470
Fecal Sludge Management: Diagnostics for Service Delivery in Urban Areas Case Study Reports A. Balikpapan B. Dhaka C. Hawassa D. Lima E. Santa Cruz
Fecal Sludge Management: Diagnostics
for Service Delivery in Urban Areas
Case Study Reports
A. Balikpapan
B. Dhaka
C. Hawassa
D. Lima
E. Santa Cruz
Fecal Sludge Management: Diagnostics
for Service Delivery in Urban Areas
Case Study in Balikpapan, Indonesia
Supporting document Final April 2016

Report of a FSM study in Balikpapan, Indonesia
i
Preface / Acknowledgements
This report is a city case study of a World Bank Economic and Sector Work on Fecal Sludge
Management: Diagnostics for Service Delivery in Urban Areas (P146128). The task team leaders
were Isabel Blackett and Peter Hawkins and task team members were Zael Sanz Uriarte,
Ravikumar Joseph, Chris Heymans and Guy Hutton.
This report is based on work conducted between January 2014 and February 2016 by Oxford
Policy Management (OPM) in partnership with the Water, Engineering and Development Centre
(WEDC) at Loughborough University. The core research team was Ian Ross (OPM), Rebecca
Scott (WEDC), Ana Mujica (OPM) and Mike Smith (WEDC). The broader team who contributed to
the study included Zach White, Rashid Zaman and Simon Brook from OPM, as well as Andy
Cotton and Sam Kayaga from WEDC. Andy Peal (independent consultant) also contributed to
certain aspects of the methodology.
The inputs of many other World Bank staff, consultants and data collection firms are acknowledged
with thanks from the task team. They have contributed to the research, findings, analysis and
reviews but are too numerous to mention.
Report of a FSM study in Balikpapan, Indonesia
1
Executive summary
Overview and key FSM service delivery challenge
Balikpapan city, located in the province of East Kalimantan, Indonesia has a reported population of
approximately 640,000 people and annual population growth of about 4.5% (approximately 1.5%
due to natural growth and 3% due to immigration). According to the latest health census, 99.5% of
households in Balikpapan own their own home, while only 0.5% rent their property.
A key challenge facing the development of Balikpapan’s sanitation and FSM services is the lack of
clarity around institutional roles and responsibilities, particularly in relation to the provision and
regulation of emptying and transportation services. The DKPP (Agency of Cleanliness, Housing and
Parks – the institution currently undertaking the role of managing any FSM activity in Balikpapan)
manage the septage treatment plant, but play no direct role in the emptying and transportation
elements of FSM services. DKPP focuses on solid waste management, constructing roads and
drainage. It is unclear who, if anyone supervises and issues permits for the construction of on-site
containment (tanks and pits), exacerbated by a lack of standards, guidelines and norms.
Study findings
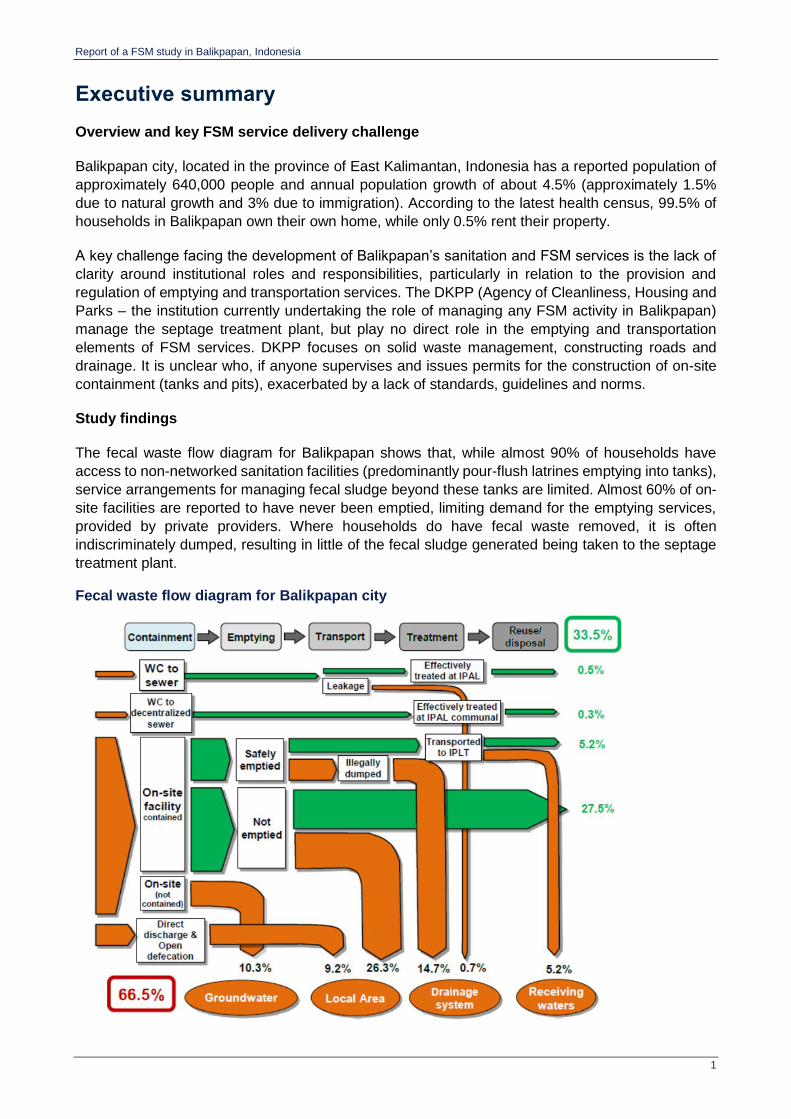
The fecal waste flow diagram for Balikpapan shows that, while almost 90% of households have
access to non-networked sanitation facilities (predominantly pour-flush latrines emptying into tanks),
service arrangements for managing fecal sludge beyond these tanks are limited. Almost 60% of on-
site facilities are reported to have never been emptied, limiting demand for the emptying services,
provided by private providers. Where households do have fecal waste removed, it is often
indiscriminately dumped, resulting in little of the fecal sludge generated being taken to the septage
treatment plant.
Fecal waste flow diagram for Balikpapan city
Report of a FSM study in Balikpapan, Indonesia
2
Analysis of demand and supply for FSM services highlights that, while private providers of emptying
services are available, the demand for these services is restricted. Results of a willingness to pay
survey identified that the majority of households are prepared to pay for a monthly desludging
service, at a price commensurate with the fees currently charged for emptying – if this is assumed
to occur approximately every 5 years. The current low demand for emptying is however exacerbated
by a combination of the poor quality of onsite infrastructure and the lack of regulation to enforce
regular emptying. Households predominantly rely on non-compliant standards of containment
facilities, where pour-flush latrines discharge to a single or double compartment “cubluk” (rather than
a well-constructed septic tank). As its is only partially lined, the cubluk operates as a soak-pit. Other
containment facilities have overflows that allow fecal sludge to discharge into drains or open water
bodies. Both conditions significantly impact on the required demand and frequency of emptying.
The City Service Delivery Assessment of Balikpapan highlights priority areas for action to establish
and implement city-wide plans to improve FSM services, together with associated budgets. It is
important that private sector providers of emptying services are incentivized to both stimulate and
meet demand for affordable FSM services, as well as to correctly use the disposal site in a way that
is economical. This must be accompanied by attention given to improving technical standards and
arrangements of on-site facilities, with consideration for a range of emptying services that can reach
into poor areas and provide affordable services. Without this, demand for emptying services will
continue to be constrained.
Next steps for the city
Presentation of the Fecal Waste Flow diagram to city officials in Balikpapan resulted in an immediate
acceptance of the problems facing FSM services. This lead to a constructive discussion on “How do
we solve this?” and “Who should be responsible for doing what?”. A Sanitation Working Group has
been established and a City Sanitation Strategy (CSS) developed that lays out targets and identifies
required sanitation development activities. This in turn has enabled the Head of Bappeda (the City
Planning Agency) and the city Mayor to identify and propose new institutional arrangements to
enhance FSM services and effective treatment of septage from on-site sanitation systems at the
treatment facilities. Policy, regulatory and legislative arrangements to support these changes will
need to be developed. Budget allocations, poorly coordinated in the past, will need to be oriented in
line with the new institutional arrangements as they are translated into law and responsibilities for
asset ownership transferred.
The local House of Representatives has been formulating a sanitation law, with regulation focusing
on issues of tariffs and off-site sewerage services. It has been identified that the development of a
new city sanitation master plan should include regulation around non-networked services and private
sector emptying, to ensure these issues are included in future legislation. While new institutional
arrangements and plans for FSM services, as part of the sanitation master plan, are starting to be
addressed, consideration will need to be given to the costings (investment and recovery) for a range
of service levels and intervention options, to support implementation. Bappeda have indicated plans
to invest in more private sector-operated desludging trucks and construction of a new septage
treatment plant. Use of emptying services by households is currently constrained by cost, location
and access (to the property and into the tank itself), especially for the urban poor. Those who use
desludging services report being satisfied with them, but the sanitation master plan must also identify
how these services will expand to meet future demand, to ensure safe transfer of fecal sludge to
effectively managed treatment facilities.
Report of a FSM study in Balikpapan, Indonesia
3
Table of contents
Preface / Acknowledgements i
Executive summary 1
Table of contents 3
List of tables and figures 5
List of abbreviations 6
1 Introduction and Research Framework 7
1.1 About this report 7
1.2 Study rationale 7
1.3 Research framework 9
1.4 Report structure 10
2 Methodology 11
2.1 Overall design 11
2.2 Sampling 13
2.2.1 Sub-samples and sampling units 13 2.2.2 Sampling in the other instruments 13
3 Background to Balikpapan city 15
3.1 Balikpapan overview 15
3.2 Balikpapan’s sanitation context 15
3.3 Balikpapan’s FSM context 16
4 Fecal Waste Flow Diagrams 18
4.1 Introduction 18
4.2 Methodology 18
4.2.1 Sewered households 19 4.2.2 On-site, non-networked facilities 20
4.3 Results 21
4.3.1 Survey results as an input to the SFD 21
4.4 Presentation of SFD 23
4.5 Implications of the SFD for FSM in Balikpapan 24
5 FSM service potential demand and supply assessment 25
5.1 Introduction 25
5.2 Household demand for FSM services 25
5.2.1 Tenancy status 25 5.2.2 Accessibility of the containment facility 26 5.2.3 Household satisfaction with current services 28
5.3 Supply of FSM services 29
6 Fecal sludge characteristics, treatment and possible end-use options 31
6.1 Fecal sludge characteristics 31
6.2 Current treatment and end-use 32
7 City Service Delivery Assesssment Error! Bookmark not defined.
7.1 Introduction 34
7.2 Methodology 34
7.3 Findings 36
7.3.1 Enabling 36
Report of a FSM study in Balikpapan, Indonesia
4
7.3.2 Developing 36 7.3.3 Sustaining 36 7.3.4 Implications of the CSDA scorecard 37
8 Next steps for Balikpapan city 38
References / Bibliography 40
Annex A CSDA scoring table criteria 41
Annex B Links to data collection instruments 45
Report of a FSM study in Balikpapan, Indonesia
5
List of tables and figures
Figure 1 Diagram of how the tools fit together ............................................................................. 8 Figure 2 Institutional arrangement for sewerage and septage management, Balikpapan ........... 16 Figure 3 The sanitation service chain ........................................................................................ 16 Figure 4 Fecal waste flow diagram for Balikpapan city............................................................... 24 Figure 7 CSDA scorecard for Balikpapan .................................................................................. 35
Table 1 FSM research project components ................................................................................ 9 Table 2 Summary table of data collection instruments .............................................................. 11 Table 3 Distribution of Willingness to Pay surveys ................................................................... 12 Table 4 Sampling sites for FS characteristics data ................................................................... 14 Table 5 Population figures for Balikpapan ................................................................................ 15 Table 6 Key FSM stakeholders ................................................................................................. 17 Table 7 Management of blackwater – where toilets discharge to .............................................. 22 Table 8 Proportion of pits/tanks which have ever been emptied ............................................... 22 Table 9 Fecal Waste Flow Matrix: based on Technical Survey data and further details ............ 23 Table 10 Tenancy status ............................................................................................................ 25 Table 11 Accessibility of toilet for emptying equipment ............................................................... 26 Table 12 Age of tanks ................................................................................................................ 27 Table 13 Willingness to pay for a regular emptying service (annual price) .................................. 27 Table 14 Satisfaction with emptying service provider (n=70) ...................................................... 29 Table 15 Institutional capacity of current FSM emptying and transportation services ................. 29 Table 16 Physical capacity of existing private emptying providers .............................................. 30 Table 17 Calorific value test results for IPLT, Balikpapan ........................................................... 31 Table 18 Results indicating helminth eggs/larva per gram of fecal sludge samples .................... 32 Table 19 The CSDA framework for FSM .................................................................................... 34 Table 20 Example CSDA question, criteria and scoring .............................................................. 35

Report of a FSM study in Balikpapan, Indonesia
6
List of abbreviations
Bappeda City Planning Agency, Balikpapan
CS Customer satisfaction (component of the Social survey)
CSDA City Service delivery assessment
Cubluk Used to describe a ‘septic tank’ (effectively a leach pit)
DKPP Agency of Cleanliness, Housing and Parks, Balikpapan
FGD Focus group discussion
FS Fecal sludge
FSM Fecal sludge management
IPAL Wastewater treatment plant
IPLT Septage (fecal sludge) treatment plant
KII Key informant interviews
OSS On-site (non-networked/non-sewered) sanitation facilities
PDAM Water Utility
ST Septic tank
WTP Willingess To Pay (component of the Social survey)
Report of a FSM study in Balikpapan, Indonesia
7
1 Introduction and Research Framework
1.1 About this report
This report summarises the main findings of a study on fecal sludge management in Balikpapan,
Indonesia. It forms one of the city case studies within the project entitled ‘Fecal Sludge Management:
Diagnostics for Service Delivery in Poor Urban Areas’, hereinafter “the FSM research project”. This
work is funded by the World Bank’s Water Global Practice (formerly the Water and Sanitation
Programme). There are five city case studies as part of this project (Balikpapan in Indonesia, Dhaka
in Bangladesh, Hawassa in Ethiopia, Lima in Peru and Santa Cruz in Bolivia).
This project is led by Oxford Policy Management (OPM) in partnership with the Water, Engineering
and Development Centre (WEDC) at Loughborough University. The full TOR for the global FSM
research project can be provided on request. The overall objective of the global research is: “to work
with the WSP urban sanitation team to develop the methodology, design, develop survey instruments
and undertake analysis of data collected from field case studies (linked to World Bank operations
projects), refine the diagnostic tools and develop decision-making tools and guidelines for the
development of improved FSM services.” The scope includes the need for city-wide fecal sludge (or
septage) management services with a focus on poor urban communities.
This document is one of several that are part of the FSM research project, and is not intended as a
stand-alone report. It is based on extracted data from several studies as part of technical assistance
in Balikpapan by the World Bank, as indicated in Table 2. As such, this report does not contain much
background information on Balikpapan as the assumed audiences are the World Bank project team
together with others familiar with or interested in Balikpapan and its context, including the relevant
municipal, regional and federal authorities. The full FSM research project Inception report, available
on request, contains more background information on the global research project and the
methodology, including the Research Framework.
The report’s structure is detailed below. It begins with a brief introduction to the research and the city
of Balikpapan, followed by sections analysing the overall urban sanitation context which are not
specific to FSM. Thereafter, the report’s focus is on the FSM services and market in particular.
1.2 Study rationale
It is common for poor people living in the urban areas of most low-income countries to use on-site
sanitation facilities, or to defecate in the open. Even when improved on-site options are used to
contain excreta, in many cities there exist limited services for the collection, transport and disposal
or treatment of the resulting fecal sludge. Few opportunities for resource recovery through end-use
of fecal sludge exist. The service delivery gaps within and between the stages of the sanitation
service chain become more apparent as urban sanitation access increases. Failure to ensure strong
links throughout the fecal sludge management (FSM) service chain results in untreated fecal sludge
(FS) contaminating the environment, with serious implications for human health.
Despite this, there are few tools and guidelines to help city planners navigate complex FSM
situations, despite increasing demand. This study builds on existing frameworks and diagnostic tools,
in particular the use of the City Service Delivery Assessment scorecard and Fecal Waste Flow
Diagram (SFD), as indicated in Figure 1. The diagnostic and decision-support tools are themselves
based on tried-and-tested strategic planning approaches and frameworks, with a focus on
practicality, while the overall global research aimed to update and develop a wider range of tools
and guidelines based on the results of five case study cities. In most of the study cities, this has been

Report of a FSM study in Balikpapan, Indonesia
8
supported by interaction with city stakeholders involved in ongoing World Bank lending.
Acknowledging the difficulty of reforming FSM services in cities, the political economy dimensions of
FSM are explicitly included as part of the overall analysis.
How the full set of diagnostic and decision-support tools and program design guidelines fit together
is represented in Figure 1 that follows. It is more fully explained in accompanying study documents,
available on request.
Figure 1 Diagram of how the tools fit together
The specific objectives of the Balikpapan city case study are:
To provide quantitative and qualitative data on the sanitation situation in Balikpapan, from a
socio-economic perspective, specifically as they relate to FSM;
To provide initial recommendations to guide discussions around future interventions in the
sanitation sector in Balikpapan, by contributing credible data and analysis; and
To inform the development and use of the analytical tools and guidelines where applied to
both current and supplementary studies, using a mix of results as sources of primary and
secondary data.
The Balikpapan case study was primarily socio-economic rather than technical, although it did
include a limited level of technical inspection of sub-surface infrastructure (tanks and pits) for the
benefit of other World Bank operations.

Report of a FSM study in Balikpapan, Indonesia
9
1.3 Research framework
During the inception stage, the OPM/WEDC team developed a Research Framework (RF), based
on the overarching research questions implicit in the TOR and draft research protocol. From these
questions, a logical set of project components were developed, and data collection instruments
devised that would help in the collection of data for the indicators making up each component. The
approach taken in the research is to place all components – as well as ensuing results – of the study,
within the context of the FSM service chain, to optimise its relevance and effectiveness. This is clear
from the full version of the RF in the study Inception report, with all components and questions
arranged along the service chain.
The initial structure of components from the Inception report is reflected in Table 1 below.
Table 1 FSM research project components
Assessment Objective Component
1 City Service
Delivery Assessment
To understand the status of service delivery building blocks, and the
political economy of FSM services overall
1a CSDA scorecard
1b Stakeholder analysis
2 Fecal Sludge (FS) situation assessment
To understand current FS management patterns and future
scenarios
2a Fecal Waste Flow Diagram
(SFD)
2b FS characteristics and end-use
potential
2c Public health risk analysis
3
Existing demand &
supply assessment
To understand customer demand for FSM services and the current status
of service providers
3a Demand - mapping customer
demand and preferences
3b Supply - mapping service
provider supply and capacity
4 Intervention assessment
To identify a hierarchy of FSM intervention options and models for implementing and financing them
4a Intervention options
4b Implementation and financing
models
5 Appraisal To appraise different interventions
against the "business as usual" scenario
5a Economic appraisal of
intervention options
The study methodology used for the Balikpapan city study is described in the next section. It should
be noted that the study methodology used for Balikpapan is different to that proposed in the
Research Framework for the full FSM research project. Field studies were ongoing in Balikpapan,
from which data sets were to be utilised for this research alongside commissioned consultancy-
based research to identify data for aspects of this FSM study. This commissioned work was carried
out prior to final agreement of all data collection instruments for the other city studies.
Primary data was partially collected in Balikpapan as part of this research (in relation to the demand/
supply assessment, FS characteristics and observation of service providers). As such, not all of the
tools have been used to their full capacity. This report also draws on data collected by the World
Bank for internal uses and synthesises the findings from several studies.
Report of a FSM study in Balikpapan, Indonesia
10
1.4 Report structure
This report is sub-divided into three groups of chapters. The initial chapters describe the city
background and methodology. There is one chapter which addresses the urban sanitation context
without a specific focus on FSM (accounting for all fecal waste flows in the city). The rest of the report
considers FSM services and service delivery.
Background
o Section 2 summarises the study methodology
o Section 3 provides background to the city
Urban sanitation context
o Section 4 shows a Fecal Waste Flow Diagram
Analysis of FSM services
o Section 5 contains the potential FSM service demand and supply assessment
o Section 6 discusses the current characteristics and treatment of fecal sludge
o Section 7 contains a City Service Delivery Assessment
o Section 8 proposes next steps for Balikpapan in relation to FSM services
Annexes
o Annex A provides the full CSDA scoring table
Report of a FSM study in Balikpapan, Indonesia
11
2 Methodology
2.1 Overall design
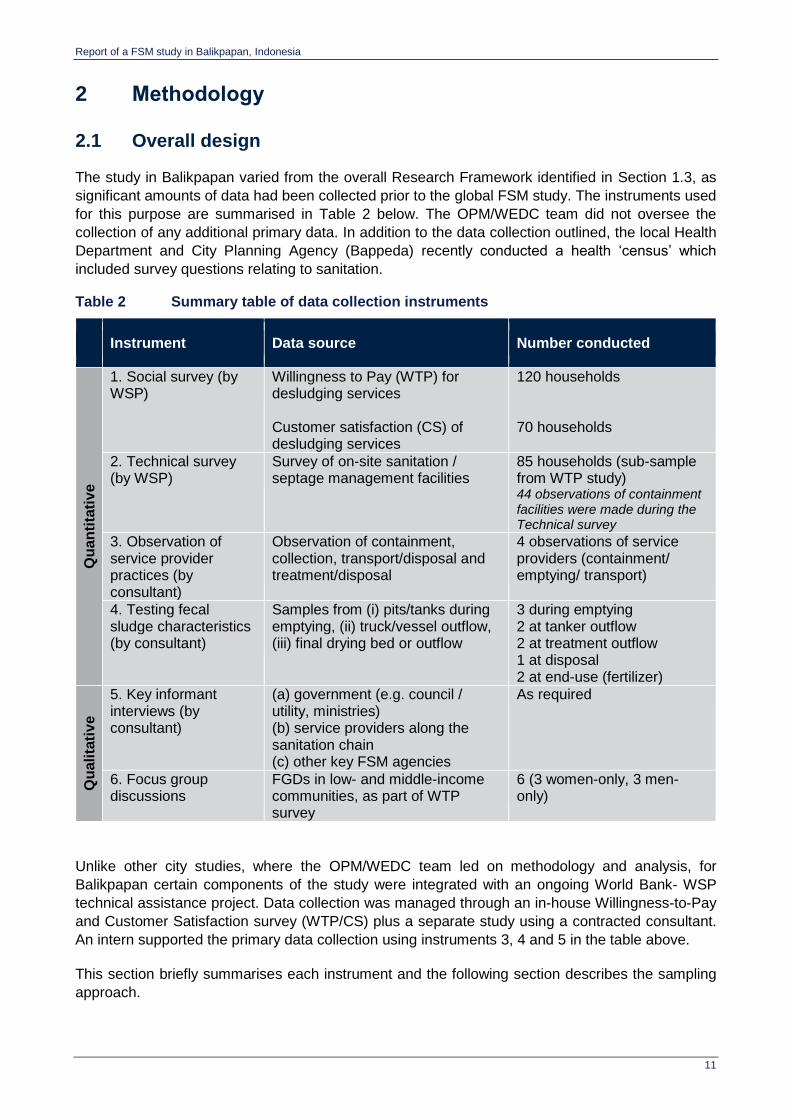
The study in Balikpapan varied from the overall Research Framework identified in Section 1.3, as
significant amounts of data had been collected prior to the global FSM study. The instruments used
for this purpose are summarised in Table 2 below. The OPM/WEDC team did not oversee the
collection of any additional primary data. In addition to the data collection outlined, the local Health
Department and City Planning Agency (Bappeda) recently conducted a health ‘census’ which
included survey questions relating to sanitation.
Table 2 Summary table of data collection instruments
Instrument Data source Number conducted
Qu
an
tita
tiv
e
1. Social survey (by WSP)
Willingness to Pay (WTP) for desludging services Customer satisfaction (CS) of desludging services
120 households 70 households
2. Technical survey (by WSP)
Survey of on-site sanitation / septage management facilities
85 households (sub-sample from WTP study) 44 observations of containment facilities were made during the Technical survey
3. Observation of service provider practices (by consultant)
Observation of containment, collection, transport/disposal and treatment/disposal
4 observations of service providers (containment/ emptying/ transport)
4. Testing fecal sludge characteristics (by consultant)
Samples from (i) pits/tanks during emptying, (ii) truck/vessel outflow, (iii) final drying bed or outflow
3 during emptying 2 at tanker outflow 2 at treatment outflow 1 at disposal 2 at end-use (fertilizer)
Qu
alita
tiv
e
5. Key informant interviews (by consultant)
(a) government (e.g. council / utility, ministries) (b) service providers along the sanitation chain (c) other key FSM agencies
As required
6. Focus group discussions
FGDs in low- and middle-income communities, as part of WTP survey
6 (3 women-only, 3 men-only)
Unlike other city studies, where the OPM/WEDC team led on methodology and analysis, for
Balikpapan certain components of the study were integrated with an ongoing World Bank- WSP
technical assistance project. Data collection was managed through an in-house Willingness-to-Pay
and Customer Satisfaction survey (WTP/CS) plus a separate study using a contracted consultant.
An intern supported the primary data collection using instruments 3, 4 and 5 in the table above.
This section briefly summarises each instrument and the following section describes the sampling
approach.

Report of a FSM study in Balikpapan, Indonesia
12
Social and Technical surveys
The Willingness To Pay (WTP) survey collected data on the household’s socio-economic status,
attitudes to sanitation, previous experiences of pit/tank emptying, reasons for selecting service
providers and willingness to pay for emptying services. The survey did not collect data on the
containment facility itself.
The Customer Satisfaction (CS) survey also collected data on the household’s socio-economic
status, previous experiences of pit/tank emptying, reasons for selecting service providers and
willingness to pay for emptying services. In addition, data was collected on the satisfaction with the
emptying service.
For the technical survey, data was also collected about the household’s containment facility,
including design elements relevant to FSM service delivery (emptying fecal sludge from tanks/pits).
Table 3 Distribution of Willingness to Pay surveys 1
Sub City Administrative Villages Number of Respondents Income level
Balikpapan Tengah Karang rejo 30 Low
Balikpapan kota Klandasan Hulu 36 Low
Balikpapan Selatan Sepinggan raya 15 Middle
Sepinggan Selatan 36 Low
Total 120
Observation of service provider practices
An observation protocol involved making visual inspections about fecal sludge (FS) management
from pits or tanks to final disposal, in particular watching service providers (SPs) go about their
business. It required identification of hazards, hazardous events, and an assessment of possible
risks at each stage (containment, emptying, conveyance, treatment and end-use or disposal) of the
fecal sludge management chain.
Testing fecal sludge characteristics
The characteristics of fecal sludge will vary, depending on factors such as the length of time for
which it has been stored, the season, and the storage conditions e.g. whether the sludge was in a
lined or unlined pit. Assessment of the characteristics was required at three stages: (i) during
removal, as this will influence the removal methods that could be used, (ii) prior to treatment, as this
will influence how the fecal sludge can be transported and treated, and possible resource recovery
options pre-treatment, and (iii) after treatment, as this will determine the resource value of the end
product derived from the treated fecal sludge.
Key informant interviews (KIIs)
Key informant interviews (KIIs) are the way in which primary information was sought to address key
questions about how both the ‘enabling environment’ and the operating environment affects FSM
1 Due to the multiple levels of purposive sampling and the various conditions applied in selection of the households, it is not possible to say that the results are representative of Balikpapan city, or any of the sub-city locations. The Social survey report does not identify that the data is representative of Balikpapan, but rather refers to results as being in relation to the percentage of respondents.

Report of a FSM study in Balikpapan, Indonesia
13
services (past, current and future). KIIs were held with stakeholders having responsibility or interest
in FSM services at city-level, allowing the enabling and operating environments to be better
understood in relation to their influence within the city. Informants interviewed included Chairmen of
city neighbourhoods, staff of local government departments (including Urban Planning and
Settlement, Public Works), the Municipal Water Company and other agencies such as the
Department of Revenue (in charge of land and building tax) and the State Electricity Company.
Focus Group Discussion (FGDs)
FGD participants were recruited by the research team, along with the head of the neighbourhood,
based on certain characteristics. These included; having their own toilet, being from low- or middle-
income socio-economic status and willing to participate. In FGDs with three groups of women,
transect walks were added, in which the FGD participants were invited to see the condition of water
and sanitation in the settlement community by observing and asking about issues related to
sanitation.
2.2 Sampling
2.2.1 Sub-samples and sampling units
All three surveys (WTP and CS for the Social Surveys and the Technical Survey) draw from the
same sample frame. Areas for the surveys were purposively selected in collaboration with local
government: the City Planning Bureau (Bappeda), the Department of Hygiene, the Agency of
Cleanliness, Housing and Parks (DKPP) and the Civil Order, Politics and National Unity Services.
Three sub-districts were selected as the focus of the study: Tengah, Kota and Selatan.
Within each sub-district four Kelurahan (Administrative Villages) were then also purposively
selected. This selection was based on: wealth status (low and middle-income); population density
(high); location (coastal and inland); and areas without any sanitation programmes. Within each
Kelurahan a list of households who were beneficiaries of the subsidised rice scheme (Raskin) was
provided by the head of the neighbourhood. From this list households were randomly selected for
interview for the WTP survey. For the CS survey, neighbourhood heads identified suitable
households, i.e. those that had emptied their pits in the last three years. Households that had been
interviewed for any sanitation-related survey in the last 6 months were excluded.
From the households selected for interview in the WTP and CS surveys, a sub-set were also selected
to be included in the Technical survey. An additional 11 households who receive Raskin were also
selected randomly from other sub-districts.
Because of the multiple selection criteria used, the surveys cannot be said to be random household
surveys, or representative of Balikpapan as a whole. Where possible in the report, data from the
WTP and CS surveys are presented alongside data from a recent city-wide Health Census, to allow
for a comparison.
2.2.2 Sampling in the other instruments
Testing FS characteristics
Grab samples of FS were taken from a range of sample locations across the city and across the
sanitation chain. All samples were collected between 12pm and 5pm on the same day. The samples
were then flown to a laboratory in Jakarta and as such were tested the following day.
Report of a FSM study in Balikpapan, Indonesia
14
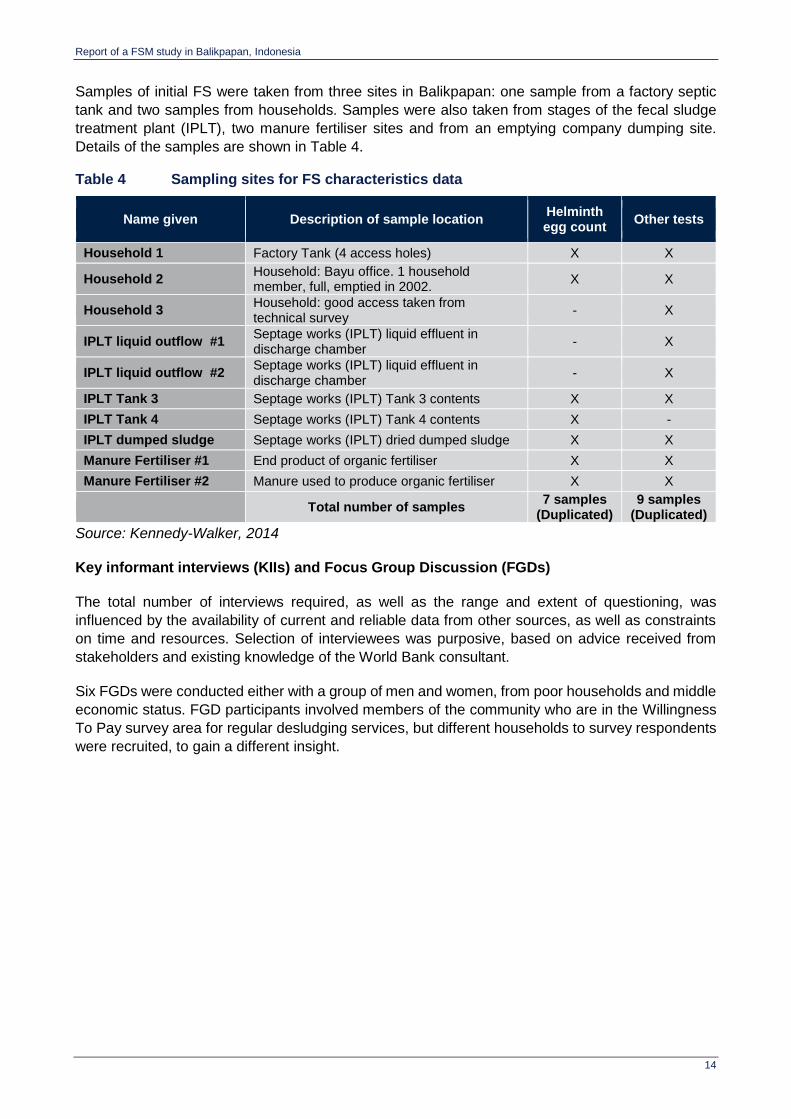
Samples of initial FS were taken from three sites in Balikpapan: one sample from a factory septic
tank and two samples from households. Samples were also taken from stages of the fecal sludge
treatment plant (IPLT), two manure fertiliser sites and from an emptying company dumping site.
Details of the samples are shown in Table 4.
Table 4 Sampling sites for FS characteristics data
Name given Description of sample location Helminth egg count
Other tests
Household 1 Factory Tank (4 access holes) X X
Household 2 Household: Bayu office. 1 household member, full, emptied in 2002.
X X
Household 3 Household: good access taken from technical survey
- X
IPLT liquid outflow #1 Septage works (IPLT) liquid effluent in discharge chamber
- X
IPLT liquid outflow #2 Septage works (IPLT) liquid effluent in discharge chamber
- X
IPLT Tank 3 Septage works (IPLT) Tank 3 contents X X
IPLT Tank 4 Septage works (IPLT) Tank 4 contents X -
IPLT dumped sludge Septage works (IPLT) dried dumped sludge X X
Manure Fertiliser #1 End product of organic fertiliser X X
Manure Fertiliser #2 Manure used to produce organic fertiliser X X
Total number of samples 7 samples
(Duplicated) 9 samples
(Duplicated)
Source: Kennedy-Walker, 2014
Key informant interviews (KIIs) and Focus Group Discussion (FGDs)
The total number of interviews required, as well as the range and extent of questioning, was
influenced by the availability of current and reliable data from other sources, as well as constraints
on time and resources. Selection of interviewees was purposive, based on advice received from
stakeholders and existing knowledge of the World Bank consultant.
Six FGDs were conducted either with a group of men and women, from poor households and middle
economic status. FGD participants involved members of the community who are in the Willingness
To Pay survey area for regular desludging services, but different households to survey respondents
were recruited, to gain a different insight.

Report of a FSM study in Balikpapan, Indonesia
15
3 Background to Balikpapan city
3.1 Balikpapan overview
Balikpapan city is located in the province of East Kalimantan. The city is the gateway to East
Kalimantan and has ports for activities related to petroleum. The latest population data (2012) reports
637,448 people living in Balikpapan (Population and Civil Registration District Municipality).
Balikpapan is the second largest city in East Kalimantan after Samarinda. Population growth is 4.5%;
1.5% due to natural growth and 3% from immigration. Table 5 shows the population levels of the 6
sub-cities.
Table 5 Population figures for Balikpapan
2013
Population Households
Balikpapan City 664,595 132,919
West Balikpapan 99,862 19,972
South Balikpapan 133,989 26,798
North Balikpapan 144,305 28,861
Central Balikpapan 115,235 23,047
Balikpapan Kota 96,250 19,250
East Balikpapan 74,954 14,991
Data based on projection by the Civil and Population Dinas Office (Disduk) of Balikpapan City Planning Department (BAPPEDA)
The city is roughly 50,000 hectares (~500 Km2), with the majority of areas below 100 metres above
sea level. The topography of the city is reported to be 85% hilly and 15% flat. Geologically, the soil
is mainly yellow-red podsols and silica sand, which is extremely prone to erosion and landslides.
Weathered rock material, usually hard and eroded, can be found in the area.
The average year-round temperature is about 27°C and annual rainfall approximately 2,800 mm
which occurs steadily throughout the year.
According to the Department of Health’s Balikpapan Health Census, or Survei Jaga Kelurahan, 2014,
99.5% of households in Balikpapan own their own home, while only 0.5% rent.
3.2 Balikpapan’s sanitation context
The local government has established an active Sanitation Working Group and developed a City
Sanitation Strategy which lays out the targets and required sanitation development activities in an
action plan for 2011-2016.
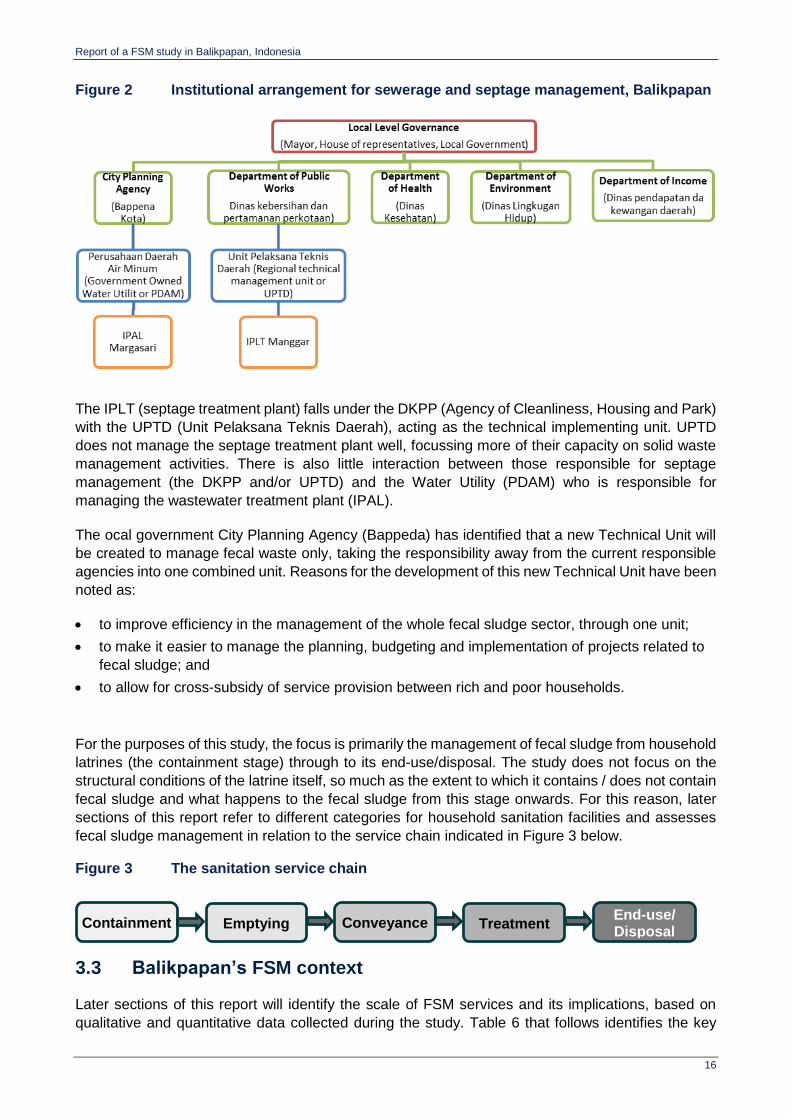
Within Balikpapan, there are a range of organisations involved in santiation. These are shown in
the following Figure 2.
Report of a FSM study in Balikpapan, Indonesia
16
Figure 2 Institutional arrangement for sewerage and septage management, Balikpapan
The IPLT (septage treatment plant) falls under the DKPP (Agency of Cleanliness, Housing and Park)
with the UPTD (Unit Pelaksana Teknis Daerah), acting as the technical implementing unit. UPTD
does not manage the septage treatment plant well, focussing more of their capacity on solid waste
management activities. There is also little interaction between those responsible for septage
management (the DKPP and/or UPTD) and the Water Utility (PDAM) who is responsible for
managing the wastewater treatment plant (IPAL).
The ocal government City Planning Agency (Bappeda) has identified that a new Technical Unit will
be created to manage fecal waste only, taking the responsibility away from the current responsible
agencies into one combined unit. Reasons for the development of this new Technical Unit have been
noted as:
to improve efficiency in the management of the whole fecal sludge sector, through one unit;
to make it easier to manage the planning, budgeting and implementation of projects related to
fecal sludge; and
to allow for cross-subsidy of service provision between rich and poor households.
For the purposes of this study, the focus is primarily the management of fecal sludge from household
latrines (the containment stage) through to its end-use/disposal. The study does not focus on the
structural conditions of the latrine itself, so much as the extent to which it contains / does not contain
fecal sludge and what happens to the fecal sludge from this stage onwards. For this reason, later
sections of this report refer to different categories for household sanitation facilities and assesses
fecal sludge management in relation to the service chain indicated in Figure 3 below.
Figure 3 The sanitation service chain
3.3 Balikpapan’s FSM context
Later sections of this report will identify the scale of FSM services and its implications, based on
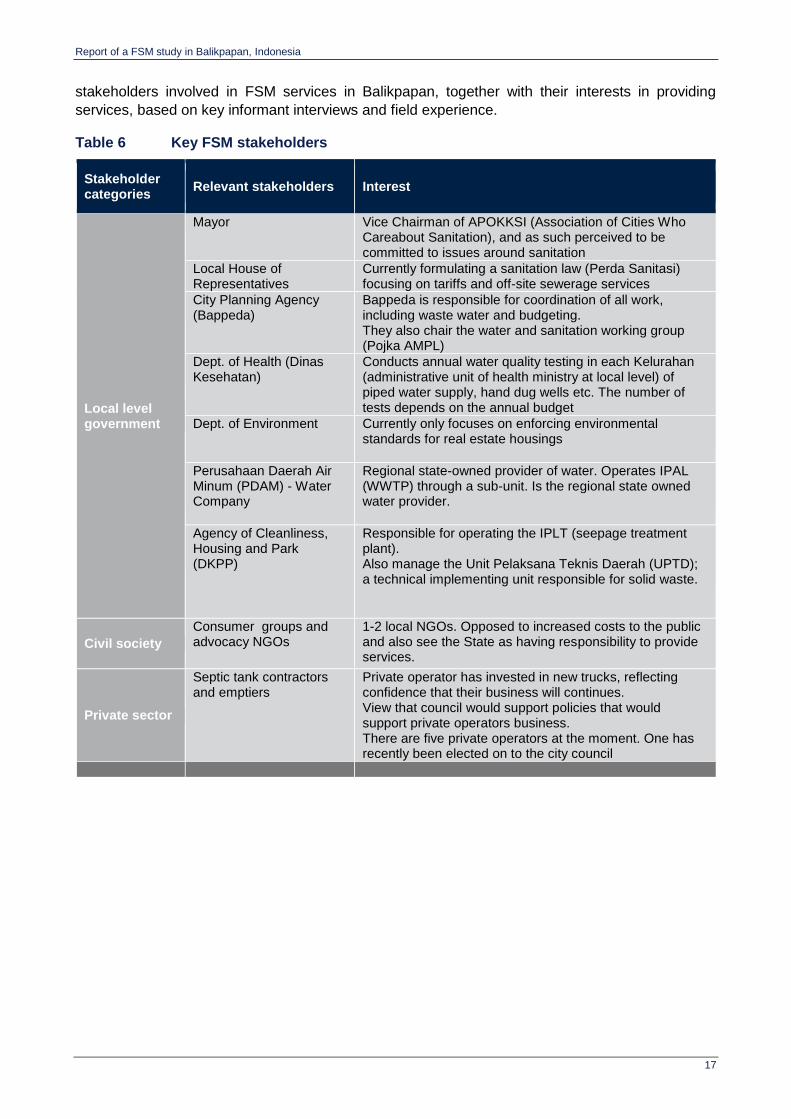
qualitative and quantitative data collected during the study. Table 6 that follows identifies the key
Treatment End-use/ Disposal
Conveyance Emptying Containment
Report of a FSM study in Balikpapan, Indonesia
17
stakeholders involved in FSM services in Balikpapan, together with their interests in providing
services, based on key informant interviews and field experience.
Table 6 Key FSM stakeholders
Stakeholder categories
Relevant stakeholders Interest
Local level government
Mayor Vice Chairman of APOKKSI (Association of Cities Who Careabout Sanitation), and as such perceived to be committed to issues around sanitation
Local House of Representatives
Currently formulating a sanitation law (Perda Sanitasi) focusing on tariffs and off-site sewerage services
City Planning Agency (Bappeda)
Bappeda is responsible for coordination of all work, including waste water and budgeting. They also chair the water and sanitation working group (Pojka AMPL)
Dept. of Health (Dinas Kesehatan)
Conducts annual water quality testing in each Kelurahan (administrative unit of health ministry at local level) of piped water supply, hand dug wells etc. The number of tests depends on the annual budget
Dept. of Environment Currently only focuses on enforcing environmental standards for real estate housings
Perusahaan Daerah Air Minum (PDAM) - Water Company
Regional state-owned provider of water. Operates IPAL (WWTP) through a sub-unit. Is the regional state owned water provider.
Agency of Cleanliness, Housing and Park (DKPP)
Responsible for operating the IPLT (seepage treatment plant). Also manage the Unit Pelaksana Teknis Daerah (UPTD); a technical implementing unit responsible for solid waste.
Civil society
Consumer groups and advocacy NGOs
1-2 local NGOs. Opposed to increased costs to the public and also see the State as having responsibility to provide services.
Private sector
Septic tank contractors and emptiers
Private operator has invested in new trucks, reflecting confidence that their business will continues. View that council would support policies that would support private operators business. There are five private operators at the moment. One has recently been elected on to the city council

Report of a FSM study in Balikpapan, Indonesia
18
4 Fecal Waste Flow Diagrams
4.1 Introduction
Fecal Waste Flow Diagrams (also known as SFDs) in their current form arise from WSP’s 12-city
study of FSM (Peal et al., 2013). In short, an SFD is a visualisation of how FS flows along the
sanitation service chain. At each stage of the chain, the proportion is indicated which is or is not
effectively managed to the next stage of the chain. At the end of the chain, the proportion of FS
which is effectively managed is indicated as “safe”, with the remaining proportion deemed “unsafe”,
and the primary destination of that FS indicated (e.g. groundwater, local environment, drains etc.)2
Thus far, SFDs in different cities have been undertaken using different methodologies, as is often
necessary in the context of poor data availability. Furthermore, most SFDs so far (including those in
the 12-city study) were undertaken using secondary data and expert estimates. This study is the first
to use primary household survey data and field-based observations to construct SFDs. A group of
urban sanitation experts is currently discussing the ‘roll-out’ of the use of SFDs, for which other
methodologies will be developed.3
4.2 Methodology
For this analysis, several key indicators from the Technical survey can be used for assessing the
containment facility used and household blackwater disposal. Particular data from the survey
questions can be used to identify information relating to:4
i) Toilet type: response options are Pour flush / Cistern flush / Other
ii) Where black water is discharged to: response options are Underground tank, Storm
water drain, Stream/canal/river, Pond, City sewerage/communal system, Unknown
iii) If there is an underground tank, where the tank discharges to: response options are
Pipe to soil/ soak pit/leach field, Pipe to city sewerage/ communal system, To drain/
stream/river, No outlet pipe, Other, Unknown
iv) How often the tank has been emptied in the last 5 years
v) When the tank was last emptied
vi) Why the tank was emptied
vii) Who emptied the tank
The Health Census also collected comparable data, on all but item iii).
Of these, question ii) is the most crucial for the construction of the SFD. It should be noted that the
household’s response is taken as given in the case of the health census. In the case of the Technical
survey, observations were made on the above ground infrastructure and measurements taken of
below ground infrastructure (dimensions and depth) from the surface.
2 It is acknowledged that FS may pass from drains into other water bodies, e.g. rivers, but the diagram focuses on the primary destination. 3 See website for the SFD promotion initiative: http://sfd.susana.org/ 4 Taken from the On-site sanitation survey and Customer Satisfaction survey

Report of a FSM study in Balikpapan, Indonesia
19
To analyse this data, an SFD matrix is created, as shown in Error! Reference source not found.
below. It shows which data sources are used and how they are analysed into levels of effective /
ineffective management of fecal waste through the stages of the service chain – with results in the
next section.
First, the Technical survey data on types of infrastructure is used to allocate households to five
categories shown in the column marked (1) in Table 9 that follows below:
A. “Sewered - centralised system” – toilets connected to sewers (not on-site sanitation)
B. “De-centralised communal system” – Networked sewerage not connected to the main
network (i.e. not on-site sanitation or centralised sewerage).
C. “On-site storage – contained and emptied” – on-site toilets (either pits or tanks) which
can be emptied
D. “On-site storage – not emptied” – on-site toilets where pits or tanks are sealed and/or
abandoned once they have filled up
E. “Open defecation and direct discharge” – self-explanatory
The data from questions (A) to (E) are allocated in column (2) below (a key shows the meaning of
the colour-coding of cells by data source). Next, the proportions for each of the stages of the chain
are allocated. As can be seen from the ‘collected’ column, a certain proportion of the population’s
FS which makes it to that stage is emptied by a service provider, and the rest is not emptied (e.g.
overflows to drains). This is estimated by dividing the number of households which reported having
had their pit emptied (question (iv) and (v) above), by the number of households using emptiable
technologies as self-reported.
Since data comes from a range of surveys, proportions in the matrix are proportions of households,
not proportions of people or of FS volumes. In Balikpapan, the mean household size was 4.8.5
4.2.1 Sewered households
Details for this section were established from the water utilities records of customer connection,
Euroconsult report and from key informant interviews held at the Wastewater Treatment Plant at
Margasari.
The in-depth analysis done by Euroconsult (2014) on the sewerage system at Margasari did not
define the type of containment facilities that are used by households with access to the sewerage
system. However, it can be assumed from observations made throughout Balikpapan that pour flush
toilets would be used in the majority of households. 99% of respondents stated they had their own
private toilets.
The existing sewerage network and wastewater treatment plant (known locally as Instalasi
Pengolahan Air Limbah, IPAL) was built in the year 2000. The wastewater treatment plant currently
serves two of Balkipapan’s 34 villages (Kelurahan Margasari and Kelurahan Baru).
Records held at the IPAL at Margasari indicate that 1,308 households are connected to the treatment
facility by a conventional sewerage system. Based on 5 people per household, it is estimated that
6,780 people are served by the sewerage system – or only 1% of the total population of Balikpapan.
As the majority of the population in Balikpapan use pour flush toilets (WSP technical survey indicated
5 The SFD involves assumptions that (i) each person produces the same amount of FS and (ii) pit accumulation rates are constant across the city. This is an approximation but the most pragmatic approach in the context of uncertainty around FS volumes. FS volume only really becomes an issue when considering the extent of change in service levels needed to deal with the amounts. This study is primarily about identifying the broader picture of where the management of FS is or isn’t effective, not what volumes are being managed or mismanaged.
Report of a FSM study in Balikpapan, Indonesia
20
97.6% of respondents use a pour flush toilet), an assumed value of 60 l/capita/day is used on which
to make an assumption about the flows entering the sewerage system in Balikpapan.
Once the sewage reaches the IPAL the effluent from the sedimentation tanks pass through a series
of chamber for dewatering. The sludge produced from the IPAL is then dried and is utilised for
internal gardening and for landscaping at some PDAM offices (There is approximately 4-5m3 of
sludge removed per month which is mixed with rice husk (using 25 bags of 50kg at Rp4000/bag per
month). This is dried onsite for about 2 weeks. The liquid effluent is used for gardening, cleaning and
collected for the fire department.
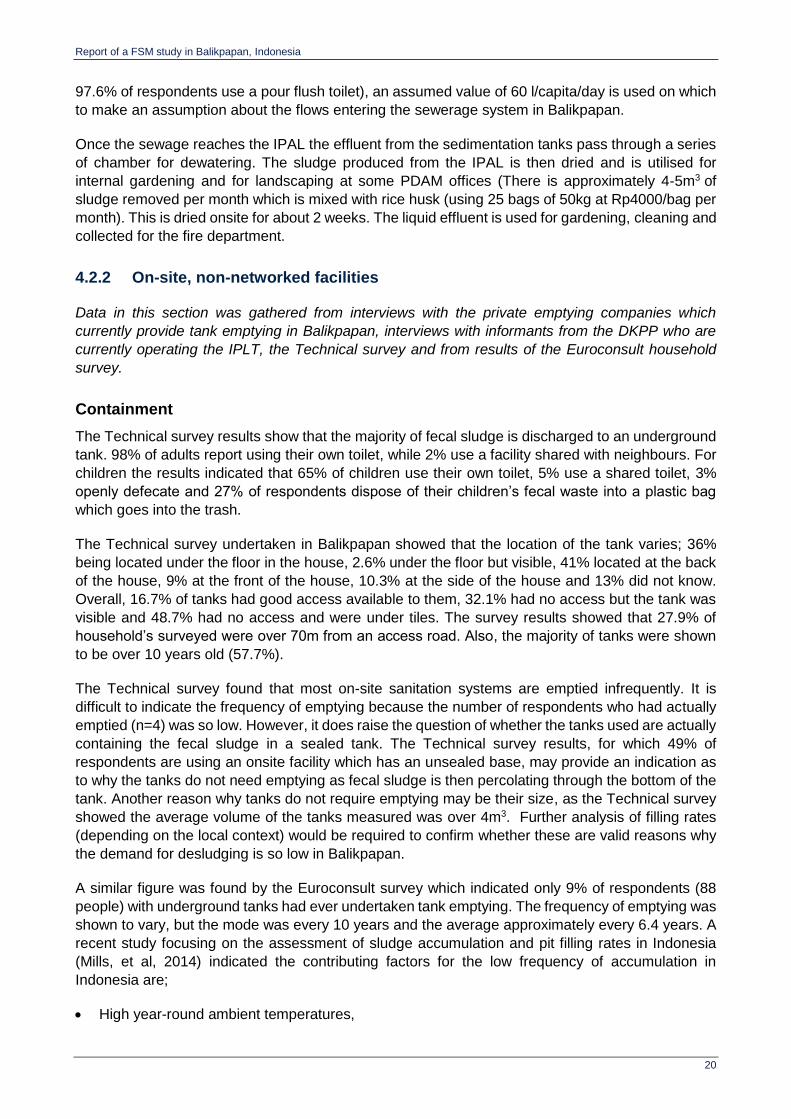
4.2.2 On-site, non-networked facilities
Data in this section was gathered from interviews with the private emptying companies which
currently provide tank emptying in Balikpapan, interviews with informants from the DKPP who are
currently operating the IPLT, the Technical survey and from results of the Euroconsult household
survey.
Containment
The Technical survey results show that the majority of fecal sludge is discharged to an underground
tank. 98% of adults report using their own toilet, while 2% use a facility shared with neighbours. For
children the results indicated that 65% of children use their own toilet, 5% use a shared toilet, 3%
openly defecate and 27% of respondents dispose of their children’s fecal waste into a plastic bag
which goes into the trash.
The Technical survey undertaken in Balikpapan showed that the location of the tank varies; 36%
being located under the floor in the house, 2.6% under the floor but visible, 41% located at the back
of the house, 9% at the front of the house, 10.3% at the side of the house and 13% did not know.
Overall, 16.7% of tanks had good access available to them, 32.1% had no access but the tank was
visible and 48.7% had no access and were under tiles. The survey results showed that 27.9% of
household’s surveyed were over 70m from an access road. Also, the majority of tanks were shown
to be over 10 years old (57.7%).
The Technical survey found that most on-site sanitation systems are emptied infrequently. It is
difficult to indicate the frequency of emptying because the number of respondents who had actually
emptied (n=4) was so low. However, it does raise the question of whether the tanks used are actually
containing the fecal sludge in a sealed tank. The Technical survey results, for which 49% of
respondents are using an onsite facility which has an unsealed base, may provide an indication as
to why the tanks do not need emptying as fecal sludge is then percolating through the bottom of the
tank. Another reason why tanks do not require emptying may be their size, as the Technical survey
showed the average volume of the tanks measured was over 4m3. Further analysis of filling rates
(depending on the local context) would be required to confirm whether these are valid reasons why
the demand for desludging is so low in Balikpapan.
A similar figure was found by the Euroconsult survey which indicated only 9% of respondents (88
people) with underground tanks had ever undertaken tank emptying. The frequency of emptying was
shown to vary, but the mode was every 10 years and the average approximately every 6.4 years. A
recent study focusing on the assessment of sludge accumulation and pit filling rates in Indonesia
(Mills, et al, 2014) indicated the contributing factors for the low frequency of accumulation in
Indonesia are;
High year-round ambient temperatures,

Report of a FSM study in Balikpapan, Indonesia
21
No solid waste content in tanks,
Type of tank used (bottomless) and the contents of the tank being low strength (high water
content) causes the majority of contents to easily infiltrate into the ground,
Tanks containing outlet pipes which discharge contents out of the tank and reduce
accumulation rates,
Low numbers of users,
Limited understanding of household for the need to regularly desludge.
Emptying/ transport
There are currently three private tank emptying companies working in Balikpapan. Previously, the
local government ran their own vacuum tanker but this broke down 2 years ago and has not been
replaced. Only vacuum tankers are used for the emptying and transportation of fecal sludge in
Balikpapan and no manual emptying or other methods were observed. Most of the trucks are
Mitsubishi trucks and consist of a steel tank, vacuum pump, hose (70-80m length) and bucket.
During interviews with the owners of the emptying companies in Balikpapan information was
collected on the standard operating procedures. The standard operating procedures for tank
emptying is observed to be non-written, verbal and ad-hoc. Only one of the three emptying
companies (Bunga Lemo) was shown to keep records of their customer base and operations.
Treatment
Only two of the private sector tank emptying companies transport the septage collected to the
designated IPLT at Manggar. The largest private sector emptying company, Bangu Lemo, transports
and dumps the septage indiscriminately on their own land located close to the site of the IPLT. A
recent technical review of the IPLT showed there to be a number of fundamental problems with the
design and functionality of the IPLT and indicated the facility is impossible to operate efficiently so
therefore recommends that a new facility should be built (ensuring properly considered design).
End-use/disposal
Currently none of the solid effluent from the IPLT is reused. Disposal of dried septage sludge occurs
adjacent to the IPLT bed structure. The sludge is removed periodically (every 6 months, but there
are no records of this operation and the growth of vegetation on the drying beds suggests that it is
done infrequently. The liquid effluent from the tanks outflows to the IPAL downstream of the landfill.
4.3 Results
4.3.1 Survey results as an input to the SFD
Due to the structure of the survey questions it is not possible to map the survey responses to JMP
questionnaires. However, the surveys do tell us the sanitation situation in Balikpapan is relatively
uniform. As per the Technical survey, 99% of respondents have their own private latrine; 92% are
squat toilets (99% in the health census); 98% are flush latrines; 92% of these empty to a septic tank
or pit (97.7% in the health census).
Arguably the most important question in our survey is where the contents of toilets go after flushing
or similar. The standard question in the Demographic and Health Surveys (DHS) incorporate this
into the overall sanitation question (see WHO/UNICEF core questions), but it needs to be asked

Report of a FSM study in Balikpapan, Indonesia
22
separately in order to get better quality data.6 We rely on household-reported data for this indicator,
while noting that households may not always know the full detail.
The Technical survey identified that 97.6% of the 85 latrines examined were pour-flush latrines
discharging to a septic tank, pit or to an open water body. 1.2%, or 1 household system, was found
to discharge to a sewer. The Health Census report similarly identified that 97.7% of households use
septic tanks for onsite containment, 1.9% of households are connected to the sewer network and
the remaining 0.4% use other means of disposal. Table 7 presents the two sets of survey data.
Table 7 Management of blackwater – where toilets discharge to
Technical Survey Health Census
No. of households % No. of households %
Septic tank or pit latrine 78 91.8% 76,772 97.7%
Canal or river 2 2.4% - -
Sewerage network 1 1.2% 1,549 1.9%
Sea 3 3.5% - -
Other - - 288 0.4%
Do not know 1 1.2% - -
Total 85 100.0% 78,321 100%
Source: World Bank Technical survey and Department of Health Census
60% of households in the Technical survey reported constructing their containment facility outside
of the house itself, with 38% reporting constructing the facility within the household. The Health
Census data reported that 99.5% of respondents have the tank located ‘in the yard’, which may
equate to both categories of response in the Technical survey.
The Technical survey identified that 88.5% of respondents reported making use of a single tank as
their containment facility, with 70% reporting the tank as having two or more compartments. Similarly,
the Health Census reported over 67% of tanks having two or more compartments.
The Health Census also reported just over 2% of housholds having their containment facility located
in a flood-prone region. In the Technical survey just under 6% of respondents reported that they
were flooded at least once per year (the remaining 94% reported never being flooded).
Table 8 Proportion of pits/tanks which have ever been emptied
Technical Survey Health Census
No. of households % No. of households %
Never 14 77.8% 45,489 59.3%
At least once 4 22.2% 31,283 40.8%
Total 18 100% 76,772 100%
Taking the Health Census results, approximately 41% of households have emptied their containment
facility. The Technical survey puts this figure at a much lower value of 22.2%. Both results highlight
that FSM emptying services have not been engaged by the majority of the surveyed population.
6 As stated above, the question asked in the Technical Survey sought to answer the questions “Where is blackwater discharged to?” and “Where is the discharge from the underground tank?”.

Report of a FSM study in Balikpapan, Indonesia
23
The following table show details of the values used to generate a fecal waste flow matrix for
Balikpapan based primarly on the Technical survey results. Further consultation between staff of the
World Bank and consultants knowledgeable about the city, values were refined and adjusted to
better suit the realities and experiences known to the staff. This also includes assumptions made
about the safety of discharges of FS and effluent into the various geographical domains – particularly
in relation to the groundwater.
Table 9 Fecal Waste Flow Matrix: based on Technical Survey data and further details
Type of system
% of FW Contained4 Collected5 Delivered Treated Total Safe
not safely
safely not
safely safely
not safely
safely not
safely safely 33.5%
Centralised sewer system1
1.2% 0.0% 100.0% 0.0% 100.0% 60.0% 40.0% 0.0% 100.0%
0.0% 1.2% 0.0% 1.2% 0.7% 0.5% 0.0% 0.5% 0.5%
Decentralised communal system2
0.3% 0.0% 100.0% 0.0% 100.0% 0.0% 100.0% 0.0% 100.0%
0.0% 0.3% 0.0% 0.3% 0.0% 0.3% 0.0% 0.3% 0.3%
On-site: contained & emptied3
25.2% 0.0% 100.0% 0.0% 100.0% 58.0% 42.0% 50.0% 50.0%
0.0% 25.2% 0.0% 25.2% 14.7% 10.5% 5.2% 5.2% 5.2%
On-site: not emptied
64.1% 16.0% 84.0% 49.0% 51.0%
10.0% 54.0% 26.3% 27.5% 27.5%
Open defecation & direct discharge6
9.2% - - 100.0% 0.0%
- - 9.2% 0.0% 0.0%
Total Unsafe 66.5% 10.3% 35.5% 15.4% 5.2%
Affected zones Groundwater Local Area Drainage System Receiving water
Notes: 1. Leakage based on expected IPAL inflow (300L/hh/dx1374hh) vs measured inflow 161m3/d (only one flow measurement). Treatment performance from effluent target compliance. (Euroconsult Mott MacDonald Balikpapan Sanitation Sector Project Feasibility Study 2014) 2. Estimate from 12 Decentralized treatment systems, assume 25hh connections. Assume good performance. 3. Contained (see below) and previously emptied (WSP study). Delivery to IPLT based on WSP private sector survey 2.5/6 trucks. Treatment based on WSP IPLT assessment of treatment performance. 4. On-site sanitation systems classified as non-contained when groundwater <5m depth & distance to well <10m. Households missing groundwater data were found to not use well water and assumed contained. Households missing distance to well and not using well water were assumed contained. Use of groundwater is otherwise not considered. 5. On-site systems classified as not safely collected are system with overflow to drain/river (this has the same effect as direct discharge, see 6). Un-emptied and contained systems without an overflow are considered safely stored. 6. Direct discharge when no on-site system, ie. helicopter toilet or pipe from WC to drain/river
4.4 Presentation of SFD
Using all these results, we are able to construct a fecal waste flow diagram (SFD) for Balikpapan
city. This is presented as Figure 4 below. SFDs work on the same principle as the matrix shown
above. Household’s toilet technology and associated containment method is shown on the left, with
intermediate steps and primary destination of the FS shown along the sanitation service chain. What
is clear from this SFD is that the proportion of waste entering the environment due to poor
containment is far less than that entering the environment through other parts of the chain.

Report of a FSM study in Balikpapan, Indonesia
24
Figure 4 Fecal waste flow diagram for Balikpapan city
4.5 Implications of the SFD for FSM in Balikpapan
As visualised in the SFD, roughly 19% of the fecal waste that is not safely managed is due to poor,
or a lack of, onsite containment. The remaining 47% of the fecal waste that is unsafely managed is
due to what happens after containment.
While almost 90% of households have access to non-networked sanitation facilities (predominantly
pour-flush latrines emptying to tanks), service arrangements for managing fecal sludge beyond these
tanks are limited. Almost 60% of on-site facilities are reported to have never been emptied, limiting
demand for the emptying services, provided by private providers. Where households do have fecal
waste removed, it is often indiscriminately dumped, resulting in very little of the fecal sludge
generated actually being taken to the septage treatment plant.
On a more positive note, the SFD clearly shows that the FSM services in the city are functional to
some extent through all stages of the service chain, in the sense that over 10% of fecal waste
reaches treatment centres via FSM services and that some of that waste of safely managed.
Similarly some of the fecal waste entering the conventional sewer system and the decentralised
networks are safely treated.

Report of a FSM study in Balikpapan, Indonesia
25
5 FSM service potential demand and supply assessment
5.1 Introduction
This chapter provides a brief assessment of demand and supply for FSM services in Balikpapan. At
this stage, it is important to note the difference between potential (or notional) demand and effective
demand. We consider the potential demand for FSM services to be the type and quantity of services
which would be demanded in the absence of any market failures or distortions. This is different from
effective demand, which is the type and quantity of services actually purchased in the context of
current supply and current prices. As only approximately 2% of the respondents in the Health Census
and Technical Survey have a sewer connection and there is very little open defecation, the potential
demand for FSM services would appear to be signficiant. This is partially reflected in the already
functioning FSM services in the city.
On the supply side, we consider what types of FSM services the market is currently providing to
households.7 Dimensions of supply include the number of service providers of different types
(manual, mechanical etc.), the geographical areas they serve and the prices they charge.
5.2 Household demand for FSM services
The research framework (Section 1.3) set out to answer the following question: “What is the existing
customer demand and preferences for FSM services?”, i.e. the current effective demand.
Results are presented below in relation to four key area affecting demand: tenancy status,
accessibility of facilities for emptying equipment, age of the containment facility and willingness to
pay for emptying services. The full report (Kennedy-Walker, 2014) contains further results taken from
the Technical survey and results from a Euroconsult Study.
5.2.1 Tenancy status
The incentives that drive demand for improved FSM services are influenced by who is responsible
for the ongoing maintenance to keep toilets functioning. Overwhelmingly the respondents of both
surveys report that they either own their home or it is owned by a family member; 86% in the
Technical survey and 99.5% in the Health Census. This makes the households themselves as an
extremely important stakeholder, being responsible for the emptying of their own facility. This is more
so than in other cities where landlords or the government themselves own or manage a much larger
proportion of properties.
Table 10 Tenancy status
Technical survey Health census
No. of households % No. of households %
Owned 73 84.9% 78,139 99.38%
Owned by family member 1 1.2% 125 0.16%
Rented 12 14.0% 364 0.46%
Total 86 100% 78,628 100%
7 FSM services are obviously also demanded by the government, businesses etc. but households are the focus of this study.

Report of a FSM study in Balikpapan, Indonesia
26
5.2.2 Accessibility of the containment facility
Focusing on the containment facility itself, Table 11 below shows the accessibility of the main pit/tank
structure based on findings from the Technical survey. This reports that nearly 50% of respondents
do not have a tank with an access point and that the tank is under the floor; presenting considerable
difficulty with regards to emptying. A further 32% of respondents report that there is no access point
but that the tank itself is visible. Only 16.7% of respondents observed have a tank access suitable
for easy emptying.
The enumerators of the Technical survey were required to make a judgement on whether an
emptying point could be created. For over 82% of the sample the enumerators judged that an entry
point to the tanks could not be created. In the Willingness to Pay and Customer satisfaction surveys
the respondents who had emptied there pit (n=78) were asked about access; 46% reported that
access had to be made by breaking through the floor or concrete. This suggests that in addition to
any amount paid for emptying services there are additional costs associated with repairing parts of
the house and pit/tank. Despite this 96.9% of respondents were satisfied with the access to their
tank (see Table 14 below)
Table 11 Accessibility of toilet for emptying equipment
Technical survey
No. of households %
Visible manhole 7 9.0
Manhole filled with cement 2 2.6
Closed PVC 4 5.1
No access but the tank is visible 25 32.1
No access and tank is under the floor 38 48.7
Other 2 2.6
Total 78 100.0
The Health Census and the Technical survey do not have comparable results for this aspects, as
the Health Census asked a simple yes/no question on access via manhole – resulting in 80.4% of
respondents reporting that their tank had manhole access. Though the Health Census has a
considerably larger sample size, the degree to which the observed Technical survey data disagree
with the self-reported Health Census data is beyond that observed around other questions. In this
case more credence should be given to the Technical survey data as the observational data was
collected by trained enumerators and is considered as more reliable. Due to the Technical Survey’s
purposive sampling methodology however, the results cannot be said to be representative of
Balikpapan as a whole.
5.2.2.1 Fill rate
Data on the type of containment was already shown in Table 7Error! Reference source not found.
above. Neither survey has detailed information on the average time taken for tanks to fill. However,
in both surveys a large majority stated that they had never emptied their tank; 77.8% in the Technical
Survey and 59.3% in the Health Census. Table 12 below shows the ages of the tanks as reported in
the Technical Survey. 42.3% of tanks are less than 10 years old. Of the respondents of the
Willingness to Pay Survey and the Customer Satisfaction survey 62.8% of respondents that report
having emptied their tank in the last 5 years have a tank aged over 10 years. 58.3% of the

Report of a FSM study in Balikpapan, Indonesia
27
respondents who reported never to have emptied their tank have a septic tank aged 10 years or
less. This suggests then that current demand for FSM services is a poor guide to what future demand
may, be even if household access to sanitation and the containment facilities used for blackwater
does not change.
Table 12 Age of tanks
Technical survey
No. of households %
< 3 years 16 20.5%
3 - 5 years 10 12.8%
5 - 10 years 7 9.0%
> 10 years 45 57.7%
Total 78 100.0%
5.2.2.2 Financial aspects
The Willingness to Pay survey asked respondents directly the amount they would consider paying
for a monthly emptying service. The results are presented Table 13 below, the figures are presented
as an annual cost of subscription as opposed to a monthly cost. The exchange rate taken is the 2014
period average as the original survey was conducted in early 2014.
Table 13 Willingness to pay for a regular emptying service (annual price)
Willingness to Pay Survey (n=190)
Annual cost %
6,000 Rs (0.5 USD) 1.3%
12,000 Rs (1.0 USD) 1.3%
24,000 Rs (2.0 USD) 1.3%
36,000 Rs (3.0 USD) 4.4%
48,000 Rs (4.0 USD) 5.0%
60,000 Rs (5.1 USD) 24.4%
84,000 Rs (7.1 USD) 1.3%
108,000 Rs (9.1 USD) 3.1%
120,000 Rs (10.1 USD) 39.4%
132,000 Rs (11.1 USD) 0.6%
180,000 Rs (15.2 USD) 4.4%
240,000 Rs (20.3 USD) 13.1%
300,000 Rs (25.3 USD) 0.6%
Total 100%
1 USD = 11,865.2 Indonesian Rupiah
81% of respondents expressed an interest in having a regular desludging service. 37.7% of
respondents were willing to pay up to 5.1 USD annually for this and a further 44.4% of respondents
were willing to pay between 5.2 – 11.1 USD for the service, with the remaining 18.1% willing to pay
over that amount.
Four (4) respondents in the Technical Survey reported paying an average of 287,500 Rs (24 USD)
(range: 150,000–450,000 Rs) for emptying services. For current service levels and assuming tanks
Report of a FSM study in Balikpapan, Indonesia
28
would have to be emptied every 5 years, respondents are expressing a willingness to pay at a rate
suited to the current service level. However, given the relatively small number of respondents to this
question, it is not possible to draw any conclusions for Balikpapan as a whole.
During the FGDs with the communities, the majority of participants queried the monthly payment
method for regular desludging. It was also highlighted that those who had had their tank emptied
before felt that regular emptying every 4 years was acceptable, however those who hadn’t felt that
this time period was too short, as the tank would not be full in that time. The following issues were
raised:
If people do not pay all their instalments (over 4 years) how will they be punished?
Is it possible for the service providers to implement the program where they live? (e.g.
respondents in narrow streets)
Who is responsible for the programme? If there is a problem with the programme who do they
contact? It should be clear.
For those renting- if they are involved in the scheme and pay on a monthly basis but they then
move before the emptying how does that work?
Female participants from the middle income community raised concerns about if the programme
didn't sustain and they have paid monthly instalments.
If instalments were utilised then there were three alternative payment mechanism preferred;
PDAM billing, PLN and head of RT. However, each payment must be transparent and evidence
of payment must be provided.
Respondents from the middle-income community were shown to be less interested in the monthly
payment scheme, as they perceived that they could afford to pay for the service in one lump sum
rather than in monthly instalments. These respondents also highlighted that each tank should be
assessed for its feasibility for regular desludging. Those tanks that are not up to standard should
then be repaired prior to regular desludging being conducted. These findings highlight issues which
may affect peoples’ willingness to accept/pay for regular emptying services.
Community leaders indicated that they thought regular emptying was an interesting idea which could
bring benefits to health and the environment in the community. It was highlighted that before such a
scheme could be implemented socialisation within the community about the idea would be needed.
This would be needed to highlight to the community why regular emptying was needed, the benefit
of the service and how it would be managed. The community leaders highlighted that there would
need to be agreement from the community as it involves monthly payments from them.
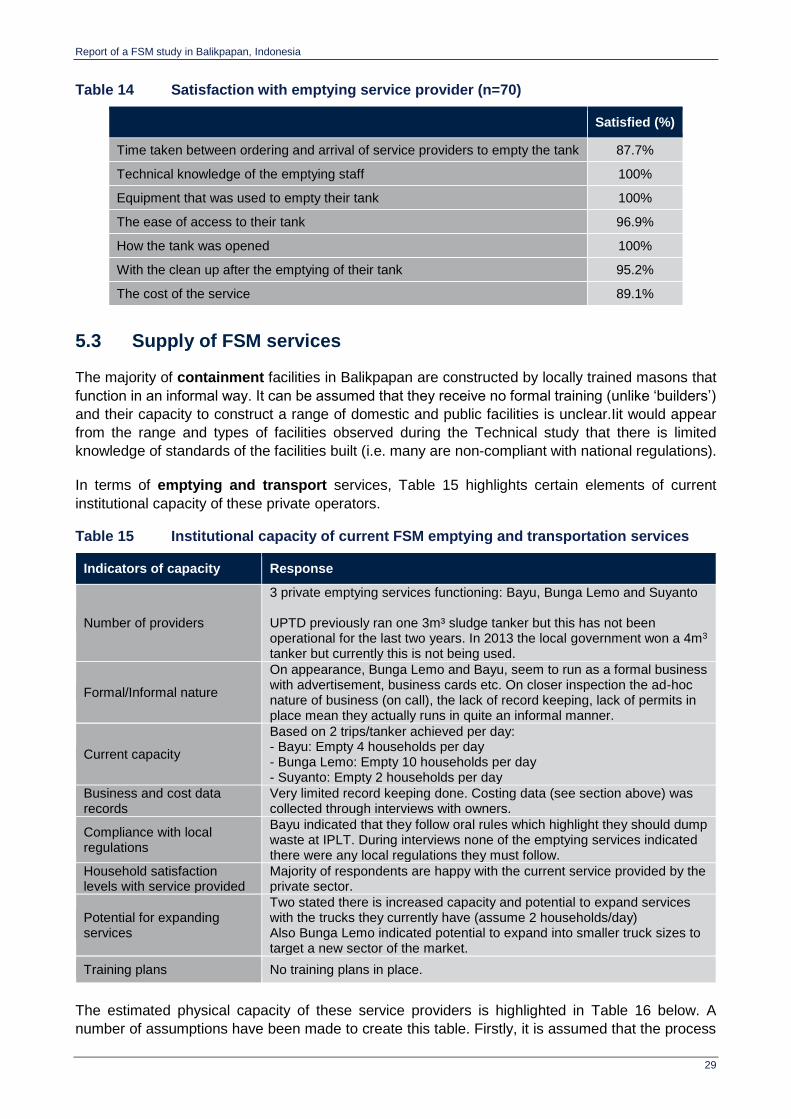
5.2.3 Household satisfaction with current services
Households were asked to express their satisfaction with current services – both the sanitation
facility itself and the emptying services used – across a range of factors, as shown in the tables
following. Overall, as shown in Table 14, the respondents of the WTP and CS surveys who have
had their tanks emptied showed a high degree of satisfaction with the services provided.
Report of a FSM study in Balikpapan, Indonesia
29
Table 14 Satisfaction with emptying service provider (n=70)
Satisfied (%)
Time taken between ordering and arrival of service providers to empty the tank 87.7%
Technical knowledge of the emptying staff 100%
Equipment that was used to empty their tank 100%
The ease of access to their tank 96.9%
How the tank was opened 100%
With the clean up after the emptying of their tank 95.2%
The cost of the service 89.1%
5.3 Supply of FSM services
The majority of containment facilities in Balikpapan are constructed by locally trained masons that
function in an informal way. It can be assumed that they receive no formal training (unlike ‘builders’)
and their capacity to construct a range of domestic and public facilities is unclear.Iit would appear
from the range and types of facilities observed during the Technical study that there is limited
knowledge of standards of the facilities built (i.e. many are non-compliant with national regulations).
In terms of emptying and transport services, Table 15 highlights certain elements of current
institutional capacity of these private operators.
Table 15 Institutional capacity of current FSM emptying and transportation services
Indicators of capacity Response
Number of providers
3 private emptying services functioning: Bayu, Bunga Lemo and Suyanto UPTD previously ran one 3m³ sludge tanker but this has not been operational for the last two years. In 2013 the local government won a 4m3
tanker but currently this is not being used.
Formal/Informal nature
On appearance, Bunga Lemo and Bayu, seem to run as a formal business with advertisement, business cards etc. On closer inspection the ad-hoc nature of business (on call), the lack of record keeping, lack of permits in place mean they actually runs in quite an informal manner.
Current capacity
Based on 2 trips/tanker achieved per day: - Bayu: Empty 4 households per day - Bunga Lemo: Empty 10 households per day - Suyanto: Empty 2 households per day
Business and cost data records
Very limited record keeping done. Costing data (see section above) was collected through interviews with owners.
Compliance with local regulations
Bayu indicated that they follow oral rules which highlight they should dump waste at IPLT. During interviews none of the emptying services indicated there were any local regulations they must follow.
Household satisfaction levels with service provided
Majority of respondents are happy with the current service provided by the private sector.
Potential for expanding services
Two stated there is increased capacity and potential to expand services with the trucks they currently have (assume 2 households/day) Also Bunga Lemo indicated potential to expand into smaller truck sizes to target a new sector of the market.
Training plans No training plans in place.
The estimated physical capacity of these service providers is highlighted in Table 16 below. A
number of assumptions have been made to create this table. Firstly, it is assumed that the process
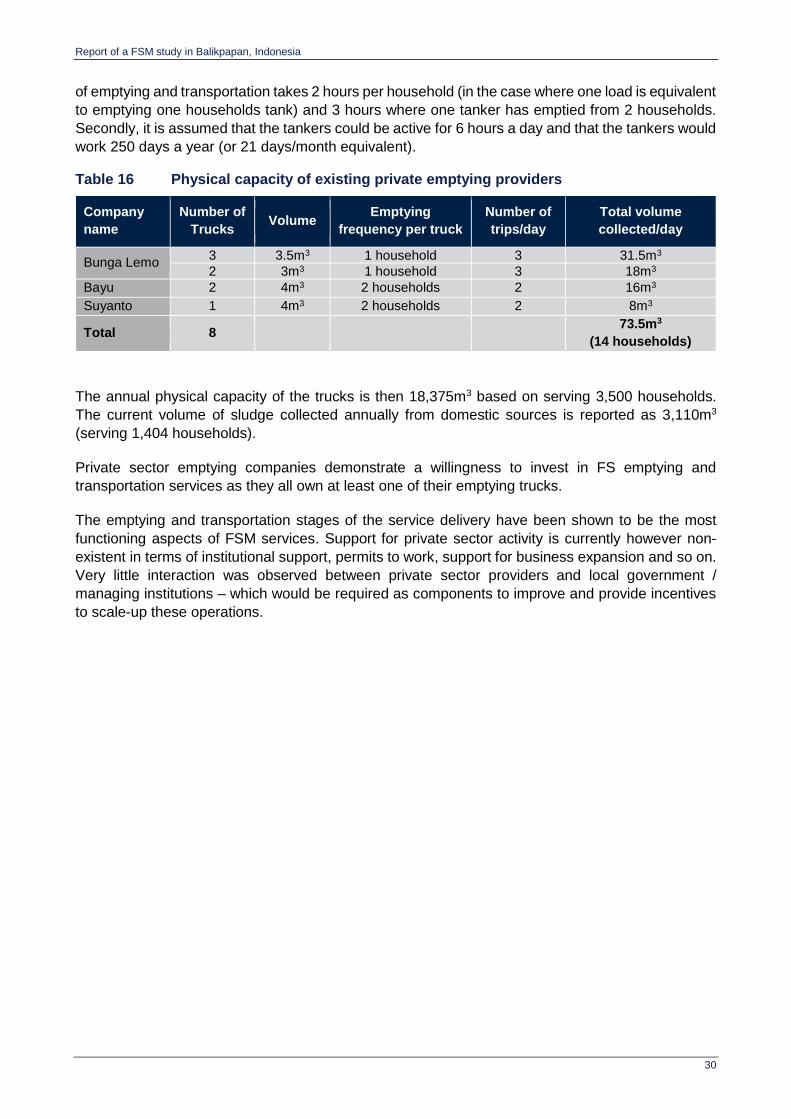
Report of a FSM study in Balikpapan, Indonesia
30
of emptying and transportation takes 2 hours per household (in the case where one load is equivalent
to emptying one households tank) and 3 hours where one tanker has emptied from 2 households.
Secondly, it is assumed that the tankers could be active for 6 hours a day and that the tankers would
work 250 days a year (or 21 days/month equivalent).
Table 16 Physical capacity of existing private emptying providers
Company
name
Number of
Trucks Volume
Emptying
frequency per truck
Number of
trips/day
Total volume
collected/day
Bunga Lemo 3 3.5m3 1 household 3 31.5m3
2 3m3 1 household 3 18m3
Bayu 2 4m3 2 households 2 16m3
Suyanto 1 4m3 2 households 2 8m3
Total 8 73.5m3
(14 households)
The annual physical capacity of the trucks is then 18,375m3 based on serving 3,500 households.
The current volume of sludge collected annually from domestic sources is reported as 3,110m3
(serving 1,404 households).
Private sector emptying companies demonstrate a willingness to invest in FS emptying and
transportation services as they all own at least one of their emptying trucks.
The emptying and transportation stages of the service delivery have been shown to be the most
functioning aspects of FSM services. Support for private sector activity is currently however non-
existent in terms of institutional support, permits to work, support for business expansion and so on.
Very little interaction was observed between private sector providers and local government /
managing institutions – which would be required as components to improve and provide incentives
to scale-up these operations.

Report of a FSM study in Balikpapan, Indonesia
31
6 Fecal sludge characteristics, treatment and possible end-use options
6.1 Fecal sludge characteristics
Two sets of fecal sludge samples were collected and tested from a range of locations in Balikpapan,
to investigate the chemical composition and physical characteristics of the sludge. The first round of
samples (March 2014) were undertaken as a test run for the laboratories and the process of taking
the samples, with a second round of samples taken in May 2014. The sampling methodology for the
fecal sludge characteristics are outlined in Section 2.2.2.
Samples of primary fecal sludge were taken from three sites in Balikpapan: one sample from a
factory septic tank and two samples from households. Samples were also taken from two manure
fertiliser sites and from two emptying company dumping sites, see Table 4 above for details.
Samples taken at the IPLT drying beds were from the discharge chamber, and drying beds (tanks)
3 and 4:
Samples taken within the discharge chamber consisted of fecal sludge that had accumulated
over time within the chamber (the inlet to the works). The sample was wet-dry in consistency
and was brown/black in colour with some smell.
Samples taken from the start of the two drying beds in use (3 and 4) consisted of fresh sludge
received by the drying beds directly after discharge by the tankers. The sample was wet in
consistency and black in colour with some smell.
Samples taken from the end of the two drying beds in use (3 and 4) consisted of fecal sludge
that had been left to dry for approximately 6 weeks. The sample was wet-dry in consistency,
black in colour and with some smell (but not as strong as from the start of the drying beds).
Samples were also taken of dried fecal sludge that had been removed from the drying beds and
dumped on adjacent land, about 2 months previously. This sludge was observed as being of dry
consistency, black in colour with very little smell.
Details of the chemical and physical characteristics of the fecal sludge are contained in the full report
by Kennedy-Walker, 2014 and in particular Appendix D of that report. The results show that, for the
samples taken from the households, all samples were of a very liquid consistency that flowed easily
and contained no solid waste.
Calorific value tests were performed on samples taken from the end of the two drying beds, by the
company Sucofindo. The analysed sample was a well-mixed composition from two tanks at the fecal
sludge treatment plant (total sample volume of 1 litre). The sample was taken during the first round
of sampling for testing. The tests were performed using a bomb calorimeter and the results are
indicated in Table 17 below.
Table 17 Calorific value test results for IPLT, Balikpapan
Parameter Unit Results Method
Total Moisture %, (as received) 86.0 ASTM D. 3302-10
Moisture in Analysis %, (air dried basis) 24.7 ASTM D.3173-11
Gross Calorific Value Kcal/kg, (air dried
basis) 2552 ASTM D. 5865-10

Report of a FSM study in Balikpapan, Indonesia
32
The favoured units of Calorific Value for this study is MJ/kg so therefore converted from Kcal/kg the
result achieved is 10.68MJ/kg (conversion used 1 kcal = 0.0041868 MJ).
Additional tests were conducted to analyse FS samples for helminth eggs. Table 18 below provides
the results received from the department of parasitology at the University of Indonesia for samples
taken at two households and the FS drying beds. The techniques used were; direct examination,
sucrose flotation from 5 gram of sludge sample and quantitative analysis of egg/larvae recovered.
Table 18 Results indicating helminth eggs/larva per gram of fecal sludge samples
Sample Code Ascaris
lumbricoides eggs
Hookworm larvae
Trichuris trichiura
eggs
Strongyloides stercoralis
larvae
HH#1 (liquid waste)
30 0 0 0
HH#2 (liquid waste)
13 0 0 13
IPLT Tank 3 (semi solid waste)
150 267 0 0
IPLT Tank 4 (liquid waste)
50 0 20 0
The results highlight that samples are contaminated with some form of helminth egg and therefore
pose a possible risk to humans that may come into contact with sludge directly or soil it has been
applied to through the skin or oral digestion. The laboratory highlighted during analysis that for the
case of A. lumbricoides eggs, there were more fertilised than non-fertilised eggs observed, with
samples from HH#1 and IPLT Tank 4 having fertilised eggs. The lab also found only S. stercoralis
and hookworm in larvae form with no eggs, suggesting the eggs had already hatched.
Chemical characteristics of samples were also analysed using the Environmental Engineering
department at the University of Indonesia. The full report (Kennedy-Walker, 2014) contains details
of the test results.
6.2 Current treatment and end-use
There is currently one fecal sludge treatment facility serving Balikpapan, consisting of a discharge
chamber and four drying beds. The volume of each drying bed is approximately 207m3 (measured
tank size 23*6*1.5m). Therefore the total volume of the IPLT is 828m3. If the physical capacity of the
existing private emptying equipment was achieved (73.5m3 /day) the IPLT would reach its volumetric
capacity in approximately 11 days.
Two drying beds were not functioning at the time of observation and with no operating procedures
or design manuals available, the actual operating capacity is unclear.
Records at the IPLT show 159 loads of FS to the treatment facility in 2013 (no indication of volume
of truck used). The recorded number of loads at the IPLT is much less than those expected (564
loads per year) when calculating from information received from emptying companies (based on 42
trip/month for companies that empty into IPLT). The contrasting information is either down to poor
record keeping at IPLT, incorrect information supplied by emptiers or some of the sludge not being
dumped at the IPLT.
Currently testing of treatment efficiency occurs annually on the liquid influent and effluent to the IPLT
and adjacent IPAL. The sample results observed from interviews held at the IPLT show that the
results do not meet the required effluent standard. Independent samples taken also show that the
effluent does not meet the standards. Interviewees indicated that if the sample results do not comply
with environmental standards nothing is done to change procedure or operation of the IPLT.
Report of a FSM study in Balikpapan, Indonesia
33
Currently none of the solid effluent from the IPLT is reused, with dried septage sludge disposed of
adjacent to the IPLT bed structure. Operational staff state that the sludge is removed periodically
(every 6 months), but there are no records of this operation and the growth of vegetation on the
drying beds suggests that it is done infrequently. The liquid effluent from the tanks outflows to the
IPAL downstream of the landfill.
Future options for end-use?
Results of recent studies carried out by Sandec/Eawag to analyse the calorific value of fecal sludge
taken from various sources highlight that on average the calorific value of untreated sludge is
17.3MJ/kg dry solids (Gold, 2013), which compares well with other biomas fuels. Average values for
fecal sludge from on-site sanitation systems in the Sandec study (based in 3 cities in Africa) were
significantly higher than results obtained in Balikpapan. The lower calorific value is possibly
influenced by local diet as well as the practice of using water for anal cleansing. Also given the humid
climate, the level of pre-drying required to achieve a sufficiently low moisture content for the fecal
sludge to act as a viable fuel-source would be technically challenging and unlikely to be cost-
effective.
Together with the chemical and physical characteristics of the fecal sludge, the calorific value results
point to the fact that the fecal waste is very liquid, very dilute and very weak. Collectively these
characteristics suggest that the fecal sludge is likely to be too weak or dilute to be of much value for
any type of beneficial, market-based end-use. Effluent re-use in nearby agricultural areas may be
the most viable option available, if deemed acceptable and the process can be safely managed.
In relation to potential expansion of the site and services, a new government-owned 4m³ tanker could
provide more loading to IPLT if commissioned. A new IPLT is due to be built in the future- details of
the design and when are unknown. Expansions of service may come about if the running of the IPLT
moves to a new technical unit. Mining companies have indicated they may be interested in using
large qualities of treated sludge for mandatory land reclamation.
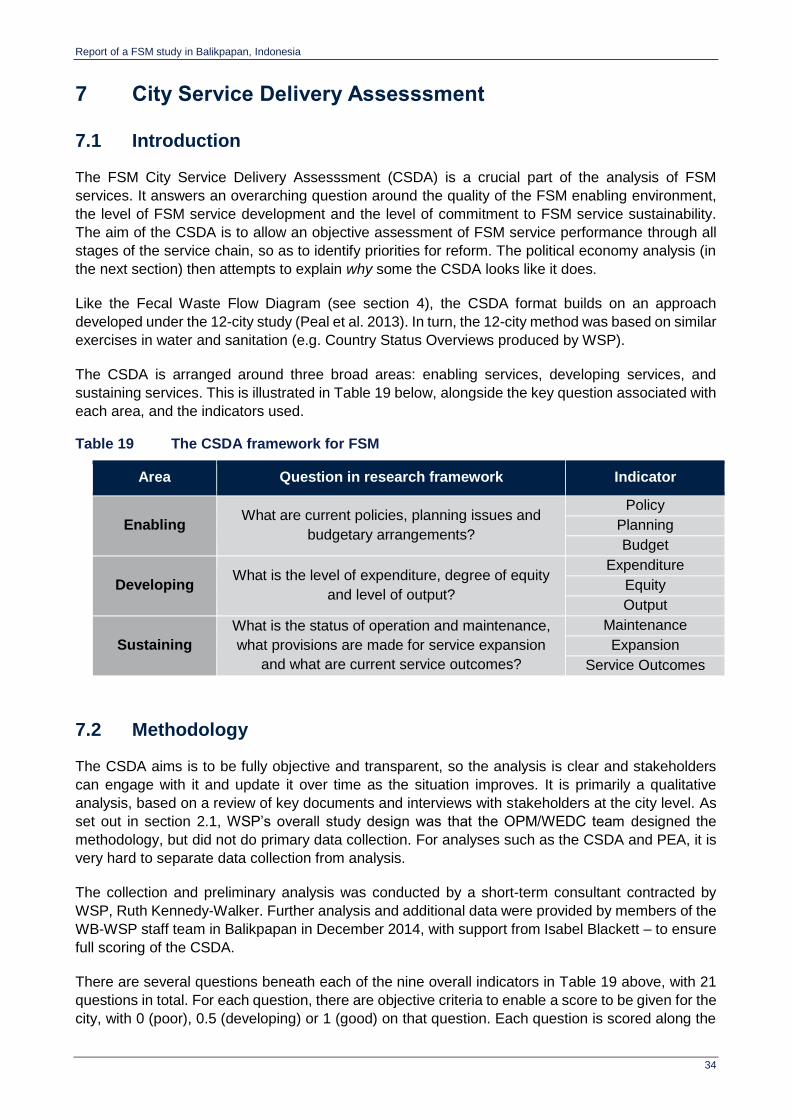
Report of a FSM study in Balikpapan, Indonesia
34
7 City Service Delivery Assesssment
7.1 Introduction
The FSM City Service Delivery Assesssment (CSDA) is a crucial part of the analysis of FSM
services. It answers an overarching question around the quality of the FSM enabling environment,
the level of FSM service development and the level of commitment to FSM service sustainability.
The aim of the CSDA is to allow an objective assessment of FSM service performance through all
stages of the service chain, so as to identify priorities for reform. The political economy analysis (in
the next section) then attempts to explain why some the CSDA looks like it does.
Like the Fecal Waste Flow Diagram (see section 4), the CSDA format builds on an approach
developed under the 12-city study (Peal et al. 2013). In turn, the 12-city method was based on similar
exercises in water and sanitation (e.g. Country Status Overviews produced by WSP).
The CSDA is arranged around three broad areas: enabling services, developing services, and
sustaining services. This is illustrated in Table 19 below, alongside the key question associated with
each area, and the indicators used.
Table 19 The CSDA framework for FSM
Area Question in research framework Indicator
Enabling What are current policies, planning issues and
budgetary arrangements?
Policy
Planning
Budget
Developing What is the level of expenditure, degree of equity
and level of output?
Expenditure
Equity
Output
Sustaining
What is the status of operation and maintenance,
what provisions are made for service expansion
and what are current service outcomes?
Maintenance
Expansion
Service Outcomes
7.2 Methodology
The CSDA aims is to be fully objective and transparent, so the analysis is clear and stakeholders
can engage with it and update it over time as the situation improves. It is primarily a qualitative
analysis, based on a review of key documents and interviews with stakeholders at the city level. As
set out in section 2.1, WSP’s overall study design was that the OPM/WEDC team designed the
methodology, but did not do primary data collection. For analyses such as the CSDA and PEA, it is
very hard to separate data collection from analysis.
The collection and preliminary analysis was conducted by a short-term consultant contracted by
WSP, Ruth Kennedy-Walker. Further analysis and additional data were provided by members of the
WB-WSP staff team in Balikpapan in December 2014, with support from Isabel Blackett – to ensure
full scoring of the CSDA.
There are several questions beneath each of the nine overall indicators in Table 19 above, with 21
questions in total. For each question, there are objective criteria to enable a score to be given for the
city, with 0 (poor), 0.5 (developing) or 1 (good) on that question. Each question is scored along the
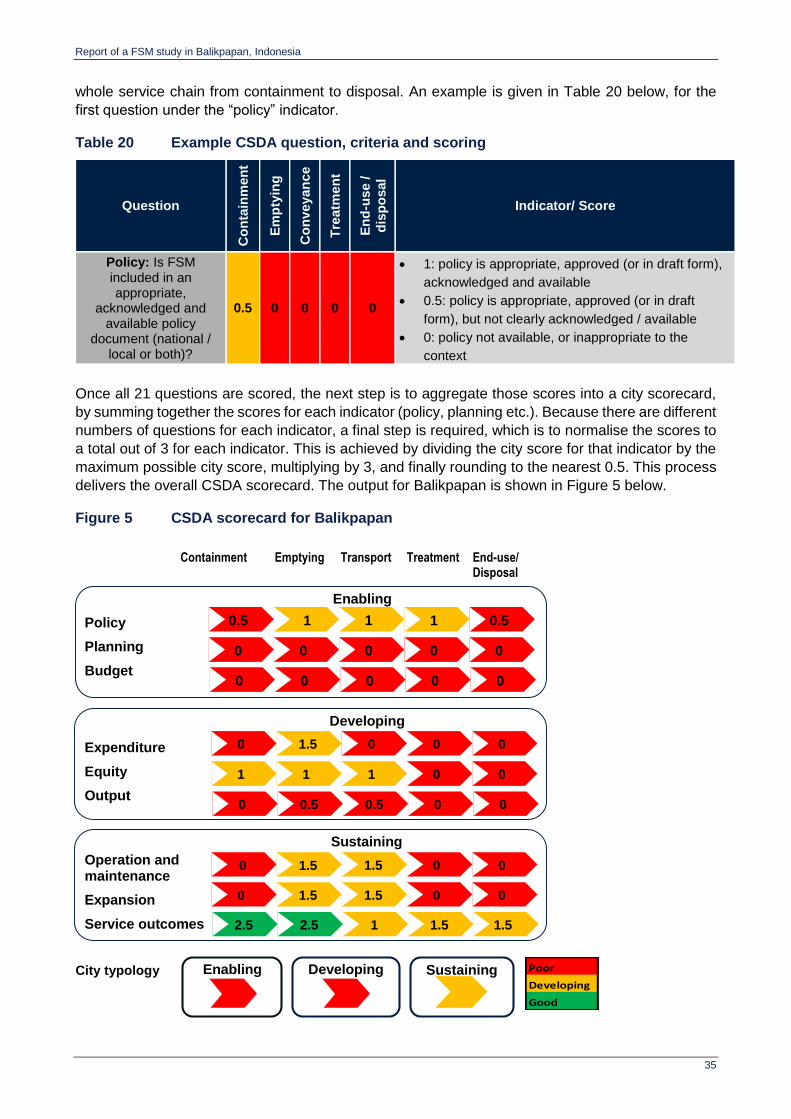
Report of a FSM study in Balikpapan, Indonesia
35
whole service chain from containment to disposal. An example is given in Table 20 below, for the
first question under the “policy” indicator.
Table 20 Example CSDA question, criteria and scoring
Question
Co
nta
inm
en
t
Em
pty
ing
Co
nveyan
ce
Tre
atm
en
t
En
d-u
se /
dis
po
sal
Indicator/ Score
Policy: Is FSM included in an appropriate,
acknowledged and available policy
document (national / local or both)?
0.5 0 0 0 0
1: policy is appropriate, approved (or in draft form),
acknowledged and available
0.5: policy is appropriate, approved (or in draft
form), but not clearly acknowledged / available
0: policy not available, or inappropriate to the
context
Once all 21 questions are scored, the next step is to aggregate those scores into a city scorecard,
by summing together the scores for each indicator (policy, planning etc.). Because there are different
numbers of questions for each indicator, a final step is required, which is to normalise the scores to
a total out of 3 for each indicator. This is achieved by dividing the city score for that indicator by the
maximum possible city score, multiplying by 3, and finally rounding to the nearest 0.5. This process
delivers the overall CSDA scorecard. The output for Balikpapan is shown in Figure 5 below.
Figure 5 CSDA scorecard for Balikpapan
0.5 0.5 1 1 1
0 0 0 0 0
0 0 0 0 0
Policy
Planning
Budget
Enabling
0 0 1.5 0 0
1 0 1 1 0
0 0 0.5 0.5 0
Expenditure
Equity
Output
Developing
0 0 1.5 1.5 0
0 0 1.5 1.5 0
2.5 1.5 2.5 1 1.5
Operation and maintenance
Expansion
Service outcomes
Sustaining
City typology Enabling
Developing
Sustaining
Containment Emptying Transport Treatment End-use/ Disposal
Poor
Developing
Good

Report of a FSM study in Balikpapan, Indonesia
36
7.3 Findings
The overall CSDA scorecard for Balikpapan is shown above as Figure 5. An explanation for each
score allocated to the full set of 21 questions is shown in Annex A, while the following summaries
the implications of those results.
7.3.1 Enabling
While the policy environment for FSM in Balikpapan remains relatively weak, it is rapidly developing.
The work of the Sanitation Task Force has enabled the new Head of Bappeda and the city Mayor to
identify and propose new institutional arrangements to enhance FSM services and effective
treatment of septage from on-site sanitation systems at the treatment facilities. Policy, regulatory
and legislative arrangements to support these changes will need to be developed.
Budget allocations have been poorly coordinated in the past – and will need to be oriented in line
with the new institutional arrangements, as they are translated into law and responsibilities for asset
ownership transferred.
7.3.2 Developing
There has been a notable lack of government financial support to FSM services, with provision only
for attempting to maintain operation of the septage treatment facility. Bappeda have indicated plans
to invest in more desludging trucks, to be operated by the private sector. Currently emptying services
are mainly provided by private sector providers. Use of emptying services by households are
constrained by cost, location and access (to the property and into the soak pit/ septic tank itself),
especially for the urban poor. Those who use desludging services report being satisfied with them,
but the city sanitation plan does not identify how services will expand to meet future demand and
ensure safety in the transfer of FS through the whole of the service chain.
While FS may be safely collected from containment systems, it is not all transferred to a safe
treatment or disposal location. The treatment facility is not well managed and does not provide
effective treatment at the current loading rates.
7.3.3 Sustaining
The new Sanitation Master Plan – being developed under the leadership of Bappeda – is to include
FSM as a component. The Health Agency census data is also beginning to account for sanitation
and FSM services at household level. These are encouraging signs that the city is moving towards
addressing FSM as a significant component of future investment options.
While private operators of desludging trucks appear to break even financially, other stages of the
service chain – notably operation of the septage treatment facility – do not currently achieve cost-
recovery. There are no current plans reported to strengthen the role of private emptying service
providers, although this may be affected by a new Mayoral decree affecting new institutional
arrangements for septage management, as noted in February 2015.
Regarding compliance with national standards for FS services, these only exist in relation to the
construction of on-site containment systems, not to further stages of the service chain. Even then,
households are predominantly using non-compliant standards of containment facilities, with pour-
flush latrines discharging to a single or double compartment “cubluk” (rather than a septic tank). Not
fully lined, the cubluk acts as a soak-pit, with implications for both the frequency of emptying
requirements and the extent of contamination of the groundwater in the meantime. In spite of this,

Report of a FSM study in Balikpapan, Indonesia
37
households are not that reliant on groundwater for direct consumption, but rather for showering, toilet
use, laundry and personal washing. Health risks associated with FSM services are considered to be
low – backed-up by a reported incidence of diarrhoea at less than 2% of children of families
questioned during a Willingness to Pay study.
However, in the long-term, without attention given to improving technical arrangements of on-site
facilities and consideration for a range of emptying services that can reach into poor areas and
provide affordable services, demand for safe and effective emptying services will continue to be
constrained.
7.3.4 Implications of the CSDA scorecard
The resulting CSDA scorecard and city typology of the FSM City Service Delivery Assesssment in
Figure 5 reveals that the city is beginning to make progress in areas of supporting improvements to
FSM services – with these mainly being demonstrated through the emptying and transportation
stages of the service chain. As the service outcomes are generally good from the household
perspective (containment and emptying of fecal sludge), attention needs to be paid to the safe
transfer of fecal sludge to effective treatment facilities.
While new institutional arrangements and plans for FSM as part of the Sanitation Master Plan are
starting to be addressed (see next section), consideration will need to be given to the costings
(investment and recovery) for a range of service and intervention options, to support implementation.

Report of a FSM study in Balikpapan, Indonesia
38
8 Next steps for Balikpapan city
The World Bank - WSP technical assistance in Balikpapan ran in parallel, and often slightly ahead
of the global FSM research study. Findings from an assessment of the city’s FSM services were
reached at an early stage and presented to all key stakeholders during a workshop held in August
2014.
At that meeting, significant buy-in to the results of the study was generated – leading to discussions
of proposed actions. In particular, the Head of the City Planning Department was noted to take a
strong lead on actions to follow. In particular, the findings related to customer preferences and
willingness to pay for regular desludging, was greeted with a response of “well let’s do it – how do
we start?”.
The SFD was a significant mechanisms to draw people’s attention to discussing next steps. These
discussions were structured around the sanitation chain, in relation where the flow of fecal waste
“drops out” of the service chain.
Key issues identified related to:
poor households having poorer quality latrines that act more like open defecation, overhung or
overflowing. They are often in narrow lanes and far from main roads, making emptying difficult.
This would need to be considered.
the need for a more regulated private sector, contracted to do regular desludging and having
an improved ‘on call’ system. This would need to be supported by communications with the
public and how this be bets done.
resolving institutional responsibilities, leading to institutions knowing who should do what
Bappeda, PDAM and other key stakeholders have since identified steps to improve FSM services in
the city. This led to a series of proposed or achieved actions in December 2015:
Area for action Action / responsibility
Lead agency for FSM services The Mayor has appointed the PDAM (the Water Utility) to
manage FSM services and clarified this in regulation.
Task Force to address FSM service issues
PDAM is to establish the services team including technical,
planning, MIS, marketing and financial staff
Communication / promotion initiatives
PDAM are to develop materials and a communication
strategy
Asset ownership
Arrangements for ownership and / or paying charges for use
of local government assets (fecal sludge treatment plant) to
be established
Private sector partnership A form of partnership with private sector providers is to be
developed by the PDAM
Regular desludging
PDAM will provide both an on-demand and regular
desludging services. A tariff to cover regular desludging and
financial aspects is to be established, starting with a pilot
project covering 1,000 households. Improved record-keeping
and MIS, necessary for managing the regular desludging
program, will be developed.
Report of a FSM study in Balikpapan, Indonesia
39
A Sanitation Working Group has been established and a City Sanitation Strategy (CSS) developed
that lays out targets and identifies required sanitation development activities. This in turn has enabled
the new Head of Bappeda (the City Planning Agency) and the city Mayor to identify and propose
new institutional arrangements to enhance FSM services and effective treatment of septage from
on-site sanitation systems at the treatment facilities. Policy, regulatory and legislative arrangements
to support these changes will need to be developed. Budget allocations, poorly coordinated in the
past, will need to be oriented in line with the new institutional arrangements as they are translated
into law and responsibilities for asset ownership transferred.
The local House of Representatives has been formulating a sanitation law, with regulation focusing
on issues of tariffs and off-site sewerage services. It has been identified that the development of a
new city sanitation master plan should include regulation around non-networked services and private
sector emptying, to ensure these issues are included in future legislation. While new institutional
arrangements and plans for FSM services, as part of the sanitation master plan, are starting to be
addressed, consideration will need to be given to the costings (investment and recovery) for a range
of service levels and intervention options, to support implementation. Bappeda have indicated plans
to invest in more private sector-operated desludging trucks and construction of a new septage
treatment plant. Use of emptying services by households is currently constrained by cost, location
and access (to the property and into the tank itself), especially for the urban poor. Those who use
desludging services report being satisfied with them, but the sanitation master plan must also identify
how these services will expand to meet future demand, to ensure safe transfer of fecal sludge to
effectively managed treatment facilities.
Report of a FSM study in Balikpapan, Indonesia
40
References / Bibliography
Euroconsult Mott MacDonald, 2014, Balikpapan Sanitation Sector Project Feasibility Study, January
2014
Gold, A. M., 2013, Faecal Sludge-From Waste to Solid biofuel? SANDEC (Department of Water and
Sanitation in Developing Countries), Eawag, Zurich, Switzerland
Kennedy-Walker, R., 2014, Diagnostics and Guidelines for Fecal Sludge Management: Report of
data collected from Balikpapan, Indonesia. 20th June 2014
Mills, F., Blackett, I and Tayler, K., 2014, Assessing on-site systems and sludge accumulation rates
to understand pit emptying in Indonesia, in Sustainable Water and Sanitation Service for All in a
Fast Changing World, proceedings of the 37th International Conference, Hanoi, Vietnam, WEDC,
Loughborough University, UK
Peal A., Evans B., Blackett I., Hawkins P. and Heymans C., 2014. Fecal sludge management (FSM):
analytical tools for assessing FSM in cities. Review paper. Journal of Water, Sanitation and Hygiene
for Development: 04.3, pp. 371-383. IWA Publishing
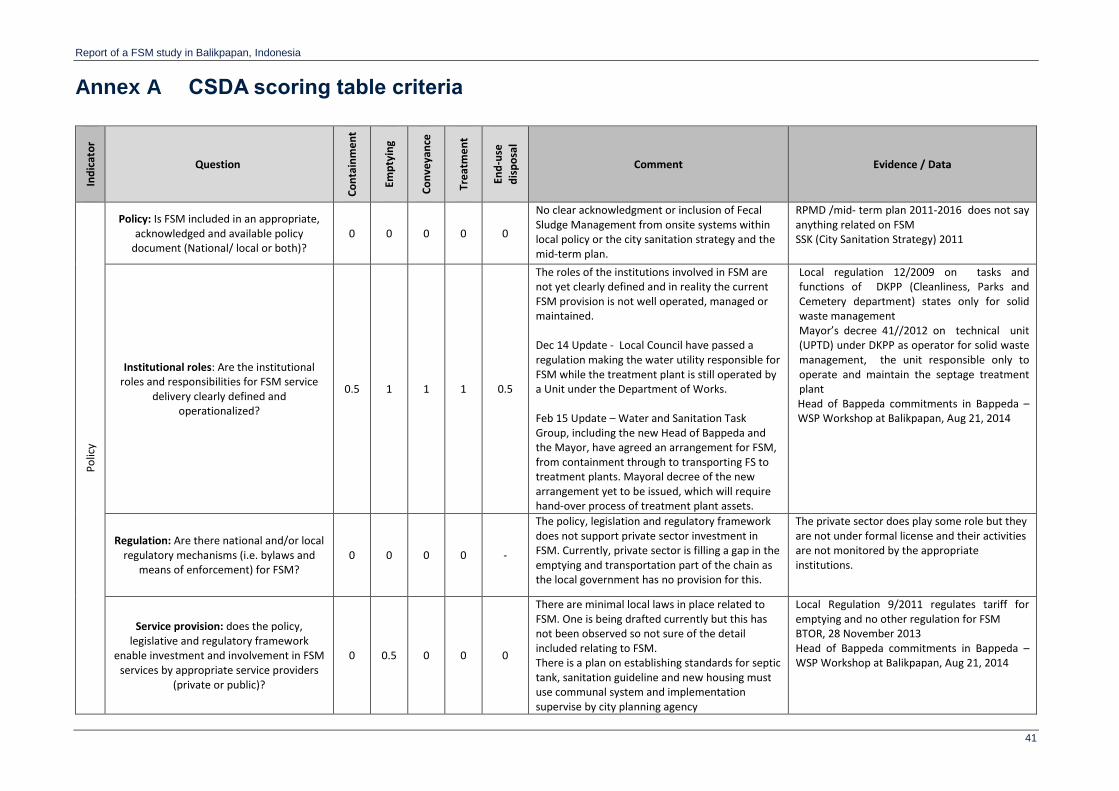
Report of a FSM study in Balikpapan, Indonesia
41
Annex A CSDA scoring table criteria In
dic
ato
r
Question
Co
nta
inm
en
t
Emp
tyin
g
Co
nve
yan
ce
Tre
atm
en
t
End
-use
dis
po
sal
Comment Evidence / Data
Po
licy
Policy: Is FSM included in an appropriate, acknowledged and available policy
document (National/ local or both)? 0 0 0 0 0
No clear acknowledgment or inclusion of Fecal Sludge Management from onsite systems within local policy or the city sanitation strategy and the mid-term plan.
RPMD /mid- term plan 2011-2016 does not say anything related on FSM SSK (City Sanitation Strategy) 2011
Institutional roles: Are the institutional roles and responsibilities for FSM service
delivery clearly defined and operationalized?
0.5 1 1 1 0.5
The roles of the institutions involved in FSM are not yet clearly defined and in reality the current FSM provision is not well operated, managed or maintained. Dec 14 Update - Local Council have passed a regulation making the water utility responsible for FSM while the treatment plant is still operated by a Unit under the Department of Works. Feb 15 Update – Water and Sanitation Task Group, including the new Head of Bappeda and the Mayor, have agreed an arrangement for FSM, from containment through to transporting FS to treatment plants. Mayoral decree of the new arrangement yet to be issued, which will require hand-over process of treatment plant assets.
Local regulation 12/2009 on tasks and functions of DKPP (Cleanliness, Parks and Cemetery department) states only for solid waste management Mayor’s decree 41//2012 on technical unit (UPTD) under DKPP as operator for solid waste management, the unit responsible only to operate and maintain the septage treatment plant Head of Bappeda commitments in Bappeda – WSP Workshop at Balikpapan, Aug 21, 2014
Regulation: Are there national and/or local regulatory mechanisms (i.e. bylaws and
means of enforcement) for FSM? 0 0 0 0 -
The policy, legislation and regulatory framework does not support private sector investment in FSM. Currently, private sector is filling a gap in the emptying and transportation part of the chain as the local government has no provision for this.
The private sector does play some role but they are not under formal license and their activities are not monitored by the appropriate institutions.
Service provision: does the policy, legislative and regulatory framework
enable investment and involvement in FSM services by appropriate service providers
(private or public)?
0 0.5 0 0 0
There are minimal local laws in place related to FSM. One is being drafted currently but this has not been observed so not sure of the detail included relating to FSM. There is a plan on establishing standards for septic tank, sanitation guideline and new housing must use communal system and implementation supervise by city planning agency
Local Regulation 9/2011 regulates tariff for emptying and no other regulation for FSM BTOR, 28 November 2013 Head of Bappeda commitments in Bappeda – WSP Workshop at Balikpapan, Aug 21, 2014
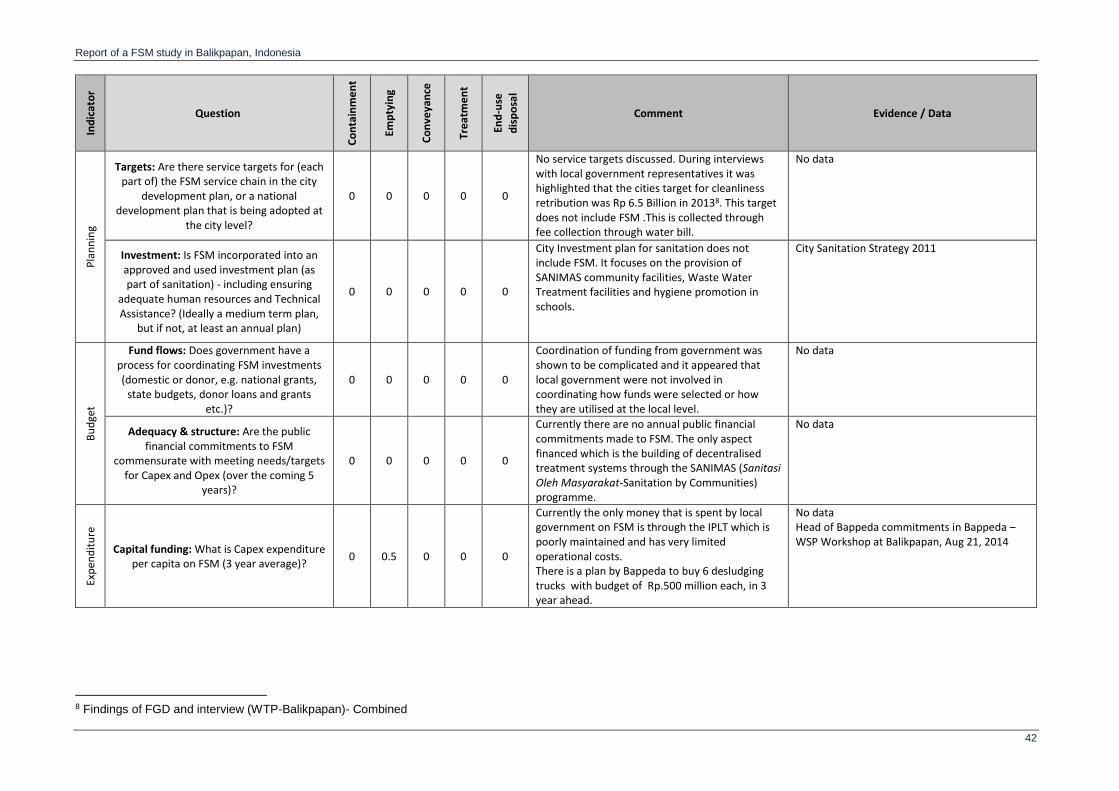
Report of a FSM study in Balikpapan, Indonesia
42
Ind
icat
or
Question
Co
nta
inm
en
t
Emp
tyin
g
Co
nve
yan
ce
Tre
atm
en
t
End
-use
dis
po
sal
Comment Evidence / Data
Pla
nn
ing
Targets: Are there service targets for (each part of) the FSM service chain in the city
development plan, or a national development plan that is being adopted at
the city level?
0 0 0 0 0
No service targets discussed. During interviews with local government representatives it was highlighted that the cities target for cleanliness retribution was Rp 6.5 Billion in 20138. This target does not include FSM .This is collected through fee collection through water bill.
No data
Investment: Is FSM incorporated into an approved and used investment plan (as part of sanitation) - including ensuring
adequate human resources and Technical Assistance? (Ideally a medium term plan,
but if not, at least an annual plan)
0 0 0 0 0
City Investment plan for sanitation does not include FSM. It focuses on the provision of SANIMAS community facilities, Waste Water Treatment facilities and hygiene promotion in schools.
City Sanitation Strategy 2011
Bu
dge
t
Fund flows: Does government have a process for coordinating FSM investments (domestic or donor, e.g. national grants,
state budgets, donor loans and grants etc.)?
0 0 0 0 0
Coordination of funding from government was shown to be complicated and it appeared that local government were not involved in coordinating how funds were selected or how they are utilised at the local level.
No data
Adequacy & structure: Are the public financial commitments to FSM
commensurate with meeting needs/targets for Capex and Opex (over the coming 5
years)?
0 0 0 0 0
Currently there are no annual public financial commitments made to FSM. The only aspect financed which is the building of decentralised treatment systems through the SANIMAS (Sanitasi Oleh Masyarakat-Sanitation by Communities) programme.
No data
Exp
end
itu
re
Capital funding: What is Capex expenditure per capita on FSM (3 year average)?
0 0.5 0 0 0
Currently the only money that is spent by local government on FSM is through the IPLT which is poorly maintained and has very limited operational costs. There is a plan by Bappeda to buy 6 desludging trucks with budget of Rp.500 million each, in 3 year ahead.
No data Head of Bappeda commitments in Bappeda – WSP Workshop at Balikpapan, Aug 21, 2014
8 Findings of FGD and interview (WTP-Balikpapan)- Combined

Report of a FSM study in Balikpapan, Indonesia
43
Ind
icat
or
Question
Co
nta
inm
en
t
Emp
tyin
g
Co
nve
yan
ce
Tre
atm
en
t
End
-use
dis
po
sal
Comment Evidence / Data
Equ
ity
Choice: Is there a range of affordable, appropriate, safe and adaptable
technologies for FSM services available to meet the needs of the urban poor?
0 0 0 0 0
Options such as tank emptying do exist and in some cases are used by the urban poor. Barriers such as cost, location, access and support for ensuring proper maintenance may inhibit use.
Social and On-site sanitation study, October 2014 on main findings: 53% of households are located in the lane of less than 2 meters wide 83% of soak pits/septic tanks have no access hole and need breaking the top slab or ceramic/ floor for emptying
Reducing inequity: Are there specific and adequate funds, plans and measures to
ensure FSM serves all users, and specifically the urban poor?
0.5 0.5 0.5 0 0
The current city sanitation plan does not detail how improved sanitation for the urban poor will be met in detail. One of the private sector companies’ has plans to provide tanks suitable for accessing low income areas.
No data
Ou
tpu
ts
Quantity / capacity: Is the capacity of the FSM chain growing at the pace required to ensure access to FSM meets the needs and
targets that protects public & environmental health?
0 0.5 0.5 0 0
Capacity at each part of the chain is not growing. The actual demands for FSM are met by the current provision but this does not ensure protection for public and environmental health.
No data
Quality: Is the quality of FSM sufficient to ensure functioning facilities and services
that protect against risk through the service chain?
0 0 0 0 0
The quality of FSM is poor with the only part of the chain that is properly functioning being the emptying and transportation part which is run by the private sector and not all septage is transported to septage treatment plant. The majority of on-site system used by households is not proper septic tank . The septage treatment plant is not properly operated.
Final Balikpapan Report For FSM Diagnostic and Guidelines Development Project, June 2014 Balikpapan Report: Social and on-site sanitation study, October 014 Sludge Treatment Facility Balikpapan: Present operational procedures and options for improvement , October 2014
Reporting: Are there procedures and processes applied on a regular basis to monitor FSM access and the quality of
services and is the information disseminated?
0 0 0 0 0
There is no reporting of the current FSM access and quality of service provided by the city authorities. The health department conduct surveys which have a part that assesses containment but this is done every 3 years.
No data
O&
M Cost recovery: Are O&M costs known and
fully met by either cost recovery through user fees and/or local revenue or transfers?
0 1 1 0 0
Operation and maintenance fees for IPLT treatment facility are not met by fees collected for dumping at IPLT or local revenue for FSM. For emptying and transport it was reported that most months the companies break even.
BTOR, 28 November 2013 : total revenue in 2012 and 2013 was IDR 3 million respectively and could not cover the operational costs
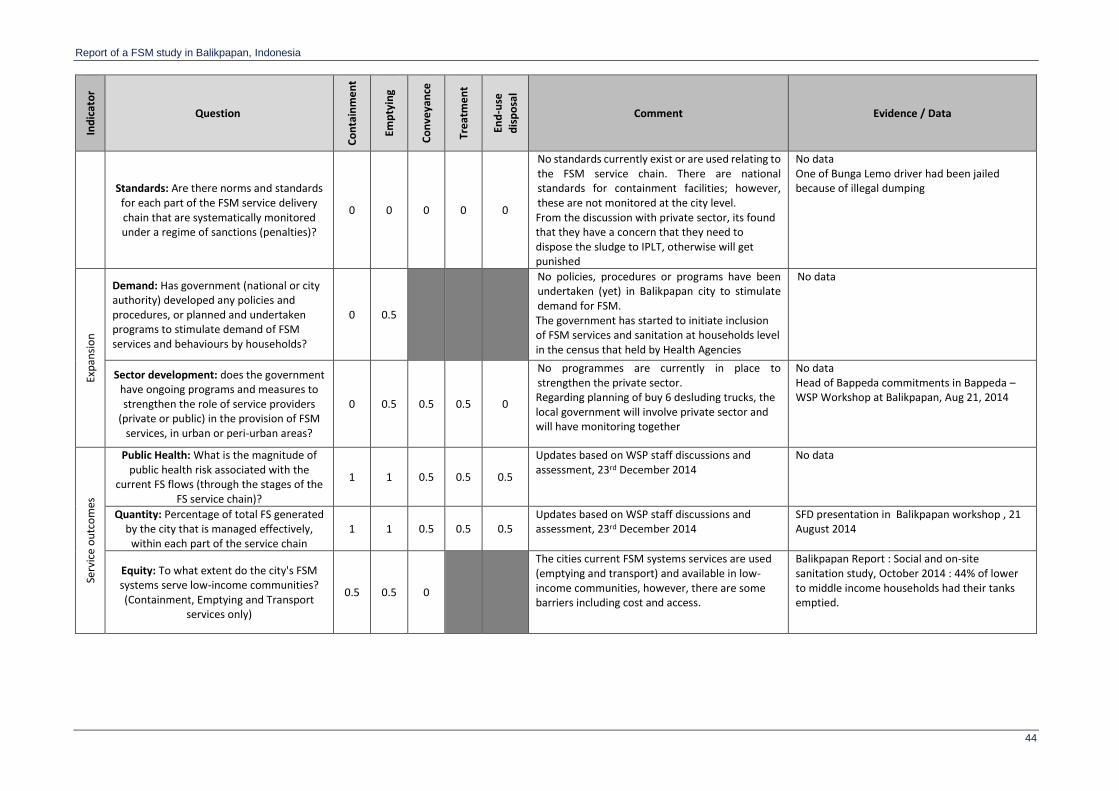
Report of a FSM study in Balikpapan, Indonesia
44
Ind
icat
or
Question
Co
nta
inm
en
t
Emp
tyin
g
Co
nve
yan
ce
Tre
atm
en
t
End
-use
dis
po
sal
Comment Evidence / Data
Standards: Are there norms and standards for each part of the FSM service delivery chain that are systematically monitored under a regime of sanctions (penalties)?
0 0 0 0 0
No standards currently exist or are used relating to the FSM service chain. There are national standards for containment facilities; however, these are not monitored at the city level. From the discussion with private sector, its found that they have a concern that they need to dispose the sludge to IPLT, otherwise will get punished
No data One of Bunga Lemo driver had been jailed because of illegal dumping
Exp
ansi
on
Demand: Has government (national or city authority) developed any policies and procedures, or planned and undertaken programs to stimulate demand of FSM services and behaviours by households?
0 0.5
No policies, procedures or programs have been undertaken (yet) in Balikpapan city to stimulate demand for FSM. The government has started to initiate inclusion of FSM services and sanitation at households level in the census that held by Health Agencies
No data
Sector development: does the government have ongoing programs and measures to strengthen the role of service providers
(private or public) in the provision of FSM services, in urban or peri-urban areas?
0 0.5 0.5 0.5 0
No programmes are currently in place to strengthen the private sector. Regarding planning of buy 6 desluding trucks, the local government will involve private sector and will have monitoring together
No data Head of Bappeda commitments in Bappeda – WSP Workshop at Balikpapan, Aug 21, 2014
Serv
ice
ou
tco
mes
Public Health: What is the magnitude of public health risk associated with the
current FS flows (through the stages of the FS service chain)?
1 1 0.5 0.5 0.5
Updates based on WSP staff discussions and assessment, 23rd December 2014
No data
Quantity: Percentage of total FS generated by the city that is managed effectively,
within each part of the service chain 1 1 0.5 0.5 0.5
Updates based on WSP staff discussions and assessment, 23rd December 2014
SFD presentation in Balikpapan workshop , 21 August 2014
Equity: To what extent do the city's FSM systems serve low-income communities? (Containment, Emptying and Transport
services only)
0.5 0.5 0
The cities current FSM systems services are used (emptying and transport) and available in low-income communities, however, there are some barriers including cost and access.
Balikpapan Report : Social and on-site sanitation study, October 2014 : 44% of lower to middle income households had their tanks emptied.

Report of a FSM study in Balikpapan, Indonesia
45
Annex B Links to data collection instruments
See the instruments and Terms of Reference report here.

Fecal Sludge Management: Diagnostics
for Service Delivery in Urban Areas
Case study in Dhaka, Bangladesh
Supporting document Final April 2016

Case study report – Fecal Sludge Management in Dhaka, Bangladesh
i
Preface / Acknowledgements
This report is a city case study of a World Bank Economic and Sector Work on Fecal Sludge
Management: Diagnostics for Service Delivery in Urban Areas (P146128). The task team leaders
were Isabel Blackett and Peter Hawkins and the task team members were Zael Sanz Uriarte,
Ravikumar Joseph, Chris Heymans and Guy Hutton.
This report is based on work conducted between January 2014 and February 2016 by Oxford
Policy Management (OPM) in partnership with the Water, Engineering and Development Centre
(WEDC) at Loughborough University. The core research team was Ian Ross (OPM), Rebecca
Scott (WEDC), Ana Mujica (OPM) and Mike Smith (WEDC). The broader team who contributed to
the study included Zach White, Rashid Zaman and Simon Brook from OPM, as well as Andy
Cotton and Sam Kayaga from WEDC. Andy Peal (independent consultant) also contributed to
certain aspects of the methodology.
Detailed feedback on early drafts was received from Ravikumar Joseph, Isabel Blackett and Peter
Hawkins and Josses Mugabi of the World Bank, as well as Elisabeth Kvarnstrom and Mark Ellery
(consultants). The team benefitted from the support and facilitation of Abdul Motaleb and Nishtha
Mehta of the World Bank.
Finally, helpful feedback from Dhaka WASH sector stakeholders was received at the beginning
and end of the research process, through workshops at the World Bank office in May 2014 and
October 2014.
Case study report – Fecal Sludge Management in Dhaka, Bangladesh
ii
Executive summary
Introduction
This report summarises the main findings of a case study on faecal sludge management in Dhaka,
Bangladesh. It is part of the project entitled ‘Fecal Sludge Management: Diagnostics for Service
Delivery in Poor Urban Areas’, funded by the World Bank Water and Sanitation Programme (WSP).
There are five city case studies as part of this project (Balikpapan, Dhaka, Freetown, Lima and Santa
Cruz). The specific objectives of the Dhaka study were:
To provide quantitative and qualitative data on the sanitation situation in Dhaka from a socio-
economic perspective, specifically as it relates to FSM.
To do the above in such a way that the data is representative of the city as a whole but also
providing a separate picture of the situation in slums (especially the slum areas of Mirpur and
Uttara where a World Bank-supported project is underway)
To provide initial recommendations to guide discussions around future interventions in the
sanitation sector in Dhaka, by contributing credible data and analysis.
To inform the development of analytical tools and guidelines for using them, by “road-testing”
draft tools using primary data collection.
Methodology
The study followed an overall research framework developed as part of the inception period, which
set out research questions and sub-questions. Data collection instruments were then developed so
as to answer these questions. Six data collection instruments were used in Dhaka, four quantitative
and two qualitative. The quantitative instruments were a household survey, transect walks,
observation of service provider practices, and tests of fecal sludge characteristics. The qualitative
instruments were key informant interviews and focus group discussions.
The OPM / WEDC team led on methodology design and data analysis, while data collection was
undertaken by separately-contracted consultants under the leadership of WSP. All data collection
was undertaken by Adhuna Ltd, with the exception of key informant interviews which were
undertaken by WSP short-term consultants.
The household survey primarily aimed to collect data from households using on-site sanitation
(particularly those living in slums) regarding their use of FSM services and preferences for future
FSM services. The sampling was carefully planned so as to allow conclusions to be drawn about the
city as a whole on a representative basis, and about slum areas in particular, on a purposive basis.
The transect walks aimed to enable participants to make a subjective and qualitative assessment of
physical and environmental conditions within a community. The observation protocol for service
providers involved making visual inspections about fecal sludge (FS) from pits or tanks to final
disposal, in particular watching service providers go about their business. The tests of FS
characteristics were carried out at three stages: (i) during removal, (ii) after removal, and (iii) after
treatment (which was not relevant for Dhaka). The key informant interviews aimed to address key
questions about how both the ‘enabling environment’ and the operating environment affects FSM
services (past, current and future). Finally, the focus group discussions with residents of informal
settlements aimed to gather qualitative data that would complement, validate, or challenge
conclusions drawn from the household survey data.
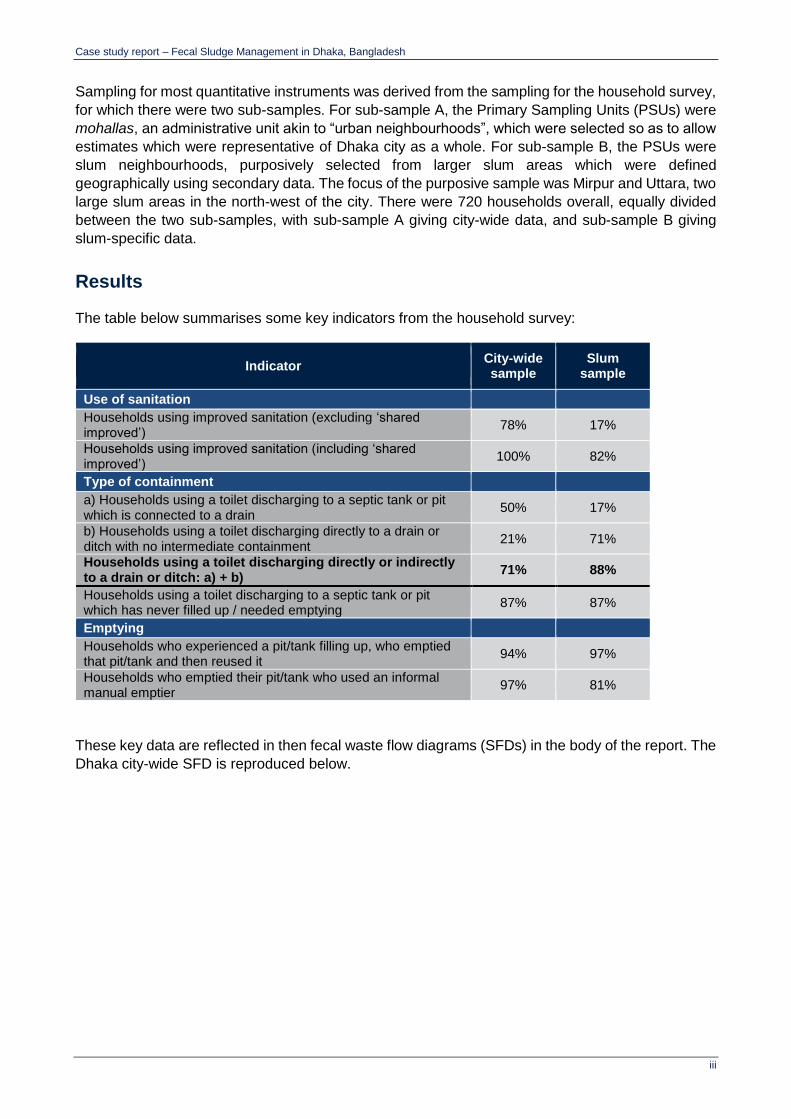
Case study report – Fecal Sludge Management in Dhaka, Bangladesh
iii
Sampling for most quantitative instruments was derived from the sampling for the household survey,
for which there were two sub-samples. For sub-sample A, the Primary Sampling Units (PSUs) were
mohallas, an administrative unit akin to “urban neighbourhoods”, which were selected so as to allow
estimates which were representative of Dhaka city as a whole. For sub-sample B, the PSUs were
slum neighbourhoods, purposively selected from larger slum areas which were defined
geographically using secondary data. The focus of the purposive sample was Mirpur and Uttara, two
large slum areas in the north-west of the city. There were 720 households overall, equally divided
between the two sub-samples, with sub-sample A giving city-wide data, and sub-sample B giving
slum-specific data.
Results
The table below summarises some key indicators from the household survey:
Indicator City-wide sample
Slum sample
Use of sanitation
Households using improved sanitation (excluding ‘shared improved’)
78% 17%
Households using improved sanitation (including ‘shared improved’)
100% 82%
Type of containment
a) Households using a toilet discharging to a septic tank or pit which is connected to a drain
50% 17%
b) Households using a toilet discharging directly to a drain or ditch with no intermediate containment
21% 71%
Households using a toilet discharging directly or indirectly to a drain or ditch: a) + b)
71% 88%
Households using a toilet discharging to a septic tank or pit which has never filled up / needed emptying
87% 87%
Emptying
Households who experienced a pit/tank filling up, who emptied that pit/tank and then reused it
94% 97%
Households who emptied their pit/tank who used an informal manual emptier
97% 81%
These key data are reflected in then fecal waste flow diagrams (SFDs) in the body of the report. The
Dhaka city-wide SFD is reproduced below.
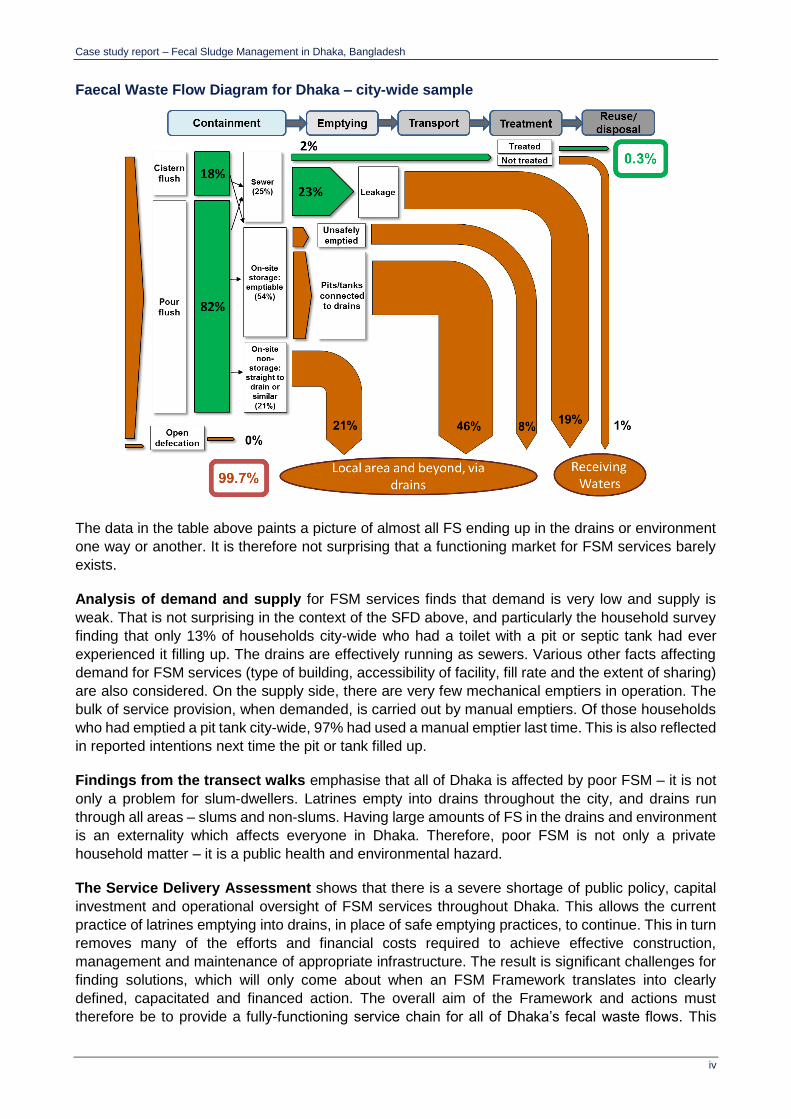
Case study report – Fecal Sludge Management in Dhaka, Bangladesh
iv
Faecal Waste Flow Diagram for Dhaka – city-wide sample
The data in the table above paints a picture of almost all FS ending up in the drains or environment
one way or another. It is therefore not surprising that a functioning market for FSM services barely
exists.
Analysis of demand and supply for FSM services finds that demand is very low and supply is
weak. That is not surprising in the context of the SFD above, and particularly the household survey
finding that only 13% of households city-wide who had a toilet with a pit or septic tank had ever
experienced it filling up. The drains are effectively running as sewers. Various other facts affecting
demand for FSM services (type of building, accessibility of facility, fill rate and the extent of sharing)
are also considered. On the supply side, there are very few mechanical emptiers in operation. The
bulk of service provision, when demanded, is carried out by manual emptiers. Of those households
who had emptied a pit tank city-wide, 97% had used a manual emptier last time. This is also reflected
in reported intentions next time the pit or tank filled up.
Findings from the transect walks emphasise that all of Dhaka is affected by poor FSM – it is not
only a problem for slum-dwellers. Latrines empty into drains throughout the city, and drains run
through all areas – slums and non-slums. Having large amounts of FS in the drains and environment
is an externality which affects everyone in Dhaka. Therefore, poor FSM is not only a private
household matter – it is a public health and environmental hazard.
The Service Delivery Assessment shows that there is a severe shortage of public policy, capital
investment and operational oversight of FSM services throughout Dhaka. This allows the current
practice of latrines emptying into drains, in place of safe emptying practices, to continue. This in turn
removes many of the efforts and financial costs required to achieve effective construction,
management and maintenance of appropriate infrastructure. The result is significant challenges for
finding solutions, which will only come about when an FSM Framework translates into clearly
defined, capacitated and financed action. The overall aim of the Framework and actions must
therefore be to provide a fully-functioning service chain for all of Dhaka’s fecal waste flows. This
Case study report – Fecal Sludge Management in Dhaka, Bangladesh
v
requires recognition of the scale of the problem, dialogue and engagement of public, private and civil
society bodies to ensure appropriate infrastructure and services can be systematically developed
and adapted to respond to the various contextual challenges of the city (space, tenancy, flooding,
poverty, etc.).
All of this suggests that bringing change to fecal sludge management practices in Dhaka will demand
significant reform of the regulatory systems that currently govern all stages of the service chain. In
the context of the general failure of existing regulatory systems, clearly segregating the roles for
regulation of failure by central government, from that of licensing of compliance by local
governments, from that of service management by providers, may improve the incentives for overall
compliance and investment.
Economic analysis of four hypothetical intervention options is undertaken, three of which are non-
conventional sewer models and one of which was full fecal sludge management. This aims to
illustrate the types of costs which might be incurred for different interventions. In each case, the
sanitation chain was modelled for the whole population of Uttara and Mirpur, where an intervention
financed by the World Bank is to take place. Since the analysis is hypothetical, its value is in drawing
together the costs data relevant to Dhaka in a comparable form using standardized units. There is a
risk that the comparison of costs using data from different sources is inaccurate at best, or invalid at
worst. Due to these limitations it is difficult to develop any implications for FSM in Dhaka; primary
data collection on costs is required before the technology costing can be taken to be reflective of the
costs of implementing different sanitation interventions.
A ‘Prognosis for Change’ assessment surmises that the externalities of poor FSM are both public
and dispersed, whereas addressing the lack of proper containment would involve private costs (from
households and property developers). A credible threat of enforcement, which would raise the cost
of inaction on the part of these stakeholders, is therefore critical. Proper containment will require the
enforcement of ensuring existing emptiable systems (pit/tank) are disconnected from drains, that
existing non-emptiable systems are upgraded, and that newly-constructed buildings have an
appropriate containment system. Change is achievable on this front, but interventions will not be
successful unless they address the incentives which deliver the current outcome, which is the drains
running as sewers.
Recommended intervention options from the study are identified, grouped according to the key
stages of the sanitation service chain. These relate to the following areas, and are discussed in detail
in section 10.
Formalised and operational transport, treatment and end-use stages of the fecal sludge service
chain need to be identified and put in place, enabling fecal sludge to be safely received, treated
and managed as upstream arrangements are improved. Effective business and financial
models will be needed for each stage.
Systematic and progressive steps to improve existing containment infrastructure must include
disconnecting latrine outlets from drains as alternative ‘outlets’ are introduced. Newly-
constructed buildings should not be permitted to discharge fecal materials to drains. For on-site
systems, the aim must be to introduce correctly built containment that enables systematic and
safe emptying services to function.
A range of affordable mechanical, or improved manual, emptying services are needed that can
respond quickly to demand, especially for shared sanitation facilities and for the urban poor.
Licencing, service agreements and contracts can help service providers to invest in improved
business operations, as well as improve regulation to achieve service standards.
Case study report – Fecal Sludge Management in Dhaka, Bangladesh
vi
Table of contents
Preface / Acknowledgements i
Executive summary ii
Introduction ii
Methodology ii
Results iii
Table of contents vi
List of tables and figures ix
1 Introduction and Research Framework 11
1.1 About this report 11
1.2 Study rationale and objectives 11
1.3 Research framework 12
1.4 Report structure 14
2 Methodology 15
2.1 Overall design 15
2.2 Sampling 17
2.2.1 Sampling for the household survey 17 2.2.2 Sampling in the other instruments 19
2.3 Fieldwork implementation 20
2.4 Limitations 21
3 Background to Dhaka city 23
3.1 Dhaka overview 23
3.2 Dhaka’s sanitation context 24
3.3 Dhaka’s FSM context 26
4 Fecal Waste Flow Diagrams 28
4.1 Introduction 28
4.2 Methodology 29
4.3 Results 31
4.3.1 Household survey results as an input to SFD 31 4.3.2 Presentation of SFDs 34
4.4 Implications of the SFDs for FSM in Dhaka 37
5 Public Health Risk Assessment 38
5.1 Introduction and methodology 38
5.2 Results: risks through stages of the FSM service chain 39
5.2.1 Containment: household facilities, levels of sharing and practices 39 5.2.2 Emptying: household practices around emptying services 40 5.2.3 Emptying, transport and disposal: observed practices and risks, in slum areas 41 5.2.4 Transport and discharge: associated with sewerage 45
5.3 Results: risks from wider environmental contamination 45
5.4 Implications: assessing the public health risk from poor FSM 47
6 FSM service potential demand and supply assessment 49
6.1 Introduction 49
6.2 Methodology 50
6.2.1 Demand 50

Case study report – Fecal Sludge Management in Dhaka, Bangladesh
vii
6.2.2 Supply 52
6.3 Findings – household demand for FSM services 53
6.3.1 Determinants of household demand 53 6.3.2 Household satisfaction with current services 58 6.3.3 Barriers faced by households in slum areas, in obtaining FSM services 60
6.4 Findings – supply of FSM services 60
6.4.1 Services effectively supplied 61 6.4.2 Service provider capacity 62
7 Fecal Sludge Reuse Options 65
7.1 Fecal sludge characteristics 65
7.2 Current treatment and reuse, and possible future options 65
7.2.1 Treatment 66
8 City Service Delivery Assessment 68
8.1 Introduction 68
8.2 Methodology 68
8.3 Findings 70
8.3.1 Enabling 70 8.3.2 Developing 71 8.3.3 Sustaining 71 8.3.4 Implications of the CSDA scorecard 72
9 Prognosis for Change 73
9.1 Introduction 73
Methodology 73
Findings 74
Dhaka’s FSM context 74 9.1.1 Mapping institutional responsibilities 75 9.1.2 Illustrating the incentive problem 77 9.1.3 The influence and interests of stakeholders in FSM reform 78
9.2 Implications for FSM in Dhaka 79
10 Intervention options 81
10.1 Identified weaknesses, through the service chain 81
10.2 Proposed solutions, through the service chain 83
10.3 The Service Delivery Context: priorities to address 88
10.3.1 Enabling: policy, planning and budget 88 10.3.2 Developing: equity and outputs 89 10.3.3 Sustaining: O&M, expansion and service outcomes 91
10.4 Resulting hierarchy of interventions 92
Adopting a phased and pragmatic approach 93
10.5 Feasibility of these options in the context of the Prognosis for Change 94
11 Economic analysis of intervention options 95
11.1 Introduction 95
11.2 Methodology 95
11.3 Sources and analysis of data 95
11.4 Summary of the three hypothetical intervention options 96
11.5 Design populations 99
11.6 Technology cost analysis 100
11.7 Damage costs and cost effectiveness analysis 103
Case study report – Fecal Sludge Management in Dhaka, Bangladesh
viii
11.8 Conclusions and implications for FSM in Dhaka 104
12 Conclusion 105
Annex A Map of sampled areas 108
Annex B Faecal Waste Flow matrices 109
Annex C CSDA scoring table criteria 110
Annex D Public health risk assessment: scoring used 114
Annex E Economic analysis tables 118
Case study report – Fecal Sludge Management in Dhaka, Bangladesh
ix
List of tables and figures
Figure 1 Use of sanitation in Dhaka, by type of facility (Census, 2011) ...................................... 25 Figure 2 The sanitation service chain ........................................................................................ 25 Figure 3 Indicative map of sanitation in Dhaka City, overlaid with slum locations and the sewerage network ......................................................................................................................... 26 Figure 4 Faecal Waste Flow Matrix – empty example ................................................................ 31 Figure 5 Faecal Waste Flow Diagram for Dhaka – city-wide sample .......................................... 36 Figure 6 Faecal Waste Flow Diagram for Dhaka – slum sample ................................................ 36 Figure 7 ‘Transport’ and disposal points during observed manual emptying .............................. 43 Figure 8 Emptying and disposal points during observed mechanical emptying .......................... 44 Figure 9 CSDA scorecard for Dhaka .......................................................................................... 70 Figure 10 Process mapping for new building construction .......................................................... 78 Figure 11 City-wide faecal waste flow: results and problems ...................................................... 82 Figure 12 Slum area faecal waste flow: results and problems ..................................................... 82 Figure 13 Total annualized costs of technology options for Mirpur and Uttara .......................... 100 Figure 14 Annualized cost components of FSM (cost per HH in Taka) ..................................... 101 Figure 15 Annualized cost components of SBS (cost per HH in Taka) ...................................... 102 Figure 16 Annualized cost components of SBS ABR (cost per HH in Taka and USD) .............. 102 Figure 17 Annualized costs for septic tanks connected to settled sewers (Costs per HH in Taka and USD) 103 Figure 18 Map showing sampled wards and location of sampled PSUs.................................... 108 Figure 19 Faecal Waste Flow matrix – city-wide sample ........................................................... 109 Figure 20 Faecal Waste Flow matrix – slum sample ................................................................. 109
Table 1 FSM project components ............................................................................................. 13 Table 2 Summary table of data collection instruments .............................................................. 15 Table 3 Differing definitions of Dhaka ....................................................................................... 23 Table 4 Sanitation facility used, by technology type .................................................................. 31 Table 5 Sanitation facility used, by JMP category ..................................................................... 32 Table 6 Management of blackwater – where toilets discharge to .............................................. 33 Table 7 Proportion of pits/tanks which have ever filled-up ........................................................ 34 Table 8 Past action after pit or tank filled-up ............................................................................. 34 Table 9 Prevalence of diarrhoea among respondents in the last 2 weeks................................. 39 Table 10 Reason for emptying .................................................................................................... 40 Table 11 Observation of FS in drains ......................................................................................... 45 Table 12 Physical determinants of demand for FSM services..................................................... 50 Table 13 Economic determinants of demand for FSM services .................................................. 51 Table 14 Scoring for housing density, paths and roads from transect walks ............................... 53 Table 15 Type of building occupied ............................................................................................ 54 Table 16 Accessibility of toilet for emptying equipment ............................................................... 54 Table 17 Average time taken for pit or tank to fill-up ................................................................... 55 Table 18 Number of people using the same sanitation facility .................................................... 56 Table 19 Satisfaction with sanitation facility ................................................................................ 58 Table 20 Satisfaction with emptying service provider ................................................................. 59 Table 21 Intended action after pit/tank fills-up ............................................................................ 60 Table 22 Emptying method cross-tabulated with service provider type – slums .......................... 61 Table 23 Discharge point of pit/tank contents during emptying ................................................... 62 Table 24 Average amount paid for emptying services ................................................................ 62 Table 25 Fecal sludge characteristics from five districts of Dhaka. ............................................. 66 Table 26 The CSDA framework for FSM .................................................................................... 68 Table 27 Example CSDA question, criteria and scoring .............................................................. 69 Table 28 Mapping stakeholders and their responsibilities for FSM ............................................. 76 Table 29 Technical interventions to improve service delivery, based on existing system type .... 84 Table 30 Design populations for the technology costing ............................................................. 99 Table 31 Current sanitation situation of slum communities in Dhaka .......................................... 99
Case study report – Fecal Sludge Management in Dhaka, Bangladesh
x
Table 32 Key to abbreviations used.......................................................................................... 100 Table 33 Health impacts of poor sanitation in Uttara and Mirpur (Taka) ................................... 104 Table 34 Cost Effectiveness analysis Taka (USD) .................................................................... 104 Table 35 Risk scores along the service chain ........................................................................... 114 Table 36 Risk of immediate human exposure with FS, at each step of the process .................. 115 Table 37 Transect Walk results of scored observations ............................................................ 116
Box 1 Solid Waste Management ............................................................................................ 46

Case study report – Fecal Sludge Management in Dhaka, Bangladesh
11
1 Introduction and Research Framework
1.1 About this report
This report summarises the main findings of a case study on faecal sludge management in
Dhaka, Bangladesh. It is part of the project entitled ‘Fecal Sludge Management: Diagnostics
for Service Delivery in Poor Urban Areas’, hereafter “the FSM research project”. This work is
funded by the World Bank Water and Sanitation Programme (WSP). There are five city case
studies as part of this project (Balikpapan, Dhaka, Freetown, Lima and Santa Cruz).
This project is led by Oxford Policy Management (OPM) in partnership with the Water,
Engineering and Development Centre (WEDC) at Loughborough University. The overall
objective of this assignment is : “to work with the WSP urban sanitation team to develop the
methodology, design, develop survey instruments and undertake analysis of data collected
from five field case studies (linked to World Bank operations projects), refine the diagnostic
tools and develop decision-making tools and guidelines for the development of improved FSM
services.” Specific objectives of the Dhaka case study are listed in the next section. The scope
includes the need for city-wide septage services with a focus on poor urban communities.
This document is part of a project deliverable designed to be internal at this stage. Therefore,
it does not contain much background information and the assumed audience is the WSP
project team and others familiar with the Dhaka FSM context.
The report’s structure is detailed below. It begins with background to the research and the city,
moving into several sections analysing the urban sanitation context which are not specific to
FSM. Thereafter, the report’s focus is FSM services in particular.
1.2 Study rationale and objectives
It is very common for poor people living in urban areas of most low-income countries either
use on-site sanitation facilities, or defecate in the open. Even when improved on-site options
are used to contain feces, in many cities there exist few services for collection, transport and
disposal or treatment of the resulting fecal sludge. Few opportunities for resource recovery
through end-use of fecal sludge exist. The service delivery gaps within and between stages of
the sanitation service chain become more apparent as sanitation coverage increases in poor
urban areas. Failure to ensure strong links throughout the fecal sludge management (FSM)
service chain results in untreated fecal sludge (FS) contaminating the environment, with
serious implications for human health.
Despite this, there are few tools and guidelines to help city planners navigate complex FSM
situations, despite increasing demand for this. This study aims to build on existing frameworks
and tools, in particular the Service Delivery Assessment scorecard, Fecal Waste Flow
Diagram, and the Economics of Sanitation Initiative toolkit. The aim is to produce diagnostic
and decision-making tools that are based in tried-and-tested strategic planning approaches
and frameworks, with a focus on practicality. Critically, updates to the tools and guidelines
have been updated based on primary data collection in five cities. In most of the cities, this is
supported by interaction with city stakeholders involved in ongoing World Bank lending.
Acknowledging the difficulty of reforming FSM services in cities, political economy questions
around FSM are explicitly included as part of the overall analysis.
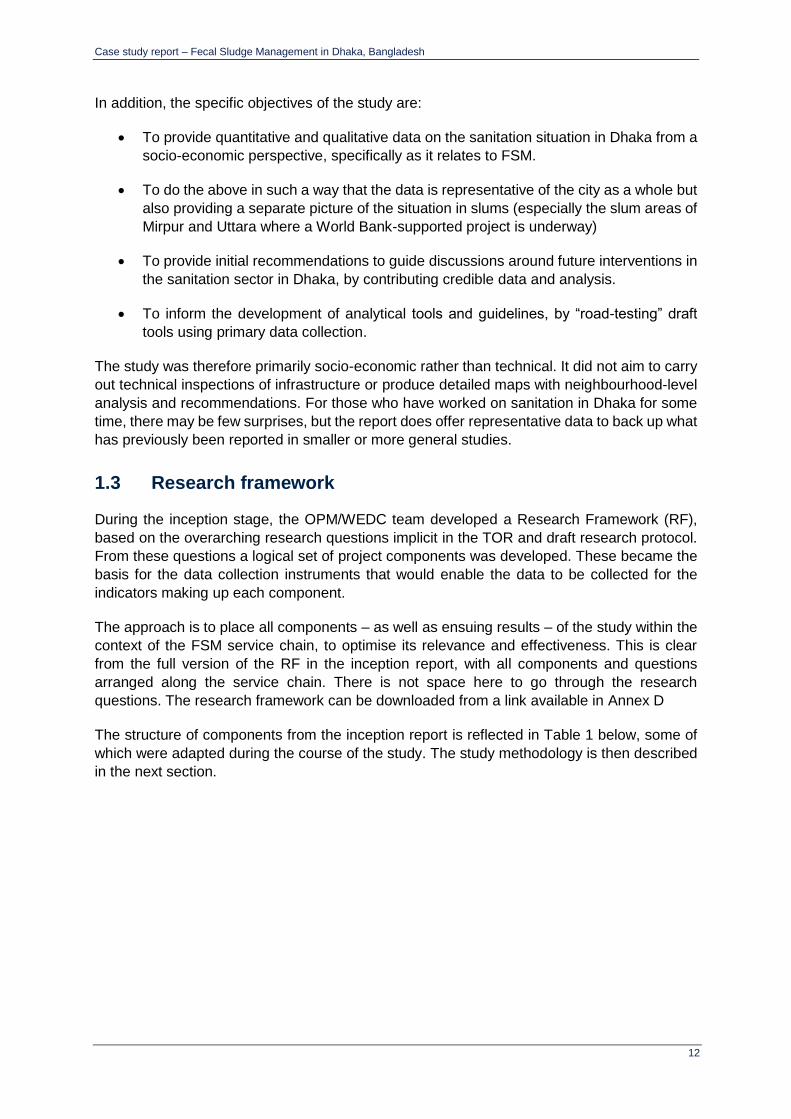
Case study report – Fecal Sludge Management in Dhaka, Bangladesh
12
In addition, the specific objectives of the study are:
To provide quantitative and qualitative data on the sanitation situation in Dhaka from a
socio-economic perspective, specifically as it relates to FSM.
To do the above in such a way that the data is representative of the city as a whole but
also providing a separate picture of the situation in slums (especially the slum areas of
Mirpur and Uttara where a World Bank-supported project is underway)
To provide initial recommendations to guide discussions around future interventions in
the sanitation sector in Dhaka, by contributing credible data and analysis.
To inform the development of analytical tools and guidelines, by “road-testing” draft
tools using primary data collection.
The study was therefore primarily socio-economic rather than technical. It did not aim to carry
out technical inspections of infrastructure or produce detailed maps with neighbourhood-level
analysis and recommendations. For those who have worked on sanitation in Dhaka for some
time, there may be few surprises, but the report does offer representative data to back up what
has previously been reported in smaller or more general studies.
1.3 Research framework
During the inception stage, the OPM/WEDC team developed a Research Framework (RF),
based on the overarching research questions implicit in the TOR and draft research protocol.
From these questions a logical set of project components was developed. These became the
basis for the data collection instruments that would enable the data to be collected for the
indicators making up each component.
The approach is to place all components – as well as ensuing results – of the study within the
context of the FSM service chain, to optimise its relevance and effectiveness. This is clear
from the full version of the RF in the inception report, with all components and questions
arranged along the service chain. There is not space here to go through the research
questions. The research framework can be downloaded from a link available in Annex D
The structure of components from the inception report is reflected in Table 1 below, some of
which were adapted during the course of the study. The study methodology is then described
in the next section.
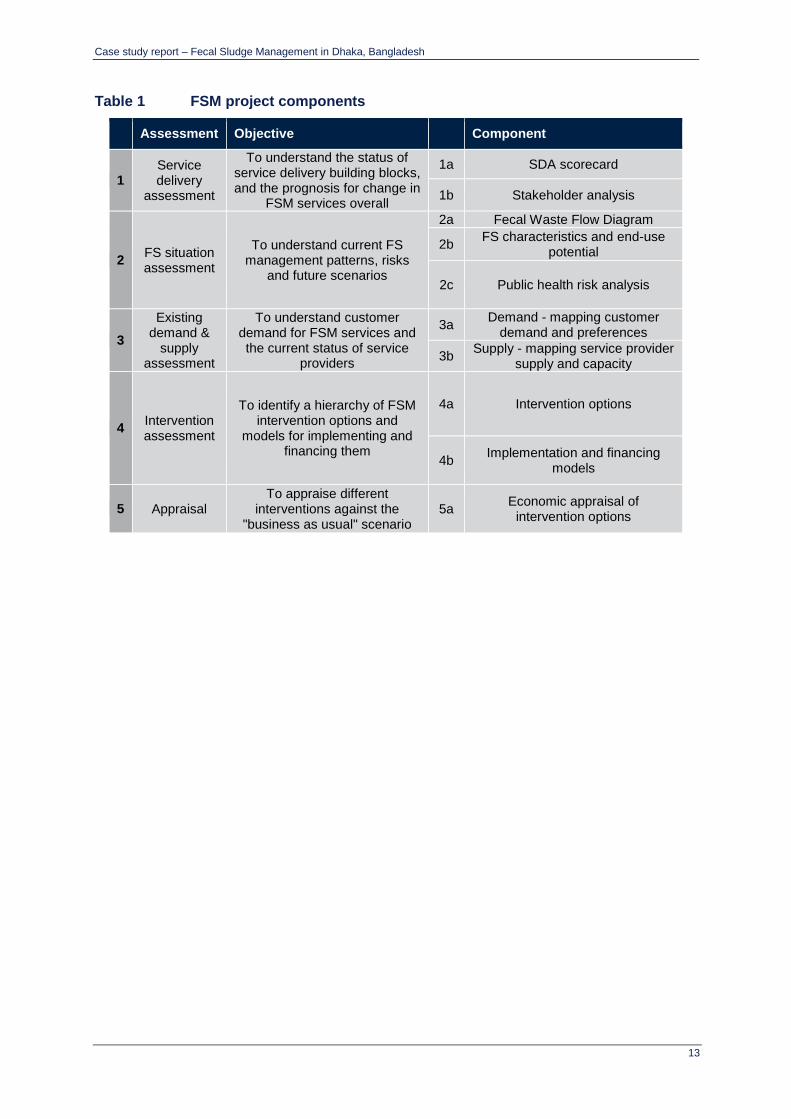
Case study report – Fecal Sludge Management in Dhaka, Bangladesh
13
Table 1 FSM project components
Assessment Objective Component
1 Service delivery
assessment
To understand the status of service delivery building blocks, and the prognosis for change in
FSM services overall
1a SDA scorecard
1b Stakeholder analysis
2 FS situation assessment
To understand current FS management patterns, risks
and future scenarios
2a Fecal Waste Flow Diagram
2b FS characteristics and end-use
potential
2c Public health risk analysis
3
Existing demand &
supply assessment
To understand customer demand for FSM services and the current status of service
providers
3a Demand - mapping customer
demand and preferences
3b Supply - mapping service provider
supply and capacity
4 Intervention assessment
To identify a hierarchy of FSM intervention options and
models for implementing and financing them
4a Intervention options
4b Implementation and financing
models
5 Appraisal To appraise different
interventions against the "business as usual" scenario
5a Economic appraisal of
intervention options
Case study report – Fecal Sludge Management in Dhaka, Bangladesh
14
1.4 Report structure
This report is structured sub-divided into three groups of chapters. The initial chapters describe
the city background and methodology. There are three chapters which cover the urban
sanitation context without a specific focus on FSM. The rest of the report considers FSM
services and service delivery.
Background
o Section 2 summarises the study methodology
o Section 3 provides background to the city
Urban sanitation context
o Section 4 shows a Fecal Waste Flow Diagram
o Section 5 contains a Public Health Risk Assessment
Analysis of FSM services
o Section 6 contains the potential FSM service demand and supply assessment
o Section 7 discusses reuse options
o Section 8 contains a Service Delivery Assessment
o Section 9 provides a Prognosis for Change based on the current situation
o Section 10 discusses intervention options
o Section 11 provides economic analysis of the intervention options
o Section 12 concludes
Annexes
o Annex A contains a map of sampled areas
o Annex B contains the detailed Faecal Waste Flow matrices
o Annex C provides the full SDA scoring table
o Annex D provides more information on the public health risk assessment
o Annex E contains further tables on the economic analysis.

Case study report – Fecal Sludge Management in Dhaka, Bangladesh
15
2 Methodology
2.1 Overall design
A key component of this study was primary data collection, since it aimed to build on an earlier
12-city FSM study based only on secondary data collection (Peal et al. 2013). The study had
six different data collection instruments, four quantitative and two qualitative, each of which
contribute to various project components shown in Table 1 above. These instruments are
summarised in Table 2 below.
Table 2 Summary table of data collection instruments
Instrument Data source n per city
Qu
an
tita
tiv
e
1. Household survey
Survey of households (i) across the city, (ii) in slums / informal settlements
720 (= 360 + 360)
2. Observation of service provider practices
Observation of containment, collection, transport/disposal and treatment/disposal
5
3. Testing fecal sludge characteristics
Samples from (i) pits/tanks during emptying, (ii) truck/vessel outflow, (iii) final drying bed or outflow
5
4. Transect walk Observation of environmental and public health risks through transect walk Drinking water supply samples, tested for fecal contamination and chlorine residual Drain water samples, tested for fecal contamination
40 (= 30 + 10) 60 (= 30 + 30) 60 (= 30 + 30)
Qu
alita
tiv
e
5. Key informant interviews
(a) government (e.g. council / utility, ministries) (b) service providers along the sanitation chain (c) other key FSM agencies
As required
6. Focus group discussions
FGDs with slum, low-income and informal communities
10
The overall design decided by WSP was that team OPM/WEDC should lead on methodology
and analysis, while actual data collection would be managed by two types of consultants
contracted separately. A local firm, Adhuna Ltd, was contracted by WSP to conduct primary
data collection under all of the above instruments, except for the Key Informant Interviews. In
addition, short-term consultants (Mark Ellery and Elisabeth Kvarnstrom) were contracted to
conduct the Key Informant Interviews and produce the draft SDA and PEA.
Detailed research protocols for the instruments in the table above are available in a separate
instruments report here. This section briefly summarises each instrument, and the ensuing
section describes the sampling approach.
Case study report – Fecal Sludge Management in Dhaka, Bangladesh
16
Household survey
The household survey aimed to collect data from and about households using on-site
sanitation (particularly those living in slums, informal or low-income settlements) regarding
their use of FSM services and preferences for future FSM services. The household survey
informs multiple components of this research. The sampling was carefully planned so as to
allow conclusions to be drawn about the city as a whole on a representative basis, and about
slum areas in particular, on a purposive basis. Questionnaire sections included household
members and characteristics, use of water and sanitation infrastructure, usability and
observation of latrines, satisfaction and planning on sanitation, filling up and emptying, and
last time emptying.
Observation of service provider practices
The observation protocol involved making visual inspections about fecal sludge (FS) from pits
or tanks to final disposal, in particular watching service providers (SPs) go about their
business. It required the identification of hazards, hazardous events, and an assessment of
possible risks at each stage (containment, emptying, transport, treatment and end-use or
disposal) of the fecal sludge management chain.
Testing fecal sludge characteristics
The characteristics of faecal sludge will vary, depending on many factors including but not
limited to the length of time for which it has been stored, the season, and the storage conditions
(e.g. whether the sludge was in a lined or unlined pit). Assessment of the characteristics was
required at three stages: (i) during removal, as this will influence the removal methods that
could be used, (ii) after removal, as this will influence how the faecal sludge can be transported
and treated, and possible resource recovery options, and (iii) after treatment, as this will
determine the resource value of the end product derived from the faecal sludge.
Transect walk
The Transect Walk enabled participants to make a subjective and qualitative assessment of
physical and environmental conditions within a community. During the walk, participants make
systematic observations, discuss their observations and record their findings using a standard
reporting format. The information collected complements information collected from household
questionnaires, observations, and sample collection and analysis. For this study, a transect
walk provides information about the broad environmental risks to public health, in particular
with respect to the presence of fecal material and solid waste, and the likelihood that these
enter drainage channels and water sources. When all observations are complete, participants
ask community members a few short questions to gain information about typical behaviours in
the community that could be a source of risk (latrines discharging to drains, overflowing
latrines, illegal dumping of fecal sludge, etc.) and the frequency of those behaviours throughout
the year (daily, weekly, seasonal, etc.). These walks were designed to give an overall picture
of conditions in a neighbourhood, with the aim of this being built into a city-wide picture. They
did not aim to allow detailed maps to be drawn with FS flows to be physically tracked, nor did
they aim to make operational recommendations at the neighbourhood level. Further discussion
of this issue is in Section 5.
Testing water supply and drain water quality
Case study report – Fecal Sludge Management in Dhaka, Bangladesh
17
During transect walks, samples of drinking water supplies and water flowing in drains (drain
water) were taken from a selection of PSUs in the city and tested for levels of E. coli. The
results can help to identify the extent to which there is an association between poor FSM
services and resulting levels of fecal contamination in the local environment (i.e. in water
supplies and surface water drains). This information, together with results from transect walk
observations, reported behaviours and practices associated with sanitation in the community
and other data sources, helps build-up a picture of the public health risks associated with poor
FSM services, associated with contamination levels (hazard), exposure and vulnerability.
Key informant interviews
Key informant interviews (KIIs) are the way in which primary information was sought to address
key questions about how both the ‘enabling environment’ and the operating environment
affects FSM services (past, current and future). KIIs were held with stakeholders having
responsibility or interest in FSM services at city-level and beyond, allowing the enabling and
operating environments to be better understood in relation to their influence within the city.
Focus group discussions
The objective of Focus Group Discussions (FGDs) with residents of informal settlements was
to gather qualitative data that would complement, validate, or perhaps challenge responses
made during the household survey. Questions focused on obtaining information relating to
household sanitation and FSM practices (particularly identifying the practices of “others” as
individuals are reluctant to talk honestly about their own, or their family’s, practices), service
levels, past interventions, risks and other issues associated with FSM services that affect their
community.
2.2 Sampling
2.2.1 Sampling for the household survey
The key sampling method was for the household survey, with the sampling approaches used
for other instruments using the selected clusters as a basis for their own sampling. Therefore,
the household survey is discussed first, and the remaining instruments are covered afterwards.
Overall it is crucial to understand that in the sampling, two pictures were being sought: the first
to give a representative understanding of the city-wide situation, and the second to give a
specific understanding of the situation in slums on a purposive level.
The study population were people living in Dhaka, Bangladesh. Hence, the sampling frame for
the household survey contains all urban areas within the boundaries of the Dhaka City
Corporations (different definitions of Dhaka’s boundaries are discussed in section 3.1). Some
non-residential areas were excluded from the sampling frame, which is discussed below.
There were two sub-sample areas (denoted A and B). Sub-sample A was representative of
the city as a whole, while sub-sample B focused on poor urban areas (identified as ‘slums’ in
Dhaka) without any attempt to be statistically representative. The aim of sub-sample A was to
get city-representative estimates at minimum cost and minimum administrative burden.
Therefore, it has a relatively small sample size, for example compared to what would be

Case study report – Fecal Sludge Management in Dhaka, Bangladesh
18
necessary for studies with different objectives (e.g. an evaluation aiming to attribute impact to
an intervention).
Sub-samples and sampling units
For sub-sample A, the Primary Sampling Units (PSUs) were mohallas, which are an
administrative unit akin to “urban neighbourhoods”. Mohallas are the lowest administrative unit
in formal city arrangement, and sit below the ward level.1 Lists of wards and mohallas were
collected from both Dhaka North City Corporation (DNCC) and Dhaka South City Corporation
(DSCC).
For sub-sample B, the PSUs were slum neighbourhoods, purposively selected from larger
slum areas which were defined geographically using secondary data. The focus of the
purposive sample was Mirpur and Uttara, two large slum areas in the north-west of the city
which each received one third of the sub-sample B PSUs. This is because a World Bank-
supported project is currently underway in those localities, as well as them being some of the
largest slum areas in Dhaka (see Figure 3 in section 3.2 below).
The Secondary Sampling Units (SSUs) were households, in both cases. A list of slums in
Mirpur was collected from the UPPR (Urban Partnerships for Poverty Reduction) project data
for 2014. A list of slums in Uttara was collected from the Centre for Urban Studies (2005) study
team, and was updated by Adhuna based on visits to these areas. Finally, a map of all Dhaka’s
slums, based on remote sensing of Google Earth images in 2014, was collected from the World
Bank. All three sources were used to build the list of potential sub-sample B PSUs to be
purposively selected.
A map showing the location of sampled PSUs within wards is shown in Annex A.
Sample sizes
To estimate the sample size for sub-sample A, the statistical software EpiInfo was used. The
sample size needed to generate city-representative estimates with a confidence level of 90%
was predicted to be 360 households, given other variables in the power calculation.2 Surveys
placing a premium on representativeness would aim for 95% confidence, but it was decided
that 90% was enough to give us a good idea of FSM services used in the city. It was decided
to use the same sample size for sub-sample B, for ease of comparison and understanding.
The power calculation would be identical for sub-sample B, but since the sampling is purposive
rather than random, there is no specific level of confidence. The total number of households
surveyed across both sub-samples was therefore 720.
1 In a household survey, households are the sampling unit we are interested in, but it is difficult and expensive to sample 1000 households from across a city completely randomly, as you would potentially have to go to 1000 different localities. Therefore, most surveys take an intermediary approach using clusters of households. This approach has two sampling units. The community/neighbourhood is the primary sampling unit (PSU) and the household is the secondary sampling unit (SSU). The reason we say PSU instead of community/neighbourhood is the former can be clearly defined geographically, whereas the latter means different things to different people. The size of a PSU will differ across cluster surveys. The gold standard is to use census enumeration areas (usually between 200-400 households), but this is not always possible. 2 This is based on an expected frequency of 80%, a design effect of 2, a PSU/cluster size of 12, a total number of 30 PSUs, and a margin of error of 5%. For the city-wide sample, our indicator of interest is the proportion of households using on-site sanitation (OSS), which for Dhaka was estimated to be around 80%.
Case study report – Fecal Sludge Management in Dhaka, Bangladesh
19
Sampling methodology
Sub-sample A – city-wide
A cluster random sampling method was used to sample the mohallas/PSUs to be surveyed.
First, any mohallas which were outside the sampling frame were excluded, due to the study’s
focus on residential areas. These were any which were predominantly characterised by
university areas, business districts, government administrative areas, military cantonments
and diplomatic areas. The rationale for this was that, which the sanitation arrangements of
such institutions are an important part of the whole picture, a socio-economic household survey
can only interview residential households. Of the remaining mohallas, 15 mohallas from DNCC
and 15 from DSCC were randomly sampled using a programme in Stata (a statistical software
package), so as to account for the relative population size of wards and mohallas across the
two This gave 30 mohallas out of 690 in the list. This can legitimately be called a city-wide
sample of mohallas, with the caveats that non-residential areas are excluded and Dhaka is
defined as the city corporation jurisdiction.
Households (SSUs) were sampled using systematic random sampling. Adhuna produced
Google Earth images with the border of each sampled mohalla indicated. Next, they drew the
largest possible rectangle that fits within the border of the mohalla, and divided it into twelve
equally-sized blocks. Upon arrival in the block, the supervisor sent the enumerator to the centre
of each block, and took them to a randomly selected household closest to the centre of that
block, by spinning a pen and visiting the nearest household to which it was pointing, taking
care to not be influenced by households which were easier to access. Where the nearest
household was a building of more than one floor containing more than one household, a floor
of the building was randomly selected.
Sub-sample B – slums
A purposive sampling method was used. First, collected lists of slums in Mirpur, Uttara and
elsewhere from different sources (see above). Next, for Mirpur and Uttara, any slums were
excluded which contained fewer than 200 households from the slum lists, then randomly
sampled 10 slums from each of Uttara and Mirpur. For the rest of the city’s slums, 10 slums
were purposively sampled from other parts of the city, based on the World Bank map and
aiming to balance a variety of geographical areas with a variety of slum sizes. Adhuna visited
those 10 slums in advance to verify that they were slums as per the national definition.
For sampling households/SSUs, the same process was followed as in sub-sample A.
2.2.2 Sampling in the other instruments
Observation of service provider practices and testing FS characteristics
Fully recorded observations were made at 5 different locations, through all stages (where
possible) of the sanitation service chain. The chosen observations reflected existing fecal
sludge management practices as much as possible, considering both manual and mechanical,
formal and informal emptying methods. Arrangements for observation were driven by the
schedules of the service providers with whom Adhuna collaborated.

Case study report – Fecal Sludge Management in Dhaka, Bangladesh
20
Tests for FS characteristics were carried out on FS collected during the observations, so the
sampling method is identical.
Transect Walks
Transect walks were conducted in 40 PSUs in total: all 30 PSUs of sub-sample A and 10
randomly selected PSUs from the full list of sub-sample B PSUs. Annex D includes an
explanation of the format and scoring used during the Transect Walks.
Testing water supply and drain water quality
Samples of drinking water supplies and drain water (water freely flowing in drains) were taken
in 20 PSUs; 10 PSUs from sub-sample A and sub-sample B were randomly selected for
transect walks. Water samples were taken from the three most common drinking water
supplies identified in the PSU (through asking community members) namely piped water into
the community, from groundwater sources within the community, or from surface water
sources. Samples were taken at the source of the supply and tested for levels of E. coli, to
identify contamination in the supply itself and avoid measuring contamination resulting from
poor water storage or handling practices. Drain water samples were taken from locations to
represent the three most common types and characteristics of drains in the community
(identified during the transect walks) and also tested for levels of E. coli, to identify
contamination from poor sanitation and fecal sludge handling within the PSU. A standard
procedure for collecting samples was followed, with samples sent to registered laboratories for
testing.
Key informant interviews (KIIs)
The total number of interviews required, as well as the range and extent of questioning, was
influenced by the availability of current and reliable data from other sources, as well as
constraints on time and resources. Selection of interviewees was purposive, based on advice
received from stakeholders and existing knowledge of the World Bank consultant.
Focus group discussions (FGDs)
10 FGDs were held with households from 10 sub-sample B PSUs, which were randomly
selected from the total of 30 sub-sample B PSUs in slum areas.
2.3 Fieldwork implementation
Pretesting, training and piloting
Initial pre-testing was carried out by Adhuna to refine the instruments before a week of
enumerator training. During the training, all data collection instruments were piloted in urban
communities in both higher-income and lower-income areas, as part of field practice for the
enumerators. The team then joined a debriefing session before starting data collection.
Field team composition
For the quantitative survey, four field teams were deployed for data collection. Each team was
composed by one Supervisor and two Household Enumerators. In addition to that there was
Case study report – Fecal Sludge Management in Dhaka, Bangladesh
21
one qualitative team composed of one supervisor and two qualitative researchers. An
experienced Field Manager was responsible for ensuring overall management, field
implementation and quality assurance.
Data collection
The field teams collected the majority of the data from the 60 sampled PSUs in 4 weeks during
September-October 2014. On average, each team spent one day in a PSU. Each household
interviewer conducted the survey in 6 households per day, and thus each team with 2
interviewers completed 12 households in a cluster in one day. For the transect walks (TWs),
five teams of two participants conducted all 40 TWs over 7 days (5 consecutive days in late
September / early October for 37 TWs and a further 2 days in late October to complete the
remaining 3 TWs). Teams conducted between 2 and 10 TWs each. Observations of service
providers were conducted over a 1 week period in mid-November, with 2 observations carried
out on the first day and the remaining 3 on the subsequent days. The delay to data collection
was waiting for the pit emptiers that Adhuna was in contact with to be called to carry out
emptying services.
Data entry, cleaning and analysis
The quantitative survey data were entered into SPSS at Adhuna’s offices in Dhaka, using
various data quality checks, including range checks, skips and internal consistency checks.
After data cleaning checks, data were then transferred into the statistical software Stata. Data
were analysed using Stata in OPM’s offices in Oxford.
2.4 Limitations
This study has various limitations which are important to explain, so that readers understand
the strengths and weaknesses of the data and what conclusions can and cannot be drawn
from the analysis. These should be considered in the context of the objectives of the study
(see section 1.2 above). These are:
Socio-economic survey – household surveys with enumerators skilled in social
research can only really ask question of householders. Such individuals cannot make
technical inspections of infrastructure which would require a different skillset.
Therefore, it is necessary to take the household’s responses at face value (e.g. about
the destination of their blackwater). Furthermore, it was not possible to physically
establish the pathways of FS once it has left then household (e.g. which kind of drain,
or its ultimate destination).
Sampling method – sample surveys are designed to estimate indicators for a broader
population. Therefore, they cannot produce detailed data for specific neighbourhoods
without dramatically increasing the sample size and appropriate stratification. The
sample size is relatively small, compared to what would be necessary for an impact
evaluation, for example. In a similar vein, transect walks aimed to build up a broad
picture rather than specific maps or explanations for individual neighbourhoods. In
addition, the study only focuses on residential areas and households, not institutions.

Case study report – Fecal Sludge Management in Dhaka, Bangladesh
22
Definition of Dhaka – as explained in section 3.1, the definition of Dhaka used is the
area under the jurisdiction of the two Dhaka City Corporations (covering about 7
million people), rather than any other definition in use.
Seasonality – The data collection took place at the end of, or just after, the monsoon
season in Bangladesh, which runs from May to September. The timing of a survey
will always influence its results, which is true for several of the instruments used in
this study. In this case the most likely influence is that drains were running fuller than
normal, which could have diluted the fecal load and made the E. coli counts lower
than would be expected, particularly at the height of the dry season. Other influences
may also have been taking place, such as changes in water usage patterns and
latrine emptying rates.

Case study report – Fecal Sludge Management in Dhaka, Bangladesh
23
3 Background to Dhaka city
3.1 Dhaka overview
Bangladesh is one of the most densely populated countries in the world with approximately
160 million people living in a land area of around 150,000 km2. The country is moving
convincingly towards achieving most of the Millennium Development Goal targets and in
particular has made remarkable progress in the reduction of open defecation to just 3%
nationwide (WHO/UNICEF, 2014). While the majority of the population still lives in rural areas,
the urban population has been growing rapidly from just 5% of the total population in 1971 to
27% in 2008.
Dhaka is reportedly the fastest growing city in the world, with a growth rate of around 3% per
annum. This adds an estimated half a million people per year to the 14 million people already
residing in Dhaka mega-city. An associated trend is the vertical expansion of the city, which
has seen houses making way for multi-storey apartment blocks, which then in turn have made
way for high-rise buildings. Expansion of the sewerage network has not kept up with population
growth.3 . Anecdotally, from key informant interviews with sweepers, there has also been a
decrease in demand for the emptying of septic tanks. Given the near absence of a mechanical
emptying market in Dhaka, this suggests an overall increase (both in relative and absolute
terms) in households connecting pits and septic tanks to drains of various kinds. Regardless
of the trend in recent years, it is clear that a large fecal load is ending up in the storm water
drainage system. Further details are provided in section 6.
Defining the boundaries of Dhaka is not straightforward – different definitions and jurisdictions
are shown in Table 3. For this study, “Dhaka” was defined as being the areas under the
jurisdiction of the Dhaka City Corporations, commonly referred to as “Dhaka City”. This is due
to this being the most commonly-understood term and it being administrated by a clear
authority. Ultimately, one definition had to be selected and the one most appropriate for both
city planning was selected, so it is justified to call this a city-wide sample. It should also be
noted that the boundaries of Dhaka City do not fully align with DWASA’s service area.
Table 3 Differing definitions of Dhaka
Area (km2)
Households Population Notes
Dhaka mega-city (Dhaka Action Plan area)
767 3,337,130 14,171,567
commonly called Dhaka Action Plan (DAP) area:(including adjoining urban areas, some of which are
outside Dhaka district)
Greater Dhaka 316 2,034,146 8,906,039 DCCs + 17 rural unions, not often
referred to
Dhaka City 126 1,576,746 6,970,105 98 Wards of DCCs + 1
Cantonment & Birman Bandar, commonly called Dhaka City
BBS Population & Housing Census, 2011
3 DWASA’s 2013 Sewerage Master Plan for Dhaka City (see section 3.2) refers to

Case study report – Fecal Sludge Management in Dhaka, Bangladesh
24
While average incomes in Dhaka are relatively high as compared to the rest of Bangladesh,
the absolute number of poor people in Dhaka is also very high. Over one-third of all Dhaka
residents live in slum areas with densities 7-8 times greater than the city average.
The topography is extremely flat and close to sea level. Much of the city sits on a layer of
Madhupur clay that extends to a depth of about 10m. Other areas sit on a variety of soil types,
including loose and soft silty clay, clayey silt or organic clay. It is widely recognised that, as
these soil types have low infiltration capacity they are not suited to the infiltration requirements
of on-site sanitation systems needing to ‘drain away’ effluent, such as correctly installed septic
tanks.. Dhaka experiences a hot, wet and humid tropical climate. The monsoon between the
months of May and October is responsible for over 85% of the annual average rainfall of over
2,000mm. This combined with the urban density and destruction of water bodies leaves Dhaka
highly susceptible to seasonal flooding.
Until November 2011, the task of running the affairs of the city of Dhaka was undertaken by
the Dhaka City Corporation (DCC), comprising 92 wards. At that time, it was split into two parts
– Dhaka North City Corporation (DNCC) with 36 wards, and Dhaka South City Corporation
(DSCC), with 56 wards. Each is headed by a government-appointed administrator. The DCCs
are designated as autonomous bodies responsible for municipal services (i.e. public health,
water supply and drainage, roads, etc.) and given fund-raising power including levying of rates,
fees and rents. However, the Government reserves the right to intervene in their affairs, e.g.
by appointing the Chief Executive Officer, or transferring functions.
According to the population census 2011, 78% of the population of Dhaka city live in rented
housing. In 2005 it was estimated that there were over 3 million slum dwellers residing in 5,000
slums, comprising 35% of the population of Dhaka city at that time (Centre for Urban Studies,
2005).4 Slums and squatter settlements are increasingly concentrated on the fringes of the
city, due to an acute demand for land and high land prices, especially in the central zones and
upper class residential areas.
3.2 Dhaka’s sanitation context
According to the 2011 census, access to “sanitary” latrines within the Dhaka City Corporation
area is 94%. The Bangladesh Bureau of Statistics (BBS) definition of a sanitary latrine
comprises of two arrangements: either a sanitary latrine with a water seal, where feces are
covered by the water that remains in the water seal (or pan) after use; or a sanitary latrine
without water seal, or where the water seal is broken, such that water does not remain in the
pan after use. Data are shown in Figure 1 below. The census identified extremely low rates of
open defecation within the city (0.3%, not shown in the chart), and relatively low use of non-
sanitary latrines (5%).5
4 Updated data from a slum census conducted by BBS in 2014 should be available by mid-2015. 5 Ideally we would also show the census data re-categorised by JMP definitions, but this is not possible without access to the raw census data. Shared sanitation is particularly important in Dhaka, as is shown in our data in section 4 below. The definitions of sanitary and non-sanitary latrines are from the National Sanitation Strategy 2005, with the key difference being whether the passage between then squat hole and pit is sealed (either by a lid or a water seal).

Case study report – Fecal Sludge Management in Dhaka, Bangladesh
25
Figure 1 Use of sanitation in Dhaka, by type of facility (Census, 2011)
Definitions used by the Bangladesh Bureau of Statistics (as well as the Millennium
Development Goal for sanitation) relate to the type of user-interface (i.e. the latrine itself),
without reference to how or where the latrine discharges fecal waste beyond this containment
stage, through to further stages of the sanitation service chain. However, for the purposes of
this study, the focus is primarily the management of fecal sludge from latrines (i.e. the
containment stage) and to an extent all forms of fecal waste flows, including sewerage, through
to end-use/disposal (see Figure 2 below).
Figure 2 The sanitation service chain
The study is not focusing on the structural conditions or the latrine itself, so much as the extent
to which it contains / does not contain fecal sludge and what happens to the fecal sludge from
this stage onwards. For this reason, the household survey and later sections of this report refer
to different categories for household sanitation facilities and assesses fecal sludge
management in relation to the service chain above.
In addition, the spatial dimension of access to sanitary latrines and sewerage networks is also
important. This is shown in Figure 3 below, which overlays spatial data on use of sanitary
latrines (red/pink shading) with sewer network (blue lines) and slums (yellow shaded). As can
be seen, the sewerage network only covers a small proportion of Dhaka geographically, and
is by no means used by all residents in the areas nominally “covered”. Slums are dotted around
the city, but there is a significant concentration in Uttara and Mirpur in the north-west of Dhaka.
Sanitary (water seal), 58%
Sanitary (no water-seal), 37%
Non-sanitary,
5%
0% 20% 40% 60% 80% 100%
Treatment End-use/ Disposal
Conveyance Emptying Containment
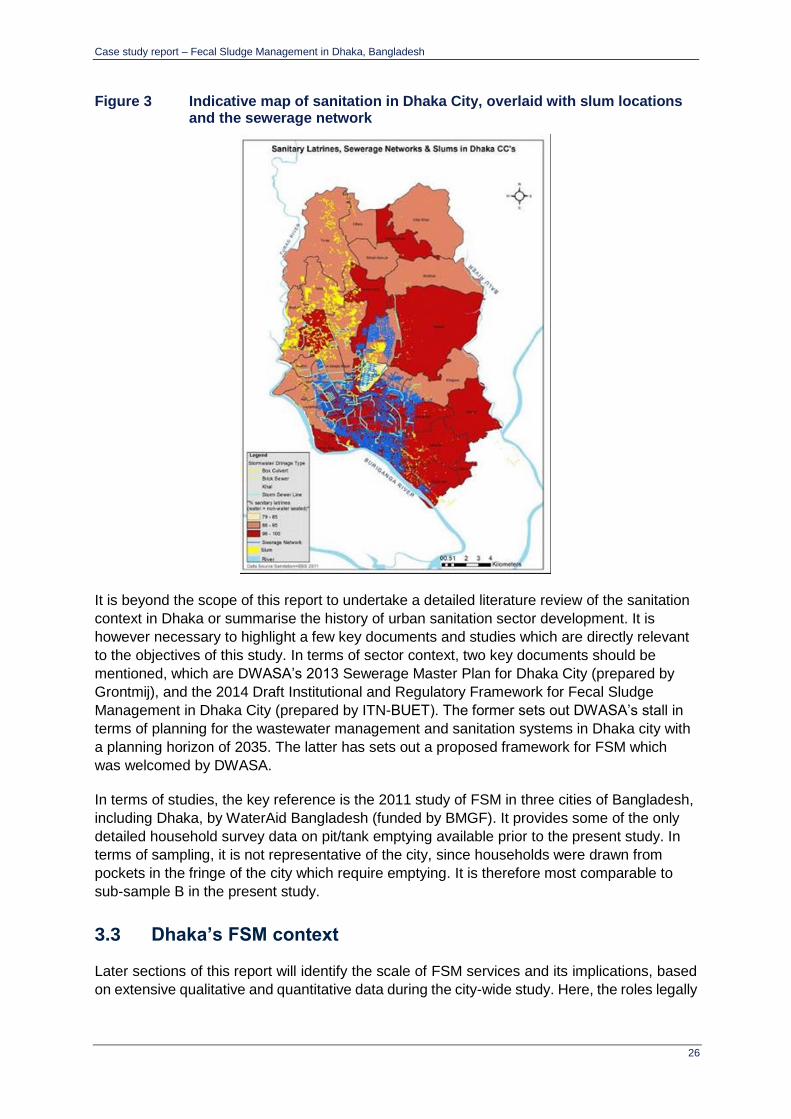
Case study report – Fecal Sludge Management in Dhaka, Bangladesh
26
Figure 3 Indicative map of sanitation in Dhaka City, overlaid with slum locations and the sewerage network
It is beyond the scope of this report to undertake a detailed literature review of the sanitation
context in Dhaka or summarise the history of urban sanitation sector development. It is
however necessary to highlight a few key documents and studies which are directly relevant
to the objectives of this study. In terms of sector context, two key documents should be
mentioned, which are DWASA’s 2013 Sewerage Master Plan for Dhaka City (prepared by
Grontmij), and the 2014 Draft Institutional and Regulatory Framework for Fecal Sludge
Management in Dhaka City (prepared by ITN-BUET). The former sets out DWASA’s stall in
terms of planning for the wastewater management and sanitation systems in Dhaka city with
a planning horizon of 2035. The latter has sets out a proposed framework for FSM which
was welcomed by DWASA.
In terms of studies, the key reference is the 2011 study of FSM in three cities of Bangladesh,
including Dhaka, by WaterAid Bangladesh (funded by BMGF). It provides some of the only
detailed household survey data on pit/tank emptying available prior to the present study. In
terms of sampling, it is not representative of the city, since households were drawn from
pockets in the fringe of the city which require emptying. It is therefore most comparable to
sub-sample B in the present study.
3.3 Dhaka’s FSM context
Later sections of this report will identify the scale of FSM services and its implications, based
on extensive qualitative and quantitative data during the city-wide study. Here, the roles legally
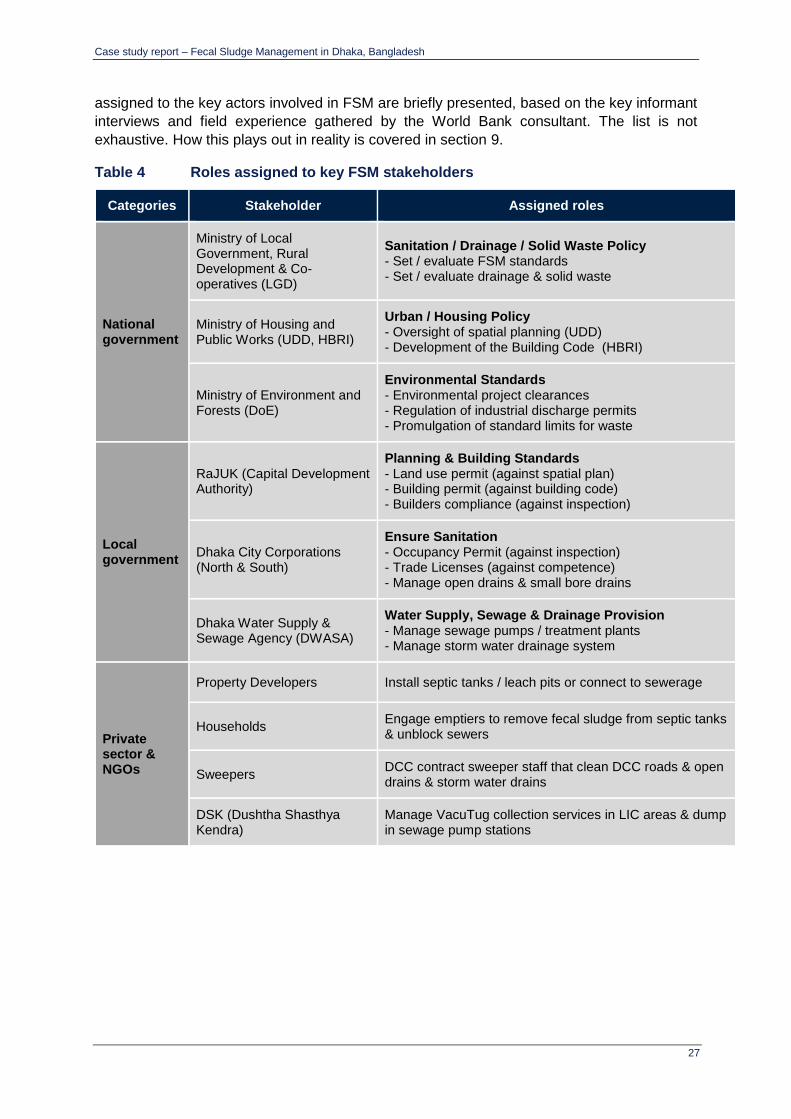
Case study report – Fecal Sludge Management in Dhaka, Bangladesh
27
assigned to the key actors involved in FSM are briefly presented, based on the key informant
interviews and field experience gathered by the World Bank consultant. The list is not
exhaustive. How this plays out in reality is covered in section 9.
Table 4 Roles assigned to key FSM stakeholders
Categories Stakeholder Assigned roles
National government
Ministry of Local Government, Rural Development & Co-operatives (LGD)
Sanitation / Drainage / Solid Waste Policy - Set / evaluate FSM standards - Set / evaluate drainage & solid waste
Ministry of Housing and Public Works (UDD, HBRI)
Urban / Housing Policy - Oversight of spatial planning (UDD) - Development of the Building Code (HBRI)
Ministry of Environment and Forests (DoE)
Environmental Standards - Environmental project clearances - Regulation of industrial discharge permits - Promulgation of standard limits for waste
Local government
RaJUK (Capital Development Authority)
Planning & Building Standards - Land use permit (against spatial plan) - Building permit (against building code) - Builders compliance (against inspection)
Dhaka City Corporations (North & South)
Ensure Sanitation - Occupancy Permit (against inspection) - Trade Licenses (against competence) - Manage open drains & small bore drains
Dhaka Water Supply & Sewage Agency (DWASA)
Water Supply, Sewage & Drainage Provision - Manage sewage pumps / treatment plants - Manage storm water drainage system
Private sector & NGOs
Property Developers Install septic tanks / leach pits or connect to sewerage
Households Engage emptiers to remove fecal sludge from septic tanks & unblock sewers
Sweepers DCC contract sweeper staff that clean DCC roads & open drains & storm water drains
DSK (Dushtha Shasthya Kendra)
Manage VacuTug collection services in LIC areas & dump in sewage pump stations
Case study report – Fecal Sludge Management in Dhaka, Bangladesh
28
4 Fecal Waste Flow Diagrams
4.1 Introduction
Fecal Waste Flow Diagrams (also known as ‘shit flow’ diagrams, or SFDs) are an innovation
arising from WSP’s 12-city study of FSM (Peal et al., 2013). In short, an SFD is a visualisation
of how fecal waste (fecal sludge or wastewater) flows along the sanitation service chain. At
each stage of the chain, the proportion of fecal waste that is or is not effectively managed to
the next stage of the chain is indicated.6
This means that:
- where fecal waste is deemed to be effectively managed from one stage of the chain to
the next (for example where wastewater from cistern flush toilets is effectively
transported through sewers to a designated treatment site, or fecal sludge is
transported by tanker to a designated disposal site), the SFD shows the flow of fecal
waste continuing along the chain – and the arrow representing that flow of fecal waste
to the next stage remains green;
- where fecal waste is deemed to be not effectively managed from one stage of the chain
to the next (for example where wastewater leaks from sewers before reaching a
designated treatment site, or fecal sludge is dumped into the environment or drainage
channels), then the SFD shows the fecal waste “dropping out” of the service chain –
and the arrow representing that flow of fecal waste turns brown.
The proportion of fecal waste that is effectively managed all the way to the end of the service
chain is indicated as “safe”, with the remaining proportion that has dropped-out of the chain
deemed “unsafe”. The primary destination of that “unsafe” fecal waste is indicated e.g.
receiving waters, general environment, drains etc.7 Thus far, SFDs in different cities have been
undertaken using different methodologies, as is often necessary in the context of poor data
availability. Furthermore, most SFDs so far (including those in the 12-city study) were
undertaken using secondary data and expert estimates. This study is amongst the first to use
primary household survey data and field-based observations to construct SFDs. A group of
urban sanitation experts is currently discussing the ‘roll-out’ of the use of SFDs, for which other
methodologies will be developed.8
One of the benefits of the sampling approach for this study is that it is possible to develop
separate SFDs which are (i) representative of the city-wide situation, and (ii) indicative of the
situation in low-income settlements (see section 2.2 above)
6 Previous iterations of SFDs distinguished between safe and unsafe practices, but here we refer to effective/ineffective management. This progression has been made because it is difficult be sure of the safety of the process, but if the fecal waste is managed to the next stage of the sanitation service chain we can say it is considered as an effective process. 7 It is acknowledged that FS may pass from drains into other water bodies, e.g. rivers, but the diagram focuses on the primary destination. It was beyond the scope of this study to be able to track the pathways of sludge beyond the household, e.g. which types of drains did it pass through and where was its eventual destination. 8 See website for the SFD promotion initiative - http://www.susana.org/en/sfd

Case study report – Fecal Sludge Management in Dhaka, Bangladesh
29
4.2 Methodology
For this analysis, several key indicators from the household survey were used. In particular,
data from the following household survey questions was used:9
A. “What kind of toilet facility do members of your household usually use?”
B. “Where do the contents of this toilet empty to?”
C. “What did you do when the pit or septic tank filled-up last time?”
D. “What was [the faecal sludge] emptied into?”
Of these, question ‘B’ is one of the most crucial for the construction of the SFD. It should be
noted that the household’s response is taken as given. It was not possible to confirm responses
by observation since enumerators were selected for a background in social research and not
sanitation. It was however felt that they could be trained to observe ‘above-ground’
components, so observation of slab, water seal, superstructure, etc. was carried out in all
households where permission was given.
Given that ‘B’ is based on household response, possible sources of bias include the household
not knowing the true answer, or knowing it but answering differently for fear of being identified
as practicing illegal behaviour (e.g. pits/tanks connected to drains). The former is certainly
likely, the latter does not seem to be an issue given the vast majority of households who
willingly disclosed illegal behaviour.
To analyse this data, an SFD matrix is created, as shown in Figure 4 below. It shows which
data sources are used and how they are analysed into levels of effective / ineffective
management of fecal waste through the stages of the service chain – with results in the next
section.
First, the household survey data on use of infrastructure (questions (A) and (B) above) is used
to allocate households to five categories shown in the column marked (1) in the figure below:
(i) “Sewered (off site centralised or decentralised)” – toilets connected to sewers
(not OSS)
(ii) “On-site storage – emptiable” – OSS toilets (involving pits or tanks) which can
be emptied. However, they can also be connected to drains through an overflow,
to avoid the need for emptying. These toilets are emptiable but may or may not be
emptied.
(iii) “On-site storage - single-use / pit sealed” – OSS toilets where pits or tanks are
sealed and/or abandoned once full. These toilets are emptiable but never emptied.
(iv) “On-site non-storage - straight to drain/similar” – OSS toilets which connect to
drains or open water bodies (e.g. hanging latrine, or latrine with a pipe connecting
the pan directly into a drain). These toilets are therefore non-emptiable.
9 Full response categories for these questions are included in the survey questionnaire, to which there is a web link in Annex D. In particular, it should be noted that the response categories to question B above were: (i) Directly to piped sewer system, (ii) Septic tank connected to "piped sewer system", (iii) Septic tank with no outlet, (iv) lined pit with no outlet, (v) septic tank connected to drain, (vi) lined pit with overflow to drain/elsewhere, (vii) unlined pit, (viii) directly to sea, lake or river, (ix) directly to drain/ditch

Case study report – Fecal Sludge Management in Dhaka, Bangladesh
30
(v) “Open defecation” – self-explanatory
The question of emptiability is key. Category (ii) above is denoted as emptiable, meaning that
this containment option involves a pit or tank which fills with FS. In Dhaka, many such
pits/tanks are also connected to drains through a variety of means (e.g. overflow pipe). This
means that while they are emptiable they are not in fact emptied as often as would be
expected, or even at all. Between the two extremes of a closed system and a system which
never fills up, there is a spectrum of scenarios. For example, some pits/tanks may have an
overflow to the drain but may still require emptying if they become blocked. This is partly
reflected in the data below.10
The data from questions (A) and (B) at the beginning of this section are allocated in column
(2) below (a key shows the meaning of the colour-coding of cells by data source). Next, the
proportions for each of the stages of the chain are allocated. As can be seen from the emptying
column, marked (3), a certain proportion of the population’s FS which makes it to that stage is
emptied by a service provider, and the rest is not emptied (e.g. overflows to drains). This is
estimated by dividing the number of households which reported emptying their pit (question
(C) above), by the number of households using emptiable technologies (questions (B) above).
The rest of the matrix follows similar logic. Full SFD matrices for the two sub-samples in Dhaka
are provided in Annex A, along with further methodological notes. This section has given a
brief overview of where the data underlying the SFDs comes from. The SFDs themselves are
more intuitively appealing and are presented in the next section.
It should be noted that since the data comes from a household survey, the proportions in the
matrix are proportions of households, not proportions of people or of FS volumes. In Dhaka,
the mean household size for sub-samples A and B was 4.8 in both cases.11
10 As will be seen, only 2% of households city-wide reported using a sanitation facility with no outlet, whereas 13% of households city-wide reported experiencing a pit or tank filling up. This suggests that some of those with who cross-connected to the drains did in fact have to empty their pit at some point. 11 The impression given by the SFD therefore involves assumptions that (i) each person produces the same amount of FS, and (ii) pit accumulation rates are constant across the city. This is an approximation but the most pragmatic approach in the context of uncertainty around FS volumes. FS volume only really becomes an issue when considering the extent of change in service levels needed to deal with the amounts. This study is primarily about identifying the broader picture of where the management of FS is or isn’t effective, not what volumes are being managed or mismanaged.

Case study report – Fecal Sludge Management in Dhaka, Bangladesh
31
Figure 4 Faecal Waste Flow Matrix – empty example
4.3 Results
Firstly, the key household survey results which are inputs to the SFD are shown in the tables
below. They are reported separately for the city-wide representative sample (sub-sample A)
and the slum/poor areas sample (sub-sample B). After that, a separate SFD matrix and
diagram for each sub-sample are presented.
4.3.1 Household survey results as an input to SFD
As can be seen from Table 4 below, the vast majority of households in the city-wide sample
used a pour-flush latrine (82%). The same category was also the most common in the slum
sample, albeit lower (46%). Unimproved latrine technologies (e.g. pit latrine without slab,
hanging toilet) were found in the slum sample but not the city-wide sample. No households
reported practising open defecation.12
Table 4 Sanitation facility used, by technology type
City-wide Slums/poor areas
% No. of households % No. of households
Cistern flush 18.1 65 0.0 0
Pour/manual flush 81.9 295 46.4 167
Pit latrine with slab 0.0 0 34.7 125
VIP latrine 0.0 0 0.8 3
Pit latrine without slab 0.0 0 6.4 23
Hanging toilet/latrine 0.0 0 10.3 37
Other 0.0 0 1.4 5
Total 100.0 360 100.0 360
12 The city-wide sample is designed to be representative of the whole city, so should include some slum areas. Given the sampling approach, it is impossible to know which of the city-wide PSUs are actually in slums. The data above suggests that not very many were, given the low prevalence of latrine types typical of slum areas in the city-wide sample. We can further pursue this question using the housing characteristics data.
1 2 4Overall
Safe:
Type of systemcontained
not
containedemptied
not
emptiedtransported
not
transportedtreated
not
treated0%
100% 0% 100% 0% 100% 100%
0% 0% 0% 0% 0% 0% 0% 0% 0%
100% 0% 100% 100% 100%
0% 0% 0% 0% 0% 0% 0% 0% 0%
100% 0%
0% 0%
0% 100%
0% 0%
0% 100%
0% 0%
Containment 0% Emptying 0% Transport 0% Treatment 0%
Unsafe: 0% 0% 0% 0% 0%
Affected zones (you can adapt the terms to
suit the context)
from household survey
from secondary data
de facto value
Local area (via
overflowing latrines
or dumped FS)
Neighbourhood (via
leakage/overflow from
sewers or drains)
Receiving waters (via
sewer
outfall/discharge)
3
Sewered (off site centralised or decentralised)
On-site storage - emptiable
On-site storage - single-use / pit sealed
On-site non-storage - straight to drain/similar
Open defecation
Local area and beyond via
drains (amount direct to
groundwater not identified)
Containment Emptying Transport Treatment
% pop.
using
of which of which of which of which

Case study report – Fecal Sludge Management in Dhaka, Bangladesh
32
The table above shows the basic categories, but it is also important to consider the proportion
of these which are shared. This is relevant, not just in terms of developing the standardised
indicators of the WHO/UNICEF JMP, but also because the FSM arrangements for shared
latrines are likely to be different from those of ‘private’ latrines from a management perspective.
This is because accountability for dealing with full or blocked pits, as well as payment for FSM
services, may be less clear-cut in a ‘shared’ situation, recognising that this label could refer to
a large number of scenarios. The technology and service used would be as for private facilities,
while noting that shared pits/tanks would be likely to fill more quickly, depending on the number
of users.
As can be seen from Table 5 below, 78% of households city-wide used a facility considered
improved under JMP definitions, whereas this was only 17% for the slum sample. It should be
emphasised, however, that 65% of the slum sample used a latrine which was an improved
technology but shared with other households or a public facility. Overall, 78% of slum
households used a latrine (improved or unimproved) which was shared between 2 or more
households. Further sections below go into this in more detail.
Table 5 Sanitation facility used, by JMP category
City-wide Slums/poor areas
% No. of households % No. of households
Improved 77.5 279 16.7 60
Improved shared13 22.5 81 65.3 235
Unimproved 0.0 0 5.8 21
Unimproved shared14 0.0 0 12.2 44
Total 100.0 360 100.0 360
As noted above, the most important question in the survey is where the contents of toilets go
after flushing or similar. The standard question in the Demographic and Health Surveys (DHS)
incorporate this into the overall sanitation question (see WHO/UNICEF core questions), it was
necessary to ask it separately in order to get better quality data.15 Household-reported data is
relied upon for this indicator, while noting that households may not always know the full detail,
especially if they are renting, or may answer untruthfully16. Furthermore, with a socio-economic
survey rather than a technical survey, it was not possible to physically verify household’s
answers to this question, which would have required a different kind of expertise amongst
enumerators. Nonetheless, a large proportion of the enumerator training was spent ensuring
that the enumerators fully understood distinctions between the response categories.17
13 The JMP definition of a shared facility is one which is used by 2 or more households (including a public facility). 14 “Unimproved shared” is not a category usually reported by the JMP, but it is useful to report for our purposes, so we can see the full proportion of households sharing latrines. 15 As stated above, the question asked was “Where do the contents of this toilet empty to?”. The question is answered by all households, regardless of whether they owned a private toilet, managed a shared toilet or used a shared toilet. 16 We are relatively confident in this data because the figure for sewerage is around 25%, which is more or less what was expected. Of course this does not mean that the waste going into the sewer makes it through the system or is treated. 17 In Table 6, the data are reported as per the response categories used in the questionnaire, with footnotes in the table below qualifying aspects of the data. The response categories used were developed on the basis of discussion with experts on sanitation in Dhaka regarding prevalent containment options.

Case study report – Fecal Sludge Management in Dhaka, Bangladesh
33
The results were grouped into risk categories based on the relative risk to public health from a
combination of the type of containment arrangement and where the FS and effluent empty to:
Low-risk categories are those where the FS can be considered to be contained (in
JMP terms), at least in relation to the first stage of the service chain.
High-risk categories are those where the FS goes directly into the environment and
so potentially poses a risk of exposure to the public, whether via drainage systems or
water bodies that people interact with (especially children).
Medium-risk categories are those where there is at least some containment in a pit or
septic tank, but those pits/tanks either: a) have outlets connected to drains which allow
only partially digested effluent to flow through, or b) are unlined, allowing FS to leach
into the surrounding soil and groundwater which may be used for domestic purposes
(e.g. washing clothes). These scenarios still represent a risk, but it is somewhat lower
than contact with fresh FS as in the high-risk category above
The results are shown in Table 6 below. Unsurprisingly, high-risk blackwater management
practices are more common in the slum sample (71%) than the city-wide sample (21%). It is
worth emphasising that toilets were connected to drains (either immediately or after
intermediate storage in a pit/tank) for 71% of households city-wide, and 87% of slum
households.
Cutting the data another way, it is important to note that 75% of households city-wide use what
is considered as an on-site sanitation system, whereas 100% of households in slum areas do
so. However, in practice the majority of these on-site systems connect into the drainage
network, either directly or via an on-plot pit/tank.
Table 6 Management of blackwater – where toilets discharge to
City-wide Slums/poor areas
% No. of
households %
No. of households
Low risk 29.2 104 11.9 43
Directly to piped sewer system 24.7 88 0.0 0
Septic tank with no outlet18 2.0 7 6.4 23
Septic tank connected to piped sewer system
2.5 9 0.0 0
Lined pit with no outlet 0.0 0 5.6 20
Medium risk 49.7 177 17.3 62
Septic tank connected to drain 49.7 177 14.2 51
Lined pit with overflow to drain / elsewhere
0.0 0 2.5 9
Unlined pit 0.0 0 0.6 2
High risk 21.1 75 70.9 255
Directly to drain/ditch 21.1 75 70.6 254
Directly to sea, lake or river 0.0 0 0.3 1
Total 100.0 356 100.0 360
18 A septic tank without an outlet is really a holding tank, equivalent to a lined pit. In reality, it may or may not be fully lined, or have a sealed base.

Case study report – Fecal Sludge Management in Dhaka, Bangladesh
34
With so many pits and tanks connected to the drainage system, it is not hard to see why there is such a limited market for FSM services, as outlined in section 3.2 above. In order to assess the potential demand, households were asked whether their pit/tank had ever filled up (if they had one). The results are shown in Table 7 below. As can be seen, in the city-wide sample, only 13% of those answering the question (i.e. 10% of the 360 households overall) reported having experiencing the pit or tank of their toilet filling up.19 These proportions are very similar in the slum sample (13% of those responding, 10% of overall slum households). Table 7 Proportion of pits/tanks which have ever filled-up
Pit/Tank ever filled up?
No. of households
City-wide 295
Yes 12.5% 37
No 87.5% 258
Slums/poor areas 259
Yes 13.1% 34
No 86.9% 225
Finally, it is worth considering reported household behaviour in the context of pits filling up. This was assessed by asking about what action the household took last time this happened. As can be seen across both sub-samples, almost all households emptied the pit/tank and then reused it. The nature of the service they used, and associated data, is discussed in section 6 below. Combining these data, the conclusion is that 8% of households in Dhaka overall have emptied a pit or tank, as compared to 10% in Dhaka’s slums.20 Table 8 Past action after pit or tank filled-up
City-wide Slums/poor areas
% No. of households % No. of households
Emptied and reused pit/tank 93.8 30 97.4 37
Abandoned and pit/tank unsealed 6.2 2 0 0
Covered and used alternative pit 0 0 2.6 1
Total 100.0 32 100.0 38
4.3.2 Presentation of SFDs
Using all these results, two sets of SFD matrices and diagrams were constructed: one for the
city-wide sample and one for the slum sample. These are presented as Figure 5 and Figure 6
below. SFDs work on the same principle as the matrix shown above. Household’s toilet
technology and associated containment method is shown on the left, with intermediate steps
and primary destination of the FS shown along the sanitation service chain. What is clear from
both SFDs is that the majority of FS in Dhaka is not effectively managed. Some 99-100%
eventually ends up in the city drains or receiving waters untreated, regardless of its route. It is
19 Households were only supposed to answer the question if their latrine was connected to a pit or tank, with a “not applicable” response category for others. 20 This comes from 30/360=8% and 37/360=10%

Case study report – Fecal Sludge Management in Dhaka, Bangladesh
35
notable that only about half of households in Dhaka overall use a toilet which is “emptiable”
(see definitions in section 4.2)
For clarity, it is worth briefly describing the city-wide results. Dhaka has a sewer network which
covers part of the city, with 25% of households in city-wide sample reporting being connected
to a sewer.21 However, as shown in Figure 5, only about 1.2% of households’ FS which enters
the sewer ends up being treated (this comprises the faecal waste of 0.3% of households
overall). This is due to leakages in the system and deficiencies at the treatment plant
(explained in discussion on treatment in section 7.2.1).
The other 75% of households reported using an improved latrine, though many are shared
(and noting the caveats above regarding slums in the city-wide sample).22 However, as shown
below, all of the FS from those toilets ends up in the environment or drains, by three different
routes. Some households have latrines with no storage component, i.e. the contents travel
straight to the drains. Overall, this is the case for 21% of households’ FS city-wide. If there is
containment of some kind (e.g. a pit or tank), for 46% of households’ FS overall, this goes
through to a drain via a connection from the pit or tank. In the small proportion of cases where
the containment chamber is emptied (8% of households overall), the methods used result in
the FS ending up in the drains (see section 5.2.3) Overall then, as shown in the SFD, only 1%
of households’ FS in Dhaka is effectively managed.
Considering next the SFD for the slum sample (Figure 6), the main differences are that some
people are using unimproved sanitation options (18% of households overall). In slums, only
29% of households use a facility which is emptiable (against 54% city-wide).23 However, it was
found that households in slums are more likely to have decided to empty a pit or tank (see
Table 8). This is most likely because in some densely-populated slum areas, drainage is less
formal and there may not be nearby drains to connect to.
Of those households with an emptiable pit or tank, about a third have actually emptied it, which
equates to 10% of slums households overall using an emptying service. Similar to the city-
wide sample, qualitative research in slum areas found that all of the FS that is emptied ends
up in the drains and eventually the wider environment. Overall then, 0% of households’ FS in
slums is effectively managed.
21 Households were asked to show their DWASA sewerage bill if they responded with this option. 25% is slightly higher than the general estimate of 20%, but is within the bounds of sampling error in a sample of only 360 households 22 Note that not all cistern flush toilets go into sewers, and not all pour-flush toilets go into pits/tanks. The small black arrows in the diagram illustrate this. What matters is the blackwater management. 23 This data comes from Table 6, but is more clearly shown in the SFD tables in Annex B.
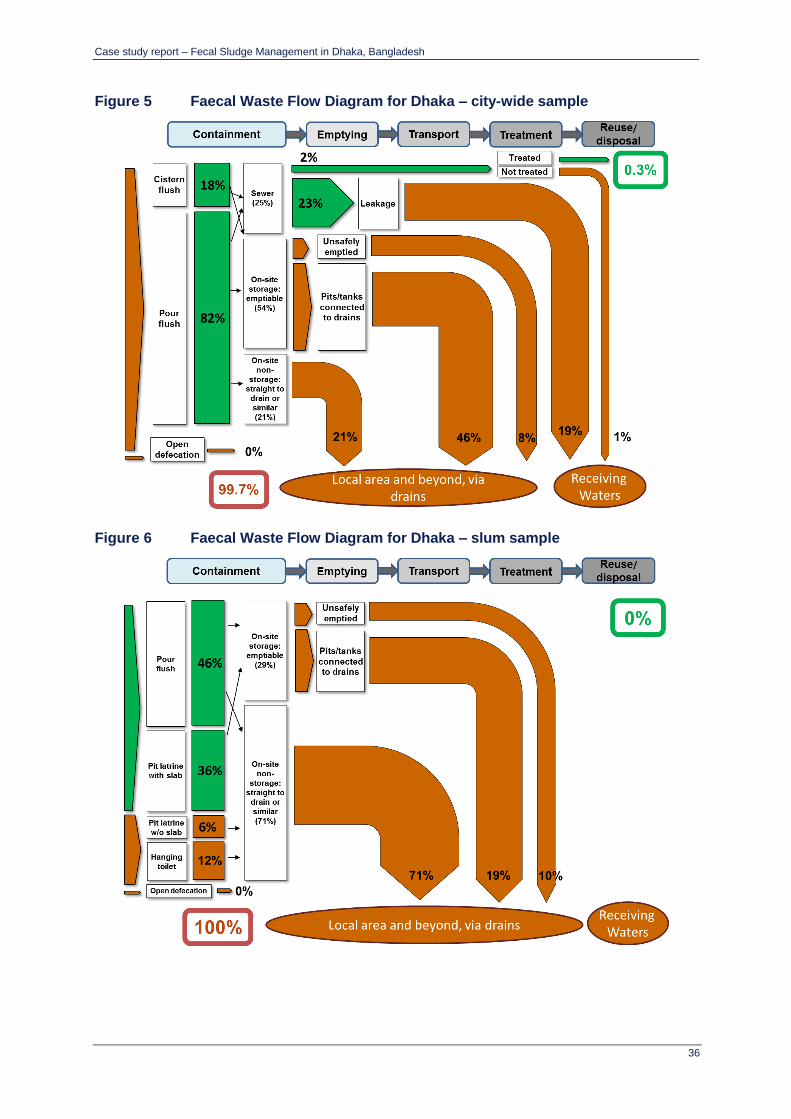
Case study report – Fecal Sludge Management in Dhaka, Bangladesh
36
Figure 5 Faecal Waste Flow Diagram for Dhaka – city-wide sample
Figure 6 Faecal Waste Flow Diagram for Dhaka – slum sample
Case study report – Fecal Sludge Management in Dhaka, Bangladesh
37
4.4 Implications of the SFDs for FSM in Dhaka
The city-wide SFD shows that almost all FS is ending up in the drains or environment one way
or another. It is therefore not surprising that a market for FSM services barely exists. Only 10%
of households city-wide have experiencing a pit filling up. It must be emphasised that having
large amounts of FS in the drains and environment is an externality which affects everyone in
Dhaka. Poor FSM is not only a private household matter – it is a public health and
environmental hazard. Most of the time, it mainly affects poor households whose children play
in and around the drains or contaminated ground. However, during heavy rains, when the
drains block up and the city floods, the problem affects everyone. The risk to public health is
discussed in section 5.3 below
Both SFDs above are necessarily vague about the destination of the untreated FS (i.e. “local
area and beyond, via drains). There are many different kinds of drains in Dhaka – for example,
the large storm drains (managed by DWASA), the small-bore local drains (managed by the
DCCs) and informal street side drains in lower-income areas (properly managed by nobody).
For some of these, FS entering them means contaminating the local environment. For others
(e.g. the large underground drains) it means contaminating the Buriganga river further
downstream.
There are various implications of the SFDs above for FSM in Dhaka. These are discussed in
full in section 10 of this report focusing on implementation options. In short, however, it is clear
that key challenges in Dhaka are: (i) preventing newly-constructed buildings from connecting
septic tanks and blackwater outlets to the drains, and (ii) progressively disconnecting existing
households’ systems from the drains and ensuring proper containment. This will not be an
easy process – analysis of the problem is discussed in section 9. Clearly sewerage should
play a role, but given that only 3% of sewage entering the system is currently treated, and only
20-25% of households have a sewer connection, its role will continue to be minor even in the
medium-to-long-term. Addressing Dhaka’s sanitation crisis by introducing proper containment
and systematically getting these facilities connected to the most appropriate technical option(s)
to provide a functioning sanitation service chain is clearly a priority.
In terms of FSM services, the SFDs show that at the moment, when households experience a
pit or tank filling up, they do use an emptying service rather than abandoning that pit or tank.
Some service providers exist (as discussed in section 6.4 below), but markets are thin. As
proper containment is introduced, one would expect broadening and deepening of those
markets.
Case study report – Fecal Sludge Management in Dhaka, Bangladesh
38
5 Public Health Risk Assessment
5.1 Introduction and methodology
A component of the diagnostic study is to assess the extent of public health risk resulting from
poor FSM services within Dhaka, representing risks at a city-wide level and for slum/poor
areas. The study also seeks to identify the approximate level and location along the sanitation
service chain of adverse public health risks.
Methods adopted within the data collection instruments to do this include:
- Identifying types of household facility and emptying services used (supported by direct
observation of the cleanliness and functionality of the facility), during the household
survey;
- Observing emptying service providers to identify how their practices may introduce risk
to the household specifically (containment and emptying stages) and to the wider public
at large (emptying, transport and disposal stages) - see Annex D for information on the
scoring system used;
- Scoring hazards and vulnerability factors observed during transect walks (see
explanation below), along with information about local practices that could result in
fecal contamination in the environment (see Annex D for information on the scoring
system used);
- Measuring fecal contamination levels in local drains and water supplies, to identify
potential levels of exposure to risks; and
- Asking for perceptions of risk related to emptying services, during focus group
discussions.
Collating and analysing results from the data collection instruments provides information
about sources of risk through the service chain. This includes: how clean and operational
toilets are kept within the household; how effectively and safely service providers empty,
transport and dispose of fecal sludge; the extent to which infrastructure provides effective
handling of fecal sludge and wastewater through the city.
Given the limited extent of data collected for this part of the study, it can only provide a
general indication of risk level at positions along the service chain. The study is not intended
to report on specific locations or flow paths of FS movement within the sampled PSUs.24
For more information about the sanitation-related diseases and the significance of safe
management of fecal sludge to protect environmental and public health, see Cairncross and
Feachem (1993, pp.11-25), and Strande et al (2014, pp.1-4).
24 Original datasets contain GPS locations of observed risks in the PSUs that can be examined further

Case study report – Fecal Sludge Management in Dhaka, Bangladesh
39
5.2 Results: risks through stages of the FSM service chain
5.2.1 Containment: household facilities, levels of sharing and practices
The standard of household containment facilities has been identified from the household
survey, as indicated in Section 4.3.1.
From the survey, reported levels of sharing of facilities shows that, in slum areas, 65% of
households use an improved shared latrine and a further 12% an unimproved shared latrine.
This compares with 22% of households city-wide using an improved shared latrine and no
households using an unimproved shared latrine (see Table 5). For shared latrines in slum
areas, an average of 11 households share a latrine (median value 7 households), as compared
to an average of 5 households sharing a latrine city-wide (median value 4 households). 35%
of slum dwellers who use a shared latrine reported sharing their latrine with more than 30
individuals.
Standards of cleanliness for household facilities, observed during the household survey, were
found to vary between city-wide and slum area facilities.
- City-wide, 100% of observed latrines were found to have a cleanable slab and 96% no
fecal or urine contamination on the floor or slab.
- In slum areas, these levels fell to 78% of latrines having a cleanable slab. 71% showed
no signs of fecal or urine contamination on the floor or slab, which given the extent of
sharing is perhaps a better result than might be expected.
Practices around the disposal of child faeces also introduces risks to both households and
potentially the wider public. City-wide, 6% of households reported unsafe methods practiced
when disposing of faeces of children under 5 years old (disposing into drains, ditches, solid
waste or leaving in the open), while in the slum areas this figure rises to 67%. In the majority
of cases this is by faeces being disposed into drains or ditches (56%), with remaining practices
being through disposing of faeces with solid waste (7%) or faeces left in the open (11%).
Despite such potential risks, levels of diarrhoea are relatively low, as shown in Table 9
below. The household survey gives the following results for self-reported diarrhoea
prevalence by the respondent (person answering the questions). As can be seen, prevalence
was higher in the slum sample (4%) than the city-wide sample (2%). However, it may be too
small a difference to be statistically significant. A similar pattern is seen amongst children
under-5. In the city-wide sample, respondents reported that no children under-5 had suffered
from diarrhoea in the past two weeks, but this figure was 3% in the slum sample.25
Table 9 Prevalence of diarrhoea among respondents in the last 2 weeks
City-wide Slums/poor areas
25 These figures are more or less consistent with the Bangladesh DHS 2011 data on diarrhoea prevalence, which found that 4% of children under-5 in urban areas nation-wide had suffered from diarrhoea in the 2 weeks preceding the survey.

Case study report – Fecal Sludge Management in Dhaka, Bangladesh
40
% No. of households % No. of households
None 98.3 354 95.8 345
One 1.4 5 3.9 14
Two 0.3 1 0.3 1
Total 100.0 360 100.0 360
It should be noted that diarrhoea prevalence is only one indicator of a contaminated
environment. It is increasingly understood that nutrition outcomes, especially stunting (height-
for-age) are strongly linked to sanitation through multiple transmission pathways. The
Bangladesh DHS 2011 found that, in urban Bangladesh, 36% of children under-5 were stunted.
While stunting has numerous determinants, living in such a contaminated environment
certainly contributes to those observed outcomes.
Wider risks to public health, beyond risks to families and individuals from poorly-managed
containment facilities and practices, arise from poor access to fecal waste management during
discharge, emptying, transport and disposal practices.
5.2.2 Emptying: household practices around emptying services
As seen in the results from the household survey and reported during focus group discussions in slum areas, the majority of households rely on using some form of self-built latrine that connects into a drain, either directly or via a pit or septic tank. The data regarding filling-up and emptying rates was discussed in section 4.3.1.
Of those households who have called on emptying services, the reasons have been identified
as mainly the pit/tank being nearly full (for both city-wide and slum areas), and only in a few
cases the facility overflowing, smelling, or becoming blocked (Table 10).
Table 10 Reason for emptying
City-wide Slums/poor areas
% No. of households % No. of households
Pit/tank was nearly full 86.7 26 86.5 32
Pit/tank was overflowing 0.0 0 5.4 2
Bad smell 0.0 0 2.7 1
Blocked 13.3 4 5.4 2
Total 100.0 30 100.0 37
Satisfaction expressed about the safety of emptying services was reported to be high across
both city-wide and slum area households.26 83% of households city-wide (30 responses) and
87% of households in slum areas (37 responses) stated they were either very satisfied or
satisfied with the safety of emptying services. Risk as perceived by householders will not be
the same as actual risk resulting from the process, so this information should be considered
alongside results from the structured observation (next section).
26 Households who had used an emptying service provider (mechanised or manual) were asked to rate their satisfaction with the safety of the service – from very satisfied to very dissatisfied. With no definition for “safety” given to households, the response will be based on the perceived level of safety to the household themselves as a result of the emptying activity.

Case study report – Fecal Sludge Management in Dhaka, Bangladesh
41
5.2.3 Emptying, transport and disposal: observed practices and risks, in slum areas
Planned observations were carried out during five emptying operations in slum areas (three
carried out by manual emptiers and two using mechanised vacuum tankers – the VacuTug).
In all five cases, there were no logistical challenges affecting the service providers themselves,
as access to the latrine on the compound was satisfactory and access into the pit/tank in each
case was by lifting a removable cover slab to gain full access to the pit/tank below.
Using a structured observation format, likely sources of immediate risk from exposure to FS at
each step of the process were identified for the Containment, Emptying, Transport and
Disposal stages. Treatment and End-use of fecal sludge is not practiced in Dhaka, so these
stages of the service chain could not be observed.
Risk levels were taken to be based on exposure as follows:
- at containment stage to the family members/households who use the facility,
- at emptying stage to those in the compound (site) where the facility is located, plus the
neighbourhood along the emptying route from the compound to transport/disposal
point,
- at transport and disposal stages, affecting a wider geographical area and population,
especially where FS is discharged into drains and open water bodies. Disposal of FS
into a drain may not present a direct risk to public health (unless people enter into the
drain and/or use the drain water directly), but there will be high environmental pollution
occurring beyond the final outfall of the drain. There could therefore be risks resulting
from human contact with wastewater discharges beyond the outfall – but the location
of such discharge was not identified within the scope of this study.
Based on the scoring system developed for the structured observation, exposure to risk were
recorded using High/Med/Low categories. The specific results are shown in Annex D, while
the following sections discuss the broader findings and their implicationsError! Reference
ource not found.. It should be kept in mind that, as the immediate risk was being noted down
at each stage in the process, the risk level can vary between stages, depending on the actions
taken.
Containment and Emptying: Manual
The containment facilities where manual emptying was observed (three cases) introduced a
low risk to the household, as they were in relatively clean condition and the pits/ tanks were
not full to the point of overflowing.
The action of manual emptying itself introduced medium risk to the compound and possibly
neighbours on two occasions, as spillage occurred during the removal and transfer of fecal
sludge from the emptying bucket to ground level buckets/containers or discharge into
channels.
- In the majority of focus group discussions, participants identified manual emptying as
an unsafe practice, as fecal sludge is discharged into the nearest pond, drain, water
body or canal. In no case was FS reported as being transported to a safe discharge

Case study report – Fecal Sludge Management in Dhaka, Bangladesh
42
point. On two occasions, fecal sludge was reported to have been spilt onto paths and
roads during the procedure identified as affecting the health of children, who are often
barefoot.
- 81% of households surveyed in slums who had used an emptying service reported
using manual emptiers (compared with 97% of households’ city-wide) on the basis of
their affordability, accessibility and a more flexible and responsiveness service. This
was backed up by the majority of FGDs. In slums, 14% reported emptying themselves,
which is likely to carry similar or greater risks due to lack of appropriate equipment and
skills.
Containment and Emptying: Mechanical
The containment facilities where mechanical emptying was observed (two cases) were
considered to introduce a medium risk to the household. The risk was rated as higher, due to
the pit or tank being extremely full or overflowing immediately prior to emptying. This is likely
to be influenced by the fact that households often have to wait for some days for mechanical
emptiers to become available, during which time pits/tanks fill up and latrines may become
overfull, back-up and become difficult to keep clean.
The emptying action was observed to pose low risk to the household, as removal and transfer
of fecal sludge is well contained in the suction pipes connected directly from the pit/tank to the
tanker.
Transport and Disposal: Manual
Manual emptying in each case did not record a risk for a ‘transportation’ stage, as the fecal
sludge was discharged into either a water body (pond), open drain or covered stormwater
drain near to the household. In the first two cases, the actual risk is anticipated to be high,
due to the potential for spills and direct human contact with fresh fecal sludge – as seen from
the photographs below. In the third case (Korail), the transportation process introduced very
little, if any, risk to the household.
Disposal locations in the first two cases, being an open drain and dug trench leading to an
open waterbody, are considered to be high risk. The disposal of fecal sludge into a covered
drain in the third case (Korail) is considered to introduce no direct risk to public health, but
rather there will be high environmental pollution occurring beyond the final outfall of the
stormwater drain used and there could also be risks resulting from any human contact with the
discharge beyond the outfall.

Case study report – Fecal Sludge Management in Dhaka, Bangladesh
43
Figure 7 ‘Transport’ and disposal points during observed manual emptying
1: Uttara 2: Shikderbari 3: Korail
FS tipped directly into a channel
FS tipped into a dug trench
FS carried off the property
that discharges into an open drain
and discharged, via the trench
into a local pond
and discharged into a nearby covered drain
Transport and Disposal: Mechanical
Transporting FS in the vacuum tankers was observed to pose little, if any, risk. The FS was
safely contained in the tankers without any spillage occurring on route to the disposal point.
Disposal practice by the mechanical emptiers was considered as medium risk. As far as can
be ascertained, the eventual discharge from the stormwater or surface water drain may not
interact directly with human activities – such as people using drain water for washing, cleaning
or other domestic uses, children playing in drains, drains overflowing into properties or drain
water reaching low-lying areas. Given the complexity and coverage of drainage networks in
Dhaka (and given the constraints of this study), identifying the actual risk from any given
disposal practice, its scale and location within the city, is extremely unlikely.
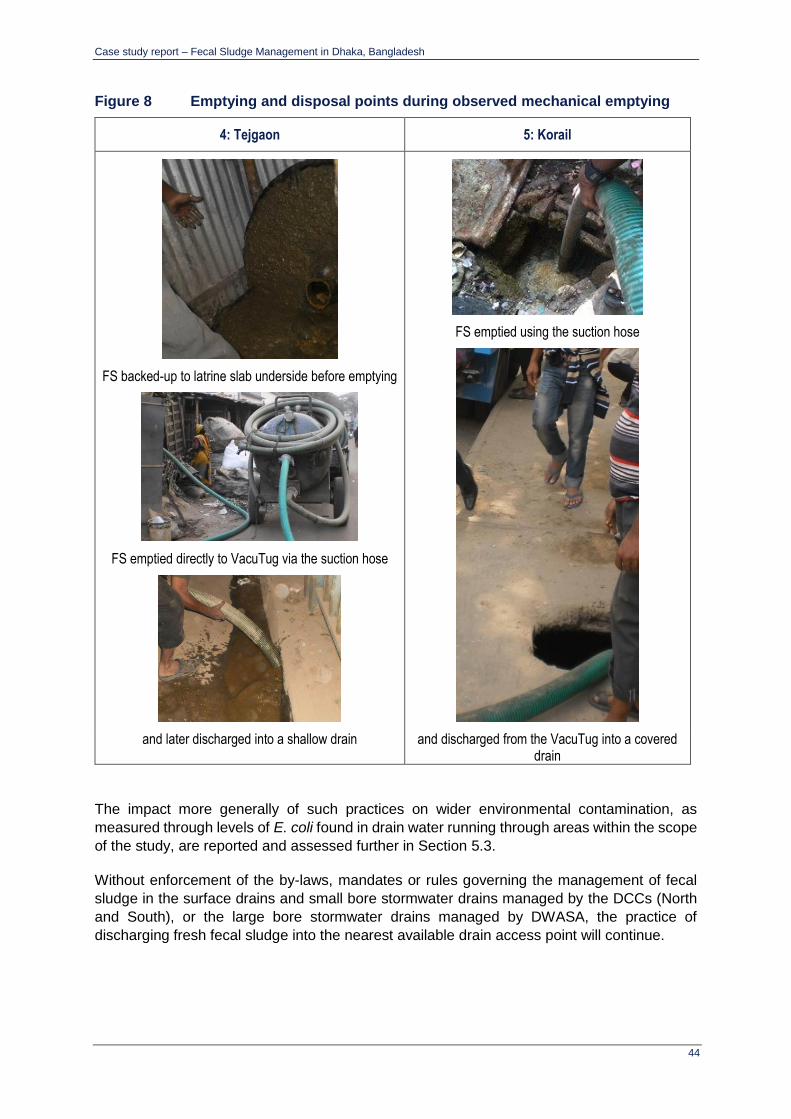
Case study report – Fecal Sludge Management in Dhaka, Bangladesh
44
Figure 8 Emptying and disposal points during observed mechanical emptying
4: Tejgaon 5: Korail
FS backed-up to latrine slab underside before emptying
FS emptied directly to VacuTug via the suction hose
FS emptied using the suction hose
and later discharged into a shallow drain and discharged from the VacuTug into a covered drain
The impact more generally of such practices on wider environmental contamination, as
measured through levels of E. coli found in drain water running through areas within the scope
of the study, are reported and assessed further in Section 5.3.
Without enforcement of the by-laws, mandates or rules governing the management of fecal
sludge in the surface drains and small bore stormwater drains managed by the DCCs (North
and South), or the large bore stormwater drains managed by DWASA, the practice of
discharging fresh fecal sludge into the nearest available drain access point will continue.

Case study report – Fecal Sludge Management in Dhaka, Bangladesh
45
While Dhaka has a sewage treatment plant at Pagla, it does not accept fecal sludge directly.
As such, there is no site in Dhaka available for anyone to discharge fecal sludge in a manner
where it can be safely treated.
5.2.4 Transport and discharge: associated with sewerage
The sewerage network in Dhaka is currently estimated to cover 20% of the city population
(Dhaka Sewerage Master Plan Report, 2013). The household survey identified that city-wide
25% of households reported having their latrine directly connected to a piped sewer system,
with no connections in slum areas. However, not all of the wastewater discharging into sewers
reaches the treatment plant in Pagla, due to either leaking sewers or non-functioning pumping
stations leading to sewers discharging into nearby drains or watercourses (via overflows).
The DWASA Sewerage Master Plan notes that 9 of the 27 installed pumping stations are not
functional, while a further 10 or more may not be working, or are currently by-passed. As a
result, it would seem that about 70% of the sewerage network is currently not operational.
Getting details of the actual level of failure, enabling leakage rates and overflows to be
identified, has not been possible during the course of the study.
5.3 Results: risks from wider environmental contamination
The 40 transect walks (30 conducted city-wide and 10 in slum areas) confirmed that fresh fecal
waste is visible or present in the majority of local environments and neighbourhoods – both at
a city-wide scale and within slum areas. This is primarily through the practice of latrines
emptying either directly, or via pits and septic tanks, into local drains. In many cases these
drains are open and fecal waste was directly observed.
Drain water
Where fecal waste was seen in drains on the day of the transect walk (in 50% of locations city-
wide and in slum only areas), during the short interview with community members, people
confirmed in 80% of both city-wide and slum areas that they would see fecal waste in the
drains on a daily basis throughout the year.27
When community members were asked about the practice of latrines emptying into drains, in
the city-wide areas people reported that this occurs daily in 57% of locations (17/30 locations),
while in slum areas people reported this as occurring in 80% of the locations (8/10 locations).
Samples of drain water taken in 20 areas (10 city-wide and 10 in slums) confirmed the
presence of E.Coli in the drains.
Table 11 Observation of FS in drains
Observed during transect
walks Reported by community
Fecal waste in drains Latrines emptying to drains on a
daily basis
27 Refer to the description of the Transect Walks in the Methodology section

Case study report – Fecal Sludge Management in Dhaka, Bangladesh
46
City-wide areas 50% (N=30) 57% (N=30)
Slum areas 50% (N=10) 80% (N=10)
There is widespread recognition that the practice of discharging fecal sludge to drains
throughout the city generates a high environmental health risk. However there is little evidence
of chronic health risks resulting from this – indicated by the low prevalence of diarrhoeal
disease. This situation is however interspersed with high acute health risks during episodes
that generate high exposure levels, such as blockages to drains and drains failing to deal with
overloading during flooding, as well as poorly managed emptying practices.
Where the population are likely to be most at risk is where they have the opportunity to come
into direct contact with fecal contamination in drain water. For some people, this may be due
to a practice of using drain water for non-domestic activities (such as washing vehicles), but
the greatest risk often associated with drains is children playing in, or close to, drains without
being aware of the risks from contact with drain water, practicing safe handling or effective
handwashing afterwards. Although the transect walks did not directly identify cases of children
playing in drains, it was clear that children regularly play in close proximity to open drains and
are likely to pick-up contamination through for example contact with overflowing drains or
walking barefoot next to blocked and overflowing drains.
Dumped fecal sludge, removed from blocked drains
When either the shallow, open drains or deep, closed stormwater drains become blocked (as
happens frequently) they are eventually emptied. As the network consists of mainly open
drains, the bulk of this work is carried out by manual sweepers, with dredgers used in some
cases. The removed sludge will contain a mixture of fecal sludge, sand and silt (and in certain
locations of the city industrial pollutants) and is dumped directly next to the drains in the streets
or pathways. The extent to which this practice occurs is not clear. The transect walks only
noted fecal sludge dumped in one location out of 40, with this practice being reported by local
residents as occurring on roughly a monthly basis.
Open waterbodies
When asked about the extent to which fecal sludge reaches open bodies of water (such as
ponds, rivers, canals or streams), people reported that this is a daily occurrence in 5 city-wide
locations (17% of the 30 study areas) and in 6 slum areas (60% of the 10 study areas). The
question did not extend to identifying how the fecal sludge reached the ponds – whether it
came directly from latrine outlets, or by manual emptiers disposing of removed fecal sludge
into the waterbodies. In either case, open water in the local environment is frequently and
significantly contaminated.
Box 1 Solid Waste Management
Health risks from people coming into contact with (potentially contaminated) solid waste in
their local environment is not a direct part of this study. However, piles of solid waste
accumulating close to where people live was noted in 47% of city-wide areas and 40% of
slum areas, with these piles at times obstructing open drains in the area.
Case study report – Fecal Sludge Management in Dhaka, Bangladesh
47
A further route of fecal contamination is when the feces of small children who are not using
latrines is thrown-out with solid waste. Of households reporting having to handle children’s
feces, 3 out of 94 families in city-wide areas (3%) and 8 out of 109 families in slum areas
(7%) reported throwing the children’s feces out with their solid waste. The nation-wide
MICS figures for 2006 report these values as 11% for all families and 14% amongst the
poorest quintile (MICS, 2006). Levels in the urban context are understandably lower than
national figures, but of concern is that the feces of babies and young children are known to
contain a higher proportion of disease-causing organisms than adult feces – so
contaminated solid waste in the environment poses a potential health risk to the whole
community.
Water supply
Dhaka has significantly improved access to piped water supplies throughout the city in recent
years. In slum areas in any city however, these supplies often have additional connections
informally added to any formal arrangement, resulting in “spaghetti” networks where pipes are
connected using temporary joints/seals, leaving domestic supplies prone to contamination.
Where pipes run in drains, the risk of contamination can increase significantly.
Transect walks in the 40 PSUs did not identify any situations where the water supply
infrastructure as identified as being at direct risk from poor FSM services. Tests on drinking
water from piped or groundwater supplies, at the point of delivery, in 40 of the PSUs showed
a detectable level of E. coli in 3 piped water supplies from city-wide areas (10% of the 30
samples taken), in 1 piped water supply and 1 groundwater source from slum areas (20% of
the 10 samples taken in total). While these sample sizes are too small to be statistically
significant, they point to the fact that some piped water supplies are becoming contaminated
before, or as, they reach households.
5.4 Implications: assessing the public health risk from poor FSM
Risk to public health, as a result of poor FSM services, comes when there is human exposure
(i.e. some form of contact) to the hazard (i.e. feces that contains pathogens), through an event
(such as walking barefoot over fecal sludge, working or playing in drains that carry fecal sludge
discharged from latrines, drinking water or via hands contaminated with feces). The study has
identified that all areas of Dhaka are prone to fecal contamination, resulting from fecal sludge
being carried in drainage networks and eventually reaching open waterbodies, or being
dumped by the roadside when drains are unblocked. In certain areas of Dhaka, exposure to
fecal sludge is more direct and hazardous – such as where fresh fecal sludge is discharged
directly into open waterbodies (such as ponds) that are used for recreational purposes or
domestic water use, or contaminated drains overflowing into living areas. In other situations,
the cause and level of exposure may be more difficult to measure, such as the extent to which
contamination in water supplies is a result of poor FSM.
It is likely that the drain networks running through slum areas will be more informal and open,
as compared to those running through the city as a whole. It is also recognised that parts of
the city, most notably the eastern area, become inundated caused by external flooding from
rising rivers as well as internal flooding caused by stormwater and the poor drainage

Case study report – Fecal Sludge Management in Dhaka, Bangladesh
48
infrastructure.28 What is clear however is that the problem of fecal contamination is occurring
throughout the city? Perhaps as a result of the extensive scale of poor FS management, the
complex integration of slum areas within the city as a whole and resulting spread of
contamination, assessment of the findings so far has not identified a strong association
between the locations (PSUs) of poor management practices and any risks identified within
that PSU – either through measured contamination of drain water or water supplies, or through
observed / reported human behaviours that bring people into contact with fecal sludge.
Further analysis is needed if results of where, how and to what level risk is occurring, are to
be clearly identified. In collaboration with the Centre for Global Safe Water at the Rollins
School of Public Health, Emory University, results from Dhaka have been initially analysed
using an adapted version of the SaniPATH tool.29 This initial analysis has identified
weaknesses in the data available from the Dhaka study to be able to carry out the SaniPATH
analysis. These weaknesses are both in terms of the reliability of certain results (essentially
the microbiological indicators of fecal contamination in drain water and drinking water
samples), as well as the extent of data available relating to human behaviours in the study
PSUs that expose people to pathways of fecal contamination.
At this stage, the study is not able to present an analysis of public health risk from poor FSM
services in Dhaka. However, the collaboration has informed ongoing development of a
SaniPATH tool for FSM services by; identifying minimum data requirements to conduct a
credible public health risk assessment, the need for preliminary assessment of the main
pathways of risk and the reporting requirements for target audiences such as municipal
managers or World Bank staff. Further collaboration will work towards developing a more
effective tool that addresses an appropriate level of data collection and analysis, with improved
visual presentation of the results.
28 Haque, A.N., Grafakos, S. and Huijsman, M. (2010), Assessment of adaptation measures against flooding in the city of Dhaka, Bangladesh, IHS Working Papers, Number 25/2010, Institute for Housing and Urban Development Studies, Rotterdam, The Netherlands 29 SaniPATH is a Rapid Assessment Tool to assess exposure to fecal contamination in urban, low-income settings. Details available at http://www.sanipath.com

Case study report – Fecal Sludge Management in Dhaka, Bangladesh
49
6 FSM service potential demand and supply assessment
6.1 Introduction
In economic theory, markets for goods and services operate on the basis of demand and
supply. This chapter provides a brief assessment of demand and supply for FSM services in
Dhaka. At this stage, it is important to note the difference between potential (or notional)
demand and effective demand. The potential demand for FSM services is the quantity (and
type) of services which would be demanded in the absence of any market failures or
distortions. This is different from effective demand, which is the quantity (and type) of services
actually purchased in the context of current supply and current prices.
A simple way of illustrating this is to note that 75% of households city-wide use OSS, which
suggests high potential demand for FSM services. However, only 13% of households report
experiencing a pit or tank filling up (see section 4.3), suggesting low effective demand.
Reasons for a gap between potential demand and effective demand in Dhaka include: (i) 52%
of households city-wide report having pits/tanks connected to drains (reducing or removing the
need for emptying), which is illegal and therefore a market failure, (ii) 21% of households city-
wide do not even have a pit or tank – their latrine empties directly to a drain or ditch without
intermediate containment, (ii) many service providers may not be able to physically access
households, which affects the type of services demanded, (iii) market prices for services may
be higher than consumers are willing or able to pay, which is a market failure.
There can be different definitions of potential demand in the context of FSM, with varying layers
of complexity. The simplest definition is as per the above, i.e. services that would be demanded
if all OSS households used emptying services and were willing and able to pay. Qualifications
could be added for different scenarios, for example (i) given emptying of pits tanks every 10
years on average, (ii) given regularly desludging once a year, (iii) given that 30% of households
are unable to pay the market price and a further 20% are unwilling, and so on. For this study,
we have kept things simple.
On the supply side, the types of FSM services the market is currently providing to households
were studied.30 Dimensions of supply include the number of service providers of different types
(manual, mechanical etc.), the geographical areas they serve, the prices they charge, and so
on.
This section will argue that the main problem in Dhaka is on the demand side. Fewer FSM
services are demanded than would be expected given the population using OSS, primarily
because people connect to the drains. Where FSM services are demanded, manual emptying
predominates because slow traffic and poor accessibility to households demanding emptying
inhibits mechanical emptiers from entering the market, due to low perceived profitability.
30 FSM services are obviously also demanded by the government, businesses etc. but households are the focus of this study.

Case study report – Fecal Sludge Management in Dhaka, Bangladesh
50
6.2 Methodology
This sub-section sets out key dimensions of demand and supply, and the data collected related
to those, from the various instruments. It was not intended to collect data on all of these
aspects, given the broad scope of the research and the limitations of some of the instruments
used.
6.2.1 Demand
The research framework (see section 1.3) poses the following question: “What is the existing
customer demand and preferences for FSM services?”, i.e. the current effective demand. This
is discussed in three parts: (a) physical and economic determinants of household demand, (b)
household satisfaction with current services, and (c) the barriers which households face in
obtaining FSM services.31 This list is not meant to be exhaustive, but rather those considered
important for answering the questions in the research framework.
Physical and economic determinants of household demand
It is useful to separate the physical and economic determinants of household demand,
because the differences between them have implications for any interventions; either in
stimulating or responding to that demand. Physical determinants are related to geography and
infrastructure, whereas economic determinants are more to do with markets and finance.
The main determinants are set out in Table 12 and
Table 13 below, which list various key determinants and the way they have been measured
them by the research instruments, as well as where it was chosen not to collect data in this
area.
Table 12 Physical determinants of demand for FSM services
Dimension Instrument used to collect
quantitative data
1. Accessibility of location
Equipment access – likelihood of equipment of different
sizes (manual emptier, VacuTug, tanker truck, etc.) being
able to access the facility to empty it
Household survey questions about
equipment access and emptying
point. Also transect walk questions
around conditions of roads/paths in
the area
Type of building – whether single-storey or multi-storey,
and privately owned or in shared ownership Household survey question
2. Fill rate
31 Given our focus on household demand, the primary concern is demand for emptying services rather than the rest of the sanitation service chain. The research framework also asks about levels of satisfaction by providers of emptying services with current transport, treatment and disposal/end-use arrangements. As the scale of formalised emptying services is so limited and there is no effective treatment or end-use for fecal sludge in Dhaka, this aspect does not form a significant part of the study.
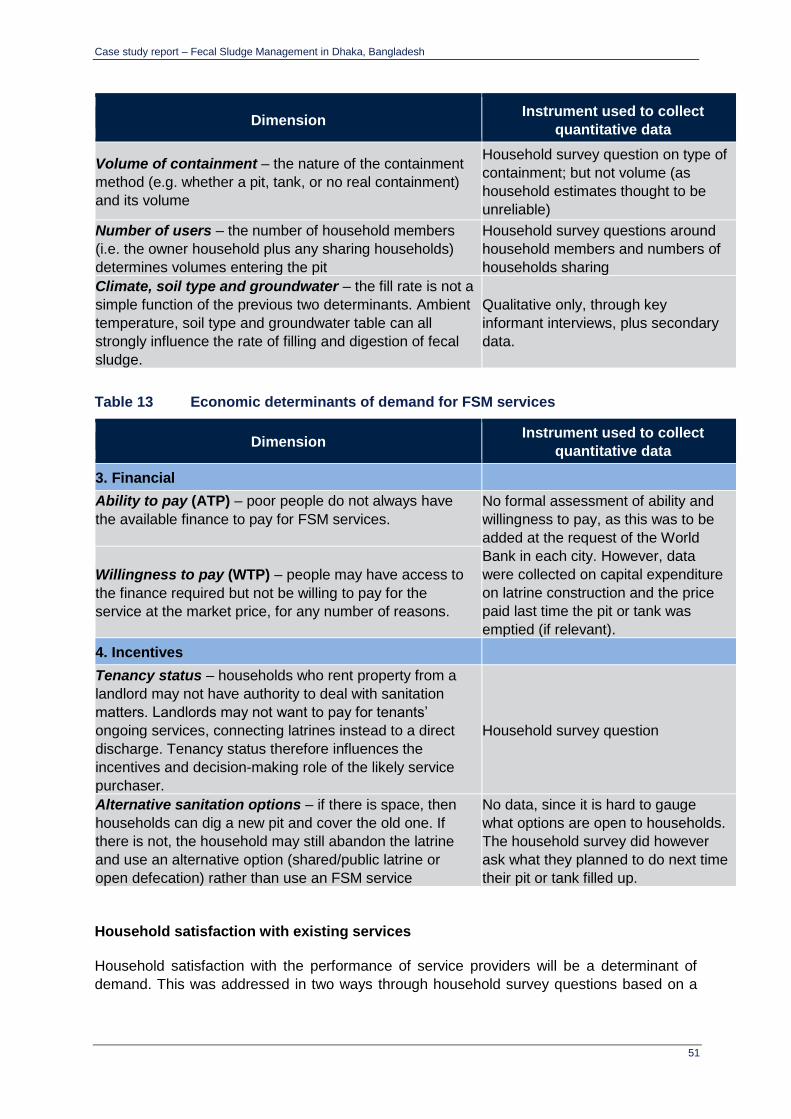
Case study report – Fecal Sludge Management in Dhaka, Bangladesh
51
Dimension Instrument used to collect
quantitative data
Volume of containment – the nature of the containment
method (e.g. whether a pit, tank, or no real containment)
and its volume
Household survey question on type of
containment; but not volume (as
household estimates thought to be
unreliable)
Number of users – the number of household members
(i.e. the owner household plus any sharing households)
determines volumes entering the pit
Household survey questions around
household members and numbers of
households sharing
Climate, soil type and groundwater – the fill rate is not a
simple function of the previous two determinants. Ambient
temperature, soil type and groundwater table can all
strongly influence the rate of filling and digestion of fecal
sludge.
Qualitative only, through key
informant interviews, plus secondary
data.
Table 13 Economic determinants of demand for FSM services
Dimension Instrument used to collect
quantitative data
3. Financial
Ability to pay (ATP) – poor people do not always have
the available finance to pay for FSM services.
No formal assessment of ability and
willingness to pay, as this was to be
added at the request of the World
Bank in each city. However, data
were collected on capital expenditure
on latrine construction and the price
paid last time the pit or tank was
emptied (if relevant).
Willingness to pay (WTP) – people may have access to
the finance required but not be willing to pay for the
service at the market price, for any number of reasons.
4. Incentives
Tenancy status – households who rent property from a
landlord may not have authority to deal with sanitation
matters. Landlords may not want to pay for tenants’
ongoing services, connecting latrines instead to a direct
discharge. Tenancy status therefore influences the
incentives and decision-making role of the likely service
purchaser.
Household survey question
Alternative sanitation options – if there is space, then
households can dig a new pit and cover the old one. If
there is not, the household may still abandon the latrine
and use an alternative option (shared/public latrine or
open defecation) rather than use an FSM service
No data, since it is hard to gauge
what options are open to households.
The household survey did however
ask what they planned to do next time
their pit or tank filled up.
Household satisfaction with existing services
Household satisfaction with the performance of service providers will be a determinant of
demand. This was addressed in two ways through household survey questions based on a
Case study report – Fecal Sludge Management in Dhaka, Bangladesh
52
four-point Likert scale.32 Firstly, households were asked to rate their satisfaction level with
various aspects of sanitation facilities used, including quality of construction, ease of access,
privacy and cleanliness. Secondly, households which had used an emptying service last time
their pit or tank had filled up, were asked to rate the service provider on price, overall service
quality, safety and ease of obtaining service.
Other barriers which households face in obtaining FSM services
Some reasons for a gap between potential and effective demand for FSM services in Dhaka
are already listed above (e.g. connecting outlets to drains, physical access to households and
willingness to pay). However, there are many other potential barriers which households may
face in securing FSM services (some of which are included in the economic and physical
determinants in the tables above).
There are further barriers to accessing services which it may not have been possible to predict
ex ante. These were therefore explored in qualitative research, particularly through Focus
Group Discussions with community members in slums areas. Several of the discussion
questions focused around perceptions and opinions of existing services, and what participants
would like to see in terms of improved services in the future. Discussions were semi-structured,
with participants able to discuss questions more openly, allowing further determinants of
demand not otherwise addressed in the household survey to be identified.
6.2.2 Supply
On the supply side, the research questions were around the current status and quality of FSM
service delivery. This was divided into assessments of physical capacity of service providers
(number of providers and the scale of service reach) and technical/institutional capacity (the
scope and quality of services). This is assessed along the sanitation service chain. All of these
factors were assessed mainly through Key Informant Interviews with service providers (SPs)
themselves, as carried out by local consultants contracted by WSP. The following areas were
to be covered:
Physical capacity
o Scale – number of SPs, their staffing capacity and areas they serve
o Turnover – monthly income/expenditure of SPs
o Clients – number of clients in past month
Technical/institutional capacity
o Formality – whether formal (i.e. licensed/registered) or informal
o Compliance – local regulations, or fines/persecution imposed
o Skills/equipment – types of skilled staff and equipment available
Much of this data came from the report submitted by the WSP consultant Mark Ellery. Answers
on all these dimensions were not always available or forthcoming.
32 Categories included “very satisfied”, “satisfied”, “dissatisfied” and “very dissatisfied”
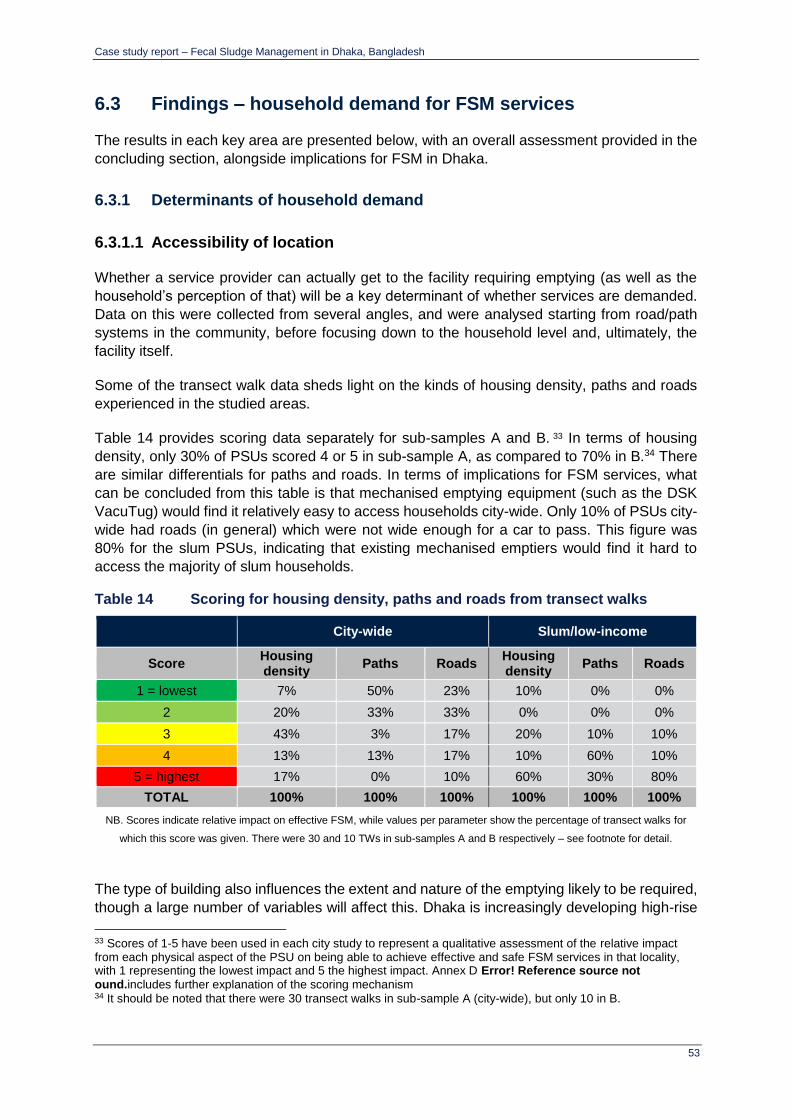
Case study report – Fecal Sludge Management in Dhaka, Bangladesh
53
6.3 Findings – household demand for FSM services
The results in each key area are presented below, with an overall assessment provided in the
concluding section, alongside implications for FSM in Dhaka.
6.3.1 Determinants of household demand
6.3.1.1 Accessibility of location
Whether a service provider can actually get to the facility requiring emptying (as well as the
household’s perception of that) will be a key determinant of whether services are demanded.
Data on this were collected from several angles, and were analysed starting from road/path
systems in the community, before focusing down to the household level and, ultimately, the
facility itself.
Some of the transect walk data sheds light on the kinds of housing density, paths and roads
experienced in the studied areas.
Table 14 provides scoring data separately for sub-samples A and B. 33 In terms of housing
density, only 30% of PSUs scored 4 or 5 in sub-sample A, as compared to 70% in B.34 There
are similar differentials for paths and roads. In terms of implications for FSM services, what
can be concluded from this table is that mechanised emptying equipment (such as the DSK
VacuTug) would find it relatively easy to access households city-wide. Only 10% of PSUs city-
wide had roads (in general) which were not wide enough for a car to pass. This figure was
80% for the slum PSUs, indicating that existing mechanised emptiers would find it hard to
access the majority of slum households.
Table 14 Scoring for housing density, paths and roads from transect walks
City-wide Slum/low-income
Score Housing density
Paths Roads Housing density
Paths Roads
1 = lowest 7% 50% 23% 10% 0% 0%
2 20% 33% 33% 0% 0% 0%
3 43% 3% 17% 20% 10% 10%
4 13% 13% 17% 10% 60% 10%
5 = highest 17% 0% 10% 60% 30% 80%
TOTAL 100% 100% 100% 100% 100% 100%
NB. Scores indicate relative impact on effective FSM, while values per parameter show the percentage of transect walks for
which this score was given. There were 30 and 10 TWs in sub-samples A and B respectively – see footnote for detail.
The type of building also influences the extent and nature of the emptying likely to be required,
though a large number of variables will affect this. Dhaka is increasingly developing high-rise
33 Scores of 1-5 have been used in each city study to represent a qualitative assessment of the relative impact from each physical aspect of the PSU on being able to achieve effective and safe FSM services in that locality, with 1 representing the lowest impact and 5 the highest impact. Annex D Error! Reference source not ound.includes further explanation of the scoring mechanism 34 It should be noted that there were 30 transect walks in sub-sample A (city-wide), but only 10 in B.

Case study report – Fecal Sludge Management in Dhaka, Bangladesh
54
buildings and, as Table 15 below shows, the majority of households city-wide (53%) live in
buildings of more than one storey, whereas this was only the case for 5% of households in the
slum sample. The nature of containment, and associated access to pits/tanks, is therefore
likely to be considerably different city-wide and in slums. In addition, the management of that
containment in a large building is likely to be different too. Accessibility to then pit/tank is only
tangentially related to this.
Table 15 Type of building occupied
City-wide Slums/poor areas
% No. of households % No. of households
Private residence (single storey) 22.5 81 51.7 186
Private residence (multi-storey) 25.3 91 1.9 7
Shared residence (single storey) 22.5 81 42.8 154
Shared residence (multi-storey) 27.8 100 3.3 12
Other 1.9 7 0.3 1
Total 100.0 360 100.0 360
Focusing on the toilet itself, Table 16 below shows the accessibility of the main pit/tank
structure, followed by the presence of a purpose-built hatch (as one would expect with a
correctly-constructed septic tank). Following the theme from the TW data, households in slum
areas were again harder to access at the household level, with “poor access” for 93% of
households (against 69% for the city-wide sample).35 With regard to the pit/tank having access
points or hatches to facilitate emptying, it was more common for city-wide households to have
one (31%) than in slum areas (5%).36
Table 16 Accessibility of toilet for emptying equipment
% of household latrines observed City-wide (%) Slums (%)
Access for mechanical emptying equipment
(1) Poor access (only manual possible) 69.4 93.1
(2) Reasonable access (small machines possible) 23.1 6.4
(3) Good access (large machines possible) 7.5 0.6
TOTAL 100 100
Access point/hatch for emptying
(1) Yes; purpose built hatch 30.6 4.7
(2) Yes; squatting plate must be removed 53.9 55.8
(3) No; slab must be broken for access 15.6 39.4
TOTAL 100 100
Overall, from the perspective of accessibility it is clear that city-wide, households and the
contents of their pits/tanks are far more accessible to formalised emptying services (i.e. beyond
using buckets and ropes) than in slum areas in particular. This is an unsurprising finding, but
35 This data comes from observations by our enumerators during the household survey. There were three categories: “Poor access, only accessible to hand-carried emptying equipment”, “Reasonable access for small (manual or mechanised) emptying equipment” and “Good access for medium/large size (mechanised) emptying equipment”. Definition of these categories was covered during the training. 36 This was also an observation. There is room for confusion between categories 2 and 3, so we would emphasise comparison between category 1 and and the total of the others.
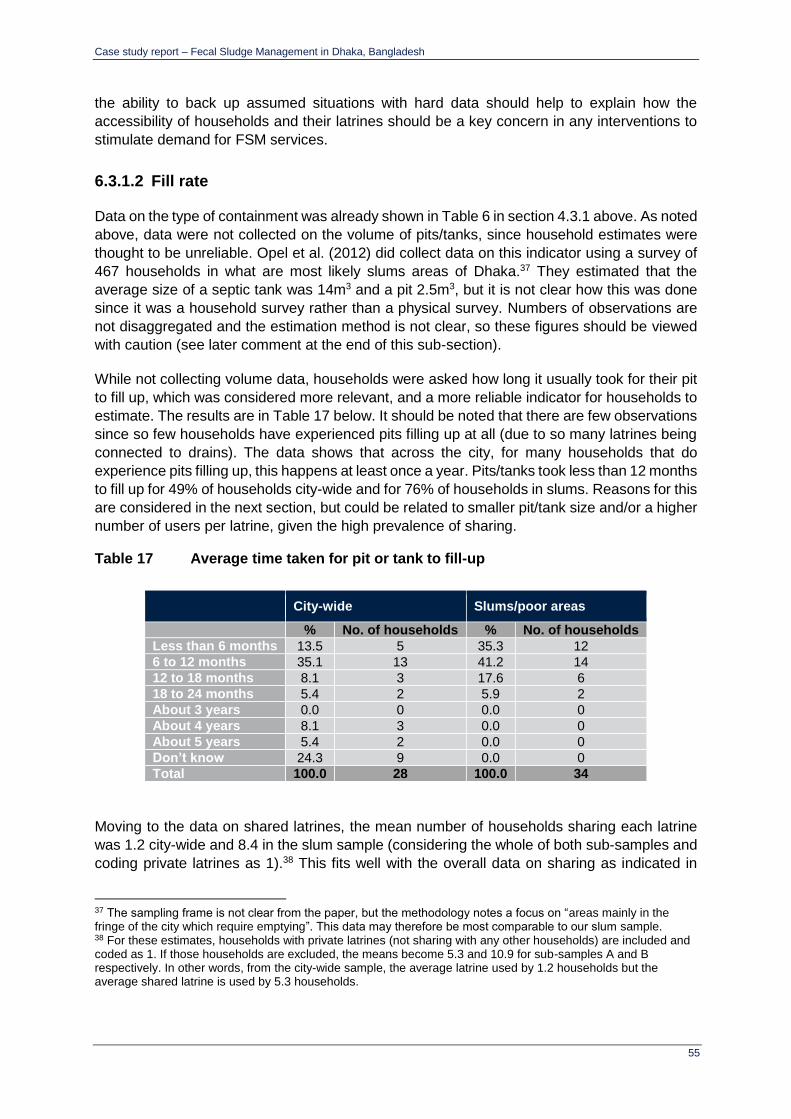
Case study report – Fecal Sludge Management in Dhaka, Bangladesh
55
the ability to back up assumed situations with hard data should help to explain how the
accessibility of households and their latrines should be a key concern in any interventions to
stimulate demand for FSM services.
6.3.1.2 Fill rate
Data on the type of containment was already shown in Table 6 in section 4.3.1 above. As noted
above, data were not collected on the volume of pits/tanks, since household estimates were
thought to be unreliable. Opel et al. (2012) did collect data on this indicator using a survey of
467 households in what are most likely slums areas of Dhaka.37 They estimated that the
average size of a septic tank was 14m3 and a pit 2.5m3, but it is not clear how this was done
since it was a household survey rather than a physical survey. Numbers of observations are
not disaggregated and the estimation method is not clear, so these figures should be viewed
with caution (see later comment at the end of this sub-section).
While not collecting volume data, households were asked how long it usually took for their pit
to fill up, which was considered more relevant, and a more reliable indicator for households to
estimate. The results are in Table 17 below. It should be noted that there are few observations
since so few households have experienced pits filling up at all (due to so many latrines being
connected to drains). The data shows that across the city, for many households that do
experience pits filling up, this happens at least once a year. Pits/tanks took less than 12 months
to fill up for 49% of households city-wide and for 76% of households in slums. Reasons for this
are considered in the next section, but could be related to smaller pit/tank size and/or a higher
number of users per latrine, given the high prevalence of sharing.
Table 17 Average time taken for pit or tank to fill-up
City-wide Slums/poor areas
% No. of households % No. of households
Less than 6 months 13.5 5 35.3 12
6 to 12 months 35.1 13 41.2 14
12 to 18 months 8.1 3 17.6 6
18 to 24 months 5.4 2 5.9 2
About 3 years 0.0 0 0.0 0
About 4 years 8.1 3 0.0 0
About 5 years 5.4 2 0.0 0
Don’t know 24.3 9 0.0 0
Total 100.0 28 100.0 34
Moving to the data on shared latrines, the mean number of households sharing each latrine
was 1.2 city-wide and 8.4 in the slum sample (considering the whole of both sub-samples and
coding private latrines as 1).38 This fits well with the overall data on sharing as indicated in
37 The sampling frame is not clear from the paper, but the methodology notes a focus on “areas mainly in the fringe of the city which require emptying”. This data may therefore be most comparable to our slum sample. 38 For these estimates, households with private latrines (not sharing with any other households) are included and coded as 1. If those households are excluded, the means become 5.3 and 10.9 for sub-samples A and B respectively. In other words, from the city-wide sample, the average latrine used by 1.2 households but the average shared latrine is used by 5.3 households.

Case study report – Fecal Sludge Management in Dhaka, Bangladesh
56
Table 5 in section 4.3.1. Where toilets are shared, it is worth considering the numbers of
people which were sharing in more detail, as is shown in Table 18 below.39 This comes directly
from data reported by households, as opposed to from estimations based on secondary data;
it should be noted that the average household size was 4.8 in both sub-samples
As can be seen, the majority of latrines in the city-wide sample were used by fewer than 6
people, since most households (78%) did not share their latrine with other households. In the
slum sample, however, 35% of households reported that the latrine that they use was shared
by more than 30 people (with only 9% sharing with 5 people or fewer). To some extent, this
can be explained by the use of public toilets. Relating this data to demand for FSM services,
we would expect the average latrine in Dhaka’s slums to fill up faster than the average latrine
city-wide, since more people use it, all things being equal. However, this does not account for
other factors relating to fill rates (e.g. size of pit/tank).
Table 18 Number of people using the same sanitation facility
City-wide Slums/poor areas
No. of people using the same facility % No. of households % No. of households
1 to 5 56.0 201 8.6 28
6 to 10 26.5 95 10.4 34
11 to 15 7.8 28 15.0 49
16 to 20 3.6 13 16.8 55
21 to 30 1.9 7 14.7 48
More than 30 4.2 15 34.6 113
Total 100.0 359 100.0 327
Returning to the figures from Opel et al (2012) on average septic tank / pit volumes and
assuming that these represent slum areas of Dhaka, then using these volumes and the values
from this study for average users of household / shared facilities in defined slum areas, it can
tentatively be concluded that septic tanks or pits would take somewhere between 10-20 years
to fill with fecal sludge. This assumes that septic tanks are generally used in shared facilities
with at least 20 users sharing and pits are used in households with at least 5 users sharing. It
also takes a conservative value for sludge accumulation of 40 litres/person/year40 for both
septic tanks and pit latrines and assumes that the systems are operating correctly, with final
effluent discharging to soakaways.
Where households have reported emptying their containment facility, the frequency of
emptying is much shorter (typically less than 12 months), highlighting that the effluent
discharge arrangement is not operating correctly, or does not exist. The removed contents
comprises the generated fecal sludge (i.e. including urine, water used for anal cleansing and
other liquids added to the pit such as wastewater, subtracting what infiltrates through the lining
of the pit or tank.)
Rapid filling is therefore likely to occur during times of heavy use of the facility, or where the
tank/pit cannot leach liquid into the surrounding ground, especially during the wet season and
when the ground is saturated. As shown in Table 18Table 17, pits/tanks filled up much faster
39 This data was asked directly in a survey question as a categorical variable for the categories shown: “How many people use this toilet regularly?” 40 These are common figures used for excreta sludge held in wet conditions – based on the gradual build-up (accumulation) of sludge, allowing for decomposition and compacting of the sludge, over time

Case study report – Fecal Sludge Management in Dhaka, Bangladesh
57
in slum areas. The dense soil conditions within Dhaka city are known to hinder effective
infiltration, this is not a surprising finding, but again points to reasons why people rely so much
on drains to frequently remove the majority of the content of their tanks/pits from their property,
without having to pay for regular emptying services.
6.3.1.3 Financial aspects
As noted above, collecting data on ATP and WTP was beyond the scope of what was
achievable rigorously in the questionnaire time available. However, data were collected on
the price paid the last time an FSM service was used, and whether households thought that
price was fair.
First though, it is worth briefly considering finance for containment. Households were asked
how much they spent (in cash) to build their toilet at the time when it was built (including
materials and labour), if they spent cash at all. For the city-wide sample this question was only
answered by those in higher wealth quintiles so the data is not that representative (mean is
$579, n=52). However, for the slum sample, the mean for an improved latrine was $153 (n=61)
and for an unimproved latrine was $19 (n=19).41 In terms of paying to use a toilet, this was
very uncommon. Only 3% of households in the slum sample reported paying to use their toilet,
and 0% in the city-wide sample. Finally, regarding repairs/maintenance to toilets in the past 12
months (including repairs to mechanism, superstructure, or drainage, as well as FSM emptying
services), the mean was $53 city-wide (n=42) and $33 in the slum sample (n=41).42
Overall, this data gives us a picture of city-wide households investing more in their latrine than
slum households, which is logical since their incomes are higher, amongst other reasons. In
addition, it shows that, while few people pay to use toilets, those that do have toilets are
investing significant amounts of money annually in their upkeep (while noting that only 11-12%
of households in each sub-sample reported having this expenditure in the last 12 months).
With regard to payment for FSM services the last time emptying took place, the mean amount
paid was $30 city-wide (n=26) and $13 in slums (n=28). 48% of households city-wide reported
that the price they paid was “too high”, with this rising to 64% for slum households. Almost all
households paid the full amount on delivery, and for both sub-samples three quarters of
households paid a flat rate, with the remaining quarter paying a volumetric charge.
6.3.1.4 Incentives
The incentives that drive demand for improved FSM services are influenced by who is
responsible for the ongoing maintenance to keep toilets functioning, including whether it is
shared or not. While the household survey shows that approximately 50% of households rent
their property, both at city-wide scale and in slum areas, management responsibility for toilet
facilities varies more significantly between the two sub-samples.
City-wide, 77% of households used a private household toilet (on plot), while in slum areas
this was 19% of households. However, only 26% of households city-wide and 41% of
41 Nb. we did not ask how long ago this was, so are unable to account for inflation and exchange rates, so the results are indicative only. We used the rate 1 BGD taka = 0.013 USD 42 Both city-wide and in slums, most households reported that this expenditure was mainly for repairs to the bowl/slab etc. or for drainage. Only c.20% in both sub-samples reported that the expense was for pit emptying.

Case study report – Fecal Sludge Management in Dhaka, Bangladesh
58
households in slums reported being responsible for managing their facility (assumed to be in
relation to maintenance and repair needs of physical components of the toilet itself as well as
the maintenance, repairs and emptying of what the toilet empties into – i.e. a septic tank or
pit). Landlords were reported to be responsible for managing toilets in 68% of cases city-wide,
which does not tally completely with only 50% renting, which may illustrate some confusion
over the definition of “landlord” in Bengali. Landlords and NGOs together managed 50% of
facilities in slums; 39% and 12% respectively. The confusion over landlords could be explained
by the high proportion of households being based in multi-storey buildings in sub-sample A
(see Table 15 above), whereby even if the flat is owned, FSM may still be perceived to be the
responsibility of the overall building owner/manager, or some kind of caretaker. This could
explain why such a high proportion of households city-wide use a private toilet (77%) but such
a low proportion reported being responsible themselves for managing it (26%).
From this it can be ascertained that, even where households use a private toilet within the
dwelling, city-wide they are less likely to be responsible for servicing that toilet and/or what it
is connected to (i.e. a septic tank or pit) than households in slum areas. With such a significant
percentage of facilities under the management responsibility of landlords/managers, it is clear
that they are a key stakeholder in decision-making around investments and plans to improve
infrastructure and FSM services to support ongoing functionality of toilets from a city-wide
perspective, as well as in slum areas.
Where households invest in a toilet facility, they are likely to have stronger incentives for seeing
this toilet continue to function. City-wide, 100% of facilities were reported as having an overall
durable structure (with cleanable slab, waterseal, roof and providing privacy). Of houses
owning toilets in the slum sample, almost 90% of households made a level of investment in
their own toilet. 52% in a durable toilet, with a further 16% having a non-durable superstructure
but a cleanable slab (with or without a water seal) and 21% a durable superstructure but with
a non-cleanable slab.43
6.3.2 Household satisfaction with current services
Households were asked to express their satisfaction with current services – both the sanitation
facility itself and the emptying services used – across a range of factors, as shown in the tables
following. City-wide, the vast majority (over 95% in all cases) reported being satisfied or very
satisfied with the sanitation facility, across all 4 categories of satisfaction. For slum areas the
emphasis shifted, with the majority being either satisfied (43-50%) or dissatisfied (35-43%)
across the 4 categories.
Table 19 Satisfaction with sanitation facility
a. City-wide
Very satisfied (%)
Satisfied (%)
Dissatisfied (%)
Very dissatisfied (%)
Total (%)
No. of households
43 Definitions used are: Very basic = Non-durable superstructure without water seal / cleanable slab; Basic = Durable superstructure without water seal / cleanable slab; Weak improved = Non-durable superstructure with cleanable slab / cleanable slab & water seal; Strong improved = Durable superstructure with cleanable slab, roof & privacy / same + water seal

Case study report – Fecal Sludge Management in Dhaka, Bangladesh
59
Quality of construction
15.8 81.7 2.5 0.0 100.0 360
Ease of access
17.5 78.9 3.6 0.0 100.0 360
Privacy 41.4 56.7 1.9 0.0 100.0 360
Cleanliness 32.8 65.6 1.7 0.0 100.0 360
b. Slums/poor areas
Very satisfied (%)
Satisfied (%)
Dissatisfied (%)
Very dissatisfied (%)
Total (%)
No. of households
Quality of construction
3.3 50.0 36.7 10.0 100.0 360
Ease of access 3.9 46.9 43.3 5.8 100.0 360
Privacy 15.8 45.0 35.3 3.9 100.0 360
Cleanliness 6.4 43.3 43.1 7.2 100.0 360
For households who reported using a service provider (8% city-wide and 10% in slum areas),
satisfaction levels for 3 of the 4 categories of service provision were similar between city-
wide and slum areas. The biggest difference in the sub-samples came in satisfaction for the
ease of obtaining services, with more households dissatisfied in slum areas. Price seems to
be the factor with the biggest dissatisfaction, across both sub-samples.
Table 20 Satisfaction with emptying service provider
a. City-wide
Very satisfied (%)
Satisfied (%)
Dissatisfied (%)
Very dissatisfied (%)
No. of households
Price 6.7 53.3 40.0 0.0 30
Service quality 3.3 83.3 13.3 0.0 30
Safety 3.3 80.0 16.7 0.0 30
Ease of obtaining service
0.0 80.0 20.0 0.0 30
b. Slums/poor areas
Very satisfied (%)
Satisfied (%)
Dissatisfied (%)
Very dissatisfied (%)
No. of households
Price 2.7 45.9 48.6 2.7 37
Service quality 0.0 83.8 16.2 0.0 37
Safety 5.4 81.1 13.5 0.0 37
Ease of obtaining service
2.7 59.5 32.4 5.4 37
Households in both city-wide and slum areas also identified their intended action once their pit/tank fills-up (whether it had filled-up previously or not) as per the table below. Less weight was placed on this data than the action after the pit last filled up, as it may not be carried out. Nonetheless, it does signal market intention in some sense. In addition, all households were

Case study report – Fecal Sludge Management in Dhaka, Bangladesh
60
permitted to answer (regardless of whether they had emptied in the past) as shown by the higher total respondents. As can be seen, manual emptying is the preferred option by a long margin in both sub-samples. It is intriguing that such a high proportion of households in slum areas planned to manually empty themselves. Unfortunately, the data do not shed light on the reasons for this stated preference, but it may be down to willingness and ability to pay. Table 21 Intended action after pit/tank fills-up
City-wide Slums/poor areas
% No. of households % No. of households
Empty by a household member 0.0 0 25.7 56
Empty by a manual emptier 93.4 285 72.9 159
Empty by a mechanical emptier 6.2 19 0.5 1
Cover and seal pit 0.0 0 0.9 2
Abandon toilet without covering 0.3 1 0 0
Total 100.0 305 100.0 218
6.3.3 Barriers faced by households in slum areas, in obtaining FSM services
Focus group discussions (FGDs) held in slum areas identified that the key barriers that
households face relate both to costs/affordability and awareness/information about (other)
available FSM services.
Families living in slums lack a reliable income as a result of working as day labourers and/or
being on very low incomes. Where households have hired the services of manual emptiers,
this can result in a trade-off with other significant household expenditure. During FGDs, two
individuals reported that these costs affected them being able to pay school fees or for
medicine, while other families in two communities were reported as having to borrow money
to pay the emptying charge.
Where shared latrines with septic tanks are used, people are more aware of the services
provided by mechanical emptiers, but in no case were these services reported as having been
used. In some cases because the tanks haven’t yet needed emptying (built within in the last 4
years), or the VacuTug can’t reach the facility. In no case did FGDs report people receiving
support for emptying services – either for household or shared toilets – with support only
extending to the construction of the toilets themselves. Households are generally not aware of
the actual costs of improving on current emptying services – i.e. changing from manual
emptying to mechanical emptying – but typically identified that the cost would be high.
Improving current emptying services was only seen as realistic in relation to shared latrines,
where costs could be shared between households.
6.4 Findings – supply of FSM services
As set out in section 6.2.2, the questions on the supply side related to the current status and
quality of FSM service delivery. This was divided into assessments of physical capacity of
service providers (number of providers and the scale of service reach) and
technical/institutional capacity (the scope and quality of services).
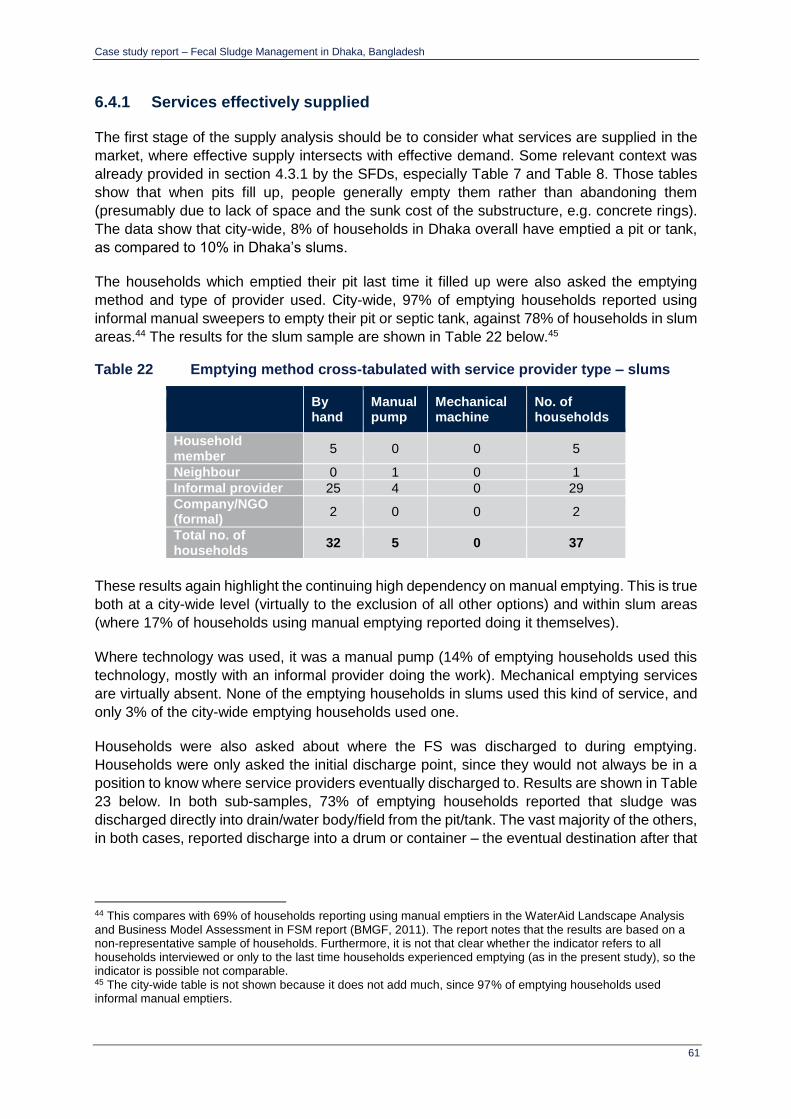
Case study report – Fecal Sludge Management in Dhaka, Bangladesh
61
6.4.1 Services effectively supplied
The first stage of the supply analysis should be to consider what services are supplied in the
market, where effective supply intersects with effective demand. Some relevant context was
already provided in section 4.3.1 by the SFDs, especially Table 7 and Table 8. Those tables
show that when pits fill up, people generally empty them rather than abandoning them
(presumably due to lack of space and the sunk cost of the substructure, e.g. concrete rings).
The data show that city-wide, 8% of households in Dhaka overall have emptied a pit or tank,
as compared to 10% in Dhaka’s slums.
The households which emptied their pit last time it filled up were also asked the emptying
method and type of provider used. City-wide, 97% of emptying households reported using
informal manual sweepers to empty their pit or septic tank, against 78% of households in slum
areas.44 The results for the slum sample are shown in Table 22 below.45
Table 22 Emptying method cross-tabulated with service provider type – slums
By hand
Manual pump
Mechanical machine
No. of households
Household member
5 0 0 5
Neighbour 0 1 0 1
Informal provider 25 4 0 29
Company/NGO (formal)
2 0 0 2
Total no. of households
32 5 0 37
These results again highlight the continuing high dependency on manual emptying. This is true
both at a city-wide level (virtually to the exclusion of all other options) and within slum areas
(where 17% of households using manual emptying reported doing it themselves).
Where technology was used, it was a manual pump (14% of emptying households used this
technology, mostly with an informal provider doing the work). Mechanical emptying services
are virtually absent. None of the emptying households in slums used this kind of service, and
only 3% of the city-wide emptying households used one.
Households were also asked about where the FS was discharged to during emptying.
Households were only asked the initial discharge point, since they would not always be in a
position to know where service providers eventually discharged to. Results are shown in Table
23 below. In both sub-samples, 73% of emptying households reported that sludge was
discharged directly into drain/water body/field from the pit/tank. The vast majority of the others,
in both cases, reported discharge into a drum or container – the eventual destination after that
44 This compares with 69% of households reporting using manual emptiers in the WaterAid Landscape Analysis and Business Model Assessment in FSM report (BMGF, 2011). The report notes that the results are based on a non-representative sample of households. Furthermore, it is not that clear whether the indicator refers to all households interviewed or only to the last time households experienced emptying (as in the present study), so the indicator is possible not comparable. 45 The city-wide table is not shown because it does not add much, since 97% of emptying households used informal manual emptiers.
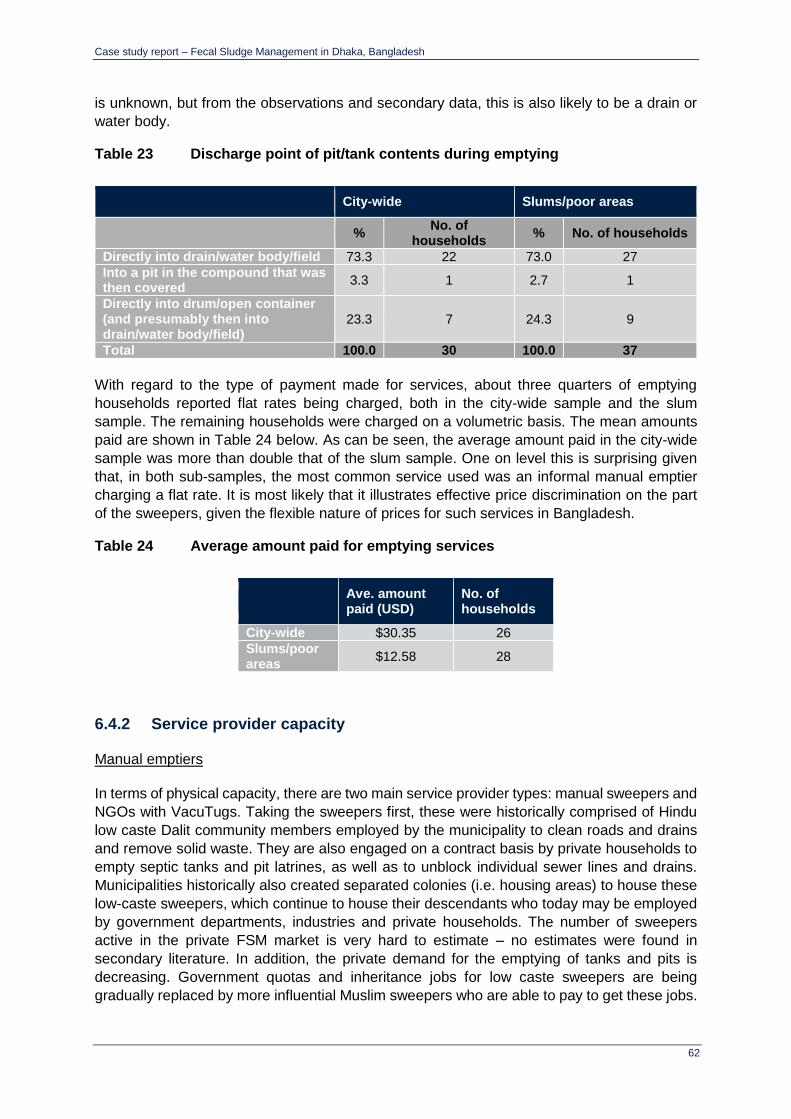
Case study report – Fecal Sludge Management in Dhaka, Bangladesh
62
is unknown, but from the observations and secondary data, this is also likely to be a drain or
water body.
Table 23 Discharge point of pit/tank contents during emptying
City-wide Slums/poor areas
% No. of
households % No. of households
Directly into drain/water body/field 73.3 22 73.0 27
Into a pit in the compound that was then covered
3.3 1 2.7 1
Directly into drum/open container (and presumably then into drain/water body/field)
23.3 7 24.3 9
Total 100.0 30 100.0 37
With regard to the type of payment made for services, about three quarters of emptying
households reported flat rates being charged, both in the city-wide sample and the slum
sample. The remaining households were charged on a volumetric basis. The mean amounts
paid are shown in Table 24 below. As can be seen, the average amount paid in the city-wide
sample was more than double that of the slum sample. One on level this is surprising given
that, in both sub-samples, the most common service used was an informal manual emptier
charging a flat rate. It is most likely that it illustrates effective price discrimination on the part
of the sweepers, given the flexible nature of prices for such services in Bangladesh.
Table 24 Average amount paid for emptying services
Ave. amount paid (USD)
No. of households
City-wide $30.35 26
Slums/poor areas
$12.58 28
6.4.2 Service provider capacity
Manual emptiers
In terms of physical capacity, there are two main service provider types: manual sweepers and
NGOs with VacuTugs. Taking the sweepers first, these were historically comprised of Hindu
low caste Dalit community members employed by the municipality to clean roads and drains
and remove solid waste. They are also engaged on a contract basis by private households to
empty septic tanks and pit latrines, as well as to unblock individual sewer lines and drains.
Municipalities historically also created separated colonies (i.e. housing areas) to house these
low-caste sweepers, which continue to house their descendants who today may be employed
by government departments, industries and private households. The number of sweepers
active in the private FSM market is very hard to estimate – no estimates were found in
secondary literature. In addition, the private demand for the emptying of tanks and pits is
decreasing. Government quotas and inheritance jobs for low caste sweepers are being
gradually replaced by more influential Muslim sweepers who are able to pay to get these jobs.
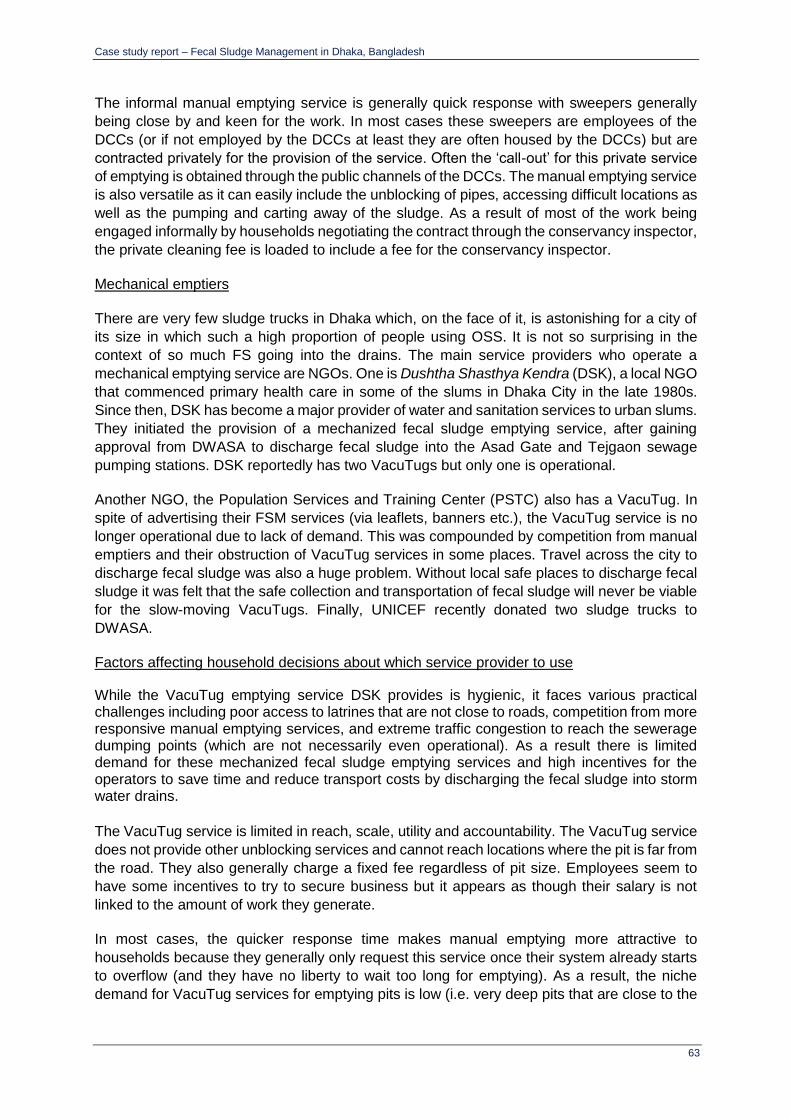
Case study report – Fecal Sludge Management in Dhaka, Bangladesh
63
The informal manual emptying service is generally quick response with sweepers generally
being close by and keen for the work. In most cases these sweepers are employees of the
DCCs (or if not employed by the DCCs at least they are often housed by the DCCs) but are
contracted privately for the provision of the service. Often the ‘call-out’ for this private service
of emptying is obtained through the public channels of the DCCs. The manual emptying service
is also versatile as it can easily include the unblocking of pipes, accessing difficult locations as
well as the pumping and carting away of the sludge. As a result of most of the work being
engaged informally by households negotiating the contract through the conservancy inspector,
the private cleaning fee is loaded to include a fee for the conservancy inspector.
Mechanical emptiers
There are very few sludge trucks in Dhaka which, on the face of it, is astonishing for a city of
its size in which such a high proportion of people using OSS. It is not so surprising in the
context of so much FS going into the drains. The main service providers who operate a
mechanical emptying service are NGOs. One is Dushtha Shasthya Kendra (DSK), a local NGO
that commenced primary health care in some of the slums in Dhaka City in the late 1980s.
Since then, DSK has become a major provider of water and sanitation services to urban slums.
They initiated the provision of a mechanized fecal sludge emptying service, after gaining
approval from DWASA to discharge fecal sludge into the Asad Gate and Tejgaon sewage
pumping stations. DSK reportedly has two VacuTugs but only one is operational.
Another NGO, the Population Services and Training Center (PSTC) also has a VacuTug. In
spite of advertising their FSM services (via leaflets, banners etc.), the VacuTug service is no
longer operational due to lack of demand. This was compounded by competition from manual
emptiers and their obstruction of VacuTug services in some places. Travel across the city to
discharge fecal sludge was also a huge problem. Without local safe places to discharge fecal
sludge it was felt that the safe collection and transportation of fecal sludge will never be viable
for the slow-moving VacuTugs. Finally, UNICEF recently donated two sludge trucks to
DWASA.
Factors affecting household decisions about which service provider to use
While the VacuTug emptying service DSK provides is hygienic, it faces various practical challenges including poor access to latrines that are not close to roads, competition from more responsive manual emptying services, and extreme traffic congestion to reach the sewerage dumping points (which are not necessarily even operational). As a result there is limited demand for these mechanized fecal sludge emptying services and high incentives for the operators to save time and reduce transport costs by discharging the fecal sludge into storm water drains.
The VacuTug service is limited in reach, scale, utility and accountability. The VacuTug service
does not provide other unblocking services and cannot reach locations where the pit is far from
the road. They also generally charge a fixed fee regardless of pit size. Employees seem to
have some incentives to try to secure business but it appears as though their salary is not
linked to the amount of work they generate.
In most cases, the quicker response time makes manual emptying more attractive to
households because they generally only request this service once their system already starts
to overflow (and they have no liberty to wait too long for emptying). As a result, the niche
demand for VacuTug services for emptying pits is low (i.e. very deep pits that are close to the

Case study report – Fecal Sludge Management in Dhaka, Bangladesh
64
road). Price is probably not the key driver. A WaterAid study on reasons for choosing manual
emptying across three different cities found that found less than a quarter of households chose
manual emptying because of the lower price compared with mechanical emptying (Opel et al.
2012). The main driver for households in choosing informal manual emptiers over formal
mechanical emptiers was the relative ease of accessing the manual emptiers with their
flexibility for attending call-outs at any time of day and night also being a significant factor.

Case study report – Fecal Sludge Management in Dhaka, Bangladesh
65
7 Fecal Sludge Reuse Options
7.1 Fecal sludge characteristics
All of the samples of fecal sludge removed from on-site sanitation facilities in Dhaka were very
liquid, and could flow easily. The fluid nature of the wastes made it possible to empty pits and
tanks either manually (using buckets) or mechanically (using suction tankers). Suction tankers
were able to use pipes of approximately 100 mm diameter without any problems, because the
sludge behaved as a free-flowing liquid.
Samples of fecal sludge were collected from five districts within Dhaka for laboratory analysis,
with samples from each district being taken from latrines and tanks during both emptying and
discharge. Samples taken from tankers during discharge may have included fecal sludge from
more than one latrine. Results of the laboratory analyses are summarised in Table 8.1 below.
Numbers of bacteria were high, as was to be expected. Two different media were used for
culturing E. Coli bacteria; the media being MFC (Membrane Fecal Coliform Agar) and EMB
(Eosin Methylene Blue Agar). Both media gave broadly similar results, although bacterial
counts using the MFC medium were consistently slightly higher than those using EMB medium.
Helminth egg numbers were much lower than expected, with a maximum count of 781 eggs/L,
compared to counts of approximately 4000 eggs/L reported from other cities.
Most of the other parameters measured were also low, with COD and BOD values indicating
very weak waste strengths. These values, together with the very liquid consistency of the fecal
sludge, imply that the fecal sludge samples were very dilute, containing high proportions of
water. The COD:BOD ratios were within the range from 2.01 to 2.54, suggesting that the
wastes are predominantly organic, from domestic sources and relatively fresh. The measured
nutrient contents (Nitrogen and Phosphorus) were variable.
7.2 Current treatment and reuse, and possible future options
At present there are no systems in place for promoting better standards for fecal sludge
treatment and reuse within Dhaka, and no formal reuse arrangements exist. Some research
has been undertaken to assess the possibility of reusing fecal sludge for agriculture (rice and
vegetable crops) in Bangladesh (Dey, 2015) although detailed results have not yet been
published. By-laws promote and encourage containment of fecal sludge, but most septic tanks
and leach pits discharge directly to storm water drains, so wastes are not contained. There is
no likelihood of wastes being collected, treated and re used in the foreseeable future because
the wastes are not contained effectively, and there are no clear incentives for anyone to
improve fecal sludge service quality standards.
Currently there is one wastewater treatment plant (at Pagla), which does not function
efficiently. Pagla STP is located on a 110.5 ha site to the south east of Dhaka City,
approximately 8 km from the city centre. The Master Plan quotes a design capacity for Pagla
STP of 96,000 m3/day, and 120,000 m3/day at peak flow rate. This treatment plant does not
currently treat fecal sludge, although there are plans within the DWASA Master Plan for a
possible future upgrade of the Pagla treatment plant to include septic tank sludge
management. The Master Plan states that Pagla has sludge drying ponds, and land available
for sludge drying and disposal facilities on-site. It also states that Pagla is conveniently close

Case study report – Fecal Sludge Management in Dhaka, Bangladesh
66
to rural and agricultural areas where sludge may be re-used, and that trials could also be
conducted into effluent re-use in nearby agricultural areas.
Although analyses of fecal sludge samples suggested that the wastes are predominantly
organic, it has been noted that sludge samples collected from open storm water drains
contained fecal sludge, sand and industrial pollutants. The presence of industrial chemicals
limits the opportunities for reuse of sludge taken from the drains, and reuse of this sludge
should be discouraged.
The fecal sludge characteristics show the wastes to be very liquid, very dilute, and very weak.
These characteristics suggest that the fecal sludge may be too weak or dilute to be of much
value for any type of beneficial re-use. However, it was a very small sample (n=5), and the
Master Plan recommends pilot tests for re-use of sludge as an agricultural fertiliser, and
effluent re-use in nearby agricultural areas.
Table 25 Fecal sludge characteristics from five districts of Dhaka.
Parameter Range of values
(Manual emptying) Range of values
(Mechanical emptying) Comparative
septage values *
E.coli (MFC media) (cfu/100 mL)
1.6 × 10⁴ to 6.4 × 10⁴ 6.1 × 10³ to 8.0 × 10³
E coli (EMB media) (cfu/100 mL)
1.4 × 10⁴ to 4.2 × 10⁴ 1.8 × 10⁴ to 5.4 × 10⁴
Total helminth eggs (No/L)
267 to 781 408 to 562 4,000
Total solids (mg/L) 19,420 to 57,272 12,778 to 72,694 30,000 (< 3%)
Suspended solids (mg/L)
17,868 to 55,484 10,852 to 70,896 7,000
COD (mg/L) 300 to 672 480 to 678 < 10,000
BOD (mg/L) 118 to 306 266 to 447
COD:BOD ratio 2.01 to 2.54 1.65 to 1.93 5 to 10
NH4 – nitrogen (mg/L) 20 to 1,100 130 to 1,900 < 1,000
Total nitrogen (mg/L) 30 to 10,700 200 to 1,400
Total Phosphorus (mg/L)
170 to 900 120 to 200
* Ingallinella et al, 2002
7.2.1 Treatment
The Master Plan for Dhaka states that the treatment facilities at Pagla WTP consist of
sedimentation tanks, facultative ponds and disinfection, although the sedimentation tanks do
not collect and remove sludge, sludge has accumulated in the facultative ponds, and the
disinfection stage does not function. Pagla also has sludge lagoons, but no facilities for
treatment or disposal of sludge from septic tanks.
It is estimated in the Master Plan that approximately 30% of the population is potentially served
by the sewerage system, with only 20% having connections to the sewers. Several sewers
and manholes have become blocked and fallen into disrepair. Sewage that should flow to
Pagla from some parts of the city for treatment is therefore currently discharged, untreated,
into storm water drains and nearby lakes. In the Master Plan it is estimated that flows entering
Pagla STP are within the range 30,000 to 40,000 m3/day. As Pagla STP has a design capacity
Case study report – Fecal Sludge Management in Dhaka, Bangladesh
67
of 96,000 m3/day, the estimated flows into Pagla STW imply that it is significantly under-loaded,
and that it could achieve good quality treatment. However, the effluent quality does not
currently meet the effluent standard for BOD5.
Calculations carried out by WSP’s short term consultant (Mark Ellery) suggest that only 1.2%
of wastewater entering the system is actually treated at the WWTP, which is down to leakage
(from people cross-connecting to drains and poor O&M) and poor treatment for the wastewater
which does eventually make it to the WWTP. He measured capacity throughput at the outlet
weir of 250 l/s (which implies 22 MLD entering the plant).46 Because many of the processes
require some manual oversight he assumed 8 hours per day of operation, and 50% efficiency
based on general observations at the WWTP. This implies about 3.6 MLD is actually treated
by the WWTP. With an assumption of 118 litres per capita per day of wastewater generated,
and about 2.75m people connected, that implies 325 MLD entering the system. Overall then,
only about 1.2% of wastewater entering the sewerage system is effectively treated.
46 However, the WWTP had only been turned just before the team’s arrival (scum on the top of the clarifiers had not been collected by the rotating arm and there were septic bubbles rising from the sludge).
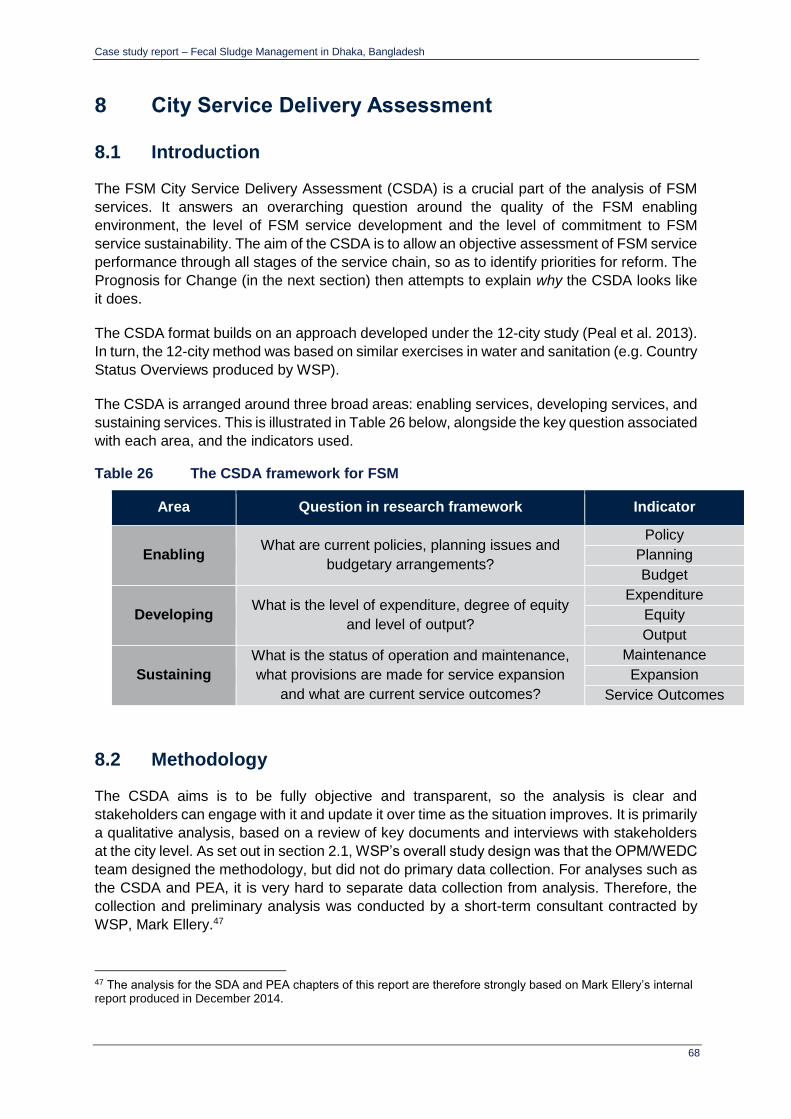
Case study report – Fecal Sludge Management in Dhaka, Bangladesh
68
8 City Service Delivery Assessment
8.1 Introduction
The FSM City Service Delivery Assessment (CSDA) is a crucial part of the analysis of FSM
services. It answers an overarching question around the quality of the FSM enabling
environment, the level of FSM service development and the level of commitment to FSM
service sustainability. The aim of the CSDA is to allow an objective assessment of FSM service
performance through all stages of the service chain, so as to identify priorities for reform. The
Prognosis for Change (in the next section) then attempts to explain why the CSDA looks like
it does.
The CSDA format builds on an approach developed under the 12-city study (Peal et al. 2013).
In turn, the 12-city method was based on similar exercises in water and sanitation (e.g. Country
Status Overviews produced by WSP).
The CSDA is arranged around three broad areas: enabling services, developing services, and
sustaining services. This is illustrated in Table 26 below, alongside the key question associated
with each area, and the indicators used.
Table 26 The CSDA framework for FSM
Area Question in research framework Indicator
Enabling What are current policies, planning issues and
budgetary arrangements?
Policy
Planning
Budget
Developing What is the level of expenditure, degree of equity
and level of output?
Expenditure
Equity
Output
Sustaining
What is the status of operation and maintenance,
what provisions are made for service expansion
and what are current service outcomes?
Maintenance
Expansion
Service Outcomes
8.2 Methodology
The CSDA aims is to be fully objective and transparent, so the analysis is clear and
stakeholders can engage with it and update it over time as the situation improves. It is primarily
a qualitative analysis, based on a review of key documents and interviews with stakeholders
at the city level. As set out in section 2.1, WSP’s overall study design was that the OPM/WEDC
team designed the methodology, but did not do primary data collection. For analyses such as
the CSDA and PEA, it is very hard to separate data collection from analysis. Therefore, the
collection and preliminary analysis was conducted by a short-term consultant contracted by
WSP, Mark Ellery.47
47 The analysis for the SDA and PEA chapters of this report are therefore strongly based on Mark Ellery’s internal report produced in December 2014.
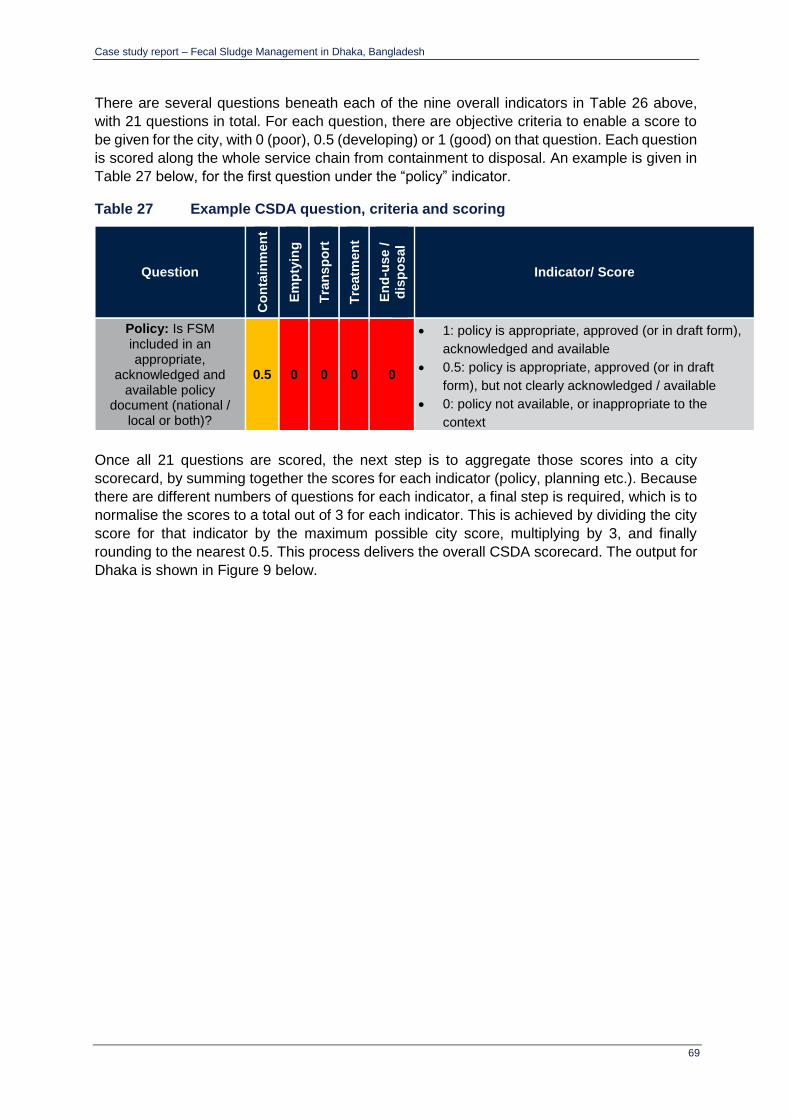
Case study report – Fecal Sludge Management in Dhaka, Bangladesh
69
There are several questions beneath each of the nine overall indicators in Table 26 above,
with 21 questions in total. For each question, there are objective criteria to enable a score to
be given for the city, with 0 (poor), 0.5 (developing) or 1 (good) on that question. Each question
is scored along the whole service chain from containment to disposal. An example is given in
Table 27 below, for the first question under the “policy” indicator.
Table 27 Example CSDA question, criteria and scoring
Question C
on
tain
men
t
Em
pty
ing
Tra
nsp
ort
Tre
atm
en
t
En
d-u
se /
dis
po
sal
Indicator/ Score
Policy: Is FSM included in an appropriate,
acknowledged and available policy
document (national / local or both)?
0.5 0 0 0 0
1: policy is appropriate, approved (or in draft form),
acknowledged and available
0.5: policy is appropriate, approved (or in draft
form), but not clearly acknowledged / available
0: policy not available, or inappropriate to the
context
Once all 21 questions are scored, the next step is to aggregate those scores into a city
scorecard, by summing together the scores for each indicator (policy, planning etc.). Because
there are different numbers of questions for each indicator, a final step is required, which is to
normalise the scores to a total out of 3 for each indicator. This is achieved by dividing the city
score for that indicator by the maximum possible city score, multiplying by 3, and finally
rounding to the nearest 0.5. This process delivers the overall CSDA scorecard. The output for
Dhaka is shown in Figure 9 below.
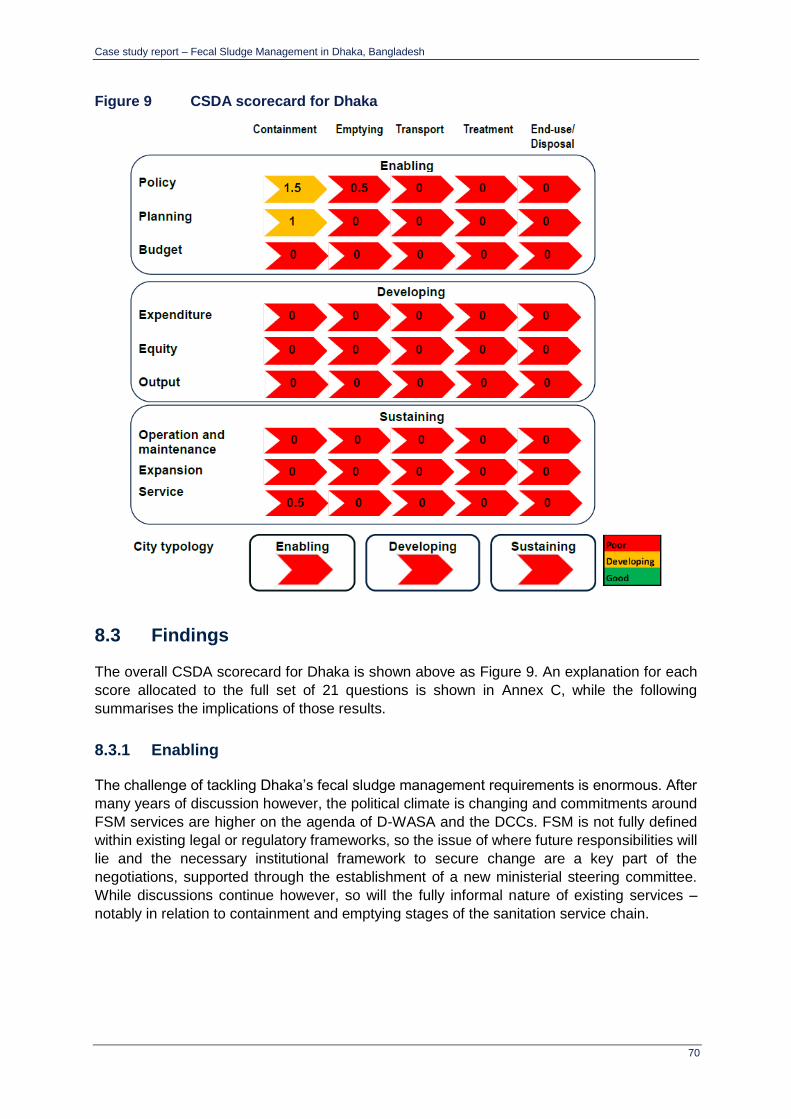
Case study report – Fecal Sludge Management in Dhaka, Bangladesh
70
Figure 9 CSDA scorecard for Dhaka
8.3 Findings
The overall CSDA scorecard for Dhaka is shown above as Figure 9. An explanation for each
score allocated to the full set of 21 questions is shown in Annex C, while the following
summarises the implications of those results.
8.3.1 Enabling
The challenge of tackling Dhaka’s fecal sludge management requirements is enormous. After
many years of discussion however, the political climate is changing and commitments around
FSM services are higher on the agenda of D-WASA and the DCCs. FSM is not fully defined
within existing legal or regulatory frameworks, so the issue of where future responsibilities will
lie and the necessary institutional framework to secure change are a key part of the
negotiations, supported through the establishment of a new ministerial steering committee.
While discussions continue however, so will the fully informal nature of existing services –
notably in relation to containment and emptying stages of the sanitation service chain.

Case study report – Fecal Sludge Management in Dhaka, Bangladesh
71
Households and landlords throughout Dhaka have made significant investments in
containment facilities so that use of sanitary latrines is at 95%.48 Such investments overcome
the problem of localised fecal contamination through open defecation, as a short-term
response to the national target to “contain feces”. However, given the fact that so many latrines
are connected to drains (directly or indirectly) such changes have simply shifted the problem
of managing fecal waste away from homes and local neighbourhoods, via drains, into a
broader challenge of addressing pollution of public spaces and waterbodies. Like international
targets, the national target itself does not address either the quality of containment, or post-
containment stages of the service chain until effluent discharge. There has been little notable
public investment in Dhaka, in regard to strengthening stages of the service chain,
accountability mechanisms or a legal and regulatory framework. The challenge for both public
and private service providers in particular is ensuring adequate institutional capacity and
resources to improve on the availability of affordable containment and emptying arrangements,
while connecting household discharges to something other than drains that will eventually
eliminate both public and environmental risk through establishing a fully-functioning service
chain.
8.3.2 Developing
There is currently no identifiable public expenditure in FS infrastructure or services, with the
result that the availability of appropriate, affordable and safe services to the city population is
almost non-existent. This is notable especially in relation to the standards of containment and
emptying facilities for the urban poor, but affects all of the city’s population through the
ineffective transport and disposal stages of the service chain. Any future application of
subsidies or taxes would need to ensure adequate funds are reinvested into low income areas
to address the problem.
Property owners of new developments across the city easily find ways to side-step the building
codes and challenges found to be associated with them (such as dense soil or restricted land
area making soak pits unrealistic, or connections to sewer lines frequently being blocked).
Connecting to existing storm water drains is increasing the practice of shifting fecal waste out
of local areas, at the expense of contaminating public spaces and the wider environment.
Households living in the ever-increasing number of multi-occupancy dwellings are not
responsible for such decisions, which are taken by the landlords/managers of such dwellings,
and will often have no knowledge of the actual infrastructure, operation and maintenance
requirements beyond their latrine.
8.3.3 Sustaining
Operation and maintenance costs for FS services are primarily carried by households through
their investment in self-financed sanitation infrastructure and paying for any informal emptying
services. There are no government-provided services and only limited provision by civil society
of public latrine blocks – and even then maintenance and emptying of shared facilities falls to
the users. Any public costs are negative and externalised as city-wide environmental health
degradation and localised public-health risks resulting from incidents such as flooding, drain
blockages and unsafe emptying procedures. The non-enforcement of building codes is
48 In slum areas, this “investment” may be in terms of using shared latrines – often shared with significant numbers of other users. This externalises costs for individuals, notably in relation to time spent using these facilities.
Case study report – Fecal Sludge Management in Dhaka, Bangladesh
72
resulting in existing sewered facilities being cross-connected to drains, or newly built facilities
directly connecting to storm drains, to overcome problems of frequent sewer blockages. Public
statements obliging households to build septic tanks and soak pits, in the absence of broader
improvements to ensure functionality of connected services, will continue to be unsuccessful.
Current service outcomes, representing the city as a whole and for slum areas only, are shown
in Section 4.3 as Figure 5 and Figure 6 respectively. These clearly demonstrate the extreme
lack of effective management of fecal waste through all stages of the service chain. The result
is public health risks for those affected by flooding, blocked drains and poorly managed
emptying services (notably the urban poor), but also environmental contamination affecting all
areas of the city.
8.3.4 Implications of the CSDA scorecard
The resulting CSDA scorecard of the FSM service delivery assessment in Figure 9 reveals a
complete absence of public policy, capital investment and operational oversight of FSM. This
has resulted in a situation where the majority of fecal waste is discharged to existing storm
water drains.
This current practice provides a relatively ‘desirable’ option for householders, landlords and
developers, as it removes the effort and financial cost of periodic maintenance and emptying
correctly built septic tanks and pits, to keep them functioning. It does however place significant
challenges for finding solutions. With no public investment in FSM services, the informality of
unregulated private provision is set to continue. This can only change when any newly adopted
FSM Framework translates into clearly defined, capacitated and financed action, with the aim
of providing a fully-functioning service chain for all of Dhaka’s fecal waste flows. This will
require recognition, dialogue and engagement of public, private and civil society bodies to
ensure appropriate infrastructure and services can be systematically developed and adapted
to respond to the various contextual challenges of the city (space, tenancy, flooding, poverty,
etc.). Any increasing formality of the dominant informal nature of FS services may need to
focus on opportunities in the transport, conveyance and end-use stages of the service chain –
before tackling the containment and emptying stages.
All of this suggests that bringing change to fecal sludge management practices in Dhaka will
demand significant reform of the regulatory systems that currently govern all stages of the
service chain. In the context of the general failure of existing regulatory systems, clearly
segregating the roles for regulation of failure by central government, from that of licensing of
compliance by local governments, from that of service management by providers, may improve
the incentives for overall compliance and investment.
Case study report – Fecal Sludge Management in Dhaka, Bangladesh
73
9 Prognosis for Change
9.1 Introduction
This chapter provides a Prognosis for Change (PFC), by considering the positions of various
stakeholders, in particular the institutions and incentives at play. In the sanitation sector, key
studies considering these questions include a multi-country study carried out by WSP with
OPM (WSP, 2010) and a series of papers by the Overseas Development Institute (ODI, 2013).
In addition, SANDEC’s recent FSM book includes a chapter on stakeholder analysis, which is
a key methodology in this kind of analysis (Strande et al., 2014). Through this Prognosis for
Change (PFC), it is intended to understand three things, which are worth briefly outlining.
Firstly, a PFC considers how “institutions” function. Here, institutions are defined as “the rules
and norms governing human interaction”, rather than a narrower definition of organisations.
Institutions can be formal, such as codified laws – one example in FSM might be a by-law
about where FS can be legally dumped. More importantly, institutions also can be informal,
such as social norms. For example, prevailing attitudes towards reusing FS in agriculture are
an informal institution.
Secondly, a PFC considers the incentives which institutions provide to stakeholders. A
stakeholder is any individual or group with an interest in the outcome of a policy. In FSM, some
examples of relevant stakeholders may include (but are certainly not limited to) sludge truck
companies, the City Council, or slum-dwellers. Stakeholders can be defined broadly or
narrowly as required by the breadth and depth of the analysis. For example, the earlier three
stakeholder examples could be narrowed to recent entrants to sludge truck market, the
planning department of the city council, or female slum-dwellers. This would allow more
nuanced analysis rather than taking whole organisations as homogenous.
Finally, a PFC considers how stakeholders exert influence. Here, influence is defined as the
formal or informal power to cause something or to prevent it from happening. In FSM, it might
be worth considering city council by-laws on FS. A city council may have formal legal power,
but if all their by-laws are openly flouted by service providers without fear of punishment, then
their influence is very low by that measure. However, they may have informal power to
influence FSM in other ways, for example in the ways their employees act when they find a
blocked sewer pipe.
In addition, in order to be practically useful, a PFC should also consider the implications of the
findings for effective engagement in a reform or change process. This involves an assessment
of the options for engagement, and weighing them up in the context of the prevalent power
dynamics and the likely response of stakeholders.
Methodology
In this study, developing a PFC was only one concern alongside a large number of other
research priorities, as set out in Table 1 near the beginning of the report, which lists all the
project components. There was therefore a balance to be struck. The approach in this broad
study was to link a focused PFC closely to the service delivery assessment (see section 8
above). The aim is therefore to explain why the SDA is as it is – in other words, to explore why
Case study report – Fecal Sludge Management in Dhaka, Bangladesh
74
the service delivery blockages exist, and what entry points are available to stakeholders to try
and resolve them.
Undertaking a PFC is a primarily qualitative exercise. It relies on targeted interviews or focus
groups with stakeholders, alongside secondary data in the form of key sector documents,
reports and studies. As noted in section 8.2 for the SDA methodology, the OPM/WEDC team
did not conduct primary data collection and preliminary analysis under this project, which was
done by other people contracted by the World Bank. Interview notes and reports from other
consultants were primarily used to construct this PFC. In order to keep the length of this report
manageable, only a brief summary of the full analysis conducted by the team is provided in
this section.
Developoing a PFC requires a structure in order to be clearly analysed and communicated.
There are a bewildering number of tools available, which can be applied to particular questions
so as to explore some of the issues described above. Many tools which are commonly used,
including in this study, are contained in a sourcebook which OPM produced for the Wold Bank
(Holland, 2007).. Rather than take up more space with explanation here, it is better to go
straight into the findings. Briefly, however, the main tools used include stakeholder mapping,
process mapping and stakeholder analysis.
Findings
Dhaka’s FSM context
As noted above, the main objective is to explore why the SDA results are as they are. For
Dhaka, the SDA is almost entirely red (i.e. “poor” scores), albeit with some orange
(“developing”) scores for policy and planning around the containment stage of the chain.
Scores for the rest of the chain are universally zero except for policy around emptying, where
the score of 0.5 is only given because D-WASA has given two NGOs permission to discharge
VacuTug contents into the intakes of two of their 30 sewage pump stations. Overall then, the
job of the PFC in the Dhaka context is to try and explain “why is nothing happening on FSM”
and what is the prognosis for change?
At this stage, it is worth reconsidering Dhaka’s context and the responsibilities of key actors,
which were already set out in section 3 above. In summary, three key characteristics of
Dhaka’s context include:
(i) rapid population growth alongside vertical expansion of the city into apartment
blocks and high-rise buildings,
(ii) use of “sanitary” latrines approaches 95%, but almost none of the resulting FS is
effectively contained. 99% of the waste enters the drains and local environment,
either by a “long route” (e.g. pits/tanks with overflow to drains) or a “short route”
(e.g. directly to drains with no intermediary containment) – see SFD in section 4.3.2,
(iii) a defective sewer system theoretically serving 20% of the population, but with only
3% of wastewater entering the system actually being treated.
All this results in very low demand for FSM services, with the only households using proper
containment being (a) those in slums with no nearby drain, and (b) houses which have not
connected their latrines & septic tanks to drains – anecdotally, these are more likely to be older
residences according to some key informants. This in turn results in a thin market, with hardly

Case study report – Fecal Sludge Management in Dhaka, Bangladesh
75
any service providers providing mechanical emptying. The key service providers are manual
emptiers, but their services are only demanded by a small proportion of the city’s population.
There is emerging recognition that this situation cannot continue and, recently, ITN-BUET was
engaged to draft a Fecal Sludge Management Framework for Dhaka City, with the assistance
of the Gates Foundation. The impetus for this was discussions around the sewerage master
plan for Dhaka.49 While the draft master plan itself is extremely ambitious (aiming to move from
20% sewerage coverage in 2015 to 70% by 2025), discussions around it resulted in movement
towards acknowledgement that FSM has a role to play. This acknowledgement was hard to
avoid in the light of slow progress in extending sewerage coverage and problems with the
effectiveness of the existing network.
The ITN-BUET framework proposed a sanitation tax on all households by local governments
for the public good of FSM, the establishment of an environmental police, and a database of
disposal systems and payments for delivery of fecal sludge. Following the presentation of this
draft to the National Forum on WSS, the Ministry has requested ITN-BUET to develop a draft
National Fecal Sludge Management Framework under the guidance of a Ministerial committee.
In effect, this is a welcoming of the Dhaka framework, though it remains in draft.50
These are bold proposals to improve FSM in Dhaka, in the context of the existing situation
suiting many stakeholders. The use of storm drains for eventual FS disposal to some extent
makes life easier for many stakeholders. The impetus for the decision is therefore discussed
in more detail alongside the use of tools below, alongside the caveat that nothing appears to
have changed on the ground as yet.
In some ways, the current situation persists not only because it suits people, but also because
of the apparently low visible costs it imposes on the majority. For example, there is hardly any
expenditure on FSM services, any health impacts may not be perceived to be related to FSM,
and potential costs of sewerage system blockages are avoided by cross-connecting to the
drains. The hidden costs become far more apparent during the rainy season when the drainage
system becomes overloaded and low-lying areas of the city are flooded, especially poor areas.
The nature of these costs, and whether they are as low as they are perceived by stakeholders,
is addressed in Section 11 on the economics.
Overall, the context is an almost absent market for FSM services despite a rapidly growing
population. Most FS is simply not managed – the problem is avoided by FS being re-routed to
the drains either directly or indirectly. There is, however, an emerging discussion around
resolving this situation. The next section maps out stakeholders’ current responsibilities.
9.1.1 Mapping institutional responsibilities
As set out above, the focus is how institutions function, the incentives which those institutions
provide to stakeholders, and how those stakeholders exert influence. It is therefore important
to understand who those stakeholders are, alongside their formal and informal roles. A useful
49 The World Bank is financing the Dhaka Water & Sanitation Project (DWSSP) for the preparation of the Sewerage Master Plan for Dhaka. including the prioritization of key investments in the wastewater management and sanitation system. 50 This situation may have changed even since Mark Ellery conducted the key informant interviews in June-December 2014. We will update this report in discussion with Mark and others active in the going World Bank project, before any versions of this report are shared externally.
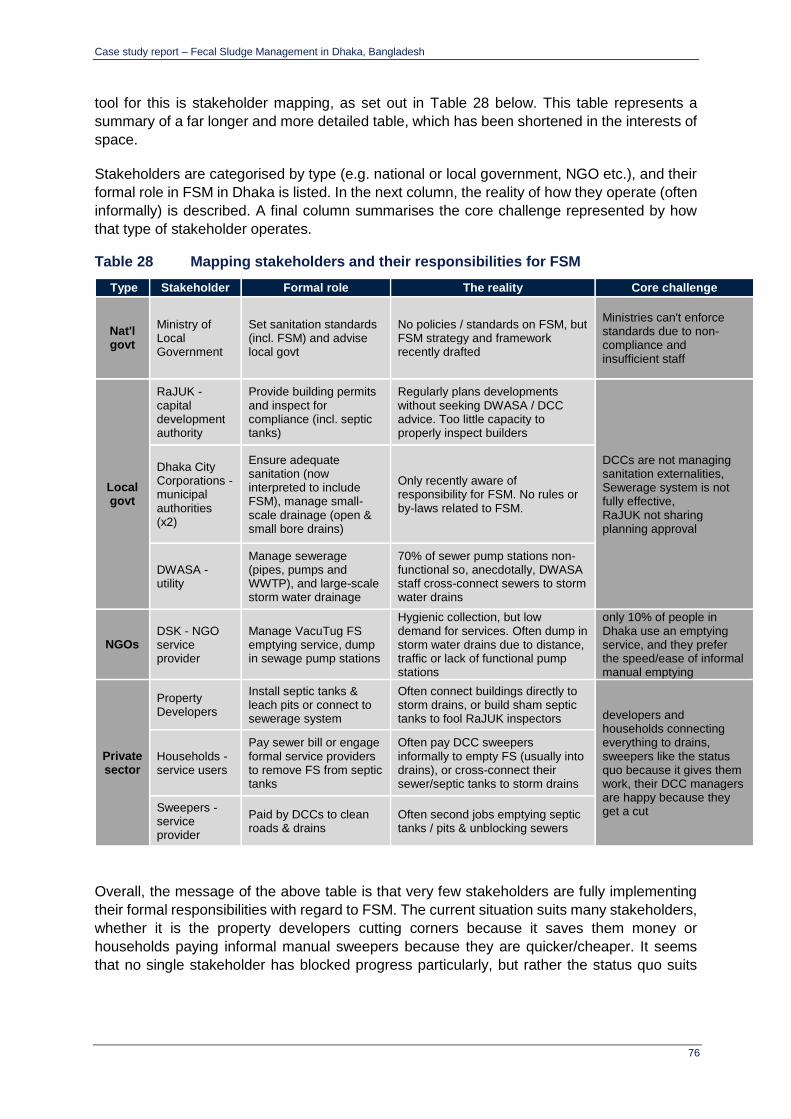
Case study report – Fecal Sludge Management in Dhaka, Bangladesh
76
tool for this is stakeholder mapping, as set out in Table 28 below. This table represents a
summary of a far longer and more detailed table, which has been shortened in the interests of
space.
Stakeholders are categorised by type (e.g. national or local government, NGO etc.), and their
formal role in FSM in Dhaka is listed. In the next column, the reality of how they operate (often
informally) is described. A final column summarises the core challenge represented by how
that type of stakeholder operates.
Table 28 Mapping stakeholders and their responsibilities for FSM
Type Stakeholder Formal role The reality Core challenge
Nat'l govt
Ministry of Local Government
Set sanitation standards (incl. FSM) and advise local govt
No policies / standards on FSM, but FSM strategy and framework recently drafted
Ministries can't enforce standards due to non-compliance and insufficient staff
Local govt
RaJUK - capital development authority
Provide building permits and inspect for compliance (incl. septic tanks)
Regularly plans developments without seeking DWASA / DCC advice. Too little capacity to properly inspect builders
DCCs are not managing sanitation externalities, Sewerage system is not fully effective, RaJUK not sharing planning approval
Dhaka City Corporations -municipal authorities (x2)
Ensure adequate sanitation (now interpreted to include FSM), manage small-scale drainage (open & small bore drains)
Only recently aware of responsibility for FSM. No rules or by-laws related to FSM.
DWASA - utility
Manage sewerage (pipes, pumps and WWTP), and large-scale storm water drainage
70% of sewer pump stations non-functional so, anecdotally, DWASA staff cross-connect sewers to storm water drains
NGOs DSK - NGO service provider
Manage VacuTug FS emptying service, dump in sewage pump stations
Hygienic collection, but low demand for services. Often dump in storm water drains due to distance, traffic or lack of functional pump stations
only 10% of people in Dhaka use an emptying service, and they prefer the speed/ease of informal manual emptying
Private sector
Property Developers
Install septic tanks & leach pits or connect to sewerage system
Often connect buildings directly to storm drains, or build sham septic tanks to fool RaJUK inspectors developers and
households connecting everything to drains, sweepers like the status quo because it gives them work, their DCC managers are happy because they get a cut
Households - service users
Pay sewer bill or engage formal service providers to remove FS from septic tanks
Often pay DCC sweepers informally to empty FS (usually into drains), or cross-connect their sewer/septic tanks to storm drains
Sweepers - service provider
Paid by DCCs to clean roads & drains
Often second jobs emptying septic tanks / pits & unblocking sewers
Overall, the message of the above table is that very few stakeholders are fully implementing
their formal responsibilities with regard to FSM. The current situation suits many stakeholders,
whether it is the property developers cutting corners because it saves them money or
households paying informal manual sweepers because they are quicker/cheaper. It seems
that no single stakeholder has blocked progress particularly, but rather the status quo suits
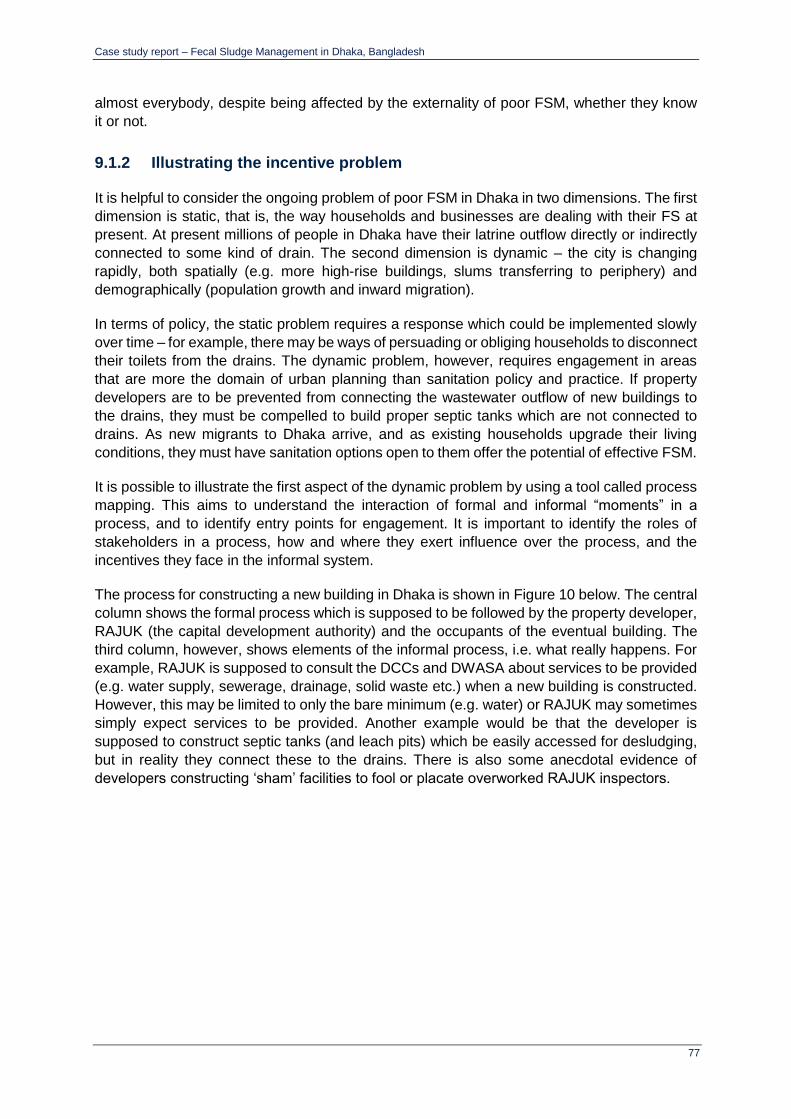
Case study report – Fecal Sludge Management in Dhaka, Bangladesh
77
almost everybody, despite being affected by the externality of poor FSM, whether they know
it or not.
9.1.2 Illustrating the incentive problem
It is helpful to consider the ongoing problem of poor FSM in Dhaka in two dimensions. The first
dimension is static, that is, the way households and businesses are dealing with their FS at
present. At present millions of people in Dhaka have their latrine outflow directly or indirectly
connected to some kind of drain. The second dimension is dynamic – the city is changing
rapidly, both spatially (e.g. more high-rise buildings, slums transferring to periphery) and
demographically (population growth and inward migration).
In terms of policy, the static problem requires a response which could be implemented slowly
over time – for example, there may be ways of persuading or obliging households to disconnect
their toilets from the drains. The dynamic problem, however, requires engagement in areas
that are more the domain of urban planning than sanitation policy and practice. If property
developers are to be prevented from connecting the wastewater outflow of new buildings to
the drains, they must be compelled to build proper septic tanks which are not connected to
drains. As new migrants to Dhaka arrive, and as existing households upgrade their living
conditions, they must have sanitation options open to them offer the potential of effective FSM.
It is possible to illustrate the first aspect of the dynamic problem by using a tool called process
mapping. This aims to understand the interaction of formal and informal “moments” in a
process, and to identify entry points for engagement. It is important to identify the roles of
stakeholders in a process, how and where they exert influence over the process, and the
incentives they face in the informal system.
The process for constructing a new building in Dhaka is shown in Figure 10 below. The central
column shows the formal process which is supposed to be followed by the property developer,
RAJUK (the capital development authority) and the occupants of the eventual building. The
third column, however, shows elements of the informal process, i.e. what really happens. For
example, RAJUK is supposed to consult the DCCs and DWASA about services to be provided
(e.g. water supply, sewerage, drainage, solid waste etc.) when a new building is constructed.
However, this may be limited to only the bare minimum (e.g. water) or RAJUK may sometimes
simply expect services to be provided. Another example would be that the developer is
supposed to construct septic tanks (and leach pits) which be easily accessed for desludging,
but in reality they connect these to the drains. There is also some anecdotal evidence of
developers constructing ‘sham’ facilities to fool or placate overworked RAJUK inspectors.
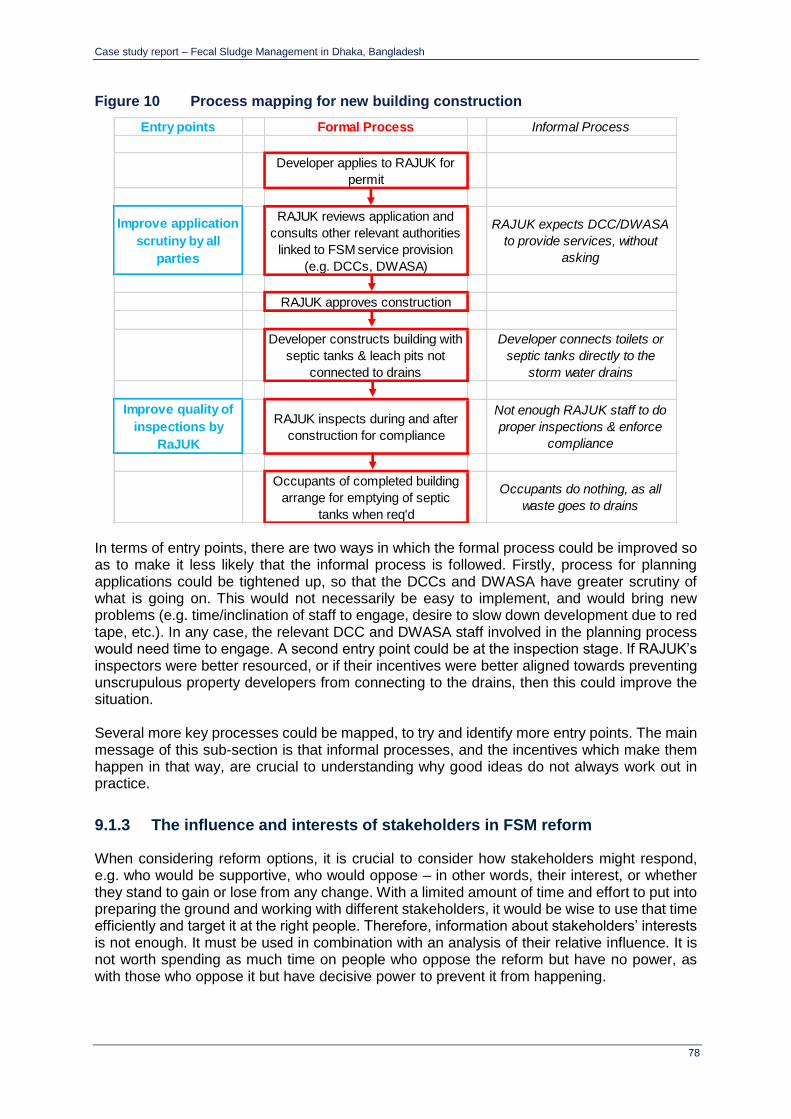
Case study report – Fecal Sludge Management in Dhaka, Bangladesh
78
Figure 10 Process mapping for new building construction
In terms of entry points, there are two ways in which the formal process could be improved so as to make it less likely that the informal process is followed. Firstly, process for planning applications could be tightened up, so that the DCCs and DWASA have greater scrutiny of what is going on. This would not necessarily be easy to implement, and would bring new problems (e.g. time/inclination of staff to engage, desire to slow down development due to red tape, etc.). In any case, the relevant DCC and DWASA staff involved in the planning process would need time to engage. A second entry point could be at the inspection stage. If RAJUK’s inspectors were better resourced, or if their incentives were better aligned towards preventing unscrupulous property developers from connecting to the drains, then this could improve the situation. Several more key processes could be mapped, to try and identify more entry points. The main message of this sub-section is that informal processes, and the incentives which make them happen in that way, are crucial to understanding why good ideas do not always work out in practice.
9.1.3 The influence and interests of stakeholders in FSM reform
When considering reform options, it is crucial to consider how stakeholders might respond, e.g. who would be supportive, who would oppose – in other words, their interest, or whether they stand to gain or lose from any change. With a limited amount of time and effort to put into preparing the ground and working with different stakeholders, it would be wise to use that time efficiently and target it at the right people. Therefore, information about stakeholders’ interests is not enough. It must be used in combination with an analysis of their relative influence. It is not worth spending as much time on people who oppose the reform but have no power, as with those who oppose it but have decisive power to prevent it from happening.
Entry points Formal Process Informal Process
Developer applies to RAJUK for
permit
Improve application
scrutiny by all
parties
RAJUK reviews application and
consults other relevant authorities
linked to FSM service provision
(e.g. DCCs, DWASA)
RAJUK expects DCC/DWASA
to provide services, without
asking
RAJUK approves construction
Developer constructs building with
septic tanks & leach pits not
connected to drains
Developer connects toilets or
septic tanks directly to the
storm water drains
Improve quality of
inspections by
RaJUK
RAJUK inspects during and after
construction for compliance
Not enough RAJUK staff to do
proper inspections & enforce
compliance
Occupants of completed building
arrange for emptying of septic
tanks when req'd
Occupants do nothing, as all
waste goes to drains

Case study report – Fecal Sludge Management in Dhaka, Bangladesh
79
For example, it would be useful for those leading on FSM reform to consider whether each stakeholder in Table 28 would support or oppose a move towards better containment and emptying practices in Dhaka. This could help start a conversation about stakeholder engagement in reform processes.
For example, the DCCs would stand to gain in terms of a smaller load being placed on their small-bore drainage system, which might be expected to become blocked less often as a result. If FSM reform creates more work for them, in terms of the new responsibilities now apparent (see Table 28 above), then this might make them less enthusiastic.
Informal sweepers are in a similar situation. Stopping latrines being connected to drains would work well for them in the short term, in the sense that they would get more business doing pit emptying. However, they may be wary of market developments which would enable mechanical truck emptiers to break into their market into the medium term. However, sweepers have relatively little influence over FSM reform. They can affect the day-to-day situation on the ground (for example, there is anecdotal evidence that sweepers have interfered with the ability of mechanical operators to empty pits), but they are not an influential constituency on the whole. It is also worth noting that many of them are DCC employees, who carry out private emptying work on the side. Households and property developers, on the other hand, might be expected to oppose reforms, as they do not perceive the societal damage costs of inaction, but only the personal costs they would bear from a change to the situation. Both would stand to face higher costs, households from having to adapt their toilet facility and eventually pay emptying fees, and property developers from having to spend more on proper septic tanks and appropriate access to them. Both are likely to be influential, households in terms of public opinion, and developers in terms of their political connections.
9.2 Implications for FSM in Dhaka
In conclusion, this chapter has summarised aspects of the analysis conducted through key
informant interviews by World Bank consultants, to help explain why the SDA looks as it does.
That is, why is the whole SDA showing poor FSM service delivery overall. The fact that the
whole thing is red, not just parts of it, has precluded a focused look at key parts of the chain,
which may be more appropriate in other cities.
The implications of all this for FSM in Dhaka is mainly that it is crucial to maintain momentum
on the emerging reform agenda. Progress could easily stall if opposing forces emerge to try
and block it, or if DCC and DWASA drop it due to lack of priority. The various analyses above,
as well as a lot more in the associated report by Mark Ellery, show that while the status quo
suits almost everybody, there are also many stakeholders who would gain from reform as well.
The only influential stakeholders who risk losses are households and property developers, so
special care must be taken to try and win them over.
Householders may be responsive to public education campaigns which increase awareness
of the impacts of poor FSM, especially during or after times of flooding when the contents of
the drains suddenty matters to everybody. As for property developers, the cynical view is that
they will get away with whatever they can. They may well oppose reforms. However, as long
as those in favour can form a strong coalition to put things through, it is unlikely that the costs
to the developers of proper containment are significant enough to warrant them wanting a fight.
All they have to do is put in septic tanks, and the costs of emptying and maintaining those are
Case study report – Fecal Sludge Management in Dhaka, Bangladesh
80
borne by those eventually managing the building, who in turn can pass them onto the occupant
households.
Strategies are needed to bring along those stakeholders who might be expected to be
cautiously in favour. RAJUK, the DCCs or the sweepers could easily become obstructive if
they perceive a risk of losing out. What the process mapping shows, even of one process, is
that institutions such as regulations and by-laws do not always operate in the way they are
supposed to. It would be disappointing if reform efforts culminated only in yet another set of
by-laws which are ignored by all stakeholders. Special care must therefore be taken to ensure
that any reforms properly consider the changes in incentives they may cause, or indeed fail to
cause.
To address the “so what” questions which are often a response to this kind of analysis, a
section at the end of the next chapter (which focuses on intervention options) considers the
feasibility of proposals in the context of the above analysis.

Case study report – Fecal Sludge Management in Dhaka, Bangladesh
81
10 Intervention options
This section proposes interventions to improve fecal sludge management services in Dhaka
and provide an effective enabling environment within which those services can be
appropriately developed and sustainably managed. These interventions are initially informed
by results of the survey data that highlight problems with existing services (as most clearly
represented in the fecal waste flow diagrams). Th interventions most directly affecting service
delivery are then considered in the context of results from using the broader detailed diagnostic
tools, in particular the service delivery assessment (SDA) and the Prognosis for Change (PFC),
as presented in other sections of this report.
This section does not identify or propose specific and detailed actions to be taken, who is best
placed to undertake those actions, what information is needed in advance of taking action
(such as additional feasibility studies), or the likely outcome of those actions. A number of
studies and initiatives are ongoing in Dhaka to do this. The intervention options presented here
take account of those studies and can hopefully support the further development of details and
recommendations from those other studies.
To support planning decisions for improving FSM services over time, this chapter starts by
referring back to key results responding to the question “Where are we now?” using the fecal
waste flow diagrams as a means to illustrate the key challenges. It then goes on to propose
responses to the question “Where do we want to get to?”, that acknowledge components of
the enabling environment, current studies and ongoing sectoral reforms, as well as good
practice and relevant experience from elsewhere.
Addressing the next question “How do we want to get there?” is a further process that requires
strong leadership at city level, engagement of city authorities and key stakeholders, detailed
studies and analysis to identify specific plans and solutions that can support an incremental
and strategic planning approach. Some ideas on how a phased and pragmatic approach may
be necessary for this process to take shape are identified in Section 0).
10.1 Identified weaknesses, through the service chain
The key starting point for presenting weaknesses in the existing services is the fecal waste
flow diagrams, as they identify the extent to which FS is managed (or not) through the current
sanitation service chains (sewered and non-sewered).
From these diagrams, “problems” or “weaknesses” in the process of managing wastewater
and FS at the key stages in the chain can be highlighted (see following figures), pointing to
where interventions are needed to improve the status quo.
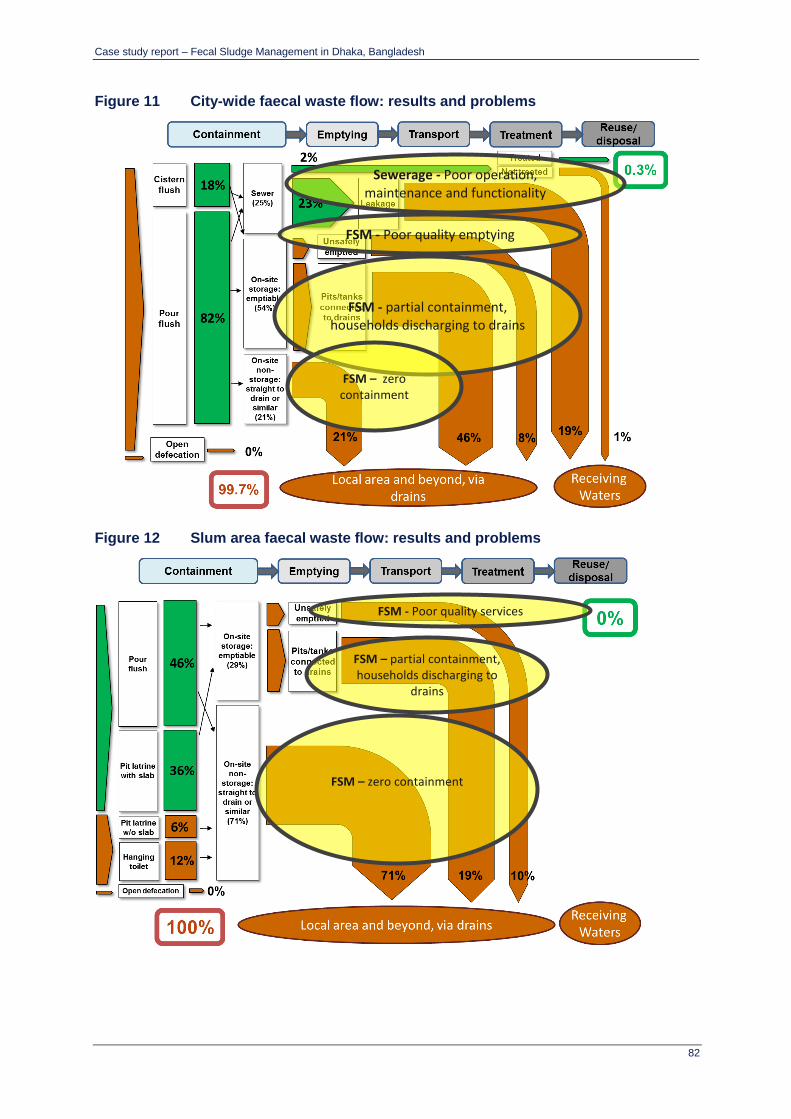
Case study report – Fecal Sludge Management in Dhaka, Bangladesh
82
Figure 11 City-wide faecal waste flow: results and problems
Figure 12 Slum area faecal waste flow: results and problems
FSM - Poor quality emptying
Sewerage - Poor operation, maintenance and functionality
FSM - partial containment, households discharging to drains
FSM - Poor quality services
FSM – partial containment, households discharging to
drains
FSM – zero containment
FSM – zero containment

Case study report – Fecal Sludge Management in Dhaka, Bangladesh
83
10.2 Proposed solutions, through the service chain
Taking the highlighted problems, it is possible to identify possible solutions to address them,
based on findings from the FSM study, results and discussions emerging from ongoing studies
within the city – such as the recommendations from the DWASA Dhaka Sewerage Master Plan
Project (March 2013), DWASA Low-Income Customer Service Improvement Plan (LICSIP,
May 2015), and the Dhaka Water and Sanitation Project (DWSSP) consultancy identifying
sewage collection and treatment options for Uttara and Mirpur (on-going).
These proposed solutions are grouped according to the types of containment / discharge
arrangements (system type), then consider possible interventions through the later stages of
the service chain.
At the level of analysis possible from the FSM study, the solutions are not identified on the
basis of specific locations within Dhaka, although they provide guidance on what needs to be
addressed within the city as a whole and for slums in general. This level of detail and analysis
requires further data sets and investigation, such as ongoing through the DWSSP consultancy.
These findings can offer guidance as to the types of interventions to be explored in more depth
as part of that and other work.
Table 29 on the following pages sets out possible technical interventions, whereas the sections
following the table consider interventions more related to the enabling environment. The
options in the table are not necessarily mutually exclusive and in presenting the “Where do we
want to get to?” they do not specify interim or staged approaches. These are discussed in the
following section. Some examples of where these kinds of options have been successful in
other cities around the world are also provided within the subsequent section.

84
Table 29 Technical interventions to improve service delivery, based on existing system type
System type / key problems
Potential solutions
Containment Emptying Convenyance Treatment Disposal End-use
Sewers
Poor retention of connections
Limited O&M / functionality (leakage, blockages, overflows, etc.)
Ineffective treatment / poor effluent standard
Enforce building codes for new-build housing; i.e. connected to existing or planned sewers
Disconnect household connections to drains, where household is within 100m of operational sewer
Provide incentives for households to connect to sewers (low- or zero- cost connection fee, staged payments, etc.) and penalties for households that disconnect where functioning sewers are available
N/A Prevent illegal connections, clear blockages, ensure functioning pumping stations
Increase monitoring and recording of sewer conditions
Increase capacity and resources to respond to O&M needs, achieve call-out services (blockages, collapses, pump station failure, etc.) and maintain sewer functionality
Extend sewer lines into designated, targeted locations
Improve functionality of Pagla Sewage Treatment Plant (STP) – ensure it is functioning to design standard. Manage existing facilities better and extension of treatment units as and where required
Allocate funds for operation and maintenance purposes
Improve effluent discharge points to minimize environmental risk
Monitor and report on effluent standards
Identify options for regulated end-use of treated effluent from STPs – e.g. irrigation
On-site: emptiable
Poor quality (unsafe) emptying practices
Enforce regulations to prevent cross-connections to drains where containment facilities exist
Improve the design and construction of
Extend/ improve emptying options and services:
a) Modified STs/pits: fast response time,
Identify, research, pilot and develop a range of innovative transport solutions (mechanised or human powered) to access diverse locations, offering a
Introduce a range of FS treatment facilities: DEWATS, dewatering/drying beds with possible co-composting of dried
Identify unofficial disposal/ discharge sites and address key public and
Explore opportunities for FS end-use in agriculture (nutrient value), industry (e.g. energy value as

85
System type / key problems
Potential solutions
Containment Emptying Convenyance Treatment Disposal End-use
Limited coverage of emptying services
High rates of connecting to drains
septic tanks (STs) and pits, with correct standards followed:
a) Modified STs and pits with separate grey/ blackwater discharge; greywater to drains, blackwater to a ‘holding tank’ (modified ST with no outlet) where no piped system available
b) Standard STs and pits: combined grey/blackwater discharging to small bore sewer (SBS)
c) Modified or new interceptor tank: combined grey/blackwater discharging to small bore sewer (SBS)
good access, small volumes, affordable
b) Standard STs/pits connected to SBS: mid- to larger-volumes, good access, safer emptying & disposal practices
Identify and support entrepreneurs who can provide a range of appropriate emptying services, that are affordable, accessible and safe for households, the public and environment
more affordable and responsive service – smaller vehicles, more flexibility, shorter routes. (e.g. WSUP pilot studies with tricycle units)
Introduce transfer stations for small-vehicle operators – linked to larger collection services to take FS to treatment (where distance to discharge point is uneconomical) (e.g. WSUP pilot study)
Construct small-bore sewers, connecting households with improved STs/pits or new interceptor tanks to decentralised treatment facility
sludge and municipal solid waste
Introduce FS-handling station to the STP sites, or dedicated FS treatment plants operated locally
Locate decentralised treatment sites to ensure safe and efficient access for emptying service providers – where households discharge to drains and provision of sewers is highly unlikely (RajUK to support process of land approval and purchase)
environmental health risks.
Identify reasons for continued use of unofficial disposal and:
- if lack of provision: provide more official discharge points and treatment sites, or
- if distance: introduce transfer stations and enforcement
Modify existing sites and manage new FS disposal sites – to minimise risk to public and environmental health
a dried fuel source, anaerobic digestion), etc.
On-site: non-emptiable
Modify existing STs/pits, as per part (a) for on-site
As above As above As above As above As above

86
System type / key problems
Potential solutions
Containment Emptying Convenyance Treatment Disposal End-use
Poor containment infrastructure
Direct discharge to environment
emptiable above, so as to convert them to being both emptiable and providing effective containment
Introduce new/ improved on-site containment, e.g. interceptor tanks, septic tanks or pits, for household/ community or public facilities – constructed and located to make emptying possible.
Increase emptying services to additional facilities
No containment facility
Direct discharge to environment
Invest in additional communal/public facilities – to reduce sharing to acceptable levels – connected to local sewer networks
Invest in new household-level container-based options, where acceptable to users
Identify technical options for low-lying and flood-prone areas for household /
Ensure additional communal / public facilities are connected into localised sewer network
Increase emptying services to new facilities: see above
Identify and invest in new/ innovative servicing of household containment options that have no outlet
As above As above As above As above

87
System type / key problems
Potential solutions
Containment Emptying Convenyance Treatment Disposal End-use
communal/ public level of facilities
(e.g. WSUP’s SWEEP teams)
Report of a FSM study in Dhaka, Bangladesh
88
10.3 The Service Delivery Context: priorities to address
The WSP desk study review of Dhaka city FSM, conducted as part of the Review of Fecal Sludge
Management in 12 Cities (Peal et al, 2013), placed Dhaka within the 3 city typologies as a Type 1
city: Poor FSM. For Type 1 cities, the WSP report states that investments in infrastructure would
be ineffective if carried out in isolation to addressing the broader enabling environment, due to the
absence of an overall FSM framework at the time of the study.
Based on analysis of broader findings from the FSM study, the following sections consider the key
areas of the Enabling Environment (as defined and grouped within the Service Delivery Analysis of
Enabling, Developing and Sustaining components) and identify priority actions to support any
infrastructure-focused investments in Dhaka. While drawing on the SDA results as presented in
Section 8 and Annex C, it also accounts for current studies and ongoing sectoral reforms taking
place in Dhaka, as well as good practice and relevant experience from elsewhere.
10.3.1 Enabling: policy, planning and budget
Policy: Ongoing policy revisions must give attention to the needs of all aspects of the FSM service
chain (particularly emptying, convenyance, treatment and disposal), not only access to containment
infrastructure. This will require significant investment of time and resources to achieve, but should
start with clear commitments from the lead agencies to an agenda for change and recognition of
FSM services as a key component of Dhaka’s sanitation provision for the foreseeable future.
Establishing a separate strategy for FSM services is seen as a good starting point by a number of
stakeholders. It is currently a strategic component of the National Strategy for Water Supply and
Sanitation (2014), with a draft FSM framework in place for consultation.
Regulation: A strong set of regulatory laws, bylaws and enforcement procedures will be needed,
reflecting updated policy and strategy to ensure construction standards for containment
infrastructure and services along the FSM chain (emptying through the treatment / disposal) are
adhered to. This requires commitment from all key players, including the Ministry of Environment,
RAJUK, City Corporations, DWASA, service providers (formal and informal) and households – so
that each is aware of their duties, responsibilities and rights.
Institutional roles: there remains a significant absence of clearly understood roles assigned to
appropriately regulated and resourced institutions in relation to sanitation and FSM services. This
remains a key aspect in the ongoing process of developing and adopting a new FSM Institutional
Framework for Dhaka (discussed in more detail in the Prognosis for Change section), prior to
approval and adoption. In addition, mechanisms to support and encourage stronger inter-agency
cooperation, reporting and response will be essential for the FSM Institutional Framework to be
successfully implemented. This process may require – and be supported by – the establishment of
a designated and dedicated national agency addressing the range of on-plot sanitation, FSM
services and sewerage services, as in the case of ONAS and ONEA in Senegal and Burkina Faso
respectively. The FSM framework, in place for consultation, proposes a few organisations for these
purposes. At city level, it may be prudent to identify a single body to hold principal oversight and
accountability for the full sanitation service chain (incorporating sewerage and FSM services), with
appropriate actors (government, private sector or CSOs) delegated the responsibility to deliver
defined services along stages of the service chain where they have the greatest potential to deliver
effective, efficient and safe services. Amendments to the City Corporation Act (2009) and WASA Act
(1996) could then ensure that FSM services are more explicitly defined, using current terminology
and giving clarity to the agreed mandated roles of these principal actors.

Report of a FSM study in Dhaka, Bangladesh
89
Service provision and planning: Service improvement plans at a city-wide level, as well as to
specifically identified (targeted) areas, must continue to thoroughly assess the feasibility of a range
of technical options (i.e. beyond the more typically constrained choice of septic tanks and soak pits,
or conventional sewerage), affecting all stages of the service chain. This can include options for
household container-based latrines, holding tanks or interceptor tanks for households, means of
reducing the BOD of effluent discharging from tanks, pumps for safer manual removal of FS from
pits and tanks, local treatment units for larger installations such as multi-occupancy high rise
dwellings or community-based facilities (e.g. anaerobic baffled reactors), non-conventional
sewerage networks (including small-bore sewers), transfer stations with/without on-site partial
treatment and so on. Those responsible for developing improvement plans need to identify a range
of cost-effective operation, maintenance and management arrangements that can be competently
managed at as local a level as is necessary and reasonable (i.e. the principle of subsidiarity). These
may include for example, responsibilities to arrange desludging of septic tanks for individual
households, or those shared within a compound, or for making repairs to tanks, connecting pipework
and valve chambers, and so on.
Such an approach requires incentives to encourage the uptake and running of effective services –
these could be linked to further business opportunities for those showing themselves to be
competent. Any such service arrangements must respond to current and expressed needs of those
to be served, in line with Developing components (next section). It should also be noted that without
improving on containment infrastructure, and so reducing the extremely high levels of connectivity
to drainage infrastructure, little else is likely to bring about significant change in the FSM service
chain.
Budget: Development of comprehensive FSM plans have to identify realistic budgetary requirements
that can inform the required level of public and external investment in infrastructure and services,
through the service chain. The ESI Toolkit is a good first step in this process.
10.3.2 Developing: equity and outputs
Equity Choice / reducing inequity: the city needs to identify a wider range of responsive, accessible
and affordable FS emptying and transportation options that can service existing and newly
developed household containment facilities. This process needs to bear in mind and develop variable
costs for variable service levels: so for example customers receiving on-site services are paying less
than those receiving sewered services (see under Cost Recovery for examples).
- The emptying services that people currently have access to – formal mechanised vacutug (in
some areas), or informal manual emptiers – may benefit from a wider range of options.
Enabling and encouraging a greater range that can overcome some of the limitations
experienced by existing service providers (limited access and space in high-density areas,
procedures involving direct contact with fresh fecal sludge, etc.), within a regulated service
sector, is likely to increase competition and therefore promote greater customer-focus and
cost-control amongst service providers. The service chain must respond to both current user
demand, as well as the generally expressed willingness to pay more for responsive and
reliable emptying services.51 To achieve this, services must be able to access some of the
hardest to reach communities, be easy for households to contact and provide more flexible
call-out and payment arrangements – all of which were identified as constraints during
consultation with focus groups..
51 People consulted in focus groups stated a level of interest to pay more for improved sanitation and FS services, but these comments were not made within a structured willingness-to-pay study.
Report of a FSM study in Dhaka, Bangladesh
90
- A range of technical options for alternative sewer arrangements (Small Bore and Settled
Sewers) is proposed in the LICSIP and DWSSP reports. The proposal of a zero-fee
connection is intended to encourage higher connection rates. However, more detailed
assessment of the feasibility of each option in terms of cost-effective operation, maintenance
and management arrangements must be thoroughly and critically explored to identify the
most likely opportunity for functioning systems in a range of localities. At the same time, the
DWSSP Uttara and Mirpur study (Interim Report, May 2015) must give greater attention to
options for improving and servicing on-site sanitation systems.
Outputs Quantity / capacity: The SFDs presented earlier show that even if households have
emptiable latrines, emptying does not achieve safe disposal of FS. It has also been identified that
demand for emptying from the current formal providers is not achieving a self-sustaining business
opportunity and may even be declining.
- Where facilities are connected to the existing or future conventional sewer network,
attention must be given to ensuring continued functionality of sewers, for example through
quick action taken to address reported blockages, sewer collapse and failures in pump
stations. LICSIP introduces the implementation of penalties for customers refusing to connect
to sewers, once they become available in an area. However, only where sewer functionality
is maintained can cross-connections being made to drains be expected to stop, or
environmental standards and a “polluter pays” principle be enforced to any level of success.
- Where facilities are to be connected to new non-conventional sewer arrangements, it
will be essential that the roles and responsibilities of the various actors are clearly defined
(the draft FSM framework entrusts this responsibility to the city corporations) and resourced.
Areas needing specific attention will include: arrangements for operation and maintenance
of settling (septic/ interceptor) tanks and service lines within properties, plus arrangements
for emptying tanks (LICSIP includes options for scheduled emptying arrangements by D-
WASA to improve functionality); or responsibility for repairing manholes at the point where
the service line and small bore line connect needs to be clearly defined. An effective
scheduled emptying service, funded by costs levied onto water bills, could significantly
improve response times for pit/tank emptying. A range of emptying services would then need
to be available, to match the level of access to facilities for road-based emptiers.
- For those households that will continue to use on-site systems, emptying and
transportation service providers (formal and informal) will need to have the means and
support to gain access to other convenient, flexible and safe emptying equipment,
transporting fecal sludge to managed disposal locations where they can discharge sludge for
safe disposal or treatment. As identified in the LICSIP study, the use of effectively managed
transfer stations and decentralised treatment facilities at strategic locations within the city
could support this.
- Where septic tanks / pits are currently discharging into drains, the de-connection of
such arrangements is seen as a crucial issue. Mechanisms to effectively achieve this will
require, for example; public awareness campaigns and consultation, enforcement of the
regulations and imposing fines, technical interventions at household level to improve the
construction quality and accessibility of containment facilities, helping households to identify
and make use of emptying service providers. Such actions are crucial to protecting those
most at risk from contaminated drainage water in low-lying and flood-prone areas. In reality,
an incremental approach to addressing this difficult issue will be required, as considered
further at the end of this Section10.5.

Report of a FSM study in Dhaka, Bangladesh
91
Outputs Quality and reporting: The faecal waste flow diagrams and proposed technical interventions
outlined in Table 29 show that the greatest complexity in the service chain presently occurs at the
containment and emptying stages. Current practices of handling fecal sludge introduce significant
risk to the public and wider environment through a lack of facilities to contain fecal waste, combined
with unregulated and unsafe disposal practices. The study has highlighted the huge and city-wide
scale of the problem and a range of interventions will need to be matched carefully to current
practices, as well as opportunities and constraints that exist in different locations within the city. The
following comments support the technical recommendations identified as Potential Solutions in the
earlier Table.
- Considering existing infrastructure and services: 21% of households city-wide and 71% of
households in slum areas have a non-emptiable arrangement (e.g. toilet empties straight into
a drain). In such cases, the toilet would need converting to include some form of emptiable
containment or to connect to sewer arrangement. Meanwhile 84% of households in cities and
65% of households in slum areas with emptiable pits/tanks have not had them emptied, as
they discharge into drains or elsewhere. In these cases, stronger enforcement is needed to
ensure these households take steps to convert existing pits/tanks into holding tanks as a step
towards complying with the law, as well as increasing availability of emptying / transport
services, so that they can physically connect into a viable and functioning service chain.
- New infrastructure provision must enable better containment of fecal sludge, either through
correctly constructed on-site sub-structures (septic tanks or pits) with access for emptying
built-in, and/or correctly constructed connections to effectively managed off-site networks.
Only when a minority of households practice informal or illegal practices can meaningful reporting
occur in relation to poor construction practices, or illegal discharges resulting from poor servicing of
on-site facilities and poor maintenance off-site facilities. Currently the majority follow this practice.
10.3.3 Sustaining: O&M, expansion and service outcomes
Cost recovery and standards: Cost recovery mechanisms will need to address all stages of the
service chain – considering costs affecting households, service providers and financial transfers from
other sectors. An approach is successfully being implemented in Hai Phong, Vietnam where
households connected to the sewer are charged a fee for wastewater services, while households
who are not connected to the sewer are charged a lower ‘environmental fee’. In Maputo,
Mozambique a similar arrangement is applied for solid waste services. The draft FSM framework for
Dhaka proposes a sanitation tax to cover costs associated with collection, treatment and disposal of
FS.
- Any development of service standards must be informed by an assessment of what can be
realistically achieved (as opposed to what may ultimately be required over time to achieve
levels of “good practice” or nationally recognised service level standards) within a given
timeframe and under a range of contextualised constraints, incrementally working towards
improved standards over time and as service levels improve and infrastructure becomes
available. Minimum standards can be set that ensure basic protection of public health and
critical services (such as water supplies).
- A willingness-to-pay survey was not a component of this study and it is not clear that a WTP
survey has been conducted as part of current studies looking at identifying options within
Low-Income Communities in general, or target areas in particular. WTP information is most
useful and reliable in the context of clearly-defined service options, which do not yet exist in
Dhaka – so would be a valuable component of prior to committing to specific service
investment plans and programmes.

Report of a FSM study in Dhaka, Bangladesh
92
Key to this process will be a review of the tariff structures for water supply and sewerage currently
in operation in Dhaka. Many stakeholders note that the heavily subsidised sewerage charges leave
little financial ‘space’ within which to set lower, appropriate tariffs for FSM services. The ongoing
review of tariffs by the Water Supply and Sanitation Regulatory Commission is seen as a critical
component.
Demand and sector development: As plans for service enhancement are developed, it is important
to engage civil society, households, landlords and informal service providers, in ways to stimulate
demand for improved FSM services. This could help to generate interest and commitment to carrying
out duties to improve the service chain, where each actor has most influence and the most to benefit.
Customer demand for improved services remains latent while proper containment is almost non-
existent and access to service options is so highly constrained. This report identifies key
determinants affecting household demand – including limited access for service providers, low
percentages of pits/tanks that ever fill up (and long filling times where they do fill), lack of awareness
of services and affordability of those services. These findings could be used to undertake carefully-
designed formative research to identify the motivators and messages for a behaviour change
communication and promotion campaign to stimulate willingness to pay for improved infrastructure
and services. Such a campaign should be undertaken alongside changes in legislation, enforcement
of building standards for correctly-constructed containment facilities (septic tanks and pits) and the
availability of FSM services.
- Focus group discussions with residents of slum areas highlight a general willingness from
households to contribute towards more effective and responsive emptying services. This
willingness is however significantly constrained by households’ lack of access to formal
financial services (especially to help with large one-off payments such as mechanised
emptying), or if as tenants they have little influence over services installed and managed by
landlords. Consideration should be given to how, for example, existing savings and loans
schemes supporting water and sanitation improvements, or tenancy agreements stating
minimum service standards tenants can and should expect from landlords, could support
households and informal service providers to improve containment, emptying and
conveyance stages of the service chain – to reduce unregulated and unsafe practices.
- As service improvement plans are considered, discussed and developed, representatives of
landlords, service providers and residents need to be brought into this process.
10.4 Resulting hierarchy of interventions
1. Conveyance, treatment, end-use: Issues formalising transport, treatment and end-use stages
of the service chain (the downstream stages) need to be addressed, in parallel with
addressing the containment and emptying stages, so that FS can be received and managed
when upstream arrangements are improved. Effective business models need to be identified,
which ongoing studies WSUP may be in a good position to help identify.
2. Containment: The number of existing sanitation systems that discharge directly or indirectly
to drains needs to be reduced – particularly where this has a direct impact on public health
through overflowing drains in low-lying areas. This requires a systematic and progressive
process of disconnecting existing systems from the drains as alternative ‘outlets’ are
introduced. These alternatives may include, for example: conventional sewers where these
are extended (particularly for servicing public / communal toilet blocks), interceptor tanks
discharging to small-bore-sewers; holding tanks frequently serviced by small mechanised
emptying trucks; pits serviced by improved (safe) manual emptying using a devise such as

Report of a FSM study in Dhaka, Bangladesh
93
the Gulper. Newly-constructed buildings should not be permitted to discharge fecal materials
directly to drains. The aim should be to focus on achieving properly constructed containment,
and to ensure that sanitation facilities are systematically serviced by the most appropriate
technical option(s).
3. Emptying: Entrepreneurs and NGOs require encouragement to offer a range of affordable
mechanical or improved manual emptying services, and to be able to respond quickly,
especially for shared sanitation facilities and for the urban poor. Licencing, service
agreements and contracts issued by the regulating agency could help service providers to
invest in equipment and business operations, as well as improving the regulation of service
standards. The WSUP study into business models may a helpful starting point, to further
explore suitable arrangements to achieve appropriate service standards.
The experience from Dakar, Senegal of the Market Structuring of FSM Program (PSMBV) would be
worth exploring further. This programme identifies institutional structures, customer-based services,
private sector incentives and regulation, as well as technical innovation and development through
the full FSM service chain.52
Any improvements to sanitation services should also seek to achieve the following overarching aims:
- ensure the needs of vulnerable family members (including elderly and disabled people,
pregnant women, and small children) are considered in the provision of facilities and services;
and
- adopt an integrated response to addressing sanitation, solid waste, and drainage
infrastructure and services. Only in this way can equitable, functional and sustainable
services be delivered.
Adopting a phased and pragmatic approach
Given the extent of the lack of effective and safe sanitation services, a pragmatic approach is needed
for Dhaka. Only in this way will all customers be eventually able to access services in some way or
other, informed by the range of customer types and supported by a broad range of service level
options appropriate to different income levels.
As part of this approach, it will be important to identify key time-bound stages that can respond to
the “How are we going to get there?” question, within a strategic planning process. It would be helpful
to identify milestones for phases of incremental improvements in all FSM and sewerage services,
within the current planning timeframe of 2015-2035. Objectives can be set for each phase, with
specific indicators and activities identified to support those objectives – including minimum standards
to protect public and environmental health. For this process to work, decision-points will be needed
to identify where in the city and at what phase services will aim to be predominantly i) FSM services
for on-site sanitation, ii) a mixture of conventional sewerage and non-conventional piped networks
with supporting services, or iii) conventional piped sewerage networks.
If the intention is to incrementally connect customers to effective and safely managed sewerage
services, this may require the adoption of certain non-standard approaches, that are gradually
addressed and overcome with time. For example, in low income communities in particular, but also
in other parts of the city as and when appropriate, this may mean prioritising investments in improving
household, communal and public containment facilities (various forms of tanks have been mentioned
52 More details can be found on the website: http://www.onasbv.sn/en/

Report of a FSM study in Dhaka, Bangladesh
94
previously) while developing a series of transfer stations for FS handling and decentralised treatment
sites (STPs and FSTPs).
As options for piped networks (predominantly non-conventional for LICs) are identified, planned and
implemented, it may be necessary to allow the improved tanks to continue to discharge effluent into
the drains (open surface and deep stormwater drains), without prosecution, until a piped network
(conventional or non-conventional) is available and functioning for the users to connect into. This
could be by way of offering a “grace period” to customers, before which penalties will not be applied
providing the containment facilities are correctly operated and maintained (i.e. regularly desludged),
and with clear guidance about the conditions under which penalties would be imposed once sewer
connections become feasible. In the interim, households discharging to stormwater drains could be
charged on the basis of using the drains as a form of combined sewer. Basic treatment would need
to be provided at the drain outlets (primary screening and management of the discharge points as a
minimum) to reduce impacts on the environment and public health risks. Special attention would be
important to those drains most at risk of discharging into living environments, especially in low-lying
areas. This sort of approach, though unconventional and requiring careful management to ensure
transitioning as soon as feasible, would allow the development of sewered networks to be planned
in line with changes to urban settlements, as the city develops and sewers can be introduced
throughout the city, or new forms of sanitation are identified.
10.5 Feasibility of these options in the context of the Prognosis for Change
As set out above, these intervention options were developed with a solid understanding of the PFC
(section 9). Therefore, they are all deemed feasible, if carried out in an appropriate sequence with
the engagement of the right stakeholders. Nonetheless, it is worth specifically highlighting what will
be the key factor requiring special consideration in the context of the PFC, particularly the
stakeholder analysis. That factor is enforcement of laws and regulations, particularly at the
containment stage of the chain.
There are three key aspects of this: (i) ensuring existing emptiable systems are disconnected from
drains (or replaced with an appropriate sewered option), (ii) ensuring existing non-emptiable systems
are upgraded, (iii) ensuring newly constructed buildings have an appropriate system. Each of these
is a slightly different problem, but all have one thing in common. There is currently little incentive for
the household or property developer concerned to act. This is because the externality is public and
dispersed, while addressing the problem would involve the stakeholder incurring private costs
themselves.
Therefore, it is crucial that interventions aimed at converting existing containment infrastructure, or
ensuring developers don’t break the law, are planned in the context of this incentive problem. Public
education will not be enough. There must be a credible threat of penalties, through publicising of
fines imposed on households and developers. It would be worth studying other sectors in Dhaka
which have successfully enforced the law in this way and, if there are no examples, looking further
afield, including to other countries.
Report of a FSM study in Dhaka, Bangladesh
95
11 Economic analysis of intervention options
The costing is based on secondary data. All costs and benefits are given at the HH level, since the
secondary data was not suitable for extrapolating total costs and benefits for Uttara and Mirpur as
a whole. Results should therefore be treated with caution.
11.1 Introduction
Economic analysis compares interventions on the basis of how much they cost and what benefits
they bring. This chapter presents a cost analysis of possible sanitation intervention options for the
slums of Uttara and Mirpur and a partial damage costing. The analysis spans the sanitation chain
and is broken down by cost component allowing a detailed view of where costs are incurred and
their significance in generating value for money.
Two key pieces of information are required to conduct this analysis. Firstly, an estimate of the
damage cost which monetises the negative consequences of poor sanitation i.e. the cost of doing
nothing. Secondly, an estimate of the costs of the proposed intervention is required. This second
component requires that there is a clear intervention designed for a well-defined population and
that the components of that intervention can be costed.
11.2 Methodology
Four hypothetical intervention options were tested; three non-conventional sewer models drawn
from the Low-Incomes Customers’ Service Improvement Plan (LICSIP) (DWASA 2015); and one
postulating a hypothetical situation for full fecal sludge management based on secondary cost
data drawn predominantly from an unpublished 2012 study (Mikhael (2012)). The damage cost
analysis is based on the survey data collected as part of this study, covering the health and time
cost impacts associated with diarrhoeal disease. There were insufficient data to model other
negative impacts associated with poor sanitation included in the damage cost module of the ESI
Toolkit (e.g. water resources, broader environmental impact, tourism etc.).
These intervention options are hypothetical and do not necessarily reflect what may be technically
feasible. The main objective is to illustrate the types of costs which might be incurred for different
interventions. The aim on the benefits side is a secondary one, and compares the benefits of the
hypothetical interventions leading to calculation of the net present value.
In each case, the sanitation chain was modelled for the whole population of Uttara and Mirpur. In
other words, for each of the three scenarios it is assumed that the whole population moves from
whatever they are currently using to a single homogenous sanitation option along the whole chain,
although in reality this is unlikely to happen
11.3 Sources and analysis of data
Data on intervention costs was collected from published and unpublished studies on the costs of
different sanitation technologies in different contexts. Where possible data was used that pertains
to Dhaka, where this was not possible this was expanded to include data available from other
urban areas of Bangladesh, and if not available, then other South and South East Asian cities. All
cost data were derived from secondary sources, and these are quite limited given the relatively low
number of comparable FSM systems (cf sewerage systems). The cost data available were often
lump sum costs and had to be converted into per capita costs. These secondary costs come in a
variety of units. First the costs are adjusted for inflation and all converted to Taka. Beyond that the

Report of a FSM study in Dhaka, Bangladesh
96
unit has to be adjusted before it can be applied to a population. All cost data were converted into a
per capita figure. For onsite technologies this is done based on the number of HHs that would use
that latrine. The logic behind this is that sharing latrines is widespread and the cost per capita is
largely driven by the extent of sharing. The survey conducted for the slum sample indicates that
78% of households share a latrine with 1 or more other households. On average, 7 households
share one latrine and given an average household size of 4.8, of those who share toilets the
average is 34 people sharing one latrine. In all models it is assumed that all HHs move to having a
private onsite facility, which represents a considerable and unrealistic change from the existing
situation especially given space constraints. Hence this analysis is illustrative only.
Per capita costs for the other parts of the sanitation chain (extraction and conveyance, treatment
and disposal and reuse) are estimated on a volumetric basis and as such are less sensitive to
assumptions surrounding sharing. The logic behind this is that the volume of fecal waste that any
system would need to deal with does not vary with the level of sharing; although the frequency of
extraction and conveyance will increase if many people are sharing a small facility. As such, the
costs associated with treatment and disposal and reuse are sensitive to assumptions surrounding
the volume of fecal matter produced per capita.
There is a danger in applying limited secondary data to hypothetical models. Firstly, the original
cost figure is rooted in the context from which it came; which is not necessarily the same as the
context in which they are being applied. In selecting the input data the costs most relevant to the
hypothetical situations were selected. The hypothetical options described also highlight the
situations in which the intervention would be suitable and the key assumptions used in calculating
the costs. The second major challenge is that it is not immediately apparent how the costs are
calculated in the secondary sources. If any given cost figure does not include the full costs of
delivering that part of the sanitation chain it will be underestimated relative to more complete
costings.
11.4 Summary of the three hypothetical intervention options
Four models were considered; the data sources for these and a brief summary of the proposed
models follows.
i) Full coverage of non-conventional sewerage I: small bore sewers connected to sewer
lines (SBSs).
Onsite facility and
collection
Extraction and
conveyance
Treatment Disposal and
Reuse
Technology Flush to sewer SBS Additional WWTP
capacity None
Main sources
of data Hutton (2012) DWASA (2015) DWASA (2015) -
Small bore sewers are small diameter pipes which rely on gravity to transport the waste directly
from the latrine into the conventional sewer system. They rely on a minimum of 50 lpcd of
greywater to move the blackwater through the system. This implies that all households convert to a
private ‘flush to sewer’ latrine from whatever they are using now (known from survey data), and the
sewers lead to WWTPs. The additional capacity required is built into the DWASA cost data. The
LICSIP report states that SBS are a good option for areas where there is a low risk of eviction, are

Report of a FSM study in Dhaka, Bangladesh
97
within 600 metres of a planned or existing DWASA sewer, and where there are few existing
operational septic tanks.
It should be noted that a SBS sewer system was installed in Mirpur in 1991 under the Dhaka Urban
Infrastructure Improvement Project (DUIIP); the system was not effectively commissioned and
subsequently failed. The reasons for the system’s failure include:
i) The institutional responsibilities were not defined for the various activities required to assure operations and maintenance.
ii) Lack of maintenance of the sewer system and de-sludging of the interceptor tanks may have led to early failure of the system.
iii) Only 50-60% of the original appraised pipe connections to interceptor/septic tanks were installed by the DUIIP. Un-served houses were probably never connected to the sewer pipes in order to minimise expenditure.
iv) The SBS system was developed for low income areas with single storey houses and one toilet per family. Presently most of the low income areas have developed to middle income areas with fully developed multi-storey buildings. The SBS system was reportedly not designed to serve the increased number of people and it is likely that parts of it have been destroyed during later development. The sizing of the pipes and interceptor tanks cannot meet the current needs in the middle income areas.
v) Community participation is a critical factor to ensure proper O&M of the facilities and ultimate delivery of services. Periodic cleaning of the interceptor tanks is the responsibility of the owners. However there are no septic tank sludge management facilities available in Dhaka and there is limited incentive for sludge tank emptying. The awareness of periodic interceptor tank de-sludging has not developed, as most of the tanks are not in use and are currently filled with garbage.
Consequently the DWASA Master Plan recommends that the SBS systems are not suitable for areas in which there is high population growth, areas where there is a high risk of population overspill from a growing area, and areas where it is anticipated that many multi story buildings will be constructed over the lifespan of the system. The LICSIP estimates that SBSs may be suitable for 30% of low income households.
ii) Full coverage of non-conventional sewerage II: small bore sewers connected to
Anaerobic Baffled Reactors (SBS ABR).
Onsite facility and
collection
Extraction and
conveyance
Treatment Disposal and
Reuse
Technology Flush to sewer SBS ABR Additional WWTP
capacity None
Main sources
of data DWASA (2015) DWASA (2015) DWASA (2015) -
ABRs are a form of decentralised waste water treatment that remove solids at points throughout
the network, the effluent flowing from the ABRs is largely solid free but high in pathogens and flows
on into the main network through SBSs. This route down the chain implies that all households
convert to a private flush to sewer latrine from whatever they are using now (known from survey
data), and those SBS lines lead to the ABRs which in turn are connected to the main sewer lines
via SBSs.
In the LICSIP SBSs with ABRs are taken to be a suitable option for communities that are farther
than 600 metres from a planned or existing DWASA sewer line and have suitable space for the
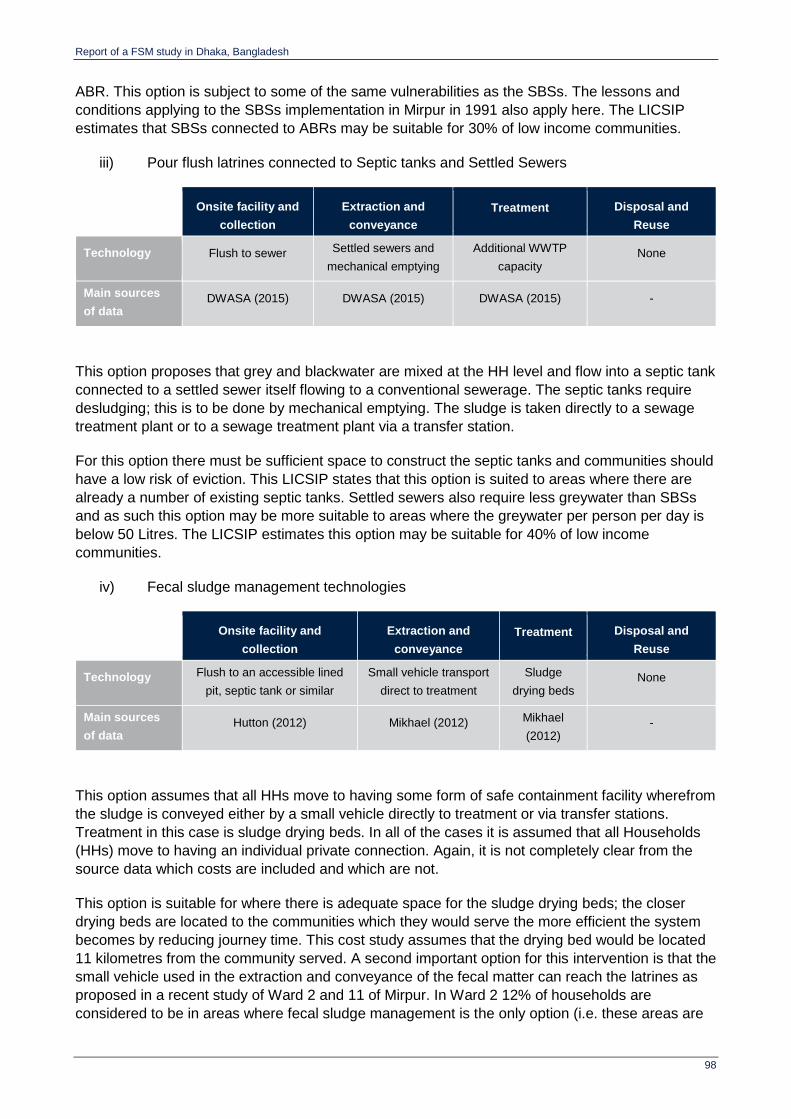
Report of a FSM study in Dhaka, Bangladesh
98
ABR. This option is subject to some of the same vulnerabilities as the SBSs. The lessons and
conditions applying to the SBSs implementation in Mirpur in 1991 also apply here. The LICSIP
estimates that SBSs connected to ABRs may be suitable for 30% of low income communities.
iii) Pour flush latrines connected to Septic tanks and Settled Sewers
Onsite facility and
collection
Extraction and
conveyance
Treatment Disposal and
Reuse
Technology Flush to sewer Settled sewers and
mechanical emptying
Additional WWTP
capacity None
Main sources
of data DWASA (2015) DWASA (2015) DWASA (2015) -
This option proposes that grey and blackwater are mixed at the HH level and flow into a septic tank
connected to a settled sewer itself flowing to a conventional sewerage. The septic tanks require
desludging; this is to be done by mechanical emptying. The sludge is taken directly to a sewage
treatment plant or to a sewage treatment plant via a transfer station.
For this option there must be sufficient space to construct the septic tanks and communities should
have a low risk of eviction. This LICSIP states that this option is suited to areas where there are
already a number of existing septic tanks. Settled sewers also require less greywater than SBSs
and as such this option may be more suitable to areas where the greywater per person per day is
below 50 Litres. The LICSIP estimates this option may be suitable for 40% of low income
communities.
iv) Fecal sludge management technologies
Onsite facility and
collection
Extraction and
conveyance
Treatment Disposal and
Reuse
Technology Flush to an accessible lined
pit, septic tank or similar
Small vehicle transport
direct to treatment
Sludge
drying beds None
Main sources
of data Hutton (2012) Mikhael (2012) Mikhael
(2012) -
This option assumes that all HHs move to having some form of safe containment facility wherefrom
the sludge is conveyed either by a small vehicle directly to treatment or via transfer stations.
Treatment in this case is sludge drying beds. In all of the cases it is assumed that all Households
(HHs) move to having an individual private connection. Again, it is not completely clear from the
source data which costs are included and which are not.
This option is suitable for where there is adequate space for the sludge drying beds; the closer
drying beds are located to the communities which they would serve the more efficient the system
becomes by reducing journey time. This cost study assumes that the drying bed would be located
11 kilometres from the community served. A second important option for this intervention is that the
small vehicle used in the extraction and conveyance of the fecal matter can reach the latrines as
proposed in a recent study of Ward 2 and 11 of Mirpur. In Ward 2 12% of households are
considered to be in areas where fecal sludge management is the only option (i.e. these areas are
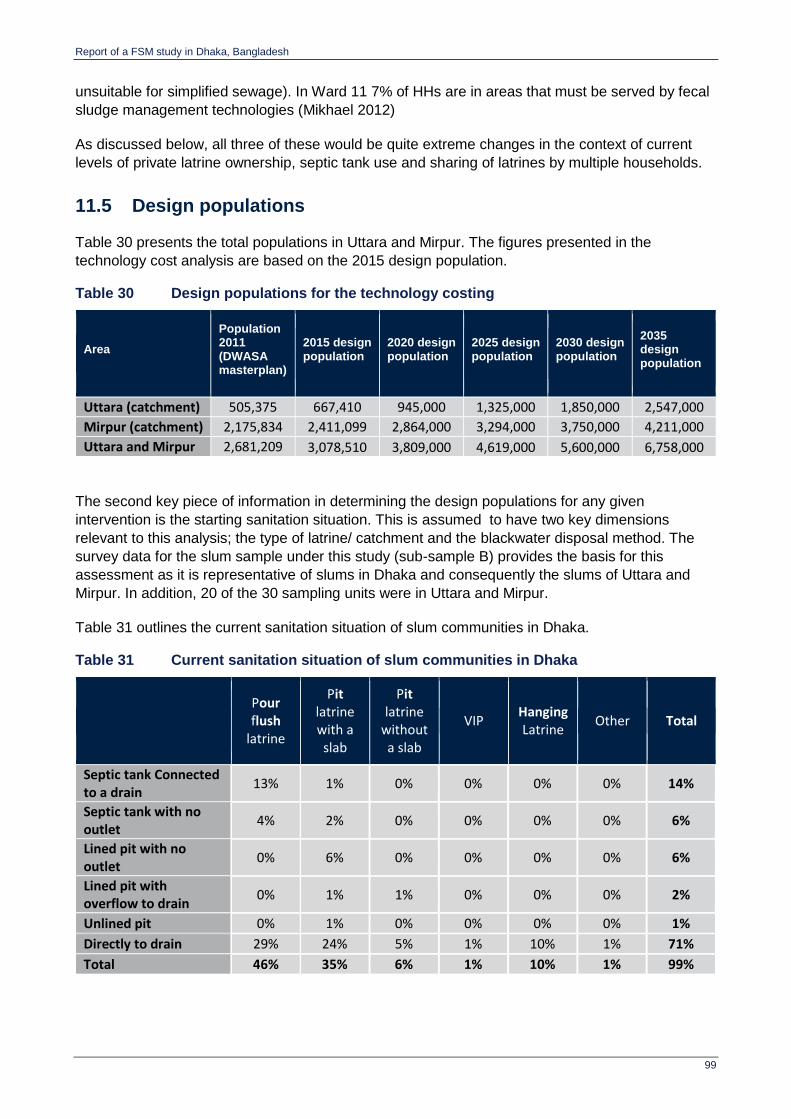
Report of a FSM study in Dhaka, Bangladesh
99
unsuitable for simplified sewage). In Ward 11 7% of HHs are in areas that must be served by fecal
sludge management technologies (Mikhael 2012)
As discussed below, all three of these would be quite extreme changes in the context of current
levels of private latrine ownership, septic tank use and sharing of latrines by multiple households.
11.5 Design populations
Table 30 presents the total populations in Uttara and Mirpur. The figures presented in the
technology cost analysis are based on the 2015 design population.
Table 30 Design populations for the technology costing
Area
Population 2011 (DWASA masterplan)
2015 design population
2020 design population
2025 design population
2030 design population
2035 design population
Uttara (catchment) 505,375 667,410 945,000 1,325,000 1,850,000 2,547,000
Mirpur (catchment) 2,175,834 2,411,099 2,864,000 3,294,000 3,750,000 4,211,000
Uttara and Mirpur 2,681,209 3,078,510 3,809,000 4,619,000 5,600,000 6,758,000
The second key piece of information in determining the design populations for any given
intervention is the starting sanitation situation. This is assumed to have two key dimensions
relevant to this analysis; the type of latrine/ catchment and the blackwater disposal method. The
survey data for the slum sample under this study (sub-sample B) provides the basis for this
assessment as it is representative of slums in Dhaka and consequently the slums of Uttara and
Mirpur. In addition, 20 of the 30 sampling units were in Uttara and Mirpur.
Table 31 outlines the current sanitation situation of slum communities in Dhaka.
Table 31 Current sanitation situation of slum communities in Dhaka
Pour flush
latrine
Pit latrine with a slab
Pit latrine
without a slab
VIP Hanging Latrine
Other Total
Septic tank Connected to a drain
13% 1% 0% 0% 0% 0% 14%
Septic tank with no outlet
4% 2% 0% 0% 0% 0% 6%
Lined pit with no outlet
0% 6% 0% 0% 0% 0% 6%
Lined pit with overflow to drain
0% 1% 1% 0% 0% 0% 2%
Unlined pit 0% 1% 0% 0% 0% 0% 1%
Directly to drain 29% 24% 5% 1% 10% 1% 71%
Total 46% 35% 6% 1% 10% 1% 99%

Report of a FSM study in Dhaka, Bangladesh
100
Where HHs already possess part of the proposed technology a proportion of the total secondary
cost was excluded. These is only done for the HHs facility not the other parts of the sanitation
chain as the rest of the sanitation chain is taken to be largely absent based on the slum SFD done
as part of this research.
11.6 Technology cost analysis
Figure 13 presents the total annualized costs for the three routes through the sanitation chain
which are proposed in the LICSIUP report. Annex E contains a table summarising the data
underscoring these calculations. Overall the SBS ABR option has the lowest overall cost per HH.
The FSM option is the cheapest with regard to treatment and the most expensive with regards to
onsite facilities (i.e. containment). This is largely driven by the high conveyance costs associated
with the FSM option, this is discussed more below.
The graphs presented below use abbreviations for the different options; Table 32 is a key to these.
Table 32 Key to abbreviations used
Abbreviation Description
FSM The fecal sludge management option – Fecal waste is emptied by a vacutug and
transported directly to sludge drying beds.
SBS Small Bore Sewers connected to DWASA main sewers.
SBS ABR Small bore sewers connected to DWASA sewers via anaerobic baffled reactors
ST to SS Septic tanks connected to settled sewers themselves connected to DWASA sewers.
Figure 13 Total annualized costs of technology options for Mirpur and Uttara
Figures 14, 15, and 16 present the cost components of each option and each part of the sanitation
chain, by cost category. The other key driver of costs are the recurrent and capital maintenance
$0
$10
$20
$30
$40
$50
$60
৳ 0
৳ 500
৳ 1,000
৳ 1,500
৳ 2,000
৳ 2,500
৳ 3,000
৳ 3,500
৳ 4,000
৳ 4,500
Onsite Extraction and conveyance offecal waste
Treatment
USD
BD
T
Total annualized financial cost
FSM SBS SBS ABR ST to SS
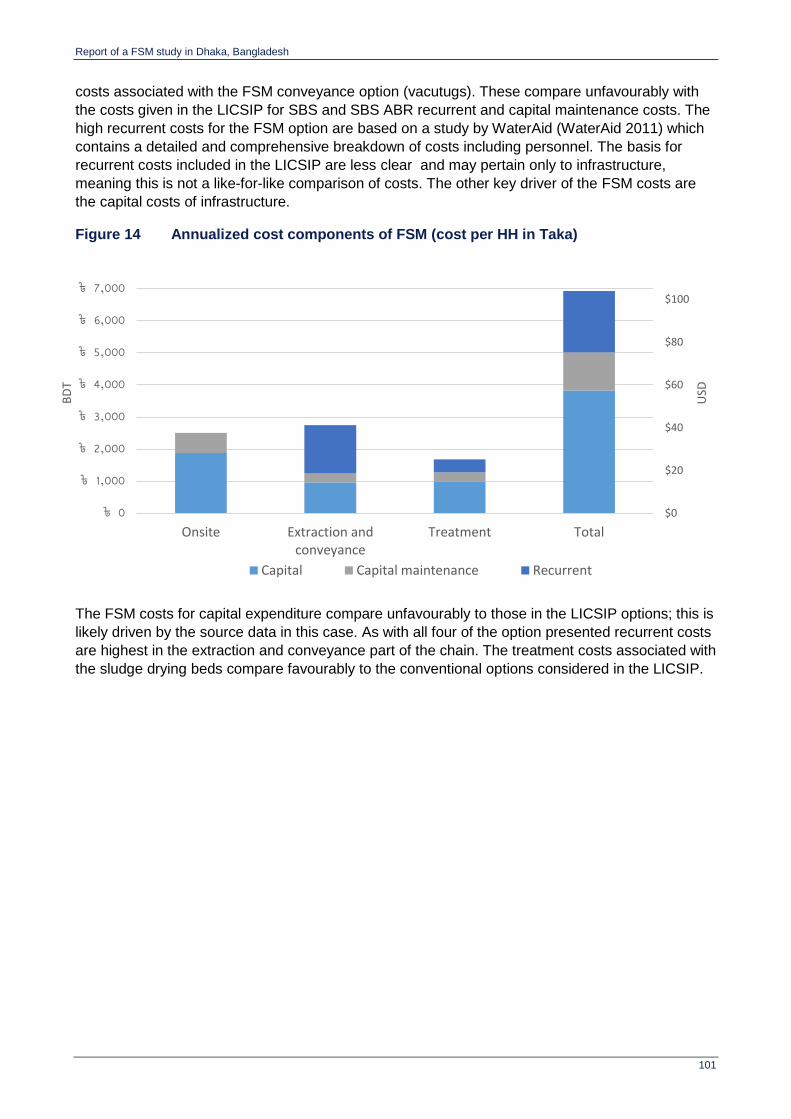
Report of a FSM study in Dhaka, Bangladesh
101
costs associated with the FSM conveyance option (vacutugs). These compare unfavourably with
the costs given in the LICSIP for SBS and SBS ABR recurrent and capital maintenance costs. The
high recurrent costs for the FSM option are based on a study by WaterAid (WaterAid 2011) which
contains a detailed and comprehensive breakdown of costs including personnel. The basis for
recurrent costs included in the LICSIP are less clear and may pertain only to infrastructure,
meaning this is not a like-for-like comparison of costs. The other key driver of the FSM costs are
the capital costs of infrastructure.
Figure 14 Annualized cost components of FSM (cost per HH in Taka)
The FSM costs for capital expenditure compare unfavourably to those in the LICSIP options; this is
likely driven by the source data in this case. As with all four of the option presented recurrent costs
are highest in the extraction and conveyance part of the chain. The treatment costs associated with
the sludge drying beds compare favourably to the conventional options considered in the LICSIP.
$0
$20
$40
$60
$80
$100
৳ 0
৳ 1,000
৳ 2,000
৳ 3,000
৳ 4,000
৳ 5,000
৳ 6,000
৳ 7,000
Onsite Extraction andconveyance
Treatment Total
USD
BD
T
Capital Capital maintenance Recurrent
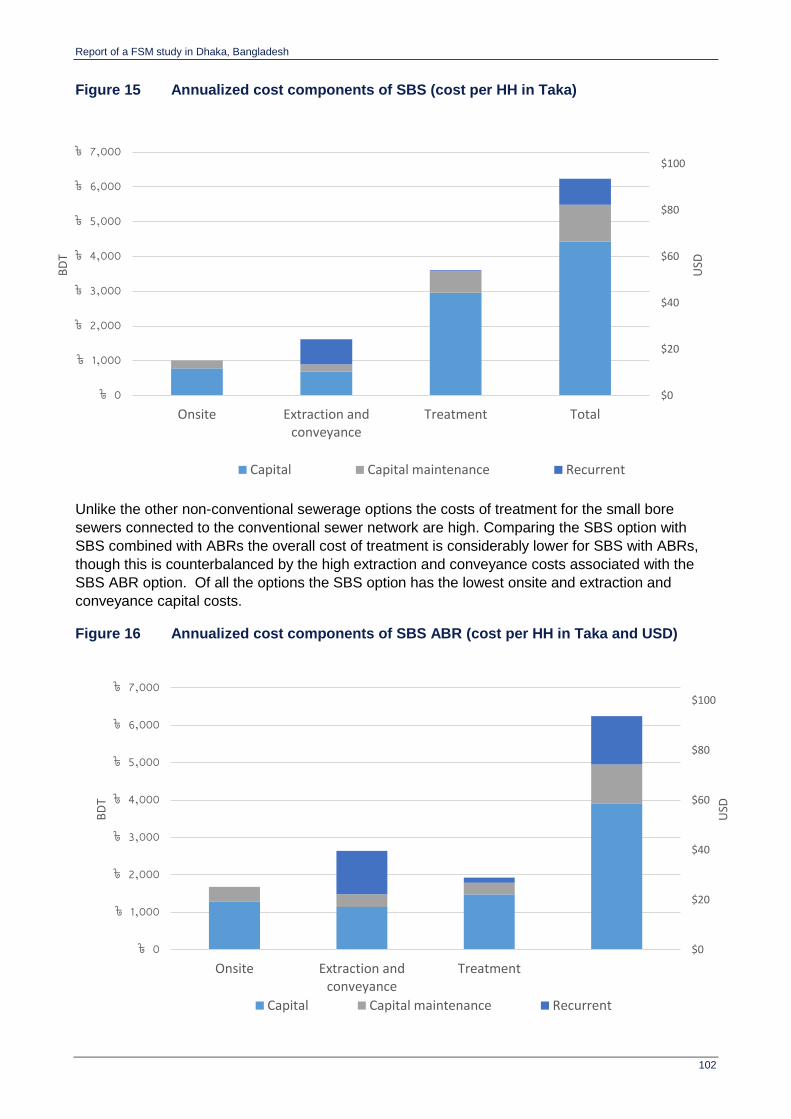
Report of a FSM study in Dhaka, Bangladesh
102
Figure 15 Annualized cost components of SBS (cost per HH in Taka)
Unlike the other non-conventional sewerage options the costs of treatment for the small bore
sewers connected to the conventional sewer network are high. Comparing the SBS option with
SBS combined with ABRs the overall cost of treatment is considerably lower for SBS with ABRs,
though this is counterbalanced by the high extraction and conveyance costs associated with the
SBS ABR option. Of all the options the SBS option has the lowest onsite and extraction and
conveyance capital costs.
Figure 16 Annualized cost components of SBS ABR (cost per HH in Taka and USD)
$0
$20
$40
$60
$80
$100
৳ 0
৳ 1,000
৳ 2,000
৳ 3,000
৳ 4,000
৳ 5,000
৳ 6,000
৳ 7,000
Onsite Extraction andconveyance
Treatment Total
USD
BD
T
Capital Capital maintenance Recurrent
$0
$20
$40
$60
$80
$100
৳ 0
৳ 1,000
৳ 2,000
৳ 3,000
৳ 4,000
৳ 5,000
৳ 6,000
৳ 7,000
Onsite Extraction andconveyance
Treatment
USD
BD
T
Capital Capital maintenance Recurrent
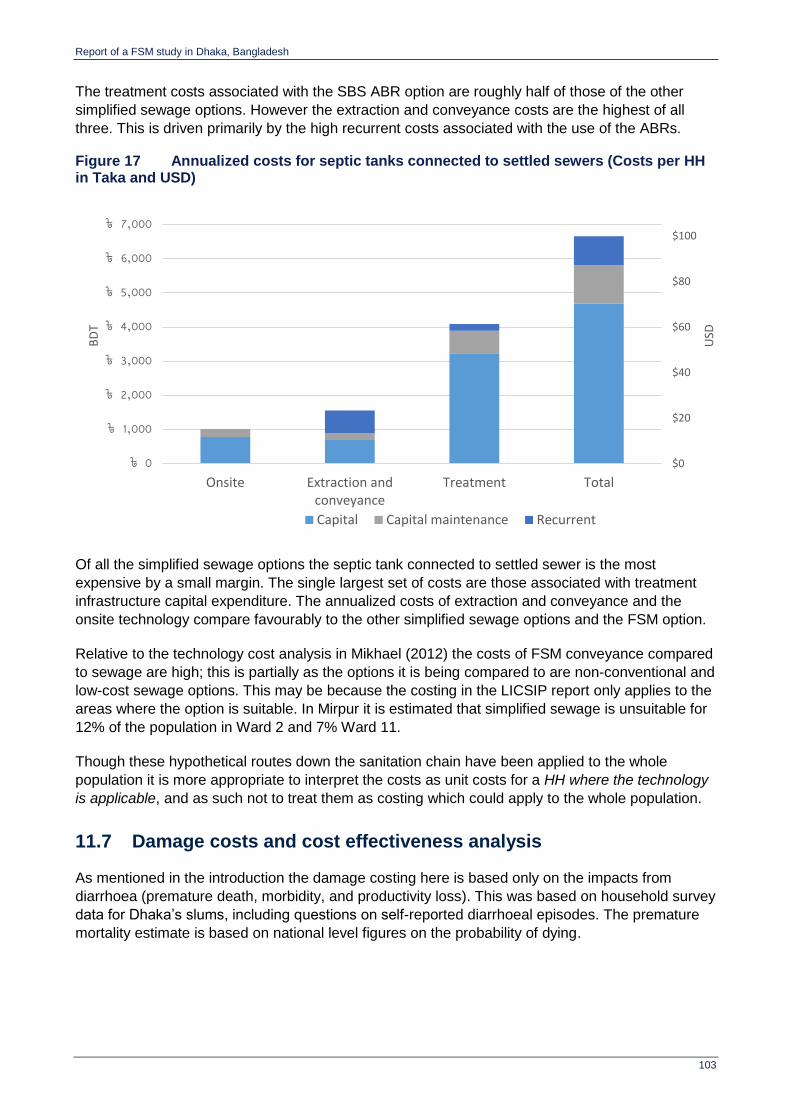
Report of a FSM study in Dhaka, Bangladesh
103
The treatment costs associated with the SBS ABR option are roughly half of those of the other
simplified sewage options. However the extraction and conveyance costs are the highest of all
three. This is driven primarily by the high recurrent costs associated with the use of the ABRs.
Figure 17 Annualized costs for septic tanks connected to settled sewers (Costs per HH in Taka and USD)
Of all the simplified sewage options the septic tank connected to settled sewer is the most
expensive by a small margin. The single largest set of costs are those associated with treatment
infrastructure capital expenditure. The annualized costs of extraction and conveyance and the
onsite technology compare favourably to the other simplified sewage options and the FSM option.
Relative to the technology cost analysis in Mikhael (2012) the costs of FSM conveyance compared
to sewage are high; this is partially as the options it is being compared to are non-conventional and
low-cost sewage options. This may be because the costing in the LICSIP report only applies to the
areas where the option is suitable. In Mirpur it is estimated that simplified sewage is unsuitable for
12% of the population in Ward 2 and 7% Ward 11.
Though these hypothetical routes down the sanitation chain have been applied to the whole
population it is more appropriate to interpret the costs as unit costs for a HH where the technology
is applicable, and as such not to treat them as costing which could apply to the whole population.
11.7 Damage costs and cost effectiveness analysis
As mentioned in the introduction the damage costing here is based only on the impacts from
diarrhoea (premature death, morbidity, and productivity loss). This was based on household survey
data for Dhaka’s slums, including questions on self-reported diarrhoeal episodes. The premature
mortality estimate is based on national level figures on the probability of dying.
$0
$20
$40
$60
$80
$100
৳ 0
৳ 1,000
৳ 2,000
৳ 3,000
৳ 4,000
৳ 5,000
৳ 6,000
৳ 7,000
Onsite Extraction andconveyance
Treatment Total
USD
BD
T
Capital Capital maintenance Recurrent
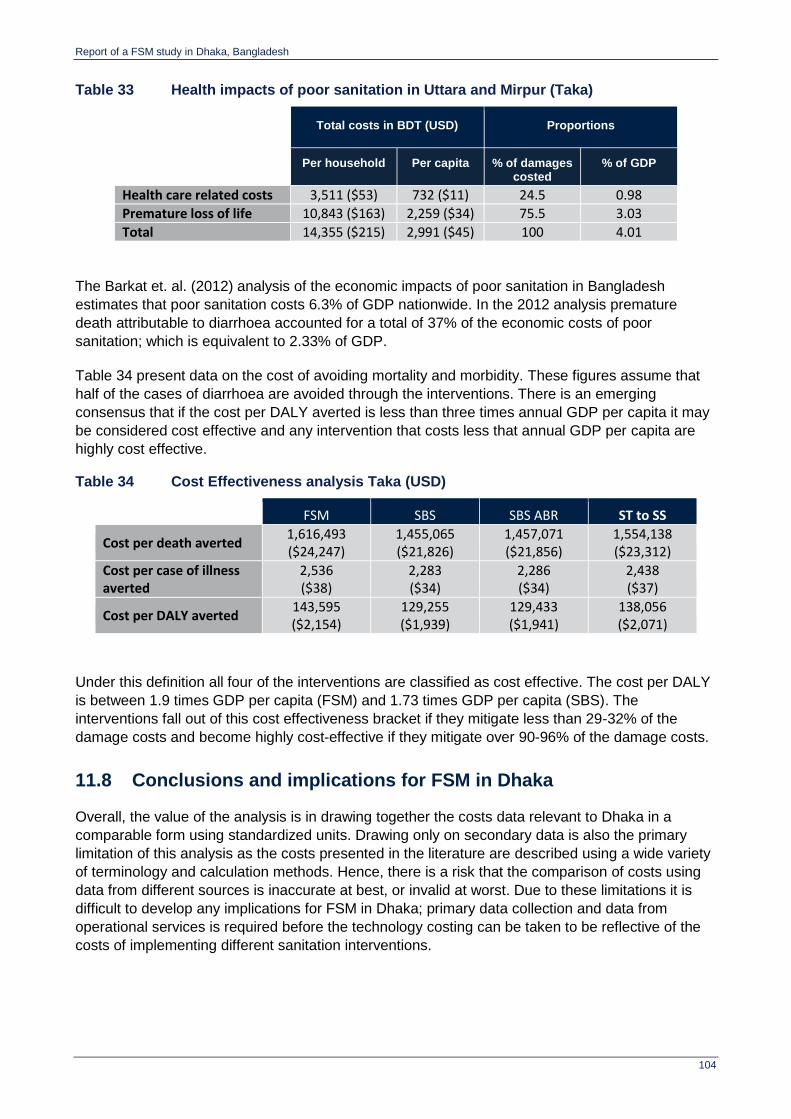
Report of a FSM study in Dhaka, Bangladesh
104
Table 33 Health impacts of poor sanitation in Uttara and Mirpur (Taka)
Total costs in BDT (USD) Proportions
Per household Per capita % of damages costed
% of GDP
Health care related costs 3,511 ($53) 732 ($11) 24.5 0.98
Premature loss of life 10,843 ($163) 2,259 ($34) 75.5 3.03
Total 14,355 ($215) 2,991 ($45) 100 4.01
The Barkat et. al. (2012) analysis of the economic impacts of poor sanitation in Bangladesh
estimates that poor sanitation costs 6.3% of GDP nationwide. In the 2012 analysis premature
death attributable to diarrhoea accounted for a total of 37% of the economic costs of poor
sanitation; which is equivalent to 2.33% of GDP.
Table 34 present data on the cost of avoiding mortality and morbidity. These figures assume that
half of the cases of diarrhoea are avoided through the interventions. There is an emerging
consensus that if the cost per DALY averted is less than three times annual GDP per capita it may
be considered cost effective and any intervention that costs less that annual GDP per capita are
highly cost effective.
Table 34 Cost Effectiveness analysis Taka (USD)
FSM SBS SBS ABR ST to SS
Cost per death averted 1,616,493 ($24,247)
1,455,065 ($21,826)
1,457,071 ($21,856)
1,554,138 ($23,312)
Cost per case of illness averted
2,536 ($38)
2,283 ($34)
2,286 ($34)
2,438 ($37)
Cost per DALY averted 143,595 ($2,154)
129,255 ($1,939)
129,433 ($1,941)
138,056 ($2,071)
Under this definition all four of the interventions are classified as cost effective. The cost per DALY
is between 1.9 times GDP per capita (FSM) and 1.73 times GDP per capita (SBS). The
interventions fall out of this cost effectiveness bracket if they mitigate less than 29-32% of the
damage costs and become highly cost-effective if they mitigate over 90-96% of the damage costs.
11.8 Conclusions and implications for FSM in Dhaka
Overall, the value of the analysis is in drawing together the costs data relevant to Dhaka in a
comparable form using standardized units. Drawing only on secondary data is also the primary
limitation of this analysis as the costs presented in the literature are described using a wide variety
of terminology and calculation methods. Hence, there is a risk that the comparison of costs using
data from different sources is inaccurate at best, or invalid at worst. Due to these limitations it is
difficult to develop any implications for FSM in Dhaka; primary data collection and data from
operational services is required before the technology costing can be taken to be reflective of the
costs of implementing different sanitation interventions.
Report of a FSM study in Dhaka, Bangladesh
105
12 Conclusion
This report has outlined the main findings of a case study on faecal sludge management in Dhaka,
Bangladesh. This section concludes summarising the key points of each aspect of the analysis. It
ends with recommended intervention options, as well as implications of the ‘prognosis for change’.
Fecal waste flow diagrams (SFDs) were constructed based on a household survey and secondary
data, one for the a city-wide situation and one for a slum-specific view. The analysis makes it clear
that in both cases, almost all fecal sludge ends up in the drains or environment one way or another.
Only 10% of households city-wide have experiencing a pit filling up.
Analysis of demand and supply for FSM services finds that demand is very low and supply is
weak. That is not surprising in the context of the SFD, and particularly the household survey finding
that only 13% of households city-wide who had a toilet with a pit or septic tank had ever experienced
it filling up. The drains are effectively running as sewers. Various other facts affecting demand for
FSM services (type of building, accessibility of facility, fill rate and the extent of sharing) are also
considered. On the supply side, there are very few mechanical emptiers in operation. The bulk of
service provision, when demanded, is carried out by manual emptiers. Of those households who had
emptied a pit tank city-wide, 97% had used a manual emptier last time. This is also reflected in
reported intentions next time the pit or tank filled up.
Findings from the transect walks emphasise that all of Dhaka is affected by poor FSM – it is not
only a problem for slum-dwellers. Latrines empty into drains throughout the city, and drains run
through all areas – slums and non-slums. Having large amounts of FS in the drains and environment
is an externality which affects everyone in Dhaka. Therefore, poor FSM is not only a private
household matter – it is a public health and environmental hazard.
The Service Delivery Assessment shows that there is a severe shortage of public policy, capital
investment and operational oversight of FSM services throughout Dhaka. This allows the current
practice of latrines emptying into drains, in place of safe emptying practices, to continue. This in turn
removes many of the efforts and financial costs required to achieve effective construction,
management and maintenance of appropriate infrastructure. The result is significant challenges for
finding solutions, which will only come about when an FSM Framework translates into clearly
defined, capacitated and financed action. The overall aim of the Framework and actions must
therefore be to provide a fully-functioning service chain for all of Dhaka’s fecal waste flows. This
requires recognition of the scale of the problem, dialogue and engagement of public, private and civil
society bodies to ensure appropriate infrastructure and services can be systematically developed
and adapted to respond to the various contextual challenges of the city (space, tenancy, flooding,
poverty, etc.).
All of this suggests that bringing change to fecal sludge management practices in Dhaka will demand
significant reform of the regulatory systems that currently govern all stages of the service chain. In
the context of the general failure of existing regulatory systems, clearly segregating the roles for
regulation of failure by central government, from that of licensing of compliance by local
governments, from that of service management by providers, may improve the incentives for overall
compliance and investment.
Economic analysis of four hypothetical intervention options was undertaken, three of which are
non-conventional sewer models and one of which was full fecal sludge management. This aimed to
illustrate the types of costs which might be incurred for different interventions. In each case, the
sanitation chain was modelled for the whole population of Uttara and Mirpur, where an intervention
financed by the World Bank is to take place. Since the analysis is hypothetical, its value is in drawing

Report of a FSM study in Dhaka, Bangladesh
106
together the costs data relevant to Dhaka in a comparable form using standardized units. There is a
risk that the comparison of costs using data from different sources is inaccurate at best, or invalid at
worst. Due to these limitations it is difficult to develop any implications for FSM in Dhaka; primary
data collection and data from operational services is required before the technology costing can be
taken to be reflective of the costs of implementing different sanitation interventions.
A ‘Prognosis for Change’ assessment surmises that the externalities of poor FSM are both public
and dispersed, whereas addressing the lack of proper containment would involve private costs (from
households and property developers). A credible threat of enforcement, which would raise the cost
of inaction on the part of these stakeholders, is therefore critical. Proper containment will require the
enforcement of ensuring existing emptiable systems (pit/tank) are disconnected from drains, that
existing non-emptiable systems are upgraded, and that newly-constructed buildings have an
appropriate containment system. Change is achievable on this front, but interventions will not be
successful unless they address the incentives which deliver the current outcome, which is the drains
running as sewers.
Recommended intervention options from the study are identified, grouped according to the key
stages of the sanitation service chain. These relate to the following areas, and are discussed in detail
in section 10.
Formalised and operational transport, treatment and end-use stages of the fecal sludge service
chain need to be identified and put in place, enabling fecal sludge to be safely received, treated
and managed as upstream arrangements are improved. Effective business and financial
models will be needed for each stage.
Systematic and progressive steps to improve existing containment infrastructure must include
disconnecting latrine outlets from drains as alternative ‘outlets’ are introduced. Newly-
constructed buildings should not be permitted to discharge fecal materials to drains. For on-site
systems, the aim must be to introduce correctly built containment that enables systematic and
safe emptying services to function.
A range of affordable mechanical, or improved manual, emptying services are needed that can
respond quickly to demand, especially for shared sanitation facilities and for the urban poor.
Licencing, service agreements and contracts can help service providers to invest in improved
business operations, as well as improve regulation to achieve service standards.
The main implication of the study’s findings for FSM in Dhaka are that it is crucial to maintain
momentum on the emerging reform agenda. Progress could easily stall if opposing forces emerge
to try and block it, or if DCC and DWASA drop it due to lack of priority. While the status quo suits
almost everybody, there are also many stakeholders who would gain from reform as well. Influential
stakeholders who risk losses are households and property developers, so special care must be taken
to try and win them over.
The intervention options proposed were developed based on the prognosis for change (PFC).
Therefore, they are all deemed feasible, if carried out in an appropriate sequence with the
engagement of the right stakeholders. However, there are some factors which will require special
consideration in light of the PFC, particularly the stakeholder analysis. That factor is enforcement of
laws and regulations, particularly at the containment stage of the chain.
There are three key aspects of this: (i) ensuring existing emptiable systems are disconnected from
drains (or replaced with an appropriate sewered option), (ii) ensuring existing non-emptiable systems
are upgraded, (iii) ensuring newly constructed buildings have an appropriate system. Each of these
is a slightly different problem, but all have one thing in common. There is currently little incentive for

Report of a FSM study in Dhaka, Bangladesh
107
the household or property developer concerned to act. This is because the externality is public and
dispersed, while addressing the problem would involve the stakeholder incurring private costs
themselves.
Therefore, it is crucial that interventions aimed at converting existing containment infrastructure, or
ensuring developers don’t break the law, are planned in the context of this incentive problem. Public
education will not be enough. There must be a credible threat of penalties, through publicising of
fines imposed on households and developers. It would be worth studying other sectors in Dhaka
which have successfully enforced the law in this way and, if there are no examples, looking further
afield in Bangladesh or to other countries..
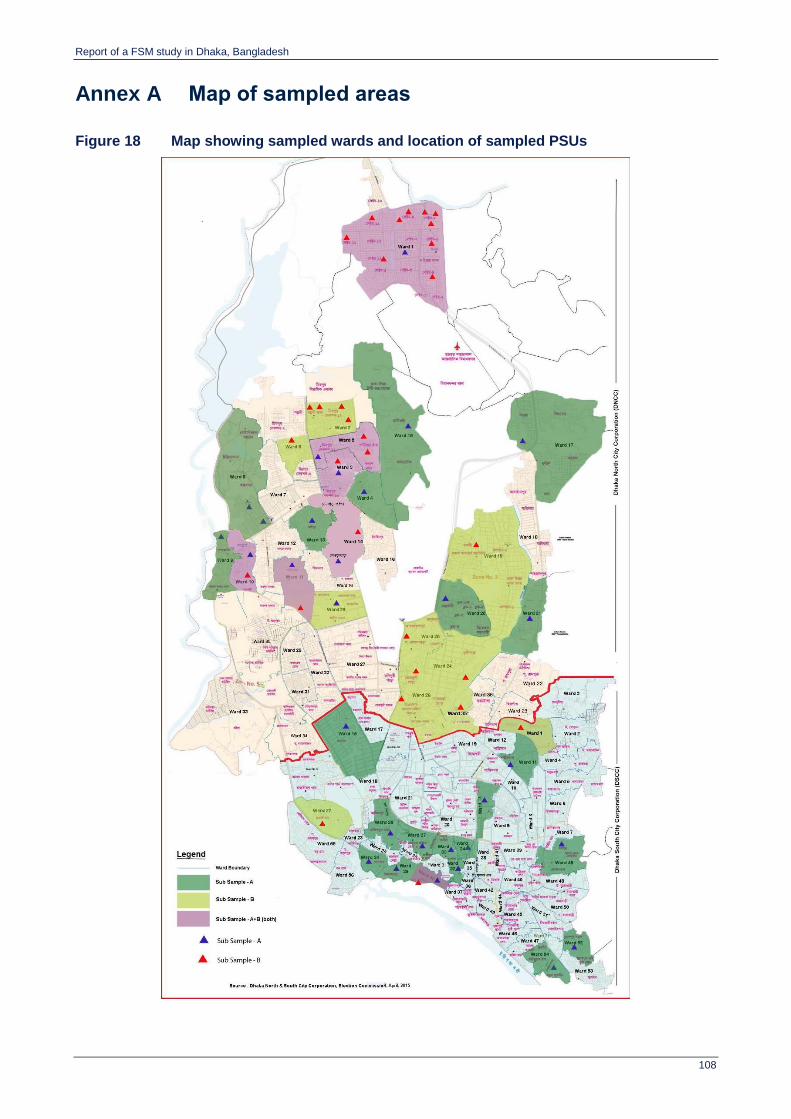
Report of a FSM study in Dhaka, Bangladesh
108
Annex A Map of sampled areas
Figure 18 Map showing sampled wards and location of sampled PSUs

Report of a FSM study in Dhaka, Bangladesh
109
Annex B Faecal Waste Flow matrices
This section contains the raw data which goes into producing the SFDs. As an example, in the city-wide matrix in Figure 19 below, 21% of households in Dhaka use an OSS latrine which empties straight to a drain without any intermediate containment. A further 54% use an OSS latrine which in theory empties to a septic tank or pit which contains FS, but in reality the vast majority of these pits/tanks (84%) are also connected to drains. Therefore, FS is only partially contained and eventually, as the chamber becomes full, it will flow through to the drain any intermediate storage. As a consequence, only 8% of households’ FS is actually emptied (54% * 16% = 8%). Figure 19 Faecal Waste Flow matrix – city-wide sample
Figure 20 Faecal Waste Flow matrix – slum sample
Overall
Dhaka - city-wide Safe:
Type of systemcontained
not
containedemptied
not
emptiedtransported
not
transportedtreated
not
treated0.3%
25% 100% 0% 100% 0% 7% 93% 17% 83%
25% 0% 25% 0% 2% 23% 0% 1% 0.3%
54% 100% 0% 16% 84% 0% 100% 0% 100%
54% 0% 8% 46% 0% 8% 0% 0% 0.0%
0% 100% 0%
0% 0%
21% 0% 100%
0% 21%
0% 0% 100%
0% 0%
Containment 79% Emptying 79% Transport 79% Treatment 2%
Unsafe: 100% 21% 46% 31% 1%
Affected zones (you can adapt the terms to
suit the context)
from household survey
from secondary data
de facto value
Containment Emptying Transport Treatment
% pop.
using
of which of which of which of which
Sewered (off site centralised or decentralised)
On-site storage - emptiable
On-site storage - single-use / pit sealed
On-site non-storage - straight to drain/similar
Open defecation
Local area and beyond via
drains (amount direct to
groundwater not identified)
Local area (via
overflowing latrines or
dumped FS)
Neighbourhood (via
leakage/overflow from
sewers or drains)
Receiving waters (via
sewer
outfall/discharge)
Overall
Dhaka - slums Safe:
Type of system
containednot
containedemptied
not
emptiedtransported
not
transportedtreated
not
treated0%
0% 100% 0% 100% 0% 25% 75% 25% 75%
0% 0% 0% 0% 0% 0% 0% 0% 0%
29% 100% 0% 35% 65% 0% 100% 0% 100%
29% 0% 10% 19% 0% 10% 0% 0% 0%
0% 100% 0%
0% 0%
71% 0% 100%
0% 71%
0% 0% 100%
0% 0%
Containment 29% Emptying 29% Transport 29% Treatment 0%
Unsafe: 100% 71% 19% 10% 0%
Affected zones (you can adapt the terms to
suit the context)
from household survey
from secondary data
de facto value
Containment Emptying Transport Treatment
Sewered (off site centralised or decentralised)
On-site storage - emptiable
On-site storage - single-use / pit sealed
On-site non-storage - straight to drain/similar
Open defecation
% pop.
using
Local area and beyond via
drains (amount direct to
groundwater not identified)
Local area (via
overflowing latrines
or dumped FS)
Neighbourhood (via
leakage/overflow from
sewers or drains)
Receiving waters (via
sewer
outfall/discharge)
of which of which of which of which

Report of a FSM study in Dhaka, Bangladesh
110
Annex C CSDA scoring table criteria In
dic
ato
r
Question
Co
nta
inm
en
t
Emp
tyin
g
Co
nve
yan
ce
Tre
atm
en
t
End
-use
dis
po
sal
Comment
Po
licy
Policy: Is FSM included in an appropriate, acknowledged and
available policy document (National/ local or both)?
0.5 0 0 0 0
There is scant mention of FSM in the any of the major sector policy documents in Bangladesh. There are numerous policy documents relating to eradicating open defecation and promoting safe sanitation but little mention of FSM. In Dhaka, till recently, the issue of FSM was almost completely invisible in policies and strategy documents. The recent D-WASA master plan mentions an increasing role for D-WASA in FSM but this requires agreement with the CC's. The recently drafted national water supply & sanitation strategy has a chapter on FSM and a draft FSM Framework has been drafted by BUET for Dhaka with support of the Gates Foundation.
Institutional roles: Are the institutional roles and
responsibilities for FSM service delivery clearly defined and
operationalized?
0.5 0 0 0 0
In Bangladesh, the role of managing sanitation is assigned to local governments under the respective City Corporation, Paurashava and Union Parishad Actcs, however FSM is not explicitly identified nor recognized as a responsibility of anyone. While dejure the responsibility of FSM was assigned to Dhaka City Corporations (North & South), defacto the City Corporation's have been oblivious of the need to manage fecal sludge (or indeed their responsibilities for FSM). A draft FSM framework for Dhaka has been developed by BUET which lays out the roles and responsibilities for the various organizations (DCC, DWASA, RAJUK). This has led to the creation of a Ministry steering committee to oversee the development of a national framework for FSM. Containment is assigned to households but the common practice is to connect to open drains.
Regulation: Are there national and/or local regulatory
mechanisms (i.e. bylaws and means of enforcement) for FSM?
0.5 0 0 0 0
RajUK plays the key role in Dhaka of regulating household behaviour in regards to the creation of assets for the containment of fecal sludge however RaJUK is NOT monitoring 'as built' construction sufficiently to stop households from connecting the black / grey water from new buildings directly to the storm water drains. The City Corporations are responsible for regulating household behaviour in managing on-site sanitation systems and entrepreneur behaviour in managing fecal sludge emptying, transporting & treating processes however they are unaware of this responsibility and have no engagement in this regard. DWASA bylaws forbid the connection of toilets and septic tanks to the storm water drains, however this is not reinforced at all. The Ministry of Environment has dedicated significant resources to regulating industrial effluent with apparently neglible effect. It has not yet focused on the regulation of sewage / fecal sludge discharges.
Service provision: does the policy, legislative and regulatory framework enable investment
and involvement in FSM services by appropriate service providers
(private or public)?
0.5 0.5 0 0 0
The existing legal documents do not even recognize the existence of fecal sludge management and therefore there is nothing that either enables or nothing that limits any investments in fecal sludge management practices. In Dhaka, the emptying of pits / septic tanks is undertaken by private sweepers and the emptying of drains is undertaken by government contract sweepers. While trade licenses (issued by the City Corporation) are generally required for those engaged in formal trade, the fully informal nature of fecal sludge management services means that this is not undertaken. D-WASA has given permission for 2 NGOs that operate mechanical emptying systems the permission to discharge the contents of the VacuTug into the intake of 2 of the 30 of the D-WASA sewage pump stations.
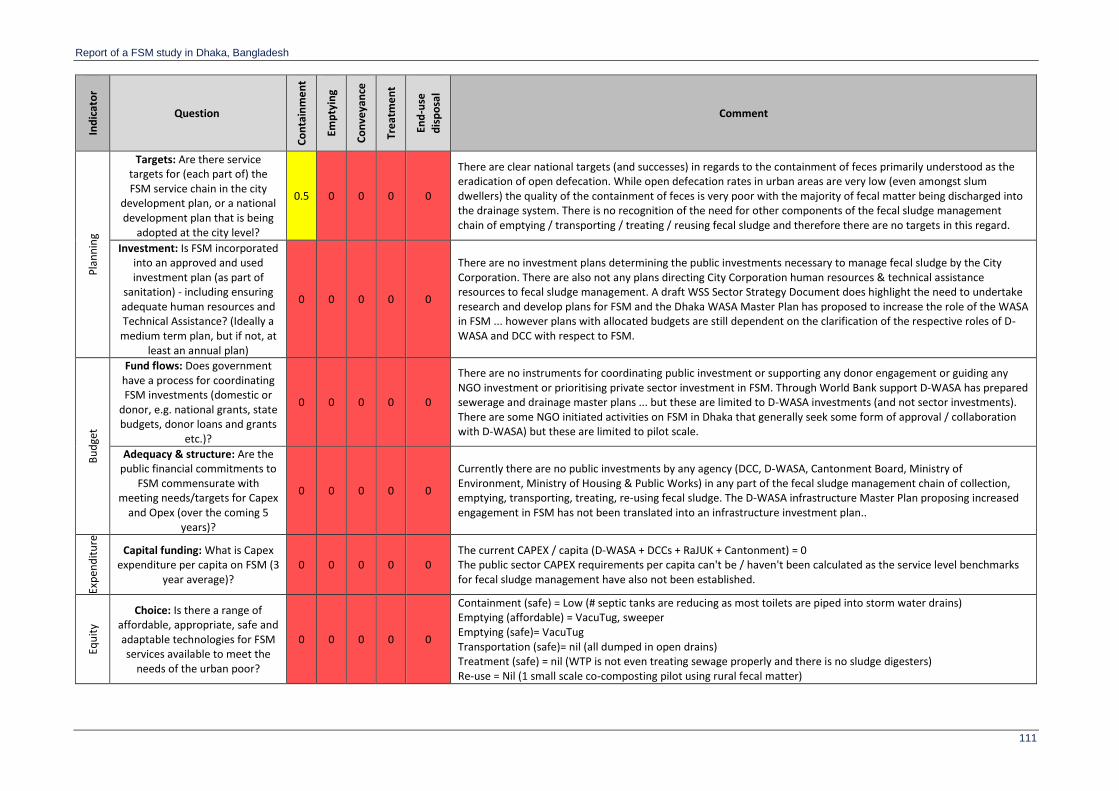
Report of a FSM study in Dhaka, Bangladesh
111
Ind
icat
or
Question
Co
nta
inm
en
t
Emp
tyin
g
Co
nve
yan
ce
Tre
atm
en
t
End
-use
dis
po
sal
Comment
Pla
nn
ing
Targets: Are there service targets for (each part of) the FSM service chain in the city
development plan, or a national development plan that is being
adopted at the city level?
0.5 0 0 0 0
There are clear national targets (and successes) in regards to the containment of feces primarily understood as the eradication of open defecation. While open defecation rates in urban areas are very low (even amongst slum dwellers) the quality of the containment of feces is very poor with the majority of fecal matter being discharged into the drainage system. There is no recognition of the need for other components of the fecal sludge management chain of emptying / transporting / treating / reusing fecal sludge and therefore there are no targets in this regard.
Investment: Is FSM incorporated into an approved and used investment plan (as part of
sanitation) - including ensuring adequate human resources and Technical Assistance? (Ideally a
medium term plan, but if not, at least an annual plan)
0 0 0 0 0
There are no investment plans determining the public investments necessary to manage fecal sludge by the City Corporation. There are also not any plans directing City Corporation human resources & technical assistance resources to fecal sludge management. A draft WSS Sector Strategy Document does highlight the need to undertake research and develop plans for FSM and the Dhaka WASA Master Plan has proposed to increase the role of the WASA in FSM ... however plans with allocated budgets are still dependent on the clarification of the respective roles of D-WASA and DCC with respect to FSM.
Bu
dge
t
Fund flows: Does government have a process for coordinating FSM investments (domestic or
donor, e.g. national grants, state budgets, donor loans and grants
etc.)?
0 0 0 0 0
There are no instruments for coordinating public investment or supporting any donor engagement or guiding any NGO investment or prioritising private sector investment in FSM. Through World Bank support D-WASA has prepared sewerage and drainage master plans ... but these are limited to D-WASA investments (and not sector investments). There are some NGO initiated activities on FSM in Dhaka that generally seek some form of approval / collaboration with D-WASA) but these are limited to pilot scale.
Adequacy & structure: Are the public financial commitments to
FSM commensurate with meeting needs/targets for Capex
and Opex (over the coming 5 years)?
0 0 0 0 0
Currently there are no public investments by any agency (DCC, D-WASA, Cantonment Board, Ministry of Environment, Ministry of Housing & Public Works) in any part of the fecal sludge management chain of collection, emptying, transporting, treating, re-using fecal sludge. The D-WASA infrastructure Master Plan proposing increased engagement in FSM has not been translated into an infrastructure investment plan..
Exp
end
itu
re
Capital funding: What is Capex expenditure per capita on FSM (3
year average)? 0 0 0 0 0
The current CAPEX / capita (D-WASA + DCCs + RaJUK + Cantonment) = 0 The public sector CAPEX requirements per capita can't be / haven't been calculated as the service level benchmarks for fecal sludge management have also not been established.
Equ
ity
Choice: Is there a range of affordable, appropriate, safe and adaptable technologies for FSM services available to meet the
needs of the urban poor?
0 0 0 0 0
Containment (safe) = Low (# septic tanks are reducing as most toilets are piped into storm water drains) Emptying (affordable) = VacuTug, sweeper Emptying (safe)= VacuTug Transportation (safe)= nil (all dumped in open drains) Treatment (safe) = nil (WTP is not even treating sewage properly and there is no sludge digesters) Re-use = Nil (1 small scale co-composting pilot using rural fecal matter)

Report of a FSM study in Dhaka, Bangladesh
112
Ind
icat
or
Question
Co
nta
inm
en
t
Emp
tyin
g
Co
nve
yan
ce
Tre
atm
en
t
End
-use
dis
po
sal
Comment
Reducing inequity: Are there specific and adequate funds,
plans and measures to ensure FSM serves all users, and
specifically the urban poor?
0 0 0 0 0
No funds/systems/procedures for making FSM services available to the urban poor and there is no criteria codified in policy/strategy/ orders/acts for making FSM services available to the rich (let alone the poor). The urban poor are the only ones that really cannot afford to connect their toilets to the deep storm water drains, however for emptying & transportation they engage manual emptiers who will generally dump waste at the closest location thus polluting the same waterways. The proposal to introduce an environmental sanitation tax for FSM (linked to holding tax) could be an opportunity for local management of the externality of FSM to be rewarded by channelling resources back to LIC areas.
Ou
tpu
ts
Quantity / capacity: Is the capacity of the FSM chain
growing at the pace required to ensure access to FSM meets the needs and targets that protects public & environmental health?
0 0 0 0 0
There appears to be a decline in the fecal sludge emptying part of the service delivery chain as there appears to be fewer septic tanks installed as housing developers prefer to connect the fecal waste directly to the storm water drains. Therefore more and more of the call-outs of sweepers from households are for the clearing of blockages rather than emptying. There are no demands at all on the hygienic FSM service delivery chain to meet either the existing needs/demands nor any future targets to protect public and environmental health.
Quality: Is the quality of FSM sufficient to ensure functioning
facilities and services that protect against risk through the
service chain?
0 0 0 0 0
There is high risk throughout the whole of the FSM service delivery chain. Most of the high health risks occur in the containment/emptying part of the FSM chain with most toilets (& septic tanks) being directly connected to the storm water drains. Given that these connections are to deep drains the proximate health risk is low but the environmental health risk is high. Emptying is high hazard with removal of the sludge primarily undertaken by manual sweepers. Transport of FSM is vulnerable to dumping directly into open drains by manual sweepers or carting by VacuTugs before dumping into the open drains. There is no treatment or re-use of fecal sludge except potentially on the outskirts of the city where there are pit latrines and the sludge is buried.
Reporting: Are there procedures and processes applied on a
regular basis to monitor FSM access and the quality of services
and is the information disseminated?
0 0 0 0 0
There are no systems for reporting on the levels of access to FSM services or on the quality of the FSM services. There is some recognition of the need to regulate infrastructure creation by developers however this regulation is 'blind' to the different containment practices and the implications of this on the different FSM services that need to be made available. The systems for reporting on the O&M of FSM are limited to only collection with no systems for tracking the amount of FSM that reaches the DWASA designated drop off locations of which only a very small fraction ends up in the treatment plant.
O&
M
Cost recovery: Are O&M costs known and fully met by either
cost recovery through user fees and/or local revenue or
transfers?
0 0 0 0 0
Any O&M costs of the fecal sludge management system are fully borne by users accessing private operators. There are no government provided FSM services however the public cost of poor FSM management is externalised primarily into the storm water drainage system. The public cost is primarily an environmental health cost transported through deep underground storm water drains however the public health cost becomes localised during the frequent blockages / emptying of the sludge from the drains.
Standards: Are there norms and standards for each part of the
FSM service delivery chain that are systematically monitored under a regime of sanctions
(penalties)?
0 0 0 0 0
The only part of the fecal sludge management chain that appears to have any form of regulation is the planning authority requirement stipulated by RaJUK to install a septic tank in non-sewered areas. These requirements appear to be side-stepped by housing developers especially in the areas where there are good storm water drains. Even in sewered areas there seems to be a general preference to connect to the storm water drains, which block-up far less often than the sewers. Although the DWASA Act mentions that it is illegal to connect to drains and canals, there are no rules or sanctions regulating this or any other parts of the fecal sludge management chain.

Report of a FSM study in Dhaka, Bangladesh
113
Ind
icat
or
Question
Co
nta
inm
en
t
Emp
tyin
g
Co
nve
yan
ce
Tre
atm
en
t
End
-use
dis
po
sal
Comment
Exp
ansi
on
Demand: Has government (national or city authority) developed any policies and procedures, or planned and undertaken programs to stimulate demand of FSM services and behaviours by households?
0 0 0 0 0
The government has not developed any policies and procedures, nor has it planned or undertaken any programs to stimulate demand of FSM services nor has it promoted hygienic FSM behaviours by households. Recent notices issued by D-WASA have reminded households of their obligations to build a septic tank and a soak pit in the unsewered areas but the management of the fecal sludge beyond this has not been raised publically. The FSM chapter of the national WSS strategy commits to the development of guidelines, pilot projects and the drafting of by-laws / regulations for Local government institutions.
Sector development: does the government have ongoing programs and measures to
strengthen the role of service providers (private or public) in
the provision of FSM services, in urban or peri-urban areas?
0 0 0 0 0
FSM service providers for cleaning blockages are expanding but FSM emptying is contracting. The emptying of septic tanks is primarily undertaken by the government employed cleaners (or publically housed sweepers) that offer a small scale, disorganized and unhygienic private emptying service to households. The government has not yet developed any measures to strengthen the role of these privately engaged public sector workers to improve the quality of FSM services but WSUP are working on capacity development with emptiers.. In terms of the liason with other public sector agencies (i.e. NGOs), DWASA is giving permission to DSK / PSTC operarors to discharge fecal sludge from their VacuTugs at pre-designated areas (as a pre-cursor to a potential future role of the private sector), WSUP is starting operations of a VacuTug for D-WASA and UNICEF has provided VacuTugs to D-WASA.
Serv
ice
ou
tco
mes
Public Health: What is the magnitude of public health risk associated with the current FS
flows (through the stages of the FS service chain)?
0.5 0 0 0 0
Although the management of fecal sludge in Dhaka has been grossly neglected, the connection of fecal sludge systems into the deep storm water drainage system means that the local health risk is low while the larger environmental health risk is excessive. The generally low health risk is compounded by short periods of high health risk when the deep stormwater drainage system blocks up or fails to deal with overloading during flooding.
Quantity: Percentage of total FS generated by the city that is
managed effectively, within each part of the service chain
0 0 0 0 0
Percentage figures will only be ESTIMATES rather than absolute values. Multiplying-up results from HH survey frame is possible, but dependent on assumptions that must be explicitly stated for each context. Volumes can be more accurately measured downstream of containment (from collection through to end-use). Less than 50% of fecal sludge is safely contained, emptied, transported, treated, re-used. Details to be confirmed after the household survey.
Equity: To what extent do the city's FSM systems serve low-
income communities? (Containment, Emptying and
Transport services only)
0.5 0 0 0 0
The FSM services of containment, emptying and transport serve low-income communities - Containment: Open defecation rates within low income communities is extremely low. Low income communities tend to contain fecal sludge as they do not have the capacity to connect to deep storm water drains and they do not tend to connect to the open drains because of their proximate location to the house. - Emptying: Manual emptying services are readily available within low income communities as there are often some emptiers living / working within the LICs. - Transportation: Is available via manual carts that are filled / emptied in the middle of the night & then dumped into canals or drains
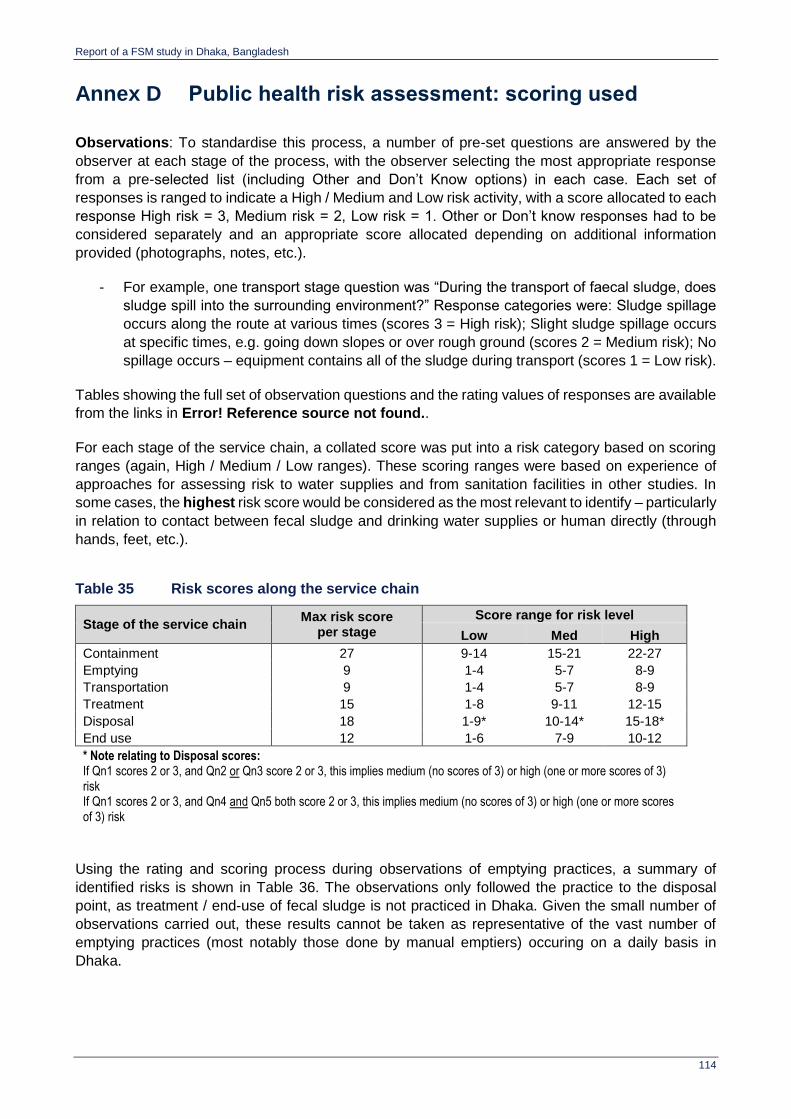
Report of a FSM study in Dhaka, Bangladesh
114
Annex D Public health risk assessment: scoring used
Observations: To standardise this process, a number of pre-set questions are answered by the
observer at each stage of the process, with the observer selecting the most appropriate response
from a pre-selected list (including Other and Don’t Know options) in each case. Each set of
responses is ranged to indicate a High / Medium and Low risk activity, with a score allocated to each
response High risk = 3, Medium risk = 2, Low risk = 1. Other or Don’t know responses had to be
considered separately and an appropriate score allocated depending on additional information
provided (photographs, notes, etc.).
- For example, one transport stage question was “During the transport of faecal sludge, does
sludge spill into the surrounding environment?” Response categories were: Sludge spillage
occurs along the route at various times (scores 3 = High risk); Slight sludge spillage occurs
at specific times, e.g. going down slopes or over rough ground (scores 2 = Medium risk); No
spillage occurs – equipment contains all of the sludge during transport (scores 1 = Low risk).
Tables showing the full set of observation questions and the rating values of responses are available
from the links in Error! Reference source not found..
For each stage of the service chain, a collated score was put into a risk category based on scoring
ranges (again, High / Medium / Low ranges). These scoring ranges were based on experience of
approaches for assessing risk to water supplies and from sanitation facilities in other studies. In
some cases, the highest risk score would be considered as the most relevant to identify – particularly
in relation to contact between fecal sludge and drinking water supplies or human directly (through
hands, feet, etc.).
Table 35 Risk scores along the service chain
Stage of the service chain Max risk score
per stage
Score range for risk level
Low Med High
Containment 27 9-14 15-21 22-27
Emptying 9 1-4 5-7 8-9
Transportation 9 1-4 5-7 8-9
Treatment 15 1-8 9-11 12-15
Disposal 18 1-9* 10-14* 15-18*
End use 12 1-6 7-9 10-12
* Note relating to Disposal scores: If Qn1 scores 2 or 3, and Qn2 or Qn3 score 2 or 3, this implies medium (no scores of 3) or high (one or more scores of 3) risk If Qn1 scores 2 or 3, and Qn4 and Qn5 both score 2 or 3, this implies medium (no scores of 3) or high (one or more scores of 3) risk
Using the rating and scoring process during observations of emptying practices, a summary of
identified risks is shown in Table 36. The observations only followed the practice to the disposal
point, as treatment / end-use of fecal sludge is not practiced in Dhaka. Given the small number of
observations carried out, these results cannot be taken as representative of the vast number of
emptying practices (most notably those done by manual emptiers) occuring on a daily basis in
Dhaka.

Report of a FSM study in Dhaka, Bangladesh
115
Table 36 Risk of immediate human exposure with FS, at each step of the process
Nº Equipment (man/mech)
Access for equipment type
Containment Emptying Conveyance Disposal Disposal
Point
1 Manual Small mechanical Low Med Direct discharge High Ditch (open)
2 Manual Hand-carried only Low Med Direct discharge High Pond
3 Manual Hand-carried only Low Low Direct discharge Medium* Drain (covered)
4 Mechanical Medium/large Med Low Low Medium* Drain (shallow)
5 Mechanical Medium/large Med Low Low Medium* Drain (covered)
* See comments in other sections about likely risks from the method of disposal into drains
Transect walks: Participants used a standard reporting format to allocate scores to help represent
a qualitative assessment of the relative impact from physical and environmental conditions on being
able to achieve effective and safe FSM services in that locality.
Categories included in the conditions that were recorded included: drainage infrastructure and use
(noting the presence of storm water, greywater and/or blackwater); evidence of open defecation,
dumped fecal sludge or solid waste; public latrine coverage; access to water points; housing density;
conditions of roads and paths. Each category was pre-allocated 5 observed responses, ranging from
very poor conditions (scoring 5) through to very good conditions or no evidence found (scoring 1).
Scores of 1 therefore represent the lowest impact and 5 the highest impact on FSM services. Results
from the 40 transect walks (10 in subsample A PSUs and 10 in subsample B PSUs) are shown in
Table 37.
For certain categories relating to FSM (for example evidence of open defecation, fecal sludge,
blackwater in drains) that scored 3 or more, participants identified the location of the observation,
how often the particular risk occurred in the area, by asking members of the community for
information, and the mechanism for human contact and contamination route (through people walking
in bare feet, entering drains, blackwater in drains overflowing near to homes, etc.).
Tables showing the format for scoring conditions in the PSUs during the Transect Walks and for
collecting further details where high risks were seen, are available from the links in Annex E.
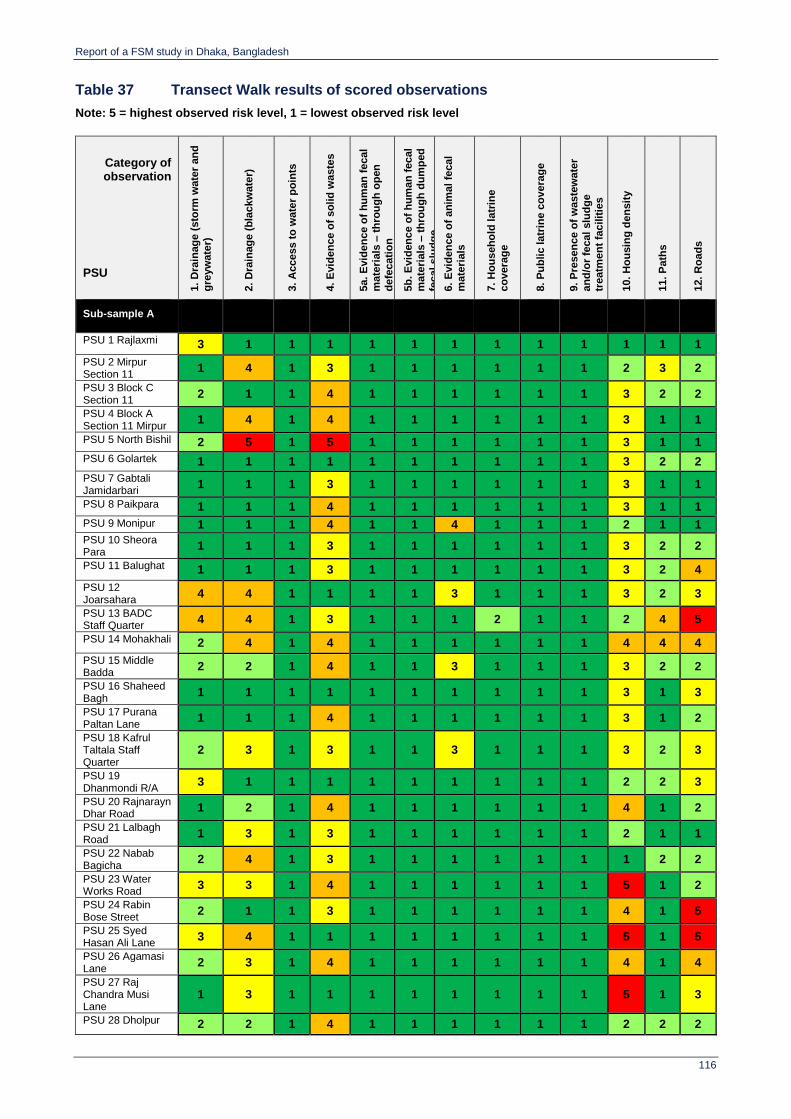
Report of a FSM study in Dhaka, Bangladesh
116
Table 37 Transect Walk results of scored observations
Note: 5 = highest observed risk level, 1 = lowest observed risk level
Category of observation
PSU
1.
Dra
inag
e (
sto
rm w
ate
r an
d
gre
yw
ate
r)
2.
Dra
inag
e (
bla
ckw
ate
r)
3.
Access t
o w
ate
r p
oin
ts
4.
Evid
en
ce o
f so
lid
waste
s
5a.
Evid
en
ce o
f h
um
an
fecal
mate
rials
– t
hro
ug
h o
pen
de
fecati
on
5b
. E
vid
en
ce o
f h
um
an
fecal
mate
rials
– t
hro
ug
h d
um
ped
fecal
slu
dg
e
6.
Evid
en
ce o
f an
imal
fecal
mate
rials
7.
Ho
us
eh
old
latr
ine
co
vera
ge
8.
Pu
blic latr
ine c
ov
era
ge
9.
Pre
sen
ce o
f w
aste
wate
r
an
d/o
r fe
cal
slu
dg
e
treatm
en
t fa
cilit
ies
10.
Ho
usin
g d
en
sit
y
11.
Path
s
12.
Ro
ad
s
Sub-sample A
PSU 1 Rajlaxmi 3 1 1 1 1 1 1 1 1 1 1 1 1
PSU 2 Mirpur Section 11
1 4 1 3 1 1 1 1 1 1 2 3 2
PSU 3 Block C Section 11
2 1 1 4 1 1 1 1 1 1 3 2 2
PSU 4 Block A Section 11 Mirpur
1 4 1 4 1 1 1 1 1 1 3 1 1
PSU 5 North Bishil 2 5 1 5 1 1 1 1 1 1 3 1 1
PSU 6 Golartek 1 1 1 1 1 1 1 1 1 1 3 2 2
PSU 7 Gabtali Jamidarbari
1 1 1 3 1 1 1 1 1 1 3 1 1
PSU 8 Paikpara 1 1 1 4 1 1 1 1 1 1 3 1 1
PSU 9 Monipur 1 1 1 4 1 1 4 1 1 1 2 1 1
PSU 10 Sheora Para
1 1 1 3 1 1 1 1 1 1 3 2 2
PSU 11 Balughat 1 1 1 3 1 1 1 1 1 1 3 2 4
PSU 12 Joarsahara
4 4 1 1 1 1 3 1 1 1 3 2 3
PSU 13 BADC Staff Quarter
4 4 1 3 1 1 1 2 1 1 2 4 5
PSU 14 Mohakhali 2 4 1 4 1 1 1 1 1 1 4 4 4
PSU 15 Middle Badda
2 2 1 4 1 1 3 1 1 1 3 2 2
PSU 16 Shaheed Bagh
1 1 1 1 1 1 1 1 1 1 3 1 3
PSU 17 Purana Paltan Lane
1 1 1 4 1 1 1 1 1 1 3 1 2
PSU 18 Kafrul Taltala Staff Quarter
2 3 1 3 1 1 3 1 1 1 3 2 3
PSU 19 Dhanmondi R/A
3 1 1 1 1 1 1 1 1 1 2 2 3
PSU 20 Rajnarayn Dhar Road
1 2 1 4 1 1 1 1 1 1 4 1 2
PSU 21 Lalbagh Road
1 3 1 3 1 1 1 1 1 1 2 1 1
PSU 22 Nabab Bagicha
2 4 1 3 1 1 1 1 1 1 1 2 2
PSU 23 Water Works Road
3 3 1 4 1 1 1 1 1 1 5 1 2
PSU 24 Rabin Bose Street
2 1 1 3 1 1 1 1 1 1 4 1 5
PSU 25 Syed Hasan Ali Lane
3 4 1 1 1 1 1 1 1 1 5 1 5
PSU 26 Agamasi Lane
2 3 1 4 1 1 1 1 1 1 4 1 4
PSU 27 Raj Chandra Musi Lane
1 3 1 1 1 1 1 1 1 1 5 1 3
PSU 28 Dholpur 2 2 1 4 1 1 1 1 1 1 2 2 2

Report of a FSM study in Dhaka, Bangladesh
117
Category of observation
PSU
1.
Dra
inag
e (
sto
rm w
ate
r an
d
gre
yw
ate
r)
2.
Dra
inag
e (
bla
ckw
ate
r)
3.
Access t
o w
ate
r p
oin
ts
4.
Evid
en
ce o
f so
lid
waste
s
5a.
Evid
en
ce o
f h
um
an
fecal
mate
rials
– t
hro
ug
h o
pen
de
fecati
on
5b
. E
vid
en
ce o
f h
um
an
fecal
mate
rials
– t
hro
ug
h d
um
ped
fecal
slu
dg
e
6.
Evid
en
ce o
f an
imal
fecal
mate
rials
7.
Ho
us
eh
old
latr
ine
co
vera
ge
8.
Pu
blic latr
ine c
ov
era
ge
9.
Pre
sen
ce o
f w
aste
wate
r
an
d/o
r fe
cal
slu
dg
e
treatm
en
t fa
cilit
ies
10.
Ho
usin
g d
en
sit
y
11.
Path
s
12.
Ro
ad
s
PSU 29 Muradpur 4 3 1 5 1 1 4 1 1 1 5 4 4
PSU 30 New Jurain Alambag
5 4 1 4 1 1 1 1 1 1 5 4 4
Sub-sample B
PSU 33 East Kurmitola Camp
3 3 1 5 1 1 3 1 1 1 5 4 5
PSU 34 Baganbari Slum
1 3 1 3 1 1 1 2 1 1 5 5 5
PSU 38 Shohid Bag
1 3 2 2 2 2 2 1 1 1 5 4 5
PSU 43 No. 8 Slum
1 3 1 5 1 1 1 2 1 1 5 5 5
PSU 47 Railline Slum
4 3 3 1 1 1 5 1 1 5 5 5
PSU 51 Karail 1 1 1 4 1 1 1 2 1 1 5 4 5
PSU 55 Kopikhet Bastee
1 2 2 4 1 1 2 2 1 4 4 5
PSU 41 Khalpar/Balurmath Slum
No drain
No drain
1 3 1 1 1 2 1 1 3 3 4
PSU 49 Shikderbari
No drain
No drain
1 3 1 1 1 2 1 1 1 4 5
PSU 50 Ahlia No drain
No drain
1 3 1 1 3 2 1 1 3 4 3

Report of a FSM study in Dhaka, Bangladesh
118
Annex E Economic analysis tables
Onsite Extraction and conveyance
Treatment Disposal & reuse
Total
FSM
Capital 15207 8827 8706 0 32740
Annualized 1786 1037 959 0 3782
Capital maintenance 845 2433 925 0 4203
Annualized 99 286 102 0 487
Recurrent 0 1962 13 0 1975
Total annualized financial cost 1885 3285 1074 0 6244
SBS
Capital 14569 12995 27919 0 55482
Annualized 1711 1347 2895 0 5954
Capital maintenance 824 433 928 0 2185
Annualized 97 45 96 0 238
Recurrent 0 227 433 0 661
Total annualized financial cost 1808 1620 3424 0 6852
SBS ABR
Capital 14569 21534 13959 0 50061
Annualized 1711 2233 1447 0 5391
Capital maintenance 824 615 141 0 1580
Annualized 97 64 15 0 175
Recurrent 0 313 182 0 494
Total annualized financial cost 1808 2609 1644 0 6061
Nb. no suitable cost data was found for disposal and reuse

Fecal Sludge Management: Diagnostics
for Service Delivery in Urban Areas
Report of a FSM study in Hawassa, Ethiopia
Supporting document Final April 2016


Report of a FSM study in Hawassa, Ethiopia
i
Preface / Acknowledgements
This report is a city case study of a World Bank Economic and Sector Work on Fecal Sludge
Management: Diagnostics for Service Delivery in Urban Areas (P146128). The task team leaders
were Isabel Blackett and Peter Hawkins and task team members were Zael Sanz Uriarte, Ravikumar
Joseph, Chris Heymans and Guy Hutton.
This report is based on work conducted between January 2014 and February 2016 by Oxford Policy
Management (OPM) in partnership with the Water, Engineering and Development Centre (WEDC)
at Loughborough University. The core research team was Ian Ross (OPM), Rebecca Scott (WEDC),
Ana Mujica (OPM) and Mike Smith (WEDC). The broader team who contributed to the study included
Zach White, Rashid Zaman and Simon Brook from OPM, as well as Andy Cotton and Sam Kayaga
from WEDC. Andy Peal (independent consultant) also contributed to certain aspects of the
methodology.
The inputs of many other World Bank staff, consultants and data collection firms are acknowledged
with thanks from the task team. They have contributed to the research, findings, analysis and reviews
but are too numerous to mention.
Report of a FSM study in Hawassa, Ethiopia
ii
Executive summary
Introduction
This report summarizes the main findings of a case study on fecal sludge management in Hawassa,
Ethiopia. It is part of the project entitled ‘Fecal Sludge Management: Diagnostics for Service Delivery
in Poor Urban Areas’, funded by the World Bank Water and Sanitation Program (WSP). There are
five city case studies as part of this project (Balikpapan, Dhaka, Hawassa, Lima and Santa Cruz).
The specific objectives of the Hawassa study were:
To provide quantitative and qualitative data on the sanitation situation in Hawassa from a
socio-economic perspective, specifically as it relates to FSM;
To do the above in such a way that the data is representative of the city as a whole but also
providing a separate picture of the situation in low-income areas, primarily through qualitative
means in the Hawassa case;
To provide initial recommendations to guide discussions around future interventions in the
sanitation sector in Hawassa, by contributing credible data and analysis; and
To inform the development of analytical tools and guidelines, by “road-testing” draft tools
using primary data collection.
Methodology
The study followed an overall research framework developed as part of the inception period, which
set out research questions and sub-questions. Data collection instruments were then developed so
as to answer these questions. Four data collection instruments were used in Hawassa, two
quantitative and two qualitative. The quantitative instruments were a household survey and transect
walks. The qualitative instruments were key informant interviews and focus group discussions.
The study team led on methodology design and data analysis, while data collection was undertaken
by separately-contracted consultants under the leadership of WSP. All data collection was
undertaken by JaRco Consulting based in Addis Ababa, with the exception of key informant
interviews which were undertaken by World Bank short-term consultants.
The household survey primarily aimed to collect data from households regarding their current use of
fecal sludge management (FSM) services and preferences for future FSM services. The sampling
allowed conclusions to be drawn about the city as a whole on a representative basis. The transect
walks enabled a subjective and qualitative assessment of physical and environmental conditions
within a community. The key informant interviews aimed to address key questions about how both
the ‘enabling environment’ and the operating environment affects FSM services (past, current and
future). Finally, the focus group discussions with residents of informal settlements aimed to gather
qualitative data that would complement, validate, or challenge conclusions drawn from the household
survey data.
Sampling for quantitative instruments was derived from the sampling for the household survey, for
which there were two sub-samples. For sub-sample A, the Primary Sampling Units (PSUs) were
menders (‘villages’), with initial stratification by “sub-city” according to their population to ensure
relatively broad geographical coverage. Sub-cities are the primary administrative division within the
city, with kebeles below them and menders the smallest unit. There are population data for sub-cities
and kebeles based on the last census, but no population data for menders. A list of the 162 menders

Report of a FSM study in Hawassa, Ethiopia
iii
was collected from all the 20 kebeles. For sub-sample B, the PSUs were also menders, but they
were purposively selected from using secondary data and expert opinion (of a WASH consultant
based in Hawassa) of where the poorest areas are. The same list of 162 menders was used for
selection, with no duplication. However, during data analysis it became clear that there were
problems with the way the local survey firm had undertaken sampling, data collection and data entry
for sub-sample B. This rendered the data from sub-sample B unreliable and therefore it has not been
used in this report. The Secondary Sampling Units (SSUs) were households in both cases.
Analyzed results were presented to key stakeholders, representing the city administration, regional
water bureau, federal ministries and the World Bank WSP in Ethiopia, during validation meetings in
November 2015. These provided an opportunity for discussion around key findings and comments
to inform completion of this report.
Results
The table below summarizes some key sanitation indicators from the household survey:
Indicator %age of households
Use of improved sanitation
Households using improved sanitation, excluding ‘shared improved’ 32%
Households using improved sanitation, including ‘shared improved’ 81%
Type of containment
Households using a toilet discharging to a lined pit 41%
Households using a toilet discharging to an unlined pit 20%
Households using a toilet discharging to a fully lined septic tank with no outlet to on-site infiltration (i.e. a sealed tank)
16%
Households using a toilet discharging to a partially lined or unlined septic tank with no outlet to on-site infiltration (i.e. effectively a soakpit)
18%
Households using a toilet discharging to a septic tank with an outlet to on-site infiltration such as a soakpit
4%
Households using a toilet discharging directly or indirectly to a drain or ditch
0%
Households using a toilet discharging to a septic tank or pit which has never filled up / needed emptying
92%
Emptying
Households who experienced a pit/tank filling up, who emptied that pit/tank and then reused it
31%
Households who experienced a pit/tank filling up, who covered the pit and used an alternative
64%
Households who emptied their pit/tank who used a formal provider (private company or municipal service)
57%
These key data are incorporated into the fecal waste flow diagram shown below. This shows that,
while there is effective access to at least some form of on-site sanitation facility throughout the city
(resulting in no reported open defecation through the household survey and limited evidence through
other data collection tools), not all fecal waste is being effectively managed through the later stages
of the FSM service chain.
The highly permeable volcanic soils underlying Hawassa facilitate the infiltration of leachate from
pits and soakaways, resulting in the great majority of tanks and pits operating for many years without
the need to be emptied. Only about 10% of households in Hawassa reported having ever had their

Report of a FSM study in Hawassa, Ethiopia
iv
pit or tank emptied. However, it also means that there is an increasing pollution load reaching the
lake which is one of the city’s main attractions.
Of greater significance in terms of current FSM needs is where households in less formal areas are
abandoning or covering pits once they are no longer in use (due to being full, or perhaps collapsed,
or no longer accessible for another reason). In such cases, households resort to finding or
constructing alternative facilities – but given reported concerns about the space to continue to do
this becoming increasingly scarce as the city urbanizes, eventually this option will become non-viable
and emptying will be required. A further challenge faces the city as it becomes more densely
populated. The soil’s absorption capacity will eventually be exceeded, putting the (little-used as
highly contaminated with natural fluoride) local groundwater sources and Lake Hawassa at greater
risk of contamination. These foreseen risks are indicated in the fecal waste flow diagram by the
brown shading of the large green arrow representing pits that are abandoned and covered over. As
Hawassa is growing and developing very fast, action will be required sooner rather than later to
improve fecal sludge management. The diagram indicates the need for the city administration to
identify priority areas for the introduction of sewerage options, while improving sanitation and FSM
services more generally.
Fecal waste flow diagram for Hawassa city
The Service Delivery Assessment developed from the study shows that, in general, Hawassa’s
FSM service context is making progress in relation to the three major components of the
assessment: enabling, developing and sustaining services. However, when looking into the details
for each component, this reveals that greater attention has been given to improving the provision
Treatment End-use/ Disposal Conveyance Emptying Containment

Report of a FSM study in Hawassa, Ethiopia
v
and promotion of toilet infrastructure and to some extent the provision of emptying services to
support this. Greater weaknesses are identified in relation to the existing treatment facility and the
effective disposal of dried fecal sludge, or any actions to develop options for fecal sludge end-use
applications. The greater component of ‘treatment and disposal’ of fecal sludge in-situ (the 70%
shown on the diagram, where containment relies on local soils to continually absorb leachate from
pits and tanks) may be satisfactory for now, but as areas of the city become more densely populated
and soil infiltration capacity is surpassed, increased risks of localized surface ponding of effluent and
pit collapse are anticipated. Residents of low-income areas also voiced concerns that the decreasing
space to build new pits when current ones become full make this practice increasingly difficult to
sustain. Without greater attention given to investing in the future needs of the city, risks to public
health will increase. This will be particularly the case in the expanding low-income areas, where
concerted efforts will be needed to address issues of inequity and lower service outcomes. To
improve FSM services in Hawassa as a whole – and most notably for those vulnerable to poor
services and resulting health risks – greater attention needs to be given to investment in a range of
services that will meet the requirements of being appropriate, affordable, available and adapted to
the needs of all users.
The Prognosis for Change surmises that overall, the market for FSM services is functioning. The
few households whose pits fill up are able to get them emptied safely and the fecal sludge is, in
general, disposed of at the fecal sludge treatment plant. While only about 10% of households in
Hawassa reported having ever emptied a pit or tank, demand for services in Hawassa is likely to
increase as the population grows and becomes more dense. Households who have relied on
covering, abandoning and replacing full pits are unlikely to be able to do so in the future.
A key implication of the study findings is that the city administration should be planning ahead in
much more detail. While the city service delivery assessment shows that basic elements of service
delivery are there, important weaknesses in the enabling environment, relating to the planning,
expenditure, operation and maintenance and expansion of services, remain. This is a significant
challenge and in the medium-term the city administration must ensure households and the city
council are involved in and committed to any plans, since they will have implications for standards
and servicing of on-site sanitation facilities. In the shorter term, the administration must resolve the
issues facing the market for FSM services, which is currently in flux due to price variations within
and between public and private sector operators. The private sector can and should play an
increasing role in service provision, under strengthened regulation by the city administration.
Formalizing their role through licensing, alongside an increase in tariffs, is likely to support this.
The key recommended actions for Hawassa City Administration are therefore:
Consult households and Hawassa City Council on the development of city-wide sanitation
plans, especially where they affect changes to standards affecting containment
infrastructure (septic tanks, pits and eventual connection to new sewerage systems);
Resolve market-based issues for FSM services, through price review and negotiating an
increased role for formalized private sector provision with licensing and regulation,
alongside an increase in tariffs;
Identify priority areas for development of sewerage networks – based on likely pollution
risks to Lake Hawassa and saturation of soils;
Address constraints at the existing fecal sludge treatment plant and negotiate land
purchase to co-site the eventual construction of a new treatment plant, wastewater
treatment plant and solid waste disposal facility.
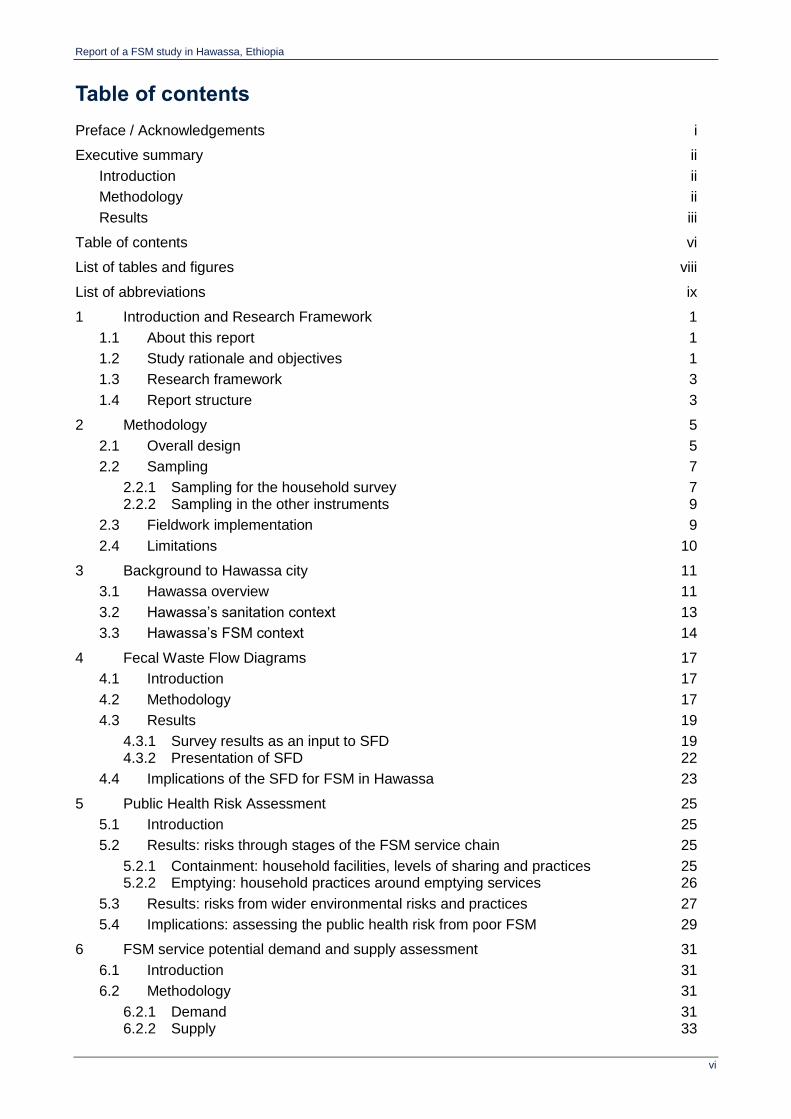
Report of a FSM study in Hawassa, Ethiopia
vi
Table of contents
Preface / Acknowledgements i
Executive summary ii
Introduction ii
Methodology ii
Results iii
Table of contents vi
List of tables and figures viii
List of abbreviations ix
1 Introduction and Research Framework 1
1.1 About this report 1
1.2 Study rationale and objectives 1
1.3 Research framework 3
1.4 Report structure 3
2 Methodology 5
2.1 Overall design 5
2.2 Sampling 7
2.2.1 Sampling for the household survey 7 2.2.2 Sampling in the other instruments 9
2.3 Fieldwork implementation 9
2.4 Limitations 10
3 Background to Hawassa city 11
3.1 Hawassa overview 11
3.2 Hawassa’s sanitation context 13
3.3 Hawassa’s FSM context 14
4 Fecal Waste Flow Diagrams 17
4.1 Introduction 17
4.2 Methodology 17
4.3 Results 19
4.3.1 Survey results as an input to SFD 19 4.3.2 Presentation of SFD 22
4.4 Implications of the SFD for FSM in Hawassa 23
5 Public Health Risk Assessment 25
5.1 Introduction 25
5.2 Results: risks through stages of the FSM service chain 25
5.2.1 Containment: household facilities, levels of sharing and practices 25 5.2.2 Emptying: household practices around emptying services 26
5.3 Results: risks from wider environmental risks and practices 27
5.4 Implications: assessing the public health risk from poor FSM 29
6 FSM service potential demand and supply assessment 31
6.1 Introduction 31
6.2 Methodology 31
6.2.1 Demand 31 6.2.2 Supply 33
Report of a FSM study in Hawassa, Ethiopia
vii
6.3 Findings – household demand for FSM services 34
6.3.1 Determinants of household demand 34 6.3.2 Household satisfaction with current services 38 6.3.3 Barriers faced by households, in obtaining FSM services 39
6.4 Findings – supply of FSM services 40
6.4.1 Services effectively supplied 41 6.4.2 Service provider capacity 42
7 Fecal sludge treatment and possible end-use options 44
7.1 Fecal sludge characteristics 44
7.2 Current treatment and possible future options 45
8 City Service Delivery Assessment 50
8.1 Introduction 50
8.2 Methodology 50
8.3 Findings 52
8.3.1 Enabling 52 8.3.2 Developing 53 8.3.3 Sustaining 54 8.3.4 Implications of the CSDA scorecard 54
9 Prognosis for change 56
10 Intervention options 66
10.1 Identified weaknesses, through the service chain 66
10.2 Proposed solutions, through the service chain 67
10.2.1 Towards city-wide incremental improvements 73
10.3 The Service Delivery Context: priorities to address 74
10.3.1 Enabling: policy, planning and budget 74 10.3.2 Developing: equity and outputs 75 10.3.3 Sustaining: O&M, expansion and service outcomes 75
10.4 Resulting prioritized interventions: guidelines for action 76
11 Conclusions and recommendations 81
References 83
Annex A Map showing city-wide sample locations 84
Annex B CSDA scoring table 85
Annex C Public health risk assessment: scoring used 94
Annex D Links to data collection instruments 97
Report of a FSM study in Hawassa, Ethiopia
viii
List of tables and figures
Figure 1 Diagram of how the tools fit together ............................................................................... 2 Figure 2 Hawassa City Administration Organizational Structure .................................................. 12 Figure 3 Access to sanitation for urban Ethiopia, JMP 2015 report ............................................. 13 Figure 4 The sanitation service chain .......................................................................................... 14 Figure 5 Fecal waste flow matrix for Hawassa ............................................................................ 19 Figure 6 Fecal waste flow diagram (SFD) for Hawassa ............................................................... 23 Figure 7 Satisfaction with characteristics of the sanitation facility ................................................ 38 Figure 8 Satisfaction with emptying service provider ................................................................... 39 Figure 9 CSDA scorecard for Hawassa ....................................................................................... 52 Figure 10 Process mapping for emptying a pit in Hawassa ........................................................... 62 Figure 11 Stakeholder analysis matrix for “simultaneous increase in government tariffs and
licensing of private sector emptiers” .............................................................................. 63 Figure 12 City-wide fecal waste flow: results and key problems .................................................... 67 Figure 13 City-wide sanitation strategy for Hawassa: a graphical representation .......................... 73
Table 1 FSM project components ............................................................................................... 3 Table 2 Summary table of data collection instruments ................................................................ 5 Table 3 Roles assigned to key FSM stakeholders .................................................................... 15 Table 4 Sanitation facility used, by technology type .................................................................. 19 Table 5 Sanitation facility used, by JMP category ..................................................................... 20 Table 6 Management of blackwater – where toilets discharge to .............................................. 21 Table 7 Past action after pit/tank filled-up ................................................................................. 21 Table 8 Prevalence of diarrhoea among respondents in the last 2 weeks................................. 26 Table 9 The number of contaminated main water supplies in 19 PSUs .................................... 28 Table 10 Physical determinants of demand for FSM services..................................................... 32 Table 11 Economic determinants of demand for FSM services .................................................. 32 Table 12 Scoring for housing density, paths and roads from transect walks ............................... 34 Table 13 Type of building occupied ............................................................................................ 34 Table 14 Accessibility of toilet for emptying equipment ............................................................... 35 Table 15 Average time taken for pit or tank to fill-up ................................................................... 35 Table 16 Number of people using the same sanitation facility .................................................... 36 Table 17 Average cash contribution to toilet construction by wealth quintile: all types ................ 36 Table 18 Average amount paid for emptying services ................................................................ 37 Table 19 Intended action after pit/tank fills-up ............................................................................ 39 Table 20 Emptying method cross-tabulated with service provider type ....................................... 41 Table 21 Ranges of identified emptying charges: formal private and Municipal services ............ 42 Table 22 Maximum volume of fecal sludge reaching the treatment plant .................................... 45 Table 23 The CSDA framework for FSM .................................................................................... 50 Table 24 Example CSDA question, criteria and scoring .............................................................. 51 Table 25 Mapping stakeholders and their responsibilities for FSM ............................................. 58 Table 26 Technical interventions to improve service delivery, based on existing system type .... 70 Table 27 Service Delivery Action Framework: Hawassa city ...................................................... 78 Table 28 Transect walk – results of scored observations ............................................................ 95

Report of a FSM study in Hawassa, Ethiopia
ix
List of abbreviations
CSDA City Service delivery assessment
ETB Ethiopian Birr (unit of currency). Exchange rate: 1 ETB = 0.048 USD
FS Fecal sludge
FSM Fecal sludge management
Kebele a "neighborhood": the smallest administrative division, similar to a ward
KII Key informant interviews
Mender equivalent to a village: under the administration of a kebele
OSS On-site (non-networked/non-sewered) sanitation facilities
OWNP One WASH National Program (of Ethiopia)
PEA Political Economy Analysis
PFC Prognosis for change
PSU Primary sampling unit
SSU Secondary sampling unit
ST Septic tank
WSE Water and Sewerage Enterprise (of Hawassa City Administration)
Report of a FSM study in Hawassa, Ethiopia
1
1 Introduction and Research Framework
1.1 About this report
This report summarizes the main findings of a study on fecal sludge management in Hawassa,
Ethiopia. It is part of the project entitled ‘Fecal Sludge Management: Diagnostics for Service Delivery
in Poor Urban Areas’, hereinafter “the FSM research project”. This work is funded by the Water and
Sanitation Program (WSP) of the World Bank. There are five city case studies as part of this project
(Balikpapan, Dhaka, Hawassa, Lima and Santa Cruz).
This project is led by Oxford Policy Management (OPM) in partnership with the Water, Engineering
and Development Centre (WEDC) at Loughborough University. The full TOR for the project can be
provided on request. The overall objective of this assignment is: “to work with the WSP urban
sanitation team to develop the methodology, design, develop survey instruments and undertake
analysis of data collected from four field case studies (linked to World Bank operations projects),
refine the diagnostic tools and develop decision-making tools and guidelines for the development of
improved FSM services.” The scope includes the need for city-wide fecal sludge (or septage)
management services with a focus on poor urban communities.
This document is one of several that make up the deliverables for the FSM research project, and is
not a stand-alone report. It does not contain much background information and the assumed
audiences are the World Bank team together with others familiar with or interested in the Hawassa
city context, including the relevant municipal, regional and federal authorities. The inception report,
available on request, contains more background information on the project and the methodology,
including the Research Framework.
The report’s structure is detailed below. It begins with background to the research and the city,
moving into several sections analyzing the overall urban sanitation context, which are not specific to
FSM. Thereafter, the report focuses on FSM services and the market in particular.
1.2 Study rationale and objectives
It is common for poor people living in the urban areas of most low-income countries to use on-site
sanitation facilities, or to defecate in the open. Even when improved on-site options are used to
contain excreta, in many cities there exist limited formal services for collection, transport and disposal
or treatment of the resulting fecal sludge. Few instances of resource recovery through processing
fecal sludge exist. The service delivery gaps within and between the stages of the sanitation service
chain become more apparent as urban sanitation access increases. Failure to ensure strong links
throughout the fecal sludge management (FSM) service chain results in untreated fecal sludge (FS)
contaminating the environment, with serious implications for human health.
Despite this, there are few tools and guidelines to help city planners navigate complex FSM
situations, despite increasing demand. This study builds on existing frameworks and diagnostic tools,
in particular the City Service Delivery Assessment scorecard, Fecal Waste Flow Diagram, and the
Economics of Sanitation Initiative toolkit – as indicated in Figure 1. The diagnostic and decision-
support tools are themselves based on tried-and-tested strategic planning approaches and
frameworks, with a focus on practicality, while the overall study aimed to update and develop a wider
range of tools and guidelines based on the results of five case study cities. In most of the study cities,
this has been supported by interaction with city stakeholders involved in ongoing World Bank
funding. Acknowledging the difficulty of reforming FSM services in cities, the political economy
dimensions of FSM are explicitly included as part of the overall analysis.

Report of a FSM study in Hawassa, Ethiopia
2
How the full set of diagnostic and decision-support tools and program design guidelines fit together
is represented in the following diagram, which is fully explained in accompanying study documents
available on request.
Figure 1 Diagram of how the tools fit together
The specific objectives of the Hawassa city case study are:
To provide quantitative and qualitative data on the sanitation situation in Hawassa, from a
socio-economic perspective, specifically as they relate to FSM;
To do the above in such a way that the data is representative of the city as a whole but also
providing a separate picture of the situation in low-income areas, primarily through qualitative
means in the Hawassa case;
To provide initial recommendations to guide discussions around future interventions in the
sanitation sector in Hawassa, by contributing credible data and analysis; and
To inform the development of analytical tools and guidelines more broadly, by “road-testing”
draft tools using primary data collection.
The Hawassa case study was primarily socio-economic rather than technical. It did not aim to carry
out technical inspections of infrastructure or produce detailed maps with neighborhood-level analysis
and recommendations. For those who have worked on sanitation in Hawassa for some time, there
may be few surprises, but the report does offer representative data to back up what has previously
been reported in smaller or more general studies.
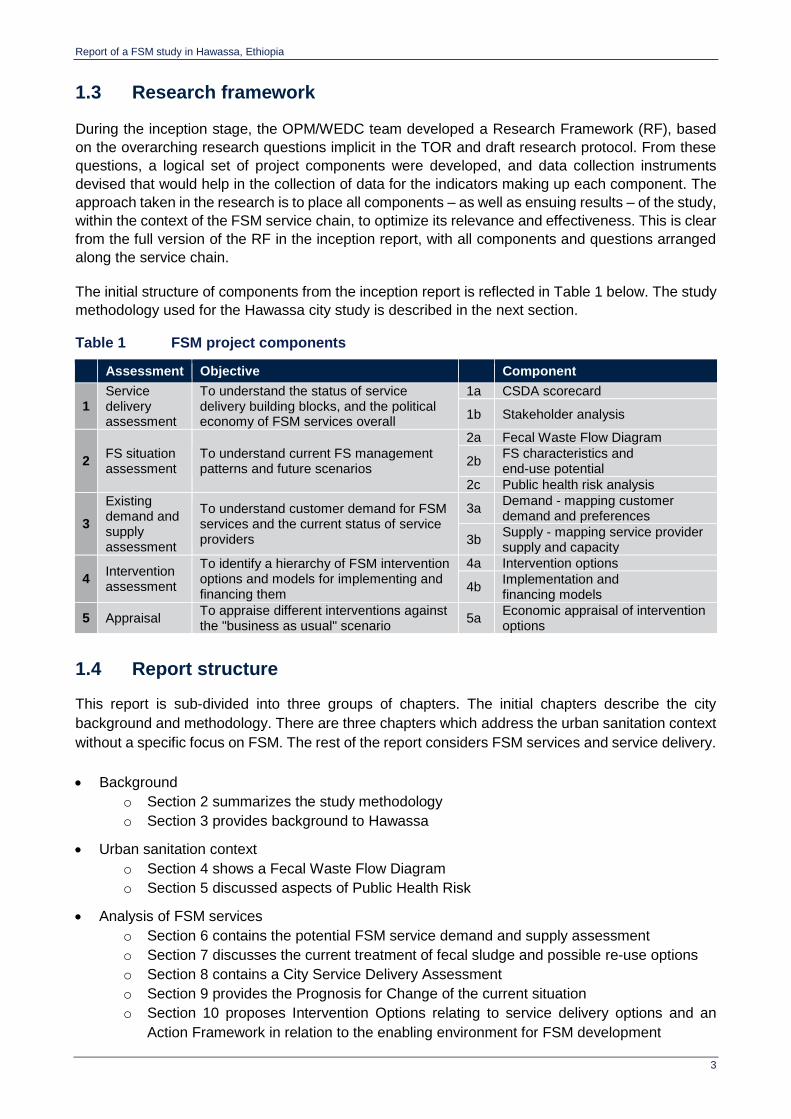
Report of a FSM study in Hawassa, Ethiopia
3
1.3 Research framework
During the inception stage, the OPM/WEDC team developed a Research Framework (RF), based
on the overarching research questions implicit in the TOR and draft research protocol. From these
questions, a logical set of project components were developed, and data collection instruments
devised that would help in the collection of data for the indicators making up each component. The
approach taken in the research is to place all components – as well as ensuing results – of the study,
within the context of the FSM service chain, to optimize its relevance and effectiveness. This is clear
from the full version of the RF in the inception report, with all components and questions arranged
along the service chain.
The initial structure of components from the inception report is reflected in Table 1 below. The study
methodology used for the Hawassa city study is described in the next section.
Table 1 FSM project components
Assessment Objective Component
1 Service delivery assessment
To understand the status of service delivery building blocks, and the political economy of FSM services overall
1a CSDA scorecard
1b Stakeholder analysis
2 FS situation assessment
To understand current FS management patterns and future scenarios
2a Fecal Waste Flow Diagram
2b FS characteristics and end-use potential
2c Public health risk analysis
3
Existing demand and supply assessment
To understand customer demand for FSM services and the current status of service providers
3a Demand - mapping customer demand and preferences
3b Supply - mapping service provider supply and capacity
4 Intervention assessment
To identify a hierarchy of FSM intervention options and models for implementing and financing them
4a Intervention options
4b Implementation and financing models
5 Appraisal To appraise different interventions against the "business as usual" scenario
5a Economic appraisal of intervention options
1.4 Report structure
This report is sub-divided into three groups of chapters. The initial chapters describe the city
background and methodology. There are three chapters which address the urban sanitation context
without a specific focus on FSM. The rest of the report considers FSM services and service delivery.
Background
o Section 2 summarizes the study methodology
o Section 3 provides background to Hawassa
Urban sanitation context
o Section 4 shows a Fecal Waste Flow Diagram
o Section 5 discussed aspects of Public Health Risk
Analysis of FSM services
o Section 6 contains the potential FSM service demand and supply assessment
o Section 7 discusses the current treatment of fecal sludge and possible re-use options
o Section 8 contains a City Service Delivery Assessment
o Section 9 provides the Prognosis for Change of the current situation
o Section 10 proposes Intervention Options relating to service delivery options and an
Action Framework in relation to the enabling environment for FSM development

Report of a FSM study in Hawassa, Ethiopia
4
o Section 11 concludes

Report of a FSM study in Hawassa, Ethiopia
5
2 Methodology
2.1 Overall design
A key component of the case study was primary data collection. The study was intended to have six
different data collection instruments, four quantitative and two qualitative, each of which contribute
to various project components shown in Table 1 above.
However, in reality two of the data collection instruments (observation of service provider practices,
and testing fecal sludge characteristics) did not take place during the data collection period, as
explained further below. In addition, while samples of drinking water were taken and analyzed during
the Transect Walks, samples of drain water were not taken, because the drains were dry during the
period of data collection (see limitations in Section 2.4). The full set of instruments is summarized in
Table 2 below, showing those that were not conducted in italics.
Table 2 Summary table of data collection instruments
Instrument Data source n per city
Qu
an
tita
tiv
e
1. Household survey Survey of households across the city1
360
2. Observation of service provider practices
Observation of containment, collection, transport/disposal and treatment/disposal
Not conducted (see below)
3. Testing fecal sludge characteristics
Samples from (i) pits/tanks during emptying, (ii) truck/vessel outflow, (iii) final drying bed or outflow
Not conducted (see below)
4. Transect walk Observation of environmental and public health risks through transect walk Drinking water supply samples, tested for fecal contamination and chlorine residual Drain water samples, tested for fecal contamination
40 (= 30+10) 57 (= 30+27) 2 Not conducted (see below)
Qu
alita
tiv
e
5. Key informant interviews
(a) government (e.g. council / utility, ministries) (b) service providers along the sanitation chain (c) other key FSM agencies
As required
6. Focus group discussions (FGDs)
FGDs with slum, low-income and informal communities
10
The OPM/WEDC team lead on methodology and analysis, while data collection was managed by
two types of consultants contracted separately. A local firm JaRco was contracted by WSP to
conduct primary data collection for most of the above instruments, with short-term consultants
(Harold Esseku and Mesfin Getachew) contracted to conduct the Key Informant Interviews and
produce the City Service Delivery Assessment (CSDA) and Political Economy Analysis (PEA) report.
1 In other city case studies, surveying was also undertake in a separate purposive sub-sample only in low-income areas. In Hawassa, problems in sampling and data collection mean this data cannot be used with confidence. Further explanation is given below. 2 A water supply in one PSU was not available during the study period, so no samples were taken.
Report of a FSM study in Hawassa, Ethiopia
6
Detailed research protocols for the instruments in the table above are available in a separate
instruments report, available on request. This section briefly summarizes each instrument, and the
following section describes the sampling approach.
Household survey: The household survey aimed to collect data from and about households using
on-site sanitation regarding their use of FSM services and preferences for future FSM services. The
household survey informs multiple components of this research. The sampling was carefully planned
so as to allow conclusions to be drawn about the city as a whole on a representative basis.
Questionnaire sections included household members and characteristics, use of water and
sanitation infrastructure, usability and observation of latrines, satisfaction and planning on sanitation,
filling up and emptying, and last time emptying.
Transect walk: The transect walk enabled participants to make a subjective and qualitative
assessment of physical and environmental conditions within a community. During the walk,
participants make systematic observations, discuss their observations and record their findings using
a standard reporting format. The information collected complements information collected from
household questionnaires, observations, and sample collection and analysis. For this study, a
transect walk provides information about the broad environmental risks to public health, in particular
with respect to the presence of fecal material and solid waste, and the likelihood that these enter
drainage channels and water sources. When all observations are complete, participants ask
community members a few short questions to gain information about typical behaviors in the
community that could be a source of risk (people defecating in the open or throwing feces out with
solid waste, uncontrolled latrine emptying or dumping of fecal sludge, etc.) and the frequency of
those behaviors throughout the year (daily, weekly, seasonal, etc.). These walks were designed to
give an overall picture of conditions in a neighborhood, with the aim of this being built into a city-wide
picture. They did not aim to allow detailed maps to be drawn with FS flows to be physically tracked,
nor did they aim to make operational recommendations at the neighborhood level. Further discussion
of this issue is in Section 5.
Testing water supply quality: During transect walks, samples of drinking water supplies were taken
from a selection of PSUs in the city and tested for levels of E. coli. The results can help to identify
the extent to which there is an association between poor FSM services and resulting levels of fecal
contamination in the local environment (i.e. in water supplies). This information, together with results
from transect walk observations, reported behaviors and practices associated with sanitation in the
community and other data sources, helps build up a picture of the public health risks from poor FSM
services, also with contamination levels (hazard), exposure and vulnerability.
Key informant interviews (KIIs): Key informant interviews (KIIs) are the way in which primary
information was sought to address key questions about how both the ‘enabling environment’ and the
operating environment affects FSM services (past, current and future). KIIs were held with
stakeholders having responsibility or interest in FSM services at city-level and beyond, allowing the
enabling and operating environments to be better understood in relation to their influence in the city.
Focus group discussions (FGDs): The objective of Focus Group Discussions (FGDs) with
residents of low-income areas was to gather qualitative data that would complement, validate, or
perhaps challenge responses made during the household survey. Questions focused on obtaining
information relating to household sanitation and FSM practices (particularly identifying the practices
of “others” as individuals are reluctant to talk honestly about their own, or their family’s, practices),
service levels, past interventions, risks and other issues associated with FSM services that affect
their community.
Instruments not applied
Report of a FSM study in Hawassa, Ethiopia
7
Observation of service provider practices: This method aimed at making visual inspections
about fecal sludge (FS) handling from pits or tanks to final disposal, in particular watching service
providers go about their business. It required the identification of hazards, hazardous events and
an assessment of possible risks at each stage (containment, emptying, conveyance, treatment
and end-use or disposal) of the fecal sludge management chain.
The survey firm JaRco advised that, despite making several attempts to observe public or private
service providers of emptying services, no household latrines or communal latrine blocks within
the defined study boundary requested emptying services during the data collection period,
although a number of institutions, hotels and public toilet blocks were using emptying services.
With the study focusing on household-level FSM services, the practices associated with public
and institutional facilities were not of direct interest to this aspect of the study.
Testing FS characteristics: Assessment of the characteristics was intended to take place at
three stages of handling: (i) during removal, as this would influence the removal methods that
could be used, (ii) after removal, as this would influence how the fecal sludge can be transported
and treated, and possible resource recovery options, and (iii) after treatment, as this would
determine the resource value of the end product derived from the fecal sludge. For the same
reasons as given above in relation to observation of service provider practices, no samples were
taken during the data collection period. In addition, JaRco were unable to find laboratories able to
carry out the required tests for FS characteristics.
2.2 Sampling
2.2.1 Sampling for the household survey
In the sampling, the aim was to give a representative understanding of the city-wide situation.
The sampling frame for the household survey contains all urban areas within the boundaries
Hawassa city. These boundaries were defined by the boundaries of the 7 sub-cities making up the
main body of Hawassa.3
Originally, there were two sub-sample areas (denoted A and B). Sub-sample A is representative of
the city as a whole, while sub-sample B focused on poor urban areas (identified as the 30 Primary
Sampling Units, or PSUs, which are the lowest-income menders4 in Hawassa) without any attempt
to be statistically representative. However, during data analysis it became clear that there were
problems with the way the local survey firm had undertaken sampling, data collection and data entry
for sub-sample B. This rendered the data unreliable and therefore it has not been used in this report.5
Explanation of sampling for sub-sample B is left in this section to give an idea of the objectives.
The aim of sub-sample A was to get city-representative estimates at minimum cost and minimum
administrative burden. Therefore, it has a relatively small sample size, for example compared to what
3 One additional sub-city about 20km from Hawassa, separated by several rural kebeles, was excluded. 4 A mender is equivalent to a village, which comes under the administration of a kebele. A kebele is the smallest
administrative unit in Ethiopia, equivalent to a “ward” or neighbourhood 5 The initial datasets received from the survey firm were not cleaned properly and had an uneven number of HHs per PSU and sub-sample. Furthermore the GPS coordinates for both sub-samples were not within the sample frame. The issue of the uneven number of HHs was due to manual error in recording the HH number and was subsequently corrected by the survey firm. The issue with the coordinates was due to multiple GPS coordinate formats being used and formats being recorded incorrectly; these were corrected by assumption but not to the extent whereby the coordinates could be used to validate sub-sample fidelity.

Report of a FSM study in Hawassa, Ethiopia
8
would be necessary for studies with different objectives (e.g. an evaluation aiming to attribute impact
to an intervention).
Sub-samples and sampling units
For sub-sample A, the Primary Sampling Units (PSUs) were menders (‘villages’), with initial stratification by “sub-city” according to their population to ensure relatively broad geographical coverage. Sub-cities are the primary administrative division within the city, with kebeles below them and menders the smallest unit. There are population data for sub-cities and kebeles based on the last census, but no population data for menders. A list of the 162 menders was collected from all the 20 kebeles.
For sub-sample B, the PSUs were also mender, but they were purposively selected from using secondary data and expert opinion (of a WASH consultant based in Hawassa) of where the poorest areas are. The same list of 162 menders was used for selection, with no duplication.
The Secondary Sampling Units (SSUs) were households, in both cases.
Sample sizes
To estimate the sample size for sub-sample A, the statistical software EpiInfo was used. The sample
size needed to generate city-representative estimates which, with a confidence level of 90%, was
predicted to be 360 households, given other variables in the power calculation.6 Surveys placing a
premium on representativeness would aim for 95% confidence, but it was decided that 90% was
enough to give us a good idea of FSM services used in the city. It was decided to use the same
sample size for sub-sample B, for ease of comparison and understanding. The power calculation
would be identical for sub-sample B, but since the sampling is purposive rather than random, there
is no specific level of confidence. The total number of households surveyed across both sub-samples
was therefore 720.
Sampling methodology
Sub-sample A – city-wide
Firstly any menders which are outside our sampling frame are excluded. For this survey, that was
all the mender in Tulla ‘sub-city’ 20km from Hawassa and separated by rural kebeles, since these
menders are effectively a separate conurbation.7
PSUs were allocated to each sub-city according to population. This stratification process was carried
out by first rounding to one decimal place, and then again to an integer.8 This creates PSUs of
roughly equal size in terms of population. A random sample was taken from these PSUs using the
statistical software package Stata; ‘seeds’ were used to avoid systematically selecting menders in
sub-cities in the same order.
6 This is based on an expected frequency of an average of 80% using non-networked sanitation (across all cities in the study), a design effect of 2, a PSU/cluster size of 12, a total number of 30 PSUs, and a margin of error of 5%. For the city-wide sample, our indicator of interest is the proportion of households using on-site sanitation (OSS), which for Hawassa was found to be 100%. 7 In other cities (e.g. Dhaka) whole PSUs were excluded which were predominantly characterised by university areas,
business districts, government administrative areas and diplomatic areas. However, in Hawassa there are no whole mender like this, so instead these areas were excluded at the household-level sampling. 8 For example, if a city’s population is 200,000 and a sub-city has a population of 25,000, then that sub-city should have 4 of the 30 PSUs ((25,000 / 200,000) * 30, rounded to nearest integer).
Report of a FSM study in Hawassa, Ethiopia
9
Households (SSUs) were sampled using systematic random sampling. 12 randomly selected HHs
were interviewed from each PSU. Populations of the menders were estimated from the populations
of the Kebele (e.g. if there are 5 menders in a Kebele of 1,800 households the population of the
menders is estimated to be 360 HHs). Households were selected using a random walk method; the
sampling interval is the population of that mender divided by 12. Enumerators started in any corner
of the mender, visiting the nth HH as per the sample interval. If the selected household were not
present the enumerators would return a further 2 times. If the HH were not present on the third time,
or they refuse to respond, then replace that household with the nth+1 household. If there are still
problems, then follow this procedure for the nth-1, then nth+2 and so on. Where the nearest household
is a building of more than one floor containing more than one household, the enumerator is to
randomly select a floor of the building.
Sub-sample B – low-income areas
After the selection of sub-sample A PSUs, a list of the remaining menders was collated. From this
50 PSUs were purposively selected as those which can be considered by local expert opinion to be
the poorest in the city. From those 50 menders, 30 were purposively sampled again, on different
criteria. The aim was to get a balance in geography and population density (e.g. even if all the very
poorest mender are in one sub-city, try and get some marginally less poor ones in geographically
diverse areas).
The sampling approach for sub-sample B within the full study was designed for cities like Dhaka and
Lima, where low-income settlements are quite large and homogeneous. To that extent, it may not
be as appropriate for secondary Ethiopian cities like Hawassa, where low-income areas are in small
pockets interspersed with other types of land use, and therefore not large enough to be whole PSUs.
In effect, Hawassa may not have 30 whole menders which can be distinguished as “low-income” and
sufficiently distinct from the rest of the city.
For sampling households/SSUs, the same process was followed as in sub-sample A.
2.2.2 Sampling in the other instruments
Key informant interviews (KIIs): The total number of interviews required, as well as the range and
extent of questioning, was influenced by the availability of current and reliable data from other
sources, as well as constraints on time and resources. Selection of interviewees was purposive,
based on advice received from stakeholders and existing knowledge of the World Bank consultant.
Focus group discussions (FGDs): 10 FGDs were held with households from 10 sub-sample B
PSUs, which were randomly selected from the total of 30 sub-sample B PSUs in low-income areas.
2.3 Fieldwork implementation
Pretesting, training and piloting: Initial pre-testing was carried out by JarCo to refine the
instruments before 4 days of enumerator training. During the training, all data collection instruments
were piloted in urban communities in both higher-income and lower-income areas, as part of field
practice for the enumerators. The team then joined a debriefing session before starting data
collection.
Field team composition: Three field teams were deployed for data collection. Each team was
composed by one Supervisor and five Household Enumerators. In addition to that there was one
qualitative team composed of one supervisor and two qualitative researchers. An experienced Field

Report of a FSM study in Hawassa, Ethiopia
10
Manager was responsible for ensuring overall management, field implementation and quality
assurance.
Data collection: The field teams collected the majority of the data from the 60 sampled PSUs over
two weeks commencing 21st February 2015. On average, each team spent one day in a PSU. Each
household interviewer conducted the survey in six households per day, and thus each team with two
interviewers completed 12 households in a cluster in one day. For the transect walks (TWs), two
teams of three participants conducted all 40 TWs over ten days. For the household survey, data
collection was carried out using android mobile phones with and an Open Data Kit app, on which the
enumerators received specific training and which was used during field practice. For other
instruments, data collection was paper-based.
Data entry, cleaning and analysis: The household survey data were downloaded from the mobile
phones at the end of each day of fieldwork, while data from other instruments were manually entered
into Microsoft Excel. JaRco carried out data cleaning using various data quality checks, including
range checks, skips and internal consistency checks. After data cleaning checks, data were then
transferred into the statistical software Stata. Data were analyzed using Stata in OPM’s offices in
Oxford. Further extensive data cleaning checks were undertaken by OPM.
2.4 Limitations
This study has various limitations which are important to explain, so that readers understand the
strengths and weaknesses of the data and what conclusions can and cannot be drawn from the
analysis. These should be considered in the context of the objectives of the study (see section 1.2
above). These are:
Technical factors – household surveys conducted by enumerators skilled in social research
are designed to ask questions that can be responded to by the householders themselves. Such
enumerators are not required to make technical inspections of sub-surface infrastructure, as this
requires a different skillset. In a social survey, the household’s response is taken at face value
(e.g. about the destination of their blackwater) as the basis for establishing the conditions
experienced by the household at the time of the study.
Sampling method – sample surveys are designed to estimate indicators for a broader
population. Therefore, they cannot produce detailed data for specific neighborhoods without
dramatically increasing the sample size and appropriate stratification. The sample size is
relatively small, compared to what would be necessary for an impact evaluation, for example. In
a similar vein, transect walks aimed to build up a broad picture rather than specific maps or
explanations for individual neighborhoods. In addition, the study only focuses on residential
areas and households, not institutions.
Definition of Hawassa – the definition of Hawassa used is the administrative boundaries of the
sub-cities forming the main body of the city, rather than any other definition in use. The Tulla
‘sub-city’ 20km from Hawassa was therefore excluded, as were any rural kebeles.
Seasonality – The data collection took place in February and March, which is at the end of the
dry season (November to January) and at the start of the first rainy season (February to May).
Peak average rainfall occurs in April and during the main rainy season (June to October). The
survey timing influences results, which in this case most likely influenced: the groundwater table
being lower than average, stormwater drains being dry and demand for emptying septic tanks
and pits limited. Other influences may also have been operational, such as changes in water
usage patterns and people’s movement in and out of the city.
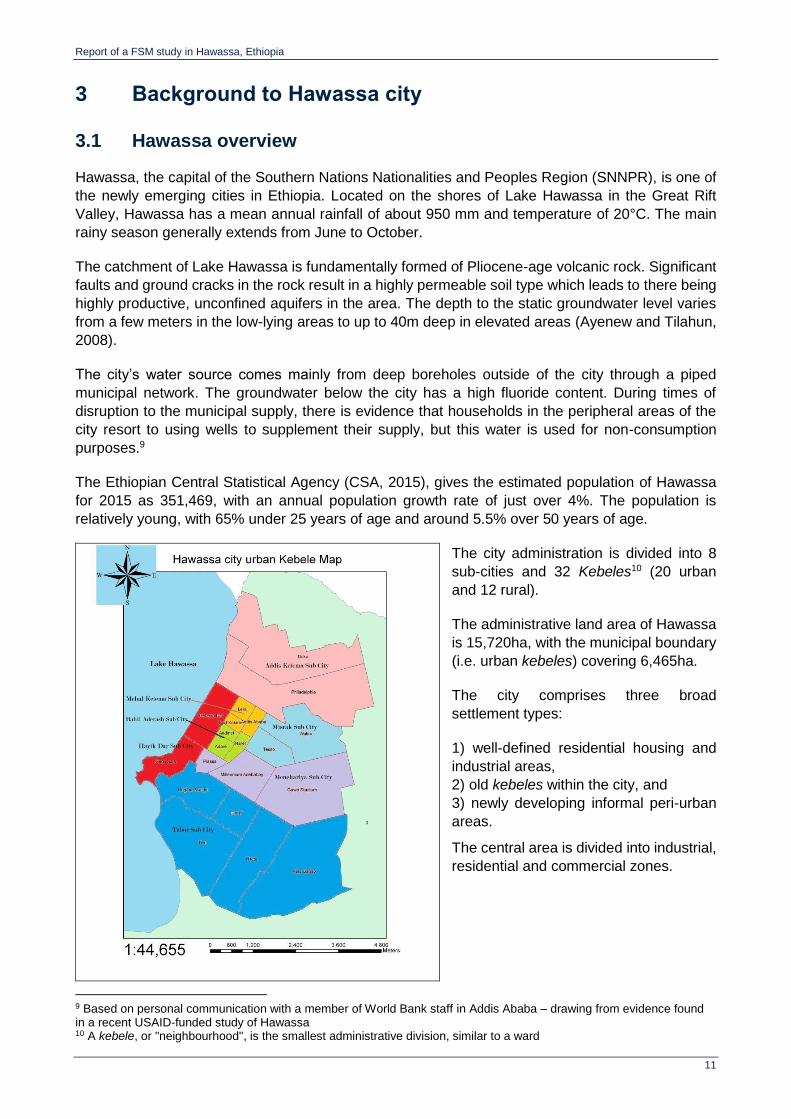
Report of a FSM study in Hawassa, Ethiopia
11
3 Background to Hawassa city
3.1 Hawassa overview
Hawassa, the capital of the Southern Nations Nationalities and Peoples Region (SNNPR), is one of
the newly emerging cities in Ethiopia. Located on the shores of Lake Hawassa in the Great Rift
Valley, Hawassa has a mean annual rainfall of about 950 mm and temperature of 20°C. The main
rainy season generally extends from June to October.
The catchment of Lake Hawassa is fundamentally formed of Pliocene-age volcanic rock. Significant
faults and ground cracks in the rock result in a highly permeable soil type which leads to there being
highly productive, unconfined aquifers in the area. The depth to the static groundwater level varies
from a few meters in the low-lying areas to up to 40m deep in elevated areas (Ayenew and Tilahun,
2008).
The city’s water source comes mainly from deep boreholes outside of the city through a piped
municipal network. The groundwater below the city has a high fluoride content. During times of
disruption to the municipal supply, there is evidence that households in the peripheral areas of the
city resort to using wells to supplement their supply, but this water is used for non-consumption
purposes.9
The Ethiopian Central Statistical Agency (CSA, 2015), gives the estimated population of Hawassa
for 2015 as 351,469, with an annual population growth rate of just over 4%. The population is
relatively young, with 65% under 25 years of age and around 5.5% over 50 years of age.
The city administration is divided into 8
sub-cities and 32 Kebeles10 (20 urban
and 12 rural).
The administrative land area of Hawassa
is 15,720ha, with the municipal boundary
(i.e. urban kebeles) covering 6,465ha.
The city comprises three broad
settlement types:
1) well-defined residential housing and
industrial areas,
2) old kebeles within the city, and
3) newly developing informal peri-urban
areas.
The central area is divided into industrial,
residential and commercial zones.
9 Based on personal communication with a member of World Bank staff in Addis Ababa – drawing from evidence found in a recent USAID-funded study of Hawassa 10 A kebele, or "neighbourhood", is the smallest administrative division, similar to a ward

Report of a FSM study in Hawassa, Ethiopia
12
Within each of these three categories of settlement, the population density varies:
well-defined residential housing and industrial areas: low density with well-planned good road
access;
old kebeles within the city: medium to high density; and
newly developing informal peri-urban areas: high density within those on the city boundary,
while those encroaching towards the city are currently more rural in nature.
Newly developing areas are inhabited by the very poor, with buildings in these areas largely semi-
permanent as the areas are formally assigned for redevelopment. Where residents are challenged
as to the legality of their status, they may end up paying to temporarily legitimize their stay.
Under the constitution of the Southern Nations, Nationalities and People’s Regional State, Hawassa
City Council is the highest government body, holding city-wide leadership responsibilities in relation
to political, economic, judicial, administrative and security matters. Hawassa City Administration
(HCA) is the highest executive body mandated to oversee the delivery of all municipal services. The
Head of the HCA is the Mayor, under whom sit three main structures: the HCA Executive Body,
Municipality Services and eight sub-city Administrations. The HCA Executive Body directly oversees
activities of the different sectoral departments, authorities and offices established to deliver services.
The Municipality Services Manager and Deputy Manager have executive roles to deliver services
including Sanitation, Beautification & Park Development Services, and Plan Preparation &
Monitoring Services, each led by a coordinator. The Water Supply and Sewerage Enterprise is the
department responsible for fecal sludge management (FSM) services in Hawassa.
Figure 2 Hawassa City Administration Organizational Structure
Hawassa City Council House Speaker
Judicial Body
Hawassa City Administration The Mayor
Mayor’s Office
Public Relations & Administration Councillor
Sub-city Administrations (8) City Administration Executive Body
Hawassa City Municipality Services
32 Kebeles Sector
Departments/Authorities/Offices Sub-city Municipalities (8)

Report of a FSM study in Hawassa, Ethiopia
13
3.2 Hawassa’s sanitation context
Available data for Hawassa city indicates that improved water supply access in 2014 was 85%.11
The household survey conducted for this study identified that 97% of households throughout the city
have access to an improved water point.12 The fast population growth of the city means that filling
the gap between demand and supply of water in the city remains a major challenge, although
additional surface water sources are under construction to supplement current supplies from
groundwater sources outside the city.
Figure 3 Access to sanitation for urban Ethiopia, JMP 2015 report
The latest JMP data showing trends for Ethiopia as a whole from
1990 to 2015, indicate access to improved sanitation facilities in
urban settings at 27%, while shared facilities account for a further
40% of urban access. Nationally, open defecation is still
practiced by about 6% of the urban population.13
Sanitation access data specifically for Hawassa city has not been
found to be available in published material. Results from this
study (showing access to improved sanitation at 32%, to
improved shared sanitation at 49% and to unimproved sanitation
at 19% - see Table 5), are shown alongside the JMP national
figures in Figure 3, for comparison.
Hawassa currently has no sewerage system. Fecal sludge
management in Hawassa is the mandated responsibility of the
Water Supply and Sewerage Enterprise. The Enterprise has
responsibility for the collection and emptying of septic tanks and
latrine pits. They operate two vacuum trucks and supervise about
a dozen vacuum trucks owned by private operators. Vacuum
trucks transport collected fecal sludge to a site operated by the
Enterprise, located at Alamura on a hilltop close to the city. The
route to the site is about 18km. The site has a treatment plant
consisting of eight sludge drying beds.
Addressing the current status of urban sanitation needs to
account for inter-related aspects, including land development
and land tenure, the promotion, regulation and enforcement of
environmental standards and solid waste management. The
Health Department, through Urban Health Extension Workers is
responsible for promotional aspects, while the regulation and
enforcement of environmental standards comes under the
Natural Resources and Environmental Protection Agency,
reporting to the Land Administration, Utilization & Environmental
Protection Authority established by the SNNP Regional State.
The Urban Sanitation, Beautification, Development and Park
11 Socio-Economic and Geo-Spatial Data Analysis and Dissemination, 2014 (2006 Ethiopian Calendar). 12 Categories of improved water supply in the survey include: piped into dwelling (10%), piped to yard/plot (77%), public tap (8%), semi-protected dug well (1%) and bought from a neighbour (1%). 13 WHO/UNICEF JMP report: Ethiopia – Estimates on the use of water sources and sanitation facilities: Updated June 2015.
20
27
30
40
11
2739
6
0
20
40
60
80
100
1990 2015
Co
vera
ge
(%
)
Urban sanitation trends
Open defecation
Other unimproved facilities
Shared facilities
Improved facilities
Haw
assa s
tud
y r
esu
lts:
for
co
mp
ari
so
n
32
49
19
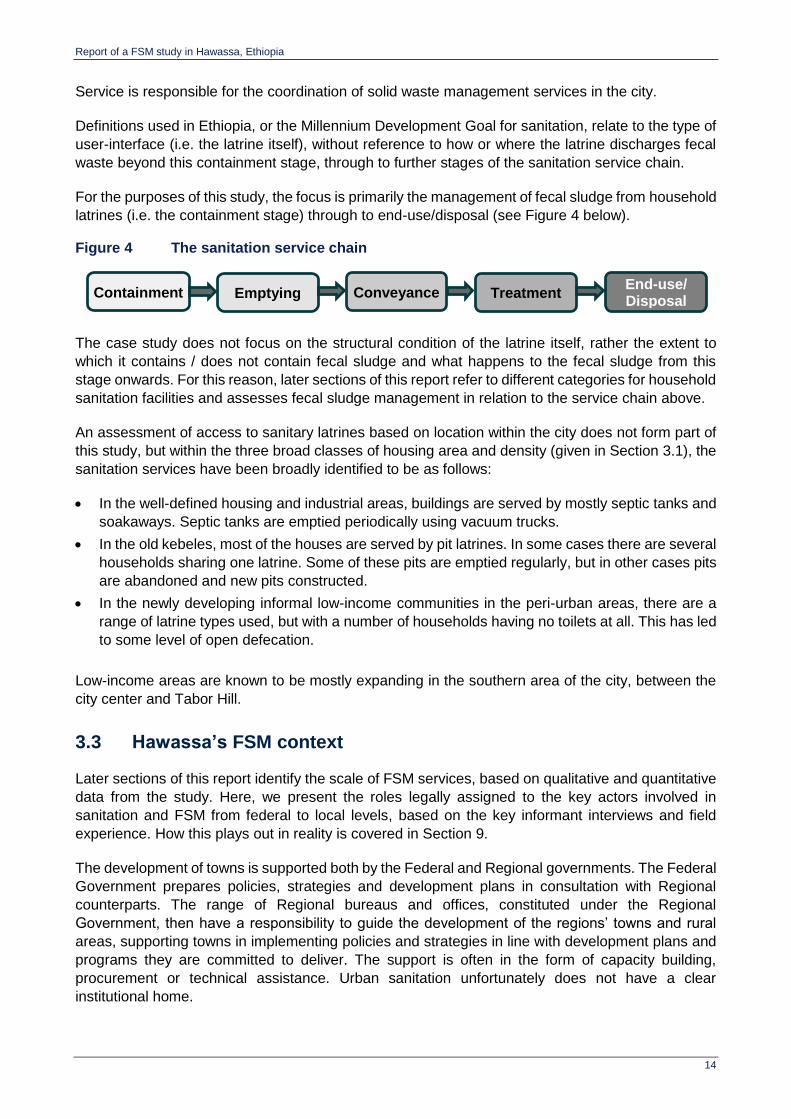
Report of a FSM study in Hawassa, Ethiopia
14
Service is responsible for the coordination of solid waste management services in the city.
Definitions used in Ethiopia, or the Millennium Development Goal for sanitation, relate to the type of
user-interface (i.e. the latrine itself), without reference to how or where the latrine discharges fecal
waste beyond this containment stage, through to further stages of the sanitation service chain.
For the purposes of this study, the focus is primarily the management of fecal sludge from household
latrines (i.e. the containment stage) through to end-use/disposal (see Figure 4 below).
Figure 4 The sanitation service chain
The case study does not focus on the structural condition of the latrine itself, rather the extent to
which it contains / does not contain fecal sludge and what happens to the fecal sludge from this
stage onwards. For this reason, later sections of this report refer to different categories for household
sanitation facilities and assesses fecal sludge management in relation to the service chain above.
An assessment of access to sanitary latrines based on location within the city does not form part of
this study, but within the three broad classes of housing area and density (given in Section 3.1), the
sanitation services have been broadly identified to be as follows:
In the well-defined housing and industrial areas, buildings are served by mostly septic tanks and
soakaways. Septic tanks are emptied periodically using vacuum trucks.
In the old kebeles, most of the houses are served by pit latrines. In some cases there are several
households sharing one latrine. Some of these pits are emptied regularly, but in other cases pits
are abandoned and new pits constructed.
In the newly developing informal low-income communities in the peri-urban areas, there are a
range of latrine types used, but with a number of households having no toilets at all. This has led
to some level of open defecation.
Low-income areas are known to be mostly expanding in the southern area of the city, between the
city center and Tabor Hill.
3.3 Hawassa’s FSM context
Later sections of this report identify the scale of FSM services, based on qualitative and quantitative
data from the study. Here, we present the roles legally assigned to the key actors involved in
sanitation and FSM from federal to local levels, based on the key informant interviews and field
experience. How this plays out in reality is covered in Section 9.
The development of towns is supported both by the Federal and Regional governments. The Federal
Government prepares policies, strategies and development plans in consultation with Regional
counterparts. The range of Regional bureaus and offices, constituted under the Regional
Government, then have a responsibility to guide the development of the regions’ towns and rural
areas, supporting towns in implementing policies and strategies in line with development plans and
programs they are committed to deliver. The support is often in the form of capacity building,
procurement or technical assistance. Urban sanitation unfortunately does not have a clear
institutional home.
Treatment End-use/ Disposal
Conveyance Emptying Containment
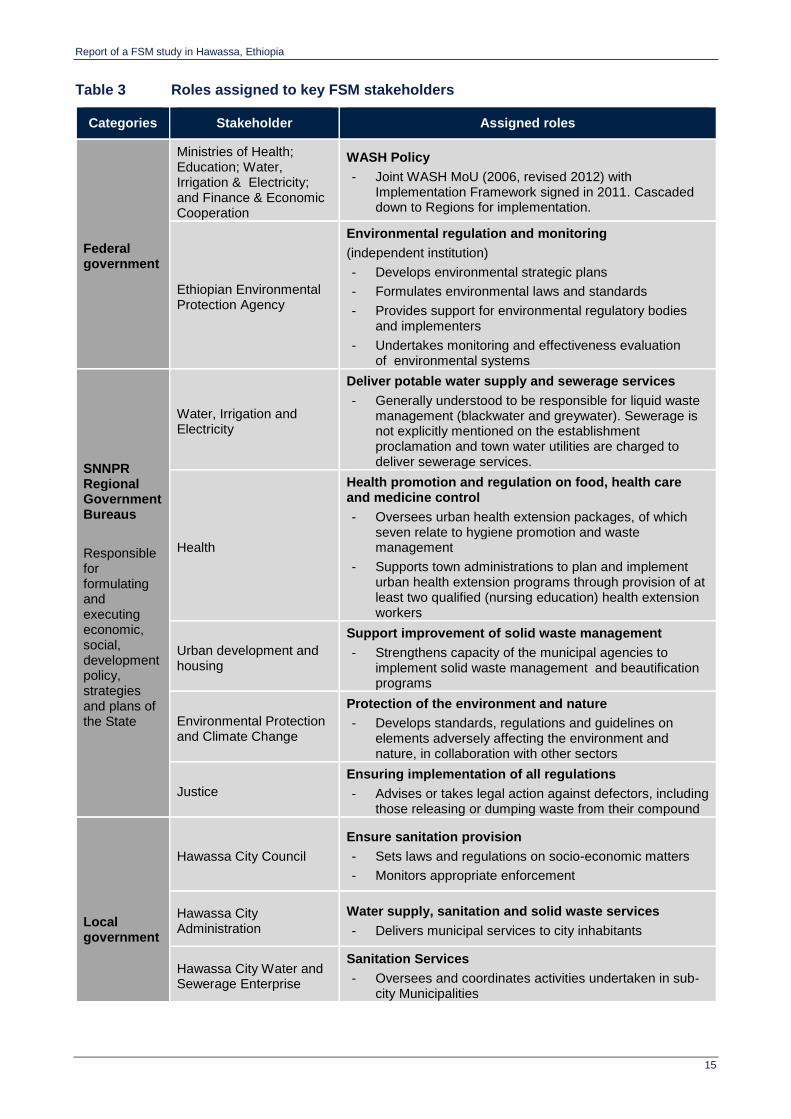
Report of a FSM study in Hawassa, Ethiopia
15
Table 3 Roles assigned to key FSM stakeholders
Categories Stakeholder Assigned roles
Federal government
Ministries of Health; Education; Water, Irrigation & Electricity; and Finance & Economic Cooperation
WASH Policy
- Joint WASH MoU (2006, revised 2012) with Implementation Framework signed in 2011. Cascaded down to Regions for implementation.
Ethiopian Environmental Protection Agency
Environmental regulation and monitoring
(independent institution)
- Develops environmental strategic plans
- Formulates environmental laws and standards
- Provides support for environmental regulatory bodies and implementers
- Undertakes monitoring and effectiveness evaluation of environmental systems
SNNPR Regional Government Bureaus
Responsible for formulating and executing economic, social, development policy, strategies and plans of the State
Water, Irrigation and Electricity
Deliver potable water supply and sewerage services
- Generally understood to be responsible for liquid waste management (blackwater and greywater). Sewerage is not explicitly mentioned on the establishment proclamation and town water utilities are charged to deliver sewerage services.
Health
Health promotion and regulation on food, health care and medicine control
- Oversees urban health extension packages, of which seven relate to hygiene promotion and waste management
- Supports town administrations to plan and implement urban health extension programs through provision of at least two qualified (nursing education) health extension workers
Urban development and housing
Support improvement of solid waste management
- Strengthens capacity of the municipal agencies to implement solid waste management and beautification programs
Environmental Protection and Climate Change
Protection of the environment and nature
- Develops standards, regulations and guidelines on elements adversely affecting the environment and nature, in collaboration with other sectors
Justice
Ensuring implementation of all regulations
- Advises or takes legal action against defectors, including those releasing or dumping waste from their compound
Hawassa City Council
Ensure sanitation provision
- Sets laws and regulations on socio-economic matters
- Monitors appropriate enforcement
Local government
Hawassa City Administration
Water supply, sanitation and solid waste services
- Delivers municipal services to city inhabitants
Hawassa City Water and Sewerage Enterprise
Sanitation Services
- Oversees and coordinates activities undertaken in sub-city Municipalities
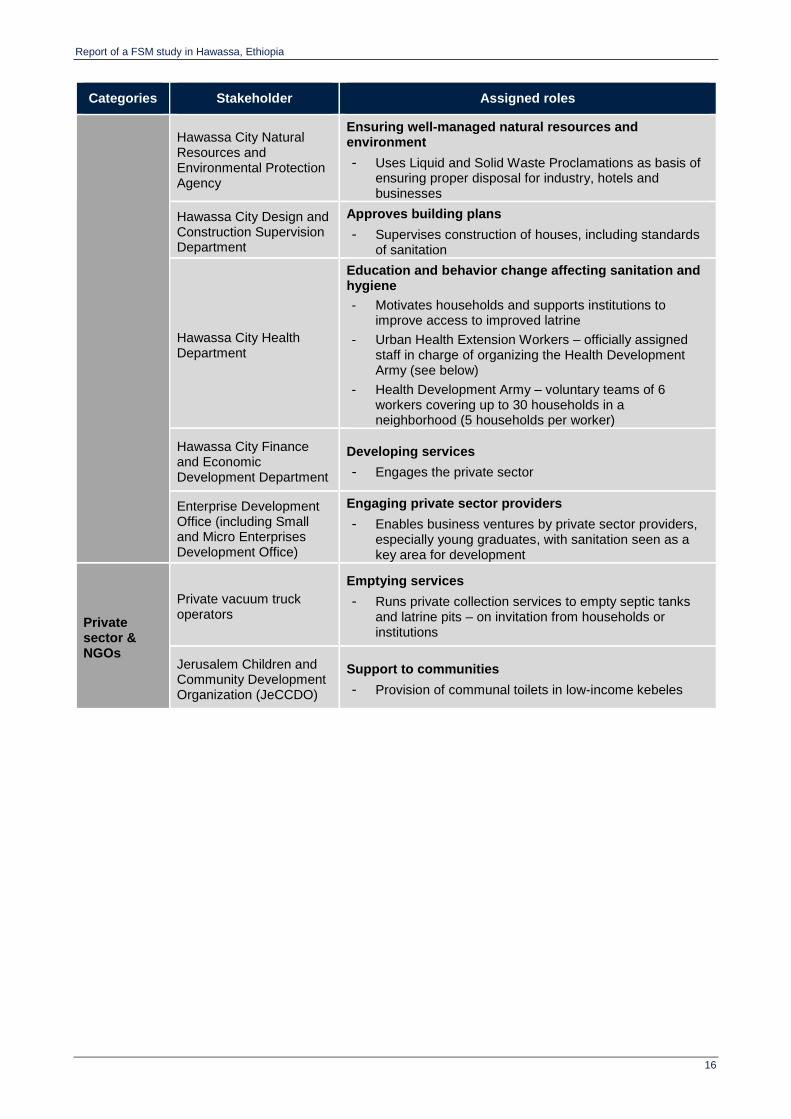
Report of a FSM study in Hawassa, Ethiopia
16
Categories Stakeholder Assigned roles
Hawassa City Natural Resources and Environmental Protection Agency
Ensuring well-managed natural resources and environment
- Uses Liquid and Solid Waste Proclamations as basis of ensuring proper disposal for industry, hotels and businesses
Hawassa City Design and Construction Supervision Department
Approves building plans
- Supervises construction of houses, including standards of sanitation
Hawassa City Health Department
Education and behavior change affecting sanitation and hygiene
- Motivates households and supports institutions to improve access to improved latrine
- Urban Health Extension Workers – officially assigned staff in charge of organizing the Health Development Army (see below)
- Health Development Army – voluntary teams of 6 workers covering up to 30 households in a neighborhood (5 households per worker)
Hawassa City Finance and Economic Development Department
Developing services
- Engages the private sector
Enterprise Development Office (including Small and Micro Enterprises Development Office)
Engaging private sector providers
- Enables business ventures by private sector providers, especially young graduates, with sanitation seen as a key area for development
Private sector & NGOs
Private vacuum truck operators
Emptying services
- Runs private collection services to empty septic tanks and latrine pits – on invitation from households or institutions
Jerusalem Children and Community Development Organization (JeCCDO)
Support to communities
- Provision of communal toilets in low-income kebeles
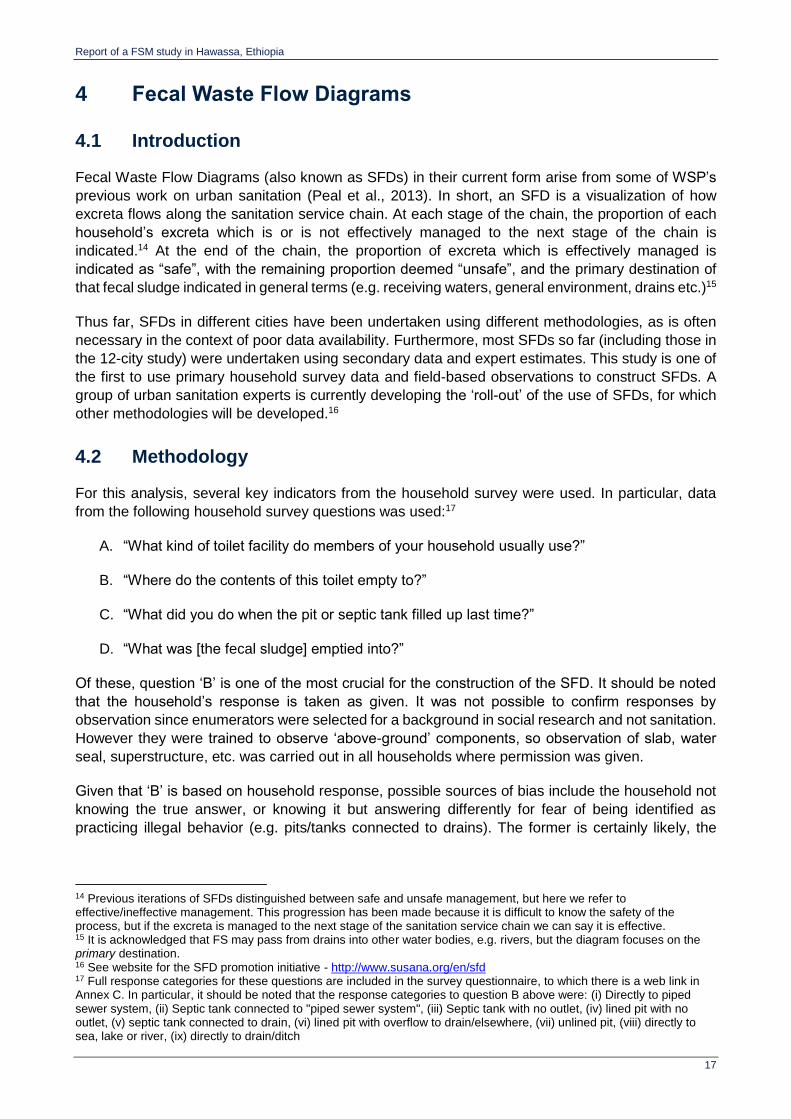
Report of a FSM study in Hawassa, Ethiopia
17
4 Fecal Waste Flow Diagrams
4.1 Introduction
Fecal Waste Flow Diagrams (also known as SFDs) in their current form arise from some of WSP’s
previous work on urban sanitation (Peal et al., 2013). In short, an SFD is a visualization of how
excreta flows along the sanitation service chain. At each stage of the chain, the proportion of each
household’s excreta which is or is not effectively managed to the next stage of the chain is
indicated.14 At the end of the chain, the proportion of excreta which is effectively managed is
indicated as “safe”, with the remaining proportion deemed “unsafe”, and the primary destination of
that fecal sludge indicated in general terms (e.g. receiving waters, general environment, drains etc.)15
Thus far, SFDs in different cities have been undertaken using different methodologies, as is often
necessary in the context of poor data availability. Furthermore, most SFDs so far (including those in
the 12-city study) were undertaken using secondary data and expert estimates. This study is one of
the first to use primary household survey data and field-based observations to construct SFDs. A
group of urban sanitation experts is currently developing the ‘roll-out’ of the use of SFDs, for which
other methodologies will be developed.16
4.2 Methodology
For this analysis, several key indicators from the household survey were used. In particular, data
from the following household survey questions was used:17
A. “What kind of toilet facility do members of your household usually use?”
B. “Where do the contents of this toilet empty to?”
C. “What did you do when the pit or septic tank filled up last time?”
D. “What was [the fecal sludge] emptied into?”
Of these, question ‘B’ is one of the most crucial for the construction of the SFD. It should be noted
that the household’s response is taken as given. It was not possible to confirm responses by
observation since enumerators were selected for a background in social research and not sanitation.
However they were trained to observe ‘above-ground’ components, so observation of slab, water
seal, superstructure, etc. was carried out in all households where permission was given.
Given that ‘B’ is based on household response, possible sources of bias include the household not
knowing the true answer, or knowing it but answering differently for fear of being identified as
practicing illegal behavior (e.g. pits/tanks connected to drains). The former is certainly likely, the
14 Previous iterations of SFDs distinguished between safe and unsafe management, but here we refer to effective/ineffective management. This progression has been made because it is difficult to know the safety of the process, but if the excreta is managed to the next stage of the sanitation service chain we can say it is effective. 15 It is acknowledged that FS may pass from drains into other water bodies, e.g. rivers, but the diagram focuses on the primary destination. 16 See website for the SFD promotion initiative - http://www.susana.org/en/sfd 17 Full response categories for these questions are included in the survey questionnaire, to which there is a web link in Annex C. In particular, it should be noted that the response categories to question B above were: (i) Directly to piped sewer system, (ii) Septic tank connected to "piped sewer system", (iii) Septic tank with no outlet, (iv) lined pit with no outlet, (v) septic tank connected to drain, (vi) lined pit with overflow to drain/elsewhere, (vii) unlined pit, (viii) directly to sea, lake or river, (ix) directly to drain/ditch

Report of a FSM study in Hawassa, Ethiopia
18
latter does not seem to be an issue given the vast majority of households who willingly disclosed
illegal behavior.
To analyze this data, an SFD matrix is created, as shown in Figure 5 below. It shows which data
sources are used and how they are analyzed into levels of effective / ineffective management of
fecal waste through the stages of the service chain – with results in the next section.
First, the household survey data on use of infrastructure (questions (A) and (B) above) is used to
allocate households to five categories shown in the column marked (1) in the figure below:
(i) “Sewered (off site centralized or decentralized)” – toilets connected to sewers (not
on-site sanitation)
(ii) “On-site storage – emptiable” – on-site toilets (either pits or tanks) which can be
emptied and are emptied from time to time
(iii) “On-site storage – single-use / pit sealed” – on-site toilets where pits or tanks are
sealed and/or abandoned once they have filled up
(iv) “On-site non-storage – straight to drain/similar” – on-site toilets which connect to
drains or open water bodies (e.g. hanging latrine, or latrine with a pipe connecting the
pan directly into a drain)
(v) “Open defecation” – self-explanatory
The question of emptiability is key. Category (ii) above is denoted as emptiable, meaning that this
containment option involves a pit or tank which fills with excreta and is therefore emptied from time-
to-time rather than abandoned or sealed when full. In Hawassa, pits/tanks are not legally allowed to
be connected to drains. Between the two extremes of a closed system and a system which never
fills up, there is a spectrum of scenarios. This is partly reflected in the data below.
The data from questions (A) and (B) at the beginning of this section are allocated in column (2) in
Figure 5 below (a key shows the meaning of the color-coding of cells by data source). Next, the
proportions for each of the stages of the chain are allocated. As can be seen from the emptying
column, marked (3), a certain proportion of the population’s excreta which makes it to that stage is
emptied by a service provider, and the rest is not emptied. This is estimated by dividing the number
of households which reported emptying their pit (question (C) above), by the number of households
using emptiable technologies (questions (B) above).
The rest of the matrix follows similar logic. The full SFD matrix for the city-wide sample in Hawassa
follows. This section has given a brief overview of where the data underlying the SFD comes from.
The SFD itself is more intuitively appealing and presented in the next section.
It should be noted that since the data comes from a household survey, the proportions in the matrix
are proportions of households, not proportions of people or of excreta volumes.18 In Hawassa, the
mean household size for sub-sample A was found to be 5.5.
18 Excreta volumes depend on a series of factors, not only population, and are quite hard to estimate. The use of a population-related variable (number of households) is proportional to the amount of fecal microorganisms excreted and therefore to the potential public health hazard.

Report of a FSM study in Hawassa, Ethiopia
19
Figure 5 Fecal waste flow matrix for Hawassa
This shows the data which goes into producing the SFD.
4.3 Results
Firstly, the household survey results and secondary data used as inputs to the SFD are shown in
the tables below for the city-wide analysis. After that, a separate SFD matrix and diagram for the city
is presented.
4.3.1 Survey results as an input to SFD
As can be seen in the table below, the majority of households use a pour / manual flush toilet
(36%) or a dry pit latrine with slab (36%). Use of a pit latrine without a slab is reported by 19% of
households, while a cistern flush toilet is reported as used by less than 10% of households. No
households reported practicing open defecation.
Table 4 Sanitation facility used, by technology type
% No. of households
Cistern flush 9.4 34
Pour/manual flush 36.1 130
Pit latrine with slab 35.8 129
Pit latrine without slab 18.6 67
VIP latrine 0.0 0
Open defecation 0.0 0
Total 100.0 360
Overall
Hawassa - city-wideManaged :
Type of systemcontained
not
containedemptied not emptied transported
not
transportedtreated
not
treated74%
0% 0% 100% 0% 100% 0% 100% 0% 100%
0% 0% 0% 0% 0% 0% 0% 0% 0%
80% 100% 0% 12% 88% 90% 10% 50% 50%
80% 0% 10% 70% 9% 1% 4% 4% 74%
20% 100% 0% 0% 100%
20% 0% 0% 20%
0% 0% 100% 0% 100%
0% 0% 0%
0% 0% 100%
0% 0%
Containment 100% Emptying 10% Transport 10% Treatment 0%
Unmanaged: 26% 0% 20% 1% 4%
Affected zones (you can
adapt the terms to suit the
context)
from household survey
estimate
de facto value
Local area (leaching
eventually to ground)
Neighbourhood
(unmanaged
emptying/transport)
City and beyond (poor
quality of treatment)
Sewered (off site centralised
or decentralised)
On-site storage - lined
pit/tank, emptiable
On-site storage - single-use
/ pit sealed (unlined pits)
On-site non-storage -
straight to drain/similar
Open defecation
Local area (leaching
directly to ground)
Containment Emptying Transport Treatment
% pop.
using
of which of which of which of which
FS not emptied is contained
(fully or partially) in lined pits
and range of STs. No risk to
public health through
groundwater, so considered
as managed
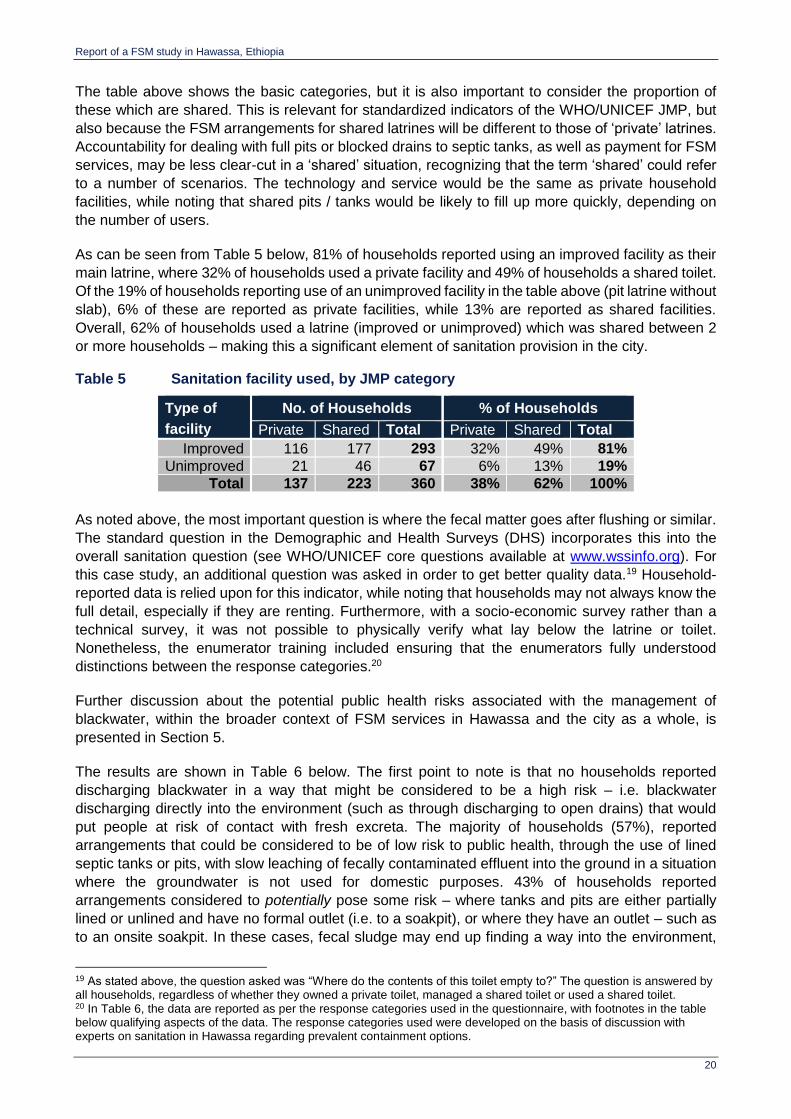
Report of a FSM study in Hawassa, Ethiopia
20
The table above shows the basic categories, but it is also important to consider the proportion of
these which are shared. This is relevant for standardized indicators of the WHO/UNICEF JMP, but
also because the FSM arrangements for shared latrines will be different to those of ‘private’ latrines.
Accountability for dealing with full pits or blocked drains to septic tanks, as well as payment for FSM
services, may be less clear-cut in a ‘shared’ situation, recognizing that the term ‘shared’ could refer
to a number of scenarios. The technology and service would be the same as private household
facilities, while noting that shared pits / tanks would be likely to fill up more quickly, depending on
the number of users.
As can be seen from Table 5 below, 81% of households reported using an improved facility as their
main latrine, where 32% of households used a private facility and 49% of households a shared toilet.
Of the 19% of households reporting use of an unimproved facility in the table above (pit latrine without
slab), 6% of these are reported as private facilities, while 13% are reported as shared facilities.
Overall, 62% of households used a latrine (improved or unimproved) which was shared between 2
or more households – making this a significant element of sanitation provision in the city.
Table 5 Sanitation facility used, by JMP category
Type of
facility
No. of Households % of Households
Private Shared Total Private Shared Total
Improved 116 177 293 32% 49% 81%
Unimproved 21 46 67 6% 13% 19%
Total 137 223 360 38% 62% 100%
As noted above, the most important question is where the fecal matter goes after flushing or similar.
The standard question in the Demographic and Health Surveys (DHS) incorporates this into the
overall sanitation question (see WHO/UNICEF core questions available at www.wssinfo.org). For
this case study, an additional question was asked in order to get better quality data.19 Household-
reported data is relied upon for this indicator, while noting that households may not always know the
full detail, especially if they are renting. Furthermore, with a socio-economic survey rather than a
technical survey, it was not possible to physically verify what lay below the latrine or toilet.
Nonetheless, the enumerator training included ensuring that the enumerators fully understood
distinctions between the response categories.20
Further discussion about the potential public health risks associated with the management of
blackwater, within the broader context of FSM services in Hawassa and the city as a whole, is
presented in Section 5.
The results are shown in Table 6 below. The first point to note is that no households reported
discharging blackwater in a way that might be considered to be a high risk – i.e. blackwater
discharging directly into the environment (such as through discharging to open drains) that would
put people at risk of contact with fresh excreta. The majority of households (57%), reported
arrangements that could be considered to be of low risk to public health, through the use of lined
septic tanks or pits, with slow leaching of fecally contaminated effluent into the ground in a situation
where the groundwater is not used for domestic purposes. 43% of households reported
arrangements considered to potentially pose some risk – where tanks and pits are either partially
lined or unlined and have no formal outlet (i.e. to a soakpit), or where they have an outlet – such as
to an onsite soakpit. In these cases, fecal sludge may end up finding a way into the environment,
19 As stated above, the question asked was “Where do the contents of this toilet empty to?” The question is answered by all households, regardless of whether they owned a private toilet, managed a shared toilet or used a shared toilet. 20 In Table 6, the data are reported as per the response categories used in the questionnaire, with footnotes in the table below qualifying aspects of the data. The response categories used were developed on the basis of discussion with experts on sanitation in Hawassa regarding prevalent containment options.
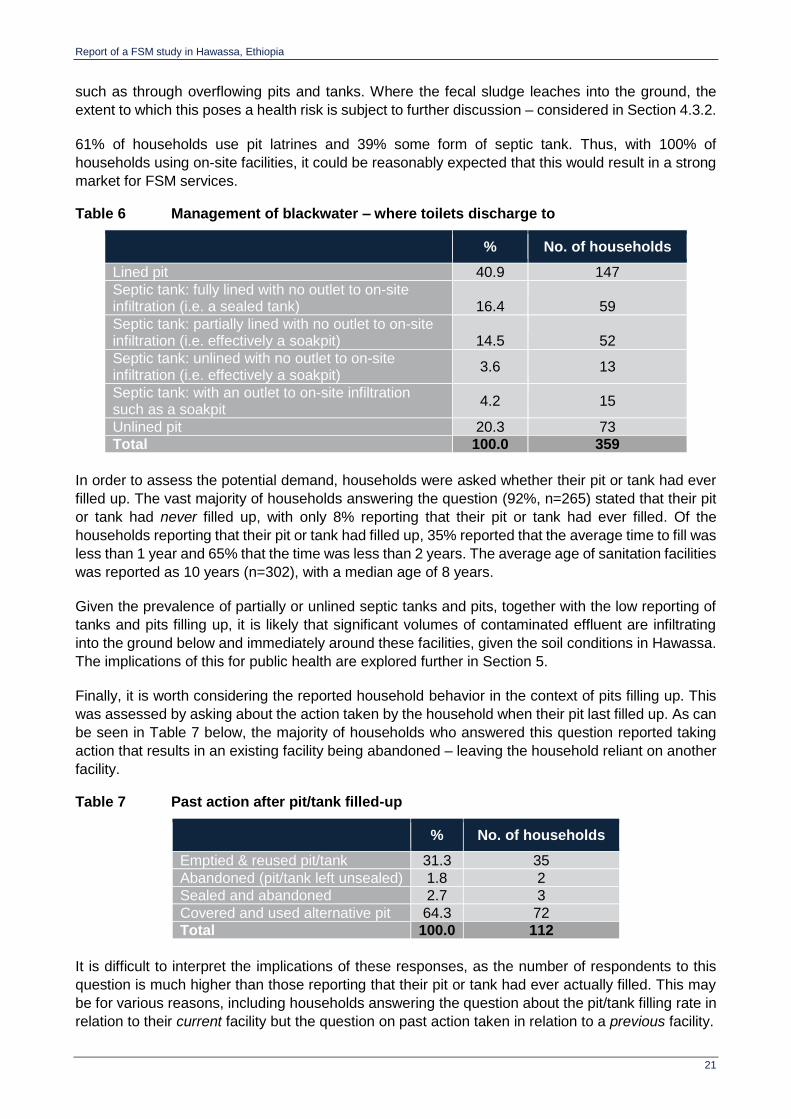
Report of a FSM study in Hawassa, Ethiopia
21
such as through overflowing pits and tanks. Where the fecal sludge leaches into the ground, the
extent to which this poses a health risk is subject to further discussion – considered in Section 4.3.2.
61% of households use pit latrines and 39% some form of septic tank. Thus, with 100% of
households using on-site facilities, it could be reasonably expected that this would result in a strong
market for FSM services.
Table 6 Management of blackwater – where toilets discharge to
% No. of households
Lined pit 40.9 147
Septic tank: fully lined with no outlet to on-site infiltration (i.e. a sealed tank) 16.4 59
Septic tank: partially lined with no outlet to on-site infiltration (i.e. effectively a soakpit) 14.5 52
Septic tank: unlined with no outlet to on-site infiltration (i.e. effectively a soakpit)
3.6 13
Septic tank: with an outlet to on-site infiltration such as a soakpit
4.2 15
Unlined pit 20.3 73
Total 100.0 359
In order to assess the potential demand, households were asked whether their pit or tank had ever
filled up. The vast majority of households answering the question (92%, n=265) stated that their pit
or tank had never filled up, with only 8% reporting that their pit or tank had ever filled. Of the
households reporting that their pit or tank had filled up, 35% reported that the average time to fill was
less than 1 year and 65% that the time was less than 2 years. The average age of sanitation facilities
was reported as 10 years (n=302), with a median age of 8 years.
Given the prevalence of partially or unlined septic tanks and pits, together with the low reporting of
tanks and pits filling up, it is likely that significant volumes of contaminated effluent are infiltrating
into the ground below and immediately around these facilities, given the soil conditions in Hawassa.
The implications of this for public health are explored further in Section 5.
Finally, it is worth considering the reported household behavior in the context of pits filling up. This
was assessed by asking about the action taken by the household when their pit last filled up. As can
be seen in Table 7 below, the majority of households who answered this question reported taking
action that results in an existing facility being abandoned – leaving the household reliant on another
facility.
Table 7 Past action after pit/tank filled-up
% No. of households
Emptied & reused pit/tank 31.3 35
Abandoned (pit/tank left unsealed) 1.8 2
Sealed and abandoned 2.7 3
Covered and used alternative pit 64.3 72
Total 100.0 112
It is difficult to interpret the implications of these responses, as the number of respondents to this
question is much higher than those reporting that their pit or tank had ever actually filled. This may
be for various reasons, including households answering the question about the pit/tank filling rate in
relation to their current facility but the question on past action taken in relation to a previous facility.
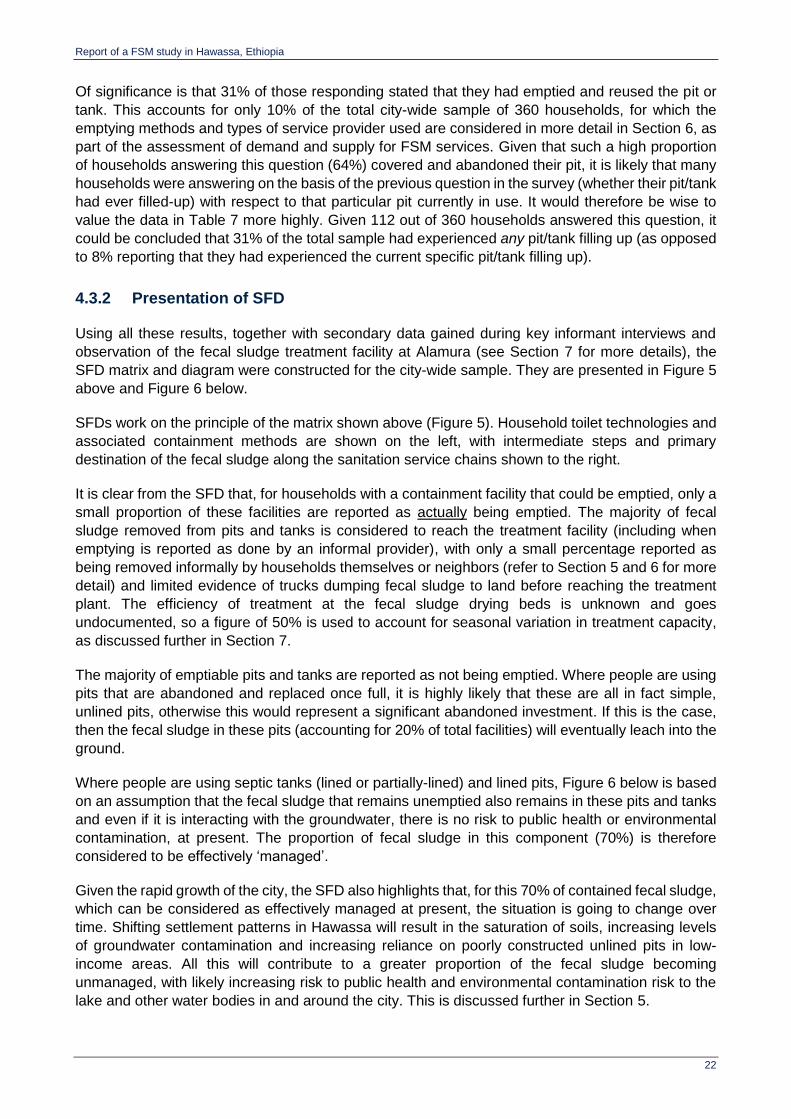
Report of a FSM study in Hawassa, Ethiopia
22
Of significance is that 31% of those responding stated that they had emptied and reused the pit or
tank. This accounts for only 10% of the total city-wide sample of 360 households, for which the
emptying methods and types of service provider used are considered in more detail in Section 6, as
part of the assessment of demand and supply for FSM services. Given that such a high proportion
of households answering this question (64%) covered and abandoned their pit, it is likely that many
households were answering on the basis of the previous question in the survey (whether their pit/tank
had ever filled-up) with respect to that particular pit currently in use. It would therefore be wise to
value the data in Table 7 more highly. Given 112 out of 360 households answered this question, it
could be concluded that 31% of the total sample had experienced any pit/tank filling up (as opposed
to 8% reporting that they had experienced the current specific pit/tank filling up).
4.3.2 Presentation of SFD
Using all these results, together with secondary data gained during key informant interviews and
observation of the fecal sludge treatment facility at Alamura (see Section 7 for more details), the
SFD matrix and diagram were constructed for the city-wide sample. They are presented in Figure 5
above and Figure 6 below.
SFDs work on the principle of the matrix shown above (Figure 5). Household toilet technologies and
associated containment methods are shown on the left, with intermediate steps and primary
destination of the fecal sludge along the sanitation service chains shown to the right.
It is clear from the SFD that, for households with a containment facility that could be emptied, only a
small proportion of these facilities are reported as actually being emptied. The majority of fecal
sludge removed from pits and tanks is considered to reach the treatment facility (including when
emptying is reported as done by an informal provider), with only a small percentage reported as
being removed informally by households themselves or neighbors (refer to Section 5 and 6 for more
detail) and limited evidence of trucks dumping fecal sludge to land before reaching the treatment
plant. The efficiency of treatment at the fecal sludge drying beds is unknown and goes
undocumented, so a figure of 50% is used to account for seasonal variation in treatment capacity,
as discussed further in Section 7.
The majority of emptiable pits and tanks are reported as not being emptied. Where people are using
pits that are abandoned and replaced once full, it is highly likely that these are all in fact simple,
unlined pits, otherwise this would represent a significant abandoned investment. If this is the case,
then the fecal sludge in these pits (accounting for 20% of total facilities) will eventually leach into the
ground.
Where people are using septic tanks (lined or partially-lined) and lined pits, Figure 6 below is based
on an assumption that the fecal sludge that remains unemptied also remains in these pits and tanks
and even if it is interacting with the groundwater, there is no risk to public health or environmental
contamination, at present. The proportion of fecal sludge in this component (70%) is therefore
considered to be effectively ‘managed’.
Given the rapid growth of the city, the SFD also highlights that, for this 70% of contained fecal sludge,
which can be considered as effectively managed at present, the situation is going to change over
time. Shifting settlement patterns in Hawassa will result in the saturation of soils, increasing levels
of groundwater contamination and increasing reliance on poorly constructed unlined pits in low-
income areas. All this will contribute to a greater proportion of the fecal sludge becoming
unmanaged, with likely increasing risk to public health and environmental contamination risk to the
lake and other water bodies in and around the city. This is discussed further in Section 5.

Report of a FSM study in Hawassa, Ethiopia
23
The actual change in risk as a result of the change to the fate of fecal waste flows from a future mix
of facilities would require a much more detailed study. This has been indicated schematically in the
SFD that follows, by mixed green and brown shading for those on-site sanitation facilities which are
not reported as being emptied but are abandoned when full.
Figure 6 Fecal waste flow diagram (SFD) for Hawassa
regards
As noted above, the mixed green and brown shading for the facilities reported as not being emptied
indicates an anticipated change in the overall risk from the fate of these fecal waste flows over time.
The situation will reach ‘crisis point’ when there is insufficient sub-soil absorption capacity for the
total liquid effluent load being generated. As buildings are built in more central and planned areas of
the city at above say 3 storeys high, there will be a need for sewerage systems to service those
buildings. Other more informal and out-lying areas of the city are likely to maintain the existing pattern
of low-quality sanitation systems, while septic tanks will become more common in the intermediate
areas.
4.4 Implications of the SFD for FSM in Hawassa
The SFD shows that, while there is effective access to at least some form of on-site sanitation
facilities throughout the city (resulting in no reported open defecation through the household survey
and limited evidence through other data collection tools), not all fecal waste is being effectively
managed through the later stages of the FSM service chain.
Treatment End-use/ Disposal Conveyance Emptying Containment

Report of a FSM study in Hawassa, Ethiopia
24
For many, the actual ‘management’ of fecal waste within their containment facility is strongly
influenced by the poor construction quality (resulting in partially lined or unlined tanks and pits) and
the soil conditions, resulting in those tanks and pits operating for many years without the need to be
emptied. Effluent from septic tanks is being managed through the use of on-site soakpits, or steady
leaching from the tank into the soil where tanks are not fully lined. As the city becomes more densely
populated, this practice will become increasingly untenable as the soil’s absorption capacity is
exceeded – with the resulting need to identify priority areas for the introduction of a range of
sewerage options. In some specific cases, or as an interim solution, there may be the need to
consider the use of well-constructed septic tanks, anaerobic baffle reactors (ABRs), or other
improved on-site containment systems supported by more responsive FSM services.
Of greater significance in terms of current fecal sludge management needs is where households in
less dense areas are abandoning or covering pits once they are no longer in use (due to being full,
or perhaps collapsed, or no longer accessible for another reason). In such cases, households resort
to finding or constructing alternative facilities – but given the reported concerns about limited space
to continue to do this, eventually this option will become non-viable and emptying will be required.
This is discussed further in later sections. It is likely that in most of these instances the pits will be of
low quality and poorly lined, putting them at risk of collapse if they are emptied mechanically. It is
also unlikely to be considered cost-effective to put them back into service by having them emptied –
unless this is done informally.
Creating the conditions for better containment and resulting safe emptying for all of these situations
will require a combination of interventions, which are considered further in the Intervention Options
assessment, under Section 10).

Report of a FSM study in Hawassa, Ethiopia
25
5 Public Health Risk Assessment
5.1 Introduction
A key component of the wider FSM study is to identify the extent of public health risks resulting from
poor FSM services within each city. The Hawassa study did not conduct all instruments intended to
support an assessment of the public health risks (i.e. observation of household latrine emptying,
testing fecal sludge samples taken during emptying and testing samples of drain water were not
undertaken, as explained in Section 2.1). Therefore, the limited data available from Transect Walks
and water quality tests can only provide an indication of the level and location along the sanitation
service chain of possible adverse public health impacts.
Methods adopted within the data collection instruments to do this include:
- Identifying types of household facility and emptying services used (supported by direct
observation of the cleanliness and functionality of the facility), during the household survey;
- Scoring hazards and vulnerability factors observed during transect walks (see explanation
below), along with information about local practices that could result in fecal contamination
in the environment (see Annex C for information on the scoring system used and the
summary of results);
- Measuring fecal contamination levels in local water supplies, to identify potential levels of
exposure to risks; and
- Asking for perceptions of risk related to emptying services, during focus group discussions.
Collating and analyzing results from the data collection instruments provides information about
sources of risk through the service chain. This includes how clean and operational toilets are kept
within the household, and the extent to which infrastructure provides effective handling of fecal
sludge and wastewater through the city.
Given the very limited extent of data collected for this part of the study, it can only provide a general
indication of risks at positions along the service chain. The study is not intended to report on specific
locations or flow paths of fecal sludge movement within the sampled PSUs.21
For more information about the sanitation-related diseases and the significance of safe management
of fecal sludge to protect environmental and public health, see Cairncross and Feachem (1993,
pp.11-25), and Strande et al (2014, pp.1-4).
5.2 Results: risks through stages of the FSM service chain
5.2.1 Containment: household facilities, levels of sharing and practices
The standard of household containment facilities has been identified from the household survey, as
indicated in Section 4.3.1.
From the survey, reported levels of sharing show that 62% of households overall were using a
shared facility, of which 49% of households used an improved shared latrine and 13% an unimproved
shared latrine. Interestingly, ownership of private household latrines was high, with 80% reporting
21 Original datasets contain GPS locations of observed risks in the PSUs that could be examined further
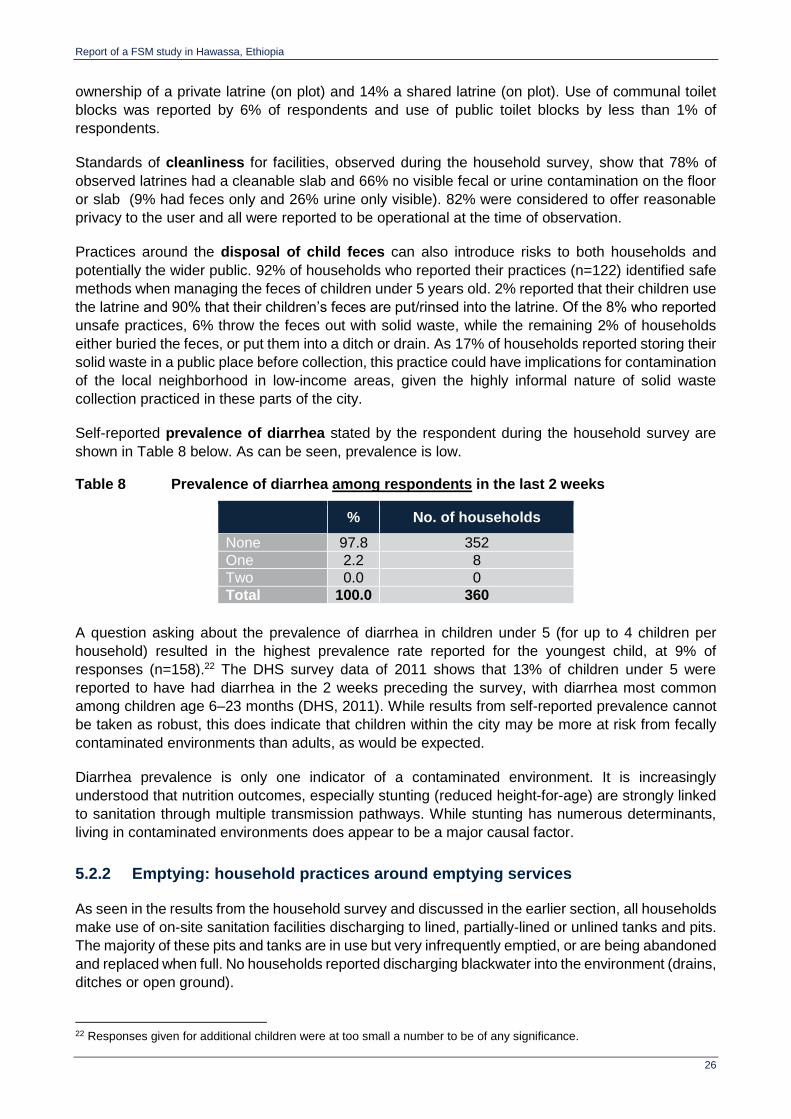
Report of a FSM study in Hawassa, Ethiopia
26
ownership of a private latrine (on plot) and 14% a shared latrine (on plot). Use of communal toilet
blocks was reported by 6% of respondents and use of public toilet blocks by less than 1% of
respondents.
Standards of cleanliness for facilities, observed during the household survey, show that 78% of
observed latrines had a cleanable slab and 66% no visible fecal or urine contamination on the floor
or slab (9% had feces only and 26% urine only visible). 82% were considered to offer reasonable
privacy to the user and all were reported to be operational at the time of observation.
Practices around the disposal of child feces can also introduce risks to both households and
potentially the wider public. 92% of households who reported their practices (n=122) identified safe
methods when managing the feces of children under 5 years old. 2% reported that their children use
the latrine and 90% that their children’s feces are put/rinsed into the latrine. Of the 8% who reported
unsafe practices, 6% throw the feces out with solid waste, while the remaining 2% of households
either buried the feces, or put them into a ditch or drain. As 17% of households reported storing their
solid waste in a public place before collection, this practice could have implications for contamination
of the local neighborhood in low-income areas, given the highly informal nature of solid waste
collection practiced in these parts of the city.
Self-reported prevalence of diarrhea stated by the respondent during the household survey are
shown in Table 8 below. As can be seen, prevalence is low.
Table 8 Prevalence of diarrhea among respondents in the last 2 weeks
% No. of households
None 97.8 352
One 2.2 8
Two 0.0 0
Total 100.0 360
A question asking about the prevalence of diarrhea in children under 5 (for up to 4 children per
household) resulted in the highest prevalence rate reported for the youngest child, at 9% of
responses (n=158).22 The DHS survey data of 2011 shows that 13% of children under 5 were
reported to have had diarrhea in the 2 weeks preceding the survey, with diarrhea most common
among children age 6–23 months (DHS, 2011). While results from self-reported prevalence cannot
be taken as robust, this does indicate that children within the city may be more at risk from fecally
contaminated environments than adults, as would be expected.
Diarrhea prevalence is only one indicator of a contaminated environment. It is increasingly
understood that nutrition outcomes, especially stunting (reduced height-for-age) are strongly linked
to sanitation through multiple transmission pathways. While stunting has numerous determinants,
living in contaminated environments does appear to be a major causal factor.
5.2.2 Emptying: household practices around emptying services
As seen in the results from the household survey and discussed in the earlier section, all households
make use of on-site sanitation facilities discharging to lined, partially-lined or unlined tanks and pits.
The majority of these pits and tanks are in use but very infrequently emptied, or are being abandoned
and replaced when full. No households reported discharging blackwater into the environment (drains,
ditches or open ground).
22 Responses given for additional children were at too small a number to be of any significance.

Report of a FSM study in Hawassa, Ethiopia
27
Satisfaction expressed about the safety of emptying services was reported to be high, with 79% of
households reporting the use of emptying services stating they were either very satisfied or satisfied
with their safety. Risk as perceived by householders will not be the same as actual risk resulting from
the process – but focus group discussions reported that the emptying process is not considered to
introduce risks, either in the emptying or transportation stages. Trucks have not been seen to spill
fecal sludge, or contaminate the local area – and no one reported identifying risks from the trucks
transporting fecal sludge within the city.
The most likely source of risk will be as a result of the delay from needing a pit or tank emptied and
the services becoming available. This is discussed further in Section 6.4 considering the supply
capacity, but here it is worth noting that although it is at a small scale, households do sometimes
experience pits/ tanks overflowing. Of the households who have called on emptying services (n=35),
the main reason has been identified as the pit or tank being nearly full (95%) with 5% reporting a pit
or tank overflowing.
In response to a question in the household survey, 10% of respondents stated that greywater is
discharged into septic tanks along with blackwater, while 41% of households discharged greywater
directly into a soakpit. 26% discharged greywater to an open drain, ditch or to open ground. This is
backed up by observations during the transect walks, that noted the presence of limited drainage
infrastructure close to homes in over half of the PSUs, but any evidence of the presence of greywater
in only two of them. The transect walks also confirmed that no blackwater is discharged into the
environment, at least beyond the boundary of the household.
Unfortunately the study has not been able to make direct observation of emptying services for
households (while services are clearly used by businesses such as hotels). Given the limited access
to emptying services throughout the city, it has not been possible to gather evidence on which to
make informed judgements about the standards of service provision and consequences for public
health risk from those practices, over and above what is reported here from the limited data in the
household survey and focus group discussions.
5.3 Results: risks from wider environmental risks and practices
Solid waste
The 40 transect walks (30 conducted city-wide and 10 in low-income areas) confirmed that solid
waste dumping is the most frequent visible problem relating to environmental sanitation across the
city. Solid waste was reported as being discarded in drains and by the roadside, typically on a daily
basis, in over half of the city-wide locations and in seven out of 10 of the low-income areas. Given
that some households dispose of child feces with solid waste (see Section 5.2.1 above), this could
introduce a certain level of risk, particularly in areas with informal solid waste collection services, or
where children play in drains and in or around solid waste piles.
Public latrines / open defecation
The transect walks identified three city-wide locations in which a public latrine had some form of fecal
contamination. This was either from feces accumulating around the facility, or the facility itself
overflowing. Residents of those PSUs noted that open defecation occurred around two of the public
latrines on a daily basis. In a further six PSUs, residents reported that people defecate in the drains
“most weeks” and around the market in one further PSU.
During transect walks held in low-income areas, in one PSU residents reported that people defecate
near to the public toilet “most weeks”, around a tobacco farm in another PSU, and “around the road”
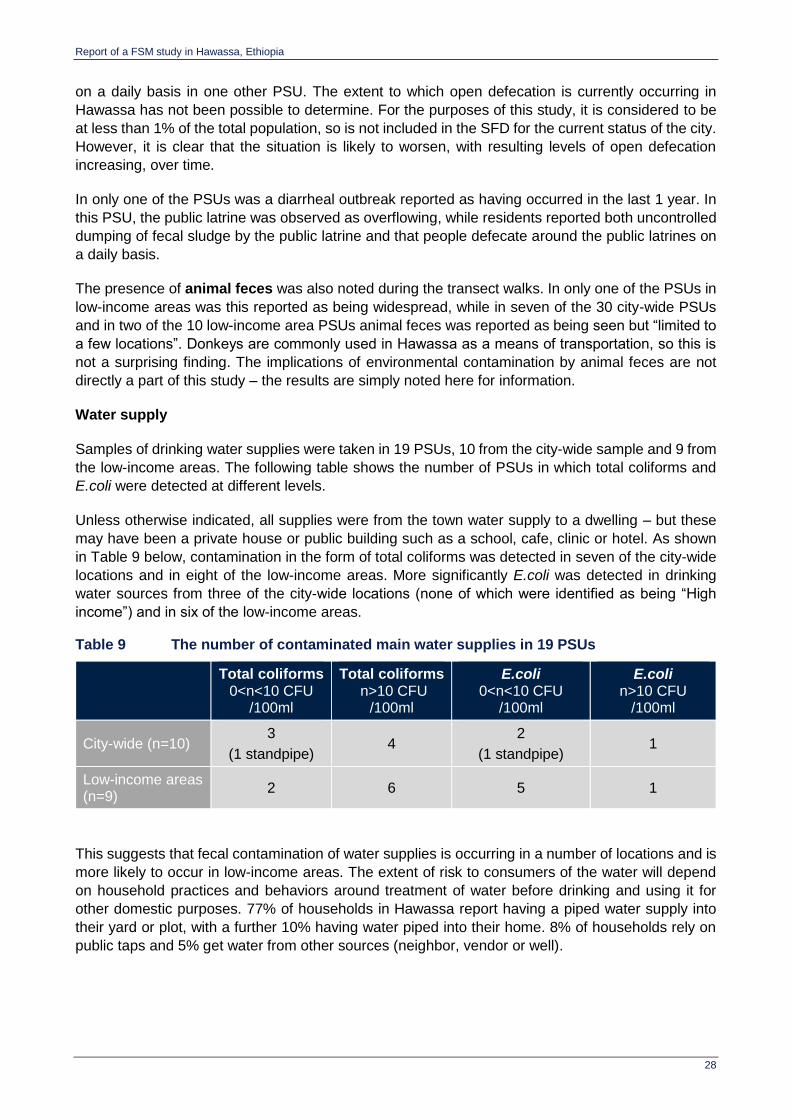
Report of a FSM study in Hawassa, Ethiopia
28
on a daily basis in one other PSU. The extent to which open defecation is currently occurring in
Hawassa has not been possible to determine. For the purposes of this study, it is considered to be
at less than 1% of the total population, so is not included in the SFD for the current status of the city.
However, it is clear that the situation is likely to worsen, with resulting levels of open defecation
increasing, over time.
In only one of the PSUs was a diarrheal outbreak reported as having occurred in the last 1 year. In
this PSU, the public latrine was observed as overflowing, while residents reported both uncontrolled
dumping of fecal sludge by the public latrine and that people defecate around the public latrines on
a daily basis.
The presence of animal feces was also noted during the transect walks. In only one of the PSUs in
low-income areas was this reported as being widespread, while in seven of the 30 city-wide PSUs
and in two of the 10 low-income area PSUs animal feces was reported as being seen but “limited to
a few locations”. Donkeys are commonly used in Hawassa as a means of transportation, so this is
not a surprising finding. The implications of environmental contamination by animal feces are not
directly a part of this study – the results are simply noted here for information.
Water supply
Samples of drinking water supplies were taken in 19 PSUs, 10 from the city-wide sample and 9 from
the low-income areas. The following table shows the number of PSUs in which total coliforms and
E.coli were detected at different levels.
Unless otherwise indicated, all supplies were from the town water supply to a dwelling – but these
may have been a private house or public building such as a school, cafe, clinic or hotel. As shown
in Table 9 below, contamination in the form of total coliforms was detected in seven of the city-wide
locations and in eight of the low-income areas. More significantly E.coli was detected in drinking
water sources from three of the city-wide locations (none of which were identified as being “High
income”) and in six of the low-income areas.
Table 9 The number of contaminated main water supplies in 19 PSUs
Total coliforms
0<n<10 CFU /100ml
Total coliforms n>10 CFU
/100ml
E.coli 0<n<10 CFU
/100ml
E.coli n>10 CFU
/100ml
City-wide (n=10) 3
(1 standpipe) 4
2
(1 standpipe) 1
Low-income areas (n=9)
2 6 5 1
This suggests that fecal contamination of water supplies is occurring in a number of locations and is
more likely to occur in low-income areas. The extent of risk to consumers of the water will depend
on household practices and behaviors around treatment of water before drinking and using it for
other domestic purposes. 77% of households in Hawassa report having a piped water supply into
their yard or plot, with a further 10% having water piped into their home. 8% of households rely on
public taps and 5% get water from other sources (neighbor, vendor or well).
Report of a FSM study in Hawassa, Ethiopia
29
5.4 Implications: assessing the public health risk from poor FSM
Risk to public health, as a result of poor FSM services, comes when there is human exposure (i.e.
some form of contact) to the hazard (i.e. fecal sludge that contains pathogens), through an event
(such as walking barefoot over fecal sludge, working or playing in drains that carry fecal sludge
discharged from latrines, drinking water contaminated with pathogens from fecal sludge).
The study has identified that the most widespread source of environmental contamination is solid
waste – and where this includes fecal matter it could present a risk to public health. While fecal
contamination of water supplies was most commonly found in low-income areas, assessment of the
findings has so far not identified a strong association between the contamination and other external
factors including poor solid waste management, lower access of household latrines or the presence
of public latrines. Further investigation would be necessary to identify the sources of contamination.
While current practices for managing containment and emptying of pits and tanks cannot be directly
linked with any risks to public health at present, what is of concern is how these practices are coming
under increasing pressure from the rapid expansion of the city. Where low-income areas are growing
in size and housing density, pressure on available space is becoming an increasing concern. The
current practice of abandoning or covering pits when they are full and using alternatives will become
increasingly non-viable as space runs out. The potential outcomes are unknown, but may include
more overflowing pits, or increased dependency on communal or public facilities
Decreasing space to dig new pits
This issue was raised a number of times during focus group discussion (FGDs) held in low-income
areas – where people have up to now been abandoning pits – usually temporary ones – and digging
new pits, or reverting to other forms of sanitation. However, respondents acknowledge that this
practice will not be possible for much longer, as they are running out of space to dig new pits. The
implications for this on increased risk of direct fecal contamination from overflowing pits or reversion
to latrines shared with more households or even open defecation, as well as a growing need for
desludging services, cannot be quantified at this stage – but must be raised as a major concern for
any plans to address the informality of settlements and tenure security.
Contamination of groundwater
The household survey identified that 97% of households throughout the city have access to an
improved water point. Given this, and a significant number of people reporting using septic tanks,
the rate of emptying pits and tanks could be expected to be higher than reported. A number of factors
are likely to affect this situation – most notably the interaction between the groundwater table and
the contents of the tanks.
As indicated in the overview, the soil type in the area is volcanic rock that has a high permeability,
while the groundwater table is also within a few meters of the surface in much of the low-lying areas
around the lake. This would result in significant leaching from soakpits, unlined or partially lined pits
and tanks into the surrounding soils. Implications for health risks from the movement of pathogens
and eventual interaction with the groundwater (influenced by the depth of groundwater below the
surface throughout the year) is considered negligible – given people’s reliance on treated water
brought in from outside of the city and minimal, if any, use of groundwater taken from shallow wells
within the city for domestic purposes (especially drinking). However, the real possibility of resulting
pollution of Lake Hawassa in the near future must not be under-estimated, as discussed further in
Section 10.
Pit / tank filling rates and emptying

Report of a FSM study in Hawassa, Ethiopia
30
As noted later in Section 6.3.1 in relation to pit filling rates, participants of focus group discussions
held in some of the low-income areas indicated that pits can fill with groundwater during the rainy
season, then the level drops during the dry season. The filling of pits from groundwater rising above
the base of the pit could result in the pit contents effectively ‘fluidizing’ on a regular basis, with the
content being ‘washed-out’ into the sub-soils.
This situation may be considered as “under control” at present, given that the demand for FSM
services is extremely low, as unlined pits and tanks take a very long time to fill. However, the chance
of localized fecal contamination from rapidly-filling pits and tanks will only increase as more and more
are poorly constructed, especially as low-income areas expand rapidly and become more densely
populated. Without the development of a viable service sector for pit and tank emptying, this
increases the risk of pits and tanks not being emptied before they overflow.
Report of a FSM study in Hawassa, Ethiopia
31
6 FSM service potential demand and supply assessment
6.1 Introduction
In economic theory, markets for goods and services operate on the basis of demand and supply.
This chapter provides a brief assessment of demand and supply for FSM services in Hawassa. At
this stage, it is important to note the difference between potential (or notional) demand and effective
demand. The potential demand for FSM services is considered to be the type and quantity of services
which would be demanded in the absence of any market failures or distortions. This is different from
effective demand, which is the type and quantity of services actually purchased in the context of
current supply and current prices.
Reasons for a gap between potential demand and effective demand in Hawassa include: (i) many
pits and septic tanks are unlined or partially lined with contents leaching directly from the chambers
into the soil, rather than fecal sludge being stored within a sealed tank and only settled effluent
discharging through a soakpit, (ii) poor operation of septic tanks, which are allowed to back-up before
being evacuated instead of regular desludging to maintain correct function of the tank and soakaway,
(iii) service providers may not be able to physically access households, (iv) market prices for services
may be higher than consumers are willing or able to pay.
On the supply side, the types of FSM services the market is currently providing to households are
considered.23 Dimensions of supply include the number of service providers of different types
(manual, mechanical etc.), the geographical areas they serve, the prices they charge, and so on.
6.2 Methodology
This sub-section sets out key dimensions of demand and supply, and the data collected related to
those, from the various instruments. The study did not set out to collect data on all of these aspects,
given the broad scope of the research and the limitations of some of the instruments used.
6.2.1 Demand
In the research framework (see section 1.3), there is the following question: “What is the existing
customer demand and preferences for FSM services?” i.e. the current effective demand. This is
discussed below in three parts: (a) physical and economic determinants of household demand, (b)
household satisfaction with current services, and (c) the barriers which households face in obtaining
FSM services. This list is not meant to be exhaustive, but rather covers those points which were
important for answering the questions in the research framework.
Physical and economic determinants of household demand
It is useful to separate the physical and economic determinants of household demand, because the
differences between them have implications for any interventions to either stimulate or respond to
that demand. Physical determinants are related to demographics, geography and infrastructure,
whereas economic determinants are more to do with markets and finance.
Some of the main determinants are set out in Table 10 and Table 11 below, which list various key
determinants and the way they have been measured in the research instruments, as well as if a
decision was taken not to collect data in this area.
23 FSM services are also demanded by the government, businesses etc. but households are the focus of this study.

Report of a FSM study in Hawassa, Ethiopia
32
Table 10 Physical determinants of demand for FSM services
Dimension Instrument used to collect
quantitative data
1. Accessibility of location
Equipment access – likelihood of equipment of different sizes (manual emptier, VacuTug, tanker truck, etc.) being able to access the facility to empty it
Household survey questions about equipment access and emptying point. Also transect walk questions around conditions of roads/paths in the area
Type of building – whether single-storey or multi-storey, and privately owned or in shared ownership
Household survey question
2. Fill rate
Volume of containment – the nature of the containment method (e.g. whether a pit, tank, or no real containment) and its volume
Household survey question on type of containment, from which we constructed a latrine durability index, but not volume (as household estimates thought to be unreliable)
Solid waste accumulation in pits– the amount and nature of solid waste thrown into pits, rather than being collected
Household survey question on the main means of solid waste collection
Number of users – the number of household members (i.e. the owner household plus any sharing households) determines volumes entering the pit
Household survey questions around household members and numbers of households sharing
Climate, soil type and groundwater – the fill rate is not a simple function of the previous two determinants. Ambient temperature, soil type and groundwater table can all strongly influence the rate of filling and digestion of fecal sludge.
Qualitative only, through key informant interviews, plus secondary data.
Table 11 Economic determinants of demand for FSM services
Dimension Instrument used to collect
quantitative data
3. Financial
Ability to pay (ATP) – poor people do not always have the available finance to pay for FSM services.
No formal assessment of ability and willingness to pay, as this was to be added at the request of the World Bank in each city. However, we did collect data on capital expenditure on latrine construction and the price paid last time the pit or tank was emptied (if relevant).
Willingness to pay (WTP) – people may have access to the finance required but not be willing to pay for the service at the market price, for any number of reasons.
4. Incentives
Tenancy status – households who rent property from a landlord may not have authority to deal with sanitation matters. Landlords may not want to pay for tenants’ ongoing services, connecting latrines instead to a direct discharge. Tenancy status therefore influences the incentives and decision-making role of the likely service purchaser.
Household survey question
Alternative sanitation options – if there is space, then households can dig a new pit and cover the old one. If there is not, the household may still abandon the latrine and use an alternative option (shared/public latrine or open defecation) rather than use an FSM service
No data, since it is hard to gauge what options are open to households. We did however ask in the household survey what they planned to do next time their pit or tank filled up.

Report of a FSM study in Hawassa, Ethiopia
33
Household satisfaction with existing services
Household satisfaction with the performance of service providers will be a determinant of demand.
This was addressed in two ways through household survey questions based on a four-point Likert
scale.24 Firstly, households were asked to rate their satisfaction level with various aspects of the
sanitation facilities used, including quality of construction, ease of access, privacy and cleanliness.
Secondly, households which had used an emptying service the last time their pit or tank filled up,
were asked to rate the service provider on price, overall service quality, safety and ease of obtaining
service.25
Other barriers which households face in obtaining FSM services
Some reasons for a gap between potential and effective demand for FSM services that may be
operating in Hawassa are already listed above (e.g. physical access to households and willingness
to pay). However, there are other potential barriers which households may face in securing FSM
services. Some of these barriers to accessing services have not been possible to predict ex ante.
These were therefore explored in the qualitative research, particularly through FGDs with community
members in low-income areas. Several of the discussion questions focused around perceptions and
opinions of existing services, and what participants would like to see in terms of improved services
in the future. Discussions were semi-structured, with participants able to discuss questions more
openly, so allowing for the identification of further determinants of demand not otherwise addressed
in the household survey. The full list of topics and questions addressed can be found via a link in
Annex D.
6.2.2 Supply
On the supply side, the research questions were around the current status and quality of FSM service
delivery, with a focus on assessing current technical and institutional capacity (i.e. the scope and
quality of services). This was assessed mainly through the report submitted by the WSP consultants,
using interviews with Hawassa City Administration, service providers and operators of the treatment
plant.
The following areas were considered:
Physical capacity
o Scale – number of service providers, their staffing capacity and areas they serve
o Clients – number of clients in past month
Technical/institutional capacity
o Formality – whether formal (i.e. licensed/registered) or informal
o Compliance – local regulations, or fines/persecution imposed
Answers on all these dimensions were not always available or forthcoming. Naturally, households’
satisfaction with service providers (see previous section) was also relevant.
24 Categories included “very satisfied”, “satisfied”, “dissatisfied” and “very dissatisfied”. 25 A low proportion of households responded to this question (35 out of 360), so there are few observations for these indicators.

Report of a FSM study in Hawassa, Ethiopia
34
6.3 Findings – household demand for FSM services
The results in each key area are presented below, with an overall assessment provided in the
concluding section, alongside implications for FSM in Hawassa.
6.3.1 Determinants of household demand
6.3.1.1 Accessibility of location
Whether a service provider can actually get to the facility requiring emptying (as well as the
household’s perception of this) will be a key determinant of demand for services. Data to assess
accessibility were collected from several angles and analyzed starting from road / path systems in
the PSU, before focusing down to the household level and, ultimately, the facility itself.
Some of the transect walk data sheds light on the kinds of housing density, paths and roads observed
in the studied areas. Table 12 provides scoring data for city-wide and low-income areas.26 The main
issue is that housing density is a significant issue in low-income areas only, with paths and roads
not likely to pose significant limitations on access for services either at a city-wide level, or in low-
income areas specifically. In terms of implications for FSM services, what can be concluded from
this table is that while mechanized emptying equipment may find it relatively easy to access all areas
of the city, reaching individual households may prove to be difficult in some low-income communities.
Table 12 Scoring for housing density, paths and roads from transect walks
City-wide (n=30) Low-income (n=10)
Score Housing density
Paths Roads Housing density
Paths Roads
1 = lowest impact 50% 53% 67% 0% 40% 50%
2 13% 7% 30% 10% 0% 50%
3 20% 27% 0% 30% 30% 0%
4 17% 13% 3% 60% 30% 0%
5 = highest impact 0% 0% 0% 0% 0% 0%
TOTAL 100% 100% 100% 100% 100% 100%
Notes: Definitions used to score Housing density, Paths and Roads are given in Annex C. Scores indicate relative
impact on effective FSM (see footnote below and the table in Annex C), while values per parameter show the percentage of transect walks for which this score was given. There were 30 and 10 TWs held in city-wide and low-income PSUs respectively.
The type of building also influences the extent and nature of the emptying likely to be required, though a large number of variables will affect this. Table 13 below shows that the majority of households in Hawassa live in private residences (95%), mainly single-storey construction (92%) and a few multi-storey (3%). The remaining 5% occupying shared residences. On this basis, the majority of emptying arrangements will be within the control of the home owner/occupier. Table 13 Type of building occupied
% No. of households
Private residence (villa) 92.5 333
26 Scores of 1-5 have been developed to address a range of physical factors in the built environment for each city study. The scores provide a quantitative value to represent the qualitative assessment of each factor, relative to the impact from that physical aspect of the PSU on achieving effective and safe FSM services. A score of 1 represents the lowest impact and 5 the highest impact. Annex C includes further explanation of the scoring mechanism.
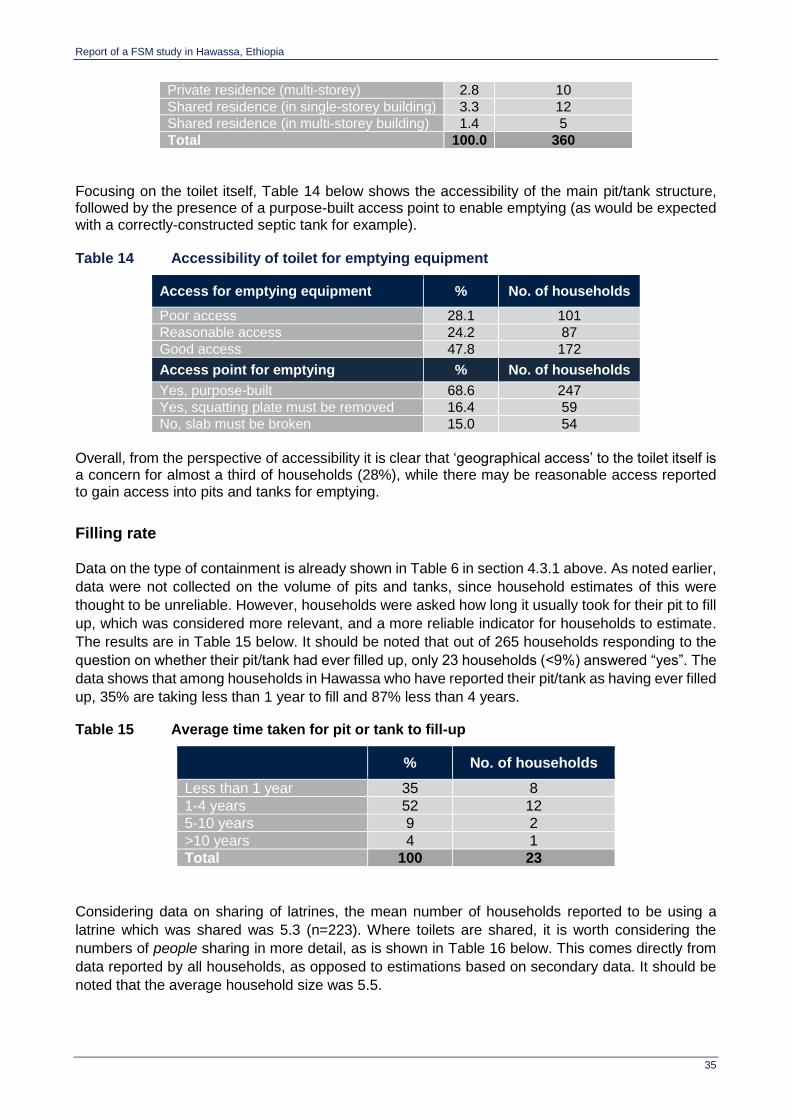
Report of a FSM study in Hawassa, Ethiopia
35
Private residence (multi-storey) 2.8 10
Shared residence (in single-storey building) 3.3 12
Shared residence (in multi-storey building) 1.4 5
Total 100.0 360
Focusing on the toilet itself, Table 14 below shows the accessibility of the main pit/tank structure, followed by the presence of a purpose-built access point to enable emptying (as would be expected with a correctly-constructed septic tank for example). Table 14 Accessibility of toilet for emptying equipment
Access for emptying equipment % No. of households
Poor access 28.1 101
Reasonable access 24.2 87
Good access 47.8 172
Access point for emptying % No. of households
Yes, purpose-built 68.6 247
Yes, squatting plate must be removed 16.4 59
No, slab must be broken 15.0 54
Overall, from the perspective of accessibility it is clear that ‘geographical access’ to the toilet itself is a concern for almost a third of households (28%), while there may be reasonable access reported to gain access into pits and tanks for emptying.
Filling rate
Data on the type of containment is already shown in Table 6 in section 4.3.1 above. As noted earlier,
data were not collected on the volume of pits and tanks, since household estimates of this were
thought to be unreliable. However, households were asked how long it usually took for their pit to fill
up, which was considered more relevant, and a more reliable indicator for households to estimate.
The results are in Table 15 below. It should be noted that out of 265 households responding to the
question on whether their pit/tank had ever filled up, only 23 households (<9%) answered “yes”. The
data shows that among households in Hawassa who have reported their pit/tank as having ever filled
up, 35% are taking less than 1 year to fill and 87% less than 4 years.
Table 15 Average time taken for pit or tank to fill-up
% No. of households
Less than 1 year 35 8
1-4 years 52 12
5-10 years 9 2
>10 years 4 1
Total 100 23
Considering data on sharing of latrines, the mean number of households reported to be using a
latrine which was shared was 5.3 (n=223). Where toilets are shared, it is worth considering the
numbers of people sharing in more detail, as is shown in Table 16 below. This comes directly from
data reported by all households, as opposed to estimations based on secondary data. It should be
noted that the average household size was 5.5.
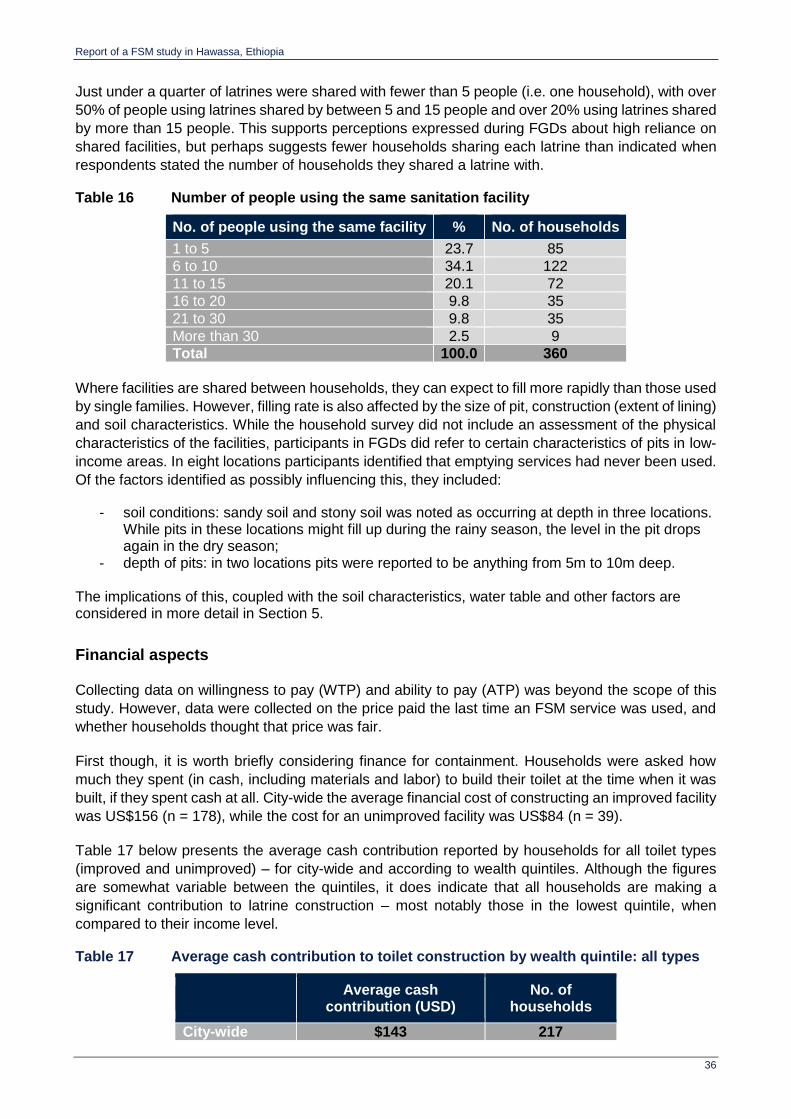
Report of a FSM study in Hawassa, Ethiopia
36
Just under a quarter of latrines were shared with fewer than 5 people (i.e. one household), with over
50% of people using latrines shared by between 5 and 15 people and over 20% using latrines shared
by more than 15 people. This supports perceptions expressed during FGDs about high reliance on
shared facilities, but perhaps suggests fewer households sharing each latrine than indicated when
respondents stated the number of households they shared a latrine with.
Table 16 Number of people using the same sanitation facility
No. of people using the same facility % No. of households
1 to 5 23.7 85
6 to 10 34.1 122
11 to 15 20.1 72
16 to 20 9.8 35
21 to 30 9.8 35
More than 30 2.5 9
Total 100.0 360
Where facilities are shared between households, they can expect to fill more rapidly than those used
by single families. However, filling rate is also affected by the size of pit, construction (extent of lining)
and soil characteristics. While the household survey did not include an assessment of the physical
characteristics of the facilities, participants in FGDs did refer to certain characteristics of pits in low-
income areas. In eight locations participants identified that emptying services had never been used.
Of the factors identified as possibly influencing this, they included:
- soil conditions: sandy soil and stony soil was noted as occurring at depth in three locations. While pits in these locations might fill up during the rainy season, the level in the pit drops again in the dry season;
- depth of pits: in two locations pits were reported to be anything from 5m to 10m deep. The implications of this, coupled with the soil characteristics, water table and other factors are considered in more detail in Section 5.
Financial aspects
Collecting data on willingness to pay (WTP) and ability to pay (ATP) was beyond the scope of this
study. However, data were collected on the price paid the last time an FSM service was used, and
whether households thought that price was fair.
First though, it is worth briefly considering finance for containment. Households were asked how
much they spent (in cash, including materials and labor) to build their toilet at the time when it was
built, if they spent cash at all. City-wide the average financial cost of constructing an improved facility
was US$156 (n = 178), while the cost for an unimproved facility was US$84 (n = 39).
Table 17 below presents the average cash contribution reported by households for all toilet types
(improved and unimproved) – for city-wide and according to wealth quintiles. Although the figures
are somewhat variable between the quintiles, it does indicate that all households are making a
significant contribution to latrine construction – most notably those in the lowest quintile, when
compared to their income level.
Table 17 Average cash contribution to toilet construction by wealth quintile: all types
Average cash
contribution (USD) No. of
households
City-wide $143 217

Report of a FSM study in Hawassa, Ethiopia
37
Lowest $108 41
Second $84 47
Middle $168 45
Fourth $147 40
Highest $210 44
Regarding repairs or maintenance to toilets in the past 12 months (including repairs to the toilet
mechanism, superstructure, or drainage arrangement), the average expenditure was US$114 (n =
51).27
Overall, households are investing significant resources in both the construction and maintenance of
their sanitation facilities. While 51% of households have spent money in maintaining their sanitation
facilities, these costs amount to 80% of the original investment for the construction of the facilities.
With regard to payment for FSM services the last time emptying took place (Table 18), the mean
amount paid was US$61 (n = 34). 32 households (94%) paid a flat rate for the emptying service and
paid the full amount on delivery. These costs are considered further, in relation to the official tariffs
and reported charges made by private and municipal service providers, in Section 6.4.1 and Table
21. For about half of household respondents, these costs were perceived to be high, while the other
half considered them to be fair.
Table 18 Average amount paid for emptying services
US dollars No. of households
Amount paid $61.07 34
* Exchange rate: 1 ETB (Ethiopian Birr) = 0.048 USD
6.3.1.2 Incentives
The incentives that drive demand for improved FSM services are influenced by who is responsible
for the ongoing maintenance to keep toilets functioning. The household survey shows that 85% of
respondents own their property, so they will have greater influence over how their latrine is managed.
80% of households used a private household toilet (on plot), with landlords reported to be
responsible for managing toilets in 30% of cases. This value does not tally completely with the 15%
of people reporting to be in rented property. This may illustrate some confusion over the definition of
‘landlord’ when responding to the specific survey questions, or be influenced by the occupancy of
government-owned “kebele houses”. These are large houses in the older parts of Hawassa, often
originally owned by a single family, but now with several families living in them and paying nominal
rents to the local government.
However, it can be ascertained that, with high numbers of households using an on-plot private toilet,
they are more likely to be responsible for servicing that toilet and/or what it is connected to (i.e. a
septic tank or pit). Most households are therefore key stakeholders in decision-making around
investments and plans to improve infrastructure and FSM services to support ongoing functionality
of the sanitation service chain.
Where households invest in a toilet facility, they are likely to have stronger incentives for seeing it
continue to function. 33% of facilities were reported as being strongly improved (with an overall
27 Most households reported that this expenditure was mainly for repairs to the toilet bowl/slab or to the superstructure (82%), while only 8 households (16%) incurred costs for emptying their pits/septic tanks in the last 12 months.
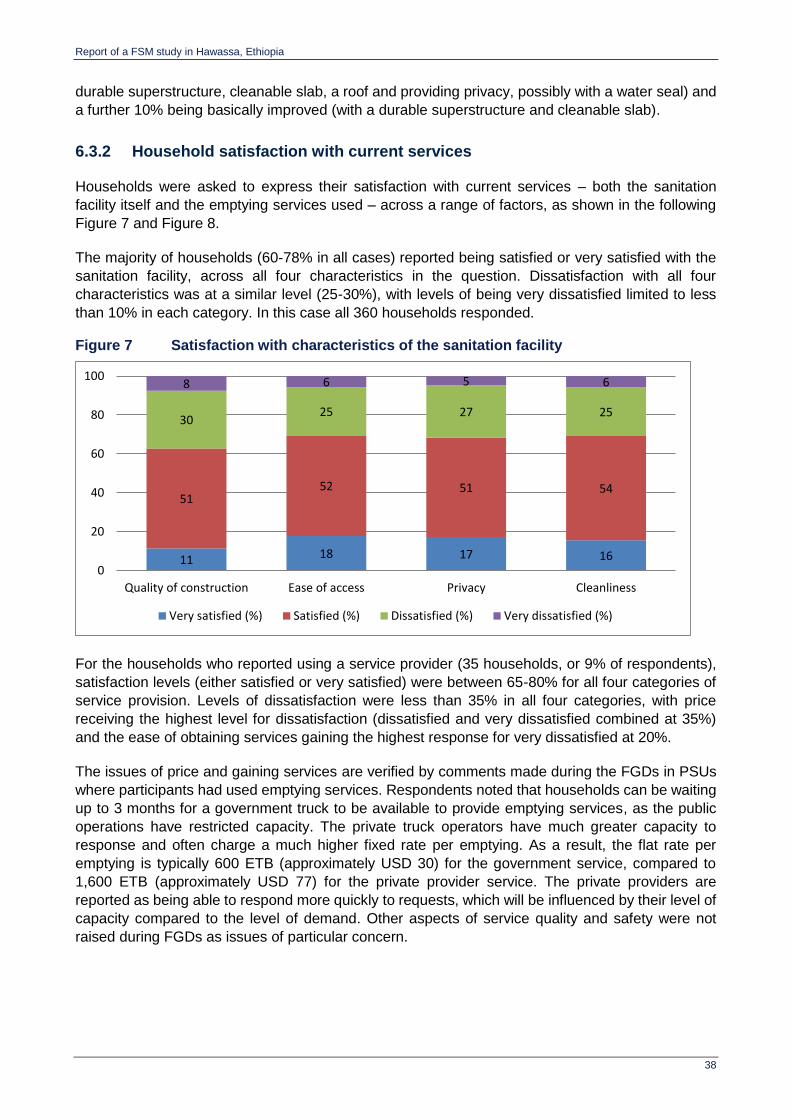
Report of a FSM study in Hawassa, Ethiopia
38
durable superstructure, cleanable slab, a roof and providing privacy, possibly with a water seal) and
a further 10% being basically improved (with a durable superstructure and cleanable slab).
6.3.2 Household satisfaction with current services
Households were asked to express their satisfaction with current services – both the sanitation
facility itself and the emptying services used – across a range of factors, as shown in the following
Figure 7 and Figure 8.
The majority of households (60-78% in all cases) reported being satisfied or very satisfied with the
sanitation facility, across all four characteristics in the question. Dissatisfaction with all four
characteristics was at a similar level (25-30%), with levels of being very dissatisfied limited to less
than 10% in each category. In this case all 360 households responded.
Figure 7 Satisfaction with characteristics of the sanitation facility
For the households who reported using a service provider (35 households, or 9% of respondents),
satisfaction levels (either satisfied or very satisfied) were between 65-80% for all four categories of
service provision. Levels of dissatisfaction were less than 35% in all four categories, with price
receiving the highest level for dissatisfaction (dissatisfied and very dissatisfied combined at 35%)
and the ease of obtaining services gaining the highest response for very dissatisfied at 20%.
The issues of price and gaining services are verified by comments made during the FGDs in PSUs
where participants had used emptying services. Respondents noted that households can be waiting
up to 3 months for a government truck to be available to provide emptying services, as the public
operations have restricted capacity. The private truck operators have much greater capacity to
response and often charge a much higher fixed rate per emptying. As a result, the flat rate per
emptying is typically 600 ETB (approximately USD 30) for the government service, compared to
1,600 ETB (approximately USD 77) for the private provider service. The private providers are
reported as being able to respond more quickly to requests, which will be influenced by their level of
capacity compared to the level of demand. Other aspects of service quality and safety were not
raised during FGDs as issues of particular concern.
11 18 17 16
5152 51 54
3025 27 25
8 6 5 6
0
20
40
60
80
100
Quality of construction Ease of access Privacy Cleanliness
Very satisfied (%) Satisfied (%) Dissatisfied (%) Very dissatisfied (%)

Report of a FSM study in Hawassa, Ethiopia
39
Figure 8 Satisfaction with emptying service provider
Households were also asked their intended action once their pit or tank fills-up (whether it had filled
previously or not). The results are shown in Table 19 below. Less emphasis is given to this data than
what action was taken after the pit last filled up, as these intentions may not be carried out.
Nonetheless, it does indicate a strong degree of intention to use the mechanical emptying market –
with 78% of respondents inferring use of a mechanical emptier. Making use of mechanical emptying
services is by far the preferred intention – but in reality this is not the action that most households
have taken in the past.
Table 19 Intended action after pit/tank fills-up
% No. of households
Empty by household member 1.1 4
Empty by a manual emptier 0.3 1
Empty by a mechanical emptier 78.1 281
Cover and seal pit 16.4 59
Abandon without covering 0.8 3
Don't know 3.3 12
Total 100.0 360
The household survey data do not give insight into the reasons why people’s preferred option is
different to current practice, but responses given during FGDs in low-income areas do provide some
idea of the barriers households currently face in obtaining FSM services, as discussed in the next
section.
6.3.3 Barriers faced by households, in obtaining FSM services
Focus group discussions (FGDs) held in low-income areas identified that the key barriers faced by
households in obtaining FSM services relate to (1) cost / affordability, (2) access to services and (3)
legality of residence affecting latrine design and operation.
In relation to cost and affordability, householders living in low-income areas do not have the
financial resources to build a good latrine that could be easily and safely emptied. They also find the
emptying services expensive. The service providers charge fixed fees per trip and these are
11 11 914
5466 71
66
209
90
14 14 1120
0
20
40
60
80
100
Price Service quality Safety Ease of obtaining service
Very satisfied (%) Satisfied (%) Dissatisfied (%) Very dissatisfied (%)
Report of a FSM study in Hawassa, Ethiopia
40
recognized as very expensive by people who have used them – although in the vast majority of
cases, people are not making use of these services. Households are clearly aware of the services
on offer from the government and private operators, as well as the costs being charged for these
services. There was a reported lack of government subsidy, or direct financial support, to make
emptying services more affordable, but an expression of demand for these services if they were
“affordable”.
In relation to geographical access, the transect walks identified the main limitation for service
providers in low-income areas was housing density. This is indicated in Table 12. Respondents in a
number of FGDs also identified poor physical access to their area and to the households themselves
(dense housing and narrow pathways between them) as a constraint to using current emptying
arrangements (i.e. the mechanized vacuum tankers). In more formal areas of Hawassa however,
access for service providers to households does not appear to be a significant barrier.
The issue of tenure security is more complex and a significant barrier affecting households in low-
income areas within the city, particularly as these areas continue to expand and become more
densely populated. Households often arrange for an initial temporary shelter to be constructed on
an unregistered plot of land, sometime paying builders to construct them at night so it is ‘built’ before
the authorities can prevent them from doing so. While they also do not have permission from the
Municipality to construct toilets, the household will generally construct a temporary, unimproved and
shallow (1-2m deep) pit latrine. When the pit fills up or collapses, it is abandoned and a new pit dug.
This practice is widespread and occurs while families have space to dig replacement pits, but
increasingly a lack of space is putting pressure on these households. Those living in low-income
areas identified that they have no incentive to build toilets that would require emptying, as they are
not prepared to make the investment in an improved toilet when it is in danger of being destroyed by
the authorities. They are effectively barred from receiving formal containment or emptying services.
Households living in poorer areas of the city in general may end up using shared latrines, or one
of the few communal or public toilet facilities provided by the government or an NGO. 6% of
households in the city-wide survey were identified as using a communal (off-plot) latrine facility (as
distinct from the 14% using an on-plot shared facility) and less than 1% using a public (off-plot)
facility.
A further barrier for households identified during the FGDs was a lack of technical knowledge and
broader awareness about how to construct good latrines, effectively manage and maintain them.
Respondents said that with government support in the way of materials and training, households
would be prepared to provide labor and skills to improve their existing latrines or build new improved
ones. However, they see far less of a role for households in emptying these latrines, unless and until:
a) people have no other option (i.e. they run out of space to dig a new latrine pit), b) they have
permission to more permanent build latrines that are designed to be emptied, and c) the cost and
waiting times for services are reduced.
6.4 Findings – supply of FSM services
As set out in section 6.2.2, questions on the supply side of FSM services related to the current status
and quality of FSM service delivery. This was divided into assessments of physical capacity of
service providers (number of providers and the scale of service reach) and technical / institutional
capacity (the scope and quality of services).

Report of a FSM study in Hawassa, Ethiopia
41
6.4.1 Services effectively supplied
The first stage of the supply analysis is to consider what services are supplied in the market, where
effective supply intersects with effective demand. Some relevant context was already provided in
Section 4.3.1, especially in Table 6 and Table 7. These tables show that when pits have previously
filled up, some people do empty them, but the majority of households abandon the pit and make use
of an alternative. The data show that city-wide, only 10% of households in Hawassa have emptied a
pit or tank.
The households which reported having their pit or tank emptied last time it filled up were also asked
the emptying method and type of equipment used. The results are shown in Table 20 below. This
highlights that in all instances, some form of mechanical emptying was reported to be used. In most
cases, this was carried out by a formal private provider, followed by an informal provider, then by the
utility. Together these account for 77% of reported emptying methods.
Table 20 Emptying method cross-tabulated with service provider type
By
hand Manual pump
Mechanical machine (%)
Total no. of households
Member of household 0 0 9 3
Neighbor 0 0 3 1
Informal provider 0 0 20 7
Formal provider (company) 0 0 40 14
Formal provider (utility) 0 0 17 6
Other 0 0 11 4
Total 0 0 100 35
These households were also asked about where the fecal sludge was discharged during emptying.
Households were only asked about the initial discharge point, as they would not always be in a
position to know where service providers eventually discharged to. All 35 households responded that
the contents were (initially) discharged into a machine/tanker.
Emptying by a member of the household, neighbor or “other” means was reported to account for
23% of emptying methods used. It would be surprising if a mechanical machine was employed in all
of these cases, but with the responses about the initial discharge point backing this up, it would
appear that use of a mechanized arrangement predominates, when people do actually empty their
pits or tanks. This is also supported by the high reported levels of satisfaction with the quality and
safety of emptying practices, as shown previously in Figure 8.
With regard to the type of payment made for services, almost all responding households (n=34)
reported paying a flat rate (94%), with only 6% of households (n=2) reporting being charged a
volumetric rate. As reported in Table 18, the average amount paid for emptying is approximately
USD 86 for formal private services and USD 70 for formal municipal services. However, costs
reported in the household survey vary by a factor of 16, from USD 14 to USD 230 for a formal private
provider, even with 94% of responses from the city-wide sample reporting a flat rate rather than a
volumetric charge.
The approved charge rates (applicable only to the WSE services) given by the General Manager of
Hawassa City Water and Sewerage Enterprise (WSE) are shown in Table 21 below. This highlights
the variation in official and unofficial charges for services provided by private operators and those
provided by the municipality. It is interesting to note that the prices reported directly from households
in the survey are almost twice the currently approved rates, and close to the commercial rate. Even
if this is a result of additional ‘informal’ fees being paid to the drivers, it indicates that the current

Report of a FSM study in Hawassa, Ethiopia
42
rates paid are commercially viable. The General Manager also pointed out that actual charges made
by private operators are often more like ETB 1,500 (or USD 72 – which compares with values
reported during the FGDs), as operators are unable to achieve cost-recovery based on the official
rates and find that households are willing to pay more anyway. This is placing greater strain on the
Municipality for services, which they feel unable to respond to at present.
In addition, the Municipality is proposing an increase to the official tariff, to achieve greater parity
between charges made by the public and private operators. An increase in fees will also support the
costs associated with trucks travelling to the existing drying beds – which places significant wear on
the vehicles travelling on the unmade and rough road as they travel up the hill to the site, especially
with a full load and during the rainy season. These costs are also shown in the table below. At these
rates, they are more like the charges reported during a focus group discussion in one of the low-
income areas of the city – which suggests that some households are already being charged at the
higher proposed rates for private operators. The full set of results in the table highlights that
household survey data are broadly consistent with other data sources.
Variations in charges will be affected by the capacity of the trucks used. The specific capacities have
not been determined, but are known to vary between those used by the private and municipal
operators. It is likely that the capacity in the range of private trucks is larger (between 7-10m³), while
those of the municipality are in the order of 4-6m³.
Table 21 Ranges of identified emptying charges: formal private and municipal services
Source of data Charge (USD)
Private provider
Charge (USD)
Municipality
Household survey (average cost) 28 $86 (n=14) $70 (n=6)
FGD: residents in central Hawassa, using
emptying services (mostly in the rainy season) $77 $30
WSE: approved tariff for private institutions n/a $36
WSE: proposed new tariff (to be approved) n/a $77
Private provider: more typical charge $72 n/a
Note: Charges are per trip, where a trip is based on emptying one household septic tank or latrine.
6.4.2 Service provider capacity
Mechanical emptying services
FSM services in Hawassa City are provided either by the municipality (Water and Sewerage
Enterprise, WSE) or private service providers.
The municipality owns two vacuum trucks that carry out up to six trips per day. However, at the
time of the study one of the municipal vacuum trucks had broken down and was out of action –
and had been for some time. WSE expressed an intention in late 2015 to purchase a further two
trucks, which may affect the decision to re-adjust the charge rate.
There are five privately owned vacuum trucks registered with the Water and Sewerage
Enterprise. In addition, a further four or five vacuum trucks provide emptying services exclusively
for hotels, resorts and restaurants in the city. In total, up to twelve vacuum trucks can be operating
in the city at any one time – although only up to seven are available to serve domestic properties.
28 These costs compare with an average of USD 57 for emptying by informal operators, as reported in the household survey (n=6).

Report of a FSM study in Hawassa, Ethiopia
43
The private providers do not operate only in Hawassa, but sometimes move to other towns to
gain additional business.
The private providers are considered by households to provide a faster response service, but they
are also reported to be unofficially charging much higher rates than the approved tariff. This places
greater pressure on the municipality, which charges lower rates, and feels that the level of demand
they face is putting pressure on their operators and the trucks themselves. As a result, the General
Manager of the Enterprise identifies that current capacity for FSM service delivery in terms of
materials, financial and human resources is insufficient, especially in light of the increasing demands
of a rapidly expanding city.
During interviews with city stakeholders, it was mentioned that private vacuum truck operators
complain they do not secure enough emptying jobs to make their work financially viable. The
seasonality of this work is in any case a commercial challenge. Together with the felt inadequacy of
the official tariff rate, these operators go on to identify themselves as operating from ‘outside of the
city’ and are therefore able to charge unofficial tariffs when serving customers within the city.
Implications of this practice on future licensing of the operators is addressed in Section 9, the
Prognosis for Change.
Manual emptying services
The household survey did not identify any manual emptying service operating in Hawassa – although
in a few instances emptying of pits/ tanks was reported as being carried out either by the household
themselves, a neighbor, or a means “other” than a recognized emptying provider (see Table 20).
This accounts for only 8 households, or 2%, of those surveyed. Only one household identified using
a manual emptier in any intended future emptying. Interviews conducted by the WSP consultants
confirmed that manual emptying is virtually non-existent in the city.
Factors affecting household decisions about which service provider to use
The main decision households make is between using the vacuum trucks operated by the
municipality, or those operated by private providers, or to abandon their full pit/tank. Both providers
appear to offer a safe and efficient service, with no concerns reported during FGDs about the
emptying or transport practices introducing risk to people’s health, or contaminating their compound,
neighborhood or the city from poor operating standards and procedures.
The key factors affecting the choice between private and public emptying are cost and speed of
response. As identified in Table 21, the average fees reported as charged by private and public
providers (from the household survey) are not that different. However, actual fees more typically
charged by private providers, including in central areas of Hawassa, can be more than double those
more typically charged by the municipality. Set against cost is the bureaucracy that affect the
response times of the municipal services – particularly given the lack of capacity they currently have.
In spite of the private operators being registered with the Water and Sewerage Enterprise, they are
in a position to act more independently and informally when it comes to charging households, as
they provide a more responsive service. Waiting times for the municipal tanker in some areas were
reported as being up to 2-3 months – especially during the rainy season when demand for emptying
is at its greatest. Respondents stated in the FGDs that they would like the municipality to address
the waiting times when using the Enterprise truck, so that services can be available as and when
needed.
Report of a FSM study in Hawassa, Ethiopia
44
7 Fecal sludge treatment and possible end-use options
7.1 Fecal sludge characteristics
During the study, including the period in which survey data was piloted and conducted in Hawassa,
the survey firm was unable to arrange to take samples of fecal sludge being removed from household
latrines, or communal latrines used by households as their main latrine. This was reported as being
due to a lack of demand for emptying services from households during that time, notably as it was
during the dry season in Hawassa when demand for emptying services by households is known to
be extremely limited. However, it may also be that the sample areas were not sufficiently extensive
to pick up the emptying of septic tanks in more formalized areas of the city, or from communal toilet
blocks shared by households in the more informal settlements. As a result, field-based samples for
testing fecal sludge characteristics were not made available. Despite this, fecal sludge emptied from
commercial properties and institutions (hotels, offices, public toilet blocks, etc.) continued to be
emptied and transported to the fecal sludge treatment plant, with discussion about the quality of
services and treatment provided informed by those operations.
Interviews held with vacuum truck drivers identified that trucks make on average four trips per day
in the dry season. This is reported to double during the rainy season, as a result of pits and tanks
being unlined and filling more quickly either by filling from below as the groundwater table rises, or
the inflow of surface run-off. With the city being a tourist destination, there are many large hotels and
resorts with dedicated vacuum trucks that can be emptying and disposing of fecal sludge at least
once a day. In addition, industrial effluents are likely to already be a significant contribution to what
is taken to the treatment plant. This will increase over time as the new industrial zone expands –
having an impact both on the treatment capacity of the site and the potential end-use of treated fecal
sludge.
Vacuum tankers were observed discharging fecal sludge at the treatment plant during the survey
firm training and while the WSP consultants were conducting interviews. The discharge from these
tankers was noted as being extremely liquid – with only a small proportion of the discharged fecal
sludge having any significant solids content as the tanker reached the final stages of discharge.
These tankers were identified as having emptied fecal sludge from hotels and other non-household
sources in Hawassa. It is to be expected that in such cases, significant volumes of wastewater will
be entering into the pits and tanks – from water used in cistern-flush or manual flushing toilets,
together with water used for anal cleansing and possibly greywater from showers, sinks and other
outlets in hotels and restaurants. This, combined with the limited access to fecal sludge emptying
services for households in Hawassa, will result in weak fecal sludge arriving to the drying beds.
The discussions that follow are based on limited data made available during this study. Any further
developments to the current treatment facility and detailed designs for any new treatment facilities
will require much more detailed investigation into the full range of domestic, commercial and
industrial effluents being collected and transported to treatment – both at present and anticipated in
the future.
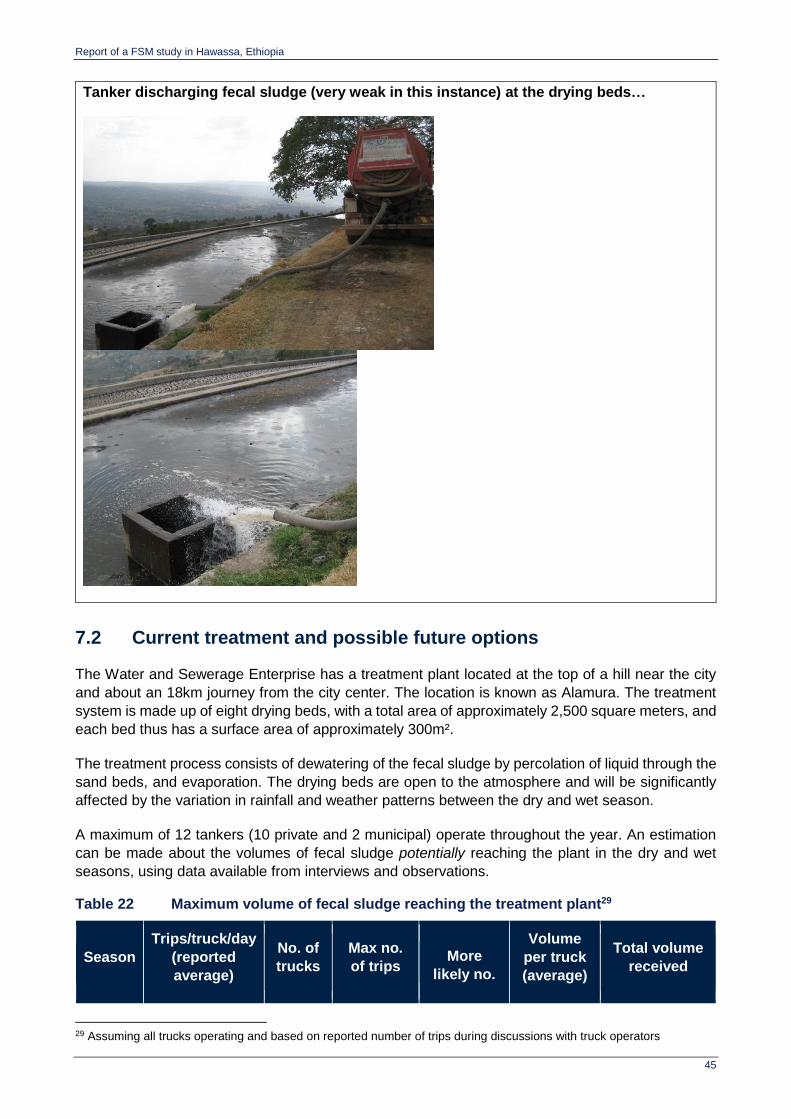
Report of a FSM study in Hawassa, Ethiopia
45
Tanker discharging fecal sludge (very weak in this instance) at the drying beds…
7.2 Current treatment and possible future options
The Water and Sewerage Enterprise has a treatment plant located at the top of a hill near the city
and about an 18km journey from the city center. The location is known as Alamura. The treatment
system is made up of eight drying beds, with a total area of approximately 2,500 square meters, and
each bed thus has a surface area of approximately 300m².
The treatment process consists of dewatering of the fecal sludge by percolation of liquid through the
sand beds, and evaporation. The drying beds are open to the atmosphere and will be significantly
affected by the variation in rainfall and weather patterns between the dry and wet season.
A maximum of 12 tankers (10 private and 2 municipal) operate throughout the year. An estimation
can be made about the volumes of fecal sludge potentially reaching the plant in the dry and wet
seasons, using data available from interviews and observations.
Table 22 Maximum volume of fecal sludge reaching the treatment plant29
Season
Trips/truck/day
(reported
average)
No. of
trucks
Max no.
of trips More
likely no.
Volume
per truck
(average)
Total volume
received
29 Assuming all trucks operating and based on reported number of trips during discussions with truck operators

Report of a FSM study in Hawassa, Ethiopia
46
of trips
(50%)
Dry 4 12 44 22 8 m³ 176 m³
Wet 8 12 96 48 8 m³ 384 m³
An estimation of the capacity of the plant size needed to take the loading of total solids (TS load) per
day can be made, using the following values:
Sludge loading rate: 100 kg/TS/m² (based on “poor conditions” that include high humidity, long
periods of rainfall and a large proportion of fresh FS – and in the case of Hawassa, a significant
proportion coming from hotels and other commercial outlets which will have a lower percentage of
TS as compared with FS from on-site systems)
Sludge loading height: 0.2m (the typical depth of FS on a drying bed)
The volume of fecal sludge arriving to the site each day (see Table 22 above for values):
Dry season = 176 m³/day
Wet season = 384 m³/day
Daily volumetric capacity required is therefore:
Dry season = 176 / 0.2 = 880m²/day
Wet season = 384 / 0.2 = 1,920m²/day
With each bed having an area of 300m², the number of beds required is:
Dry season: 3 drying beds
Wet season: 6.5, or 7 drying beds
On this basis, the eight drying beds would appear to be adequate. However, this is only true where
the treatment plant is operating as it is designed to, with effective monitoring, management and
planned maintenance. Observations made during both the dry season (March 2015) and soon after
the end of the wet season (November 2015) indicated very different conditions.
In March, no overflow from the beds was seen, as well as a number of beds containing dried sludge,
which could be emptied if required to take additional discharges of fecal sludge.

Report of a FSM study in Hawassa, Ethiopia
47
Fecal sludge treatment plant drying beds, in the dry season
Drying bed in use Drying bed at rest Dried FS being removed
Photos courtesy of Harold Esseku and Mesfin Getachew (March 2015)
During a visit to the plant shortly following the rainy season (November 2015), fecal sludge was
observed to be bypassing, or overtopping, a number of the beds and accumulating in an informal
“pool” of fecal sludge further down the hillside (see images below). The condition of the beds was
also found to be poor, with damage to retaining walls around the drying beds and excessive plant
growth on the sludge.
Condition of the FSTP drying beds, following the rainy season
Damaged retaining walls and FS by-passing Sludge “pond” at lower edge of the site
Photos courtesy of Peter Hawkins (November 2015)
Google maps image showing FSTP and informal “pool” of FS below

Report of a FSM study in Hawassa, Ethiopia
48
What this indicates is that, despite the installed capacity of the drying beds being potentially
adequate, the treatment plant is not being effectively managed and its condition is deteriorating.
Exacerbating the issue of available capacity is that the wet season is the time when demand for
emptying increases – although at the same time the number of sludge trucks actually reaching the
treatment plant may be affected by the condition of the road, which is reported to become impassable
to heavily-loaded tankers when very wet.
Systematic monitoring of tanker effluent discharge and plant effluent (volume or quality) is not taking
place. The plant operators and manager do not appear to have the necessary skills, competency or
incentives to ensure good practice operation, maintenance and oversight of the facility, in an effort
to achieve optimal functioning of the plant. As a result, the strain on current treatment capacity will
only be exacerbated and eventually fail, given the almost total lack of attention to monitoring and
regulating the tankers, or operation and maintenance of the plant.
The situation at present does not appear to be creating a public or environmental health risk, partly
due to the remote location of the site where there is little human activity. However, there may well
be greater flows of untreated fecal sludge downhill during the peak of the wet season. If the treatment
plant continues to deteriorate, as well as access to it, there is more chance that informal and/or illegal
dumping of fecal sludge could occur, or that overflow from the plant will increase to such an extent
as to have a wider and greater effect on residents or farmers around the site.
Future treatment / re-use options
Once dried, fecal sludge is manually removed from the beds and the sand layer levelled to take
further discharges of fecal sludge. The means of disposal of the dried fecal sludge is not clear and
not documented. Fecal sludge is currently thought to be disposed of in open spaces around the
Result of direct by-passing or leaking of FS from drying beds
Report of a FSM study in Hawassa, Ethiopia
49
plant. It may be further utilized by local farmers on an informal basis, but there was no evidence of
this established. The municipality has indicated that Hawassa City Natural Resources and
Environmental Protection Agency (NREPA) plans to conduct tests on the fecal sludge to ascertain
the possibility of using it in the future as a soil conditioner. Given the weak nature of the fecal sludge,
it is extremely unlikely that other uses of dried fecal sludge (such as for biogas generation or as a
solid fuel) would be viable under current conditions.
Interviews identified that operation of the treatment plant may be contracted to a private sector
institution in the future. The decision for this would need to be taken by the Water and Sanitation
Enterprise. A clearly defined management structure, monitoring system and financial arrangement
would need to be developed. Such an arrangement is thought likely to help improve the operation of
the facility and could also promote use of processed sludge as a way to generate further revenue to
manage the plant. However, given the weak nature of the sludge currently received, the capacity
limitation of the existing beds to accept additional loading, operational challenges relating to the site,
including its location and access, a thorough assessment of private investment potential and
implications would be needed.
As such negotiations are occurring, there is a more strategic and pressing need to secure additional
land for the site of a new, extended fecal sludge treatment facility, co-sited with a sewage treatment
plant as and when this becomes a reality. This site would benefit from also co-siting a new solid
waste disposal site – as the location of the current site is known to be problematic.
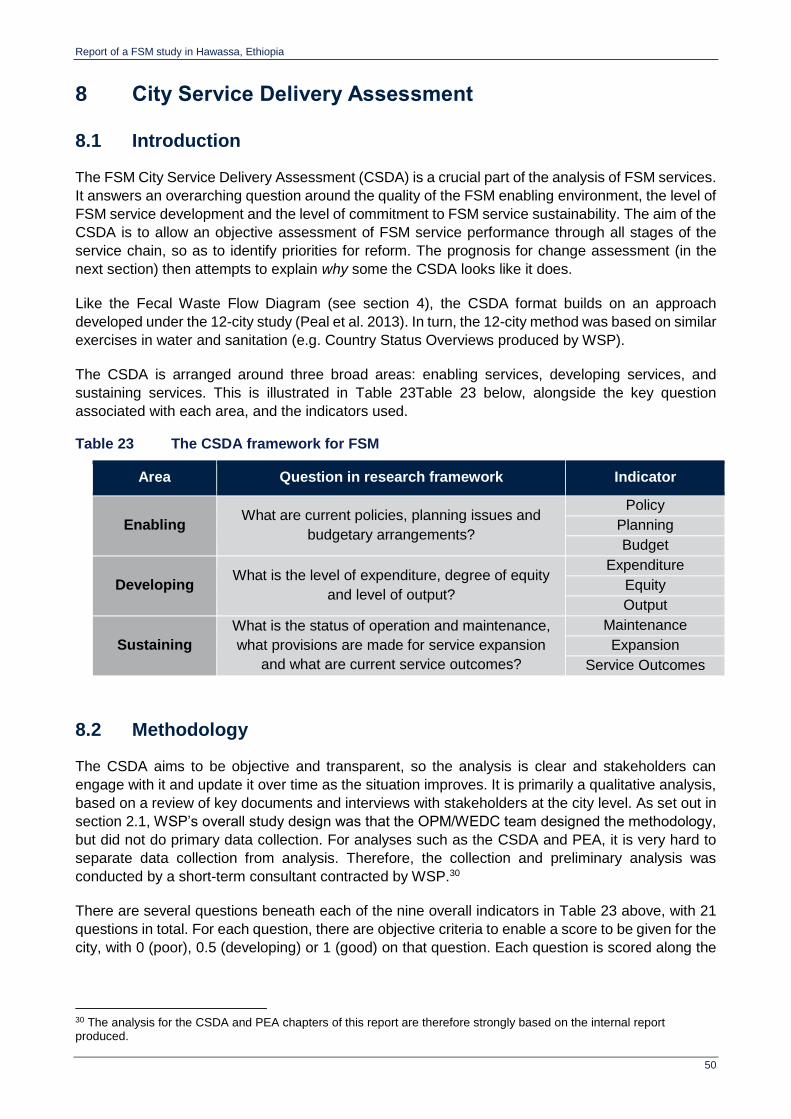
Report of a FSM study in Hawassa, Ethiopia
50
8 City Service Delivery Assessment
8.1 Introduction
The FSM City Service Delivery Assessment (CSDA) is a crucial part of the analysis of FSM services.
It answers an overarching question around the quality of the FSM enabling environment, the level of
FSM service development and the level of commitment to FSM service sustainability. The aim of the
CSDA is to allow an objective assessment of FSM service performance through all stages of the
service chain, so as to identify priorities for reform. The prognosis for change assessment (in the
next section) then attempts to explain why some the CSDA looks like it does.
Like the Fecal Waste Flow Diagram (see section 4), the CSDA format builds on an approach
developed under the 12-city study (Peal et al. 2013). In turn, the 12-city method was based on similar
exercises in water and sanitation (e.g. Country Status Overviews produced by WSP).
The CSDA is arranged around three broad areas: enabling services, developing services, and
sustaining services. This is illustrated in Table 23Table 23 below, alongside the key question
associated with each area, and the indicators used.
Table 23 The CSDA framework for FSM
Area Question in research framework Indicator
Enabling What are current policies, planning issues and
budgetary arrangements?
Policy
Planning
Budget
Developing What is the level of expenditure, degree of equity
and level of output?
Expenditure
Equity
Output
Sustaining
What is the status of operation and maintenance,
what provisions are made for service expansion
and what are current service outcomes?
Maintenance
Expansion
Service Outcomes
8.2 Methodology
The CSDA aims to be objective and transparent, so the analysis is clear and stakeholders can
engage with it and update it over time as the situation improves. It is primarily a qualitative analysis,
based on a review of key documents and interviews with stakeholders at the city level. As set out in
section 2.1, WSP’s overall study design was that the OPM/WEDC team designed the methodology,
but did not do primary data collection. For analyses such as the CSDA and PEA, it is very hard to
separate data collection from analysis. Therefore, the collection and preliminary analysis was
conducted by a short-term consultant contracted by WSP.30
There are several questions beneath each of the nine overall indicators in Table 23 above, with 21
questions in total. For each question, there are objective criteria to enable a score to be given for the
city, with 0 (poor), 0.5 (developing) or 1 (good) on that question. Each question is scored along the
30 The analysis for the CSDA and PEA chapters of this report are therefore strongly based on the internal report produced.
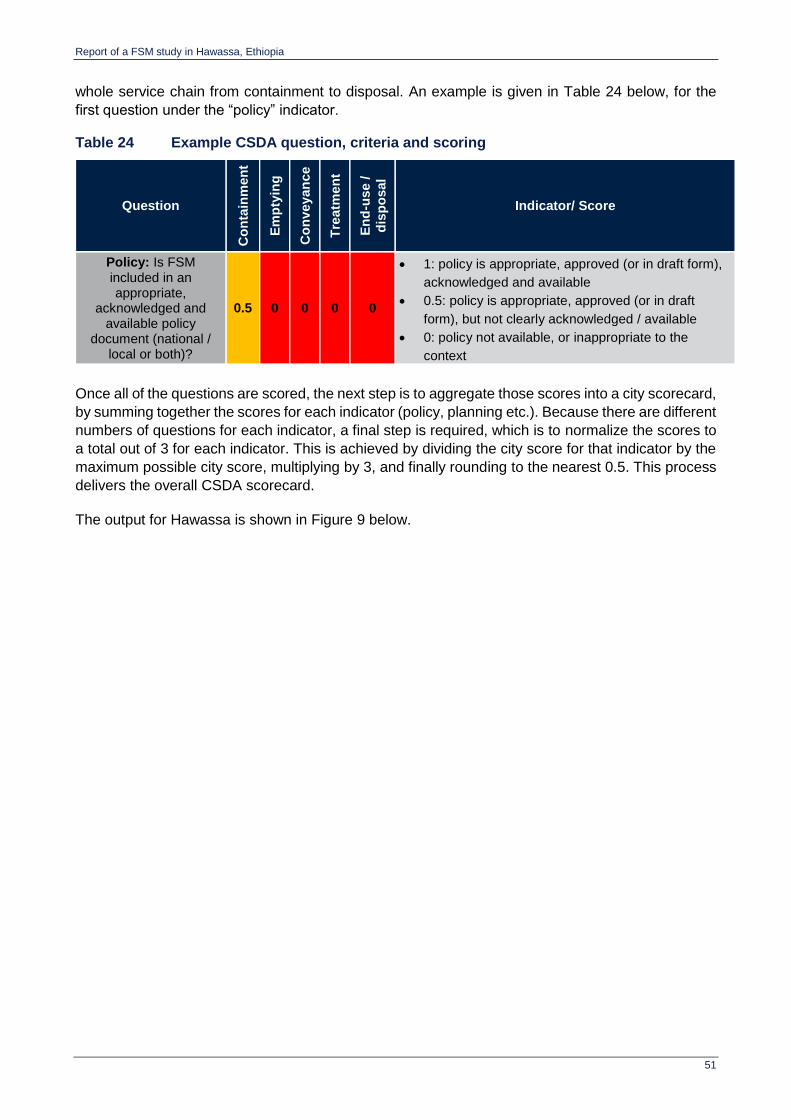
Report of a FSM study in Hawassa, Ethiopia
51
whole service chain from containment to disposal. An example is given in Table 24 below, for the
first question under the “policy” indicator.
Table 24 Example CSDA question, criteria and scoring
Question
Co
nta
inm
en
t
Em
pty
ing
Co
nveyan
ce
Tre
atm
en
t
En
d-u
se /
dis
po
sal
Indicator/ Score
Policy: Is FSM included in an appropriate,
acknowledged and available policy
document (national / local or both)?
0.5 0 0 0 0
1: policy is appropriate, approved (or in draft form),
acknowledged and available
0.5: policy is appropriate, approved (or in draft
form), but not clearly acknowledged / available
0: policy not available, or inappropriate to the
context
Once all of the questions are scored, the next step is to aggregate those scores into a city scorecard,
by summing together the scores for each indicator (policy, planning etc.). Because there are different
numbers of questions for each indicator, a final step is required, which is to normalize the scores to
a total out of 3 for each indicator. This is achieved by dividing the city score for that indicator by the
maximum possible city score, multiplying by 3, and finally rounding to the nearest 0.5. This process
delivers the overall CSDA scorecard.
The output for Hawassa is shown in Figure 9 below.

Report of a FSM study in Hawassa, Ethiopia
52
Figure 9 CSDA scorecard for Hawassa
8.3 Findings
The overall CSDA scorecard for Hawassa is shown above. An explanation for each score allocated
to the full set of questions is shown in Annex B, while the following summarizes the implications of
those results.
8.3.1 Enabling
The extent to which components of the enabling environment are making progress (in relation to
policy plus to some extent planning and budgeting, at least for the construction of household
facilities) is the result of recent advances at national level for enhancing urban sanitation services
throughout Ethiopia. While FSM services are not explicit in existing documents, they are being
incorporated into the upcoming National Integrated Urban Sanitation and Hygiene Strategy – which
3 1 2 2 1
2.5 0 1.5 1.5 0
3 1.5 1.5 1.5 1.5
Policy
Planning
Budget
Enabling
1.5 0 1.5 1.5 1.5
3 1 1.5 1.5 0
3 1 3 2.5 0.5
Expenditure
Equity
Output
Developing
Sustaining
City typology Enabling Developing Sustaining
Containment Emptying Conveyance Treatment End-use/ Disposal
1.5 1 1.5 1.5 0
1 0 1 0 0
2.5 1.5 1.5 1.5 2.5
Operation and maintenance
Expansion
Service outcomes
Report of a FSM study in Hawassa, Ethiopia
53
will account for aspects of fecal sludge emptying, through to treatment and end-use. The overall
national objective has, up to now, focused on the safe containment of excreta. Upcoming frameworks
will account for the sanitation service chain beyond household containment and the importance of
both improving hygiene standards and addressing aspects of environmental protection. The WASH
Implementation Framework (WIF) and MoU between ministries of Health; Education; Water,
Irrigation and Energy; and Finance and Economic Development are seen as providing a strong basis
from which to deliver services. While the national enabling environment is strengthening,
implementation within Hawassa faces a number of challenges and opportunities.
Institutional roles for sanitation are clearly defined in Hawassa, though they are stronger in
relation to upstream services (containment, emptying and transportation), while aspects of
treatment and end-use arrangements are less developed. This is all due to be addressed in the
Integrated Urban Sanitation and Hygiene Strategy. The Municipal Enterprise Development Office
is tasked to support the development of small and micro enterprises – but this has not been
strongly developed for FSM services up to now. Private emptying service providers are
somewhat uncoordinated and not strongly regulated at present. NGOs and other non-state
providers generally limit their role to providing (communal) latrines in low-income areas, but do
not offer follow-up support for the operation, maintenance and servicing of these facilities. A
proclamation addressing private sector roles for liquid waste management is under preparation
at national level and will eventually be adapted by Regional government and Hawassa City
Administration, accounting for the local context.
National targets, investment plans and budgets have been developed as part of the One WASH
National Program (OWNP). A lot of significance is placed onto the OWNP, which is seen as a
key mechanism through which WASH services will be enhanced throughout Ethiopia. This in turn
places substantial responsibility on Hawassa Municipality to identify city-level targets, investment
plans and associated budgets for the full range of sanitation and FSM services. Currently,
budgets are focused on the provision of (public) toilet facilities and their operation and
maintenance (cleaning, emptying, repairs, etc.) but not on aspects of treatment and disposal of
fecal sludge. A new Hawassa City master plan is in preparation. This gives greater attention to
sanitation than in previous plans, including both developing a sewerage network for the new
industrial zone and possibly central areas of the city, and developing the capacity for FSM service
delivery within Hawassa.
8.3.2 Developing
Recent capital investment in sanitation in Hawassa has been very low throughout all stages of the
service chain and is considered as be insufficient to meet current service requirements, or account
for the needs of the expanding city population. The range of service options currently available to all
users is considered as adequate in relation to containment facilities, in that the Municipality and
NGOs provide public and communal latrines in low-income areas and the Municipality is also
considering alternative facilities (including mobile latrines) to serve the poorest. This is reflected in
the reported 81% use of an improved latrine (private or shared). However, FSM emptying and
transport service options remain very limited and in low-income areas are constrained by cost,
access and durability of pits, with market growth for emptying services constrained by the lack of
demand for their services at present. There is clearly a problem in that demand for the cheaper utility-
operated trucks can result in a 2-3 month waiting time during the rainy season, while the private
sector operators often fill this gap.
The availability of capacity and resulting quality of services is considered as adequate – to the extent
that the status quo is not posing a risk to public health, either through direct contact with fecal sludge
in the open, or through use of the groundwater. There are however no defined standards at present
with which to measure the quality of service delivery – either in relation to the extent of sharing

Report of a FSM study in Hawassa, Ethiopia
54
facilities, or monitoring performance of service providers and treatment facilities. The Municipality is
continually looking to improve on this and currently takes a forward-looking approach to FSM
services and sanitation provision for the city more broadly.
8.3.3 Sustaining
Support of sustained services, operation and maintenance of existing services, achievement of
standards at current demand levels, and development of the sector to respond to growing demand
are less developed – especially in relation to the stages of emptying through to treatment and end-
use.
A significant constraint to responsive FSM services is the lack of demand for emptying from
households. This severely constrains the market for private sector engagement or public investment
in not only improved emptying, transportation and treatment options to serve a wider range of
households, but also restricts households from being encouraged to improve containment
infrastructure that can be emptied affordably and safely. More reliable and affordable emptying
services would encourage households to invest in more durable pits and tanks, as the first stage in
improved non-networked systems as part of a future mix of networked and non-networked sanitation
options. This also has an impact on potential end-use of fecal sludge products given that the fecal
sludge discharged from commercial customers is typically very weak strength and at present located
away from the customer base.
8.3.4 Implications of the CSDA scorecard
The resulting CSDA scorecard of the FSM city service delivery assessment in Figure 9 reveals firstly
that in general, Hawassa’s FSM service context is progressing and considered to be developing for
the three major components of the assessment. The details within each of the components of the
CSDA framework and through the various stages of the service chain show a very mixed picture,
influenced by the unusual contextual factors affecting the city.
When looking into the details for each of the three components, this reveals that greater attention
has been given to improving the provision of household-level infrastructure and to some extent the
provision of emptying services to support it. The greatest weaknesses are in relation to the existing
treatment facility and the effective disposal of dried fecal sludge, or any actions to develop options
for fecal sludge end-use applications. ‘Treatment and Disposal’ of fecal sludge in-situ (through
relying on the capacity of local soils to continually absorb leachate from pits and tanks without undue
impact on public health or the wider environment) may be resulting in a satisfactory outcome for now,
but as areas of the city become more densely populated the infiltration capacity is likely to be
surpassed. This could eventually introduce risks through localized surface ponding of effluent
(especially during the rainy season where the ground becomes saturated) and increasing pit
collapse.
Perhaps not surprisingly, despite the weaknesses of the emptying services, the outputs of current
services people receive and overall service outcomes in terms of management of fecal sludge within
the city, come out more strongly. This is affected by how existing household containment
infrastructure (pits and tanks) are currently functioning (refer to Section 5.4). There were concerns
voiced that the decreasing space to build new pits make these practices increasingly difficult to
sustain. It is important to note that, without greater attention given to investing in the future needs of
the city, risks to public health will increase. This will be particularly the case in the expanding low-
income areas, where concerted efforts will be needed to address issues of inequity and lower service
outcomes. This suggests that, to improve FSM services in Hawassa – and most notably for those
Report of a FSM study in Hawassa, Ethiopia
55
most vulnerable to poor services and resulting health risks – greater attention needs to be given to
investment in a range of appropriate, affordable and available services.
In addition to this, there are associate needs arising to i) identify the extent for sewerage services in
the central area of the city as it moves towards the construction of multi-storey dwellings and ii) plan
facilities and services to respond to the expected increased demand from the development of the
new industrial area.
An assessment of the combined challenges that need to be addressed to achieve sustainable
services in the face of such change, together with the incentives to be addressed, resulting likely
intervention options and actions to take forward are considered in the following sections.
Report of a FSM study in Hawassa, Ethiopia
56
9 Prognosis for change
9.1 Introduction
This chapter provides a Prognosis for Change (PFC), by considering the positions of various
stakeholders, in particular the institutions and incentives at play. In the sanitation sector, key studies
considering these questions include a multi-country study carried out by WSP with OPM (WSP,
2010) and a series of papers by the Overseas Development Institute (ODI, 2013). In addition,
SANDEC’s recent FSM book includes a chapter on stakeholder analysis, which is a key methodology
in this kind of assessment (Strande et al., 2014). Through this PFC, it is intended to understand three
things, outlined below.
Firstly, a PFC considers how “institutions” function. Here, institutions are defined as “the rules and
norms governing human interaction”, rather than a narrower definition of organizations. Institutions
can be formal, such as codified laws – one example in FSM might be a by-law about where fecal
sludge can be legally dumped. More importantly, institutions also can be informal, such as social
norms. For example, prevailing attitudes towards reusing fecal sludge in agriculture are an informal
institution.
Secondly, a PFC considers the incentives which institutions provide to stakeholders. A stakeholder
is any individual or group with an interest in the outcome of a policy. In FSM, some examples of
relevant stakeholders may include (but are certainly not limited to) sludge truck companies, the City
Council, or slum-dwellers. Stakeholders can be defined broadly or narrowly as required by the
breadth and depth of the analysis. For example, the earlier three stakeholder examples could be
narrowed to recent entrants to sludge truck market, the planning department of the city council, or
female slum-dwellers. This would allow more nuanced analysis rather than taking whole groups as
homogenous.
Finally, a PFC considers how stakeholders exert influence. Here, influence is defined as the formal
or informal power to cause something or to prevent it from happening. A city council may have formal
legal power, but if all their by-laws are openly flouted by service providers without fear of punishment,
then their influence is very low by that measure. However, they may have informal power to influence
FSM in other ways, for example in the ways their employees act regarding regulation of truck
companies.
In addition, in order to be practically useful, a PFC should also consider the implications of the
findings for effective engagement in a reform or change process. This involves an assessment of
the options for engagement, and weighing them up in the context of the prevalent power dynamics
and the likely response of stakeholders.
9.2 Methodology
In this study, developing a PFC was only one concern alongside a large number of other research
priorities, as set out in Section 2.1, near the beginning of the report, which lists all the project
components. There was therefore a balance to be struck. The approach in this broad study was to
link a focused PFC closely to the city service delivery assessment. The aim is therefore to explain
why the CSDA is as it is – in other words, to explore why the service delivery blockages exist, and
what entry points are available to try and resolve them.
Undertaking a PFC is a primarily qualitative exercise. It relies on targeted interviews or focus groups
with stakeholders, alongside secondary data in the form of key sector documents, reports and
studies. As noted in the CSDA methodology section, the OPM/WEDC team did not conduct primary

Report of a FSM study in Hawassa, Ethiopia
57
data collection and preliminary analysis under this project, which was done by other consultants
contracted by the World Bank. Reports from these consultants were the primary source of data for
constructing this PFC. In order to keep the length of this report manageable, only a brief summary
of the full analysis conducted by the team is provided in this section.
Developing a PFC requires a structure in order to be clearly analyzed and communicated. There are
a bewildering number of tools available, which can be applied to particular questions so as to explore
some of the issues described above. Many tools which are commonly used, including in this study,
are contained in a World Bank sourcebook (Holland, 2007). Rather than take up more space with
explanation here, it is better to go straight into the findings. Briefly, however, the main tools used
include stakeholder mapping, process mapping and stakeholder analysis.
9.3 Findings
9.3.1 Hawassa’s FSM context
As noted above, the main objective is to explore why the CSDA results are as they are. Considering
the stages of the chain, the Hawassa CSDA shows good scores around containment, fairly good
scores for emptying and transport, and weaker scores for treatment and disposal. Along the service
delivery components, the main overall trends to note are that, for “emptying” onwards, there are
specific weaknesses in planning, expenditure, equity, O&M and expansion. The aim of this chapter
in the Hawassa context is to try and explain why this is the case, and what the prognosis for change
is.
It is worth reconsidering Hawassa’s context and the responsibilities of key actors, which were already
set out in section 3 above. In summary, three key characteristics of Hawassa’s context include:
(i) Rapid population growth alongside horizontal expansion of the city into peri-urban areas
which are currently rural. If the current population growth rate of 4% is sustained, the
population will grow from around 350,000 in 2015 to more than 600,000 in 2030. This is
likely to be accompanied by increased population density.
(ii) All households use a latrine or septic tank of some kind, according to the household
survey, with about 81% using an improved type of latrine. Since 42% of households share
facilities with more than 15 people, one might expect rapid filling rates, but demand for
emptying is low. Only about a third of households had ever experienced a pit or tank filling
up. This is probably due to the soil type, which allows most of the fecal sludge to leach
away into the ground. Even then, only 31% of those experiencing a pit/tank filling up
actually emptied it, with the rest covering and abandoning it and using another. Overall,
this means that only 10% of households in Hawassa have ever emptied a pit or tank.
(iii) Emptying services, public and private, do exist and are used, but the market is in flux with
the government provider intending to double the tariff. Private providers are already
charging double the government rate, and many people are willing to pay them because
the waiting time for the government trucks can be 2-3 months (especially during the rainy
season). The fecal sludge treatment site has been constructed to a reasonable standard,
but is poorly managed (e.g. limited record-keeping, collapse of some drying bed walls,
considerable bypassing of sludge). Furthermore, it suffers from limited access during the
wet season on account of the poor road conditions.
Demand for FSM services will only increase until sewers are built and become operational in new,
planned developments, which is unlikely to happen in the short term. With the population rising fast
and becoming more dense, and there being less space to abandon full pits and construct new ones,
it is likely that emptying rates will increase.

Report of a FSM study in Hawassa, Ethiopia
58
However, some private providers complain of underutilization of their services, so it is likely that there
is spare capacity which could respond to increased demand in the short term, if people are willing
and able to pay the market rates. The current market situation could therefore prevail for some time
and there is not likely to be any sense of urgency in reforming the situation. There are no immediate
proposals for significant reform on the table, except for the likely tariff increase.
9.3.2 Mapping institutional responsibilities
As set out above, the focus of the PFC is how institutions function, the incentives which those
institutions provide to stakeholders, and how those stakeholders exert influence. It is therefore
important to understand who those stakeholders are, alongside their formal and informal roles. A
useful tool for this is stakeholder mapping, as set out in Table 25 below.
Stakeholders are categorized by type (e.g. national or local government, private sector etc.), and
their formal role in FSM in Hawassa is listed. In the next column, the reality of how they operate
(often informally) is described. A final column summarizes the core challenge represented by how
that type of stakeholder operates. Only an abridged set of stakeholders (e.g. only a few at the
national level) is included in the interests of space.
Table 25 Mapping stakeholders and their responsibilities for FSM
Type Stakeholder Formal role The reality Core challenge
Federal gov’t
Ministries of Health; Education; Water; and Finance
Set urban and rural WASH policy
Existing national plans or strategies are mostly focused on containment, with little to say on the other stages of the chain. The ‘National Integrated Urban Sanitation and Hygiene Strategy’ is drafted but not yet endorsed.
New strategy needs to be cleared jointly by the ministries of health, water, urban development, environment and forestry, and support given to city administrations.
Regional gov’t
Regional bureaus for Water, Urban Development, Environmental protection and Health
Support towns to implement programs, e.g. capacity building or procurement
Limited engagement on FSM thus far
The regional bureaus are less relevant for Hawassa as a city, but could have a role in supporting the licensing of truck companies operating from outside Hawassa (as well as in setting regional standards). They will also increasingly need to support town utilities on FSM.
Local gov’t
Hawassa City Council
Make bye-laws (including on sanitation, environment etc.) and monitor their enforcement
Currently blocking tariff increases for pit/tank emptying, perhaps due to concerns over the household reaction.
Tariffs need to be increased to ensure cost recovery and allow WSE to expand operations as required. More poor-inclusive pricing structures could be investigated.
Hawassa City Administration
Ensure municipal services are provided (including water, sanitation and solid waste), and ensure coordination of its departments. Ensure public toilets are provided and maintained
The previous city plan was weak on sanitation, but a new Master Plan 2015-40 under preparation includes a sewerage network and developing the capacity of FSM services
Hawassa City Water and Sewerage Enterprise (WSE)
Deliver water and sanitation services, including pit emptying via vacuum trucks and manage the
Has two vacuum trucks but one non-functional at time of study. Considering increasing tariff but cannot do so without city council approval, so currently running at a loss and
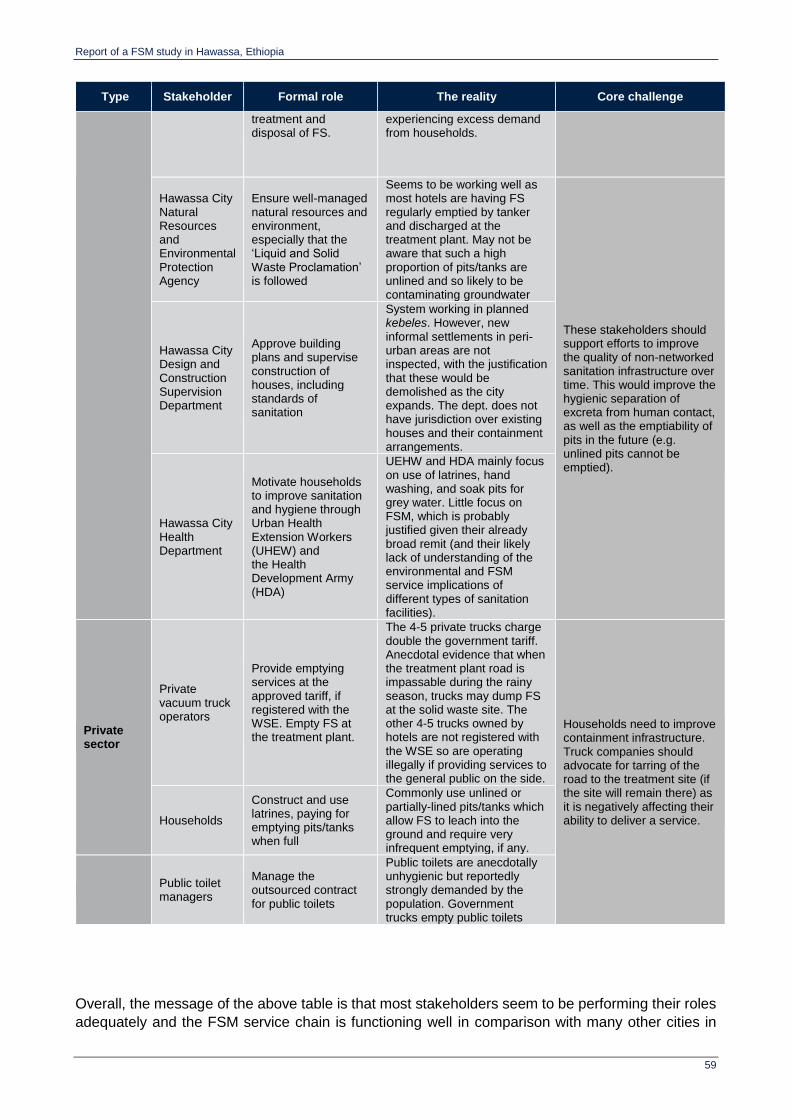
Report of a FSM study in Hawassa, Ethiopia
59
Type Stakeholder Formal role The reality Core challenge
treatment and disposal of FS.
experiencing excess demand from households.
Hawassa City Natural Resources and Environmental Protection Agency
Ensure well-managed natural resources and environment, especially that the ‘Liquid and Solid Waste Proclamation’ is followed
Seems to be working well as most hotels are having FS regularly emptied by tanker and discharged at the treatment plant. May not be aware that such a high proportion of pits/tanks are unlined and so likely to be contaminating groundwater
These stakeholders should support efforts to improve the quality of non-networked sanitation infrastructure over time. This would improve the hygienic separation of excreta from human contact, as well as the emptiability of pits in the future (e.g. unlined pits cannot be emptied).
Hawassa City Design and Construction Supervision Department
Approve building plans and supervise construction of houses, including standards of sanitation
System working in planned kebeles. However, new informal settlements in peri-urban areas are not inspected, with the justification that these would be demolished as the city expands. The dept. does not have jurisdiction over existing houses and their containment arrangements.
Hawassa City Health Department
Motivate households to improve sanitation and hygiene through Urban Health Extension Workers (UHEW) and the Health Development Army (HDA)
UEHW and HDA mainly focus on use of latrines, hand washing, and soak pits for grey water. Little focus on FSM, which is probably justified given their already broad remit (and their likely lack of understanding of the environmental and FSM service implications of different types of sanitation facilities).
Private sector
Private vacuum truck operators
Provide emptying services at the approved tariff, if registered with the WSE. Empty FS at the treatment plant.
The 4-5 private trucks charge double the government tariff. Anecdotal evidence that when the treatment plant road is impassable during the rainy season, trucks may dump FS at the solid waste site. The other 4-5 trucks owned by hotels are not registered with the WSE so are operating illegally if providing services to the general public on the side.
Households need to improve containment infrastructure. Truck companies should advocate for tarring of the road to the treatment site (if the site will remain there) as it is negatively affecting their ability to deliver a service. Households
Construct and use latrines, paying for emptying pits/tanks when full
Commonly use unlined or partially-lined pits/tanks which allow FS to leach into the ground and require very infrequent emptying, if any.
Public toilet managers
Manage the outsourced contract for public toilets
Public toilets are anecdotally unhygienic but reportedly strongly demanded by the population. Government trucks empty public toilets
Overall, the message of the above table is that most stakeholders seem to be performing their roles
adequately and the FSM service chain is functioning well in comparison with many other cities in

Report of a FSM study in Hawassa, Ethiopia
60
Ethiopia and the region. However, there are weaknesses which need to be addressed (especially
proper containment and a clearer tariff structure) and things could break down quickly in the event
of heavy rainfall or a rapid population influx.
9.3.3 Illustrating static and dynamic problems
It is helpful to consider the issue of FSM in Hawassa in two dimensions. The first dimension is static:
that is, the snapshot of how households are dealing with their fecal sludge as shown in the SFD.
Here there are not too many problems, at least during the dry season, notwithstanding likely
groundwater contamination from effluents leaching into the soil. The second dimension is dynamic
– in other words, how the SFD may have looked like five years ago and how it may look in five years’
time. Here, the city has been growing rapidly (and looks set to continue to do so) in three dimensions:
horizontally – expansion into peri-urban areas which were previously rural
vertically – replacement of single-storey housing with multi-storey housing, including the
proposed replacement of kebele housing with condominiums, which is a government policy
across the country
demographically – 4% population growth leading to a city of >600,000 people by 2030.
Taking the dynamic perspective, the SFD may look a lot worse in five years’ time if some key issues
are not addressed by the city authorities. Three of the most important key issues specifically relating
to FSM services are (i) containment in existing buildings, (ii) the construction of new buildings, and
(iii) the performance of the emptying market. In addition, ensuring provision of adequate and reliable
water supplies be essential to support the expansion of sanitation services (particularly as any
sewerage systems are developed), as well as protecting groundwater and surface water sources
from increased pollution loads.
With respect to new building construction, it will be important for key stakeholders to take a coherent
position with regard to quality of containment and planning for the full sanitation chain. In particular,
this will require dialogue between the Water and Sewerage Enterprise and the Design & Construction
Department (who have the role of inspecting new buildings). As new migrants to Hawassa arrive,
existing households rebuild or expand their dwellings, and developers build condominiums, they
must be incentivized to invest in sanitation options which offer the potential of effective FSM. The
WSE will presumably be involved in extending water supply to these new buildings, so must at the
same time insist on proper containment and accessibility for emptying services (until a sewerage
network is in place).
Even taking the static perspective and looking at existing buildings, it would be important to promote
properly lined pits that can be safely emptied, since in the future abandonment will become less
feasible due to lack of space. The Urban Health Extension Workers can have an important role in
communicating this to households.
Thus far, the analysis has mostly focused on containment, but it is worth considering the rest of the
service chain in more detail, in particular the emptying market and the WSE’s current operations.
There are three main issues, some of which were set out in Section 6:
Slow responsiveness and associated low market share of WSE;
Tariffs not aligned with cost recovery and willingness to pay (i.e. loss-making utility and
revealed higher WTP due to private sector market share); and

Report of a FSM study in Hawassa, Ethiopia
61
Regulation of private sector emptiers who are currently operating informally (i.e.
unregulated).
These are explored in the next sub-section using a tool called process mapping.
9.3.4 Illustrating the market problem
The market for emptying in Hawassa is in flux. The WSE is experiencing excess demand and the
private truck operators the opposite. Tariffs and licensing in this market could be reformed. On the
tariff side, private truck operators are successfully getting households to pay double the municipal
rate. Given the private sector has triple the market share of the WSE according to this survey, this
proves willingness to pay higher tariffs, at least on the part of households currently participating in
the market. Those who are not willing to pay those rates must wait for the WSE trucks to become
available. On the licensing side, there is anecdotal evidence that some truck operators are benefiting
from being based “outside” of the jurisdiction of Hawassa (literally and metaphorically), reportedly
coming from the town of Shashemene and elsewhere. This is inefficient given the additional fuel
costs they must incur, and they have less oversight from city authorities. There may also be a role
for the regional level of government here (e.g. Regional Water Bureau) given this is an issue going
beyond the city.
It is possible to illustrate both these issues by using a tool called process mapping. This aims to
understand the interaction of formal and informal “moments” in a process, and to identify entry points
for engagement. It is important to identify the roles of stakeholders in a process, how and where they
exert influence over the process, and the incentives they face in the informal system. Currently the
WSE is the formal emptier. There is acceptance that the private sector operators exist. Some, but
not all, are registered with the WSE – various interviewees mentioned trucks coming from outside
the city boundaries. Therefore, elements of the private sector emptying market remain informal.
None are licensed from a technical perspective. The market therefore contains elements of the
formal and informal which are hard to disentangle.
The process for a household emptying a pit in Hawassa is shown in Figure 10 below. The central
column shows the formal process which is supposed to be followed by the household and the WSE.
The right-hand column, however, shows elements of the informal process, i.e. what really happens
in many cases. The left-hand column then shows possible entry points for reform.
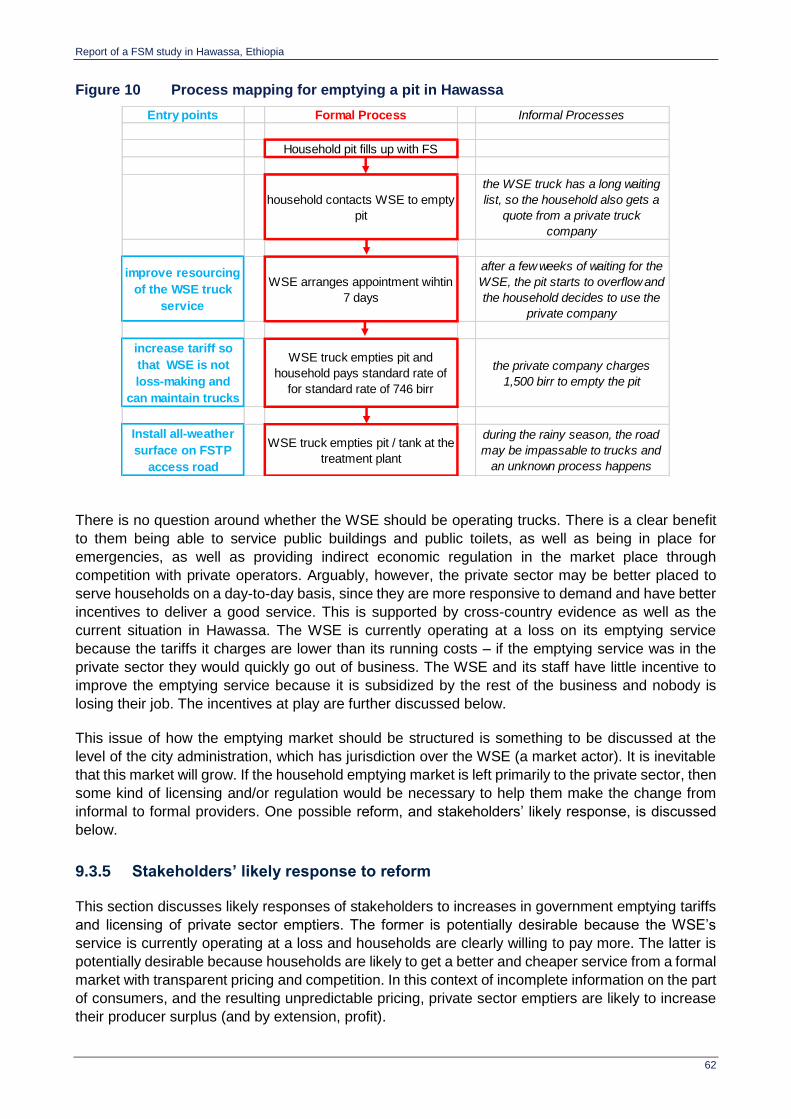
Report of a FSM study in Hawassa, Ethiopia
62
Figure 10 Process mapping for emptying a pit in Hawassa
There is no question around whether the WSE should be operating trucks. There is a clear benefit
to them being able to service public buildings and public toilets, as well as being in place for
emergencies, as well as providing indirect economic regulation in the market place through
competition with private operators. Arguably, however, the private sector may be better placed to
serve households on a day-to-day basis, since they are more responsive to demand and have better
incentives to deliver a good service. This is supported by cross-country evidence as well as the
current situation in Hawassa. The WSE is currently operating at a loss on its emptying service
because the tariffs it charges are lower than its running costs – if the emptying service was in the
private sector they would quickly go out of business. The WSE and its staff have little incentive to
improve the emptying service because it is subsidized by the rest of the business and nobody is
losing their job. The incentives at play are further discussed below.
This issue of how the emptying market should be structured is something to be discussed at the
level of the city administration, which has jurisdiction over the WSE (a market actor). It is inevitable
that this market will grow. If the household emptying market is left primarily to the private sector, then
some kind of licensing and/or regulation would be necessary to help them make the change from
informal to formal providers. One possible reform, and stakeholders’ likely response, is discussed
below.
9.3.5 Stakeholders’ likely response to reform
This section discusses likely responses of stakeholders to increases in government emptying tariffs
and licensing of private sector emptiers. The former is potentially desirable because the WSE’s
service is currently operating at a loss and households are clearly willing to pay more. The latter is
potentially desirable because households are likely to get a better and cheaper service from a formal
market with transparent pricing and competition. In this context of incomplete information on the part
of consumers, and the resulting unpredictable pricing, private sector emptiers are likely to increase
their producer surplus (and by extension, profit).
Entry points Formal Process Informal Processes
Household pit fills up with FS
household contacts WSE to empty
pit
the WSE truck has a long waiting
list, so the household also gets a
quote from a private truck
company
improve resourcing
of the WSE truck
service
WSE arranges appointment wihtin
7 days
after a few weeks of waiting for the
WSE, the pit starts to overflow and
the household decides to use the
private company
increase tariff so
that WSE is not
loss-making and
can maintain trucks
WSE truck empties pit and
household pays standard rate of
for standard rate of 746 birr
the private company charges
1,500 birr to empty the pit
Install all-weather
surface on FSTP
access road
WSE truck empties pit / tank at the
treatment plant
during the rainy season, the road
may be impassable to trucks and
an unknown process happens
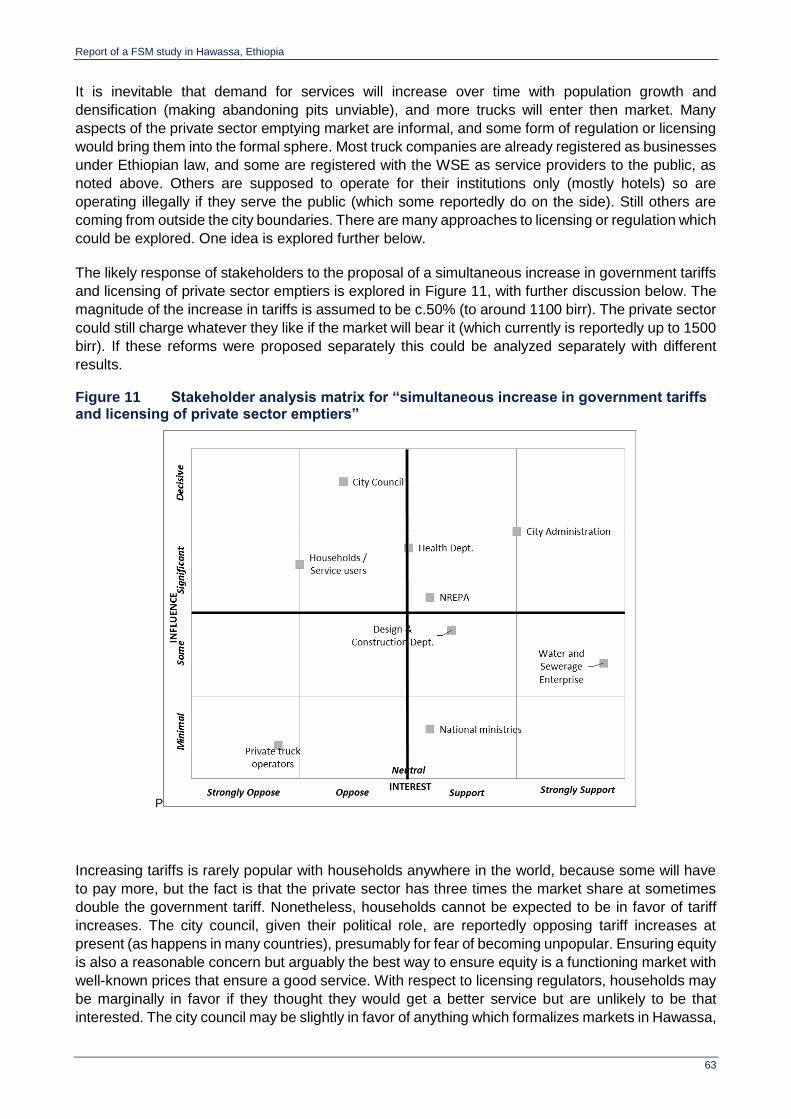
Report of a FSM study in Hawassa, Ethiopia
63
It is inevitable that demand for services will increase over time with population growth and
densification (making abandoning pits unviable), and more trucks will enter then market. Many
aspects of the private sector emptying market are informal, and some form of regulation or licensing
would bring them into the formal sphere. Most truck companies are already registered as businesses
under Ethiopian law, and some are registered with the WSE as service providers to the public, as
noted above. Others are supposed to operate for their institutions only (mostly hotels) so are
operating illegally if they serve the public (which some reportedly do on the side). Still others are
coming from outside the city boundaries. There are many approaches to licensing or regulation which
could be explored. One idea is explored further below.
The likely response of stakeholders to the proposal of a simultaneous increase in government tariffs
and licensing of private sector emptiers is explored in Figure 11, with further discussion below. The
magnitude of the increase in tariffs is assumed to be c.50% (to around 1100 birr). The private sector
could still charge whatever they like if the market will bear it (which currently is reportedly up to 1500
birr). If these reforms were proposed separately this could be analyzed separately with different
results.
Figure 11 Stakeholder analysis matrix for “simultaneous increase in government tariffs and licensing of private sector emptiers”
P
Increasing tariffs is rarely popular with households anywhere in the world, because some will have
to pay more, but the fact is that the private sector has three times the market share at sometimes
double the government tariff. Nonetheless, households cannot be expected to be in favor of tariff
increases. The city council, given their political role, are reportedly opposing tariff increases at
present (as happens in many countries), presumably for fear of becoming unpopular. Ensuring equity
is also a reasonable concern but arguably the best way to ensure equity is a functioning market with
well-known prices that ensure a good service. With respect to licensing regulators, households may
be marginally in favor if they thought they would get a better service but are unlikely to be that
interested. The city council may be slightly in favor of anything which formalizes markets in Hawassa,
Report of a FSM study in Hawassa, Ethiopia
64
but their response to the proposed tariff increase is likely to dominate. The city council obviously has
more influence over the decision, but they will be aware of public opinion.
With respect to private truck operators, they can be expected to oppose both reforms. Formalization
and licensing will decrease the likelihood that they capture more producer surplus (because pricing
and terms may become more normalized), and they will incur costs by conforming with regulations
(e.g. around safety equipment etc.). Their influence over the decision is likely to be low, however,
unless the owners are well-connected people which is unlikely to be the case. If they are involved in
the discussions as suggested above, this would increase their influence (but also make them more
likely to support proposals which they see as fair). The formalization of their role could also bring
them benefits later on (which they may not perceive at the time) in terms of the size of the market
increasing. For example, as the market is functioning well and Hawassa’s FSM services are seen to
be successful, it could mean more parts of the city staying on non-networked sanitation services
rather than converting to sewerage over time.
On the supportive side, relatively unimportant stakeholders are the health department, the Design &
Construction Department and NREPA and federal ministries. All are likely to have a broad interest
in FSM services improving in Hawassa, but all are marginal with respect to the proposed reform.
The health ministry leads on sanitation in general, but has little jurisdiction over the specific issues
in question (tariffs and licensing). The only way they are relevant is in their influence over the city
administration and city council.
The city administration can be expected to be in favor of the proposed reforms, in contrast to the city
council. This is likely because, as a technocratic institution with an interest in Hawassa being seen
as successful, they will want to see services improving and the environment protected. As the
guarantor of the WSE, they will be keen to improve cost recovery so as to avoid having to subsidize
it. They also have significant influence given their overall leadership on municipal services. Their
relationship with the city council is important in this respect.
Finally, the WSE can be expected to be in favor of both reforms. The increase in the tariff will stop
them losing money on emptying services, and will make the market less disjointed. They may well
increase their market share, but it is not clear that this is their objective. With respect to licensing,
the same rules will surely apply to them, but a more formal private sector will improve overall FSM
services in the city which the WSE should be keen to see. Their influence over these decisions is
low as compared to others, but the city administration is likely to consider them as important
stakeholders in any decision so their view is likely to carry some weight.
With respect to concrete approaches to licensing, the best initial approach may be to formally license
operators who are permitted to serve households and/or discharge fecal sludge at the plant. The
aim would be to protect customers, workers and the environment. Licenses could be granted
annually after providers fulfil certain criteria which could include: (i) technical inspection of emptying
equipment, (ii) vehicles are roadworthy, (iii) workers have access to deworming, (iv) workers have
adequate safety equipment. These would best be discussed in an open forum including the emptiers
themselves so they are committed to any outcome, as was done successfully in the case of Dakar,
Senegal. In terms of the institution best-placed to manage the licensing, it could not be the WSE
because they are a market actor. The Regional Water Bureau may be better placed. This is not a
specific recommendation of the study but rather an explanation of the issue. Discussion of
intervention options is in the next chapter.
Overall, it may not be too difficult to get agreement for licensing of private service providers, given
the increasing role they are playing in the city. The tariff increase is a more thorny issue. However,
the city council may well agree to it if they can be persuaded that willingness to pay is already high
and it is likely to be richer households who use the services anyway.
Report of a FSM study in Hawassa, Ethiopia
65
9.4 Implications for FSM in Hawassa
This section concludes the PFC by setting out a summary of the implications of this analysis for FSM
in Hawassa.
Overall, the market for FSM services is functioning. The few households whose pits fill up are able
to get them emptied safely, and the fecal sludge is in general safely disposed at the treatment plant.
Given that FSM is dysfunctional in so many cities, this is fairly good by comparison. However,
demand for services in Hawassa is likely to increase with a larger and denser population, and those
households who have relied on covering and abandoning full pits are unlikely to be able to do so in
the future. Overall, only about 10% of households in Hawassa have ever emptied a pit or tank, but
this figure is likely to rise. The status quo of abandoning pits is not sustainable. There will not be
space to do so, and it risks the integrity of the lake which the city holds dear.
The question is whether the city administration is likely to be able to respond to increased demand
for FSM services. Currently the answer appears to be no, given the excess demand experienced by
the WSE trucks even under current market conditions. A key implication of this analysis is that the
city administration should be planning ahead in much more detail. The CSDA shows that the basic
elements of service delivery are there, but important weaknesses in planning, expenditure, O&M and
expansion remain. These are the key challenges. The message of the PFC is that in the medium-
term the city administration must get households and the city council on board with any plans, since
they will have implications for containment infrastructure. In the shorter-term, they must resolve the
issues in the market which is currently in flux due to the variability of prices. The private sector can
and should play an increasing role in service provision. Formalizing their role through licensing,
alongside an increase in tariffs, is likely to support this.

Report of a FSM study in Hawassa, Ethiopia
66
10 Intervention options
This section proposes interventions to improve fecal sludge management services in Hawassa and
provide an effective enabling environment within which those services can be appropriately
developed and sustainably managed. These interventions are informed by the survey data that
highlight problems with existing services (as most clearly represented in the fecal waste flow
diagrams). The interventions most directly affecting service delivery are then considered in the
context of results from using the broader detailed diagnostic tools, in particular the city service
delivery assessment (CSDA) and the Prognosis for Change (PFC), as presented in other sections
of this report.
The intervention options presented here are intended to support the further development of detailed
recommendations as and when other more detailed studies are undertaken in the city. As such, this
section does not identify or propose specific and detailed actions to be taken, who is best placed to
undertake those actions, what information is needed in advance of taking action (such as additional
feasibility studies), or the likely outcome of those actions.
10.1 Identified weaknesses, through the service chain
The key starting point for presenting weaknesses in the existing services is the fecal waste flow
diagram, as it identifies the extent to which fecal sludge is managed (or not) through the current
sanitation service chains.
From the diagram, “problems” or “weaknesses” in the process of managing wastewater and fecal
sludge at the key stages in the chain can be highlighted, pointing to areas where interventions are
needed to improve the status quo.

Report of a FSM study in Hawassa, Ethiopia
67
Figure 12 City-wide fecal waste flow: results and key problems
10.2 Proposed solutions, through the service chain
Taking the key problems highlighted in Figure 12 above, it is possible to identify feasible solutions to
address them, based on findings from the FSM study, and discussions with key stakeholders within
the city. These proposed solutions are grouped according to the type of containment/ discharge
arrangements (i.e. the system type), considering possible interventions through the later stages of
the service chain.
At the level of analysis possible from this study using city-wide data, the solutions are not identified
on the basis of specific locations within Hawassa. This level of detailed analysis requires further data
sets and investigation. These findings can however offer guidance as to the types of interventions to
be explored in more depth as part of further work.
Table 26 on the following pages sets out possible technical interventions, whereas the sections
following the table consider interventions more related to the enabling environment of urban
sanitation, with a focus on FSM services. The options in the table are not necessarily mutually
exclusive and do not specify interim or staged approaches. These are discussed in the following
sub-section.
Currently: pits and tanks not emptied (abandoned or
replaced when full).
Densification resulting in no space to rebuild, pit collapse
and water-logging
Partial or no containment. Densification resulting in pit collapse and water-logging
Treatment End-use/ Disposal Conveyance Emptying Containment
FSTP poorly managed
FS dumped in wet season?
Limited demand
for emptying

Report of a FSM study in Hawassa, Ethiopia
68
In summary, the key messages for action through the service chain are:
Containment: Standards of latrines must address quality relating to the construction of different
components of latrine (pits, pit lining, slabs, etc.), promote hygienic standards that can more easily
be maintained (e.g. cleanable slabs) and ensure easy access for emptying (e.g. design and location
of access points). Promoting the uptake of such standards may need to consider the use of targeted
subsidies to ensure minimum standards of facilities can be realized by all households across a range
of options. For septic tanks, a program to inspect the existing construction quality can then promote,
facilitate or enforce upgrading to correctly built and operated tanks. In addition, for multi-occupancy
and informal housing, attention is needed to reduce the levels of sharing where this is excessive,
with standards around required provision of additional private or public latrines set to support this.
Where current facilities cannot be emptied, promotion can be focused on replacing or retrofitting
(unlined) pits and tanks with smaller containment units designed for a regular emptying cycle, such
as every 2-3 years.
Emptying and transport: For low-income areas actions should consider the introduction of small-
scale emptying equipment, such as the hand-powered Gulper pump in use elsewhere in East Africa,
coupled with a simple means of transport such as a donkey cart or motor tricycle fitted with a plastic
water tank. As conventional tankers can operate in many parts of Hawassa (due to the planned
nature of access roads and housing plots), it may be helpful to consider a mix of “low-tech” operators
with simple equipment (mechanical and manual pumps), “high-tech” operators working with vacuum
tankers and passive tanks (i.e. operating with no pressure or vacuum) for hauling removed fecal
waste to the treatment site beyond the city boundary. An enhanced role could be identified for those
private tanker services who come under the jurisdiction of the City Administration, as they become
registered/ licensed, regulated and operate to agreed performance standards. Their role could be
further strengthened through the gradual introduction of scheduled desludging as containment
infrastructure improves and emptying services become more available, affordable and in demand.
In addition, experience from elsewhere shows that, in order to run a viable business, operators need
control over when and where they can discharge the pit contents.
Planning for increasing emptying capacity as demand increases will be essential. To support this, a
price review and price adjustment mechanism will be needed. Year-round access to the current fecal
sludge treatment plant must be ensured, including the upgrading and maintenance of the access
road.
Treatment and end-use: At the existing treatment plant, systematic monitoring of tanker effluent
discharge and plant effluent is necessary. The plant operators and manager must be fully trained to
understand and carry out their roles to ensure good practice operation, maintenance and oversight
of the facility, with incentives to achieve optimal treatment capacity from the plant. At the same time,
more suitable site(s) to increase treatment capacity and effectiveness will be needed, accounting for
future demand and possible markets for end-use products. Over the medium term, land will be
needed for this and/or sewage treatment, and given the difficulty of siting such facilities, the process
of identification and acquisition of the land should start as soon as possible, to avoid serious
problems in 10-15 years’ time.
An assessment of the market for a range of possible end-use products can then lead on to seeking
capital funding and partnerships with plant operators for the preferred option. The experience from
Dakar, Senegal of the FSM Market Structuring Program (PSMBV) would be worth exploring further.
This program identifies institutional structures, customer-based services, private sector incentives
and regulation, as well as technical innovation and development through the full FSM service chain.31
31 More details can be found on the website: http://www.onasbv.sn/en/
Report of a FSM study in Hawassa, Ethiopia
69
Environmental protection: Finally, in relation to protecting the groundwater from excess pollution and
Lake Hawassa from the implications of this: studies should be conducted or continued to identify
major risks, mitigate against them and install appropriate sewered sewerage options into critical
areas, where necessary.

Report of a FSM study in Hawassa, Ethiopia
70
Table 26 Technical interventions to improve service delivery, based on existing system type
System type / key problems
Potential solutions
Containment Emptying Conveyance Treatment Disposal End-use
On-site: emptiable Emptied
Limited demand for emptying services
Possible dumping of FS on route to treatment plant (FSTP)
FSTP poorly managed
Improve design and construction standards for pits and tanks – including more effective pit lining options Improve pit access arrangements, to enable easier emptying In rapidly densifying areas and those with groundwater pollution concerns, consider upgrading to include small piped networks, based on detailed technical assessment of current facilities and services (including water supply) and feasibility of alternatives
Promote use of a wider range of appropriate, low-cost pit lining options, as part of sanitation marketing Inspect current facilities and promote / facilitate / enforce upgrading of pit/tank sub-structures if necessary Incentivize households to construct pits that can be emptied periodically, rather than abandoned or replaced – including use of twin-pit arrangements Ensure pits and tanks are built with access points for emptying that are appropriately sized and accessible to emptiers Introduce scheduled desludging Identify opportunities to test and potentially scale-up a wider range of small-scale emptying equipment options – both manual (e.g.
Improve access route and conditions to the FS treatment plant – to ensure year-round access is possible
Consider and pilot mixed use of both ‘low-tech’ and ‘high-tech’ emptying equipment transferring FS to passive (i.e. no vacuum) haulage trucks, to take excreta to FS treatment sites.
Improve management and monitoring of FS treatment processes
Identify the need to extend treatment capacity – either at the existing site, or additional location(s)
Identify a more suitable site(s) for current and future treatment – linked to market potential
Systematically monitor tanker discharge at treatment plant inlet and plant effluent quality
Ensure safe handling and disposal of dried FS, when not in demand as end-use product
Undertake studies to identify major pollution risks to Lake Hawassa. Install well-managed, effective sewered and non-sewered services in critical areas, if needed to protect the lake
Assess the market for a range of possible end-use products: e.g. agriculture.
For preferred option, seek capital funding and partnership with a plant operator
Locate new treatment plant(s) to ensure optimum access to markets

Report of a FSM study in Hawassa, Ethiopia
71
System type / key problems
Potential solutions
Containment Emptying Conveyance Treatment Disposal End-use
Gulper) and mechanized (e.g. VacuTug) 32
On-site: emptiable Not emptied
Pits and tanks not emptied (abandoned or replaced when full).
Densification leading to no space to rebuild, pit collapse and water-logging
For formal areas: - introduce low-cost but
improved construction options and standards: e.g. improved single or twin-pits
- ensure correct construction of septic tanks (1- or 2-compartment, with soakaway or infiltration trench). Promote as an option where appropriate, affordable and accessible to emptying services
As unlined pits fill, abandon, seal & replace with smaller emptiable unit or septic tank (based on income level). For lined pits, empty when full. If large, retrofit smaller pit or convert to ST.
For formal areas: As for Emptied above For low-income areas:
As for Emptied above, plus; - ensure communal
facilities are correctly built and located for periodic emptying
- pilot and develop
emptying service providers and techniques for mobile communal or public latrines and other appropriate innovations
For formal areas:
As for Emptied above
For low-income areas:
As for Emptied above, but focused on use of localized mobile FS transfer stations to support areas with increased demand for emptying (especially using smaller-sized emptying equipment)
As above As above As above
32 Details of a range of emptying technologies is given in Sections 4.5 and 4.6 of Faecal Sludge Management: Systems Approach for Implementation and Operation: http://www.eawag.ch/en/department/sandec/publications/faecal-sludge-management-fsm-book/

Report of a FSM study in Hawassa, Ethiopia
72
System type / key problems
Potential solutions
Containment Emptying Conveyance Treatment Disposal End-use
For low-income areas:
As above, plus:
- alternative management arrangements for plots with more than one household, to ensure all households have access to a toilet of some kind
On-site non-emptiable: Unlined pit/tank
Partial or no containment.
Densification resulting in pit collapse and water-logging
Promote replacement or retrofitting of existing infrastructure with smaller containment units, designed for 2-3 year (max) emptying cycle, to achieved improved standards of simple pits and septic tanks Consider piloting and introducing a range of simple, but durable alternative pit latrines, e.g.: - twin-pit composting
toilet - Fossa Alterna - twin-pit urine-diversion
toilets (UDTs)
Increase the variety and geographical reach of emptying services to serve additional facilities: see above
As above As above As above As above

Report of a FSM study in Hawassa, Ethiopia
73
10.2.1 Towards city-wide incremental improvements
This section has so far identified and proposed recommended actions to improve service delivery
options for on-site sanitation systems in Hawassa. There is clearly a need to anticipate the extent to
which networked sewerage will become a part of future sanitation service options as the city
expands, becomes more densely populated and receives improved access to reliable water services.
Recommendations for sewerage services (including treatment options) do not form a part of this
study. However, a strategy to incrementally and sustainably transition towards greater use of
networked sanitation options, reduce reliance on unimproved services and gradually improve all on-
site systems will be essential.
This can be visually represented in Figure 13 below, which shows a broad “trajectory of change”
over time for city-wide sanitation in Hawassa. This starts at ‘Time 0’ with the current situation. The
key strategies for achieving improved on-site facilities and accompanying effective off-site sewered
options are that:
over time, any open defecation and use of manual emptying options (reported as non-existent in
the household survey, but considered to be possibly in use and/or becoming used as the city
population grows rapidly) must quickly disappear. In addition, the extensive current practice of
covering pits when they become full and digging new pits or reverting to ‘other options’ must be
phased out.
in their place, the use of on-site facilities with either on-request or regular emptying and controlled
dumping or designated treatment must increase. Alongside this must be a gradual development
of sewerage options (decentralized, non-conventional and conventional arrangements), with
treatment, as the urban density increases.
Figure 13 City-wide sanitation strategy for Hawassa: a graphical representation
Increasing access to improved sanitation
0%
20%
40%
60%
80%
100%
2015 2020 2025 2030
sewerage + treatment
on-site + regular emptying + adequate treatment
cover and
build new
open defecation
on-site + on-request emptying + controlled dumping

Report of a FSM study in Hawassa, Ethiopia
74
10.3 The Service Delivery Context: priorities to address
Based on analysis of broader findings from the FSM study, the following sub-sections consider the
key areas of the Enabling Environment (as defined and grouped within the Service Delivery Analysis
of Enabling, Developing and Sustaining components) and identifies actions to support any
infrastructure-focused investments in Hawassa. While drawing on the CSDA results, it also draws
on good practice and relevant experience from elsewhere.
NOTE: It should be noted that this study focuses on the provision of current and future services for
fecal sludge management in Hawassa, where households are using on-site sanitation services and
are likely to do so for some time into the future. The authors of this report recognize that Hawassa
city authorities are planning the construction of an industrial district to accommodate the expanding
population and associated industry, with the inclusion of a sewerage network and treatment plant. A
sewered component of enhanced sanitation service access does not form part of the scope of this
study – not only due to the focus on FSM, but also to the assumption that any process associated
with a future planned introduction of sewerage to existing settlements will be subject to extensive
feasibility studies covering a range of possible options followed by detailed design of the preferred
option.
10.3.1 Enabling: policy, planning and budget
Policy: the federal policy and strategy framework for sanitation and FSM is relatively well developed.
The resulting area for attention is to ensure the translation of federal FSM-specific policy and strategy
objectives so that they are incorporated into regional strategic plans and objectives for integrated
WASH services in SNNPR and Hawassa city in particular. The One WASH National Program
(OWNP) is a strong federal mechanism for driving this process forward, given its high political profile,
buy-in from the four key Ministries and external support from leading donors. With the Integrated
Urban Sanitation and Hygiene Strategy recognizing the roles of the Ministry of Urban Development
and Ministry of Environment, Forestry and Climate Change, there is a clear opportunity to develop
plans and objectives focused on addressing the sewerage and FSM needs for Hawassa in an
integrated way. At the city level, these plans and objectives must account for the needs of all citizens.
Institutional roles: key stakeholders operating within Hawassa City Administration know their roles
around sanitation and FSM services and perform them well – at least to the extent that they are
required to ensure provision of latrines, management of treatment facilities and ensuring
environmental standards are maintained. However, there remain areas where the planning function
within the municipality requires strengthening, to enable closer integration with regional strategic
plans and objectives, and to make the best use of the upcoming Integrated Urban Sanitation and
Hygiene Strategy. WSE would benefit from having a stronger role, in close collaboration with the
regional Water Bureau, for regulating private sector providers, as well as strengthening its internal
capacity to oversee a wider range of integrated non-networked sanitation, FSM services and
sewerage services for Hawassa. Plans and objectives affecting all the relevant regional bureaus
must ensure that attention is given to equitable services, if stakeholders are to develop sustainably
managed, comprehensive and inclusive sanitation services to address the growing and changing
service needs of city residents in the future. For this to happen, attention should be given to improving
the monitoring and enforcement of service functions, and developing the capacity of WSE, and the
Health Department in particular, to engage with the community and ensure needs are being
addressed. This process will be supported by more promotion of sanitation services (sanitation
marketing and behavior change communication) and perhaps the introduction of smart subsidies
targeted at the poorest and most vulnerable. In addition, mechanisms to support and encourage
stronger inter-agency cooperation, reporting arrangements and response standards will be essential

Report of a FSM study in Hawassa, Ethiopia
75
for FSM services to be sustainably delivered, monitored and incrementally adapted to suit the
changing urban environment within the city.
Service provision and planning: beyond containment, FSM emptying services through to treatment
and end-use need greater attention – especially in response to the growing population and limited
budgets to address current and future needs. With improvements to improve containment and ease
of emptying of household sanitation infrastructure, demand for fecal sludge emptying and transport
services can be generated that in turn incentivize growth in those stages of the chain. Enforcement
of building codes by the Design and Construction Supervision Department needs to be stronger if
correctly-built pit latrines and septic tanks are to be rolled out through the city.
Budget: anticipated funding from the One WASH National Program needs careful planning and
management, to target priority areas appropriately. A significant infrastructure-based component of
the OWNP budget is the provision of additional public toilet blocks within the city. This provision must
be planned with the full service function in mind, with appropriate containment arrangements (such
as septic tanks) installed and connected to emptying services and/or eventual connection into piped
networks as these become available and within a suitable distance from the blocks. Examples of
such arrangements include toilet blocks discharging into decentralized (or semi-centralized)
treatment facilities such as anaerobic baffled reactors (ABRs) with effluent discharged through
planted drying beds, or connected into the expansion of centralized sewerage systems.33
10.3.2 Developing: equity and outputs
Choice / reducing inequity: attention is needed to increase the scope, flexibility and availability of
emptying services – but this will only come in response to improvements made in containment
facilities. Standards for the correct construction of on-site facilities will be needed – with sanitation
marketing and other promotional activities to encourage uptake of a range of technical options. This
may be enhanced through the use of carefully targeted subsidies. Introducing scheduled desludging
on a gradual basis can support improved emptying reliability and quality of arrangements.
Outputs: the FSM service chain functions well in comparison to many other comparable cities. Most
notable weaknesses for attention, as in so many other cities, are around the construction of safe pits
and tanks, and the treatment and end-use/disposal of treated fecal sludge. Options to enhance
treatment capacity are being explored and should consider for example covered drying beds (as
used in Kampala, Uganda or Lusaka, Zambia), with attention to optimal location, management and
performance. Developments in the earlier stages of the service chain can offer incentives to those
running emptying services to increase access, reduce costs and improve service levels.
10.3.3 Sustaining: O&M, expansion and service outcomes
Service standards and cost recovery: a more robust monitoring system for discharges at the fecal
sludge treatment plant should be initiated, to identify the extent of capacity overload, if any, and to
enable monitoring of the plant’s functionality. Movement of trucks should be more closely monitored,
supported by improved transport routes – especially the access road up to the fecal sludge treatment
plant – and monitoring operations at the solid waste disposal site, to ensure no discharge of fecal
sludge there during the rainy seasons. Addressing cost recovery issues will require attention given
to developing appropriate mechanisms for generating revenue streams. This may be in the form of
a ‘sanitation tax’ added onto water sales – where the costs are associated with the level of service
provided. Such an approach is successfully being implemented in Hai Phong, Vietnam where
households connected to the sewer are charged a fee for wastewater services, while households 33 Details of treatment technologies can be found in the Compendium of Sanitation Systems and Technologies: http://ecompendium.sswm.info/sanitation-technologies

Report of a FSM study in Hawassa, Ethiopia
76
who are not connected to the sewer are charged a lower ‘environmental fee’. Any proposals for
Hawassa should ensure sufficient revenue is raised to cover costs associated with collection,
treatment and disposal of fecal sludge, as well as sewerage service functions.
Demand and sector development: Demand for FSM services is low and limited in coverage. This is
reflected by the lack of FSM actors serving households (more focus is to the commercial and
industrial dwellings) and inadequate government response to the growing scale of the problem.
Sector development needs to come first, with improved service options available, marketed and
more widely applied. It may be best to focus use of municipal tankers for serving public institutions
and emergency responses, while developing a regulatory framework for non-municipal service
providers. Greater clarity in the process of registration, licensing and regulation of the existing private
providers, with transparency in costs and review of pricing mechanisms will support the development
of these services to required standards. Initial external financial support and “friendly regulation” can
help more actors enter the market. Demand will only achieve any significant level for service options
to become self-sustaining when prices are affordable and services more responsive.
10.4 Resulting prioritized interventions: guidelines for action
Considering results from the City Service Delivery Assessment and Prognosis for Change (Sections
8 and 9 respectively), it is possible to recommend where actions are most needed in relation to the
non-technical components of the enabling environment (such as policy and planning, institutional
arrangements, capacity and financing), to support technical responses.
For such actions to be effective, recommended interventions must respond to how well developed
the enabling environment currently is. Based on the assessed status of FSM service development
using these tools, the following Service Delivery Action Framework tables present a range of non-
technical, ‘institutional’ interventions. Actions are grouped according to the current status of the
enabling environment: Basic, Intermediate or Consolidating.
The set of recommended actions have been developed from good practice and informed by the
experience of the authors in relation to the enabling environment for urban sanitation. They are
tailored to how well developed the enabling environment currently is, with a view to strengthening it.
As the actions account for the current realities in a city, they must be recognized as essentially
sequential and should be viewed as dynamic; that is, actions are proposed as being at the Basic
stage before moving towards the Intermediate, then the Consolidating stages. Where a city is
identified to already be delivering FSM service needs from one of these stages, the resulting set of
actions are taken from the ‘next stage’.
The recommended sets of actions are shown within the boxes that have a bold outline
and shading.
As progress is made through these stages, actions can shift from being mainly about identifying,
reviewing or building awareness of services, through to actions that are more about establishing,
strengthening and promoting commitment to services, and on towards actions that are about
strengthening, consolidating and expanding engagement to achieve a more sustainable range of
enhanced services. The actions also move from prioritizing public health protection (which may
include developing temporary measures), to ensuring the protection of the environment and looking
at the potential for the re-use of fecal sludge end products. In the case of Hawassa, it is clear that a
strong focus on protection of Lake Hawassa from adverse effects of contamination is a significant
priority – and specific interventions may be necessary to ensure this is maintained as sanitation
services are addressed.
‘Action’

Report of a FSM study in Hawassa, Ethiopia
77
The actions proposed for Hawassa in the Tables that follow (Table 27 parts a), b) and c)) can be
considered to be most appropriate to the current situation both in Hawassa and in Ethiopia more
broadly, associated with the status in relation to the “trajectory of change” in Hawassa (see Figure
13) as the enabling environment develops and strengthens.
As well as protecting Lake Hawassa, any improvements to sanitation services in the city should also
seek to achieve the following overarching aims:
Ensure the needs of vulnerable family members (including elderly and disabled people,
pregnant women and small children) are considered in the provision of facilities and services;
and
Adopt an integrated response to addressing sanitation, solid waste and drainage infrastructure
and services. Only in this way can equitable, functional and sustainable services be delivered.
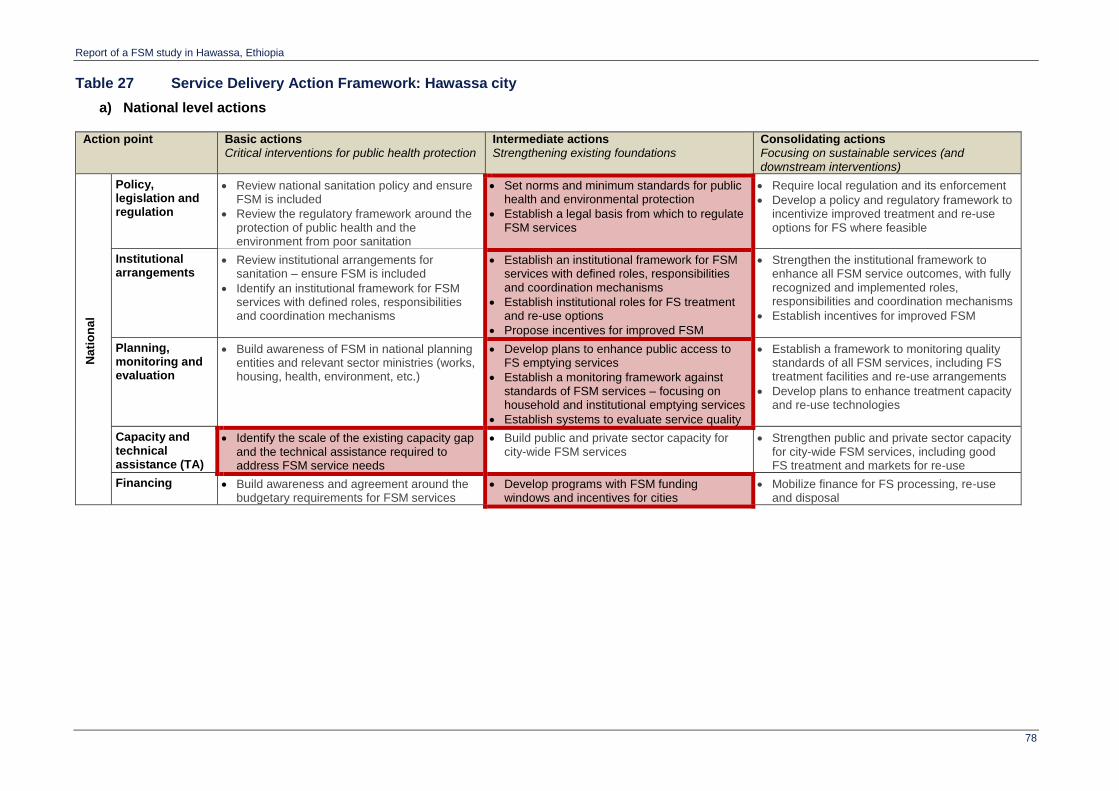
Report of a FSM study in Hawassa, Ethiopia
78
Table 27 Service Delivery Action Framework: Hawassa city
a) National level actions
Action point Basic actions Critical interventions for public health protection
Intermediate actions Strengthening existing foundations
Consolidating actions Focusing on sustainable services (and downstream interventions)
Nati
on
al
Policy, legislation and regulation
Review national sanitation policy and ensure FSM is included
Review the regulatory framework around the protection of public health and the environment from poor sanitation
Set norms and minimum standards for public health and environmental protection
Establish a legal basis from which to regulate FSM services
Require local regulation and its enforcement
Develop a policy and regulatory framework to incentivize improved treatment and re-use options for FS where feasible
Institutional arrangements
Review institutional arrangements for sanitation – ensure FSM is included
Identify an institutional framework for FSM services with defined roles, responsibilities and coordination mechanisms
Establish an institutional framework for FSM services with defined roles, responsibilities and coordination mechanisms
Establish institutional roles for FS treatment and re-use options
Propose incentives for improved FSM
Strengthen the institutional framework to enhance all FSM service outcomes, with fully recognized and implemented roles, responsibilities and coordination mechanisms
Establish incentives for improved FSM
Planning, monitoring and evaluation
Build awareness of FSM in national planning entities and relevant sector ministries (works, housing, health, environment, etc.)
Develop plans to enhance public access to FS emptying services
Establish a monitoring framework against standards of FSM services – focusing on household and institutional emptying services
Establish systems to evaluate service quality
Establish a framework to monitoring quality standards of all FSM services, including FS treatment facilities and re-use arrangements
Develop plans to enhance treatment capacity and re-use technologies
Capacity and technical assistance (TA)
Identify the scale of the existing capacity gap and the technical assistance required to address FSM service needs
Build public and private sector capacity for city-wide FSM services
Strengthen public and private sector capacity for city-wide FSM services, including good FS treatment and markets for re-use
Financing Build awareness and agreement around the budgetary requirements for FSM services
Develop programs with FSM funding windows and incentives for cities
Mobilize finance for FS processing, re-use and disposal
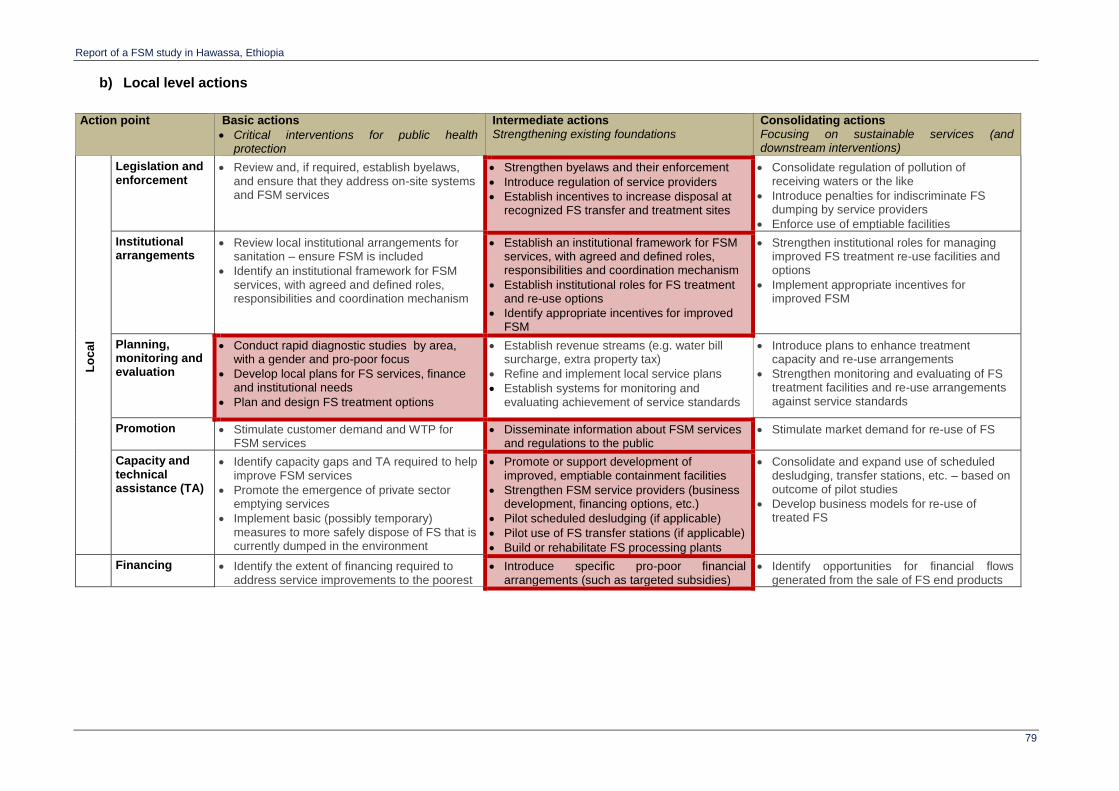
Report of a FSM study in Hawassa, Ethiopia
79
b) Local level actions
Action point Basic actions
Critical interventions for public health protection
Intermediate actions Strengthening existing foundations
Consolidating actions Focusing on sustainable services (and downstream interventions)
Lo
ca
l
Legislation and enforcement
Review and, if required, establish byelaws, and ensure that they address on-site systems and FSM services
Strengthen byelaws and their enforcement
Introduce regulation of service providers
Establish incentives to increase disposal at recognized FS transfer and treatment sites
Consolidate regulation of pollution of receiving waters or the like
Introduce penalties for indiscriminate FS dumping by service providers
Enforce use of emptiable facilities
Institutional arrangements
Review local institutional arrangements for sanitation – ensure FSM is included
Identify an institutional framework for FSM services, with agreed and defined roles, responsibilities and coordination mechanism
Establish an institutional framework for FSM services, with agreed and defined roles, responsibilities and coordination mechanism
Establish institutional roles for FS treatment and re-use options
Identify appropriate incentives for improved FSM
Strengthen institutional roles for managing improved FS treatment re-use facilities and options
Implement appropriate incentives for improved FSM
Planning, monitoring and evaluation
Conduct rapid diagnostic studies by area, with a gender and pro-poor focus
Develop local plans for FS services, finance and institutional needs
Plan and design FS treatment options
Establish revenue streams (e.g. water bill surcharge, extra property tax)
Refine and implement local service plans
Establish systems for monitoring and evaluating achievement of service standards
Introduce plans to enhance treatment capacity and re-use arrangements
Strengthen monitoring and evaluating of FS treatment facilities and re-use arrangements against service standards
Promotion Stimulate customer demand and WTP for FSM services
Disseminate information about FSM services and regulations to the public
Stimulate market demand for re-use of FS
Capacity and technical assistance (TA)
Identify capacity gaps and TA required to help improve FSM services
Promote the emergence of private sector emptying services
Implement basic (possibly temporary) measures to more safely dispose of FS that is currently dumped in the environment
Promote or support development of improved, emptiable containment facilities
Strengthen FSM service providers (business development, financing options, etc.)
Pilot scheduled desludging (if applicable)
Pilot use of FS transfer stations (if applicable)
Build or rehabilitate FS processing plants
Consolidate and expand use of scheduled desludging, transfer stations, etc. – based on outcome of pilot studies
Develop business models for re-use of treated FS
Financing Identify the extent of financing required to address service improvements to the poorest
Introduce specific pro-poor financial arrangements (such as targeted subsidies)
Identify opportunities for financial flows generated from the sale of FS end products

Report of a FSM study in Hawassa, Ethiopia
80
c) User-level actions
Action point Basic actions
Critical interventions for public health protection
Intermediate actions Strengthening existing foundations
Consolidating actions Focusing on sustainable services (and downstream interventions)
Use
rs
Planning Consult with communities to identify what they need and want
Identify the gap between the range of technical options and services currently available, and what communities’ say they need and want
Gain user feedback on improved FSM services
Improve technical options and services, in response to user feedback
Gain user feedback on current and future FSM services, including FS re-use options
Expand on the range and quality of technical options and services, in response to user feedback
Tenant sanitation
Map the tenure status (tenure “mix”), resulting sanitation pathways and stakeholder relationships
Engage and consult with landlords on constraints to FSM services
Develop sanitation options within planning frameworks and approaches that are appropriate to the tenure “mix” within the city
Develop assistance and enforcement packages for landlords
Strengthen tenure-status informed sanitation options in future planning frameworks and approaches
Focus on enforcement of service quality for landlords

Report of a FSM study in Hawassa, Ethiopia
81
11 Conclusions and recommendations
The study has identified three key challenges facing Hawassa in ensuring continued provision of
safe sanitation services to all citizens of the city, including the development of FSM services.
These are in relation to:
Addressing growth and associated densification of settlements throughout the city
Ensuring equitable services as areas expand and service levels for household facilities adapt;
Addressing the limitations and constraints of the existing treatment plant while improving the
location, access, treatment and management of future treatment; and
Achieving sustainable growth and expansion of services through all stages of the service chain,
to match increasing demand.
Whatever interventions are proposed as a result of detailed, extensive and focused studies to
address these challenges, the findings of this study recommend that they must be sure to address:
The extent to which sewerage options are needed and implemented for certain areas – such as
industrial zones, in high-density areas and where on-site systems place a clear risk to polluting
Lake Hawassa;
Land requirements for future treatment plants, including wastewater treatment, fecal sludge
treatment and solid waste disposal perhaps at a co-located site;
Improving standards of containment facilities, especially for kebele and compound housing, with
a particular focus on low-income areas;
Building the capacity and appropriate division of roles for service providers, perhaps with a view
towards the roles being focused around:
customer services (i.e. what people pay directly for in terms of containment and emptying),
where the private sector is often best placed to provide services;
public services (that can be financed through taxation), in terms of the roles of facilitation,
regulation and monitoring performance standards of the private sector actors, as well as
management of treatment, disposal and end-use facilities; and
integrating new infrastructure and services with enhanced drainage, water supply, solid
waste management and urban upgrading.
Key recommended actions for Hawassa City Administration
In the medium-term (containment and emptying):
- consult households and Hawassa City Council in the development of city-wide
sanitation plans, especially where they affect changes to standards affecting
containment infrastructure (septic tanks, pits and eventual connection to sewers); and
- identify priority area for development of sewerage networks – based on likely pollution
risks to Lake Hawassa and saturation of soils.
In the shorter-term (emptying, transport and treatment):
- rehabilitate and improve access to the treatment plant, and install adequately trained
staff and effective operational and monitoring systems;
- resolve market-based issues for FSM services, through price review and negotiating an
increased role for formalized private sector provision through licensing and regulation,
alongside an increase in tariffs; and

Report of a FSM study in Hawassa, Ethiopia
82
- identify and negotiate land purchase, to co-site a FSTP, WWTP and solid waste site.
Report of a FSM study in Hawassa, Ethiopia
83
References
Ayenew T. and Tilahun N., 2008, Assessment of lake-groundwater interactions and anthropogenic
stresses, using numerical groundwater flow model, for a Rift lake catchment in central Ethiopia,
Lakes & Reservoirs; Research and Management 2008 13: 325-343
Cairncross S. and Feachem R., 1993: pp.11-25, Environmental Health Engineering in the Tropics:
An Introductory Text, 2nd Edition, Wiley and Sons, Ltd, UK
CSA, 2015, Population and Housing Census Report-Country, Central Statistical Agency, Addis
Ababa, Ethiopia
DHS, 2011, Ethiopia Demographic and Health Survey 2011, Central Statistical Agency, Addis
Ababa, Ethiopia. March 2012
Holland, J., 2007, Tools for institutional, political, and social analysis of policy reform: A
sourcebook for development practitioners, Washington, DC: World Bank.
Peal A., Evans B., Blackett I., Hawkins P. and Heymans C., 2014. Fecal sludge management
(FSM): analytical tools for assessing FSM in cities. Review paper. Journal of Water, Sanitation and
Hygiene for Development: 04.3, pp. 371-383. IWA Publishing
Strande, L., Ronteltap, M. and Brdjanovic, D. (eds.), 2014, Fecal Sludge Management: Systems
Approach for Implementation and Operation, London, UK: IWA Publishing
WHO/UNICEF, 2015, JMP report: Ethiopia – Estimates on the use of water sources and sanitation
facilities: Updated June 2015

Report of a FSM study in Hawassa, Ethiopia
84
Annex A Map showing city-wide sample locations

Report of a FSM study in Hawassa, Ethiopia
85
Annex B CSDA scoring table
Co
nta
inm
en
t
Em
pty
ing
Co
nv
ey
an
ce
Tre
atm
en
t
En
d-u
se
dis
po
sa
l
Comment
En
ab
lin
g:
Wh
at a
re c
urr
en
t po
licie
s,
pla
nnin
g issu
es a
nd
bud
ge
tary
arr
an
gem
en
ts?
Po
licy
Policy: Is FSM
included in an appropriate,
acknowledged and available policy
document (National/ local or both)?
1
1
1
0.5
0.5
There are various policies, strategies, protocols & other related working documents, most of which are at national level but applicable across the country, namely:
1. The Constitution of the Federal Democratic Republic of Ethiopia (August 1995): Article 90.1 states that “to the extent the country’s resources permit, policies shall aim to provide all Ethiopians access to public health and education, clean water, housing, food and social security”. Article 92.1 states also that the “Government shall endeavor to ensure that all Ethiopians live in a clean and healthy environment.
2. The National Health Policy (1993): in Article 3 states ‘’……developing safe disposal of human, household, agricultural and industrial wastes and encouragement of recycling”, and “developing measures to improve the quality of housing and work premises for health.”
3. The National Hygiene & Sanitation Strategy (December 2005) 4. National Protocol for Hygiene and “On-Site” Sanitation (June 2006) 5. National Manual on Latrine Technology Options 6. WASH Memorandum of Understanding-signed among Ministries of Health, Education, Water,
Irrigation & Energy; and Finance & economic Development. The national MoU has been cascaded down to Regions (first in 2006, revised in November 2012).
7. WASH Implementation Framework (WIF) signed among the above mentioned four Ministries/sectors (August 2011)
8. ENVIRONMENTAL POLICY OF ETHIOPIA 9. National Guideline for Environmental Impact Assessment (July 2000) 10. NATIONAL GUIDELINE FOR URBAN WATER UTILITIES TARIFF SETTING 11. National Integrated Urban Sanitation and Hygiene Strategy, which is under preparation.
In addition, the upcoming Integrated Urban Sanitation & Hygiene Strategy will definitely incorporate FSM with more details considering CONTAINMENT, EMPTYING, TRANSPORT, TREATMENT AND DISPOSAL.
Institutional roles:
Are the institutional roles and
responsibilities for FSM service delivery clearly defined and operationalized?
1 0.5 0.5 0 0
In addition to the MoU and WIF, the Integrated Urban Sanitation & Hygiene Strategy is going to clearly define institutional roles in FSM. Under Hawassa City Administration, and regional level Bureaus the following institutions are taking parts in FSM and service delivery processes: Hawassa City Administration Hawassa City Municipal Services Hawassa City Water and Sanitation Enterprise
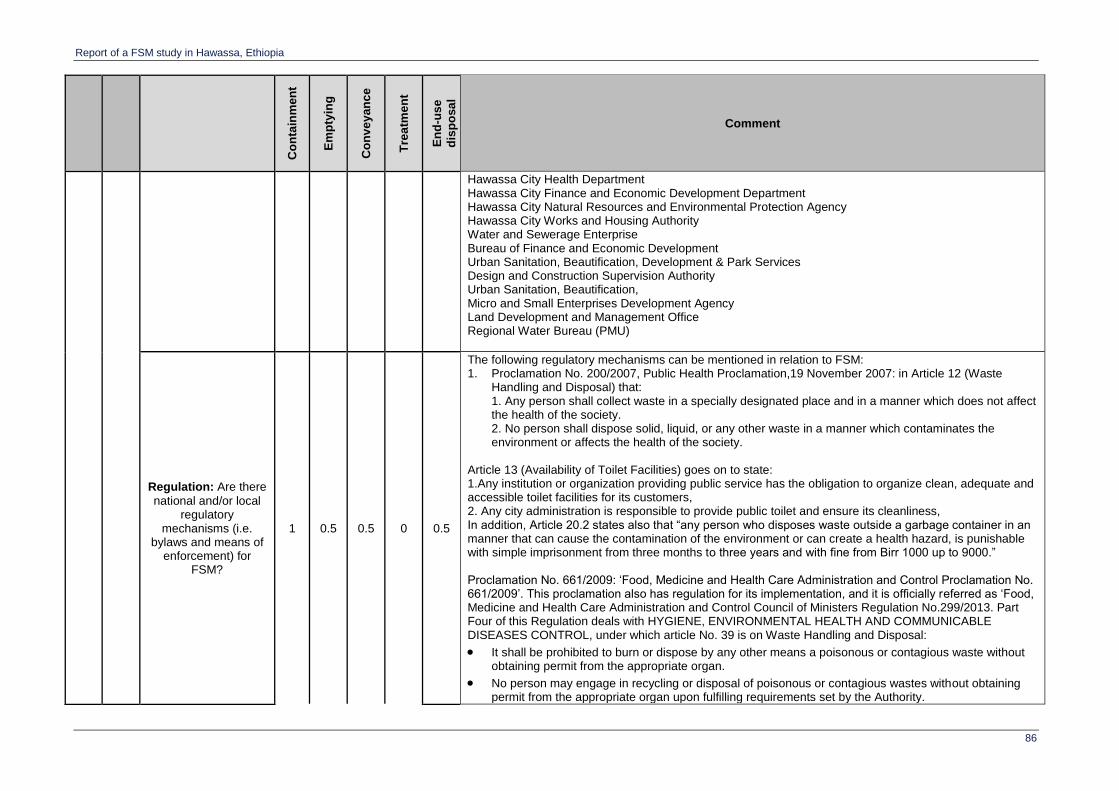
Report of a FSM study in Hawassa, Ethiopia
86
Co
nta
inm
en
t
Em
pty
ing
Co
nv
ey
an
ce
Tre
atm
en
t
En
d-u
se
dis
po
sa
l
Comment
Hawassa City Health Department Hawassa City Finance and Economic Development Department Hawassa City Natural Resources and Environmental Protection Agency Hawassa City Works and Housing Authority Water and Sewerage Enterprise Bureau of Finance and Economic Development Urban Sanitation, Beautification, Development & Park Services Design and Construction Supervision Authority Urban Sanitation, Beautification, Micro and Small Enterprises Development Agency Land Development and Management Office Regional Water Bureau (PMU)
Regulation: Are there
national and/or local regulatory
mechanisms (i.e. bylaws and means of
enforcement) for FSM?
1 0.5 0.5 0 0.5
The following regulatory mechanisms can be mentioned in relation to FSM: 1. Proclamation No. 200/2007, Public Health Proclamation,19 November 2007: in Article 12 (Waste
Handling and Disposal) that: 1. Any person shall collect waste in a specially designated place and in a manner which does not affect the health of the society. 2. No person shall dispose solid, liquid, or any other waste in a manner which contaminates the environment or affects the health of the society.
Article 13 (Availability of Toilet Facilities) goes on to state: 1.Any institution or organization providing public service has the obligation to organize clean, adequate and accessible toilet facilities for its customers, 2. Any city administration is responsible to provide public toilet and ensure its cleanliness, In addition, Article 20.2 states also that “any person who disposes waste outside a garbage container in an manner that can cause the contamination of the environment or can create a health hazard, is punishable with simple imprisonment from three months to three years and with fine from Birr 1000 up to 9000.” Proclamation No. 661/2009: ‘Food, Medicine and Health Care Administration and Control Proclamation No. 661/2009’. This proclamation also has regulation for its implementation, and it is officially referred as ‘Food, Medicine and Health Care Administration and Control Council of Ministers Regulation No.299/2013. Part Four of this Regulation deals with HYGIENE, ENVIRONMENTAL HEALTH AND COMMUNICABLE DISEASES CONTROL, under which article No. 39 is on Waste Handling and Disposal:
It shall be prohibited to burn or dispose by any other means a poisonous or contagious waste without obtaining permit from the appropriate organ.
No person may engage in recycling or disposal of poisonous or contagious wastes without obtaining permit from the appropriate organ upon fulfilling requirements set by the Authority.

Report of a FSM study in Hawassa, Ethiopia
87
Co
nta
inm
en
t
Em
pty
ing
Co
nv
ey
an
ce
Tre
atm
en
t
En
d-u
se
dis
po
sa
l
Comment
The appropriate organ shall, prior to the designation of a place for disposal or recycling of waste, confirm that the disposal or recycling of waste at such place may not cause damage to public health.
No person may discharge liquid waste to the environment unless treated in accordance with standards to be issued by the appropriate organ.
Furthermore, No. 42 deals specifically with Toilet of Public Facility, under which it says: Any toilet of a public facility shall fulfill the requirements set by the Authority. On the other hand, a section formally known as Code Enforcement established under city administrations, including Hawassa City is particularly engaged in enforcing of regulations in the various socio-economic areas including sanitation. The code enforcement section carries out its duties either by directly conducting monitoring tours across the city or when it receives complaints from residents. In its regulatory activities, the Code Enforcement section has the right to contact and mobilize police force as appropriate.
Service provision:
does the policy, legislative and
regulatory framework enable investment and
involvement in FSM services by
appropriate service providers (private or
public)?
1 0.5 0.5 0.5 0
Similar to the other sectors, private sector investment in sanitation service delivery has been permitted. As part of the country’s economic policy, private investment in all sectors is highly encouraged. The Government even facilitates investments by availing land, permits investors to import required machineries free of tax, and many other opportunities. To coordinate such private investment activities, the Government also established its structures from federal down to district levels. Accordingly, during our assessment visit, we learned that the Enterprises Development Office, in general and the Small and Micro Enterprises Development Office, in particular is practically dealing with the organization, capacity building (by provision of training, required materials provision), facilitating of loan, etc. for small-scale enterprises that would like to be engaged in sanitation service delivery. In addition to availing loan, the Enterprise Development Office also provide training to members of micro and small-scale enterprises on areas of business/financial management, customer handling, marketing, and the like. The office also closely follow up and monitor the enterprises to sort out challenges they are encountered and take remedial action timely. However, from our discussion with the enterprises development office staff, so far, there is no enterprise working on FSM at any stages of the service chain. As a matter of fact, in Ethiopia, alternative technologies, for instance small-sized vehicles for emptying and transport are hardly used/introduced. All the available vacuum trucks are conventional ones which are expensive and out of the spectrum of small and micro enterprises presumed objectives. But still, as mentioned above, the City Administration Trade and Industry Department is the responsible office to facilitate private investment for private sector /companies who applied in the different investment areas. Accordingly, the few private companies currently engaged in FSM particularly on emptying and transport had received the support in terms of loan, tax exemption while importing the vacuum trucks, etc. There is however a degree of uncoordinated / unregulated operations of private vacuum truck operations and no coordination in relation to end-use of safe disposal options.

Report of a FSM study in Hawassa, Ethiopia
88
Co
nta
inm
en
t
Em
pty
ing
Co
nv
ey
an
ce
Tre
atm
en
t
En
d-u
se
dis
po
sa
l
Comment P
lan
nin
g
Targets: Are there
service targets for (each part of) the FSM
service chain in the city development plan,
or a national development plan that
is being adopted at the city level?
1
0.5
0.5
0
0
In relation to human waste disposal, existing targets at all levels (National, Regional or District levels) are on increasing access to latrines/sanitation facilities and increasing the number of Open Defecation Free Communities across the nation. Moreover, the One WASH National Program (OWNP), which is the biggest WASH development program of the country that is planned to be implemented in two phases: Phase I from July 2013 to June 2015 and Phase II from July 2015 to June 2020, has set out the following targets:
Increasing sanitation access from 65.8% to 100% (nation-wide, both in rural, urban and pastoral settings)
In Urban settings, the main activities include study and design, capacity building and management support, environmental and resettlement safeguards, immediate service improvements and expansion and augmentation of water supplies. Sanitation and urban environmental improvements will include desludging equipment and facilities, management of wastewater and public toilets in selected locations.
No evidence of targets for end-use options or disposal means (either in-situ on at treatment site)
Investment: Is FSM
incorporated into an approved and used investment plan (as part of sanitation) - including ensuring adequate human
resources and Technical Assistance?
(Ideally a medium term plan, but if not, at least an annual plan)
0.5 0.5 0.5 0 0.5
Regarding investment plan, the OWNP mentioned above can be considered as an investment plan for improving sanitation service delivery at national level. On the other hand, the fact that the City of Hawassa is in the process of preparing a new master plan, which pledges to give appropriate focus on sanitation can be considered as one important step towards an investment plan for the city’s sanitation including FSM. There remains however no clear indication that an investment plan is addressing resource or technical assistance gaps.
Bu
dg
et
Fund flows: Does
government have a process for
coordinating FSM investments (domestic or donor, e.g. national grants, state budgets,
donor loans and grants etc.)?
1
0.5
0.5
0.5
0.5
In the above mentioned One WASH National Program, the required cost for the targets set for Urban Sanitation estimated to be USD 95.7 million and sector partners and donors have already allocated part of it. In addition, using the OWNP as a predefined mechanism for fund mobilization, the additional fund required to fully address targets set on urban sanitation improvements including FSM is planned to be solicited during the courses of the program implementation. The OWNP further elaborates ‘effective institutional arrangements and procedures need to be in place to ensure the smooth flow of funds as well as the timely availability of adequate financial resources and to track their use.’ Accordingly, the document has well defined about essential issues such as guiding principles for Program financing, assumptions for Program financing, sources and size of project funding for the Program, mitigation measures for budget availability and utilization risks and other related considerations. From the discussion with Hawassa City Administration, Water Supply and Sewerage Enterprise Manager, it was also learned that his office has been working development partners such as the World Bank. As an

Report of a FSM study in Hawassa, Ethiopia
89
Co
nta
inm
en
t
Em
pty
ing
Co
nv
ey
an
ce
Tre
atm
en
t
En
d-u
se
dis
po
sa
l
Comment
example, he mentioned that the newly constructed drying bed was financed by the grant received from the WB. However, investment in the treatment plant is previous, with no current investment plan to improve capacity or potential for end-use. No coordinated investment in operation of emptying services, transport, or safe disposal of un/treated FS
Adequacy & structure: Are the
public financial commitments to FSM commensurate with
meeting needs/targets for Capex and Opex (over the coming 5
years)?
1 0.5 0.5 0.5 0.5
The One WASH National Program document has been stated the Urban Sanitation Financial Requirement by Activity (USD) as follows:
Some budget allocation to sludge drying beds, but in the past and nothing identified at scale needed to adequately address current and future challenges. WES are running tanker operations at a loss (rely on cross-subsidy from HCA)
No. Activity Requirement (USD) %
1 Public Toilets 47,568,132 49.7%
2 Sewerage Expansion 29,515,286 30.9%
3 Vacuum Trucks 7972967.786 8.3%
4 Program Mg’t and Capacity building 4,349,266 4.6%
5 Urban Health Extension Work 4,349,266 5%
6 Sludge drying Bed 1,928,931 2.0%
Total 95,683,849 100%
Dev
elo
pin
g:
Wha
t is
the
le
vel o
f
exp
en
ditu
re, d
eg
ree
of e
quity a
nd
le
vel o
f
ou
tpu
t?
Cap
ital e
xp
end
itu
re
Capital funding:
What is Capex expenditure per capita
on FSM (3 year average)?
0.5 0.5 0.5 0.5 0
During the last three years, the Hawassa City Administration has been invested a significant amount of fund for the procurement of 2 Vacuum Trucks, the construction of new disposal site, staff salary and many other FSM related expenses. The amount of investment, comparing to the previous years, has been increasing in the last consecutive years. The per capita investment of FSM for last year is roughly estimated to be less than 2.00 USD, which is believed to be very low. From the detail interviews we had with the Deputy Mayor and Manager of the Water Supply and Sewerage Enterprise of the city, we have confirmed that the city administration has recognized that the problem of FSM would be much more than the current one as the population increases and the socio-economic development activities expands. Accordingly, the city administration is looking for a comprehensive sanitation plan that can accommodate expected problem of sanitation including FSM in the city.
Eq
uity
Choice: Is there a
range of affordable, appropriate, safe and
adaptable technologies for FSM
1
0.5
0.5
0
0
Ranges of technical options and technologies for FSM have been applied in the city. In the low-income areas of the city, we have witnessed that the city administration in collaboration with NGOs such as Jerusalem Children and Community Development Organization (JeCDDO) communal latrines are constructed and being used properly. Similarly, at selected areas, public latrines are constructed and outsourced to locally organized business associations, and are providing services to the public at
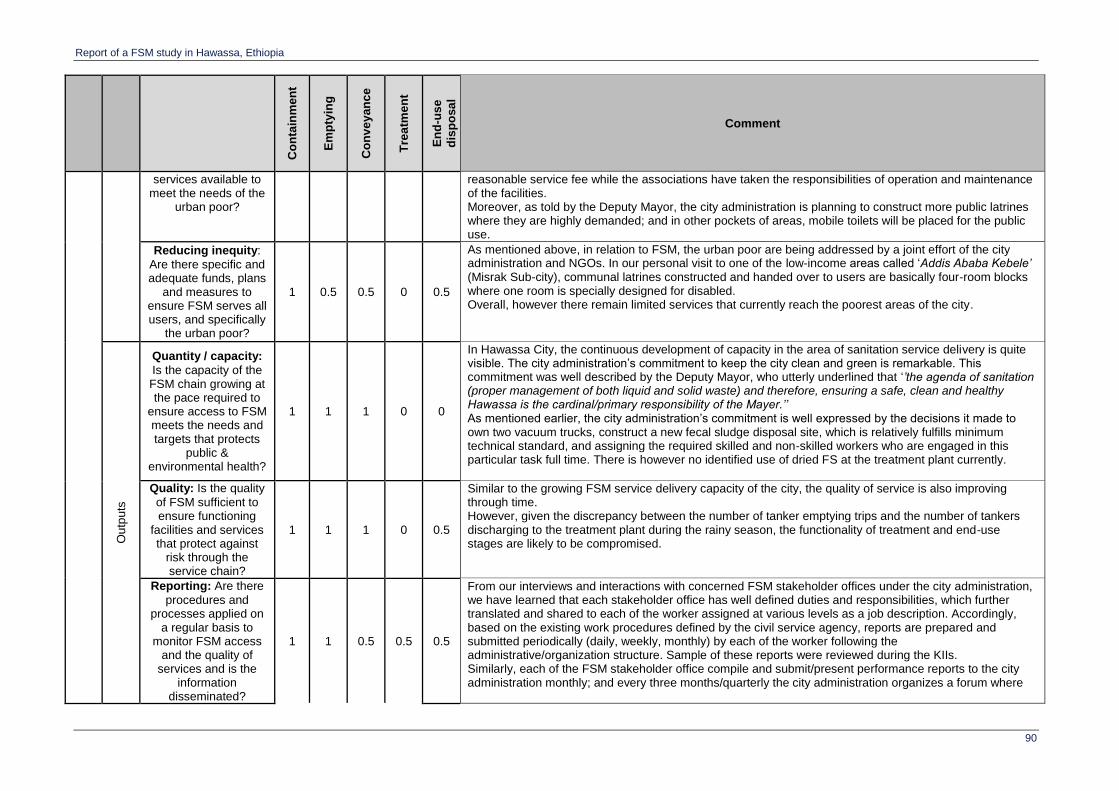
Report of a FSM study in Hawassa, Ethiopia
90
Co
nta
inm
en
t
Em
pty
ing
Co
nv
ey
an
ce
Tre
atm
en
t
En
d-u
se
dis
po
sa
l
Comment
services available to meet the needs of the
urban poor?
reasonable service fee while the associations have taken the responsibilities of operation and maintenance of the facilities. Moreover, as told by the Deputy Mayor, the city administration is planning to construct more public latrines where they are highly demanded; and in other pockets of areas, mobile toilets will be placed for the public use.
Reducing inequity:
Are there specific and adequate funds, plans
and measures to ensure FSM serves all users, and specifically
the urban poor?
1 0.5 0.5 0 0.5
As mentioned above, in relation to FSM, the urban poor are being addressed by a joint effort of the city administration and NGOs. In our personal visit to one of the low-income areas called ‘Addis Ababa Kebele’ (Misrak Sub-city), communal latrines constructed and handed over to users are basically four-room blocks where one room is specially designed for disabled. Overall, however there remain limited services that currently reach the poorest areas of the city.
Ou
tpu
ts
Quantity / capacity:
Is the capacity of the FSM chain growing at the pace required to
ensure access to FSM meets the needs and targets that protects
public & environmental health?
1 1 1 0 0
In Hawassa City, the continuous development of capacity in the area of sanitation service delivery is quite visible. The city administration’s commitment to keep the city clean and green is remarkable. This commitment was well described by the Deputy Mayor, who utterly underlined that ‘’the agenda of sanitation (proper management of both liquid and solid waste) and therefore, ensuring a safe, clean and healthy Hawassa is the cardinal/primary responsibility of the Mayer.’’ As mentioned earlier, the city administration’s commitment is well expressed by the decisions it made to own two vacuum trucks, construct a new fecal sludge disposal site, which is relatively fulfills minimum technical standard, and assigning the required skilled and non-skilled workers who are engaged in this particular task full time. There is however no identified use of dried FS at the treatment plant currently.
Quality: Is the quality
of FSM sufficient to ensure functioning
facilities and services that protect against
risk through the service chain?
1 1 1 0 0.5
Similar to the growing FSM service delivery capacity of the city, the quality of service is also improving through time. However, given the discrepancy between the number of tanker emptying trips and the number of tankers discharging to the treatment plant during the rainy season, the functionality of treatment and end-use stages are likely to be compromised.
Reporting: Are there
procedures and processes applied on
a regular basis to monitor FSM access
and the quality of services and is the
information disseminated?
1 1 0.5 0.5 0.5
From our interviews and interactions with concerned FSM stakeholder offices under the city administration, we have learned that each stakeholder office has well defined duties and responsibilities, which further translated and shared to each of the worker assigned at various levels as a job description. Accordingly, based on the existing work procedures defined by the civil service agency, reports are prepared and submitted periodically (daily, weekly, monthly) by each of the worker following the administrative/organization structure. Sample of these reports were reviewed during the KIIs. Similarly, each of the FSM stakeholder office compile and submit/present performance reports to the city administration monthly; and every three months/quarterly the city administration organizes a forum where

Report of a FSM study in Hawassa, Ethiopia
91
Co
nta
inm
en
t
Em
pty
ing
Co
nv
ey
an
ce
Tre
atm
en
t
En
d-u
se
dis
po
sa
l
Comment
all offices congregate and carry out a detailed deliberation on the various activities progress, achievement and challenges encountered by the offices to look for appropriate and timely remedial measures. The performances of offices under the city administration is popularized through various mass medias, such as local FM radios, TV broadcasts, local newspapers, bulletins, newsletters, etc. There remains however a lack of data available about the number of trucks running, the operation of the treatment plant and practices around use/disposal of dried FS.
Su
sta
inin
g:
Wha
t is
the
sta
tus o
f o
pe
ratio
n a
nd
main
ten
ance
, w
ha
t p
rovis
ions a
re
ma
de f
or
se
rvic
e e
xp
ansio
n a
nd
wh
at
are
cu
rre
nt se
rvic
e o
utc
om
es?
O&
M
Cost recovery: Are
O&M costs known and fully met by either cost recovery through user
fees and/or local revenue or transfers?
0.5 0.5 0.5 0 0.5
From our interview with the Manager of Water Supply and Sewerage Enterprise, we have learned that the Enterprise has been fully recovering its budget from the service charge/fee it collects from users; and confirmed us that the Enterprise is well of covering its budgetary requirements for its routine FSM service delivery operations/endeavors. On the other hand, however, the Manager told us that his office has also been received budget supports from the city administration and sector development partners for new and expansion projects, including FSM that require substantial investments. Scores are influenced by the extent to which transportation and treatment services are (apparently) currently running at a loss.
Standards: Are there
norms and standards for each part of the
FSM service delivery chain that are systematically
monitored under a regime of sanctions
(penalties)?
0.5 0.5 0.5 0 0
Apart from the strategies, protocols, proclamations and regulations mentioned earlier, which are very general ones (on sanitation and hygiene or solid and liquid waste), specific standards on each of the FSM service chain: CONTAINMENT, EMPTYING, CONVEYANCE, TREATMENT AND DISPOSAL, is not available. Even so, we have found out that the city administration through its offices, such as Land Development and Management Office, Design and Construction Authority, and Building Approval Office ensures the fulfillment of basic requirements for any new construction including living quarters. The four construction parameters that are considered to be checked are: Architectural, Structural, Electrical and Sanitary. Accordingly, the inclusion of toilets and other sanitary structures in the design and construction of houses is checked by the relevant technical officers from the mentioned offices. From our discussion with Frezer Kaleb (Sanitary Engineer), Messay Ashenafi (Structural Engineer) and Dawit Getachew (Architect) at the Design and Construction Authority of Hawassa City, we further learned that they have a predefined checklist to carry out the monitoring activities in each of the four parameters. Even though the existing standards are related mainly on containment but also some elements of the standard, such as the need to have ample access to buildings has contribution to easy emptying and then transport. There are no clear standards applied for construction or levels of sharing of facilities, or monitoring of any standards for end-use / disposal
Exp
ansio
n
Demand: Has
government (national or city authority) developed any
0.5 0.5
The National Hygiene & Sanitation Strategy (December 2005) clearly indicates that the country’s hygiene and sanitation promotion endeavor rests on three core pillars. Simply put they are:
1. Creation of enabling environment,
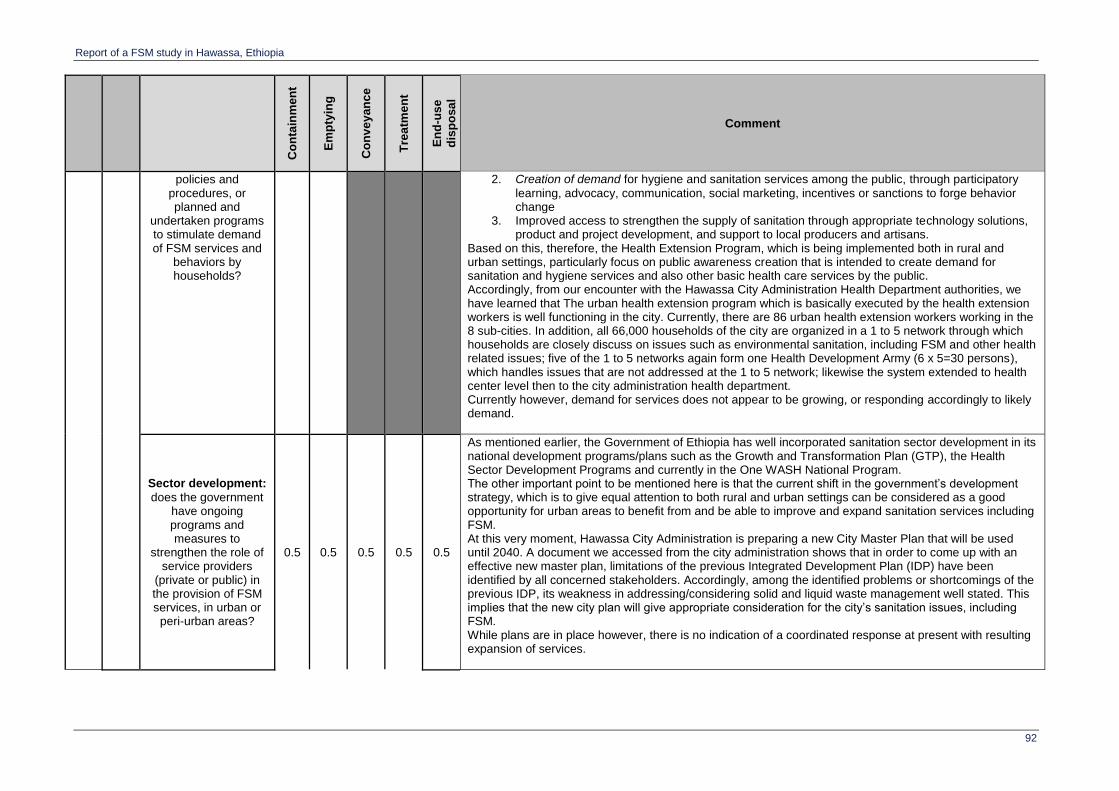
Report of a FSM study in Hawassa, Ethiopia
92
Co
nta
inm
en
t
Em
pty
ing
Co
nv
ey
an
ce
Tre
atm
en
t
En
d-u
se
dis
po
sa
l
Comment
policies and procedures, or planned and
undertaken programs to stimulate demand of FSM services and
behaviors by households?
2. Creation of demand for hygiene and sanitation services among the public, through participatory
learning, advocacy, communication, social marketing, incentives or sanctions to forge behavior change
3. Improved access to strengthen the supply of sanitation through appropriate technology solutions, product and project development, and support to local producers and artisans.
Based on this, therefore, the Health Extension Program, which is being implemented both in rural and urban settings, particularly focus on public awareness creation that is intended to create demand for sanitation and hygiene services and also other basic health care services by the public. Accordingly, from our encounter with the Hawassa City Administration Health Department authorities, we have learned that The urban health extension program which is basically executed by the health extension workers is well functioning in the city. Currently, there are 86 urban health extension workers working in the 8 sub-cities. In addition, all 66,000 households of the city are organized in a 1 to 5 network through which households are closely discuss on issues such as environmental sanitation, including FSM and other health related issues; five of the 1 to 5 networks again form one Health Development Army (6 x 5=30 persons), which handles issues that are not addressed at the 1 to 5 network; likewise the system extended to health center level then to the city administration health department. Currently however, demand for services does not appear to be growing, or responding accordingly to likely demand.
Sector development:
does the government have ongoing programs and measures to
strengthen the role of service providers
(private or public) in the provision of FSM services, in urban or
peri-urban areas?
0.5 0.5 0.5 0.5 0.5
As mentioned earlier, the Government of Ethiopia has well incorporated sanitation sector development in its national development programs/plans such as the Growth and Transformation Plan (GTP), the Health Sector Development Programs and currently in the One WASH National Program. The other important point to be mentioned here is that the current shift in the government’s development strategy, which is to give equal attention to both rural and urban settings can be considered as a good opportunity for urban areas to benefit from and be able to improve and expand sanitation services including FSM. At this very moment, Hawassa City Administration is preparing a new City Master Plan that will be used until 2040. A document we accessed from the city administration shows that in order to come up with an effective new master plan, limitations of the previous Integrated Development Plan (IDP) have been identified by all concerned stakeholders. Accordingly, among the identified problems or shortcomings of the previous IDP, its weakness in addressing/considering solid and liquid waste management well stated. This implies that the new city plan will give appropriate consideration for the city’s sanitation issues, including FSM. While plans are in place however, there is no indication of a coordinated response at present with resulting expansion of services.

Report of a FSM study in Hawassa, Ethiopia
93
Co
nta
inm
en
t
Em
pty
ing
Co
nv
ey
an
ce
Tre
atm
en
t
En
d-u
se
dis
po
sa
l
Comment S
erv
ice
ou
tco
mes
Public Health: What
is the magnitude of public health risk
associated with the current FS flows
(through the stages of the FS service chain)?
1
1
1
1
1
In Hawassa City, even though there is no conventional sewerage system, majority of households have a latrine, in low-income areas, communal latrines are used and public latrines are made available mainly for public use. In addition, the urban health extension program, which is well functioning across the city (continuous awareness creation on sanitation and hygiene among inhabitants and close follow up and supervision of households by the health extension workers) can justify that the public health risk posed by fecal sludge is low. Likewise, the survey made on the FSM of the city has confirmed that practices which can cause critical public health risk, such as manual fecal sludge emptying, illegal dumping, etc. are not done.
Quantity: Percentage
of total FS generated by the city that is
managed effectively, within each part of the
service chain
0.5 0 0.5 0.5 0
Similar to the rest of Ethiopian cities, majority of Hawassa households use on-site sanitation facilities; in most cases households rather dig new pit when the previous one get filled. Those households, who have no ample space to dig new pit, use existing emptying service either from the municipality/the city administration water and sewerage Enterprise or private service providers. It is not common practice to see fecal sludge draining directly to public drainage, to rivers or any other illegal way by households, private or public institutes. Scoring reflects that: <50% of FS effectively containment, <50% of emptiable pits/tanks emptied and transported, >50% treatment capacity (either at the FSTP, or in unemptied pits/tanks), and <50% effective disposal (in-situ or at FSTP)
Equity: To what
extent do the city's FSM systems serve
low-income communities? (Containment, Emptying and
Transport services only)
1 0.5 0.5
In Hawassa city, significant portion of the inhabitants are low-income families who are hardly able to pay fecal sludge emptying and transport service charge, which is about ETB 700.00-1400.00 per one truck (based on the capacity of the vacuum truck); in this regard, it was found out that there is variation on the amount of service charge requested by municipality and private service providers (the service charge requested by the municipality is a bit higher than that of private service providers). Accordingly, unless otherwise the city administration look for an appropriate mechanism, such as down payment system for those low income households, it is difficult to ensure equity across all inhabitants on FSM system the city has arranged.
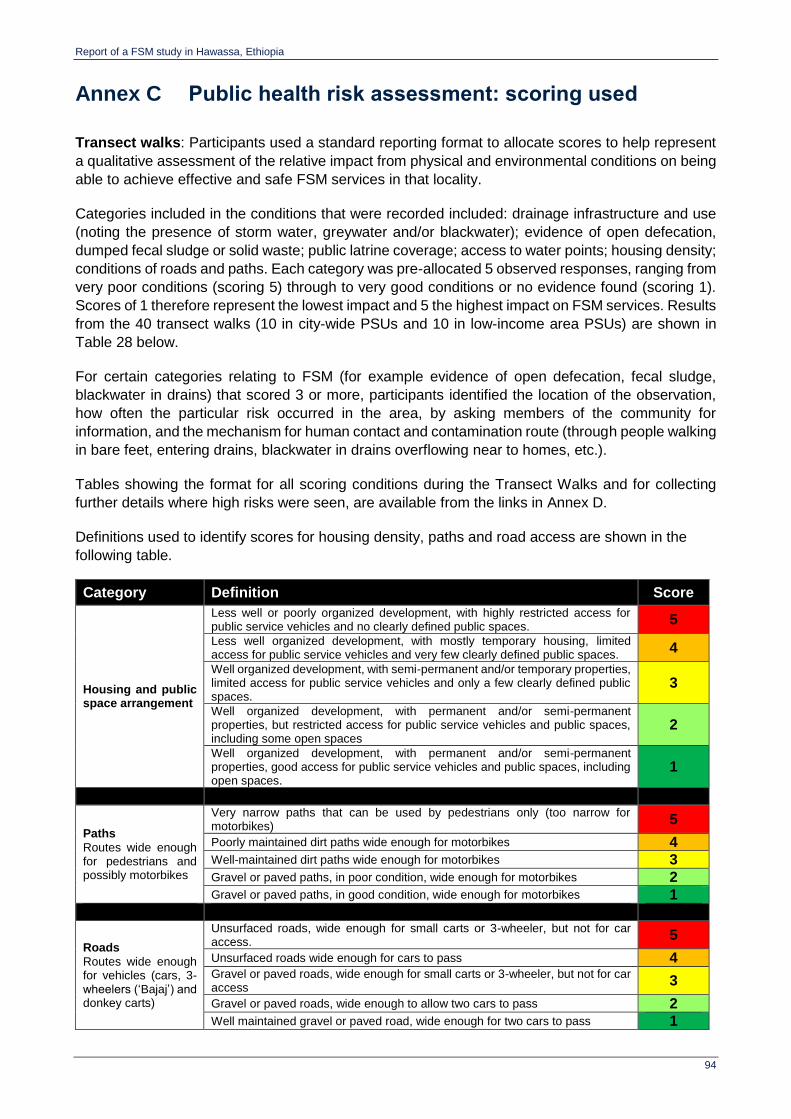
Report of a FSM study in Hawassa, Ethiopia
94
Annex C Public health risk assessment: scoring used
Transect walks: Participants used a standard reporting format to allocate scores to help represent
a qualitative assessment of the relative impact from physical and environmental conditions on being
able to achieve effective and safe FSM services in that locality.
Categories included in the conditions that were recorded included: drainage infrastructure and use
(noting the presence of storm water, greywater and/or blackwater); evidence of open defecation,
dumped fecal sludge or solid waste; public latrine coverage; access to water points; housing density;
conditions of roads and paths. Each category was pre-allocated 5 observed responses, ranging from
very poor conditions (scoring 5) through to very good conditions or no evidence found (scoring 1).
Scores of 1 therefore represent the lowest impact and 5 the highest impact on FSM services. Results
from the 40 transect walks (10 in city-wide PSUs and 10 in low-income area PSUs) are shown in
Table 28 below.
For certain categories relating to FSM (for example evidence of open defecation, fecal sludge,
blackwater in drains) that scored 3 or more, participants identified the location of the observation,
how often the particular risk occurred in the area, by asking members of the community for
information, and the mechanism for human contact and contamination route (through people walking
in bare feet, entering drains, blackwater in drains overflowing near to homes, etc.).
Tables showing the format for all scoring conditions during the Transect Walks and for collecting
further details where high risks were seen, are available from the links in Annex D.
Definitions used to identify scores for housing density, paths and road access are shown in the
following table.
Category Definition Score
Housing and public space arrangement
Less well or poorly organized development, with highly restricted access for public service vehicles and no clearly defined public spaces. 5
Less well organized development, with mostly temporary housing, limited access for public service vehicles and very few clearly defined public spaces. 4
Well organized development, with semi-permanent and/or temporary properties, limited access for public service vehicles and only a few clearly defined public spaces.
3
Well organized development, with permanent and/or semi-permanent properties, but restricted access for public service vehicles and public spaces, including some open spaces
2
Well organized development, with permanent and/or semi-permanent properties, good access for public service vehicles and public spaces, including open spaces.
1
Paths
Routes wide enough for pedestrians and possibly motorbikes
Very narrow paths that can be used by pedestrians only (too narrow for motorbikes) 5
Poorly maintained dirt paths wide enough for motorbikes 4 Well-maintained dirt paths wide enough for motorbikes 3 Gravel or paved paths, in poor condition, wide enough for motorbikes 2 Gravel or paved paths, in good condition, wide enough for motorbikes 1
Roads
Routes wide enough for vehicles (cars, 3-wheelers (‘Bajaj’) and donkey carts)
Unsurfaced roads, wide enough for small carts or 3-wheeler, but not for car access. 5
Unsurfaced roads wide enough for cars to pass 4 Gravel or paved roads, wide enough for small carts or 3-wheeler, but not for car access 3
Gravel or paved roads, wide enough to allow two cars to pass 2 Well maintained gravel or paved road, wide enough for two cars to pass 1
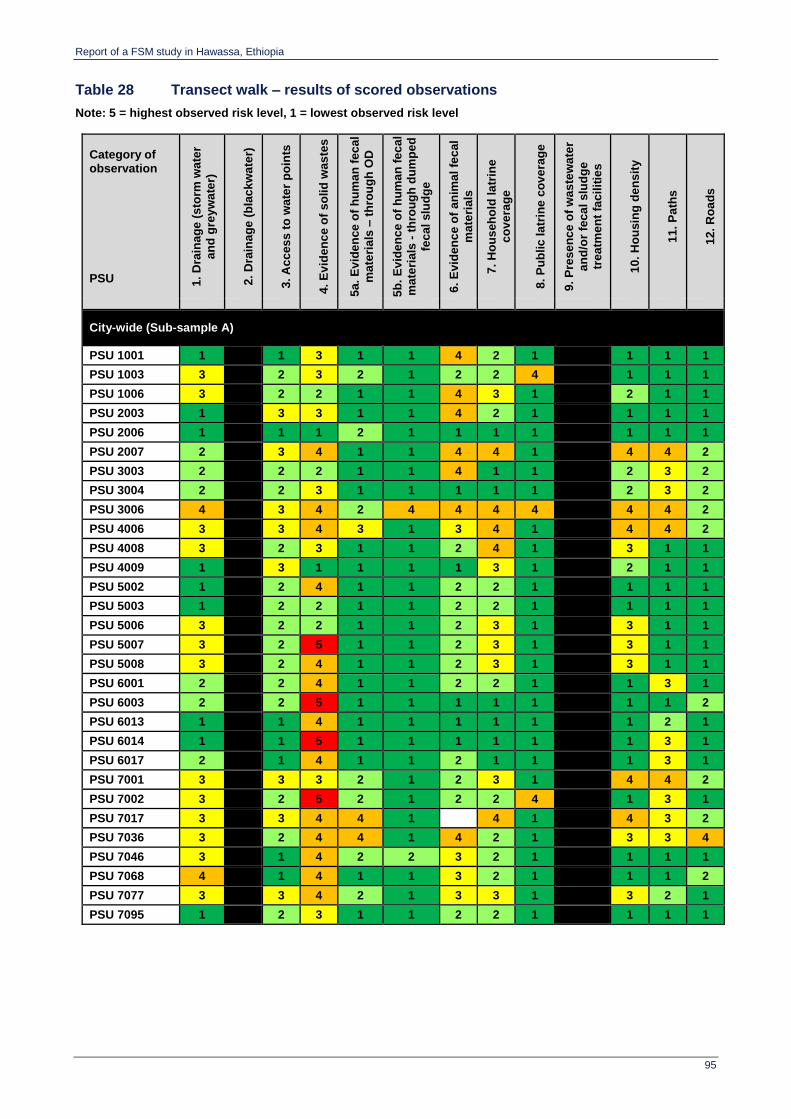
Report of a FSM study in Hawassa, Ethiopia
95
Table 28 Transect walk – results of scored observations
Note: 5 = highest observed risk level, 1 = lowest observed risk level
Category of observation PSU 1
. D
rain
ag
e (
sto
rm w
ate
r
an
d g
rey
wa
ter)
2.
Dra
ina
ge
(b
lac
kw
ate
r)
3.
Ac
ces
s t
o w
ate
r p
oin
ts
4.
Ev
iden
ce
of
so
lid
wa
ste
s
5a
. E
vid
en
ce
of
hu
ma
n f
ec
al
ma
teri
als
– t
hro
ug
h O
D
5b
. E
vid
en
ce o
f h
um
an
fe
ca
l
ma
teri
als
- t
hro
ug
h d
um
pe
d
fec
al
slu
dg
e
6.
Ev
iden
ce
of
an
ima
l fe
ca
l
ma
teri
als
7.
Ho
us
eh
old
la
trin
e
co
ve
rag
e
8.
Pu
blic
la
trin
e c
ov
era
ge
9.
Pre
se
nc
e o
f w
as
tew
ate
r
an
d/o
r fe
ca
l slu
dg
e
tre
atm
en
t fa
cil
itie
s
10
. H
ou
sin
g d
en
sit
y
11
. P
ath
s
12
. R
oa
ds
City-wide (Sub-sample A)
PSU 1001 1 1 3 1 1 4 2 1 1 1 1
PSU 1003 3 2 3 2 1 2 2 4 1 1 1
PSU 1006 3 2 2 1 1 4 3 1 2 1 1
PSU 2003 1 3 3 1 1 4 2 1 1 1 1
PSU 2006 1 1 1 2 1 1 1 1 1 1 1
PSU 2007 2 3 4 1 1 4 4 1 4 4 2
PSU 3003 2 2 2 1 1 4 1 1 2 3 2
PSU 3004 2 2 3 1 1 1 1 1 2 3 2
PSU 3006 4 3 4 2 4 4 4 4 4 4 2
PSU 4006 3 3 4 3 1 3 4 1 4 4 2
PSU 4008 3 2 3 1 1 2 4 1 3 1 1
PSU 4009 1 3 1 1 1 1 3 1 2 1 1
PSU 5002 1 2 4 1 1 2 2 1 1 1 1
PSU 5003 1 2 2 1 1 2 2 1 1 1 1
PSU 5006 3 2 2 1 1 2 3 1 3 1 1
PSU 5007 3 2 5 1 1 2 3 1 3 1 1
PSU 5008 3 2 4 1 1 2 3 1 3 1 1
PSU 6001 2 2 4 1 1 2 2 1 1 3 1
PSU 6003 2 2 5 1 1 1 1 1 1 1 2
PSU 6013 1 1 4 1 1 1 1 1 1 2 1
PSU 6014 1 1 5 1 1 1 1 1 1 3 1
PSU 6017 2 1 4 1 1 2 1 1 1 3 1
PSU 7001 3 3 3 2 1 2 3 1 4 4 2
PSU 7002 3 2 5 2 1 2 2 4 1 3 1
PSU 7017 3 3 4 4 1 4 1 4 3 2
PSU 7036 3 2 4 4 1 4 2 1 3 3 4
PSU 7046 3 1 4 2 2 3 2 1 1 1 1
PSU 7068 4 1 4 1 1 3 2 1 1 1 2
PSU 7077 3 3 4 2 1 3 3 1 3 2 1
PSU 7095 1 2 3 1 1 2 2 1 1 1 1

Report of a FSM study in Hawassa, Ethiopia
96
Category of observation PSU 1
. D
rain
ag
e (
sto
rm w
ate
r
an
d g
rey
wa
ter)
2.
Dra
ina
ge
(b
lac
kw
ate
r)
3.
Ac
ces
s t
o w
ate
r p
oin
ts
4.
Ev
iden
ce
of
so
lid
wa
ste
s
5a
. E
vid
en
ce
of
hu
ma
n f
ec
al
ma
teri
als
– t
hro
ug
h O
D
5b
. E
vid
en
ce o
f h
um
an
fe
ca
l
ma
teri
als
- t
hro
ug
h d
um
pe
d
fec
al
slu
dg
e
6.
Ev
iden
ce
of
an
ima
l fe
ca
l
ma
teri
als
7.
Ho
us
eh
old
la
trin
e
co
ve
rag
e
8.
Pu
blic
la
trin
e c
ov
era
ge
9.
Pre
se
nc
e o
f w
as
tew
ate
r
an
d/o
r fe
ca
l slu
dg
e
tre
atm
en
t fa
cil
itie
s
10
. H
ou
sin
g d
en
sit
y
11
. P
ath
s
12
. R
oa
ds
Low-income areas only (Sub-sample B)
PSU 2005 2 2 5 2 1 5 4 4 3 3 2
PSU 4001 1 2 4 1 1 3 2 1 4 1 1
PSU 4007 3 3 3 2 1 3 4 3 4 1 1
PSU 6009 3 2 4 2 1 2 3 3 3 1 1
PSU 7004 3 2 5 1 1 2 3 1 4 4 1
PSU 7024 3 3 4 2 1 4 4 1 4 3 2
PSU 7043 3 2 2 1 1 2 2 1 3 3 2
PSU 7071 3 3 4 2 1 4 5 1 4 4 2
PSU 7080 3 3 4 3 1 3 4 1 4 4 2
PSU 70104 1 2 1 1 1 1 1 2 1 1

Report of a FSM study in Hawassa, Ethiopia
97
Annex D Links to data collection instruments
This annex will contain hyperlinks to all data collection instruments (e.g. household questionnaire)
once the full World Bank study is completed.

Fecal Sludge Management: Diagnostics
for Service Delivery in Urban Areas
Case study in Lima, Peru
Supporting document Final April 201


Fecal Sludge Management in Lima – Case Study Report
i
Acknowledgements
This report is a city case study of a World Bank Economic and Sector Work on Fecal Sludge
Management: Diagnostics for Service Delivery in Urban Areas (P146128). The task team leaders
were Isabel Blackett and Peter Hawkins. Other World Bank task team members were Zael Sanz
Uriarte, Ravikumar Joseph, Chris Heymans and Guy Hutton.
This report is based on work conducted between January 2014 and February 2016 by Oxford Policy
Management (OPM) in partnership with the Water, Engineering and Development Centre (WEDC)
at Loughborough University. The core research team was Ian Ross (OPM), Rebecca Scott (WEDC),
Ana Mujica (OPM) and Mike Smith (WEDC). The broader team who contributed to the study included
Zach White, Rashid Zaman and Simon Brook from OPM, as well as Andy Cotton and Sam Kayaga
from WEDC. Andy Peal (independent consultant) also contributed to certain aspects of the
methodology.
Key inputs in terms of data collection for the Lima study were also made by Akut Peru under the
leadership of Heike Hoffmann. In addition, Ruddy Noriega (World Bank consultant) interviewed key
informants, whom we also thank for his time.
Detailed feedback on early drafts was received from Zael Sanz and Guy Hutton of the World Bank.
Helpful feedback was also received from Lima WASH sector stakeholders through workshops in
October 2015 and March 2016.

Fecal Sludge Management in Lima – Case Study Report
ii
Executive summary
Introduction
This report summarises the main findings of a case study on faecal sludge management in Lima,
Peru. It is part of the project entitled ‘Fecal Sludge Management: Diagnostics for Service Delivery in
Poor Urban Areas’, funded by the World Bank Water and Sanitation Programme (WSP). There are
five city case studies as part of this project (Balikpapan, Dhaka, Freetown, Lima and Santa Cruz).
The specific objectives of the Lima study were:
To provide quantitative and qualitative data on the sanitation situation in Lima from a socio-
economic perspective, specifically as it relates to FSM.
To do the above in such a way that the data is representative of poor non-sewered areas of
the city.
To provide initial recommendations to guide discussions around future interventions in the
sanitation sector in Lima, by contributing credible data and analysis.
To inform the development of analytical tools and guidelines for using them, by “road-testing”
draft tools using primary data collection.
Methodology
The study followed an overall research framework developed as part of the inception period, which
set out research questions and sub-questions. Data collection instruments were then developed so
as to answer these questions. Six data collection instruments were used in Lima, four quantitative
and two qualitative. The quantitative instruments were a household survey, transect walks,
observation of service provider practices, and tests of fecal sludge characteristics. The qualitative
instruments were key informant interviews and focus group discussions.
The lead consultant team led on methodology design and data analysis, while data collection was
undertaken by separately-contracted consultants under the leadership of WSP. All data collection
was undertaken by Akut Peru, with the exception of key informant interviews which were undertaken
by a WSP short-term consultant.
The household survey primarily aimed to collect data from households using on-site sanitation
regarding their current use and preferences for future FSM services. The sampling was carefully
planned so as to allow conclusions to be drawn about non-sewered areas of the city as a whole and
lowest-income non-sewered areas in particular. The transect walks aimed to enable participants to
make a subjective and qualitative assessment of physical and environmental conditions within a
community. The observation protocol for service providers involved making visual inspections about
fecal sludge (FS) from pits or tanks to final disposal. The tests of fecal sludge characteristics were
carried out at three stages: (i) in containment, (ii) during removal, and (iii) after treatment. The key
informant interviews aimed to address key questions about how both the ‘enabling environment’ and
the ‘operating environment’ affects FSM services (past, current and future). Finally, the focus group
discussions aimed to gather qualitative data that complements, validates, or challenges the
conclusions drawn from the household survey data.
Sampling for most quantitative instruments was derived from the sampling for the household survey,
for which there were two sub-samples. For sub-sample A, the Primary Sampling Units (PSUs) were
Unidades Administrativas Locales (UALs), an administrative unit akin to “urban neighbourhoods”,

Fecal Sludge Management in Lima – Case Study Report
iii
which were selected so as to allow estimates which were representative of non-sewered areas of
Lima as a whole. For sub-sample B, the PSUs were lowest-income neighbourhoods, purposively
selected among the 33 low-income and priority areas for SEDAPAL (i.e. areas that are unlikely to
get access to sewerage in the next 4 years). There are 720 households overall, equally divided
between the two sub-samples.
Results
The table below summarises some key indicators from the household survey.
Indicator Non-sewered areas
Use of sanitation
Households using improved sanitation (excluding ‘shared improved’)
76%
Households using improved sanitation (including ‘shared improved’)
84%
Type of containment
Households using a toilet discharging directly to an unlined pit
96%
Households using a toilet discharging directly to a drain or ditch
3%
Emptying
Households who have abandoned (sealed and unsealed) their previous pit after it filled up
99%
Households who experienced their current pit / tank filling up
3%
Households who have emptied their current pit / tanks after it filled up
90%
The data in the table above paints a picture of almost all fecal sludge ending up in unlined pits, of
which all are usually abandoned after they fill up. It is therefore not surprising that a market for FSM
services does not exist. These key data are reflected in the fecal waste flow diagrams (FWFDs) in
the body of the report. The non-sewered areas FWFD is reproduced below.
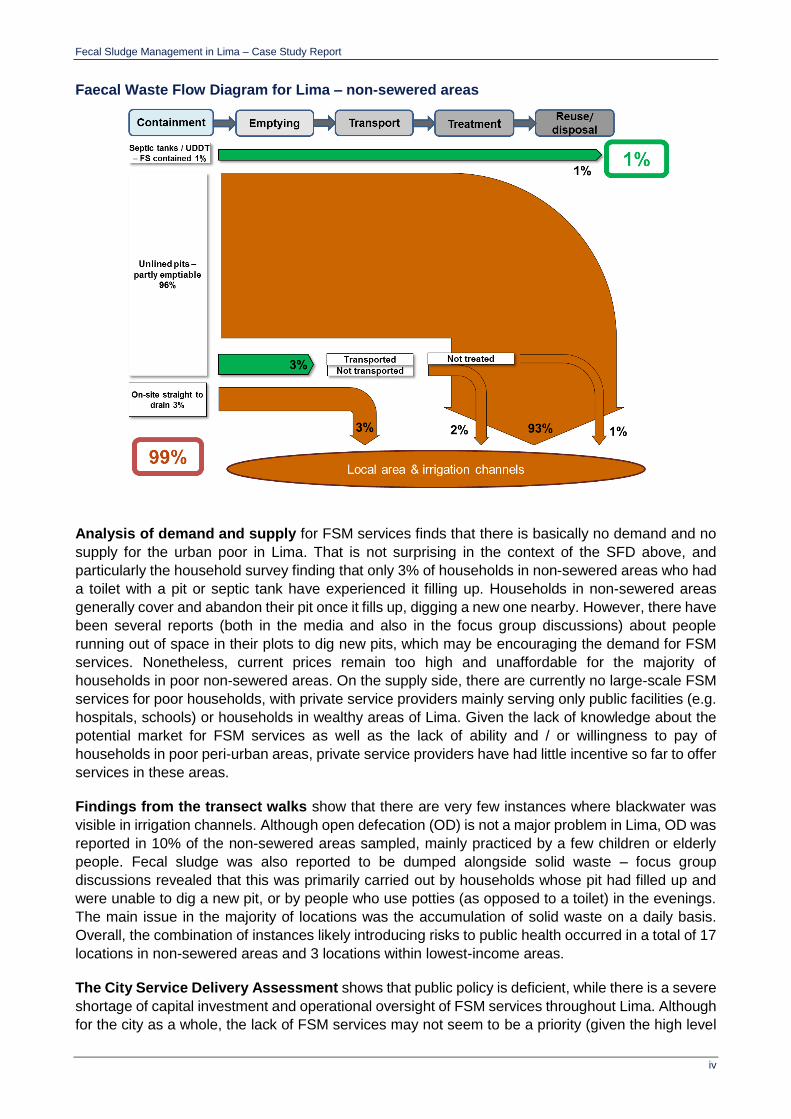
Fecal Sludge Management in Lima – Case Study Report
iv
Faecal Waste Flow Diagram for Lima – non-sewered areas
Analysis of demand and supply for FSM services finds that there is basically no demand and no
supply for the urban poor in Lima. That is not surprising in the context of the SFD above, and
particularly the household survey finding that only 3% of households in non-sewered areas who had
a toilet with a pit or septic tank have experienced it filling up. Households in non-sewered areas
generally cover and abandon their pit once it fills up, digging a new one nearby. However, there have
been several reports (both in the media and also in the focus group discussions) about people
running out of space in their plots to dig new pits, which may be encouraging the demand for FSM
services. Nonetheless, current prices remain too high and unaffordable for the majority of
households in poor non-sewered areas. On the supply side, there are currently no large-scale FSM
services for poor households, with private service providers mainly serving only public facilities (e.g.
hospitals, schools) or households in wealthy areas of Lima. Given the lack of knowledge about the
potential market for FSM services as well as the lack of ability and / or willingness to pay of
households in poor peri-urban areas, private service providers have had little incentive so far to offer
services in these areas.
Findings from the transect walks show that there are very few instances where blackwater was
visible in irrigation channels. Although open defecation (OD) is not a major problem in Lima, OD was
reported in 10% of the non-sewered areas sampled, mainly practiced by a few children or elderly
people. Fecal sludge was also reported to be dumped alongside solid waste – focus group
discussions revealed that this was primarily carried out by households whose pit had filled up and
were unable to dig a new pit, or by people who use potties (as opposed to a toilet) in the evenings.
The main issue in the majority of locations was the accumulation of solid waste on a daily basis.
Overall, the combination of instances likely introducing risks to public health occurred in a total of 17
locations in non-sewered areas and 3 locations within lowest-income areas.
The City Service Delivery Assessment shows that public policy is deficient, while there is a severe
shortage of capital investment and operational oversight of FSM services throughout Lima. Although
for the city as a whole, the lack of FSM services may not seem to be a priority (given the high level

Fecal Sludge Management in Lima – Case Study Report
v
of sewerage coverage), there are around 800,000 people in poor areas without a real and
sustainable solution to their daily sanitation needs. Sustainable solutions will only come about when
an FSM Framework translates into clearly defined, capacitated and financed action. This requires
recognition of the scale of the problem, dialogue and engagement of public, private and civil society
bodies to ensure appropriate infrastructure and services can be systematically developed and
adapted to respond to the various contextual challenges of the city. Segmentation and lack of
coordination is already a key constraint in the provision of basic services, so bringing all key
stakeholders together and aiming at reaching a consensus on a course of action, is an imperative.
A clear definition and agreement of the roles of different stakeholders along the sanitation service
chain is also required, with a particular focus on developing adequate containment and treatment
frameworks, and strengthening both emptying and transport components of the FSM chain.
Finally, a Prognosis for Change shows that the current incentives discourage actions from both
public and private stakeholders. On one hand, responsibilities for FSM at both national and local
levels have not been clearly designated, and thus both planning and financing for FSM are unlikely
to happen if no stakeholder can be held accountable for investments and results. Evidence from KIIs
also suggests that, although there seems to be no political opposition to the development of FSM
services, there is no political will either to carry this forwards. On the other hand, without a clear
demand (current and future) for FSM services, private service providers are unwilling to develop a
market that may be unprofitable. Moreover, households may be reluctant to invest in upgrading their
containment facilities, partly because many regard sewerage as the only long-term option, but also
because the lack of land tenure and ownership generally discourages investment. Change is
achievable, but interventions will not be successful unless they address the incentives which deliver
the current status quo.

Fecal Sludge Management in Lima – Case Study Report
vi
Table of contents
Acknowledgements i
Executive summary ii
Introduction ii
Methodology ii
Results iii
List of tables and figures ix
List of abbreviations xi
1 Introduction and Research Framework 1
1.1 About this report 1
1.2 Study rationale and objectives 1
1.3 Research framework 2
1.4 Report structure 3
2 Background to Lima City 5
2.1 Lima overview 5
2.2 Lima’s sanitation context 6
2.3 Lima’s FSM context 6
3 Fecal Waste Flow Diagrams 8
3.1 Introduction 8
3.2 Methodology 9
3.3 Results 12
3.3.1 Household survey results as an input to the SFD 12 3.3.2 Presentation of SFDs 15
3.4 Implications of the SFDs for FSM in Lima 17
4 Public health risk assessment 18
4.1 Introduction and methodology 18
4.2 Results: risks through stages of the FSM service chain 18
4.2.1 Containment: household facilities, levels of sharing and practices 18 4.2.2 Emptying: household practices around emptying services 20 4.2.3 Emptying, transport and disposal: observed practices and risks 20
4.3 Results: risks from wider environmental contamination 22
4.4 Implications: assessing the public health risk from poor FSM 24
5 FSM services: potential demand and supply management 25
5.1 Introduction 25
5.2 Methodology 26
5.2.1 Demand 26 5.2.2 Supply 28
5.3 Findings: household demand for services 28
5.3.1 Determinants of household demand 28 5.3.2 Barriers faced by households in lowest-income areas to obtain FSM services 33
5.4 Findings: supply of FSM services 34
5.4.1 Services effectively supplied 34 5.4.2 Service provider capacity 34
6 Fecal sludge reuse options 36

Fecal Sludge Management in Lima – Case Study Report
vii
6.1 Fecal sludge characteristics 36
6.2 Availability and access to fecal sludge services 37
6.2.1 Treatment 38 6.2.2 Re-use 38 6.2.3 Possible future reuse options 39
7 City Service Delivery Assessment 40
7.1 Introduction 40
7.2 Methodology 40
7.3 Findings 43
7.3.1 Enabling 43 7.3.2 Developing 43 7.3.3 Sustaining 43 7.3.4 Implications of the CSDA scorecard 44
8 Prognosis for Change 45
8.1 Introduction 45
8.2 Methodology 46
8.3 Findings 46
8.3.1 Lima’s FSM context 46 8.3.2 Mapping institutional responsibilities 49 8.3.3 The influence and interests of stakeholders in FSM reform 54
8.4 Illustrating the incentive problem 56
8.5 Implications for FSM in Lima 57
9 Intervention options 59
9.1 Identified weaknesses 59
9.2 Proposed solutions 60
9.3 Program design and prioritisation 66
9.3.1 Enabling: policy, planning and budget 66 9.3.2 Developing: equity and outputs 66 9.3.3 Sustaining: O&M, expansion and service outcomes 67 9.3.4 Resulting prioritised interventions: guidelines for action 67
10 Economic analysis of intervention options 71
10.1 Introduction 71
10.2 Methodology 71
10.3 Data sources 72
10.4 Hypothetical intervention options 72
10.5 Design populations 73
10.6 Technology cost analysis 73
10.7 Damage costs and cost-effectiveness analysis 76
10.8 Concluding remarks 77
11 Conclusion 78
References 80
Annex A Map of sampled areas 81
Annex B Methodology 82
B.1 Overall design 82 B.2 Sampling 84 B.2.1 Household survey 84 B.2.2 Other instruments 89

Fecal Sludge Management in Lima – Case Study Report
viii
B.3 Fieldwork implementation 89 B.4 Limitations 90
Annex C Fecal waste flow matrices 91
Annex D CSDA scoring table criteria 93
Annex E Public health risk assessment: scoring used 102
Annex F Additional tables for the economic analysis of interventions 106

Fecal Sludge Management in Lima – Case Study Report
ix
List of tables and figures
Figure 1 Human settlements in San Juan de Lurigancho ............................................................. 5 Figure 2 The sanitation service chain .......................................................................................... 6 Figure 3 Fecal Waste Flow Matrix template ............................................................................... 11 Figure 4 Sanitation facilities in non-sewered areas of Lima ....................................................... 13 Figure 5 Faecal Waste Flow Diagram for Lima – city-wide ........................................................ 16 Figure 6 Faecal Waste Flow Diagram for Lima – non-sewered areas ........................................ 17 Figure 7 Solid waste disposal areas in San Juan de Miraflores ................................................. 19 Figure 8 Urine diversion facility in San Juan de Miraflores ......................................................... 22 Figure 9 Satisfaction with characteristics of the sanitation facility .............................................. 32 Figure 10 CSDA scorecard for Lima ............................................................................................ 42 Figure 11 Key concepts in PFC assessment ............................................................................... 46 Figure 12 A woman digging an unlined pit in Puente Piedra ........................................................ 47 Figure 13 Stakeholder matrix for improving containment and emptying practices ........................ 54 Figure 14 Process mapping for a pit filling up .............................................................................. 57 Figure 15 Fecal waste flows in non-sewered areas: results and problems ................................... 59 Figure 16 Total annualised costs per household for different technologies ................................. 74 Figure 17 Annualised cost components of the sanitation interventions ....................................... 75
Table 1 FSM project components ............................................................................................... 3 Table 2 Type of sanitation service by wealth quintiles (%) .......................................................... 6 Table 3 Roles assigned to key FSM stakeholders ...................................................................... 7 Table 4 Sanitation facility used, by technology type .................................................................. 12 Table 5 Sanitation facility use, by JMP category ....................................................................... 13 Table 6 Management of blackwater – where toilets discharge to .............................................. 14 Table 7 Action after previous pit / tank used filled up ................................................................ 15 Table 8 Prevalence of diarrhoea among respondents in the last 2 weeks................................. 19 Table 9 Physical determinants of demand for FSM services..................................................... 26 Table 10 Economic determinants of demand for FSM services .................................................. 27 Table 11 Scoring for housing density, paths and roads from transect walks ............................... 29 Table 12 Type of residence occupied ......................................................................................... 29 Table 13 Accessibility of toilet for emptying equipment ............................................................... 30 Table 14 Average time taken for pit or tank to fill up ................................................................... 30 Table 15 Number of people using the same sanitation facility .................................................... 31 Table 16 Average amount paid for emptying services ................................................................ 32 Table 17 Intended action after current pit / tank fills up ............................................................... 33 Table 18 Sanitation facilities for fecal sludge samples from on-site sanitation facilities in Lima . 36 Table 19 Characteristics of fecal sludge from on-site sanitation facilities in Lima ....................... 37 Table 20 Characteristics of fresh and treated feces from urine-diversion latrines in Lima ........... 39 Table 21 CSDA framework for FSM ........................................................................................... 40 Table 22 Example of an CSDA question, criteria and scoring ..................................................... 41 Table 23 Mapping institutional responsibilities for FSM .............................................................. 51 Table 24 Technical interventions to improve the service chain, based on existing system type .. 64 Table 25 Service delivery action framework for poor non-sewered areas in Lima ....................... 69 Table 26 Type of sanitation facilities and containment for lowest-income non-sewered areas .... 73 Table 27 Damage costs of poor sanitation.................................................................................. 76 Table 28 Cost-effectiveness analysis (Peruvian Nuevos Soles and USD) .................................. 77 Table 29 Summary table of data collection instruments .............................................................. 82 Table 30 Sampling frame for Lima .............................................................................................. 85 Table 31 Districts and UALs included in sub-sample A ............................................................... 87 Table 32 Districts and UALs included in sub-sample B ............................................................... 88 Table 33 Fecal waste flow matrix – city-wide sample ................................................................. 91 Table 34 Fecal waste flow matrix – non-sewered sample ........................................................... 92 Table 35 Risk scores along the service chain ........................................................................... 102 Table 36 Risk of immediate human exposure with FS, at each step of the process .................. 103

Fecal Sludge Management in Lima – Case Study Report
x
Table 37 Transect walk – results of scored observations .......................................................... 104 Table 38 Design parameters for all intervention options ........................................................... 106 Table 39 Technology costing data (Peruvian Nuevos Soles) .................................................... 107 Table 40 Technology costing data (USD) ................................................................................. 108

Fecal Sludge Management in Lima – Case Study Report
xi
List of abbreviations
ATP Ability to Pay
CSDA City Service Delivery Assessment
DHS Demographic and Health Survey
DESA Dirección Ejecutiva de Salud Ambiental (Executive Directorate of Environmental
Health)
DIGESA Dirección General de Salud Ambiental (General Directorate of Environmental Health)
ENAHO Encuesta Nacional de Hogares (National Household Survey)
ESI Economics of Sanitation Initiative
FGD Focus Group Discussion
FS Fecal Sludge
FSM Fecal Sludge Management
FWFD Fecal Waste Flow Diagram
JMP WHO / UNICEF Joint Monitoring Programme
KII Key Informant Interview
MoE Ministry of Environment
MoHCS Ministry of Housing, Construction and Sanitation
NGO Non-Governmental Organisation
ODI Overseas Development Institute
OPM Oxford Policy Management
OSS On-Site Sanitation
PFC Prognosis for Change
PHRA Public Health Risk Assessment
PSU Primary Sampling Unit
RF Research Framework
SEDAPAL Servicio de Alcantarillado y Agua Potable de Lima (Lima Sewerage and Water Supply Service)
SFD Shit-Flow Diagram
SSU Secondary Sampling Unit
SUNASS Superintendencia Nacional de Servicios de Saneamiento (National Superintendence of Sanitation Services)
SWM Soild Waste Management
TOR Terms of Reference
TW Transect Walk
UAL Unidad Administrativa Local
UASB Up-flow Anaerobic Sludge Blanket
UDDT Urine-Diverting Dry Toilet
UNICEF United Nations Children’s Fund
WB World Bank

Fecal Sludge Management in Lima – Case Study Report
xii
WEDC Water, Engineering and Development Centre, Loughborough University
WHO World Health Organisation
WSP Water and Sanitation Programme
WTP Willingness to Pay
Fecal Sludge Management in Lima – Case Study Report
1
1 Introduction and Research Framework
1.1 About this report
This report summarises the findings of a case study on fecal sludge management in Lima, Peru. It
is part of the project entitled ‘Fecal Sludge Management: Diagnostics for Service Delivery in Poor
Urban Areas’, hereafter “the FSM research project”. This work is funded by the World Bank Water
and Sanitation Programme (WSP). There are five city case studies as part of this project
(Balikpapan, Dhaka, Hawassa, Lima and Santa Cruz).
The project is led by Oxford Policy Management (OPM) in partnership with the Water, Engineering
and Development Centre (WEDC) at Loughborough University. The full TOR for the project can be
found here. The overall objective of this assignment is to “work with the WSP urban sanitation team
to develop the methodology, design and survey instruments, undertake analysis of data collected
from five field case studies (linked to World Bank operations projects), refine the diagnostic tools,
and develop decision-making tools and guidelines for the development of improved FSM services.”
Specific objectives of the Lima case study are listed in the next section.
This document is part of a project deliverable designed to be internal at this stage. Therefore, it does
not contain much background information, and the assumed audience is the WSP project team and
other stakeholders familiar with the Lima FSM context. The inception report is available here for
other readers, which contains more background information on the project and the methodology.
The report’s structure is detailed below. It begins with a background to the research and the city,
moving into several sections analysing the urban sanitation context, which are not specific to FSM.
Thereafter, the report’s focus is on FSM services in particular.
1.2 Study rationale and objectives
It is very common for poor people living in urban areas of most low-income countries to either use
on-site sanitation facilities or defecate in the open. Even when improved on-site options are used to
contain feces, there generally exist few services for collection, transport and disposal or treatment
of the resulting fecal sludge. Fewer opportunities for resource recovery through end-use of fecal
sludge exist. The service delivery gaps within and between stages of the sanitation service chain
become more apparent as sanitation coverage increases in poor urban areas. Failure to ensure
strong links throughout the fecal sludge management (FSM) service chain results in untreated fecal
sludge (FS) contaminating the environment, with serious implications for human health.
Despite increasing demands for FSM services, there are few tools and guidelines to help city
planners navigate complex FSM situations. This study aims to build on existing frameworks and
tools, in particular the City Service Delivery Assessment (CSDA) scorecard, Fecal Waste Flow
Diagram (FWFD), and the Economics of Sanitation Initiative (ESI) toolkit. The aim is to produce
diagnostic and decision-making tools that are based in tried-and-tested strategic planning
approaches and frameworks, with a focus on practicality. Critically, updates to the tools and
guidelines will be based on primary data collection in five cities. In most of the cities, this is supported
by interaction with city stakeholders involved in ongoing World Bank lending. Acknowledging the
difficulty of reforming FSM services in cities, the political economy questions around FSM are
explicitly included as part of the overall analysis.
The specific objectives of the study are:
Fecal Sludge Management in Lima – Case Study Report
2
To provide quantitative and qualitative data on the sanitation situation in Lima from a socio-
economic perspective, specifically as it relates to FSM;
To do the above in such a way that the data is representative of the non-sewered areas of
the city as a whole but also provides a separate picture of the situation in lowest-income non-
sewered areas;
To provide initial recommendations to guide discussions around future interventions in the
sanitation sector in Lima, by contributing credible data and analysis; and
To inform the development of analytical tools and guidelines, by “road-testing” draft tools
using primary data collection.
The study was therefore primarily socio-economic rather than technical. It did not aim to carry out
technical inspections of infrastructure or produce detailed maps with neighbourhood-level analysis
and recommendations. For those who have previously worked in the sanitation sector in Lima, there
may be few surprises, but the report does offer representative data to back-up what has previously
been reported in smaller or more general studies.
1.3 Research framework
During the inception stage, the OPM/WEDC team developed a Research Framework (RF), based
on the overarching research questions implicit in the TOR and draft research protocol. From these
questions, a logical set of project components was developed. These became the basis for the
design of data collection instruments that would enable information to be collected for the indicators
making up each component.
The approach is to place all components – as well as ensuing results – of the study within the context
of the FSM service chain, to optimise its relevance and effectiveness. This is clear from the full
version of the RF in the Inception Report, with all components and questions arranged along the
service chain. There is not enough space here to go through the research questions, but the
Research Framework can be downloaded from a link available in Annex F.
The initial structure of components from the Inception Report is reflected in Table 1 below. The study
methodology is described in Annex B.
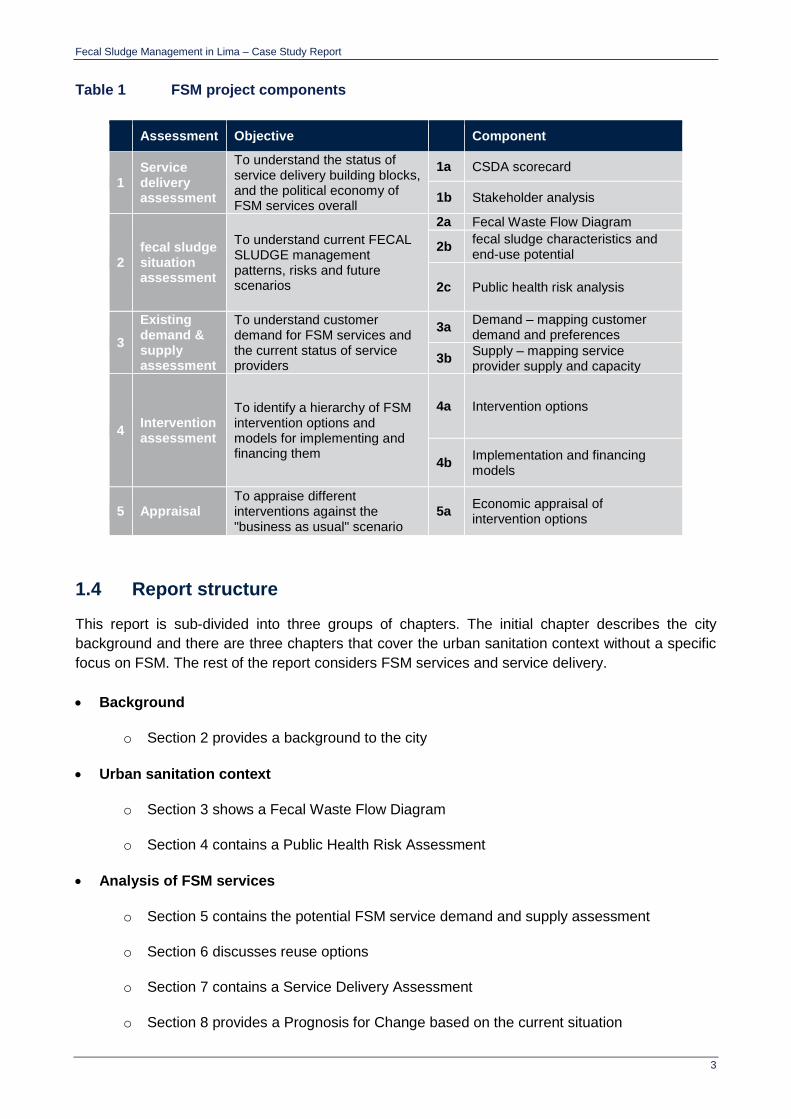
Fecal Sludge Management in Lima – Case Study Report
3
Table 1 FSM project components
Assessment Objective Component
1 Service delivery assessment
To understand the status of service delivery building blocks, and the political economy of FSM services overall
1a CSDA scorecard
1b Stakeholder analysis
2 fecal sludge situation assessment
To understand current FECAL SLUDGE management patterns, risks and future scenarios
2a Fecal Waste Flow Diagram
2b fecal sludge characteristics and end-use potential
2c Public health risk analysis
3
Existing demand & supply assessment
To understand customer demand for FSM services and the current status of service providers
3a Demand – mapping customer demand and preferences
3b Supply – mapping service provider supply and capacity
4 Intervention assessment
To identify a hierarchy of FSM intervention options and models for implementing and financing them
4a Intervention options
4b Implementation and financing models
5 Appraisal To appraise different interventions against the "business as usual" scenario
5a Economic appraisal of intervention options
1.4 Report structure
This report is sub-divided into three groups of chapters. The initial chapter describes the city
background and there are three chapters that cover the urban sanitation context without a specific
focus on FSM. The rest of the report considers FSM services and service delivery.
Background
o Section 2 provides a background to the city
Urban sanitation context
o Section 3 shows a Fecal Waste Flow Diagram
o Section 4 contains a Public Health Risk Assessment
Analysis of FSM services
o Section 5 contains the potential FSM service demand and supply assessment
o Section 6 discusses reuse options
o Section 7 contains a Service Delivery Assessment
o Section 8 provides a Prognosis for Change based on the current situation
Fecal Sludge Management in Lima – Case Study Report
4
o Section 9 discusses intervention options
o Section 10 provides an economic analysis of the intervention options
o Section 11 concludes
Annexes
o Annex A shows a map of the sampled areas
o Annex B summarises the study methodology
o Annex C contains the detailed Fecal Waste Flow matrices
o Annex D provides the full CSDA scoring table
o Annex E provides more information on the public health risk assessment
o Annex F contains further tables on the economic analysis
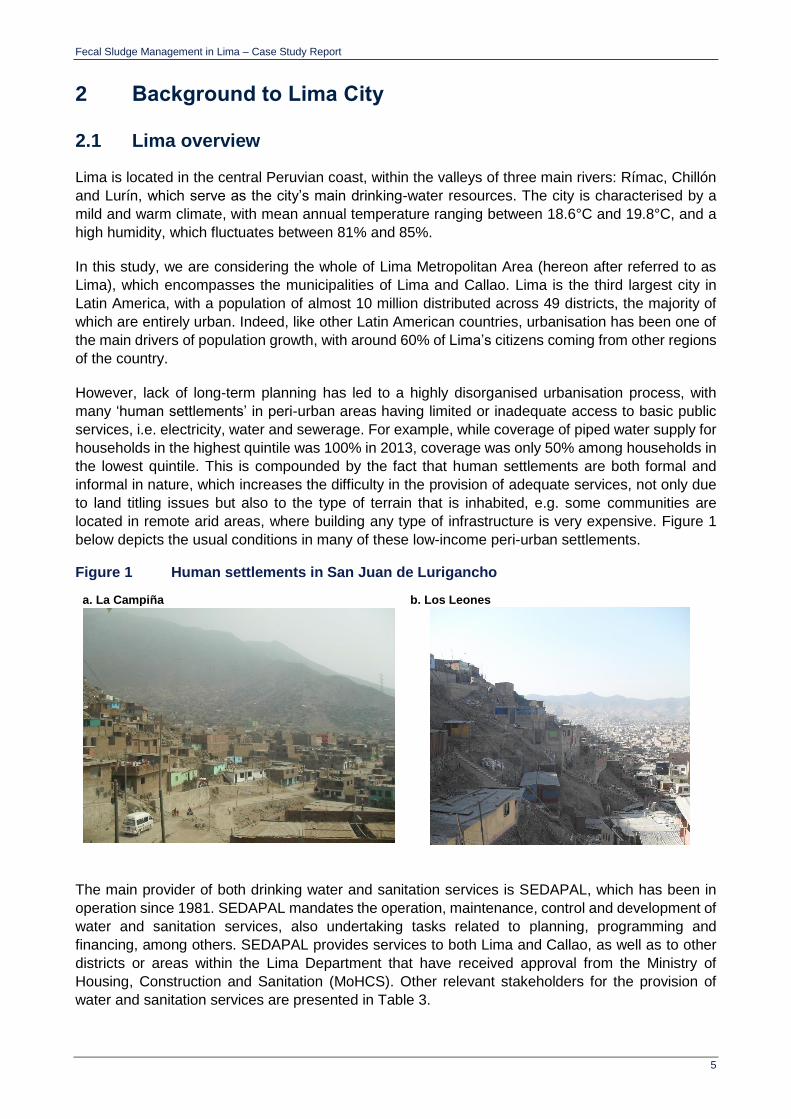
Fecal Sludge Management in Lima – Case Study Report
5
2 Background to Lima City
2.1 Lima overview
Lima is located in the central Peruvian coast, within the valleys of three main rivers: Rímac, Chillón
and Lurín, which serve as the city’s main drinking-water resources. The city is characterised by a
mild and warm climate, with mean annual temperature ranging between 18.6°C and 19.8°C, and a
high humidity, which fluctuates between 81% and 85%.
In this study, we are considering the whole of Lima Metropolitan Area (hereon after referred to as
Lima), which encompasses the municipalities of Lima and Callao. Lima is the third largest city in
Latin America, with a population of almost 10 million distributed across 49 districts, the majority of
which are entirely urban. Indeed, like other Latin American countries, urbanisation has been one of
the main drivers of population growth, with around 60% of Lima’s citizens coming from other regions
of the country.
However, lack of long-term planning has led to a highly disorganised urbanisation process, with
many ‘human settlements’ in peri-urban areas having limited or inadequate access to basic public
services, i.e. electricity, water and sewerage. For example, while coverage of piped water supply for
households in the highest quintile was 100% in 2013, coverage was only 50% among households in
the lowest quintile. This is compounded by the fact that human settlements are both formal and
informal in nature, which increases the difficulty in the provision of adequate services, not only due
to land titling issues but also to the type of terrain that is inhabited, e.g. some communities are
located in remote arid areas, where building any type of infrastructure is very expensive. Figure 1
below depicts the usual conditions in many of these low-income peri-urban settlements.
Figure 1 Human settlements in San Juan de Lurigancho
a. La Campiña b. Los Leones
The main provider of both drinking water and sanitation services is SEDAPAL, which has been in
operation since 1981. SEDAPAL mandates the operation, maintenance, control and development of
water and sanitation services, also undertaking tasks related to planning, programming and
financing, among others. SEDAPAL provides services to both Lima and Callao, as well as to other
districts or areas within the Lima Department that have received approval from the Ministry of
Housing, Construction and Sanitation (MoHCS). Other relevant stakeholders for the provision of
water and sanitation services are presented in Table 3.
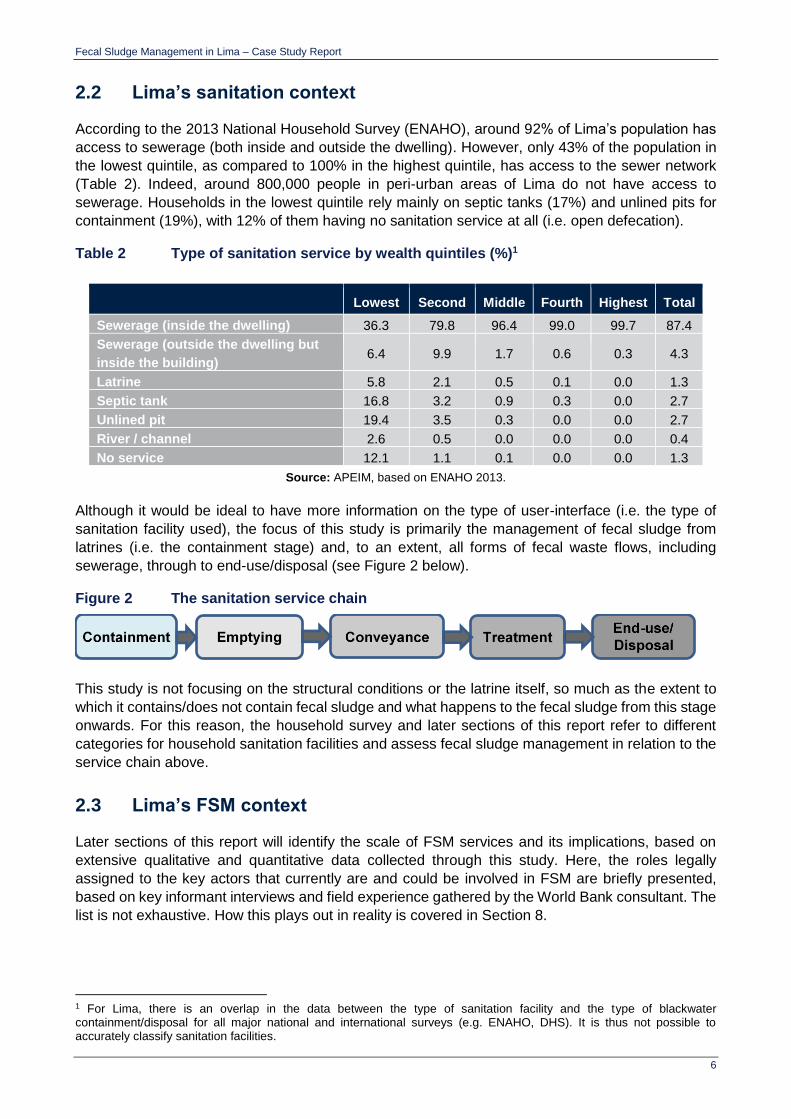
Fecal Sludge Management in Lima – Case Study Report
6
2.2 Lima’s sanitation context
According to the 2013 National Household Survey (ENAHO), around 92% of Lima’s population has
access to sewerage (both inside and outside the dwelling). However, only 43% of the population in
the lowest quintile, as compared to 100% in the highest quintile, has access to the sewer network
(Table 2). Indeed, around 800,000 people in peri-urban areas of Lima do not have access to
sewerage. Households in the lowest quintile rely mainly on septic tanks (17%) and unlined pits for
containment (19%), with 12% of them having no sanitation service at all (i.e. open defecation).
Table 2 Type of sanitation service by wealth quintiles (%)1
Lowest Second Middle Fourth Highest Total
Sewerage (inside the dwelling) 36.3 79.8 96.4 99.0 99.7 87.4
Sewerage (outside the dwelling but
inside the building) 6.4 9.9 1.7 0.6 0.3 4.3
Latrine 5.8 2.1 0.5 0.1 0.0 1.3
Septic tank 16.8 3.2 0.9 0.3 0.0 2.7
Unlined pit 19.4 3.5 0.3 0.0 0.0 2.7
River / channel 2.6 0.5 0.0 0.0 0.0 0.4
No service 12.1 1.1 0.1 0.0 0.0 1.3
Source: APEIM, based on ENAHO 2013.
Although it would be ideal to have more information on the type of user-interface (i.e. the type of
sanitation facility used), the focus of this study is primarily the management of fecal sludge from
latrines (i.e. the containment stage) and, to an extent, all forms of fecal waste flows, including
sewerage, through to end-use/disposal (see Figure 2 below).
Figure 2 The sanitation service chain
This study is not focusing on the structural conditions or the latrine itself, so much as the extent to
which it contains/does not contain fecal sludge and what happens to the fecal sludge from this stage
onwards. For this reason, the household survey and later sections of this report refer to different
categories for household sanitation facilities and assess fecal sludge management in relation to the
service chain above.
2.3 Lima’s FSM context
Later sections of this report will identify the scale of FSM services and its implications, based on
extensive qualitative and quantitative data collected through this study. Here, the roles legally
assigned to the key actors that currently are and could be involved in FSM are briefly presented,
based on key informant interviews and field experience gathered by the World Bank consultant. The
list is not exhaustive. How this plays out in reality is covered in Section 8.
1 For Lima, there is an overlap in the data between the type of sanitation facility and the type of blackwater containment/disposal for all major national and international surveys (e.g. ENAHO, DHS). It is thus not possible to accurately classify sanitation facilities.

Fecal Sludge Management in Lima – Case Study Report
7
Table 3 Roles assigned to key FSM stakeholders
Categories Stakeholder Assigned roles
National government
Ministry of Housing, Construction and Sanitation (MoHCS)
Improve sanitation management
Improve access and quality of services and ensure their sustainability
Ensure the financial sustainability of service providers
National Superintendence of Sanitation Services (SUNASS)
Regulate and supervise the provision of sanitation services
Enhance the sustainability, quality and access to drinking water and sewerage
Ministry of Environment (MoE)
Reduce socio-environmental conflicts
Improve quality of life through a better environment (e.g. reduce pollution of water resources)
Develop the New Law for Solid Waste Management, which includes emptying, transport, treatment and reuse of bio-solids.
Technical Organism for the Management of Sanitation Services (OTASS)
Ensure the adequate management of service providers to guarantee their efficiency, autonomy and social integration
Regulate, promote, supervise, audit and restructure the administration and management of service providers
Lima Directorate of Environmental Health (DESA)
Enforcement of sanitation regulations
Health promotion and monitoring of possible risks related to poor sanitation
Local government
Lima Metropolitan Municipality
Support the formalisation of human settlements and subsequent requests for access to basic public services
Provide permits to solid waste collection service providers
Health promotion
SEDAPAL (Lima Water Supply and Sewerage Service)
Mandate the operation, maintenance, control and development of water and sanitation services
Undertake tasks related to planning, programming and financing, among others
Private sector & NGOs
Households
Dig pits/build sanitation facilities
Request water and sewerage services
Demand fecal sludge emptying services
NGOs (X-Runner, etc.) Provision of urine-diverting dry sanitation facilities
(UDDTs) and collection of fecal sludge for treatment and reuse (i.e. compost)
Tertiary service providers (Mega Pack Trading, DISAL, etc.)
Provision of FSM services for public facilities (schools, universities, hospitals and social clubs) and medium- to high-income households
Fecal Sludge Management in Lima – Case Study Report
8
3 Fecal Waste Flow Diagrams
3.1 Introduction
Fecal Waste Flow Diagrams (also known as ‘shit flow’ diagrams or SFDs) are an innovation arising
from WSP’s 12-city study of FSM (Peal & Evans, 2013). In short, an SFD is a visualisation of how
fecal waste (fecal sludge or wastewater) flows along the sanitation service chain. At each stage of
the chain, the proportion of fecal waste that is or is not effectively managed to the next stage of the
chain is indicated.2
This means that where fecal waste is deemed to be:
Effectively managed from one stage of the chain to the next (for example, where wastewater
from cistern flush toilets is effectively transported through sewers to a designated treatment
site, or fecal sludge is transported by a tanker to a designated disposal site), the SFD shows
the flow of fecal waste continuing along the chain – and the arrow representing that flow of
fecal waste to the next stage remains green;
Not effectively managed from one stage of the chain to the next (for example, where
wastewater leaks from sewers before reaching a designated treatment site, or fecal sludge
is dumped into the environment or drainage channels), then the SFD shows the fecal waste
“dropping out” of the service chain – and the arrow representing that flow of fecal waste turns
brown.
The proportion of fecal waste that is effectively managed all the way to the end of the service chain
is indicated as “safely managed”, with the remaining proportion that has dropped-out of the chain
deemed “unsafely managed”. The primary destination of that “unsafe” fecal waste is indicated (e.g.
receiving waters, general environment, drains, etc.).3 Thus far, SFDs in different cities have been
undertaken using different methodologies, as is often necessary in the context of poor data
availability. Furthermore, most SFDs so far (including those in the 12-city study) were undertaken
using secondary data and expert estimates. This study is amongst the first to use primary household
survey data and field-based observations to construct SFDs. A group of urban sanitation experts is
currently discussing the ‘roll-out’ of the use of SFDs, for which other methodologies will be
developed.4
For this study, SFDs are being developed which are indicative of (i) the city-wide situation, and (ii)
the situation in low-income settlements (see Annex B for more information). For Lima, the former is
based on secondary data, whereas the latter is based on primary data collection in non-sewered
settlements (which are generally low-income areas), as part of sub-sample A.
2 Previous iterations of SFDs distinguished between safe and unsafe practices, but here we refer to effective / ineffective management. This progression has been made because it is difficult be sure of the safety of the process, but if the fecal waste is managed to the next stage of the sanitation service chain, we can say it is considered an effective process. 3 It is acknowledged that fecal sludge may pass from irrigation channels into other water bodies, e.g. rivers, but the diagram focuses on the primary destination. It was beyond the scope of this study to be able to track the pathways of sludge beyond the household, e.g. which canals did it pass through and where was its eventual destination. 4 See website for the SFD promotion initiative here.
Fecal Sludge Management in Lima – Case Study Report
9
3.2 Methodology
As noted above, the city-wide SFD is based on secondary data, because neither sub-sample in the
household survey was representative of Lima as a whole.5 Secondary data used includes other
household surveys (e.g. ENAHO 2013 for the type of sanitation system used) and utility records (i.e.
SEDAPAL’s data related to the proportion of wastewater which is transported and treated).
For the SFD in non-sewered areas, data from the household survey questions was used.6
A. What kind of toilet facility do members of your household usually use?
B. Where do the contents of this toilet empty to?
Of these, question ‘B’ is the most crucial for the SFD. The household’s response is taken as given,
as it was not possible to confirm responses by observation. Enumerators could however observe
‘above-ground’ components (i.e. slab, water seal, superstructure, etc.), and this was carried out in
all households where permission was granted.7
To analyse this data, an SFD matrix was created – a blank matrix is shown in Figure 3 below. It
shows which data sources are used and how they are analysed into categories of effective and
ineffective management of fecal waste through the stages of the service chain. Results for Lima are
shown in the next section.
Firstly, household survey data on use of infrastructure (questions A and B above) is used to allocate
households to five categories shown in the column marked (1) in the figure below:
(i) Sewered (off-site centralised or decentralised): toilets connected to sewers (not on-
site sanitation).
(ii) On-site storage – emptiable: on-site sanitation (on-site sanitation) toilets (involving pits
or septic tanks) that can be emptied. However, they can also be connected to drains
through an overflow, to avoid the need for emptying. These toilets are emptiable but may
or may not be emptied.
(iii) On-site storage – single-use / pit covered: on-site sanitation toilets where pits or tanks
are covered and / or abandoned once full. These toilets are emptiable but never emptied.
(iv) On-site non-storage – straight to drain / similar: on-site sanitation toilets which
connect directly to drains, water bodies or open ground. These toilets are therefore non-
emptiable.
(v) Open defecation (OD): self-explanatory.
The question of emptiability is key. Category (ii) above is denoted as emptiable, meaning that this
containment option involves a pit or tank which fills with fecal sludge. Between the two extremes of
a closed system and a system which never fills up, there is a spectrum of scenarios. For example,
some pits / tanks may have an overflow to the drain but may still require emptying if they become
blocked. These categories were designed to be applicable around the world. As it happens, the vast
5 In other cities in this five-city study, sub-sample A was designed to be representative of the whole city. However, given the very high sewerage coverage in Lima, sub-sample A is largely representative of non-sewered areas of the city. For more information on sampling, please refer to Annex B. 6 Full response categories for these questions are included in the survey questionnaire, to which there is a web link in Annex F. In particular, the response categories to question B above were: (i) Piped sewer system, (ii) Lined septic tank, (iii) Unlined pit (single or twin), (iv) directly to open drain, (v) directly to sea, lake or river, (vi) open ground/street 7 Given that ‘B’ is based on household response, possible sources of bias include the household not knowing the true answer or knowing it but answering differently for fear of being identified as practicing illegal behaviour. The former is certainly likely, the latter does not seem to be an issue given that households willingly disclosed illegal behaviour where applicable.

Fecal Sludge Management in Lima – Case Study Report
10
majority of households in Lima fall into category (i), as there is 92% sewerage. In non-sewered areas,
most households fall into category (iii).
Data from questions A and B at the beginning of this section are allocated in column (2) below (a
key shows the meaning of the colour-coding of cells by data source). Next, the proportions for each
of the stages of the chain are allocated. As can be seen from the emptying column, marked (3), a
certain proportion of the population’s fecal sludge which is collected is emptied by a service provider,
with the remaining fecal sludge not emptied (e.g. overflows to drains).
The rest of the matrix follows a similar logic. Full SFD matrices for the Lima Metropolitan Area (city-
wide) and non-sewered areas (sub-sample A) are presented in Annex C, along with further
methodological notes. This section has given a brief overview of where the data underlying the SFDs
comes from. The SFDs themselves are more intuitively appealing and are presented in the next
section.
As the data comes from household surveys (i.e. the Peru National Household Survey – ENAHO –
and this study’s household survey), the proportions in the matrix are proportions of households, not
proportions of people or fecal sludge volumes.8
8 The impression given by the SFD therefore involves assumptions that (i) each person produces the same amount of FS, and (ii) pit accumulation rates are constant across the city. This is an approximation but the most pragmatic approach in the context of uncertainty around fecal sludge volumes. Fecal sludge volume only really becomes an issue when considering the extent of change in service levels needed to deal with the amounts. This study is primarily about identifying the broader picture of where the management of fecal sludge is or is not effective, not what volumes are being managed or mismanaged.
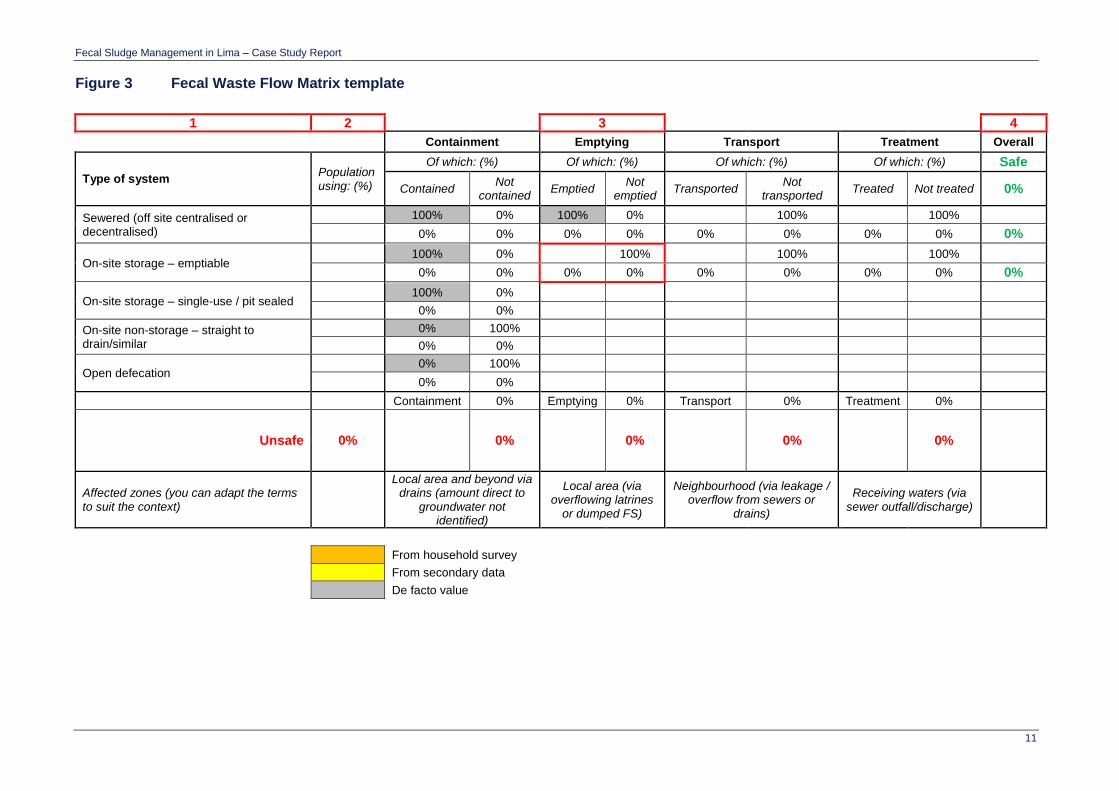
Fecal Sludge Management in Lima – Case Study Report
11
Figure 3 Fecal Waste Flow Matrix template
1 2 3 4
Containment Emptying Transport Treatment Overall
Type of system Population using: (%)
Of which: (%) Of which: (%) Of which: (%) Of which: (%) Safe
Contained Not
contained Emptied
Not emptied
Transported Not
transported Treated Not treated 0%
Sewered (off site centralised or decentralised)
100% 0% 100% 0% 100% 100%
0% 0% 0% 0% 0% 0% 0% 0% 0%
On-site storage – emptiable 100% 0% 100% 100% 100%
0% 0% 0% 0% 0% 0% 0% 0% 0%
On-site storage – single-use / pit sealed 100% 0%
0% 0%
On-site non-storage – straight to drain/similar
0% 100%
0% 0%
Open defecation 0% 100%
0% 0%
Containment 0% Emptying 0% Transport 0% Treatment 0%
Unsafe 0% 0% 0% 0% 0%
Affected zones (you can adapt the terms to suit the context)
Local area and beyond via drains (amount direct to
groundwater not identified)
Local area (via overflowing latrines
or dumped FS)
Neighbourhood (via leakage / overflow from sewers or
drains)
Receiving waters (via sewer outfall/discharge)
From household survey
From secondary data
De facto value

Fecal Sludge Management in Lima – Case Study Report
12
3.3 Results
Firstly, the secondary data and household survey results, which are inputs to the SFD, are shown in
the tables below. They are reported separately for Lima Metropolitan Area and non-sewered areas
(sub-sample A). After that, a separate SFD matrix and diagram for each area are presented.
3.3.1 Household survey results as an input to the SFD
In most countries, national household surveys usually collect data on the toilet type (e.g. cistern
flush, pour / manual flush, pit latrine, hanging toilet, etc.). However, in Peru only the type of
blackwater disposal is inquired about in Demographic and Health Surveys (DHS) and other similar
surveys. Therefore, it is not possible to know what type of toilets are most prevalent in Lima from
secondary data, though anecdotally it is mostly cistern flush or pour flush, with a raised seat in all
cases.
For non-sewered areas however, primary data (sub-sample A) is available. Although data is also
available for sub-sample B, the situation is fairly similar to that of non-sewered areas – conceptually,
it is best to think of sub-sample B as a subset of sub-sample A, i.e. all the lowest-income
neighbourhoods are in non-sewered areas. Since sub-sample A is more representative of the
situation in non-sewered areas as compared to sub-sample B, we have decided to use data from
the former to populate the SFD.
As can be seen in Table 4 below, the majority of households in non-sewered areas (57%) used
pour/manual flush toilets Pit latrines without a slab and cistern flush were the next popular, at 16%,
followed by pit latrines with slab (8%) and urine diversion toilets (1%).
Table 4 Sanitation facility used, by technology type – non-sewered areas
% No. of households
Cistern flush 15.6 56
Pour / manual flush 56.9 205
VIP latrine 2.8 10
Pit latrine (with slab) 8.1 29
Pit latrine (without slab) 16.1 58
Urine diversion toilet 0.6 2
Bucket 0.0 0
No toilet 0.0 0
Total 100.0 360
The table above shows the basic categories, but it is also important to consider the proportion of
these which are shared. This is relevant, not just in terms of developing the standardised indicators
of the WHO/UNICEF JMP, but also because the FSM arrangements for shared latrines are likely to
be different from those of ‘private’ latrines from a management perspective. This is because
accountability for dealing with full or blocked pits, as well as payment for FSM services, may be less
clear-cut in a ‘shared’ situation, recognising that this label could refer to a large number of scenarios.
The technology and service used would be as for private facilities, while noting that shared pits/tanks
would be likely to fill more quickly, depending on the number of users.
As can be seen from Table 5 below, 76% of households in non-sewered areas used a facility
considered improved under JMP definitions (see footnotes below). However, this value should be
read with some caution as, even if the facility is classified as improved by standard definitions, its

Fecal Sludge Management in Lima – Case Study Report
13
quality and maintenance may not always be adequate. Figure 4 shows some of the typical facilities
and superstructures that are observed in non-sewered peri-urban areas of Lima – superstructures
tend to be made of non-durable materials that can easily collapse while the facility itself may be
partially broken and unclean. The type of soil and landscape is also a concern in Lima, with
households in rocky and hilly areas (as shown below in Puente Piedra) being more likely to have
poorly constructed facilities.
Sharing was not that common, with only 11% of households sharing an improved or unimproved
latrine. Data on sharing was not available for Lima city-wide.9
Table 5 Sanitation facility use, by JMP category – non-sewered areas
% No. of households
Improved 75.6 272
Improved – shared10 8.3 30
Unimproved 13.6 49
Unimproved – shared11 2.5 9
Total 100.0 360
Figure 4 Sanitation facilities in non-sewered areas of Lima
a. Puente Piedra b. San Juan de Miraflores
As noted above, the most important question in the survey is where the contents of toilets go after
flushing or similar. The standard DHS question incorporates this into the overall sanitation question
(see WHO/UNICEF core questions available at www.wssinfo.org). However, for this study, it was
necessary to ask a separate question in order to get better quality data.12 Household-reported data
is relied upon for this indicator, while noting that households may not always know the full detail,
especially if they are renting, or may answer untruthfully. Furthermore, with a socio-economic survey
rather than a technical survey, it was not always possible to physically verify household’s answers
to this question. Nonetheless, a large proportion of the enumerator training was spent ensuring that
9 ENAHO does collect data on this question but it is not readily available. 10 The JMP definition of a shared facility is one which is used by 2 or more households (including a public facility). 11 “Unimproved shared” is not a category usually reported by the JMP, but it is useful to report for our purposes so we can see the full proportion of households sharing latrines. 12 As stated above, the question asked was “Where do the contents of this toilet empty to?” The question is answered by all households, regardless of whether they owned a private facility, or managed / used a shared facility.

Fecal Sludge Management in Lima – Case Study Report
14
the enumerators fully understood the distinction between the response categories. In the event, most
interviewed households in non-sewered areas of Lima fall into one category.
For completeness and consistency with other case study reports, it is important to explain that results
were grouped into risk categories based on the relative risk to public health from a combination of
the type of containment arrangement and where the fecal sludge and effluent empty to:
Low-risk categories are those where the fecal sludge can be considered to be contained (in
JMP terms), at least in relation to the first stage of the service chain.
High-risk categories are those where the fecal sludge goes directly into the environment and
so potentially poses a risk of exposure to the public, whether via drainage systems or water
bodies with which people interact (especially children).
Medium-risk categories are those where there is at least some containment in a pit or septic
tank, but those pits/tanks either: (a) have outlets connected to drains that allow only partially
digested effluent to flow through, or (b) are unlined, allowing fecal sludge to leach into the
surrounding soil and groundwater that may be used for domestic purposes (e.g. washing
clothes). These scenarios still represent a risk, but it is somewhat lower than contact with
fresh fecal sludge as in the high-risk category above.
The results are shown in Table 6 below. Only 3% of non-sewered households have high-risk
blackwater management practices, all of which goes “directly to drain”. The most common category
was medium-risk (96%), with all these being unlined pits. Comparison to the city-wide situation can
be done with reference to Table 2, noting that 92% of Lima’s population are connected to a sewer
and only 2% have high-risk blackwater management practices (connected to river or open
defecation).
Cutting the data another way, it is important to note that only 7% of households city-wide use what
is considered as an on-site sanitation system, whereas 100% of households in lowest-income areas
do so. However, in practice, the majority of these on-site systems consist of lined / unlined pits which
are covered when full and abandoned. This covering of the raw fecal sludge is usually done with
lime and soil (and in some instances with wood and cement), and cannot generally be considered
effective management.
Table 6 Management of blackwater, where toilets discharge to – non-sewered areas
% No. of households
Low risk 0.9 3
Septic tank with no outlet 0.3 1
Urine-diverting toilet – contractor collects waste
0.6 2
Medium risk 95.8 345
Unlined pit 95.8 345
High risk 3.3 14
Directly to an open drain/ditch 3.3 12
Directly to an open ground (street/ field) 0.0 0
Buried 0.0 0
Total 100.0 360
With 7% of households using on-site sanitation city-wide, the majority of which belong to low income
wealth quintiles and thus have a low ability to pay, it is not hard to see why there is such a limited
market for FSM services. However, in order to assess the potential demand, households were asked
whether both their previous and current pit / tank ever filled up. For pits that were previously in use,

Fecal Sludge Management in Lima – Case Study Report
15
77% of responding households in non-sewered areas (n = 155) noted that the pit had filled up. With
regards to pits / tanks currently in use, only 3% households in non-sewered areas reported the pit
ever filling up (n = 342).
Finally, it is worth considering the reported household behaviour in the context of pits filling up. This
was assessed by asking about the action taken by the household when their pit last filled up. As can
be seen in Table 7, the majority of households either left the pit unsealed or sealed and abandoned
it, which is consistent with the common practice of digging a new pit every time the one in use fills
up. However, when referring to the last time the current pit/tank filled up, 90% households in non-
sewered areas responded that the tank had been emptied (n = 10). This may be related to the lack
of space for building a new pit, and suggests there is some scope for future FSM services, although
there are too few observations to draw accurate conclusions.
Table 7 Action after previous pit/tank used filled up – non-sewered areas
% No. of households
Abandoned unsealed 47.1 56
Sealed and abandoned 52.1 62
Other 0.8 1
Total 100.0 119
3.3.2 Presentation of SFDs
Using all these results, two sets of SFD matrices and diagrams were constructed: one giving a city-
wide picture based on secondary data and one based on sub-sample A of the household survey.
These are presented as Error! Reference source not found. and Error! Reference source not
found. below. SFDs work on the same principle as the matrix shown above. Household’s toilet
technology and associated containment method is shown on the left, with intermediate steps and
primary destination of the fecal sludge shown along the sanitation service chain.
What is clear from the city-wide SFD is that almost half (48%) of fecal sludge in Lima is not effectively
managed. While 92% of households have a sewer connection, 27% of wastewater is released
directly into the sea without treatment. Furthermore, around 73% of the wastewater which makes it
to the treatment plant is effectively treated. These weaknesses in the sewerage system are the main
reason for the city-wide SFD looking as it does. The proportion of households that practice open
defecation or use toilets that empty straight to drains is very small, jointly encompassing 1.4% of
households. The only remaining point of note is that septic tanks are assumed to be adequately
managed while unlined pits (except when emptied) are considered to be ineffectively managed.
Overall, around 7% of households in Lima use an on-site sanitation system, 3% of which are deemed
to be effectively managed (i.e. septic tanks).

Fecal Sludge Management in Lima – Case Study Report
16
Figure 5 Fecal Waste Flow Diagram for Lima - city-wide based on secondary data
Considering next the SFD for the non-sewered sample (Error! Reference source not found.), the
picture is completely different because there are no sewers in these areas. The vast majority of
households (96%) have an unlined pit, of which around 3% were deemed to adequately contain FS
(i.e. households reported the pit filling up). The remaining 93% of unlined pits are deemed to be
ineffectively managed, with FS leaching into the surrounding environment. Households further
reported that 90% of pits that fill up are emptied, for which only 44% of FS seems to be transported
(i.e. FS is discharged into a tanker truck). However, given that there are no treatment plants
specifically designed for the reception of FS, none of the FS emptied and transported is likely to be
given adequate treatment. A further 3% of households have toilets which discharge straight to drains,
and finally 1% have a septic tank or a urine-diverting dry toilet (UDDT), in which fecal sludge is safely
contained and, for UDDTs, emptied, transported and treated by NGOs. Overall then, only 1% of fecal
sludge in non-sewered areas in Lima is effectively managed.

Fecal Sludge Management in Lima – Case Study Report
17
Figure 6 Fecal Waste Flow Diagram for Lima – non-sewered areas, based on household survey
3.4 Implications of the SFDs for FSM in Lima
The city-wide SFD shows that the city is doing relatively well at extending sewerage coverage, but
the capacity for treatment needs to be improved. By the end of 2016, both La Chira and La Taboada
wastewater treatment plants will be fully operational, increasing the capacity of treatment to almost
100%. The great majority of households that do not have access to sewerage rely on on-site
sanitation facilities that discharge to an unlined pit (96%). Only 3% of these households empty their
pits while the remaining ones generally cover and abandon their pits when full. These abandoned
unlined pits are a public health hazard, as FS leaches into the surrounding environment, potentially
contaminating nearby water sources. Some reports and media headlines also suggest that people
in poor areas are running out of space to dig new pits, while many of the covered pits collapse.
Having large amounts of fecal sludge in the environment, via unlined pits, is a hazard which primarily
affects people in poorer areas but the discharge of untreated wastewater represents a broader
externality affecting everyone. Both the SFDs are necessarily vague about the destination of the
untreated fecal sludge (i.e. “local area and beyond”). Lima has a very dry climate and much of the
fecal sludge may not contaminate the groundwater easily, but this is still possible.
Further implications of the SFDs above for FSM in Lima are discussed in Section 9 of this report,
which focuses on implementation options. In short, however, it is clear that the key challenges in
Lima are: (i) improving wastewater treatment capacity; (ii) developing and extending FSM services
to non-sewered areas where people are currently abandoning full pits in a potentially unsafe manner
– adequate containment and facility maintenance needs to be encouraged, and FS reuse needs to
be developed to increase the profitability of FSM markets; and (iii) progressively extending
alternative services, including forms of sewerage coverage to 100% (e.g. condominial sewerage) or
UDDTs with centralised emptying and treatment.

Fecal Sludge Management in Lima – Case Study Report
18
4 Public health risk assessment
4.1 Introduction and methodology
A component of the diagnostic study is to assess the extent of public health risk resulting from poor
FSM services within Lima, representing risks for non-sewered areas. The study also seeks to identify
the approximate level and location along the sanitation service chain of adverse public health risks.
Methods adopted within the data collection instruments to do this include:
Identifying types of household facility and emptying services used (supported by direct
observation of the cleanliness and functionality of the facility), during the household survey;
Observing emptying service providers to identify how their practices may introduce risk to the
household specifically (containment and emptying stages) and to the wider public at large
(emptying, transport and disposal stages);
Scoring hazards and vulnerability factors observed during transect walks (see explanation
below), along with information about local practices that could result in fecal contamination
in the environment (see Annex E for information on the scoring system used);
Measuring fecal contamination levels in local drains and water supplies, to identify potential
levels of exposure to risks; and
Asking for perceptions of risk related to emptying services, during focus group discussions.
Collating and analysing results from the data collection instruments provides information about
sources of risk through the service chain. This includes: how clean and operational toilets are kept
within the household; how effectively and safely service providers empty, transport and dispose of
fecal sludge; and the extent to which infrastructure provides effective handling of fecal sludge and
wastewater through the city.
Given the limited extent of data collected for this part of the study, it can only provide a general
indication of risk level at positions along the service chain. The study is not intended to report on
specific locations or flow paths of fecal sludge movement within the sampled UALs.13
For more information about sanitation-related diseases and the significance of safe management of
fecal sludge to protect environmental and public health, see Cairncross & Feachem (1993, pp.11-
25), and Strande et al (2014, pp.1-4).
4.2 Results: risks through stages of the FSM service chain
4.2.1 Containment: household facilities, levels of sharing and practices
From the survey, reported levels of sharing of facilities shows that 8% of households in non-
sewered areas use an improved shared latrine and 3% use an unimproved shared latrine (see Table
5). For shared latrines in non-sewered areas, 73% of households report sharing the latrine with up
to 5 people, and 26% share with up to 10 people. Around 1% of households reported sharing the
latrine with 11 people or more. Ownership of private household toilets is high in non-sewered areas,
13 Original datasets contain GPS locations of observed risks in the UALs that can be examined further.

Fecal Sludge Management in Lima – Case Study Report
19
with 89% of households reporting owning a private latrine (on plot) – either an improved (76%) or
unimproved (14%) facility.
Standards of cleanliness for household facilities, observed during the household survey, indicate
that in non-sewered areas, 68% of observed latrines were found to have a cleanable slab and 53%
had no fecal or urine contamination on the floor or slab (20% had either feces, or feces plus urine,
visible).
Practices around the disposal of child faeces also introduce risks to both households and
potentially the wider public. In non-sewered areas, 75% of households who reported their practices
(n=109) identified unsafe methods when disposing of feces of children under 5 years old (72%
throwing the feces out with solid waste, while the remaining households either buried or burned the
feces). In addition, 55% of households reported storing solid waste within the household before
collection and 24% reported throwing solid waste out into the street. All of these practices have
serious implications for contamination of the immediate household and neighbourhood environment,
as shown in Figure 7.
Figure 7 Solid waste disposal areas in San Juan de Miraflores
Self-reported diarrhoea prevalence stated by the respondent (person answering the questions)
during the household survey are shown in Table 8 below. Prevalence is relatively low, with 9% of
households reporting having at least one diarrhoea episode in the past 2 weeks.
Table 8 Prevalence of diarrhoea among respondents in the last 2 weeks – non-sewered areas
% No. of households
None 91.4 329
One 5.0 18
Two 1.9 7
Three 0.6 2
Four 1.1 4
Total 100.0 360
Focussing exclusively on children under 5, household survey data suggests that 18% of all children
under 5 in non-sewered areas (n = 190). This is significantly higher than the prevalence reported in
the 2013 ENDES (or DHS) for Lima, with 7% of children under 5 having an episode of diarrhoea.
This suggests that households in non-sewered areas of the city have a greater risk of diarrhoeal
Fecal Sludge Management in Lima – Case Study Report
20
disease as compared to the city overall, which is likely to be linked to poor access to water and
sanitation services. Indeed, at a national level, 2013 ENDES estimates indicate that the prevalence
of diarrhoea among children under 5 was higher among those who used an unimproved water source
(14%) as compared to those who used an improved water source (11%). Similarly, the prevalence
of diarrhoea was higher for children with an unimproved shared toilet (12%) as compared to children
with an improved and private facility (10%).
Diarrhoea prevalence is only one indicator of a contaminated environment. It is increasingly
understood that nutrition outcomes, especially stunting (height-for-age) are strongly linked to
sanitation through multiple transmission pathways, although stunting has numerous determinants,
including living in contaminated environments.
Wider risks to public health, beyond risks to families and individuals from poorly-managed
containment facilities and practices, as is the use of unlined pits that are poorly covered and
abandoned, arise from poor access to fecal waste management during discharge, emptying,
transport and disposal practices.
4.2.2 Emptying: household practices around emptying services
As seen in the results from the household survey in non-sewered areas, the majority of households
rely on using some form of simple latrine discharging to an unlined pit (96%) that is covered and
abandoned when full (93%) and in very few cases, emptied (3%). Others have latrines discharging
directly to an open drain, ditch or ground (3%), while the remaining 1% have a septic tank or an
UDDT facility. In 16% of cases, greywater is also discharged into the unlined pits, but the majority of
greywater is discharged directly to the open (69%) and only 3% to a soakaway.
What is clear is that very few households in non-sewered areas make use of emptying service
providers, as people traditionally cover and abandon the pit when it becomes full and dig a new one.
This is borne-out by the reported average age of pits in non-sewered areas being less than 4 years
old (median is 3 years old, n = 358 households).14
4.2.3 Emptying, transport and disposal: observed practices and risks
Planned observations were carried out at six latrines. Of these, three latrines (two pits and one septic
tank) were emptied using mechanised tankers, while two were UDDTs relying on manual removal of
dried feces from a vault or a mobile container and urine separately handled. The other was an
abandoned pit latrine. The use of urine diversion latrines (permanent and mobile) is currently at a
small scale in Lima – but of growing interest as a service option in the non-sewered areas.
Using a structured observation format, likely sources of immediate risk from exposure to fecal sludge
at each step of the process were identified for the containment, emptying, transport, disposal,
treatment, and end-use stages. Transportation, treatment and end-use of fecal material is only
practiced on a very small scale in non-sewered areas of Lima; in this instance, for the urine diversion
latrines with urine diversion and potential for re-use of dried feces.
Risk levels were taken to be based on exposure as follows:
At containment stage, to the family members / households who use the facility;
14 Similarly, for the overall non-sewered sample, less than 3% of households reported their pit / tank ever filling up.

Fecal Sludge Management in Lima – Case Study Report
21
At emptying stage, to those in the compound (site) where the facility is located, plus the
neighbourhood along the emptying route from the compound to transport / disposal point,
and
At transport, treatment and disposal stages, affecting a wider geographical area and
population.
Based on the scoring system developed for the structured observation, exposure to risk were
recorded using high / medium / low categories. A summary of the results is shown in Annex E, while
the following sections discuss the broader findings and their implications. It should be kept in mind
that, as the immediate risk was being noted down at each stage in the process, the risk level can
vary between stages, depending on the actions taken.
Containment and emptying: mechanical
Containment facilities where mechanical emptying was observed (three cases) were considered to
introduce low risk to two of the households, while in one case the pit latrine was full and at risk of
overflowing, with evidence of flies or insects inside the superstructure, which increased the overall
risk to the household to a medium level.
The emptying procedure in each case was observed to pose low risk to the household, as the
removal and transfer of fecal sludge was contained in the pipework running directly from the pit /
tank to the tanker, with only small amounts of fecal sludge becoming exposed close to the emptying
point.
Containment and emptying: manual
In the instances of manual emptying, the content was separated from urine and washing water in
UD latrines. Different types of solid waste were found in the abandoned pit, while the contents of the
urine-diversion latrines contained no solid waste.
The containment facilities themselves were found to pose low risk to households, based either on
the abandoned nature of the pit, or on the way in which feces is stored in closed containers. For one
UD latrine, the use of twin vaults allows the feces to be stored in one vault for a year before removal,
making it safe to handle. For the other UD latrine, feces are stored in a portable bucket fitted with a
lid, which is removed on a weekly basis (see Figure 8 below). Careful handling of the content of the
UD bucket results in a low risk during the emptying stage, with a low risk level also identified for
emptying the dried feces after a year of storage.
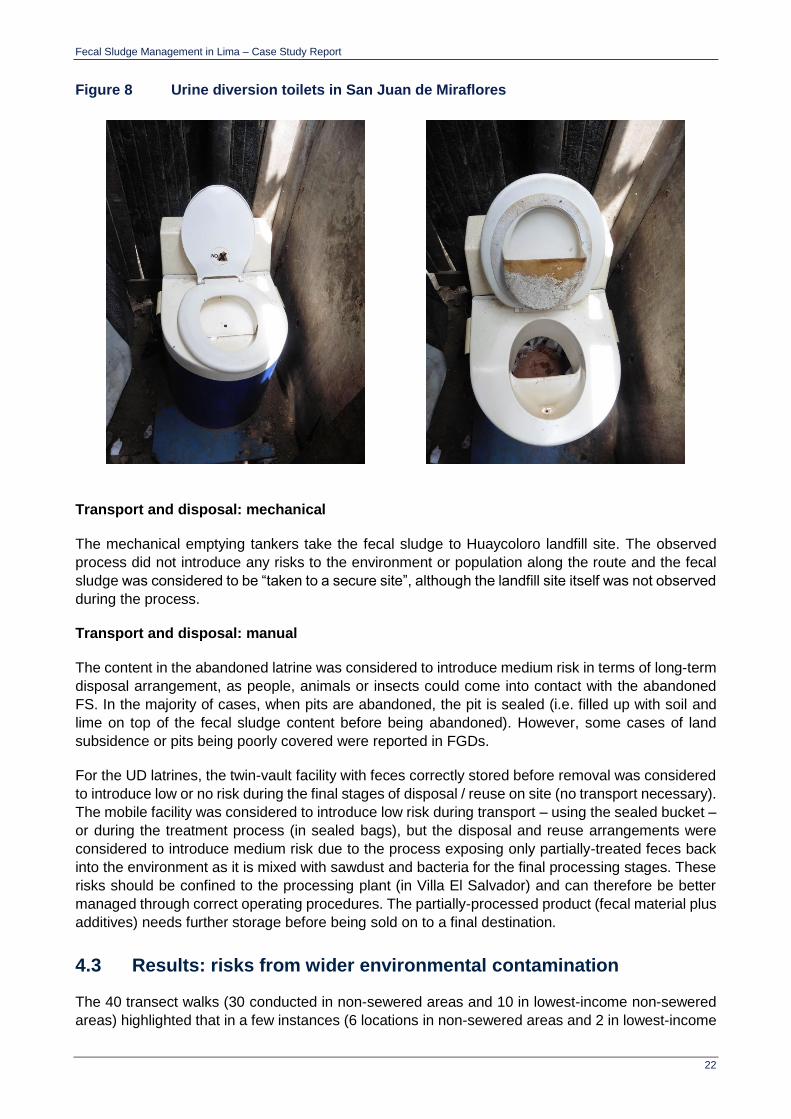
Fecal Sludge Management in Lima – Case Study Report
22
Figure 8 Urine diversion toilets in San Juan de Miraflores
Transport and disposal: mechanical
The mechanical emptying tankers take the fecal sludge to Huaycoloro landfill site. The observed
process did not introduce any risks to the environment or population along the route and the fecal
sludge was considered to be “taken to a secure site”, although the landfill site itself was not observed
during the process.
Transport and disposal: manual
The content in the abandoned latrine was considered to introduce medium risk in terms of long-term
disposal arrangement, as people, animals or insects could come into contact with the abandoned
FS. In the majority of cases, when pits are abandoned, the pit is sealed (i.e. filled up with soil and
lime on top of the fecal sludge content before being abandoned). However, some cases of land
subsidence or pits being poorly covered were reported in FGDs.
For the UD latrines, the twin-vault facility with feces correctly stored before removal was considered
to introduce low or no risk during the final stages of disposal / reuse on site (no transport necessary).
The mobile facility was considered to introduce low risk during transport – using the sealed bucket –
or during the treatment process (in sealed bags), but the disposal and reuse arrangements were
considered to introduce medium risk due to the process exposing only partially-treated feces back
into the environment as it is mixed with sawdust and bacteria for the final processing stages. These
risks should be confined to the processing plant (in Villa El Salvador) and can therefore be better
managed through correct operating procedures. The partially-processed product (fecal material plus
additives) needs further storage before being sold on to a final destination.
4.3 Results: risks from wider environmental contamination
The 40 transect walks (30 conducted in non-sewered areas and 10 in lowest-income non-sewered
areas) highlighted that in a few instances (6 locations in non-sewered areas and 2 in lowest-income

Fecal Sludge Management in Lima – Case Study Report
23
non-sewered areas), blackwater was visible in the local environment in irrigation channels. Where
this occurred, it was reported as being a daily occurrence, although little information is available
about the source of the blackwater.
Open defecation and dumped fecal sludge
Open defecation, while not a significant problem in Lima, was reported to be observed in 4 non-
sewered UALs. Consultation with community members identified open defecation as practiced in 3
locations: either by “a few” mainly children, or elderly people and children most of the time, or by
“many” people from households without latrines on a daily basis. In a further 3 locations, a few
unspecified people were suspected to be practicing open defecation, but with no further details
provided.
Other unsafe practices were reported during community consultations as:
fecal sludge dumped by dwellings or the roadside on a monthly basis, in 1 location, which
may come from the use of potties in the evening or among children and the elderly;
Uncontrolled latrine emptying near to roads and paths every couple of months, in 1 location;
Overflowing latrines occurring in 4 locations, either on an uncommon basis (3 locations in
non-sewered areas and 1 location in lowest-income areas) or most of the time (1 location).
The combination of instances likely introducing risks to public health occurred in a total of 17
locations in non-sewered areas and 3 locations within lowest-income non-sewered areas.
Water supply and irrigation channels
Tests were carried out to identify levels of fecal contamination of samples of drinking water supplies
and water in drainage/irrigation channels in 10 non-sewered UALs and 7 lowest-income non-
sewered areas. The level of E. coli in the drinking water measured above 3 FCU/100ml in 3 of the
10 non-sewered area samples and 2 of the 7 samples in lowest-income non-sewered areas.
Samples from drains/irrigation channels were shown to have levels of up to 100 FCU/100ml in 5 of
the 10 non-sewered UALs and 4 of the 7 samples in lowest-income non-sewered areas. In addition,
2 of the non-sewered samples were found to have over 1,000 FCU/100 ml.
In all locations with fecal contamination of drinking water sources, solid waste contamination of the
environment was recorded as being problematic (scoring 3 or above during the transect walk
observations). Contamination of water supplies was not found to correlate with locations where
blackwater was observed flowing in the drains/irrigation channels. In only one of the non-sewered
locations and 2 of the lowest-income non-sewered areas, contamination of water supplies was found
where community members were reported to discharge latrine contents into open water bodies
(ponds, rivers, streams or irrigation channels) on a daily basis.
Evidence thus suggests no direct link between behaviours and practices around the disposal of fecal
waste and resulting contamination of water supplies and water bodies, but rather a stronger
association between the mismanagement of fecally-contaminated solid waste and resulting
contamination.
Health and environmental risks
In 6 non-sewered locations, a diarrhoeal outbreak was identified by community members as having
occurred in the last year. Of these 6 locations, 5 took place where either blackwater was observed
in drains (2 instances), where household latrines were reported to be overflowing (2 instances), or
Fecal Sludge Management in Lima – Case Study Report
24
where a few suspected people were considered to be practicing open defecation. In all 6 locations,
solid waste was observed to be accumulating in a number of locations on a daily basis (scoring 4 in
the risk matrix) and the coverage of household latrines was considered to be between 25-75%, with
over 50% well maintained (3 locations) or 50% poorly maintained (3 locations).
4.4 Implications: assessing the public health risk from poor FSM
Risk to public health, as a result of poor FSM services, comes when there is human exposure (i.e.
some form of contact) to the hazard (i.e. feces that contains pathogens), through an event (such as
walking barefoot over fresh feces, playing in drains that carry discharges from latrines, drinking water
or via hands contaminated with feces). The study has identified that some areas of Lima are prone
to fecal contamination, resulting from (i) children’s feces being thrown out with solid waste that is a
common sight in the locations studied; (ii) latrine effluent connecting into irrigation channels that run
through the localities; and (iii) a few instances of reported open defecation or latrines being emptied
in an uncontrolled manner, resulting in fecal sludge being dumped by the roadside. In some areas
of Lima, exposure to fecal sludge may be more direct and hazardous than others – where fresh fecal
matter gets into living areas. In other situations, the cause and level of exposure may be more difficult
to measure, such as the extent to which contamination in water supplies is a result of poor FSM.
The problem of exposed fecal contamination is perhaps not that widespread in non-sewered areas
overall, given the extremely limited levels of latrine emptying that takes place. What is undoubtedly
occurring is contamination of the soil, and possibly groundwater sources, due to leaching from
unlined pit latrines. Further investigation into the public health risks and implications of this are
needed, before any conclusions can be drawn.
Further analysis is therefore needed if results of where, how and to what level risk is occurring are
to be clearly identified. In collaboration with the Centre for Global Safe Water at the Rollins School
of Public Health, Emory University, we hope that results from Lima can be analysed using an adapted
version of the SaniPATH tool.15
At this stage, the study is not able to present an analysis of public health risk from poor FSM services
in Lima. However, the collaboration with Emory University is informing ongoing development of a
SaniPATH tool for FSM services by identifying minimum data requirements to conduct a credible
public health risk assessment, the need for preliminary assessment of the main pathways of risk,
and the reporting requirements for target audiences, such as municipal managers or World Bank
staff. Further collaboration will work towards developing a more effective tool that addresses an
appropriate level of data collection and analysis, with improved visual presentation of the results.
15 SaniPATH is a Rapid Assessment Tool to assess exposure to fecal contamination in urban, low-income settings. Details available at http://www.sanipath.com

Fecal Sludge Management in Lima – Case Study Report
25
5 FSM services: potential demand and supply management
5.1 Introduction
In economic theory, markets for goods and services operate on the basis of demand and supply.
This chapter provides a brief assessment of demand and supply for FSM services in Lima. At this
stage, it is important to note the difference between potential (or notional) demand and effective
demand. The potential demand for FSM services is the quantity (and type) of services which would
be demanded in the absence of any market failures or distortions. This is different from effective
demand, which is the quantity (and type) of services actually purchased in the context of current
supply and prices.
A simple way of illustrating this is to note that 7% of households city-wide use on-site sanitation (i.e.
potential demand), of which only 3% report experiencing a pit or tank filling up, suggesting a very
low effective demand (around 0.2% of Lima’s population).16,17 Reasons for a gap between potential
demand and effective demand in Lima include, among others: (i) common practice among poor
households to dig a new pit after the one in use fills up; (ii) lack of knowledge about the existence
and safety of FSM emptying services; (iii) service providers not being able to physically access
households, which affects the type of services demanded, and (iii) market prices for services being
higher than consumers’ willingness and/or ability to pay. 18
There can be different definitions of potential demand in the context of FSM, with varying layers of
complexity. The simplest definition is as per the above, i.e. services that would be demanded if all
households using on-site sanitation requested emptying services and were willing and able to pay.
Qualifications could be added for different scenarios, for example given (i) emptying of pits/tanks
every 10 years on average, (ii) regularly desludging once a year, (iii) 30% of households are unable
to pay the market price and a further 20% are unwilling, and so on. For this study, we have kept
things simple.
Both FGDs and KIIs reveal that there are basically no formal FSM services provided to poor urban
households – FSM services are only available for public establishments (schools, universities, social
clubs, etc.), which are out of the scope of this study, and for wealthier households who own private
residences near the beach. There are a few households in non-sewered areas that were reported to
have used emptying services, but this is very rare and generally unaffordable. Thus, a detailed study
of the supply side of FSM services was not possible. However, information provided through FGDs
in non-sewered areas is referenced where appropriate.
This section will argue that the main problem in Lima is on the demand side. No FSM services are
demanded partly because people are unaware of the existence of these services, but also because
the most common practice is to dig a new pit once the one in use fills up. FSM services are
exclusively demanded by wealthier households, while poor people are not able to pay for services,
or do not even consider on-site sanitation and FSM as a medium- to long-term solution. Moreover,
the potential costs associated with reaching households in low-income areas (e.g. time and fuel) as
well as accessing the pits, may not make FSM services a profitable business for current providers
of sanitation services.
16 As reported by APEIM, based on ENAHO 2013. 17 Based on household survey data for non-sewered areas. 18 For example, in one of the FGDs carried out in the Santa Rosa district, one of the participants mentioned that emptying services may actually lead to increased pollution as the pit would have to be opened, allowing odours and contents to leak to the surrounding environment.
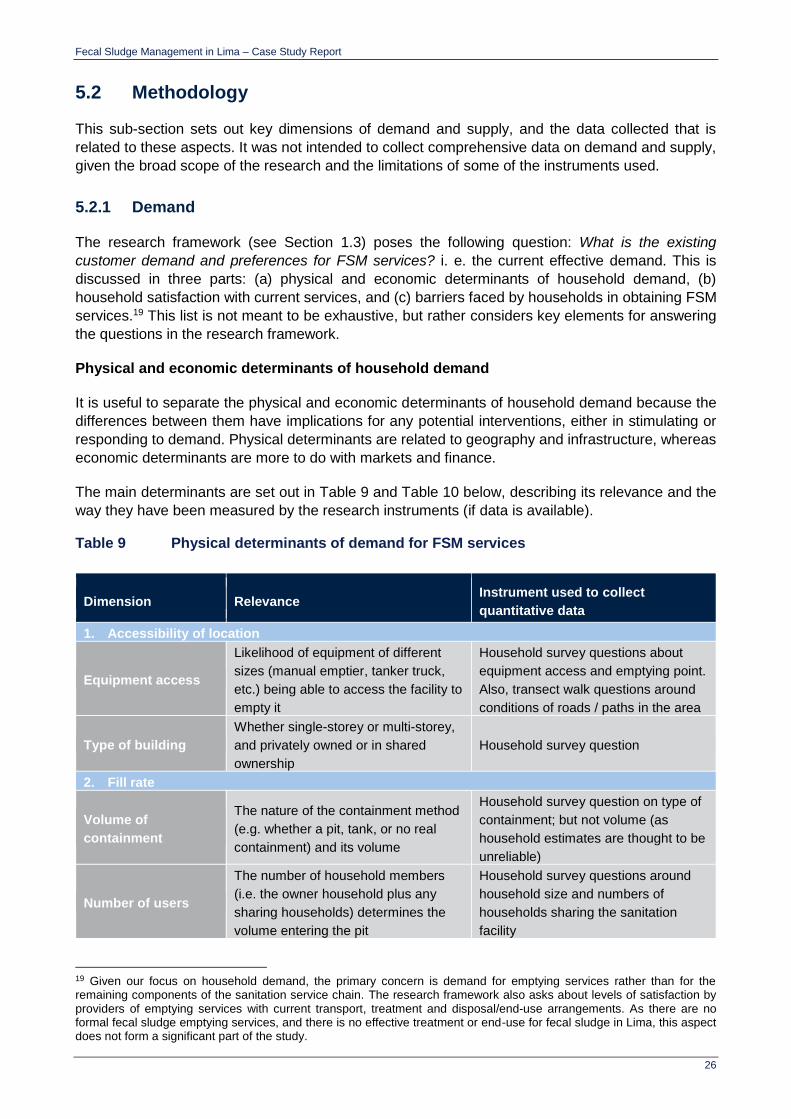
Fecal Sludge Management in Lima – Case Study Report
26
5.2 Methodology
This sub-section sets out key dimensions of demand and supply, and the data collected that is
related to these aspects. It was not intended to collect comprehensive data on demand and supply,
given the broad scope of the research and the limitations of some of the instruments used.
5.2.1 Demand
The research framework (see Section 1.3) poses the following question: What is the existing
customer demand and preferences for FSM services? i. e. the current effective demand. This is
discussed in three parts: (a) physical and economic determinants of household demand, (b)
household satisfaction with current services, and (c) barriers faced by households in obtaining FSM
services.19 This list is not meant to be exhaustive, but rather considers key elements for answering
the questions in the research framework.
Physical and economic determinants of household demand
It is useful to separate the physical and economic determinants of household demand because the
differences between them have implications for any potential interventions, either in stimulating or
responding to demand. Physical determinants are related to geography and infrastructure, whereas
economic determinants are more to do with markets and finance.
The main determinants are set out in Table 9 and Table 10 below, describing its relevance and the
way they have been measured by the research instruments (if data is available).
Table 9 Physical determinants of demand for FSM services
Dimension Relevance Instrument used to collect
quantitative data
1. Accessibility of location
Equipment access
Likelihood of equipment of different
sizes (manual emptier, tanker truck,
etc.) being able to access the facility to
empty it
Household survey questions about
equipment access and emptying point.
Also, transect walk questions around
conditions of roads / paths in the area
Type of building
Whether single-storey or multi-storey,
and privately owned or in shared
ownership
Household survey question
2. Fill rate
Volume of
containment
The nature of the containment method
(e.g. whether a pit, tank, or no real
containment) and its volume
Household survey question on type of
containment; but not volume (as
household estimates are thought to be
unreliable)
Number of users
The number of household members
(i.e. the owner household plus any
sharing households) determines the
volume entering the pit
Household survey questions around
household size and numbers of
households sharing the sanitation
facility
19 Given our focus on household demand, the primary concern is demand for emptying services rather than for the remaining components of the sanitation service chain. The research framework also asks about levels of satisfaction by providers of emptying services with current transport, treatment and disposal/end-use arrangements. As there are no formal fecal sludge emptying services, and there is no effective treatment or end-use for fecal sludge in Lima, this aspect does not form a significant part of the study.
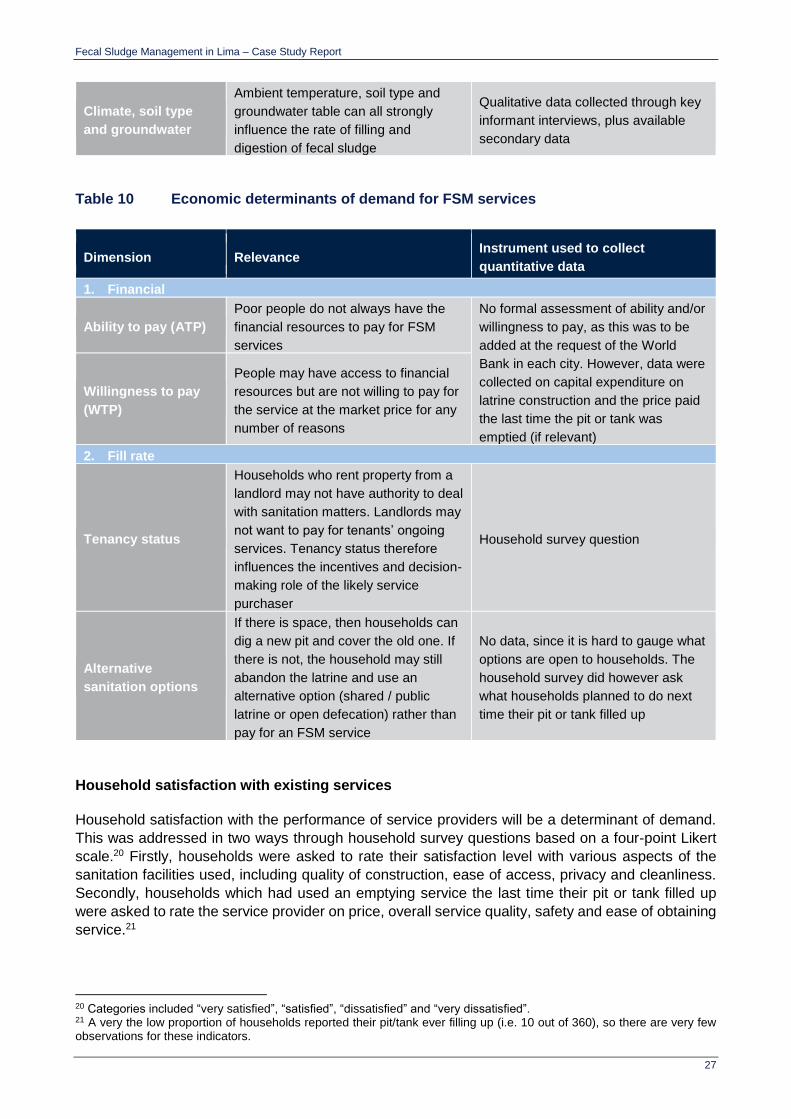
Fecal Sludge Management in Lima – Case Study Report
27
Climate, soil type
and groundwater
Ambient temperature, soil type and
groundwater table can all strongly
influence the rate of filling and
digestion of fecal sludge
Qualitative data collected through key
informant interviews, plus available
secondary data
Table 10 Economic determinants of demand for FSM services
Dimension Relevance Instrument used to collect
quantitative data
1. Financial
Ability to pay (ATP)
Poor people do not always have the
financial resources to pay for FSM
services
No formal assessment of ability and/or
willingness to pay, as this was to be
added at the request of the World
Bank in each city. However, data were
collected on capital expenditure on
latrine construction and the price paid
the last time the pit or tank was
emptied (if relevant)
Willingness to pay
(WTP)
People may have access to financial
resources but are not willing to pay for
the service at the market price for any
number of reasons
2. Fill rate
Tenancy status
Households who rent property from a
landlord may not have authority to deal
with sanitation matters. Landlords may
not want to pay for tenants’ ongoing
services. Tenancy status therefore
influences the incentives and decision-
making role of the likely service
purchaser
Household survey question
Alternative
sanitation options
If there is space, then households can
dig a new pit and cover the old one. If
there is not, the household may still
abandon the latrine and use an
alternative option (shared / public
latrine or open defecation) rather than
pay for an FSM service
No data, since it is hard to gauge what
options are open to households. The
household survey did however ask
what households planned to do next
time their pit or tank filled up
Household satisfaction with existing services
Household satisfaction with the performance of service providers will be a determinant of demand.
This was addressed in two ways through household survey questions based on a four-point Likert
scale.20 Firstly, households were asked to rate their satisfaction level with various aspects of the
sanitation facilities used, including quality of construction, ease of access, privacy and cleanliness.
Secondly, households which had used an emptying service the last time their pit or tank filled up
were asked to rate the service provider on price, overall service quality, safety and ease of obtaining
service.21
20 Categories included “very satisfied”, “satisfied”, “dissatisfied” and “very dissatisfied”. 21 A very the low proportion of households reported their pit/tank ever filling up (i.e. 10 out of 360), so there are very few observations for these indicators.

Fecal Sludge Management in Lima – Case Study Report
28
Other barriers which households face in obtaining FSM services
Some reasons for a gap between potential and effective demand for FSM services in Lima are
already listed above (e.g. physical access to households and willingness to pay). However, there
are many other potential barriers which households may face in securing FSM services.
Some of the barriers to accessing services have not been possible to predict ex ante. These were
therefore explored in the qualitative research, particularly through FGDs with community members
in lowest-income areas. Several of the discussion questions focused around perceptions and
opinions of existing services, and what participants would like to see in terms of improved services
in the future. Discussions were semi-structured, with participants able to discuss questions more
openly, so allowing for the identification of further determinants of demand not otherwise addressed
in the household survey. The full list of topics and questions addressed can be found via a link in
Annex F.
5.2.2 Supply
On the supply side, the research questions were around the current status and quality of FSM service
delivery, with a focus on assessing current technical and institutional capacity (i.e. the scope and
quality of services). This was assessed mainly through the household survey and the report
submitted by the WSP consultant.
5.3 Findings: household demand for services
The results in each key area are presented below, with an overall assessment provided in the
concluding section, alongside implications for FSM in Lima.
5.3.1 Determinants of household demand
Accessibility of location
Whether a service provider can actually get to the facility requiring emptying (as well as the
household’s perception of this) will be a key determinant of demand for services. Data to assess
accessibility were collected from several angles and analysed starting from road/path systems in the
UAL, before focusing down to the household level and, ultimately, the facility itself.
Some of the transect walk data sheds light on the kinds of housing density, paths and roads observed
in the studied areas. Table 11 provides scoring data for non-sewered areas.22 The main issue seems
to be housing density rather than the quality of paths and roads. In terms of implications for FSM
services, what can be concluded from this table is that while mechanised emptying equipment may
find it relatively easy to access non-sewered UALs, reaching individual households may prove to be
difficult given steep hillsides in some cases, housing density and the poor quality of paths. Indeed,
paths in 8 out of 30 TWs in non-sewered areas were either poorly maintained or very narrow.
22 Scores of 1-5 have been used in each city study to represent a qualitative assessment of the relative impact from each physical aspect of the UAL on being able to achieve effective and safe FSM services in that locality, with 1 representing the lowest impact and 5 the highest impact. Annex E includes further explanation of the scoring mechanism.

Fecal Sludge Management in Lima – Case Study Report
29
Table 11 Scoring for housing density, paths and roads from transect walks – non-sewered areas
TW score Housing density Paths Roads
1 = lowest 1/30 None None
2 10/30 13/30 13/30
3 6/30 9/30 9/30
4 12/30 7/30 6/30
5 = highest 1/30 1/30 2/30
Nb. Scores indicate the relative impact on effective FSM, while values per parameter show the proportion of transect walks for which this score was given, e.g. in 1 out of 30 TWs in non-sewered areas was housing density scored with 1. Note that 30 TWs were carried out in non-sewered areas.
The type of building also influences the extent and nature of the emptying required. Table 12 below
shows that the majority of households live in private residences (94%), with the remaining 6% living
in shared residences. Based on photographs from the sampled areas, most of these residences
(either private or shared) are single storey houses, although the management of the containment is
likely to be different between private and shared residences. However, accessibility to the pit/tank
will only be tangentially related to this, especially in cases where the sanitation facility is outside of
the dwelling.
Table 12 Type of residence occupied – non-sewered areas
% No. of households
Private residence 93.6 337
Shared residence 6.4 23
Total 100.0 360
Focusing on the facility itself, Table 13 below shows the accessibility of the main pit/tank structure,
followed by the presence of a purpose-built hatch (as one would expect with a correctly-constructed
septic tank). Following the theme from the TW data, 16% of households in non-sewered areas were
reported to have “poor access”, while 11% of households reported to have an access point or hatch
to facilitate emptying of their containment facility. 23
23 This data comes from observations by our enumerators during the household survey. There were three categories: (1) “Poor access, only accessible to hand-carried emptying equipment”, (2) “Reasonable access for small (manual or mechanised) emptying equipment”, and (3) “Good access for medium/large size (mechanised) emptying equipment”.

Fecal Sludge Management in Lima – Case Study Report
30
Table 13 Accessibility of toilet for emptying equipment – non-sewered areas24
% No. of households
Access for emptying equipment
Poor access (only manual is
possible) 15.8 57
Reasonable access (small
machines) 35.6 128
Good access (large machines) 46.5 161
Total 100.0 346
Access point for emptying
Yes, purpose-built hatch 11.0 38
Yes, squatting plate must be
removed 7.8 27
No, slab must be broken 81.2 281
Total 100.0 346
Overall, from the perspective of accessibility it is clear that while ‘geographic accessibility’ may not
be an issue (as indicated through both TWs and household survey data), there is limited access to
the pits for emptying. The latter should be a key concern in any interventions to stimulate demand
for FSM services, e.g. by providing simple workshops on adequate pit/sanitation facility infrastructure
to household members, as they usually dig the pits and build the facility superstructure themselves.
Filling rate
Data on the type of containment was already shown in Table 6. As noted earlier, data were not
collected on the volume of pits/tanks, since household estimates were thought to be unreliable.
However, households were asked how long it usually took for their pit to fill up, which was considered
more relevant, and a more reliable indicator for households to estimate. The results are shown in
Table 14 below. There are very few observations since so few households have experienced their
current pits filling up (i.e. around 3% of the 7% of households that use on-site sanitation across
Lima). The data shows that among households using on-site sanitation, the majority of pits take
between 2 to 5 years to fill up (75%).
Table 14 Average time taken for pit or tank to fill up – non-sewered areas
% No. of households
Less than 1 year 12.5 1
About 1 year 12.5 1
About 2 years 37.5 3
About 5 years 37.5 3
Total 100.0 8
Moving to the data on shared latrines, the mean number of households sharing each latrine was
1.1.25 Where toilets are shared, it is worth considering the number of people which were sharing in
24 Households that have urine-diverting facilities, a latrine connected to a drain or no sanitation facility were excluded. 25 For these estimates, households with private latrines (not sharing with any other households) are included and coded as 1. If those households are excluded, the mean rises to 2.2.
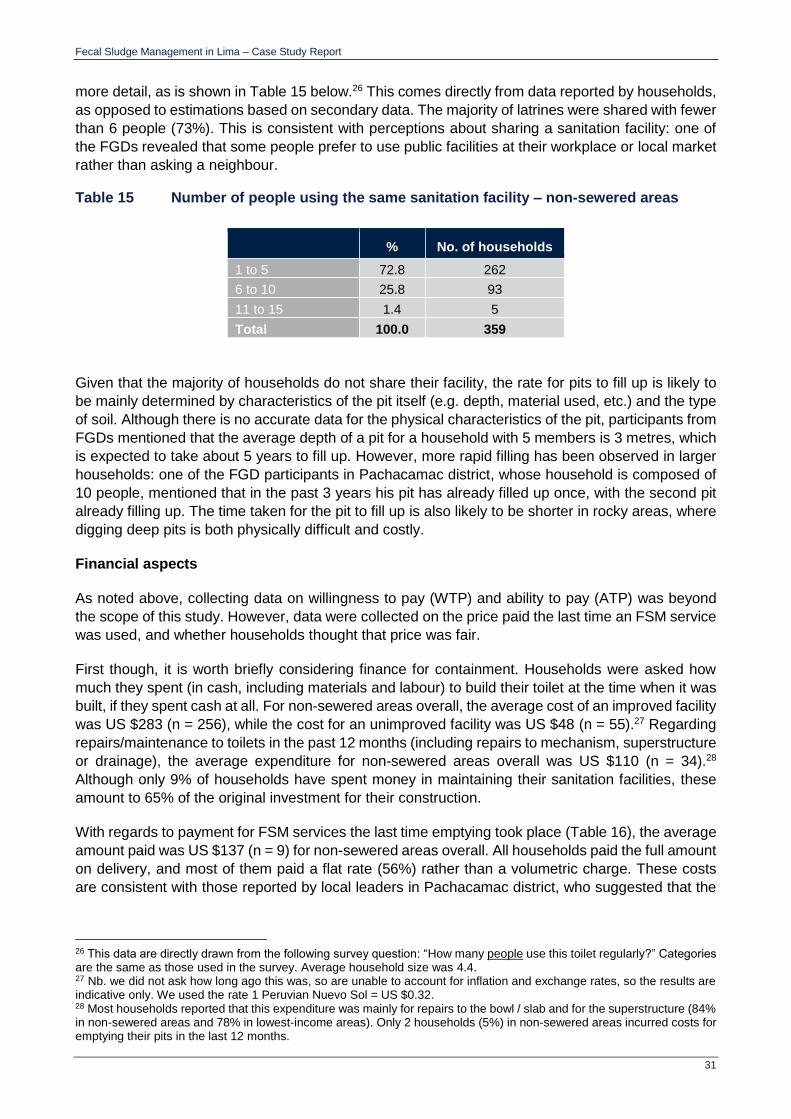
Fecal Sludge Management in Lima – Case Study Report
31
more detail, as is shown in Table 15 below.26 This comes directly from data reported by households,
as opposed to estimations based on secondary data. The majority of latrines were shared with fewer
than 6 people (73%). This is consistent with perceptions about sharing a sanitation facility: one of
the FGDs revealed that some people prefer to use public facilities at their workplace or local market
rather than asking a neighbour.
Table 15 Number of people using the same sanitation facility – non-sewered areas
% No. of households
1 to 5 72.8 262
6 to 10 25.8 93
11 to 15 1.4 5
Total 100.0 359
Given that the majority of households do not share their facility, the rate for pits to fill up is likely to
be mainly determined by characteristics of the pit itself (e.g. depth, material used, etc.) and the type
of soil. Although there is no accurate data for the physical characteristics of the pit, participants from
FGDs mentioned that the average depth of a pit for a household with 5 members is 3 metres, which
is expected to take about 5 years to fill up. However, more rapid filling has been observed in larger
households: one of the FGD participants in Pachacamac district, whose household is composed of
10 people, mentioned that in the past 3 years his pit has already filled up once, with the second pit
already filling up. The time taken for the pit to fill up is also likely to be shorter in rocky areas, where
digging deep pits is both physically difficult and costly.
Financial aspects
As noted above, collecting data on willingness to pay (WTP) and ability to pay (ATP) was beyond
the scope of this study. However, data were collected on the price paid the last time an FSM service
was used, and whether households thought that price was fair.
First though, it is worth briefly considering finance for containment. Households were asked how
much they spent (in cash, including materials and labour) to build their toilet at the time when it was
built, if they spent cash at all. For non-sewered areas overall, the average cost of an improved facility
was US $283 (n = 256), while the cost for an unimproved facility was US $48 (n = 55).27 Regarding
repairs/maintenance to toilets in the past 12 months (including repairs to mechanism, superstructure
or drainage), the average expenditure for non-sewered areas overall was US $110 (n = 34).28
Although only 9% of households have spent money in maintaining their sanitation facilities, these
amount to 65% of the original investment for their construction.
With regards to payment for FSM services the last time emptying took place (Table 16), the average
amount paid was US $137 (n = 9) for non-sewered areas overall. All households paid the full amount
on delivery, and most of them paid a flat rate (56%) rather than a volumetric charge. These costs
are consistent with those reported by local leaders in Pachacamac district, who suggested that the
26 This data are directly drawn from the following survey question: “How many people use this toilet regularly?” Categories are the same as those used in the survey. Average household size was 4.4. 27 Nb. we did not ask how long ago this was, so are unable to account for inflation and exchange rates, so the results are indicative only. We used the rate 1 Peruvian Nuevo Sol = US $0.32. 28 Most households reported that this expenditure was mainly for repairs to the bowl / slab and for the superstructure (84% in non-sewered areas and 78% in lowest-income areas). Only 2 households (5%) in non-sewered areas incurred costs for emptying their pits in the last 12 months.
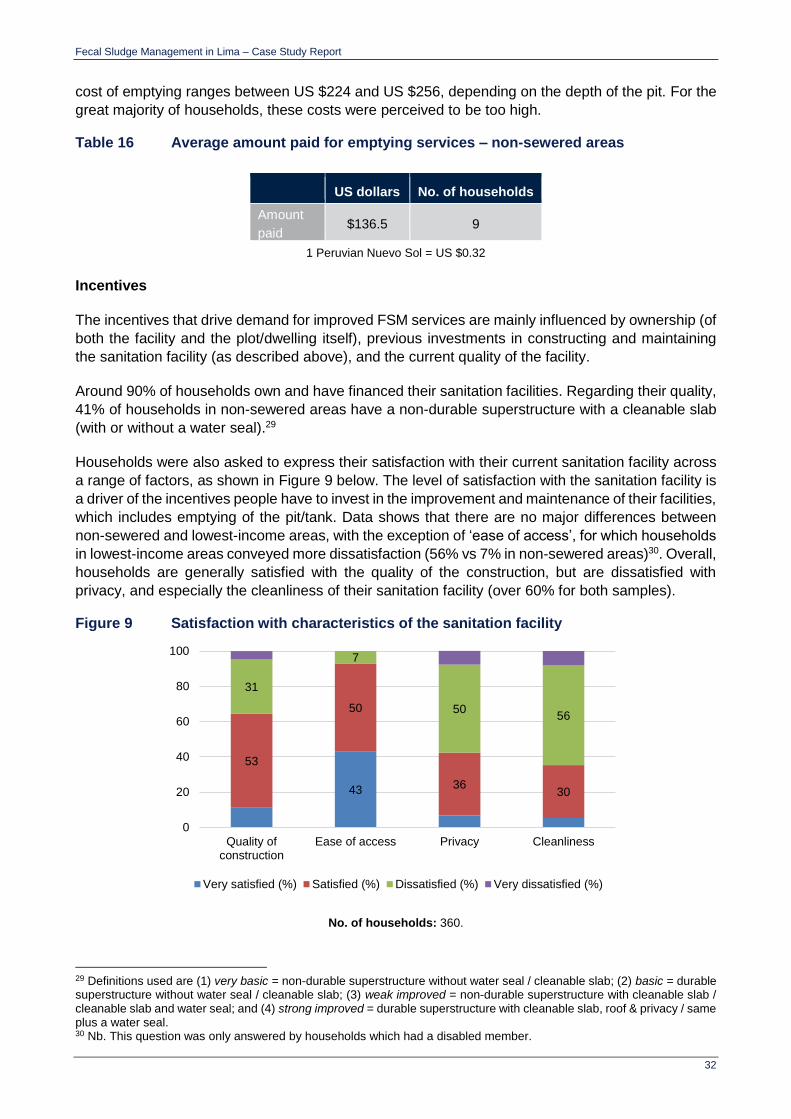
Fecal Sludge Management in Lima – Case Study Report
32
cost of emptying ranges between US $224 and US $256, depending on the depth of the pit. For the
great majority of households, these costs were perceived to be too high.
Table 16 Average amount paid for emptying services – non-sewered areas
US dollars No. of households
Amount
paid $136.5 9
1 Peruvian Nuevo Sol = US $0.32
Incentives
The incentives that drive demand for improved FSM services are mainly influenced by ownership (of
both the facility and the plot/dwelling itself), previous investments in constructing and maintaining
the sanitation facility (as described above), and the current quality of the facility.
Around 90% of households own and have financed their sanitation facilities. Regarding their quality,
41% of households in non-sewered areas have a non-durable superstructure with a cleanable slab
(with or without a water seal).29
Households were also asked to express their satisfaction with their current sanitation facility across
a range of factors, as shown in Figure 9 below. The level of satisfaction with the sanitation facility is
a driver of the incentives people have to invest in the improvement and maintenance of their facilities,
which includes emptying of the pit/tank. Data shows that there are no major differences between
non-sewered and lowest-income areas, with the exception of ‘ease of access’, for which households
in lowest-income areas conveyed more dissatisfaction (56% vs 7% in non-sewered areas)30. Overall,
households are generally satisfied with the quality of the construction, but are dissatisfied with
privacy, and especially the cleanliness of their sanitation facility (over 60% for both samples).
Figure 9 Satisfaction with characteristics of the sanitation facility
No. of households: 360.
29 Definitions used are (1) very basic = non-durable superstructure without water seal / cleanable slab; (2) basic = durable superstructure without water seal / cleanable slab; (3) weak improved = non-durable superstructure with cleanable slab / cleanable slab and water seal; and (4) strong improved = durable superstructure with cleanable slab, roof & privacy / same plus a water seal. 30 Nb. This question was only answered by households which had a disabled member.
43
53
50
3630
31
7
5056
0
20
40
60
80
100
Quality ofconstruction
Ease of access Privacy Cleanliness
Very satisfied (%) Satisfied (%) Dissatisfied (%) Very dissatisfied (%)
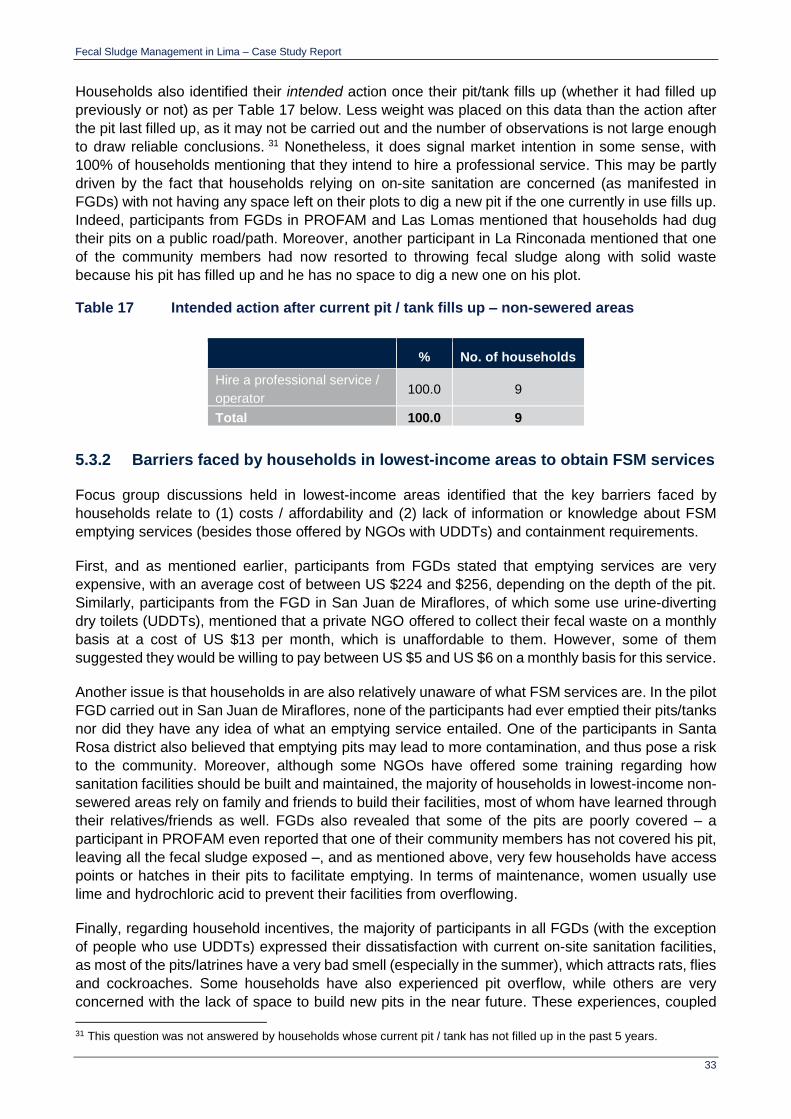
Fecal Sludge Management in Lima – Case Study Report
33
Households also identified their intended action once their pit/tank fills up (whether it had filled up
previously or not) as per Table 17 below. Less weight was placed on this data than the action after
the pit last filled up, as it may not be carried out and the number of observations is not large enough
to draw reliable conclusions. 31 Nonetheless, it does signal market intention in some sense, with
100% of households mentioning that they intend to hire a professional service. This may be partly
driven by the fact that households relying on on-site sanitation are concerned (as manifested in
FGDs) with not having any space left on their plots to dig a new pit if the one currently in use fills up.
Indeed, participants from FGDs in PROFAM and Las Lomas mentioned that households had dug
their pits on a public road/path. Moreover, another participant in La Rinconada mentioned that one
of the community members had now resorted to throwing fecal sludge along with solid waste
because his pit has filled up and he has no space to dig a new one on his plot.
Table 17 Intended action after current pit / tank fills up – non-sewered areas
% No. of households
Hire a professional service /
operator 100.0 9
Total 100.0 9
5.3.2 Barriers faced by households in lowest-income areas to obtain FSM services
Focus group discussions held in lowest-income areas identified that the key barriers faced by
households relate to (1) costs / affordability and (2) lack of information or knowledge about FSM
emptying services (besides those offered by NGOs with UDDTs) and containment requirements.
First, and as mentioned earlier, participants from FGDs stated that emptying services are very
expensive, with an average cost of between US $224 and $256, depending on the depth of the pit.
Similarly, participants from the FGD in San Juan de Miraflores, of which some use urine-diverting
dry toilets (UDDTs), mentioned that a private NGO offered to collect their fecal waste on a monthly
basis at a cost of US $13 per month, which is unaffordable to them. However, some of them
suggested they would be willing to pay between US $5 and US $6 on a monthly basis for this service.
Another issue is that households in are also relatively unaware of what FSM services are. In the pilot
FGD carried out in San Juan de Miraflores, none of the participants had ever emptied their pits/tanks
nor did they have any idea of what an emptying service entailed. One of the participants in Santa
Rosa district also believed that emptying pits may lead to more contamination, and thus pose a risk
to the community. Moreover, although some NGOs have offered some training regarding how
sanitation facilities should be built and maintained, the majority of households in lowest-income non-
sewered areas rely on family and friends to build their facilities, most of whom have learned through
their relatives/friends as well. FGDs also revealed that some of the pits are poorly covered – a
participant in PROFAM even reported that one of their community members has not covered his pit,
leaving all the fecal sludge exposed –, and as mentioned above, very few households have access
points or hatches in their pits to facilitate emptying. In terms of maintenance, women usually use
lime and hydrochloric acid to prevent their facilities from overflowing.
Finally, regarding household incentives, the majority of participants in all FGDs (with the exception
of people who use UDDTs) expressed their dissatisfaction with current on-site sanitation facilities,
as most of the pits/latrines have a very bad smell (especially in the summer), which attracts rats, flies
and cockroaches. Some households have also experienced pit overflow, while others are very
concerned with the lack of space to build new pits in the near future. These experiences, coupled
31 This question was not answered by households whose current pit / tank has not filled up in the past 5 years.

Fecal Sludge Management in Lima – Case Study Report
34
with high prices and lack of knowledge of FSM emptying services, has skewed households towards
regarding sewerage as the only medium- to long-term alternative to their current situation, which
reinforces the lack of demand for FSM services.
5.4 Findings: supply of FSM services
As set out in Section 5.2.2, the supply side assessment is mainly related to the current status and
quality of FSM service delivery as described by KIIs with service providers.
5.4.1 Services effectively supplied
The first stage of the supply analysis should be to consider what services are supplied in the market,
where effective supply intersects with effective demand. Some relevant context was already provided
in Section 3.3.1 by the SFDs, especially in Table 6 and Table 7. These tables show that when pits
have previously filled up, people generally abandon them, although recent behaviour suggests there
may be some scope for FSM emptying services – 9 out of the 10 households in non-sewered areas
for which the pit/tank currently in use filled up claimed to have emptied it. In all instances, services
were provided by a formal service provider (an NGO or a private firm) using a vacuum tanker. These
households were also asked about where the fecal sludge was discharged during emptying, with the
majority responding that contents were discharged into a drum/container (33%) or a tanker truck
(44%).32 The remaining households did not know where the fecal sludge was finally discharged.
5.4.2 Service provider capacity
Given that there are currently no formal FSM services directed at low-income households that rely
on on-site sanitation, there is limited information about the capacity of potential service providers to
cope with demand. 33 Based on KIIs and information provided by the World Bank consultant, there
are two types of service providers: independent NGOs, such as X-Runner or PEBAL, and current
providers servicing public establishments or dealing with solid waste management, e.g. Megapack
Trading S.A.C or Disal.
On one hand, X-Runner targets poor urban households and provides fecal sludge services across
the whole chain. The NGO provides a UDDT to each household, emptying its contents once a week
or every two weeks, treating and re-using the fecal sludge to create compost. The compost is
sometimes given to back to households or as a gift to future clients, but currently the majority of it is
stored at their treatment area in Villa El Salvador. FS is treated as toxic waste by national and local
legislation, which does not allow FS compost to be commercialised. There are three different types
of packages: (i) for two people: 1 UDDT emptied every two weeks at a cost of US $9 per month; (ii)
for three or more people: 2 UDDTs emptied every week at a cost of US $12 per month; and (iii) for
six people or more: 3 to 5 UDDTs emptied every week at a cost of US $16 per month. X-Runner is
currently serving 480 households, the majority of which have 2 UDDTs (74%).
On the other hand, Megapack Trading S.A.C is a large and well-established firm that primarily serves
the municipality (i.e. public establishments) and large industries (including in the mining sector). In
particular, for FSM services in schools, hospitals and social clubs, the service is provided using
mechanical emptying with tanker trucks, which have a capacity of 6, 10 and 30 m3. Services are
reported to be very efficient, with delivery upon request, but costs and limited physical accessibility
32 Households were only asked about the initial discharge point, as they would not always be in a position to know where service providers eventually discharged to. This indicator was only answered by 10 households in non-sewered areas. 33 Although some richer households in wealthy neighbourhoods are serviced by vacuum tankers to empty their septic tanks, these services are usually directed at public establishments, which households can use if they are willing and able to pay the cost.

Fecal Sludge Management in Lima – Case Study Report
35
have been highlighted as some of the potential deterrents for providing services to poor peri-urban
households. Indeed, KIIs with NGOs and service providers have suggested that it may be difficult
for current service providers (mostly specialised in solid waste management) to extend their services
to cover domestic FSM: decentralisation of treatment and improved regulation and monitoring will
be needed. From a purely business perspective, service providers all mentioned the need for a
demand/situation assessment to determine if FSM services for the urban poor are a profitable
endeavour. In addition, during the workshop held in Lima, Disal mentioned that they face two risks:
(i) households not paying and (ii) breaking the law, as legislation regarding FSM is very unclear.
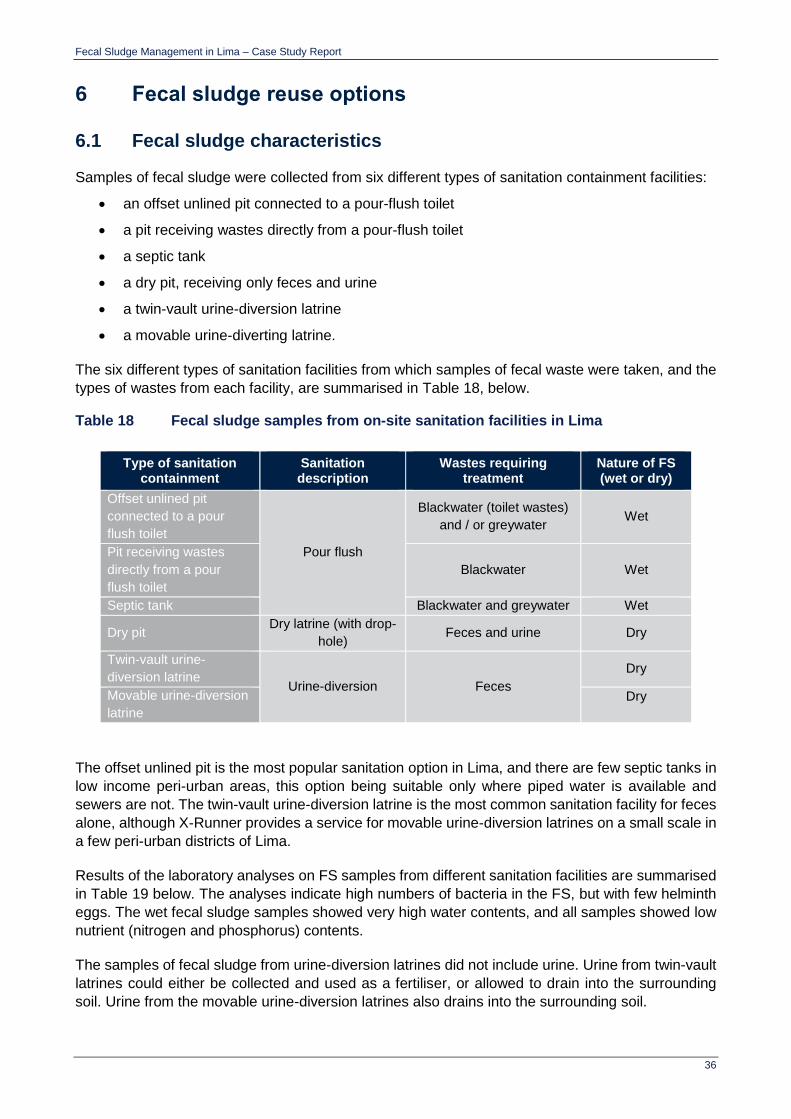
Fecal Sludge Management in Lima – Case Study Report
36
6 Fecal sludge reuse options
6.1 Fecal sludge characteristics
Samples of fecal sludge were collected from six different types of sanitation containment facilities:
an offset unlined pit connected to a pour-flush toilet
a pit receiving wastes directly from a pour-flush toilet
a septic tank
a dry pit, receiving only feces and urine
a twin-vault urine-diversion latrine
a movable urine-diverting latrine.
The six different types of sanitation facilities from which samples of fecal waste were taken, and the
types of wastes from each facility, are summarised in Table 18, below.
Table 18 Fecal sludge samples from on-site sanitation facilities in Lima
Type of sanitation containment
Sanitation description
Wastes requiring treatment
Nature of FS (wet or dry)
Offset unlined pit
connected to a pour
flush toilet
Pour flush
Blackwater (toilet wastes)
and / or greywater Wet
Pit receiving wastes
directly from a pour
flush toilet
Blackwater Wet
Septic tank Blackwater and greywater Wet
Dry pit Dry latrine (with drop-
hole) Feces and urine Dry
Twin-vault urine-
diversion latrine Urine-diversion Feces
Dry
Movable urine-diversion
latrine
Dry
The offset unlined pit is the most popular sanitation option in Lima, and there are few septic tanks in
low income peri-urban areas, this option being suitable only where piped water is available and
sewers are not. The twin-vault urine-diversion latrine is the most common sanitation facility for feces
alone, although X-Runner provides a service for movable urine-diversion latrines on a small scale in
a few peri-urban districts of Lima.
Results of the laboratory analyses on FS samples from different sanitation facilities are summarised
in Table 19 below. The analyses indicate high numbers of bacteria in the FS, but with few helminth
eggs. The wet fecal sludge samples showed very high water contents, and all samples showed low
nutrient (nitrogen and phosphorus) contents.
The samples of fecal sludge from urine-diversion latrines did not include urine. Urine from twin-vault
latrines could either be collected and used as a fertiliser, or allowed to drain into the surrounding
soil. Urine from the movable urine-diversion latrines also drains into the surrounding soil.
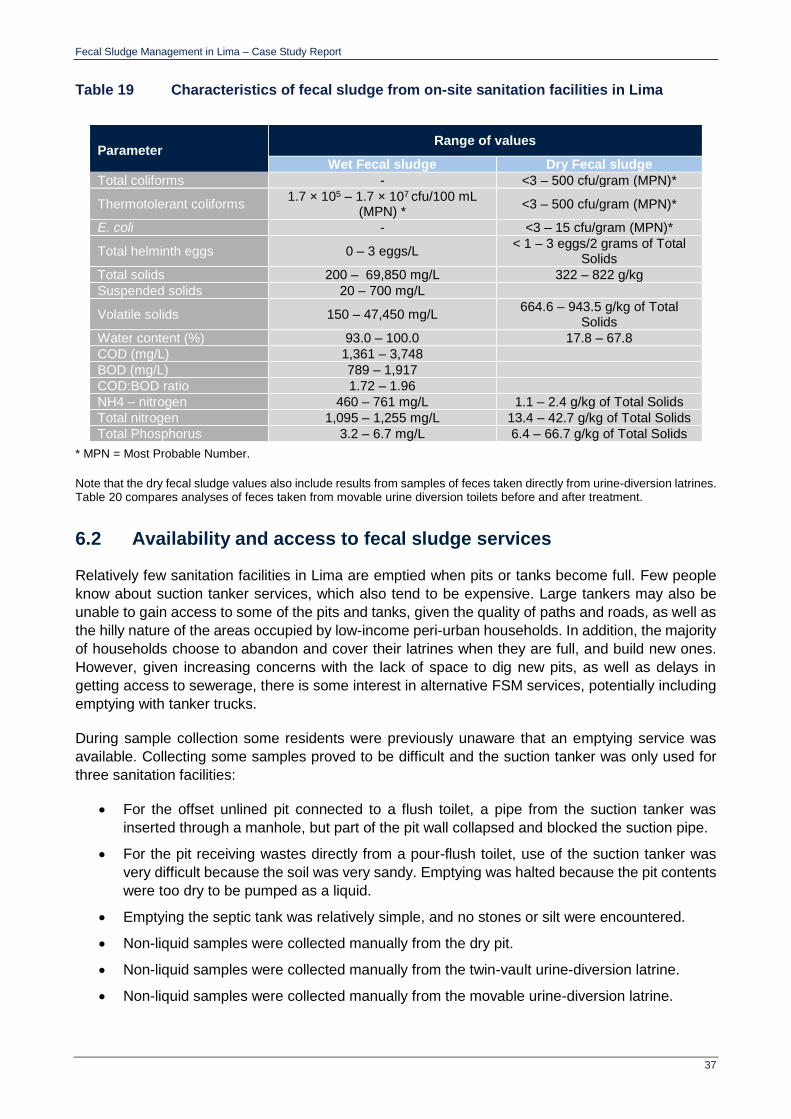
Fecal Sludge Management in Lima – Case Study Report
37
Table 19 Characteristics of fecal sludge from on-site sanitation facilities in Lima
Parameter Range of values
Wet Fecal sludge Dry Fecal sludge
Total coliforms - <3 – 500 cfu/gram (MPN)*
Thermotolerant coliforms 1.7 × 10⁵ – 1.7 × 10⁷ cfu/100 mL
(MPN) * <3 – 500 cfu/gram (MPN)*
E. coli - <3 – 15 cfu/gram (MPN)*
Total helminth eggs 0 – 3 eggs/L < 1 – 3 eggs/2 grams of Total
Solids
Total solids 200 – 69,850 mg/L 322 – 822 g/kg
Suspended solids 20 – 700 mg/L
Volatile solids 150 – 47,450 mg/L 664.6 – 943.5 g/kg of Total
Solids
Water content (%) 93.0 – 100.0 17.8 – 67.8
COD (mg/L) 1,361 – 3,748
BOD (mg/L) 789 – 1,917
COD:BOD ratio 1.72 – 1.96
NH4 – nitrogen 460 – 761 mg/L 1.1 – 2.4 g/kg of Total Solids
Total nitrogen 1,095 – 1,255 mg/L 13.4 – 42.7 g/kg of Total Solids
Total Phosphorus 3.2 – 6.7 mg/L 6.4 – 66.7 g/kg of Total Solids
* MPN = Most Probable Number.
Note that the dry fecal sludge values also include results from samples of feces taken directly from urine-diversion latrines. Table 20 compares analyses of feces taken from movable urine diversion toilets before and after treatment.
6.2 Availability and access to fecal sludge services
Relatively few sanitation facilities in Lima are emptied when pits or tanks become full. Few people
know about suction tanker services, which also tend to be expensive. Large tankers may also be
unable to gain access to some of the pits and tanks, given the quality of paths and roads, as well as
the hilly nature of the areas occupied by low-income peri-urban households. In addition, the majority
of households choose to abandon and cover their latrines when they are full, and build new ones.
However, given increasing concerns with the lack of space to dig new pits, as well as delays in
getting access to sewerage, there is some interest in alternative FSM services, potentially including
emptying with tanker trucks.
During sample collection some residents were previously unaware that an emptying service was
available. Collecting some samples proved to be difficult and the suction tanker was only used for
three sanitation facilities:
For the offset unlined pit connected to a flush toilet, a pipe from the suction tanker was
inserted through a manhole, but part of the pit wall collapsed and blocked the suction pipe.
For the pit receiving wastes directly from a pour-flush toilet, use of the suction tanker was
very difficult because the soil was very sandy. Emptying was halted because the pit contents
were too dry to be pumped as a liquid.
Emptying the septic tank was relatively simple, and no stones or silt were encountered.
Non-liquid samples were collected manually from the dry pit.
Non-liquid samples were collected manually from the twin-vault urine-diversion latrine.
Non-liquid samples were collected manually from the movable urine-diversion latrine.
Fecal Sludge Management in Lima – Case Study Report
38
6.2.1 Treatment
There are currently no treatment facilities in Lima for FS, and no organised systems for collection,
except in some rich coastal areas of the city where dwellings usually have a flush latrine with a septic
tank. When septic tanks are emptied, it is reported that the fecal sludge is illegally dumped in
SEDAPAL sewers, landfill sites or in open spaces in nearby peri-urban areas, as there are no
treatment plants designed specifically for fecal sludge.
X-Runner provides emptying, transport, treatment and reuse services in Villa El Salvador, Pamplona
Alta and Villa María del Triunfo for mobile urine-diversion latrines. Feces from these latrines are
taken to a small treatment plant where they are mixed with sawdust, and bacteria are added to
encourage composting. The material is left to compost in plastic bags, before being mixed and stored
for future sale as compost.
6.2.2 Re-use
In the absence of services for collection and treatment of fecal sludge in Lima, there is currently little,
if any, re-use, and very little prospect of significant re-use in the foreseeable future. Most pits are
abandoned when full, and emptying pits may damage the walls of pits, especially those that are
unlined.
Permanent twin-vault latrines have been constructed in a few districts. One vault is used at any time
and, when it is full, it is allowed to ‘rest’ while the second vault is used. By the time that the second
vault is almost full, the contents of the first vault should be dry and inoffensive, and could be applied
to agricultural land. Between 2000 and 2006, some 225 twin-vault latrines were constructed in Lima,
but it is reported that only 62% (140) of these are currently in use. A further 145 were constructed
between 2010 and 2014, of which more than 90% are in use. It is not clear how the urine and dried
feces are used or disposed of.
As mentioned above, X-Runner (based in the Villa El Salvador district) has supplied mobile urine-
diversion latrines to residents in 3 different areas. X-Runner services these toilets, providing an
emptying, transport, and treatment service. Feces are collected on a weekly basis from the
containers and transported to a private treatment facility, where compost is produced for possible
future reuse. The treatment process and final product have not been accredited as yet, and the
company is currently seeking a licence to sell the treated compost commercially. The final product
is currently being stored in plastic sacks until it can be sold.
Table 20 below, shows analyses of fresh and treated samples of feces from urine-diversion latrines
supplied and serviced by X-Runner. Few conclusions can be drawn from the analyses. The samples
of fresh and treated feces are independent of one another, but some results are surprising. They
appear to show an increase in the number of Total coliforms during treatment, while numbers of
Thermotolerant coliforms remain unchanged. The overwhelming majority of any sample of
Thermotolerant coliforms are E. coli, yet the results show very few Thermotolerant coliforms being
E. coli. Helminth eggs were detected after, but not before, treatment, and the moisture content of the
material remained constant. It is difficult to account for these anomalies. The increase in Total
coliforms may be associated with the composting process, and most other anomalies may be
attributed to samples being taken from different process streams. The most surprising result is the
very low percentages of Thermotolerant coliforms identified as E. coli, suggesting errors in the
bacterial analysis. The treated feces have limited value as a natural fertilizer, but could be used as
a soil improver if the numbers of bacteria and helminth eggs are reduced.

Fecal Sludge Management in Lima – Case Study Report
39
Table 20 Characteristics of fresh and treated feces from movable urine-diversion latrines in Lima
Parameter Values
Fresh Feces Treated Feces
Total coliforms – cfu/gram (MPN)* 500 > 1,100
Thermotolerant coliforms – cfu/gram (MPN)* 500 500
E. coli – cfu/gram (MPN)* 15 4
Total helminth eggs (eggs/2 grams of Total Solids)
- 5
Total solids (g/kg) 322.2 312.5
Volatile solids (g/kg of Total Solids) 943.5 711.9
Water content (%) 67.8 68.8
NH4 – nitrogen (g/kg of Total Solids) 1.2 1.1
Total nitrogen (g/kg of Total Solids) 24.7 25.2
Total Phosphorus (g/kg of Total Solids) 15.5 18.4
* MPN = Most Probable Number.
6.2.3 Possible future reuse options
Some of the possible reuse options for fecal sludge include: (1) using treated fecal sludge as a soil
conditioner or organic fertiliser; (2) using dried fecal sludge as a fuel; (3) generating biogas from
anaerobic digestion of FS; (4) producing protein for use as animal feed, and (5) including fecal sludge
in building materials. In the absence of any centralised services for emptying pits and septic tanks,
or for treating FS, the only current potential reuse option is localised use of dried feces as a soil
conditioner or organic fertiliser. Management of this, albeit on a small scale, may improve if X-Runner
obtains a licence to sell their treated compost commercially and generate a profit. Future reuse
opportunities in Lima are therefore limited, unless centralised fecal sludge collection and treatment
services are introduced and managed.
KIIs suggest that SEDAPAL and private service providers are generally keen on creating a reuse
market but are deterred by the lack of adequate treatment facilities for fecal sludge and/or a clear
institutional framework to support its development. However, wastewater reuse was legalised in
2010 and is currently being used in urban and peri-urban green areas.34 These guidelines may thus
provide an entry point for fecal sludge end-products to be used for similar purposes, as well as in
peri-urban small-scale agriculture.
34 The Ministry of Housing, Construction and Sanitation approved the “Policy Guidelines for the Promotion of Treatment for Domestic and Municipal Wastewater Reuse for Irrigation of Urban and Peri-Urban Green Areas” in November 2010.
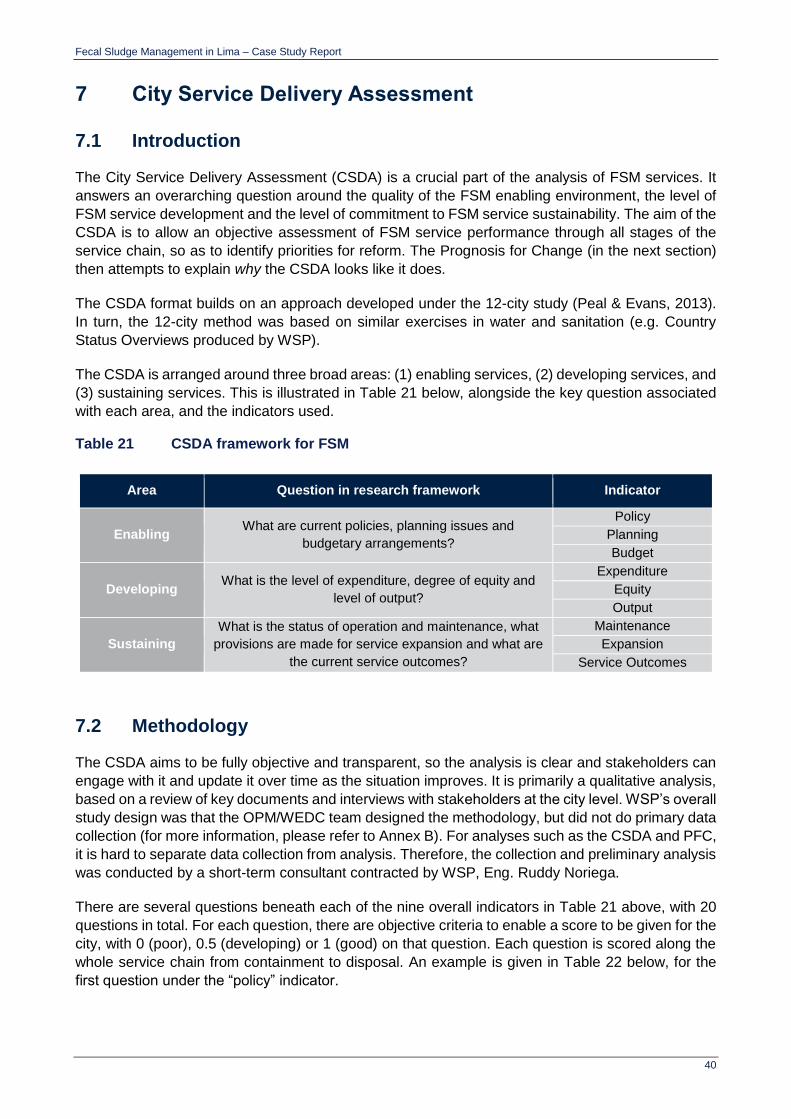
Fecal Sludge Management in Lima – Case Study Report
40
7 City Service Delivery Assessment
7.1 Introduction
The City Service Delivery Assessment (CSDA) is a crucial part of the analysis of FSM services. It
answers an overarching question around the quality of the FSM enabling environment, the level of
FSM service development and the level of commitment to FSM service sustainability. The aim of the
CSDA is to allow an objective assessment of FSM service performance through all stages of the
service chain, so as to identify priorities for reform. The Prognosis for Change (in the next section)
then attempts to explain why the CSDA looks like it does.
The CSDA format builds on an approach developed under the 12-city study (Peal & Evans, 2013).
In turn, the 12-city method was based on similar exercises in water and sanitation (e.g. Country
Status Overviews produced by WSP).
The CSDA is arranged around three broad areas: (1) enabling services, (2) developing services, and
(3) sustaining services. This is illustrated in Table 21 below, alongside the key question associated
with each area, and the indicators used.
Table 21 CSDA framework for FSM
Area Question in research framework Indicator
Enabling What are current policies, planning issues and
budgetary arrangements?
Policy
Planning
Budget
Developing What is the level of expenditure, degree of equity and
level of output?
Expenditure
Equity
Output
Sustaining
What is the status of operation and maintenance, what
provisions are made for service expansion and what are
the current service outcomes?
Maintenance
Expansion
Service Outcomes
7.2 Methodology
The CSDA aims to be fully objective and transparent, so the analysis is clear and stakeholders can
engage with it and update it over time as the situation improves. It is primarily a qualitative analysis,
based on a review of key documents and interviews with stakeholders at the city level. WSP’s overall
study design was that the OPM/WEDC team designed the methodology, but did not do primary data
collection (for more information, please refer to Annex B). For analyses such as the CSDA and PFC,
it is hard to separate data collection from analysis. Therefore, the collection and preliminary analysis
was conducted by a short-term consultant contracted by WSP, Eng. Ruddy Noriega.
There are several questions beneath each of the nine overall indicators in Table 21 above, with 20
questions in total. For each question, there are objective criteria to enable a score to be given for the
city, with 0 (poor), 0.5 (developing) or 1 (good) on that question. Each question is scored along the
whole service chain from containment to disposal. An example is given in Table 22 below, for the
first question under the “policy” indicator.
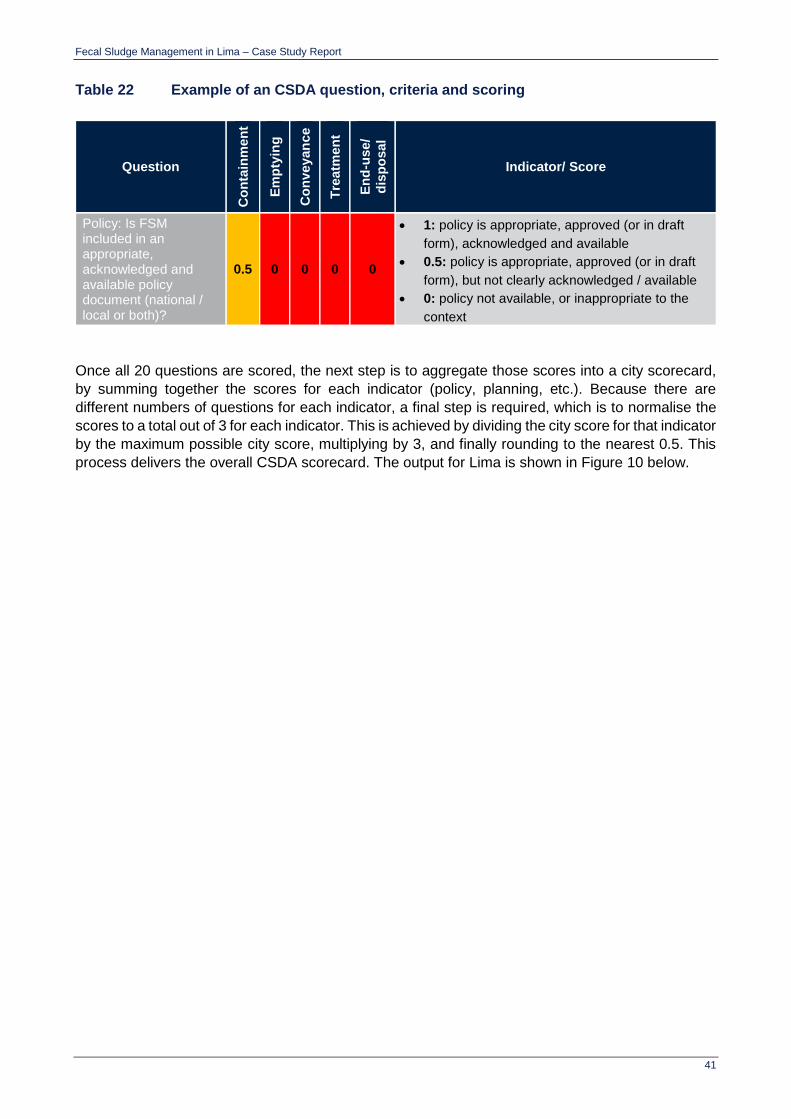
Fecal Sludge Management in Lima – Case Study Report
41
Table 22 Example of an CSDA question, criteria and scoring
Question
Co
nta
inm
en
t
Em
pty
ing
Co
nveyan
ce
Tre
atm
en
t
En
d-u
se/
dis
po
sal
Indicator/ Score
Policy: Is FSM included in an appropriate, acknowledged and available policy document (national / local or both)?
0.5 0 0 0 0
1: policy is appropriate, approved (or in draft
form), acknowledged and available
0.5: policy is appropriate, approved (or in draft
form), but not clearly acknowledged / available
0: policy not available, or inappropriate to the
context
Once all 20 questions are scored, the next step is to aggregate those scores into a city scorecard,
by summing together the scores for each indicator (policy, planning, etc.). Because there are
different numbers of questions for each indicator, a final step is required, which is to normalise the
scores to a total out of 3 for each indicator. This is achieved by dividing the city score for that indicator
by the maximum possible city score, multiplying by 3, and finally rounding to the nearest 0.5. This
process delivers the overall CSDA scorecard. The output for Lima is shown in Figure 10 below.
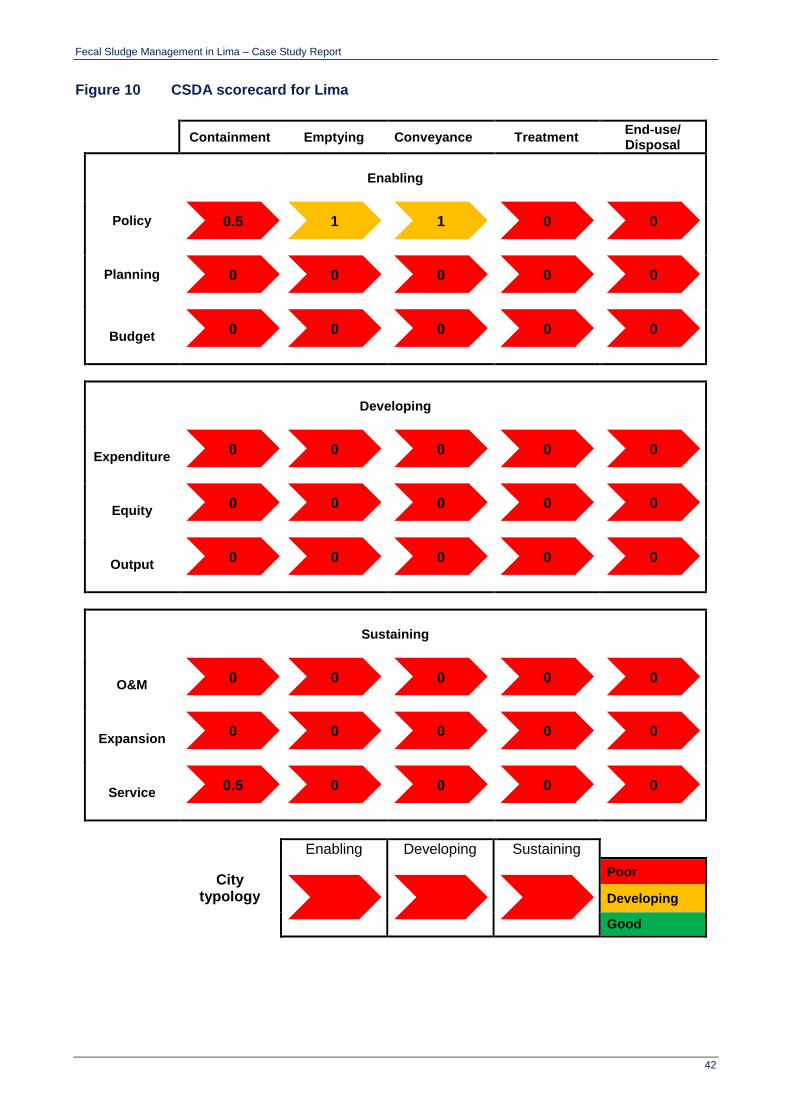
Fecal Sludge Management in Lima – Case Study Report
42
Figure 10 CSDA scorecard for Lima
Containment Emptying Conveyance Treatment End-use/ Disposal
Enabling
Policy
Planning
Budget
Developing
Expenditure
Equity
Output
Sustaining
O&M
Expansion
Service
City typology
Enabling Developing Sustaining
Poor
Developing
Good
0.5 1 1 0 0
0 0 0 0 0
0 0 0 0 0
0 0 0 0 0
0 0 0 0 0
0 0 0 0 0
0 0 0 0 0
0 0 0 0 0
0.5 0 0 0 0
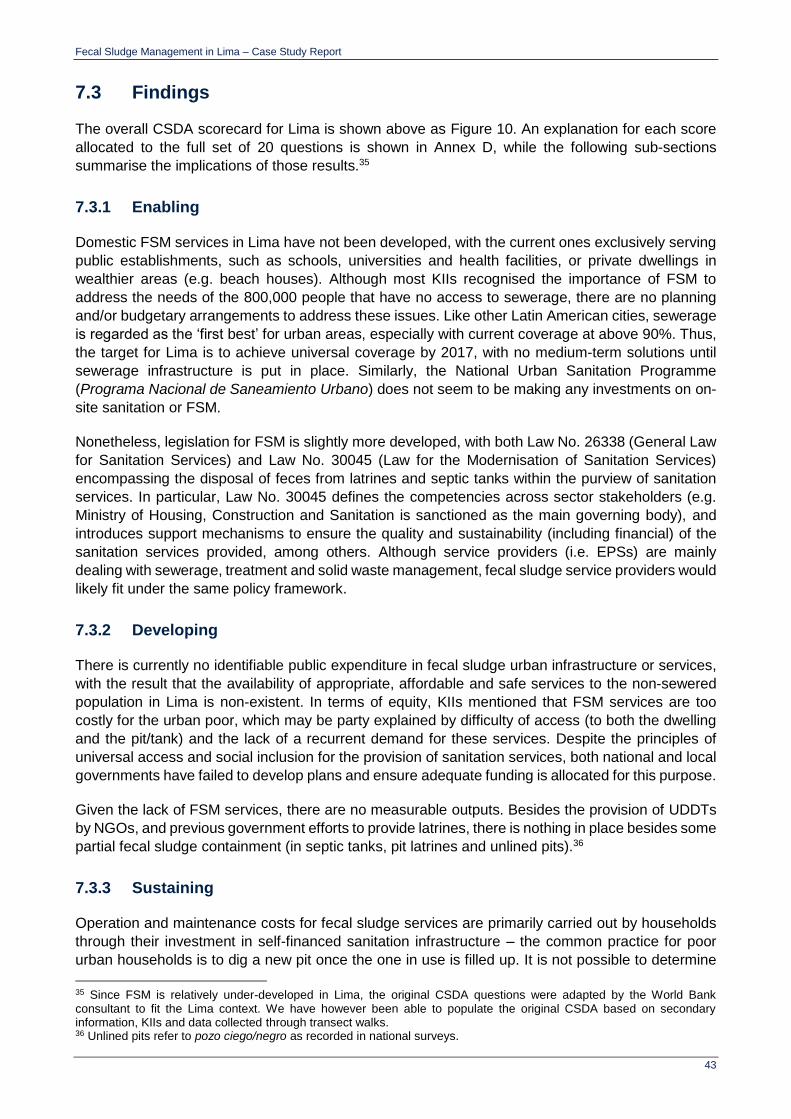
Fecal Sludge Management in Lima – Case Study Report
43
7.3 Findings
The overall CSDA scorecard for Lima is shown above as Figure 10. An explanation for each score
allocated to the full set of 20 questions is shown in Annex D, while the following sub-sections
summarise the implications of those results.35
7.3.1 Enabling
Domestic FSM services in Lima have not been developed, with the current ones exclusively serving
public establishments, such as schools, universities and health facilities, or private dwellings in
wealthier areas (e.g. beach houses). Although most KIIs recognised the importance of FSM to
address the needs of the 800,000 people that have no access to sewerage, there are no planning
and/or budgetary arrangements to address these issues. Like other Latin American cities, sewerage
is regarded as the ‘first best’ for urban areas, especially with current coverage at above 90%. Thus,
the target for Lima is to achieve universal coverage by 2017, with no medium-term solutions until
sewerage infrastructure is put in place. Similarly, the National Urban Sanitation Programme
(Programa Nacional de Saneamiento Urbano) does not seem to be making any investments on on-
site sanitation or FSM.
Nonetheless, legislation for FSM is slightly more developed, with both Law No. 26338 (General Law
for Sanitation Services) and Law No. 30045 (Law for the Modernisation of Sanitation Services)
encompassing the disposal of feces from latrines and septic tanks within the purview of sanitation
services. In particular, Law No. 30045 defines the competencies across sector stakeholders (e.g.
Ministry of Housing, Construction and Sanitation is sanctioned as the main governing body), and
introduces support mechanisms to ensure the quality and sustainability (including financial) of the
sanitation services provided, among others. Although service providers (i.e. EPSs) are mainly
dealing with sewerage, treatment and solid waste management, fecal sludge service providers would
likely fit under the same policy framework.
7.3.2 Developing
There is currently no identifiable public expenditure in fecal sludge urban infrastructure or services,
with the result that the availability of appropriate, affordable and safe services to the non-sewered
population in Lima is non-existent. In terms of equity, KIIs mentioned that FSM services are too
costly for the urban poor, which may be party explained by difficulty of access (to both the dwelling
and the pit/tank) and the lack of a recurrent demand for these services. Despite the principles of
universal access and social inclusion for the provision of sanitation services, both national and local
governments have failed to develop plans and ensure adequate funding is allocated for this purpose.
Given the lack of FSM services, there are no measurable outputs. Besides the provision of UDDTs
by NGOs, and previous government efforts to provide latrines, there is nothing in place besides some
partial fecal sludge containment (in septic tanks, pit latrines and unlined pits).36
7.3.3 Sustaining
Operation and maintenance costs for fecal sludge services are primarily carried out by households
through their investment in self-financed sanitation infrastructure – the common practice for poor
urban households is to dig a new pit once the one in use is filled up. It is not possible to determine
35 Since FSM is relatively under-developed in Lima, the original CSDA questions were adapted by the World Bank consultant to fit the Lima context. We have however been able to populate the original CSDA based on secondary information, KIIs and data collected through transect walks. 36 Unlined pits refer to pozo ciego/negro as recorded in national surveys.

Fecal Sludge Management in Lima – Case Study Report
44
with certainty how many of the pits are properly covered or sealed. Given the high level of sewerage
coverage overall, the risk to public health is often deemed to be quite low – although there could be
a high risk of environmental pollution in poorer areas where the use of unlined pits is common,
resulting in pit collapse or abandoned pits not being covered safely.
One of the main issues is the lack of demand from households for services, as this reinforces the
government’s inaction with regards to FSM development and strengthening. The majority of KIIs
confirmed that there are no government programmes or support for service providers, and no formal
systems that serve the urban poor, with the exception of small NGO initiatives that provide alternative
sanitation systems, mainly in the form of urine-diverting dry toilets.
7.3.4 Implications of the CSDA scorecard
The resulting CSDA scorecard of the FSM service delivery assessment in Figure 10 reveals a
complete absence of public policy, capital investment and operational oversight of FSM. Although
for the city as a whole, the lack of FSM services may not seem to be a priority (given the high level
of sewerage coverage), there are 800,000 people in poor areas without a real and sustainable
solution to their daily sanitation needs.
In a way, policy and regulatory frameworks already allow for the provision of emptying and transport
services to households, as feces disposal is encompassed within the national definition of sanitation
services. Current service providers of treatment and solid waste management are also likely to be
able to cope and adapt to an increase in demand, assuming that the legal provisions to ensure their
financial sustainability (Law No. 30045) are guaranteed. Through KIIs, SEDAPAL and other
stakeholders also agreed on the need to fill this gap for the urban poor, and some manifested their
willingness to get involved in the provision of adequate FSM services, as long as both national and
local governments show commitment and provide the necessary support.
This suggests that what is needed is a space for open dialogue and engagement of public, private
and civil society bodies to ensure that the appropriate infrastructure and services are systematically
developed and adapted to respond to the various contextual challenges of the city (space, tenancy,
poverty, etc.). Segmentation and lack of coordination is already a key constraint in the provision of
basic services, so bringing all key stakeholders together and aiming at reaching a consensus on a
course of action, is an imperative. A clear definition and agreement of the roles of different
stakeholders along the sanitation service chain is also required, with a particular focus on developing
adequate containment and treatment frameworks, and strengthening both emptying and transport
components.

Fecal Sludge Management in Lima – Case Study Report
45
8 Prognosis for Change
8.1 Introduction
This chapter provides a Prognosis for Change (PFC), by considering the positions of various
stakeholders, in particular the institutions and incentives at play. In the sanitation sector, key studies
considering these questions include a multi-country study carried out by WSP with OPM (WSP,
2010) and a series of papers by the Overseas Development Institute (ODI, 2013). In addition,
SANDEC’s recent FSM book includes a chapter on stakeholder analysis, which is a key methodology
for this kind of analysis (Strande et al, 2014). Through this prognosis for change, it is intended to
understand three elements, which are briefly outlined below and in Figure 11.
Firstly, a PFC considers how institutions function. Here, institutions are defined as “the rules and
norms governing human interaction”, rather than a narrower definition of organisations. Institutions
can be formal – such as codified laws, e.g. a by-law about where fecal sludge can be legally dumped
– and informal, as is the case of social norms, such as prevailing attitudes towards reusing fecal
sludge in agriculture.
Secondly, a PFC considers the incentives which institutions provide to different stakeholders. A
stakeholder is any individual or group with an interest in the outcomes of a policy. In FSM,
stakeholders may include sludge truck companies, the municipality, or poor households.
Stakeholders can be defined broadly or narrowly as required by the breadth and depth of the
analysis. For example, the former stakeholders could be narrowed to recent entrants to the sludge
truck market, the planning department of the municipality, or poor female dwellers. This allows for a
more nuanced analysis rather than taking all organisations as homogeneous.
Third, a PFC considers how stakeholders exert influence. Here, influence is defined as the formal or
informal power to cause something or to prevent it from occurring. In FSM, it might be worth
considering municipality by-laws on FS. A municipality may have formal legal power, but if all their
by-laws are openly flouted by service providers without fear of punishment, then their influence is
very low by that measure. They may however have informal power to influence the FSM market in
other ways, such as the actions undertaken by employees when they identify a blocked sewer pipe.
Finally, for a PFC to be practically useful, it should also consider the implications of the findings for
effective engagement in a reform or change process. This involves the assessment of the options
for engagement, and weighing them up in the context of the prevalent power dynamics and likely
response of stakeholders.
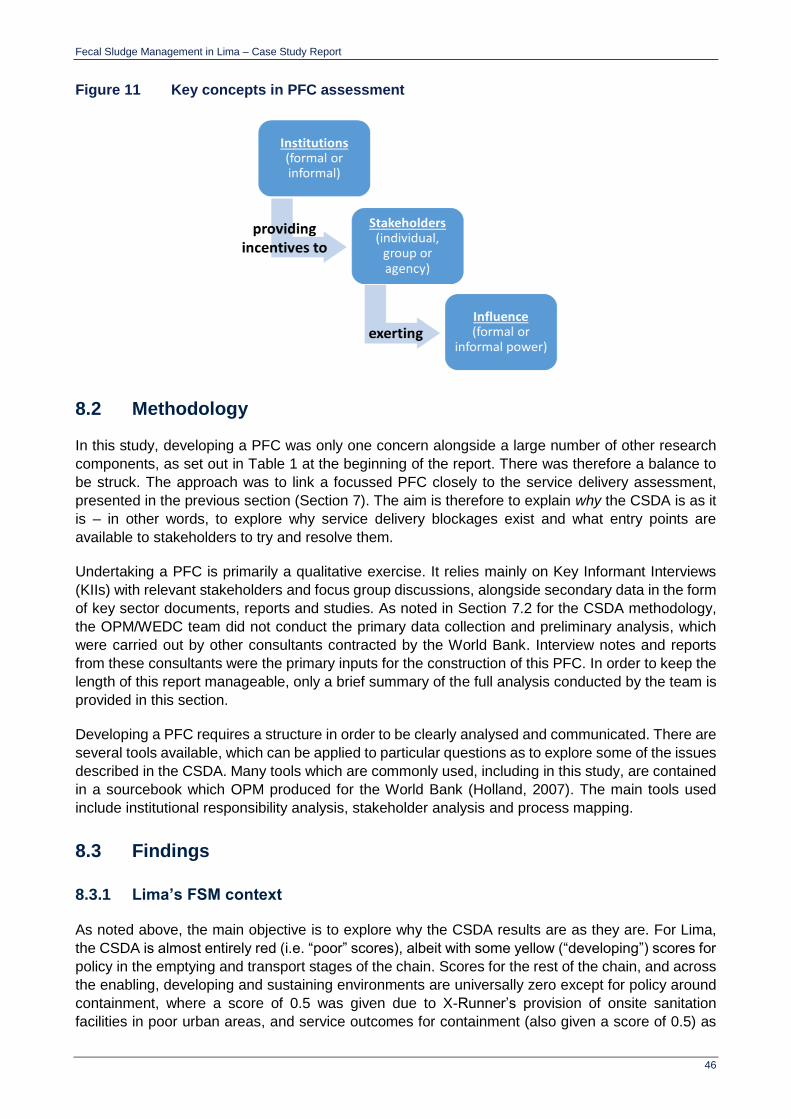
Fecal Sludge Management in Lima – Case Study Report
46
Figure 11 Key concepts in PFC assessment
8.2 Methodology
In this study, developing a PFC was only one concern alongside a large number of other research
components, as set out in Table 1 at the beginning of the report. There was therefore a balance to
be struck. The approach was to link a focussed PFC closely to the service delivery assessment,
presented in the previous section (Section 7). The aim is therefore to explain why the CSDA is as it
is – in other words, to explore why service delivery blockages exist and what entry points are
available to stakeholders to try and resolve them.
Undertaking a PFC is primarily a qualitative exercise. It relies mainly on Key Informant Interviews
(KIIs) with relevant stakeholders and focus group discussions, alongside secondary data in the form
of key sector documents, reports and studies. As noted in Section 7.2 for the CSDA methodology,
the OPM/WEDC team did not conduct the primary data collection and preliminary analysis, which
were carried out by other consultants contracted by the World Bank. Interview notes and reports
from these consultants were the primary inputs for the construction of this PFC. In order to keep the
length of this report manageable, only a brief summary of the full analysis conducted by the team is
provided in this section.
Developing a PFC requires a structure in order to be clearly analysed and communicated. There are
several tools available, which can be applied to particular questions as to explore some of the issues
described in the CSDA. Many tools which are commonly used, including in this study, are contained
in a sourcebook which OPM produced for the World Bank (Holland, 2007). The main tools used
include institutional responsibility analysis, stakeholder analysis and process mapping.
8.3 Findings
8.3.1 Lima’s FSM context
As noted above, the main objective is to explore why the CSDA results are as they are. For Lima,
the CSDA is almost entirely red (i.e. “poor” scores), albeit with some yellow (“developing”) scores for
policy in the emptying and transport stages of the chain. Scores for the rest of the chain, and across
the enabling, developing and sustaining environments are universally zero except for policy around
containment, where a score of 0.5 was given due to X-Runner’s provision of onsite sanitation
facilities in poor urban areas, and service outcomes for containment (also given a score of 0.5) as
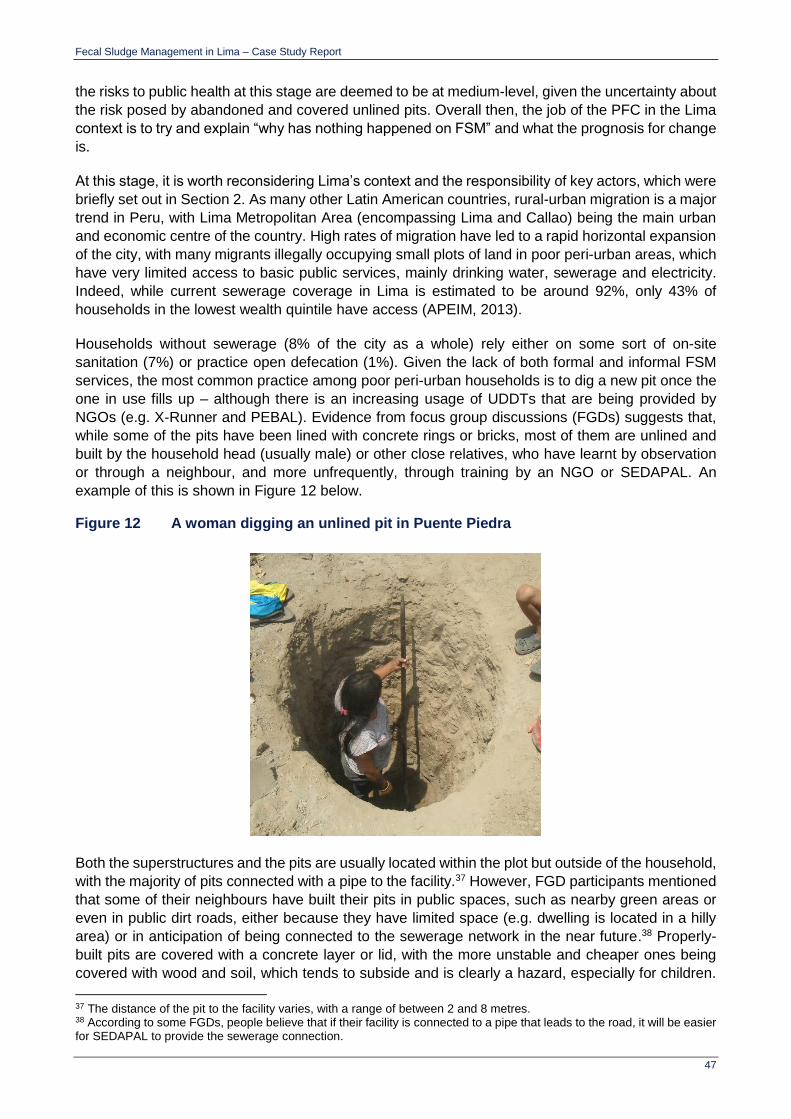
Fecal Sludge Management in Lima – Case Study Report
47
the risks to public health at this stage are deemed to be at medium-level, given the uncertainty about
the risk posed by abandoned and covered unlined pits. Overall then, the job of the PFC in the Lima
context is to try and explain “why has nothing happened on FSM” and what the prognosis for change
is.
At this stage, it is worth reconsidering Lima’s context and the responsibility of key actors, which were
briefly set out in Section 2. As many other Latin American countries, rural-urban migration is a major
trend in Peru, with Lima Metropolitan Area (encompassing Lima and Callao) being the main urban
and economic centre of the country. High rates of migration have led to a rapid horizontal expansion
of the city, with many migrants illegally occupying small plots of land in poor peri-urban areas, which
have very limited access to basic public services, mainly drinking water, sewerage and electricity.
Indeed, while current sewerage coverage in Lima is estimated to be around 92%, only 43% of
households in the lowest wealth quintile have access (APEIM, 2013).
Households without sewerage (8% of the city as a whole) rely either on some sort of on-site
sanitation (7%) or practice open defecation (1%). Given the lack of both formal and informal FSM
services, the most common practice among poor peri-urban households is to dig a new pit once the
one in use fills up – although there is an increasing usage of UDDTs that are being provided by
NGOs (e.g. X-Runner and PEBAL). Evidence from focus group discussions (FGDs) suggests that,
while some of the pits have been lined with concrete rings or bricks, most of them are unlined and
built by the household head (usually male) or other close relatives, who have learnt by observation
or through a neighbour, and more unfrequently, through training by an NGO or SEDAPAL. An
example of this is shown in Figure 12 below.
Figure 12 A woman digging an unlined pit in Puente Piedra
Both the superstructures and the pits are usually located within the plot but outside of the household,
with the majority of pits connected with a pipe to the facility.37 However, FGD participants mentioned
that some of their neighbours have built their pits in public spaces, such as nearby green areas or
even in public dirt roads, either because they have limited space (e.g. dwelling is located in a hilly
area) or in anticipation of being connected to the sewerage network in the near future.38 Properly-
built pits are covered with a concrete layer or lid, with the more unstable and cheaper ones being
covered with wood and soil, which tends to subside and is clearly a hazard, especially for children.
37 The distance of the pit to the facility varies, with a range of between 2 and 8 metres. 38 According to some FGDs, people believe that if their facility is connected to a pipe that leads to the road, it will be easier for SEDAPAL to provide the sewerage connection.
Fecal Sludge Management in Lima – Case Study Report
48
FGD participants even commented on a pit being used but left open, regardless of complaints by
neighbours related to bad smell, flies and other environmental and hygiene concerns. Once full, pits
are sealed with lime, rocks, wood and soil, and a new pit is built nearby or any nearby available
space. The lack of space to dig new pits is an increasing concern for poor non-sewered households,
with many not knowing what they will do once the pit in use fills up. There have even been reports
during FGDs of people using buckets or potty chairs and throwing their contents in a refuse bag
along with all other solid waste due to the pit having filled up and no space left for digging a new
one. Poor FSM is coupled with poor solid waste management (SWM), increasing health risks and
environmental hazards in these neighbourhoods.
On the supply side, SEDAPAL faces high costs for the provision of both water and sanitation services
to peri-urban areas, partly explained by the type of terrain occupied by poor households (e.g. rocky
and hilly areas, land intended for agricultural use, etc.), but also by the lack of land ownership and
titling. Private or tertiary service providers are mainly reported to serve wealthier areas of the city or
public institutions (e.g. schools and health facilities), where people have the ability to pay for
emptying and transport of FS, and FSM is thus a profitable business. FGD participants referred to
one or two cases where emptying services were provided to a poor peri-urban dweller, but this is
extremely occasional and unaffordable for the majority of households in these areas. Other barriers
for the provision of services in poor peri-urban areas include access to dwellings, given the hilly
landscape of some of these neighbourhoods and the lack of adequate roads, as well as access to
the pits and methods for emptying, given that the quality of their construction (and the terrain itself)
is precarious. NGOs, such as X-Runner, provide FSM services across the whole chain, but these
initiatives are still at ‘pilot-level’, serving few households and, in some cases, remaining unaffordable.
On the demand side, there is a very low level of demand for FSM services due to a lack of knowledge
of the possibility of FSM services (or high prices for vacuum truck services, when people knew of
their existence). Indeed, the majority of FGD participants did not know that emptying services exist
or that their private pits could potentially be emptied. With regard to cost, discussions also suggest
that in some neighbourhoods people are simply not willing to pay for FSM services (regardless of
the cost), expecting to receive services for ‘free’ or being comfortable with the status quo. Moreover,
on-site sanitation is generally conceived as a temporary solution with the expectation that both piped
water and sewerage will be provided in the short- to medium-term (this is true even for current users
of UDDTs). Many households have not observed any improvement in the past 5 to10 years, with
lack of progress being primarily linked to costs and the lack of land titling and formalisation of the
human settlement, which is a pre-requisite of SEDAPAL. Most FGD participants claimed that they
have already submitted their documents (i.e. land titles or plano visado) and are waiting for a
response in upcoming months. It must be noted as well that, contrary to service provision in rural
areas, SEDAPAL is not able to intervene at the intra-domiciliary level in urban or peri-urban areas,
limiting its ability to provide alternative sanitation services to households in non-sewered areas.
Overall, there is no formal FSM market for poor non-sewered households in Lima – while vacuum
truck services are demanded and supplied in some parts of the city, there is no such market in poor
peri-urban areas. On one hand, the problem has relatively low visibility given the high level of
sewerage coverage and the concentration of on-site sanitation among the urban poor. On the other
hand, given the low ability and willingness to pay of poor households, FSM services are not
demanded and hence, private or tertiary stakeholders have limited incentives to develop a market
that is likely to be financially unprofitable and unsustainable. However, SEDAPAL is currently
designing a pilot for the provision of decentralised water supply and sanitation services, including
FSM, in poor peri-urban areas. FSM services may be coupled with ‘sanitation marketing’ to offer
poor households different on-site sanitation options at affordable prices (an alternative that is
currently being explored through initiatives like “Mi Baño”, which offers different types of
prefabricated sanitation facilities). It is envisaged that SEDAPAL will have full responsibility for the

Fecal Sludge Management in Lima – Case Study Report
49
development and sustainability of the FSM market, with private/tertiary service providers being sub-
contracted to provide mainly emptying and transport services. Regulatory agencies (e.g. SUNASS
and DIGESA) will also play a key role in fixing the maximum prices or tariffs to be charged for these
services.
A preliminary overview of the situation in the language of incentives is as follows. It is clear that the
prevalent FSM service providers (vacuum truck companies serving wealthier areas of the city, e.g.
beach houses) have no incentives to provide services in poor non-sewered areas because there
seems to be no demand and no potential profit. Poor households have no incentive to properly line
their pits and empty them because the contamination is an externality that primarily affects the
general public rather than the household itself. They also have little incentive to invest in safer (and
more expensive) containment options, while their expectation is that SEDAPAL will eventually extend
the sewer network to their area. SEDAPAL has little incentive to extend the sewer network in this
way mainly because it is very costly (especially in hilly and rocky areas), but also because there are
legal impediments (i.e. lack of formal land rights) for the expansion of the network. One part of
squaring this circle is therefore for SEDAPAL to make their intentions clear.
To have a better understanding of current institutional responsibilities and the scope for reform, the
next section maps out these responsibilities across key sector stakeholders.
8.3.2 Mapping institutional responsibilities
As set out above, the focus is on how institutions function, the incentives which those institutions
provide to stakeholders, and how those stakeholders exert influence. It is therefore important to
understand who those stakeholders are, alongside their formal and informal roles. A useful tool to
do this is institutional responsibility mapping, as set out in Table 23 below. Stakeholders have been
categorised by sector (e.g. national or local government, private, etc.), and both their formal
responsibilities (‘what should be happening’) and the reality (‘what actually happens’) in FSM in Lima
are described. A final column summarises some of the main challenges faced.
The main messages of Table 23 are the following:
At both national and local levels, no responsibilities for FSM have been clearly designated
across stakeholders, which discourages the development of FSM services. Sector planning,
and thus, public budgets are unlikely to encompass FSM if no stakeholder can be held
accountable for investments and results. Indeed, budget allocations are primarily directed to
the expansion of the sewerage network and treatment facilities (both for grey and blackwater,
and solid waste). Moreover, given the current segmentation of the sanitation sector across
different institutions (as shown in Table 23), a clear designation of responsibilities is needed
(as is the case for sewerage). Indeed, several KIIs expressed that sector or national
development plans that encompass FSM cannot be developed without a prior definition and
allocation of competencies. Evidence from KIIs also suggests that, although there seems to
be no political opposition to the development of FSM, there is no political will either to carry
this forwards – this is partly driven by the persistent demand for sewerage (and piped water)
by poor non-sewered dwellers, which drives political campaigns and sanitation policy more
broadly, as well as the lack of actual commitment and actions by government counterparts.
Although there are no formal regulations or legal frameworks for FSM, these seem to be
flexible enough to encompass the provision and regulation of FSM services either by
SEDAPAL directly or through private/tertiary service providers (sub-contracted by
SEDAPAL). However, current demand is limited and there is very little knowledge about
potential demand (i.e. volume of fecal sludge to be emptied, transported, treated, etc.). A

Fecal Sludge Management in Lima – Case Study Report
50
reuse market for fecal sludge also remains to be legalised and developed. Thus, there are
no clear incentives to develop a market from the supply side.
Poor households in peri-urban Lima face significant financial restrictions to pay for the FSM
services currently offered, with emptying services ranging between USD $120 and $240 (as
reported in FGDs). The common practice of digging new pits once the ones in use fill up has
also contributed to the maintenance of the current status quo. However, limited space, land
tenure issues and health hazards and risks, as well as delays in getting access to sewerage
(which can take between 8 to 10 years), is encouraging people to explore other alternatives,
as is the case of UDDTs offered by X-Runner and PEBAL.
Overall, as shown in the CSDA scorecard in Figure 10, the whole FSM chain needs to be formally
enabled, developed and sustained. Even if the current legal frameworks for SWM service providers
allows for the inclusion of FSM service providers, there is an urgent need to explicitly include FSM
within urban development plans and budgets, and define competencies across sector institutions.
From the table, it seems that the Ministry of Housing should be the institution that has responsibility
for ensuring that appropriate FSM services exist, while SUNASS should continue to oversee the
services themselves. SEDAPAL should be the main service provider, as this would allow for an
integration of FSM services within the provision of WSS in Lima, regardless of whether services are
provided directly or through the private/tertiary sector.
Without a proper distribution and designation of responsibilities for FSM, to which stakeholders are
held accountable, it will not be possible to establish FSM services and develop a strong FSM market.
There are no obvious incentives for stakeholders to undertake FSM activities, and they cannot be
expected to independently take this venture forwards.

Fecal Sludge Management in Lima – Case Study Report
51
Table 23 Mapping institutional responsibilities for FSM
Sector Stakeholder Formal role The reality Core challenge
National government
Ministry of Housing, Construction and Sanitation (MoHCS)
Guarantee the provision of high quality urban water and sanitation services and encourage its sustainable use.
There are no specific policies for on-site sanitation or FSM in urban areas, and no budget has been allocated for these purposes.39
Although the problems with on-site sanitation in peri-urban areas are acknowledged by different stakeholders at national and local levels, responsibilities for on-site sanitation and FSM are not adequately allocated and thus no plans or interventions are carried out. Current focus on FSM nationally is on rural rather than urban areas.
Ministry of Environment
Reduce and prevent the contamination of water sources, air pollution, and soil degradation. Currently drafting the ‘Law of Solid Wastes’.
‘Law of Solid Wastes’ is mainly focused on SWM and it is uncertain if it will incorporate some or all components of the FSM chain.
Ministry of Health – Directorate for Environmental Health & Health Directorate (DESA)
Guide the design of sanitation policies to prevent diseases and improve health. 80% of budget allocated is directed towards drinking water quality assurance, with the remaining 20% directed towards waste water management.
They carry out health promotion and prevention activities, and inspections of potential foci of infection due to mismanagement of on-site sanitation facilities, but they do not actively participate in specific FSM programmes or encourage FSM development.
National Superintendence of Sanitation Services (SUNASS)
Regulate and supervise the provision of sanitation services, and improve the quality and access to drinking water and sewerage.
No guidelines for FSM, but they currently oversee the provision of fecal sludge emptying and transport services for public institutions and households with septic tanks.
A small random sample of SPs is supervised (10%) on a periodic basis, which is insufficient to enforce regulations and apply the necessary sanctions.40
39 On-site sanitation and blackwater treatment is significantly more developed for rural areas. For instance, there is a practical manual for households that provides information about containment, emptying and treatment of fecal sludge (Manual Tecnico de Difusion – Sistema de Tratamiento de Aguas Residuales para Albergues en Zonas Rurales). 40 Sanctions include corrective measures, such as public notices to discourage non-compliance of legal frameworks, refunds to affected users, or any other measure that SUNASS considers necessary to revert SPs non-compliance.

Fecal Sludge Management in Lima – Case Study Report
52
Sector Stakeholder Formal role The reality Core challenge
Technical Organism for the Management of Sanitation Services (OTASS)
Regulate, promote, supervise, audit and restructure the administration and management of service providers, and guarantee their efficiency, autonomy and social integration.
OTASS recently started its operations and it has currently provided support to some service providers (EPS). No specific concerns for FSM – this institution is solely concerned on administrative, managerial and financial efficiency and sustainability.
There seems to be an overlap between SUNASS and OTASS functions – instead of integrating or adding responsibilities to existing institutions, the sector seems to be becoming increasingly segmented.
Local government
Drinking Water and Sewerage Service of Lima (SEDAPAL)
Provide adequate access to drinking water and sewerage, as well as treatment and disposal of waste water.
FSM services for other types of on-site sanitation besides septic tanks are not considered. Due to issues with land-titling and high costs, which prohibit the provision of services to poor peri-urban areas, they are currently exploring alternative options to sewerage, including FSM coupled with ‘sanitation marketing’.
Funding and limited ability and/or willingness to pay from poor households may be an issue in scaling-up FSM services in the future.
Metropolitan Municipality of Lima
Design and assess urban plans and interventions. They also approve SP registration and grant licenses for their operation.
They have an indirect role in FSM by providing land titles to poor households and encouraging them to settle in areas where the provision of sewerage in the future is possible. Focus on sewerage as the only alternative
and limited knowledge of the potential demand for FSM services. They also have a limited budget for sanitation interventions.
District municipalities
Support district social and economic development, and plan and coordinate with different governmental agencies the implementation of local policies and interventions.
They support local communities to make official requests to SEDAPAL for the provision of drinking water and sewerage, but they have no plans to develop on-site sanitation and FSM as an alternative.
NGOs X-Runner (PEBAL also provides similar services)
Provide UDDTs, and emptying, transport, treatment and reuse of FS.
They only serve a few number of households in lowest-income non-sewered areas (approx. 480) but uptake and satisfaction have been high. Services remain unaffordable for many households (between US $9 and $16 per month).
They have very low visibility and have been unable to get the necessary funding to scale-up their services. The inexistence of a legal and formal market for fecal sludge end-products also hinders service development.

Fecal Sludge Management in Lima – Case Study Report
53
Sector Stakeholder Formal role The reality Core challenge
Private sector
Services providers (e.g. DISAL, Megapack Trading, Tecnisan)
Provide SWM services, emptying and transport of fecal sludge from septic tanks, and construct and operate sanitary landfills.
No operations in peri-urban areas due to limited willingness and ability to pay by poor households. Limited access to dwellings and pits, as well as inadequate equipment/emptying methods, may also be a deterrent for the provision of services. SWM services are not always timely.
Current business is profitable and no incentives to develop FSM in peri-urban areas as market scale is unknown.
Poor households Pay for drinking water, sewerage and SWM.
Poor households that rely on on-site sanitation dig and cover their own pits, building new ones as needed. No access to FSM services.
Low visibility and lack of ability and/or willingness to pay for current supply of fecal sludge services. Conception of on-site sanitation as an inferior or temporary service as compared to sewerage by some, and very limited knowledge of FSM services, with the exception of those provided through NGOs (e.g. X-Runner and PEBAL)

Fecal Sludge Management in Lima – Case Study Report
54
8.3.3 The influence and interests of stakeholders in FSM reform
When considering reform options, as in a redistribution or introduction of FSM responsibilities, it is
crucial to consider how stakeholders might respond, e.g. who would be supportive and who would
oppose – in other words, their interest, or whether they stand to gain or lose from any change to the
status quo. With a limited amount of time and effort to put into preparing the ground and working
with different stakeholders, it would be wise to use that time efficiently and target it at the right people.
Therefore, information about stakeholders’ interests is not enough. It must be used in combination
with an analysis of their relative influence. This will allow to identify who potentially opposes the
reform and, among them, who has enough decisive power to prevent it from being implemented.
Since there is no clear reform proposal on the table at this stage, the analysis is fairly generic and
relates to a general improvement in containment and emptying services.
Interest and influence can be scored and mapped onto a stakeholder matrix, as in Figure 13 below.
Although stakeholder matrices can help start a conversation about stakeholder engagement in
reform processes they have inherent limitations, e.g. it is not possible to be certain about how
different stakeholders would respond, stakeholders are not homogeneous, etc. In the matrix shown
below, the question of whether each stakeholder would support or oppose a move towards
developing full-scale containment and emptying practices in peri-urban Lima is considered, i.e. a
move towards preventing the construction of new, inadequate and non-emptiable pits and an
associated rise in the demand for emptying services. Their relative interest and influence to cause
or prevent such a change is assessed and scored on a scale from -10 to 10. Thus, a score of (-10,
-10) represents a stakeholder that strongly opposes the reform but has minimal influence. On the
contrary, a score of (10, 10) is representative of a stakeholder that shows strong support and is also
decisive for the reform to be implemented.
Figure 13 Stakeholder matrix for improving containment and emptying practices
Figure 13 suggests that the majority of stakeholders would hold a neutral position, i. e. they would
not actively support or discourage a reform that enhances FSM services in poor peri-urban areas in
Ministry of Housing
Ministry of Environment Ministry of
Health
SUNASS
OTASS
SEDAPAL
Metropolitan Municipality of Lima
District Municipalities
NGOs
Service providers
Poor households
INF
LU
EN
CE
INTEREST
Strongly oppose SupportOppose Strongly support
Decis
ive
Sig
nific
ant
Min
imal
Som
e
Fecal Sludge Management in Lima – Case Study Report
55
Lima. This is based on the general consensus conveyed across all KIIs that there would not be a
strong opposition against the development of formal FSM services, assuming that the reform process
is fair and actively engages all stakeholders, but is also a reflection of the current situation, where
FSM remains highly underdeveloped and there are no plans or investments in developing the sector.
All ministries, with the exception of the Ministry of Environment, would potentially take a position of
neutrality or indifference, and are highly influential. Their support may initially be moderate, actively
supporting changes to legislation to include FSM but possibly displaying some caution for political
reasons – for example, providing access to sewerage (and other basic services) to poor peri-urban
areas is usually advocated during elections, so a shift towards FSM (especially if not regarded as an
adequate medium- to long-term solution by households) may have a political cost. Given that the
Ministry of Housing, Construction and Sanitation has the main responsibility for guaranteeing access
to sanitation services, this entity is likely to be more supportive as compared to the Ministry of Health,
which would still perceive some benefits via a potential reduction in water-related diseases. The
Ministry of Environment might be slightly more reticent to take an FSM reform forwards given that
there are no clear and documented hazards to the environment from poor use of on-site sanitation
in peri-urban areas of Lima, and poor solid waste management is a more predominant concern and
complaint from poor households.
SEDAPAL was placed in an influential and supportive position, given its primary role in the provision
of water and sewerage, as well as its recent interest in exploring alternative options to sewerage in
poor peri-urban areas. SEDAPAL’s interest position is also conveying the current situation, where
they have had very little involvement in the development of FSM services to date, which may be
partly explained by the lack of explicit competencies for on-site sanitation, but also due to the demand
for sewerage exclusively on behalf of poor households. With regards to the supervisory or regulatory
agencies, OTASS has lower influence than SUNASS, given the nature of its role and, similarly to the
Ministry of Environment, it is likely to have a neutral interest in the development of FSM services.
SUNASS, on the other hand, being the main regulatory agency may show some slight opposition to
the development of FSM, partly due to the lack of clarity in the allocation of responsibilities between
SUNASS, OTASS and the Ministry of Housing (as regularly mentioned in KIIs), but also because it
will increase its regulatory burden and overall operational costs.
At the local level, the Metropolitan Municipality of Lima also has significant influence (although below
that of national regulatory agencies), but may take a neutral position or potentially oppose the
introduction of FSM services, as they are currently trying to prevent migrants from settling in
‘inconvenient’ peri-urban areas, which the provision of FSM may counteract. Similarly, district
municipalities, although having some influence, may slightly oppose the development of FSM
services. This position is explained by their current lack of involvement in the development of FSM
and on-site sanitation alternatives, and their limited accountability to people living in peri-urban
areas. Indeed, when asked about the involvement of local leaders in ensuring the provision of piped
water and sanitation, most FGD participants mentioned that they have not received any direct
support from district municipalities, with local mayors usually making several promises during
elections, which remain unfulfilled after their time in office. Moreover, district municipalities
manifested their concerns with the lack of adequate planning and budgeting in the sanitation sector,
which may have a negative effect on their level of support if they foresee that the reform will not
materialise as planned.
Finally, NGOs and private stakeholders (service providers and households) generally have minimal
influence but are likely to be the ones with the highest interest in ensuring an FSM market is
developed given their widespread concerns with their pits potentially filling up and the lack of space
to build new ones, as well as their positive experiences with UDDTs (where available and affordable)
and reuse in the form of compost. In the particular case of NGOs (X-Runner and PEBAL), support
may be moderate as they may be displaced or forced out of the market if other tertiary/private service

Fecal Sludge Management in Lima – Case Study Report
56
providers become widespread. On the contrary, current SWM service providers may see their
markets expand but may be cautious with SEDAPAL’s oversight and control (e.g. will SEDAPAL
allow for competition between SPs or will prices be pre-determined? What will the contract between
SPs and SEDAPAL entail with regards to fecal sludge transport to treatment plants?). Finally, given
that households without access to sewerage encompass 8% of the total Lima population, they have
very low visibility and influence, and while the majority are likely to support the provision of on-site
sanitation and FSM services (as manifested through FGDs for both affordable UDDTs and pit
emptying), some will still be reticent to accept these services with a preference for traditional
sewerage, especially if on-site sanitation alternatives are not coupled with adequate water supply,
which is also very deficient in peri-urban areas.41
In summary, the stakeholder matrix suggests that it is SEDAPAL who will have the decisive
influencing power over making FSM services happen in poor urban areas. Therefore, it is likely that
supporters of reform would do well to invest their time in working with SEDAPAL to move proposals
forward.
8.4 Illustrating the incentive problem
It is helpful to consider the problem of poor FSM in Lima in two dimensions. The first dimension is
static, that is, the way households, service providers and government stakeholders are currently
dealing with on-site sanitation and FSM (partly described in Table 23 above). The second dimension
is dynamic – the city is changing both spatially (e.g. people settling illegally in expanding peri-urban
areas) and demographically (urban population growth and inward migration). In terms of policy, the
static problem requires an action which could be implemented immediately but may have a slow
response over time – for example, there may be ways of persuading households to improve the
quality of their pits to minimise environmental and health hazards. The dynamic problem, however,
requires longer-term involvement and engagement in areas that are more the domain of urban
planning than sanitation policy and practice, e.g. ensuring that rural migrants settle in adequate areas
and that land titles are provided to encourage investment in private sanitation facilities and allow for
the provision of FSM services in these areas.
A useful tool to illustrate these problems is process mapping. This tool aims to understand the
interaction between formal and informal “steps” in a process, and identify entry points for
engagement. Similarly to the stakeholder matrix presented above, it is important to assess the roles
of the key stakeholders in a process, how and where they exert influence, and the incentives they
face in both formal and informal systems.
For this analysis, we have focussed on the process for dealing with a pit when it fills up, given the
predominance of this practice in poor non-sewered areas. This is shown in Figure 14 below. The
central column shows the formal process which is supposed to be followed by the household, while
the right column shows elements of the informal process, i.e. what really happens. Given that there
are no formal guidelines for containment and emptying, households cover the pits themselves with
whatever material and resources they have available, usually including lime, wood, stones, soil, and
in exceptional cases, cement. Many pits are also treated with muriatic acid to aid decomposition and
prevent overflow. After the pit is sealed, a new pit is built, if space permits. There are increasing
concerns from households with the lack of space to dig new pits on their plots if the one in use fills
up, with some people even reporting neighbours already digging their pits on public dirt roads or
green areas.
41 FGDs revealed that some poor settlements rely on private tanker trucks for their water supply, which are generally more expensive but also unreliable (e.g. service is not available when needed). Many households perceive their water to be unsafe, and claim that the water has visible particles and a bad taste.
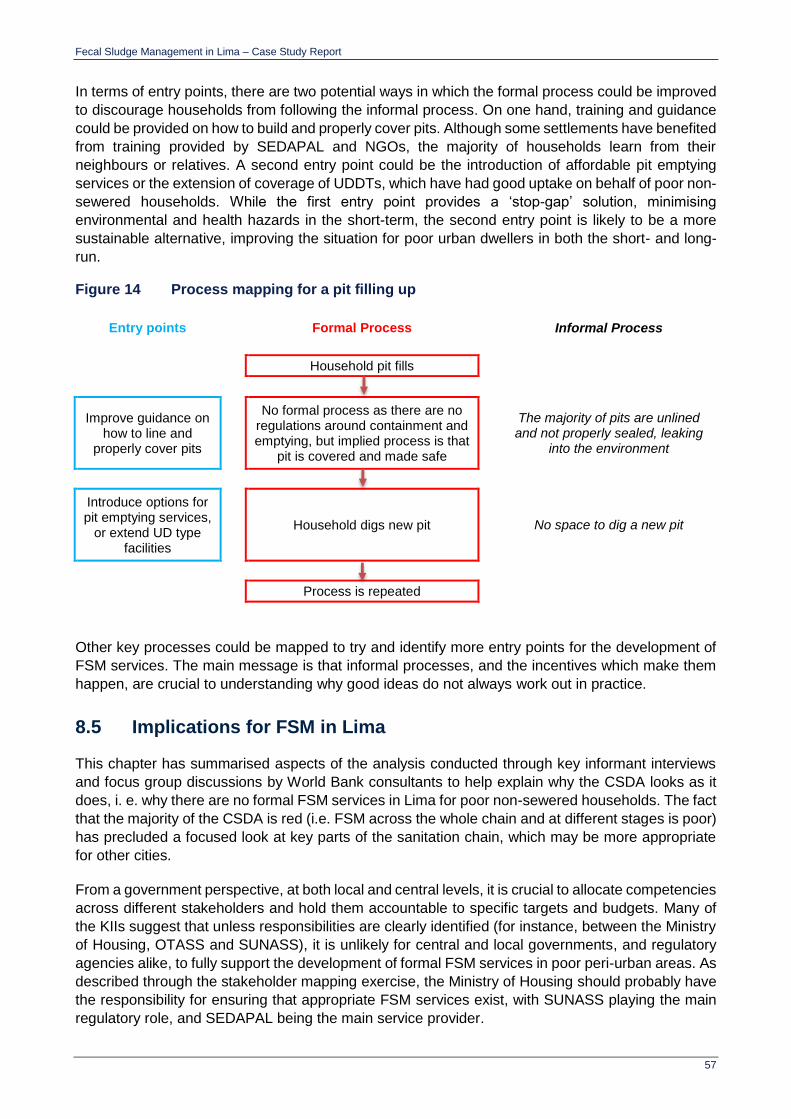
Fecal Sludge Management in Lima – Case Study Report
57
In terms of entry points, there are two potential ways in which the formal process could be improved
to discourage households from following the informal process. On one hand, training and guidance
could be provided on how to build and properly cover pits. Although some settlements have benefited
from training provided by SEDAPAL and NGOs, the majority of households learn from their
neighbours or relatives. A second entry point could be the introduction of affordable pit emptying
services or the extension of coverage of UDDTs, which have had good uptake on behalf of poor non-
sewered households. While the first entry point provides a ‘stop-gap’ solution, minimising
environmental and health hazards in the short-term, the second entry point is likely to be a more
sustainable alternative, improving the situation for poor urban dwellers in both the short- and long-
run.
Figure 14 Process mapping for a pit filling up
Entry points Formal Process Informal Process
Household pit fills
Improve guidance on how to line and
properly cover pits
No formal process as there are no regulations around containment and emptying, but implied process is that
pit is covered and made safe
The majority of pits are unlined and not properly sealed, leaking
into the environment
Introduce options for pit emptying services,
or extend UD type facilities
Household digs new pit No space to dig a new pit
Process is repeated
Other key processes could be mapped to try and identify more entry points for the development of
FSM services. The main message is that informal processes, and the incentives which make them
happen, are crucial to understanding why good ideas do not always work out in practice.
8.5 Implications for FSM in Lima
This chapter has summarised aspects of the analysis conducted through key informant interviews
and focus group discussions by World Bank consultants to help explain why the CSDA looks as it
does, i. e. why there are no formal FSM services in Lima for poor non-sewered households. The fact
that the majority of the CSDA is red (i.e. FSM across the whole chain and at different stages is poor)
has precluded a focused look at key parts of the sanitation chain, which may be more appropriate
for other cities.
From a government perspective, at both local and central levels, it is crucial to allocate competencies
across different stakeholders and hold them accountable to specific targets and budgets. Many of
the KIIs suggest that unless responsibilities are clearly identified (for instance, between the Ministry
of Housing, OTASS and SUNASS), it is unlikely for central and local governments, and regulatory
agencies alike, to fully support the development of formal FSM services in poor peri-urban areas. As
described through the stakeholder mapping exercise, the Ministry of Housing should probably have
the responsibility for ensuring that appropriate FSM services exist, with SUNASS playing the main
regulatory role, and SEDAPAL being the main service provider.

Fecal Sludge Management in Lima – Case Study Report
58
Focussing on service provision and the development of an FSM market, it is crucial to minimise the
main blockages at both supply and demand. From the supply side, a pricing scheme needs to be set
up that allows for FSM services to be profitable SEDAPAL and/or for tertiary/private sector
stakeholders, but at the same time affordable for poor peri-urban households. FGDs suggest that
households are likely to be more willing to pay small amounts on a monthly basis (as they do for
other public services) rather than a single and relatively high fee upon emptying. On the other hand,
from the demand side, households’ practice of digging a new pit once the one in use fills up needs
to change through formal training and guidelines, and enforced through legislation related to fecal
sludge containment and emptying. Households are already manifesting their concerns with the lack
of space to continue digging pits in the future, so they are definitely open to sustainable and
affordable alternatives to solve their sanitation needs. Based on the stakeholder mapping exercise,
SEDAPAL seems to be the most obvious candidate for service provision, with a progressive
involvement of the tertiary/private sector as required.
To address the “so what” questions, which are often a response to this kind of analysis, the next
section considers potential intervention options in the context of the above analysis.

Fecal Sludge Management in Lima – Case Study Report
59
9 Intervention options
This section proposes interventions to improve fecal sludge management services for poor non-
sewered areas of Lima and provide an effective enabling environment within which those services
can be appropriately developed and sustainably managed. These interventions are mainly informed
by the assessment carried out by SEDAPAL and WSP through the Reimbursable Advisory Services
(RAS) in Lima and the results of the household survey data, the SFDs and the CSDA described
earlier.
To support planning decisions for improving FSM services over time, this chapter starts by referring
back to key results responding to the question “Where are we now?” using the fecal waste flow
diagrams as a means to illustrate the key challenges. It then goes on to propose responses to the
question “Where do we want to get to?” that acknowledge components of the enabling environment,
current studies and ongoing sectoral reforms, as well as good practice and relevant experience from
elsewhere.
Addressing the next question “How do we want to get there?” is a further process that requires strong
leadership at the city level, engagement of city authorities and key stakeholders, detailed studies
and analysis to identify specific plans and solutions that can support an incremental and strategic
planning approach.
9.1 Identified weaknesses
The key starting point for presenting weaknesses in the existing services for poor non-sewered areas
in Lima is the fecal waste flow diagram, as this identifies the extent to which fecal sludge is managed
(or not) through the current sanitation service chains. From this diagram, “problems” or “weaknesses”
in the process of managing fecal sludge at the key stages in the chain can be highlighted (see Figure
15 below), pointing to where interventions are needed to improve the status quo.
Figure 15 Fecal waste flows in non-sewered areas: results and problems

Fecal Sludge Management in Lima – Case Study Report
60
9.2 Proposed solutions
Through the RAS, a decision tree was developed (see Figure 16 below) to assess possible
intervention options. The decision tree aims to (i) identify the communities that need to be prioritised;
(ii) assess the financial and technical feasibility of interventions in priority communities, and (iii)
identify household preferences to be included in the design of alternative WSS solutions. Potential
interventions should be designed to minimise water wastage, be more profitable than conventional
solutions (i. e. sewerage), be able to be fully implemented in the short-run, and be flexible enough
to meet the needs of households and adapt to their ability to pay.
Figure 16 Decision tree for WSS services in Lima
The first step of the decision tree is to identify the communities to be intervened (i.e. community
meets the selection criteria). Based on discussions with SEDAPAL, the criteria for community
selection include:
There are no plans for the extension of the sewerage network in the next five years, and/or
no national plans for investment in the area.

Fecal Sludge Management in Lima – Case Study Report
61
Land is legally occupied and physically accessible.
Local authorities are required and willing to support the interventions proposed.
Population density is above the required minimum, increasing the likelihood of financial
feasibility.
If the community or area of intervention meets the selection criteria, both the technical and financial
feasibility of the project need to be assessed – this includes investment, operational and
maintenance costs. Tariff levels and costs of services are to be assessed in coordination with
SUNASS, the main regulatory agency.
Subsequently, if the solution is technically and financially feasible, a participatory planning needs to
be carried out, enabling a direct dialogue between SEDAPAL, SUNASS, other key stakeholders,
and community members. The objective of this step is to understand the current status of WSS
services (i.e. initial diagnosis), define the activities to be carried out and the competencies of each
stakeholder involved, and finally, identify and select the best management model (considering
services decentralisation, focusing on the client, and public, community, private/tertiary or joint
public-private management). A social agreement or covenant will finally be established between
SEDAPAL and the community to ensure the accountability of service provision and management.
Although there are several options that can be used for the provision of alternative WSS services,
SEDAPAL aims to provide services that are efficient, able to create economies of scale, and allow
for the participation of the tertiary/private sector. Three different interventions have been considered:
1. On-site FS containment and greywater disposal, with FS emptying and transport services
provided by tanker trucks (i.e. mechanical emptying), discharge at a FS treatment plant and
compost and/or fertilizer production (S1);
2. Small community or condominial sewerage system, with decentralised wastewater treatment
plants and wastewater reuse in green areas (S2), and
3. UDDTs with on-site greywater disposal and specialised FS treatment with compost and/or
fertilizer production (similar to current X-Runner services) (S3).
The decision tree for these options is depicted in Figure 17 below, providing an initial assessment of
where these options might be suitable across peri-urban areas of Lima.
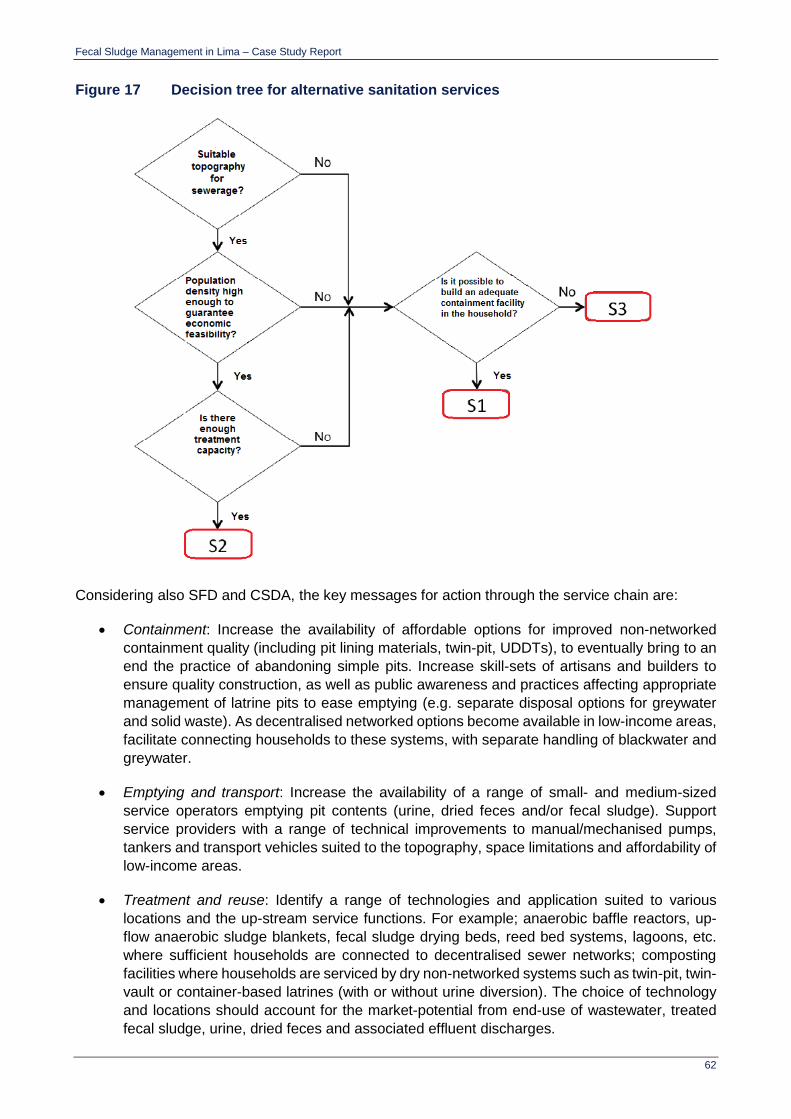
Fecal Sludge Management in Lima – Case Study Report
62
Figure 17 Decision tree for alternative sanitation services
Considering also SFD and CSDA, the key messages for action through the service chain are:
Containment: Increase the availability of affordable options for improved non-networked
containment quality (including pit lining materials, twin-pit, UDDTs), to eventually bring to an
end the practice of abandoning simple pits. Increase skill-sets of artisans and builders to
ensure quality construction, as well as public awareness and practices affecting appropriate
management of latrine pits to ease emptying (e.g. separate disposal options for greywater
and solid waste). As decentralised networked options become available in low-income areas,
facilitate connecting households to these systems, with separate handling of blackwater and
greywater.
Emptying and transport: Increase the availability of a range of small- and medium-sized
service operators emptying pit contents (urine, dried feces and/or fecal sludge). Support
service providers with a range of technical improvements to manual/mechanised pumps,
tankers and transport vehicles suited to the topography, space limitations and affordability of
low-income areas.
Treatment and reuse: Identify a range of technologies and application suited to various
locations and the up-stream service functions. For example; anaerobic baffle reactors, up-
flow anaerobic sludge blankets, fecal sludge drying beds, reed bed systems, lagoons, etc.
where sufficient households are connected to decentralised sewer networks; composting
facilities where households are serviced by dry non-networked systems such as twin-pit, twin-
vault or container-based latrines (with or without urine diversion). The choice of technology
and locations should account for the market-potential from end-use of wastewater, treated
fecal sludge, urine, dried feces and associated effluent discharges.

Fecal Sludge Management in Lima – Case Study Report
63
For any service option, the choice and implementation must adopt an integrated approach through
the full service chain. This means taking account of the need for sufficient and reliable water supplies,
solid waste management services and drainage networks to ensure optimal sanitation service
provision during operation, maintenance and management of each option. Each stage of the service
chain must also account for the range of physical and institutional constraints necessary to provide
citizens with a reliable service that protects both public and environmental health. These include
tenancy and land ownership, topography and space, affordability, capacity and resources to deliver
and sustain service functions.
Table 24 below sets out specific technical interventions, whereas the sections following the table
consider interventions more related to the enabling environment. The options in the table are not
necessarily mutually exclusive and in presenting the “Where do we want to get to?” they do not
specify interim or staged approaches. These are discussed in the following section.

Fecal Sludge Management in Lima – Case Study Report
64
Table 24 Technical interventions to improve the service chain, based on existing system type
System type (key
problems)
Potential solutions for lowest-income non-sewered areas of Lima
Containment Emptying Conveyance Treatment Disposal End-use
On-site sanitation with storage in mostly unlined pits (emptiable)
(1) Poorly constructed and managed pits
(2) Absence of safe or effective removal of fecal sludge from existing pits
(3) Most pits abandoned, rather than emptied
Improve design and construction standards for existing pits – including wider range of pit lining options to enhance emptying potential
Where off-set pits are in use, consider an upgrade to a twin-pit system (with junction box and second pit) – either for combined excreta (e.g. simple twin-pit), or dry sanitation options with urine diversion (UDDTs)
Ensure correct construction of septic tanks (1- or 2-compartment, with soakaway or infiltration trench). Promote as an option where appropriate, affordable and accessible to emptying services
Improve pit / ST access arrangements, to enable easier emptying
Explore options for connecting pour-flush or cistern-flush latrines to decentralised sewerage options (DEWATS)
Promote wider use of soakaways or local drainage systems for management of greywater
Promote use of a wider range of appropriate, low-cost pit-lining options, as part of sanitation marketing
Incentivize households to construct pits that can be emptied periodically, rather than abandoned or replaced – including use of twin-pit arrangements
Ensure pits and tanks are built with access points for emptying that are appropriately sized and accessible to emptiers
Test and scale-up wider range of emptying options – both manual and mechanised
Mobilize a wider range of transport options – including improved manual and small-scale mechanised transport, for FS, separated urine and/or dry feces
Identify the feasibility and extent of localised sewer networks (settled, condominial, small-bore) to support DEWATS
Consider and build decentralised fecal sludge treatment sites, to support areas with increased levels of emptying – such as drying beds, or composting plants for dried feces with separate urine treatment and storage
Locate decentralised treatment sites (for ABRs, reed beds, lagoons, etc.) to ensure safe and efficient access for emptying service providers
Identify the current location of unofficial disposal / discharge sites and address key public and environmental health risks
Explore extent and feasibility of required excreta disposal at DEWATS sites (blackwater or effluent discharge) against potential for viable endues options
Explore opportunities for fecal sludge reuse in: agriculture (nutrient value), industry (e.g. energy value as a dried fuel source, anaerobic digestion), etc.
Explore opportunities for reuse of urine (nutrient recovery) and dried feces (e.g. soil conditioner or fuel source)
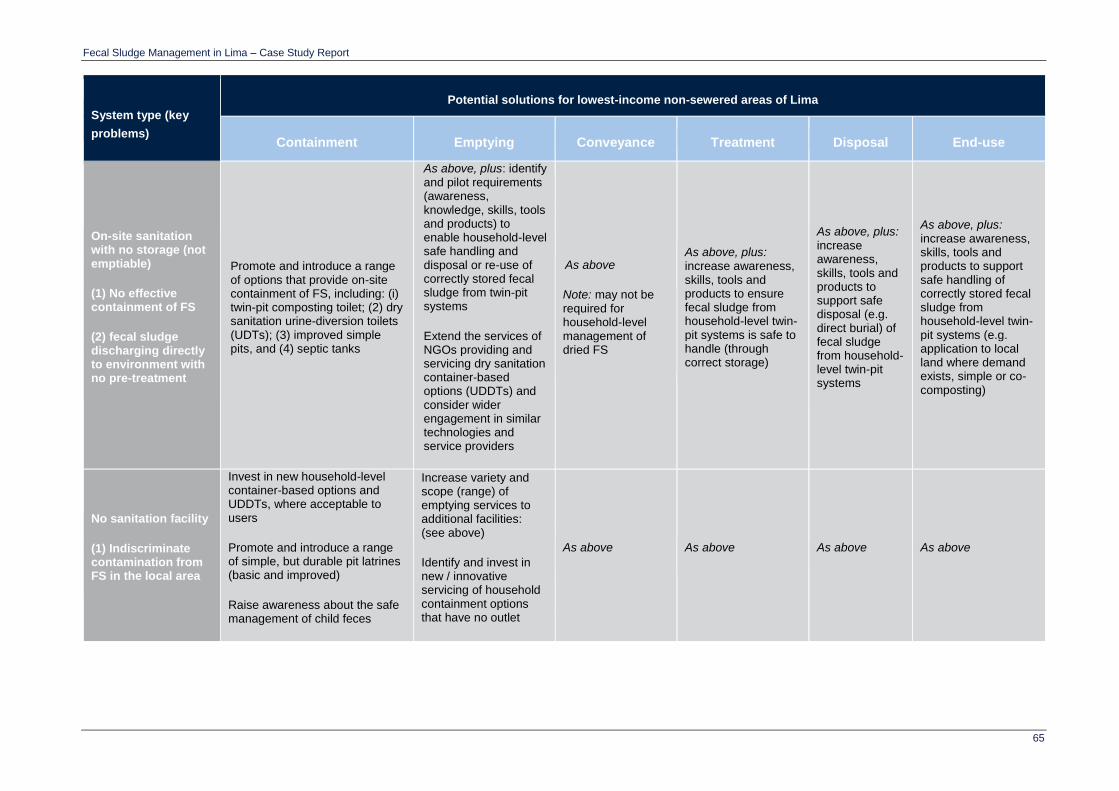
Fecal Sludge Management in Lima – Case Study Report
65
System type (key
problems)
Potential solutions for lowest-income non-sewered areas of Lima
Containment Emptying Conveyance Treatment Disposal End-use
On-site sanitation with no storage (not emptiable)
(1) No effective containment of FS
(2) fecal sludge discharging directly to environment with no pre-treatment
Promote and introduce a range of options that provide on-site containment of FS, including: (i) twin-pit composting toilet; (2) dry sanitation urine-diversion toilets (UDTs); (3) improved simple pits, and (4) septic tanks
As above, plus: identify and pilot requirements (awareness, knowledge, skills, tools and products) to enable household-level safe handling and disposal or re-use of correctly stored fecal sludge from twin-pit systems
Extend the services of NGOs providing and servicing dry sanitation container-based options (UDDTs) and consider wider engagement in similar technologies and service providers
As above
Note: may not be required for household-level management of dried FS
As above, plus: increase awareness, skills, tools and products to ensure fecal sludge from household-level twin-pit systems is safe to handle (through correct storage)
As above, plus: increase awareness, skills, tools and products to support safe disposal (e.g. direct burial) of fecal sludge from household-level twin-pit systems
As above, plus: increase awareness, skills, tools and products to support safe handling of correctly stored fecal sludge from household-level twin-pit systems (e.g. application to local land where demand exists, simple or co-composting)
No sanitation facility
(1) Indiscriminate contamination from FS in the local area
Invest in new household-level container-based options and UDDTs, where acceptable to users
Promote and introduce a range of simple, but durable pit latrines (basic and improved)
Raise awareness about the safe management of child feces
Increase variety and scope (range) of emptying services to additional facilities: (see above)
Identify and invest in new / innovative servicing of household containment options that have no outlet
As above As above As above As above

Fecal Sludge Management in Lima – Case Study Report
66
9.3 Program design and prioritisation
Based on the analysis of broader findings from the FSM study, the following sub-sections consider
the key areas of the Enabling Environment (as defined and grouped within the City Service Delivery
Assessment of the Enabling, Developing and Sustaining components) and identify actions to support
any infrastructure-focused investments in the poor non-sewered settlements of Lima. While drawing
on the CSDA results, these sections also account for good practice and relevant experience from
elsewhere.
9.3.1 Enabling: policy, planning and budget
Policy – There is a complete absence of policy relating to FSM, which requires reviewing existing
policy and incorporating FSM as a first step (for instance, in the Law for Solid Waste Management).
This will need a strong commitment from national and local level stakeholders (e.g. MoHCS,
SUNASS, Lima Metropolitan Municipality), as scale of FSM services is currently extremely limited
and universal coverage with sewerage by 2017 is the present target.
Regulation – Legislation for FSM exists in the form of general laws (such as the SEDAPAL byelaws
under Title 1, Article 2) addressing removal of feces from latrines and septic tanks; but without the
scale of services, application and enforcement are likely to be extremely weak. It will be necessary
to review existing regulation to strengthen it in view of a proposed expansion of FSM services.
Institutional roles – Current legislation does not clearly define competencies for all sector
stakeholders, which hinder the development of FSM policy and services. As mentioned in the PFC
chapter, both planning and budgeting are unlikely to happen if responsibilities are not allocated and
there is no accountability for investments and results. Although there are some mechanisms for
support to private service providers (e.g. operation under a competitive market, regulatory
frameworks), these are unlikely to have much impact on actual service provision, especially for the
urban poor. More active involvement from SEDAPAL in bringing both public and private stakeholders
together to develop a joint framework for FSM is highly recommended. This should be complemented
by a revision of existing legislation to ensure it enables more flexible and responsive services, while
addressing minimum service standards to protect public health through the stages of the FSM
service chain.
Service provision and planning – The National Urban Sanitation Programme does not show an
obvious commitment to expand or develop the scope of on-site sanitation options or FSM services,
with sewerage being considered as the first-best and long-term option for urban areas. Only once
political commitment is oriented towards the development of FSM, will plans and capacity needs be
adequately acknowledged and addressed.
Budget – There are no budgetary arrangements identified that are specifically for FSM services in
urban areas. This will require attention along with policy and planning reviews to identify the scale of
financing required and potential sources.
9.3.2 Developing: equity and outputs
Choice / reducing inequity – There is almost a total absence of FSM service options for residents
of poor non-sewered areas. Containment facilities are poorly constructed and managed with no
enforcement of standards to prevent this from happening. There needs to be much greater attention
to incentives for households to improve latrine quality, with associated incentives developed for
SEDAPAL and other emptying service providers so they can offer a range of affordable, responsive
and safe services to those who demand them. A greater understanding of community-level needs

Fecal Sludge Management in Lima – Case Study Report
67
and wants, as well as household willingness and ability to pay for different service levels is also
required.
Outputs – The fecal waste flow diagram (SFD) highlights a total absence of safe and effective
services for the whole of the service chain. This requires technical assistance for all stages of service
delivery that address the technical interventions mentioned in Table 24, as well as supporting
capacity development of institutions and agencies that will be responsible to deliver them. It will also
require attention to training of artisans, builders and entrepreneurs in a range of available options,
as well as public information and marketing to promote. Sources of committed financing for this also
need to be identified, as well as regular monitoring of achievements against improved service
coverage targets, indicators and standards.
9.3.3 Sustaining: O&M, expansion and service outcomes
Cost recovery and standards – Again, all stages of the service chain need to be addressed with
appreciation of costs affecting households and service providers. Options for financial transfers also
need to be considered (e.g. water bill surcharge, environmental tax), ensuring that charges reflect
the level of service received by the customer, i.e. those with a lower service level, should pay less.
This will likely need an incremental approach to achieving service standards, phased over time and
adopting a realistic, doable attitude.
Demand and sector development – Demand for services is almost non-existent, reflected by the
lack of FSM actors and little government attention to the scale of the problem. Sector development
needs to come first, with improved service options available, marketed and more widely applied
(probably with initial external financial support and “friendly” regulation to allow more actors to enter
the market), before demand achieves any significant level for service options to become self-
sustaining.
9.3.4 Resulting prioritised interventions: guidelines for action
Considering the results from the CSDA and PFC (Sections 7 and 8 respectively), it is possible to
recommend where actions are most needed in relation to the non-technical components of the
enabling environment (such as policy and planning, institutional arrangements, capacity and
financing), to support technical responses.
For such actions to be effective, recommended interventions must respond to how well developed
the enabling environment currently is. Based on the assessed status of FSM service development
using these tools, the following Service Delivery Action Framework tables present a range of non-
technical, ‘institutional’ interventions. Actions are grouped according to the current status of the
enabling environment: Basic, Intermediate or Consolidating.
The set of recommended actions have been developed from good practice and informed by the
experience of the authors in relation to the enabling environment for urban sanitation. They are
tailored to how well developed the enabling environment currently is, with a view to strengthening it.
As the actions account for the current realities in a city, they must be recognised as essentially
sequential and should be viewed as dynamic; that is, actions are proposed as being at the Basic
stage before moving towards the Intermediate, then the Consolidating stages. Where a city is
identified to already be delivering FSM service needs from one of these stages, the resulting set of
actions are taken from the ‘next stage’.
The recommended sets of actions are shown within the boxes that have a bold outline
and shading. ‘Action’
Fecal Sludge Management in Lima – Case Study Report
68
As progress is made through these stages, actions can shift from being mainly about identifying,
reviewing or building awareness of services, through to actions that are more about establishing,
strengthening and promoting commitment to services, and on towards actions that are about
strengthening, consolidating and expanding engagement to achieve a more sustainable range of
enhanced services. The actions also move from prioritising public health protection (which may
include developing temporary measures), to ensuring the protection of the environment and looking
at the potential for the reuse of fecal sludge end products. In the case of Lima, it is clear that a strong
focus must be on providing the poor with a range of options to eliminate the continued practice of
digging informal, unlined pits and abandoning them when full, or allowing blackwater to discharge
directly into the environment. The implications for risk to health and environmental contamination are
significant, while interventions must ensure sanitation services are ensured throughout the service
chain.
The actions proposed in Table 25 below, considering services to the poor non-sewered areas of
Lima, are all within the stage of basic actions. Such basic actions Error! Reference source not
found.are considered to be appropriate within the context of an almost total absence of attention to
FSM services at the time of the study, although the scale and significance of the challenges faced
do appear to have been gaining increasing political attention. They are considered appropriate to
address the increasing likelihood of public health risks resulting from a failure to address FSM service
limitations, were the conditions in the enabling environment identified during the study to continue
as they are currently.
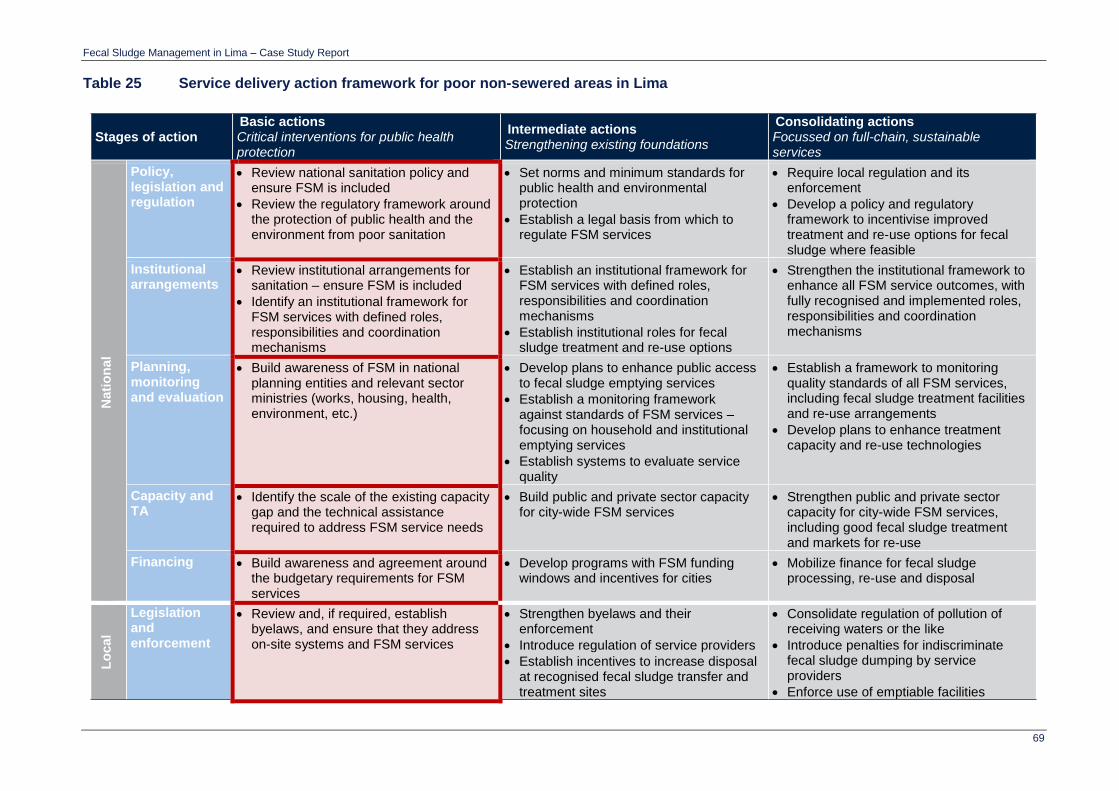
Fecal Sludge Management in Lima – Case Study Report
69
Table 25 Service delivery action framework for poor non-sewered areas in Lima
Stages of action Basic actions Critical interventions for public health protection
Intermediate actions Strengthening existing foundations
Consolidating actions Focussed on full-chain, sustainable services
Nati
on
al
Policy, legislation and regulation
Review national sanitation policy and ensure FSM is included
Review the regulatory framework around the protection of public health and the environment from poor sanitation
Set norms and minimum standards for public health and environmental protection
Establish a legal basis from which to regulate FSM services
Require local regulation and its enforcement
Develop a policy and regulatory framework to incentivise improved treatment and re-use options for fecal sludge where feasible
Institutional arrangements
Review institutional arrangements for sanitation – ensure FSM is included
Identify an institutional framework for FSM services with defined roles, responsibilities and coordination mechanisms
Establish an institutional framework for FSM services with defined roles, responsibilities and coordination mechanisms
Establish institutional roles for fecal sludge treatment and re-use options
Strengthen the institutional framework to enhance all FSM service outcomes, with fully recognised and implemented roles, responsibilities and coordination mechanisms
Planning, monitoring and evaluation
Build awareness of FSM in national planning entities and relevant sector ministries (works, housing, health, environment, etc.)
Develop plans to enhance public access to fecal sludge emptying services
Establish a monitoring framework against standards of FSM services – focusing on household and institutional emptying services
Establish systems to evaluate service quality
Establish a framework to monitoring quality standards of all FSM services, including fecal sludge treatment facilities and re-use arrangements
Develop plans to enhance treatment capacity and re-use technologies
Capacity and TA
Identify the scale of the existing capacity gap and the technical assistance required to address FSM service needs
Build public and private sector capacity for city-wide FSM services
Strengthen public and private sector capacity for city-wide FSM services, including good fecal sludge treatment and markets for re-use
Financing Build awareness and agreement around the budgetary requirements for FSM services
Develop programs with FSM funding windows and incentives for cities
Mobilize finance for fecal sludge processing, re-use and disposal
Lo
cal
Legislation and enforcement
Review and, if required, establish byelaws, and ensure that they address on-site systems and FSM services
Strengthen byelaws and their enforcement
Introduce regulation of service providers
Establish incentives to increase disposal at recognised fecal sludge transfer and treatment sites
Consolidate regulation of pollution of receiving waters or the like
Introduce penalties for indiscriminate fecal sludge dumping by service providers
Enforce use of emptiable facilities

Fecal Sludge Management in Lima – Case Study Report
70
Stages of action Basic actions Critical interventions for public health protection
Intermediate actions Strengthening existing foundations
Consolidating actions Focussed on full-chain, sustainable services
Institutional arrangements
Review local institutional arrangements for sanitation – ensure FSM is included
Identify an institutional framework for FSM services, with agreed and defined roles, responsibilities and coordination mechanism
Establish an institutional framework for FSM services, with agreed and defined roles, responsibilities and coordination mechanism
Establish institutional roles for fecal sludge treatment and re-use options
Strengthen institutional roles for managing improved fecal sludge treatment re-use facilities and options
Planning, monitoring and evaluation
Conduct rapid diagnostic studies by area, with a gender and pro-poor focus
Develop local plans for fecal sludge services, finance and institutional needs
Plan and design fecal sludge treatment options
Establish revenue streams (e.g. water bill surcharge, extra property tax)
Refine and implement local service plans
Establish systems for monitoring and evaluating achievement of service standards
Introduce plans to enhance treatment capacity and re-use arrangements
Strengthen monitoring and evaluating of fecal sludge treatment facilities and re-use arrangements against service standards
Promotion Stimulate customer demand and WTP for FSM services
Disseminate information about FSM services to the public
Stimulate market demand for re-use of FS
Capacity and technical assistance (TA)
Identify capacity gaps and TA required to help improve FSM services
Promote the emergence of private sector emptying services
Implement basic (possibly temporary) measures to more safely dispose of fecal sludge that is currently dumped in the environment
Promote or support development of improved, emptiable containment facilities
Strengthen FSM service providers (business development, financing options, etc.)
Pilot scheduled desludging (if applicable)
Pilot use of fecal sludge transfer stations (if applicable)
Build or rehabilitate fecal sludge processing plants
Consolidate and expand use of scheduled desludging, transfer stations, etc. – based on outcome of pilot studies
Develop business models for re-use of treated FS
Financing Identify the extent of financing required to address service improvements to the poorest
Introduce specific pro-poor financial arrangements (such as targeted subsidies)
Identify opportunities for financial flows generated from the sale of fecal sludge end products
Users
Planning Consult with communities to identify what they need and want
Gain user feedback on improved FSM services
Gain user feedback on current and future fecal sludge re-use options
Tenant sanitation
Engage and consult with landlords on constraints to FSM services
Develop assistance and enforcement packages for landlords
Focus on enforcement of service quality for landlords

Fecal Sludge Management in Lima – Case Study Report
71
10 Economic analysis of intervention options
Nb. The technology costing is based exclusively on secondary data. All costs and benefits are given
at the HH level, since the secondary data was not suitable for extrapolating population-level
estimates of the costs and benefits.
10.1 Introduction
This chapter provides an analysis of four possible sanitation intervention options for the low-income
non-sewered areas of Lima. The analysis spans the whole sanitation chain (i.e. containment,
emptying, transport, treatment and reuse), and is broken down by cost component, allowing a
detailed view of the points in the chain where the costs are incurred.
Two key pieces of information were required to conduct this analysis. Firstly, an estimate of the
damage cost, which assigns a monetary value to the negative consequences of poor sanitation, i.e.
“the cost of doing nothing”. Secondly, an estimate of the costs of the proposed intervention. This
requires a clear intervention design for a well-defined population, and sufficient information that
allows for each component to be costed.
10.2 Methodology
Four hypothetical models are presented in this analysis: three are based on secondary data from
existing literature on sanitation in Lima, while the remaining one draws from the reported costs of a
specific programme intervention. Costs were updated to reflect inflation to date and were estimated
for each component and at each stage of the sanitation chain.
The damage costing is based on the health-related costs associated with diarrhoeal incidence and
treatment only. The unit of analysis for all interventions is the household.
All costs are presented as annualised costs per HH. Annualisation was conducted using a standard
formula (see below) which incorporates a discount rate r1 that represents the opportunity cost of
capital.
𝑉𝑎𝑙𝑢𝑒𝑡+𝑛 = 𝑉𝑎𝑙𝑢𝑒𝑡 ∗ 𝐷𝑖𝑠𝑐𝑜𝑢𝑛𝑡 𝑓𝑎𝑐𝑡𝑜𝑟
𝐷𝑖𝑠𝑐𝑜𝑢𝑛𝑡 𝑓𝑎𝑐𝑡𝑜𝑟 = (1 + 𝑟)𝑛
Where
𝑟 = average annual interest rate
𝑛 = assumed lifespan in years
The choice of a discount rate is a key parameter of the costing. The higher the discount rate, the
higher the opportunity cost of capital and consequently, the higher the annualised costs. However,
the discount rate does not affect the ratios between different cost options. A discount rate of 6% was
used here as this is the long term rate of CPI inflation in Peru. The World Bank uses a rate of 10%
for infrastructure projects.
All of the analysis was conducted using the Economics of Sanitation Initiative (ESI). As such, many
of the assumptions used in the damage costing are based on the ESI’s standard settings.
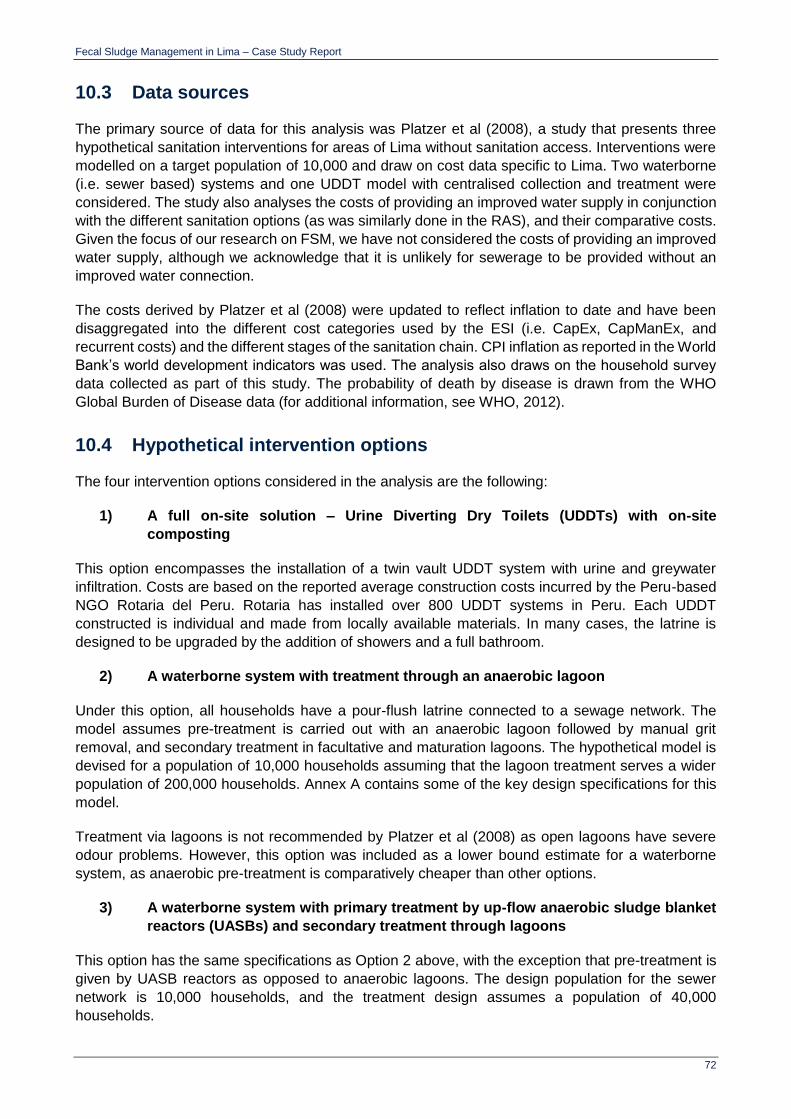
Fecal Sludge Management in Lima – Case Study Report
72
10.3 Data sources
The primary source of data for this analysis was Platzer et al (2008), a study that presents three
hypothetical sanitation interventions for areas of Lima without sanitation access. Interventions were
modelled on a target population of 10,000 and draw on cost data specific to Lima. Two waterborne
(i.e. sewer based) systems and one UDDT model with centralised collection and treatment were
considered. The study also analyses the costs of providing an improved water supply in conjunction
with the different sanitation options (as was similarly done in the RAS), and their comparative costs.
Given the focus of our research on FSM, we have not considered the costs of providing an improved
water supply, although we acknowledge that it is unlikely for sewerage to be provided without an
improved water connection.
The costs derived by Platzer et al (2008) were updated to reflect inflation to date and have been
disaggregated into the different cost categories used by the ESI (i.e. CapEx, CapManEx, and
recurrent costs) and the different stages of the sanitation chain. CPI inflation as reported in the World
Bank’s world development indicators was used. The analysis also draws on the household survey
data collected as part of this study. The probability of death by disease is drawn from the WHO
Global Burden of Disease data (for additional information, see WHO, 2012).
10.4 Hypothetical intervention options
The four intervention options considered in the analysis are the following:
1) A full on-site solution – Urine Diverting Dry Toilets (UDDTs) with on-site
composting
This option encompasses the installation of a twin vault UDDT system with urine and greywater
infiltration. Costs are based on the reported average construction costs incurred by the Peru-based
NGO Rotaria del Peru. Rotaria has installed over 800 UDDT systems in Peru. Each UDDT
constructed is individual and made from locally available materials. In many cases, the latrine is
designed to be upgraded by the addition of showers and a full bathroom.
2) A waterborne system with treatment through an anaerobic lagoon
Under this option, all households have a pour-flush latrine connected to a sewage network. The
model assumes pre-treatment is carried out with an anaerobic lagoon followed by manual grit
removal, and secondary treatment in facultative and maturation lagoons. The hypothetical model is
devised for a population of 10,000 households assuming that the lagoon treatment serves a wider
population of 200,000 households. Annex A contains some of the key design specifications for this
model.
Treatment via lagoons is not recommended by Platzer et al (2008) as open lagoons have severe
odour problems. However, this option was included as a lower bound estimate for a waterborne
system, as anaerobic pre-treatment is comparatively cheaper than other options.
3) A waterborne system with primary treatment by up-flow anaerobic sludge blanket
reactors (UASBs) and secondary treatment through lagoons
This option has the same specifications as Option 2 above, with the exception that pre-treatment is
given by UASB reactors as opposed to anaerobic lagoons. The design population for the sewer
network is 10,000 households, and the treatment design assumes a population of 40,000
households.
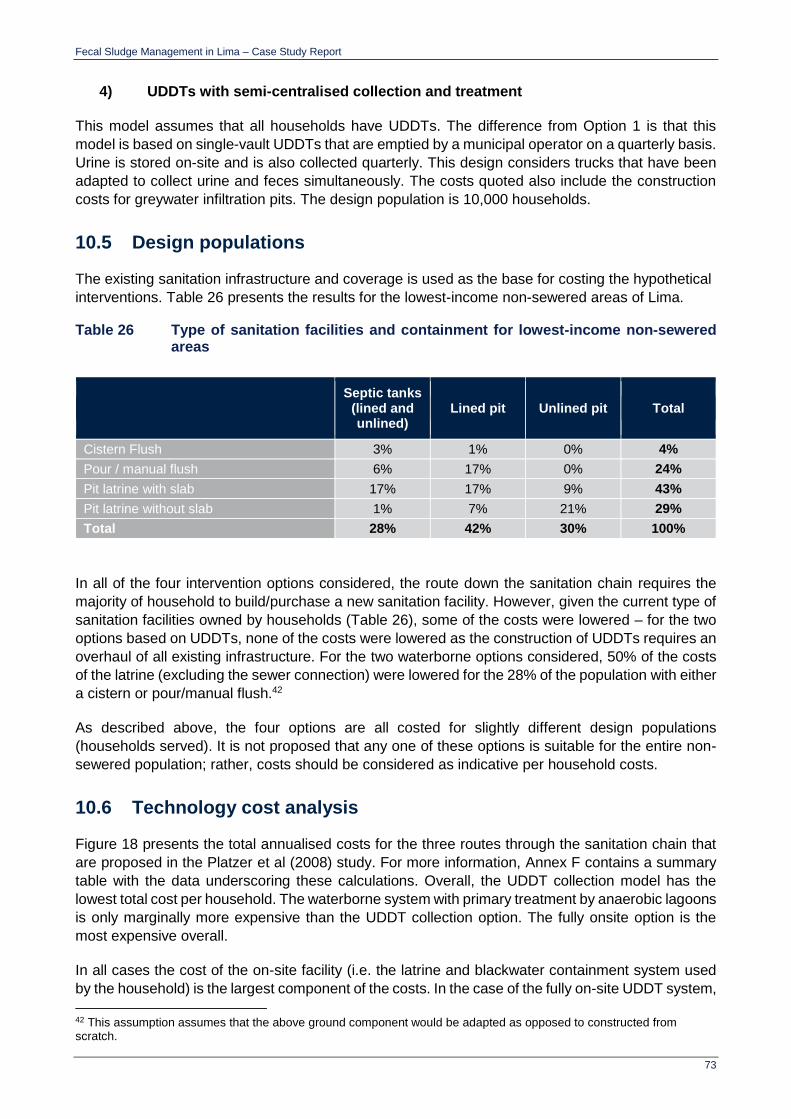
Fecal Sludge Management in Lima – Case Study Report
73
4) UDDTs with semi-centralised collection and treatment
This model assumes that all households have UDDTs. The difference from Option 1 is that this
model is based on single-vault UDDTs that are emptied by a municipal operator on a quarterly basis.
Urine is stored on-site and is also collected quarterly. This design considers trucks that have been
adapted to collect urine and feces simultaneously. The costs quoted also include the construction
costs for greywater infiltration pits. The design population is 10,000 households.
10.5 Design populations
The existing sanitation infrastructure and coverage is used as the base for costing the hypothetical
interventions. Table 26 presents the results for the lowest-income non-sewered areas of Lima.
Table 26 Type of sanitation facilities and containment for lowest-income non-sewered areas
Septic tanks
(lined and unlined)
Lined pit Unlined pit Total
Cistern Flush 3% 1% 0% 4%
Pour / manual flush 6% 17% 0% 24%
Pit latrine with slab 17% 17% 9% 43%
Pit latrine without slab 1% 7% 21% 29%
Total 28% 42% 30% 100%
In all of the four intervention options considered, the route down the sanitation chain requires the
majority of household to build/purchase a new sanitation facility. However, given the current type of
sanitation facilities owned by households (Table 26), some of the costs were lowered – for the two
options based on UDDTs, none of the costs were lowered as the construction of UDDTs requires an
overhaul of all existing infrastructure. For the two waterborne options considered, 50% of the costs
of the latrine (excluding the sewer connection) were lowered for the 28% of the population with either
a cistern or pour/manual flush.42
As described above, the four options are all costed for slightly different design populations
(households served). It is not proposed that any one of these options is suitable for the entire non-
sewered population; rather, costs should be considered as indicative per household costs.
10.6 Technology cost analysis
Figure 18 presents the total annualised costs for the three routes through the sanitation chain that
are proposed in the Platzer et al (2008) study. For more information, Annex F contains a summary
table with the data underscoring these calculations. Overall, the UDDT collection model has the
lowest total cost per household. The waterborne system with primary treatment by anaerobic lagoons
is only marginally more expensive than the UDDT collection option. The fully onsite option is the
most expensive overall.
In all cases the cost of the on-site facility (i.e. the latrine and blackwater containment system used
by the household) is the largest component of the costs. In the case of the fully on-site UDDT system,
42 This assumption assumes that the above ground component would be adapted as opposed to constructed from scratch.
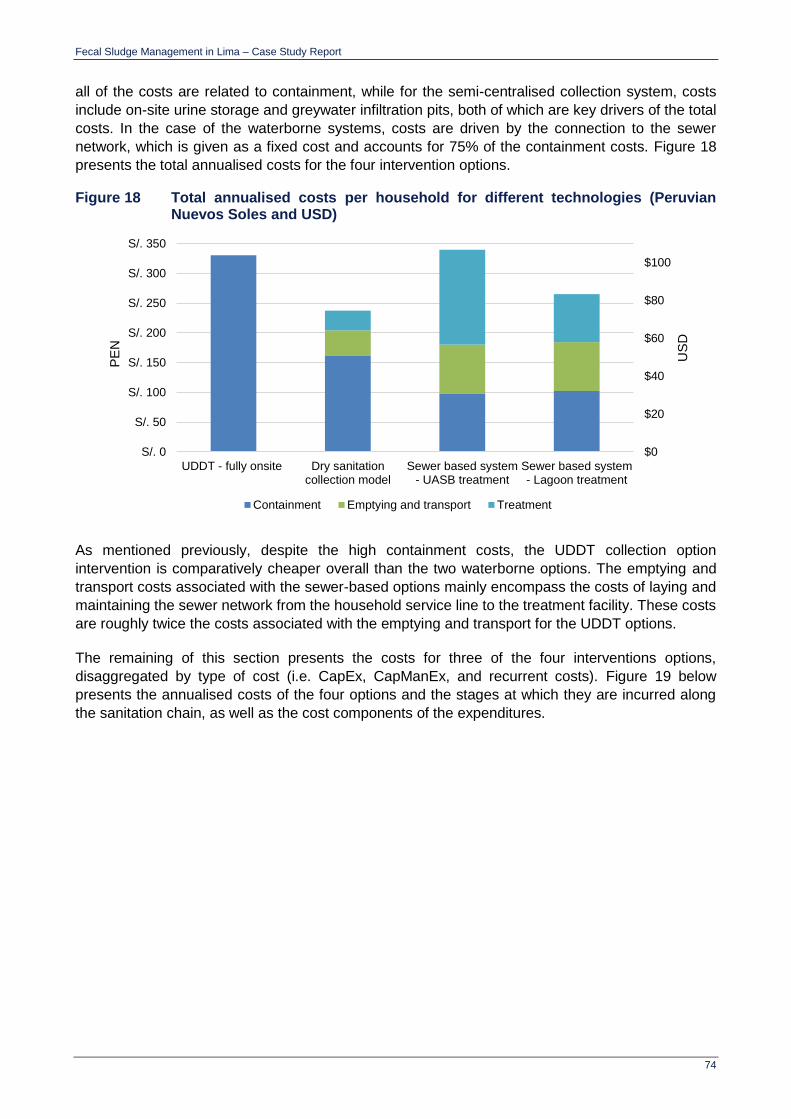
Fecal Sludge Management in Lima – Case Study Report
74
all of the costs are related to containment, while for the semi-centralised collection system, costs
include on-site urine storage and greywater infiltration pits, both of which are key drivers of the total
costs. In the case of the waterborne systems, costs are driven by the connection to the sewer
network, which is given as a fixed cost and accounts for 75% of the containment costs. Figure 18
presents the total annualised costs for the four intervention options.
Figure 18 Total annualised costs per household for different technologies (Peruvian Nuevos Soles and USD)
As mentioned previously, despite the high containment costs, the UDDT collection option
intervention is comparatively cheaper overall than the two waterborne options. The emptying and
transport costs associated with the sewer-based options mainly encompass the costs of laying and
maintaining the sewer network from the household service line to the treatment facility. These costs
are roughly twice the costs associated with the emptying and transport for the UDDT options.
The remaining of this section presents the costs for three of the four interventions options,
disaggregated by type of cost (i.e. CapEx, CapManEx, and recurrent costs). Figure 19 below
presents the annualised costs of the four options and the stages at which they are incurred along
the sanitation chain, as well as the cost components of the expenditures.
$0
$20
$40
$60
$80
$100
S/. 0
S/. 50
S/. 100
S/. 150
S/. 200
S/. 250
S/. 300
S/. 350
UDDT - fully onsite Dry sanitationcollection model
Sewer based system- UASB treatment
Sewer based system- Lagoon treatment
US
D
PE
N
Containment Emptying and transport Treatment

Fecal Sludge Management in Lima – Case Study Report
75
Figure 19 Annualised cost components of the sanitation interventions (cost per household in Peruvian Nuevos Soles and USD)
a. Sewer-based system with lagoon treatment b. Sewer-based system with UASB treatment
c. UDDT system with collection d. UDDT on-site system
$0
$20
$40
$60
$80
S/. 0
S/. 50
S/. 100
S/. 150
S/. 200
S/. 250
S/. 300
S/. 350
Containment Emptying andtransport
Treatment
US
D
PE
N
Capital Capital maintenance Recurrent
$0
$20
$40
$60
$80
S/. 0
S/. 50
S/. 100
S/. 150
S/. 200
S/. 250
S/. 300
S/. 350
Containment Emptying andtransport
Treatment
US
D
PE
N
Capital Capital maintenance Recurrent
$0
$20
$40
$60
$80
S/. 0
S/. 50
S/. 100
S/. 150
S/. 200
S/. 250
S/. 300
S/. 350
Containment Emptying andtransport
Treatment
US
D
PE
N
Capital Capital maintenance Recurrent
$0
$20
$40
$60
$80
S/. 0
S/. 50
S/. 100
S/. 150
S/. 200
S/. 250
S/. 300
S/. 350
Containment Emptying andtransport
Treatment
US
D
PE
N
Capital Capital maintenance Recurrent
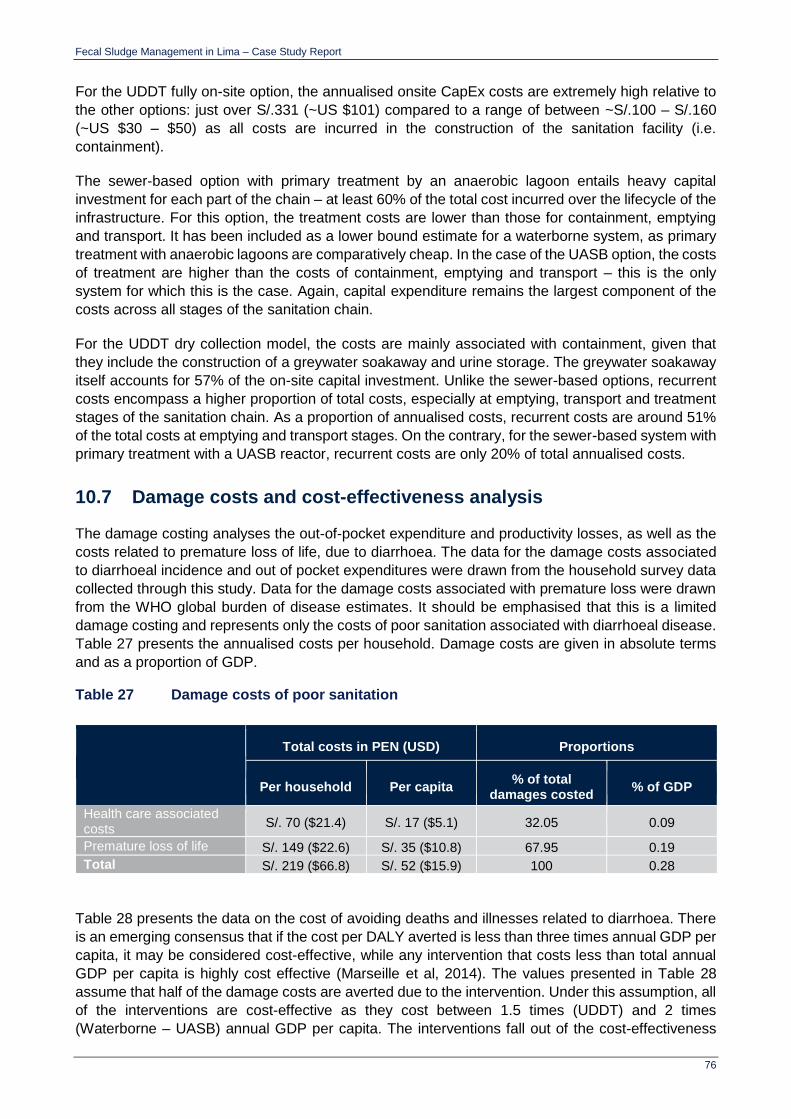
Fecal Sludge Management in Lima – Case Study Report
76
For the UDDT fully on-site option, the annualised onsite CapEx costs are extremely high relative to
the other options: just over S/.331 (~US $101) compared to a range of between ~S/.100 – S/.160
(~US $30 – $50) as all costs are incurred in the construction of the sanitation facility (i.e.
containment).
The sewer-based option with primary treatment by an anaerobic lagoon entails heavy capital
investment for each part of the chain – at least 60% of the total cost incurred over the lifecycle of the
infrastructure. For this option, the treatment costs are lower than those for containment, emptying
and transport. It has been included as a lower bound estimate for a waterborne system, as primary
treatment with anaerobic lagoons are comparatively cheap. In the case of the UASB option, the costs
of treatment are higher than the costs of containment, emptying and transport – this is the only
system for which this is the case. Again, capital expenditure remains the largest component of the
costs across all stages of the sanitation chain.
For the UDDT dry collection model, the costs are mainly associated with containment, given that
they include the construction of a greywater soakaway and urine storage. The greywater soakaway
itself accounts for 57% of the on-site capital investment. Unlike the sewer-based options, recurrent
costs encompass a higher proportion of total costs, especially at emptying, transport and treatment
stages of the sanitation chain. As a proportion of annualised costs, recurrent costs are around 51%
of the total costs at emptying and transport stages. On the contrary, for the sewer-based system with
primary treatment with a UASB reactor, recurrent costs are only 20% of total annualised costs.
10.7 Damage costs and cost-effectiveness analysis
The damage costing analyses the out-of-pocket expenditure and productivity losses, as well as the
costs related to premature loss of life, due to diarrhoea. The data for the damage costs associated
to diarrhoeal incidence and out of pocket expenditures were drawn from the household survey data
collected through this study. Data for the damage costs associated with premature loss were drawn
from the WHO global burden of disease estimates. It should be emphasised that this is a limited
damage costing and represents only the costs of poor sanitation associated with diarrhoeal disease.
Table 27 presents the annualised costs per household. Damage costs are given in absolute terms
and as a proportion of GDP.
Table 27 Damage costs of poor sanitation
Total costs in PEN (USD) Proportions
Per household Per capita % of total
damages costed % of GDP
Health care associated costs
S/. 70 ($21.4) S/. 17 ($5.1) 32.05 0.09
Premature loss of life S/. 149 ($22.6) S/. 35 ($10.8) 67.95 0.19
Total S/. 219 ($66.8) S/. 52 ($15.9) 100 0.28
Table 28 presents the data on the cost of avoiding deaths and illnesses related to diarrhoea. There
is an emerging consensus that if the cost per DALY averted is less than three times annual GDP per
capita, it may be considered cost-effective, while any intervention that costs less than total annual
GDP per capita is highly cost effective (Marseille et al, 2014). The values presented in Table 28
assume that half of the damage costs are averted due to the intervention. Under this assumption, all
of the interventions are cost-effective as they cost between 1.5 times (UDDT) and 2 times
(Waterborne – UASB) annual GDP per capita. The interventions fall out of the cost-effectiveness

Fecal Sludge Management in Lima – Case Study Report
77
bracket if they mitigate less than 25 – 32% of the damage costs and become highly cost-effective if
they mitigate over 75 – 97% of the damage costs.
Table 28 Cost-effectiveness analysis (Peruvian Nuevos Soles and USD)
UDDT twin - fully on-site
UDDT collection
system
Waterborne system -
UASB treatment
Waterborne system – lagoon
treatment
Cost per death averted S/. 1,346,543
(US $410,227)
S/. 1,601,140
(US $488,152)
S/. 1,782,255
(US $543,370)
S/. 1,747,253
(US $532,699)
Cost per case of illness averted
S/. 89
(US $27)
S/. 105
(US $32)
S/. 117
(US $36)
S/. 115
(US $35)
Cost per DALY averted S/. 27,767
(US $8,466)
S/. 33,042
(US $10,074)
S/. 36,780
(US $11,213)
S/. 36,057
(US $10,993)
Cost per DALY averted as a percentage of GDP per capita per annum
149% 178% 198% 194%
10.8 Concluding remarks
The technology cost analysis reflects the findings of the Platzer et al (2008) in that the FSM option
entailing the collection and semi-centralised treatment of fecal waste is comparatively more cost
effective than the two conventional sewer-based options proposed. Through annualising these cost,
and estimating where along the sanitation chain they are incurred, it is clear that the driving force
behind this is the considerably lower costs associated with the transport and treatment of fecal waste.
Despite the differences in the technology costs, and based on a limited damage costing, all of the
proposed intervention options are cost-effective by international standards. It is only by assuming
the interventions mitigate less than 3% – 25% of the damage cost that cost-effectiveness no longer
holds.
Fecal Sludge Management in Lima – Case Study Report
78
11 Conclusion
This study has identified several key challenges in ensuring the continued provision of safe sanitation
services in peri-urban areas of Lima. Besides increasing urbanisation rates, one of the main issues
in Lima is the relatively low visibility of sanitation issues for the urban poor, as only 8% of the city’s
population relies on on-site sanitation, with the majority of citizens having access to sewerage. Other
concerns relate to the type of terrain inhabited by the urban poor, mainly hilly and rocky or sandy
areas that are difficult to access and where building adequate sanitation facilities is generally costly
(both in terms of time and capital investments). In addition, most of these areas have been illegally
inhabited, and although land tenure has progressively been granted, many households are at risk of
getting evicted, which generally discourages expenditures on improving housing conditions.
Furthermore, the very few available FSM services only service public institutions (schools, hospitals,
etc.) and wealthier households, which can guarantee payment. Given the lack of knowledge about
the size of the demand for FS emptying and transport services and the risk of no-payment on behalf
of poor households, private/tertiary sector providers are unwilling to invest in the development of an
FSM market. As has been pointed out at several instances across this study and the RAS, SEDAPAL
should naturally have the responsibility for the provision of FSM services, ensuring their integration
with all other WSS conventional services, with the private/tertiary sector (e.g. SWM firms) potentially
intervening as sub-contractors.
Given the inexistence of a FSM market for the urban poor, priority should be given to the following:
1. Ensuring adequate containment facilities are built and maintained by households – besides
encouraging the use of FS emptying and transport services, improved containment will also
minimise issues with the lack of space to build additional pits as well as health hazards related
to poor sealing of full pits.
2. FSM and on-site sanitation alternatives need to be properly included in policy and planning
documents, and a specific budget should be allocated to ensure that FSM services are
provided. Given that SEDAPAL’s conventional WSS services will not reach many of the
households living in peri-urban areas in the next 5 to 10 years (if not more), FSM needs to
be considered as a medium- to long-term option for peri-urban communities. Although
SEDAPAL’s upcoming pilot is a good starting point, FSM services will only be scalable if a
supportive enabling environment is in place.
3. Part of the profitability of FSM markets originates from the possibility of reusing treated FS.
Currently, the Peruvian legislation considers FS as a toxic waste, which limits exclusive FS
treatment and prohibits FS reuse. This may eventually become an important barrier for the
sustainability of FSM services, and is currently an impediment for NGOs, like X-Runner,
which are having to store their end-products indefinitely.
4. Sensitisation at all levels (community, local authorities, national authorities) will be key when
planning to carry out on-site sanitation interventions as there is a bias (as is the case for most
of Latin America) towards sewerage in urban areas. On-site sanitation is generally seen as
a long-term alternative only for rural areas, with urban dwellers only considering piped water
and sewerage as their options (e.g. all of X-Runner’s clients consider UDDTs as a short-term
alternative and they are all waiting for SEDAPAL to provide conventional services).
SEDAPAL (with the support of the World Bank) is considering different alternatives to improve
coverage in peri-urban areas. These are:
Fecal Sludge Management in Lima – Case Study Report
79
On-site FS containment and greywater disposal, with FS emptying and transport services
provided by tanker trucks (i.e. mechanical emptying), discharge at a FS treatment plant and
compost and/or fertilizer production;
Small community or condominial sewerage system, with decentralised wastewater treatment
plants and wastewater reuse in green areas, and
UDDTs with on-site greywater disposal and specialised FS treatment with compost and/or
fertilizer production.
How and where these interventions are actually taken forwards will depend on the pilot outcome and
the characteristics of the different peri-urban settlements. Besides the priority areas listed above,
active engagement from all sector stakeholders through continuous consultations is an imperative if
these alternatives are to become a reality for the urban poor.
Fecal Sludge Management in Lima – Case Study Report
80
References
BANCO MUNDIAL. (2015a). Servicios de agua potable y saneamiento en áreas peri-urbanas de
Lima y Callao.
BANCO MUNDIAL. (2015b). Estrategias para la ampliación de servicios en zonas peri-urbanas de
Lima Metropolitana.
BANCO MUNDIAL & SEDAPAL (2015). Soluciones innovadoras para la prestación de servicios de
agua y saneamiento en zonas peri-urbanas de Lima Metropolitana – Marco de opciones
técnicas, institucionales y sociales.
GOBIERNO DEL PERÚ. Plan Nacional de Saneamiento 2006-2015.
MARSEILLE, E., LARSON, B., KAZI, D. S., KAHN, J. G., & ROSEN, S. (2015). Thresholds for the
cost-effectiveness of interventions: alternative approaches. WHO Bulletin, 93(2), 118–124.
NORIEGA, R. (2015a). Recopilación de datos para la economía política de servicios de gestión de
lodos fecales en Lima Metropolitana - Reporte sobre recopilación de la información
secundaria actualizado.
NORIEGA, R. (2015b). Recopilación de datos para la economía política de servicios de gestión de
lodos fecales en Lima Metropolitana - Informe resumen del análisis de las entrevistas a los
actores clave.
NORIEGA, R. (2015c). Recopilación de datos para la economía política de servicios de gestión de
lodos fecales en Lima Metropolitana - Reporte de evaluación preliminar de la economía
política y la prestación de servicios de gestión de lodos fecales en la ciudad de Lima
Metropolitana.
PLATZER, C., HOFFMAN, H., & TICONA, E. (2008). Alternatives to Waterborne Sanitation - A
Combative Study: Limits and Potentials. Presented at the IRC Symposium: Sanitation for the
Urban Poor Partnerships and Governance, Delft, The Netherlands. Retrieved from
http://www.susana.org/_resources/documents/default/2-961-platzer-hoffmann-ticona-final-
170509.pdf [accessed 7 December 2015].
RIJSBERMAN, F., & PETERSON ZWANE, A. (2012). Copenhagen Consensus 2012: Sanitation and
Water Challenge Paper. Retrieved from http://www.copenhagenconsensus.com/sites/
default/files/waterandsanitation.pdf [accessed 7 December 2015].
SEDAPAL. (2014). Formato No. 10 Conexiones de Alcantarillado. Retrieved from
http://www.sedapal.com.pe/c/document_library/get_file?uuid=6b1aff63-de1c-461c-9657-
d642e3f5a40b&groupId=1593749 [accessed 13 August 2015].
SEDAPAL. (2015). Formato No. 3 Tratamiento de Aguas Servidas. Retrieved from
http://www.sedapal.com.pe/c/document_library/get_file?uuid=6337bbfa-f2bd-4626-af55-
436cabfa5286&groupId=1593749 [accessed 13 August 2015].
WHO DEPARTMENT OF HEALTH STATISTICS AND INFORMATION SYSTEMS. (2014, May).
WHO methods and data sources for country-level causes of death 2000-2012. World Health
Organization (WHO). Retrieved from http://www.who.int/healthinfo/global_burden_disease/
GlobalCOD_method_2000_2012.pdf?ua=1 [accessed 7 December 2015].

Fecal Sludge Management in Lima – Case Study Report
81
Annex A Map of sampled areas
Non-sewered areas (sub-sample A)
Lowest-income non-sewered areas (sub-sample B)

Fecal Sludge Management in Lima – Case Study Report
82
Annex B Methodology
B.1 Overall design
A key component of this study was primary data collection, since it aimed to build on an earlier 12-
city FSM study based only on secondary data (Peal & Evans, 2013). The study had six different data
collection instruments, four quantitative and two qualitative, each of which contribute to various
project components shown in Table 1 in the introduction of this report. These instruments are
summarised in Table 29 below.
Table 29 Summary table of data collection instruments
Instrument Data source N per city
Quantitative
Household survey
Survey of households (i) in non-sewered areas of Lima (Sample A),43 (ii) in lowest-income non-sewered settlements (Sample B)
720 (360 in each sample)
Observation of service provider practices
Observations of containment 6
Testing fecal sludge characteristics
Samples from (i) pits/tanks, (ii) truck/vessel outflow, and (iii) compost for reuse.
7
Transect walks
(i) Observation of environmental and public health risks through transect walks
40 (30 in Sample A, 10
in Sample B)
(ii) Drinking water supply samples, tested for fecal contamination and chlorine residual
60 (30 in each sample)
(iii) Drain water samples, tested for fecal contamination
30 (in the 10 districts in Sample B)
Qualitative
Key informant interviews (KIIs)
(i) government (e.g. council / utility, ministries) (ii) service providers along the sanitation chain (iii) other key FSM agencies
As required
Focus group discussions (FGDs)
FGDs with non-sewered, low-income and informal communities
10
The overall design decided by WSP was that the OPM/WEDC team should lead on methodology
and analysis, while actual data collection would be managed by two types of consultants contracted
separately. A local firm, Akut Peru, was contracted by WSP to conduct primary data collection under
all of the above instruments, except for the Key Informant Interviews. In addition, a short-term
consultant (Eng. Ruddy Noriega) was contracted to conduct the Key Informant Interviews and
produce a draft of the Service Delivery Assessment and Prognosis for Change.
Detailed research protocols for the instruments in the table above are available in a separate
instruments report here. This section briefly summarises each instrument, and the ensuing section
describes the sampling approach.
43 Excluding the 27 districts in both Lima and Callao that in 2007 had a sewerage coverage above 90%.
Fecal Sludge Management in Lima – Case Study Report
83
Household survey
The household survey aimed to collect data from households using on-site sanitation (particularly
those living in informal or low-income settlements) regarding their use of FSM services and
preferences for future FSM services. The household survey informs multiple components of this
research. The sampling was carefully planned so as to allow representative conclusions to be drawn
from non-sewered households in low sewerage coverage areas of Lima Metropolitan Area44, and
separate conclusions for lowest-income non-sewered areas45 in particular, on a purposive basis.
Questionnaire sections included a household roster, dwelling characteristics, use of water and
sanitation infrastructure, usability and observation of latrines, satisfaction and planning on sanitation,
and pit / septic tank filling up and emptying.
Observation of service provider practices
The observation protocol involved making visual inspections about fecal sludge from pits or tanks to
final disposal, in particular watching service providers (SPs) go about their business. Observations
required the identification of hazards, hazardous events, and an assessment of possible risks at
each stage (containment, emptying, transport, treatment and end-use or disposal) of the fecal sludge
management chain. However, given the limited scope of FSM services in Lima, observations mainly
focussed on the containment and emptying stages of the chain.
Testing fecal sludge characteristics
The characteristics of fecal sludge will vary, depending on many factors including, but not limited to,
the length of time for which it has been stored, the season, and the storage conditions (e.g. whether
the sludge was in a lined or unlined pit). Assessment of the characteristics was performed in (i)
latrines / pits currently being used, (ii) abandoned pits, (iii) urine-diverting (UD) sanitation facilities,
and (iv) during removal, as this will influence the removal methods that could be used.
Transect walk
The transect walk enabled participants to make a subjective and qualitative assessment of the
physical and environmental conditions within a community. During the walk, participants make
systematic observations, discuss them and record their findings using a standard reporting format.
The information collected complements data from household questionnaires, observations, and
sample collection and analysis. For this study, a transect walk provides information about the broad
environmental risks to public health, in particular with respect to the presence of fecal material and
solid waste, and the likelihood that these enter drainage channels and water sources. When all
observations are complete, participants ask community members a few short questions to gain
information about typical behaviours in the community that could be a source of risk (e.g. latrines
discharging to drains, overflowing latrines, illegal dumping of fecal sludge, etc.) and the frequency of
those behaviours throughout the year (e.g. daily, weekly, seasonal, etc.). These walks were
designed to give an overall picture of conditions in a neighbourhood – they did not aim to allow
detailed maps to be drawn with fecal sludge flows to be physically tracked, nor did they aim to make
operational recommendations at the neighbourhood level.
44 In the other case country studies, sampling was designed to draw representative conclusions for the city as a whole, and lowest-income non-sewered areas in particular. However, Lima has a very high sewerage coverage (estimated at 92% in 2012), so to be able to assess FSM services, the study focussed on the low sewerage coverage areas of the city, i.e. 22 districts where sewerage coverage was below 90% in 2007. 45 Lowest-income areas were selected based on national poverty levels (i.e. districts with a poverty index level above 20%).
Fecal Sludge Management in Lima – Case Study Report
84
Testing water supply and drain water quality
During transect walks, samples of drinking water supplies and water flowing in irrigation channels
and greywater deposits or puddles were taken from a selection of UALs in the city and tested for
levels of E. coli. The results help to identify the extent to which there is an association between poor
FSM services and resulting levels of fecal contamination in the local environment (i.e. in water
supplies, irrigation channels, etc.). This information, together with results from transect walk
observations, reported sanitation behaviours and practices in the community and other data sources,
helps build-up a picture of the public health risks associated with poor FSM services, related to
contamination levels (hazard), exposure and vulnerability.
Key informant interviews
Key informant interviews (KIIs) are the way in which primary information was sought to address key
questions about how both the ‘enabling environment’ and the operating environment affects FSM
services (past, current and future). KIIs were held with stakeholders having responsibility or interest
in FSM services at city-level and beyond, allowing the enabling and operating environments to be
better understood in relation to their influence within the city.
Focus group discussions
The objective of focus group discussions (FGDs) with residents of informal settlements was to gather
qualitative data that would complement, validate, or perhaps challenge responses made during the
household survey. Questions focused on obtaining information relating to household sanitation and
FSM practices (particularly identifying the practices of “others”, as individuals are reluctant to talk
honestly about their own, or their families’ practices), service levels, past interventions, risks and
other issues associated with FSM services that affect their community.
B.2 Sampling
B.2.1 Household survey
The main sampling method design was for the household survey, with the sampling approaches for
other instruments using the selected clusters as a basis. Therefore, the household survey is
discussed first, and the remaining instruments are covered afterwards. Overall, it is crucial to
understand that in the sampling, two pictures were being sought: the first to give an understanding
of the situation of non-sewered households in (1) low sewerage coverage areas of Lima, and (2) a
specific understanding of the situation in lowest-income areas.
Given the high level of sewerage coverage in Lima, Peru, the study population were non-sewered
households in the city located in areas where sewerage coverage was below 90%, as reported in
the 2007 National Census. This encompasses 314,087 households in 22 urban districts within the
boundaries of Lima Metropolitan Area (i.e. Lima and Callao municipalities), here on referred to as
‘Lima’. These districts are listed below in Table 30.
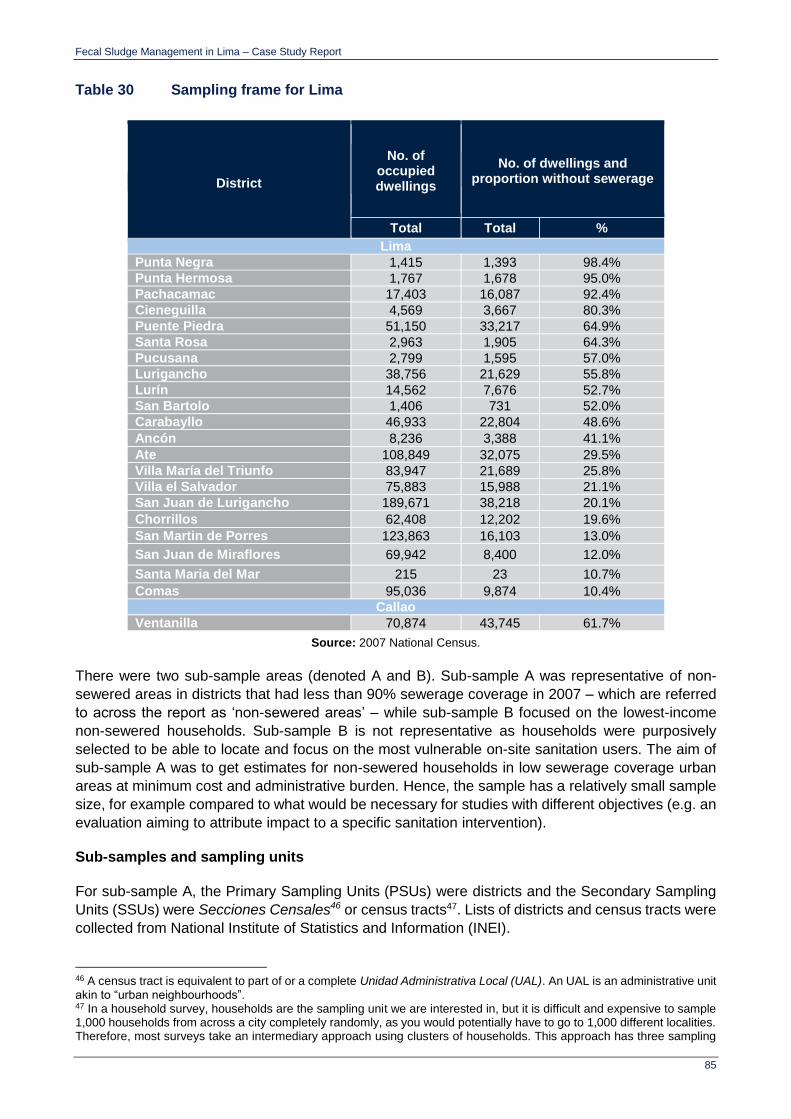
Fecal Sludge Management in Lima – Case Study Report
85
Table 30 Sampling frame for Lima
District
No. of occupied dwellings
No. of dwellings and proportion without sewerage
Total Total %
Lima
Punta Negra 1,415 1,393 98.4%
Punta Hermosa 1,767 1,678 95.0%
Pachacamac 17,403 16,087 92.4%
Cieneguilla 4,569 3,667 80.3%
Puente Piedra 51,150 33,217 64.9%
Santa Rosa 2,963 1,905 64.3%
Pucusana 2,799 1,595 57.0%
Lurigancho 38,756 21,629 55.8%
Lurín 14,562 7,676 52.7%
San Bartolo 1,406 731 52.0%
Carabayllo 46,933 22,804 48.6%
Ancón 8,236 3,388 41.1%
Ate 108,849 32,075 29.5%
Villa María del Triunfo 83,947 21,689 25.8%
Villa el Salvador 75,883 15,988 21.1%
San Juan de Lurigancho 189,671 38,218 20.1%
Chorrillos 62,408 12,202 19.6%
San Martin de Porres 123,863 16,103 13.0%
San Juan de Miraflores 69,942 8,400 12.0%
Santa Maria del Mar 215 23 10.7%
Comas 95,036 9,874 10.4%
Callao
Ventanilla 70,874 43,745 61.7%
Source: 2007 National Census.
There were two sub-sample areas (denoted A and B). Sub-sample A was representative of non-
sewered areas in districts that had less than 90% sewerage coverage in 2007 – which are referred
to across the report as ‘non-sewered areas’ – while sub-sample B focused on the lowest-income
non-sewered households. Sub-sample B is not representative as households were purposively
selected to be able to locate and focus on the most vulnerable on-site sanitation users. The aim of
sub-sample A was to get estimates for non-sewered households in low sewerage coverage urban
areas at minimum cost and administrative burden. Hence, the sample has a relatively small sample
size, for example compared to what would be necessary for studies with different objectives (e.g. an
evaluation aiming to attribute impact to a specific sanitation intervention).
Sub-samples and sampling units
For sub-sample A, the Primary Sampling Units (PSUs) were districts and the Secondary Sampling
Units (SSUs) were Secciones Censales46 or census tracts47. Lists of districts and census tracts were
collected from National Institute of Statistics and Information (INEI).
46 A census tract is equivalent to part of or a complete Unidad Administrativa Local (UAL). An UAL is an administrative unit akin to “urban neighbourhoods”. 47 In a household survey, households are the sampling unit we are interested in, but it is difficult and expensive to sample 1,000 households from across a city completely randomly, as you would potentially have to go to 1,000 different localities. Therefore, most surveys take an intermediary approach using clusters of households. This approach has three sampling
Fecal Sludge Management in Lima – Case Study Report
86
For sub-sample B, households were chosen based on three different criteria: (1) UAL is one of
SEDAPAL’s (Lima’s utility) priority areas; (2) observed poverty and (3) not connected to sewerage.
Areas prioritised by SEDAPAL are those that are unlikely to gain access to sewerage in the next four
years, which encompass 33 Unidades Administrativas Locales (UALs). The poverty status of the
household was determined based on road characteristics, access to public services (i.e. electricity,
water and sewerage), and dwelling characteristics. The focus of the sample were asentamientos
humanos (i.e. human settlements) in both rocky and sandy peri-urban areas of Lima48.
Finally, the Tertiary Sampling Units (TSUs) were households, in both cases.
A map showing the location of sampled district and SSUs within districts is shown in Annex A.
Sample sizes
Given that in both sub-samples, the sampling is purposive (i.e. in sub-sample A, the focus is non-
sewered households and in sub-sample B the focus is lowest-income non-sewered households),
there is no specific level of confidence. To be consistent with other city case studies, the sample size
for each sub-sample was 360 households, giving a total number of 720 households surveyed across
both sub-samples.
Sampling methodology
Sub-sample A – non-sewered areas
A three-stage sampling approach was followed. In the first stage, 10 districts/PSUs were sampled
from the 22 districts with a sewerage coverage below 90% using probability proportionate to size
(PPS), listed in Table 30 above. In the second stage of sampling, 30 census tracts were randomly
selected from the PSUs (i.e. 3 per district). This can legitimately be called a non-sewered sample of
census tracts of low-sewerage coverage areas of Lima.
Households (TSUs) were sampled using systematic random sampling. Each supervisor and
enumerator was given a map of the UAL divided into twelve equally-sized blocks. Upon arrival to the
first block (previously selected by Akut), the enumerator surveyed the first house (starting from the
northeast corner of the block and walking in a clockwise direction). After completing the first survey,
the enumerator jumped the following 4 houses, and interviewed the next one (i.e. the 6th house). The
enumerator followed this ‘jump system’ until 12 questionnaires were completed49.
In cases where the household did not wish to participate, it was replaced with the adjacent /
neighbouring household. There were two additional types of replacements. On one hand, if in a
census tract less than 20% of households were found not to be connected to sewerage, the tract
was randomly replaced with another one from a list of 20 census tracts. On the other hand, if during
units. The district is the primary sampling unit (PSU), the census tract / neighbourhood is the secondary sampling unit (SSU) and the household is the tertiary sampling unit (TSU). The reason we say SSU instead of census tract / neighbourhood is the former can be clearly defined geographically, whereas the latter means different things to different people. The size of a SSU will differ across cluster surveys. The gold standard is to use census enumeration areas (usually between 200 and 400 households), but this is not always possible. 48 The reason for distinguishing between rocky and sandy areas is that, in the former, households are generally unable to dig deep pits and thus rely on containment structures that fill up and overflow frequently. Digging pits in sandy soil is easier, and there is usually a higher rate of infiltration, so pits are expected to last for a longer time. 49 A differentiated systemic jump was used, depending on the number of households in the census tract without access to sewerage. For census tracts with 100 or more households without sewerage, a jump of 5 households (k = 5) was used. For census tracts with 51 – 99 households without sewerage, k = 3. Finally, for census tracts with 30 – 50 households without sewerage, k = 1 (i.e. every other household was surveyed).
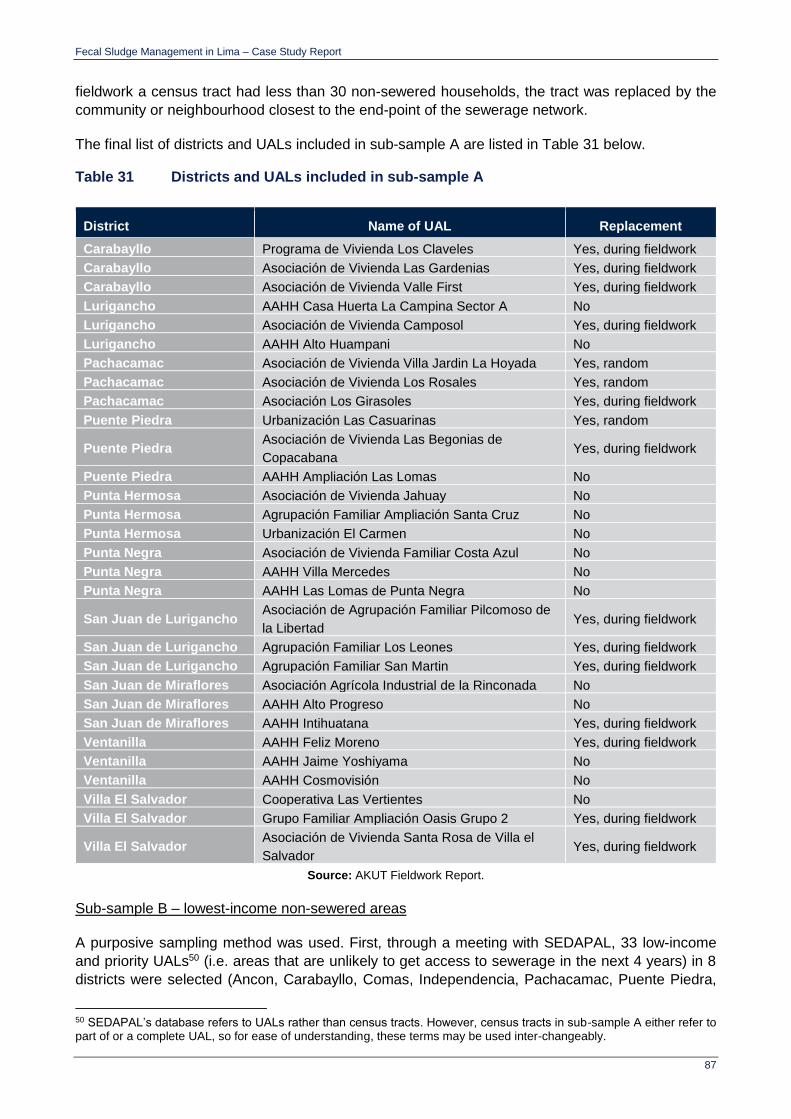
Fecal Sludge Management in Lima – Case Study Report
87
fieldwork a census tract had less than 30 non-sewered households, the tract was replaced by the
community or neighbourhood closest to the end-point of the sewerage network.
The final list of districts and UALs included in sub-sample A are listed in Table 31 below.
Table 31 Districts and UALs included in sub-sample A
District Name of UAL Replacement
Carabayllo Programa de Vivienda Los Claveles Yes, during fieldwork
Carabayllo Asociación de Vivienda Las Gardenias Yes, during fieldwork
Carabayllo Asociación de Vivienda Valle First Yes, during fieldwork
Lurigancho AAHH Casa Huerta La Campina Sector A No
Lurigancho Asociación de Vivienda Camposol Yes, during fieldwork
Lurigancho AAHH Alto Huampani No
Pachacamac Asociación de Vivienda Villa Jardin La Hoyada Yes, random
Pachacamac Asociación de Vivienda Los Rosales Yes, random
Pachacamac Asociación Los Girasoles Yes, during fieldwork
Puente Piedra Urbanización Las Casuarinas Yes, random
Puente Piedra Asociación de Vivienda Las Begonias de
Copacabana Yes, during fieldwork
Puente Piedra AAHH Ampliación Las Lomas No
Punta Hermosa Asociación de Vivienda Jahuay No
Punta Hermosa Agrupación Familiar Ampliación Santa Cruz No
Punta Hermosa Urbanización El Carmen No
Punta Negra Asociación de Vivienda Familiar Costa Azul No
Punta Negra AAHH Villa Mercedes No
Punta Negra AAHH Las Lomas de Punta Negra No
San Juan de Lurigancho Asociación de Agrupación Familiar Pilcomoso de
la Libertad Yes, during fieldwork
San Juan de Lurigancho Agrupación Familiar Los Leones Yes, during fieldwork
San Juan de Lurigancho Agrupación Familiar San Martin Yes, during fieldwork
San Juan de Miraflores Asociación Agrícola Industrial de la Rinconada No
San Juan de Miraflores AAHH Alto Progreso No
San Juan de Miraflores AAHH Intihuatana Yes, during fieldwork
Ventanilla AAHH Feliz Moreno Yes, during fieldwork
Ventanilla AAHH Jaime Yoshiyama No
Ventanilla AAHH Cosmovisión No
Villa El Salvador Cooperativa Las Vertientes No
Villa El Salvador Grupo Familiar Ampliación Oasis Grupo 2 Yes, during fieldwork
Villa El Salvador Asociación de Vivienda Santa Rosa de Villa el
Salvador Yes, during fieldwork
Source: AKUT Fieldwork Report.
Sub-sample B – lowest-income non-sewered areas
A purposive sampling method was used. First, through a meeting with SEDAPAL, 33 low-income
and priority UALs50 (i.e. areas that are unlikely to get access to sewerage in the next 4 years) in 8
districts were selected (Ancon, Carabayllo, Comas, Independencia, Pachacamac, Puente Piedra,
50 SEDAPAL’s database refers to UALs rather than census tracts. However, census tracts in sub-sample A either refer to part of or a complete UAL, so for ease of understanding, these terms may be used inter-changeably.

Fecal Sludge Management in Lima – Case Study Report
88
Santa Rosa and Ventanilla). UALs that were previously selected in sub-sample A or confirmed to
have access to sewerage (i.e. 13 UALs), were excluded, leaving a sample of 20 UALs. The remaining
10 UALs were selected based on proximity to the end-point of the sewerage network, i.e. the closest
non-sewered UAL to an excluded prioritised area. 18 of the UALs selected had sandy soil, 11 were
predominantly rocky areas, while the remaining UAL was in located in a farming area. For sampling
households / TSU, the same process was followed as in sub-sample A.
Districts and UALs included in sub-sample B are listed in Table 32 below.
Table 32 Districts and UALs included in sub-sample B
District Name of UAL Replacement SEDAPAL
Priority Area
Ancon Asociación de Vivienda La Variante de Ancón No Yes
Ancon Asociación de Vivienda Las Lomas de Ancón No Yes
Ancon Asociación Popular Villa Maria de Ancón No Yes
Carabayllo Asociación de Productores Pecuarios Pampa de
San Antonio Yes No information
Carabayllo AAHH Las Lomas de Torre Blanca Alta No No
Carabayllo Asociación Sol y Campo Yes No information
Carabayllo Asociación Agrícola 11 de Noviembre No No
Carabayllo Urbanización Los Cipreses Yes No information
Comas AAHH Villa San Camilo No No
Comas AAHH Señor de la Misericordia No Yes
Comas AAHH Ampliación Buenos Aires – III Zona
Colique No No
Independencia Asociación de Vivienda Ampliación Las
Gardenias No No
Independencia Asociación Ampliación San Juan Bautista Comité
13 No No
Independencia AAHH Santa Rosa de Lima III Etapa Yes No information
Pachacamac AAHH JIREH No Yes
Pachacamac AAHH Los Cedros de Manchay No Yes
Pachacamac Asociación de Vivienda Ecológica Los Alpes No Yes
Pachacamac Centro Poblado Rural Quebrada Verde No Yes
Pachacamac Asociación de Vivienda San Judas Tadeo No Yes
Puente Piedra Asociación de Vivienda Nueva Vida Yes No information
Puente Piedra Asociación de Vivienda Santo Domingo de
Copacabana Yes No information
Puente Piedra Asociación de Vivienda Rosario de Copacabana No Yes
Puente Piedra Asociación de Vivienda La Fortaleza No Yes
Puente Piedra Asociación de Vivienda Santa Teresa No Yes
Puente Piedra Asociación de Vivienda Luis Pardo Yes No information
Santa Rosa Asociación de Vivienda PROFAM Sector 8 No Yes
Santa Rosa Asociación de Vivienda Las Brisas de Santa Rosa
II Etapa No Yes
Santa Rosa Asociación ADESESEP Yes No information
Ventanilla AAHH Jose Maria Arguedas Yes No information
Ventanilla AAHH Ampliación Costa Azul No No information
Source: AKUT Fieldwork Report.
Fecal Sludge Management in Lima – Case Study Report
89
B.2.2 Other instruments
Observation of service provider practices and testing fecal sludge characteristics
Fully recorded observations were made at 6 different locations (latrines in use, abandoned latrines,
urine-diverting (UD) sanitation facilities and mechanical emptying trucks), at the containment and
emptying stages of the sanitation service chain. Tests were also carried out at the reuse stage for
UD bi-products, as there is no composting for other type of on-site sanitation facilities. Tests at
transport and treatment stages were excluded as there are no specific fecal sludge services (except
for public institutions and richer households). Overall, the chosen observations reflect existing fecal
sludge management practices as much as possible.
Tests for fecal sludge characteristics were carried out on fecal sludge and dried excreta collected
during the observations of SPs, so their sampling method is identical.
Transect walks
Transect walks were conducted in 40 UALs in total: all 30 census tracts of sub-sample A and 10
randomly selected UALs from the full list of sub-sample B UALs. Section 4 in the report includes an
explanation of the format and scoring used during the transect walks.
Testing water supply and drain water quality
Samples of drinking water supplies were taken in 20 different UALs; 10 in sub-sample A and 10 in
sub-sample B. Water samples were taken from either the same water source or from the three most
common drinking water supplies identified in the UAL (verified by asking community members).
Samples were taken at the source of the supply and tested for levels of E. coli to identify
contamination in the supply itself and avoid measuring contamination resulting from poor water
storage or handling practices. Similarly, water samples from irrigation channels / dumping sites were
taken in 10 UALs from sub-sample B, from either the same location or from three different locations
and also tested for levels of E. coli, to identify contamination from poor sanitation and fecal sludge
handling within the UAL. A standard procedure for collecting samples was followed, with samples
sent to registered laboratories for testing.
Key informant interviews
The total number of interviews required, as well as the range and extent of questioning, was
influenced by the availability of current and reliable data from other sources, as well as constraints
on time and resources. Selection of interviewees was purposive, based on advice received from
stakeholders and existing knowledge of the World Bank consultant.
Focus group discussions
10 FGDs were held with households from 10 UALs from sub-sample B, which were randomly
selected from the total of 30 sub-sample B UALs in lowest-income non-sewered areas.
B.3 Fieldwork implementation
Pretesting, training and piloting
Initial pre-testing was carried out by Akut to refine the instruments a week prior to the enumerator
training. During the training, all data collection instruments were piloted in UALs excluded from the
final samples but that belong to the sampling frame, i.e. any of the 22 districts with less than 90%
sewerage coverage.

Fecal Sludge Management in Lima – Case Study Report
90
Field team composition
For the quantitative survey, two field teams were deployed for data collection. Each team was
composed by one Supervisor and four Household Enumerators. An experienced Field Manager was
responsible for ensuring overall management, field implementation and quality assurance.
Data collection
The field teams collected the majority of the data from the 60 sampled UALs in 4 weeks during
December 2014 to January 2015. On average, each team spent one day in a PSU. Each household
interviewer conducted the survey in 6 households per day, and thus each team with 2 interviewers
completed 12 households in a cluster in one day. For the transect walks (TWs), five teams of two
participants conducted all 40 TWs over 7 days.
Data entry, cleaning and analysis
The quantitative survey data were entered into SPSS at Akut’s offices in Lima, using various data
quality checks, including range checks, skips and internal consistency checks. After data cleaning
checks, data were then transferred into the statistical software Stata. Data were analysed using Stata
in OPM’s offices in Oxford.
B.4 Limitations
This study has two key limitations which need to be considered to understand the strengths and
weaknesses of the data and the conclusions that can and cannot be drawn from the analysis. These
should be considered in the context of the objectives of the study (see Section 1.2 in the main report).
These are:
Socio-economic survey – household surveys with enumerators skilled in social research
can only really ask questions of householders. Although enumerators were trained to observe
and identify different characteristics of sanitation facilities, they cannot always make accurate
technical inspections of the infrastructure, which would require a different skillset. Therefore,
it is necessary to take the household’s responses at face value (e.g. about the destination of
their blackwater).
Sampling method – sample surveys are designed to estimate indicators for a broader
population. Therefore, they cannot produce detailed data for specific neighbourhoods without
dramatically increasing the sample size and appropriate stratification. The sample size for
this study is relatively small compared to what would be necessary for an impact evaluation,
for example. In a similar vein, transect walks aimed to build up a broad picture rather than
specific maps or explanations for individual neighbourhoods. Finally, the study only focuses
on non-sewered residential areas and households of Lima, excluding sewered residential
areas, and all public establishments and institutions.
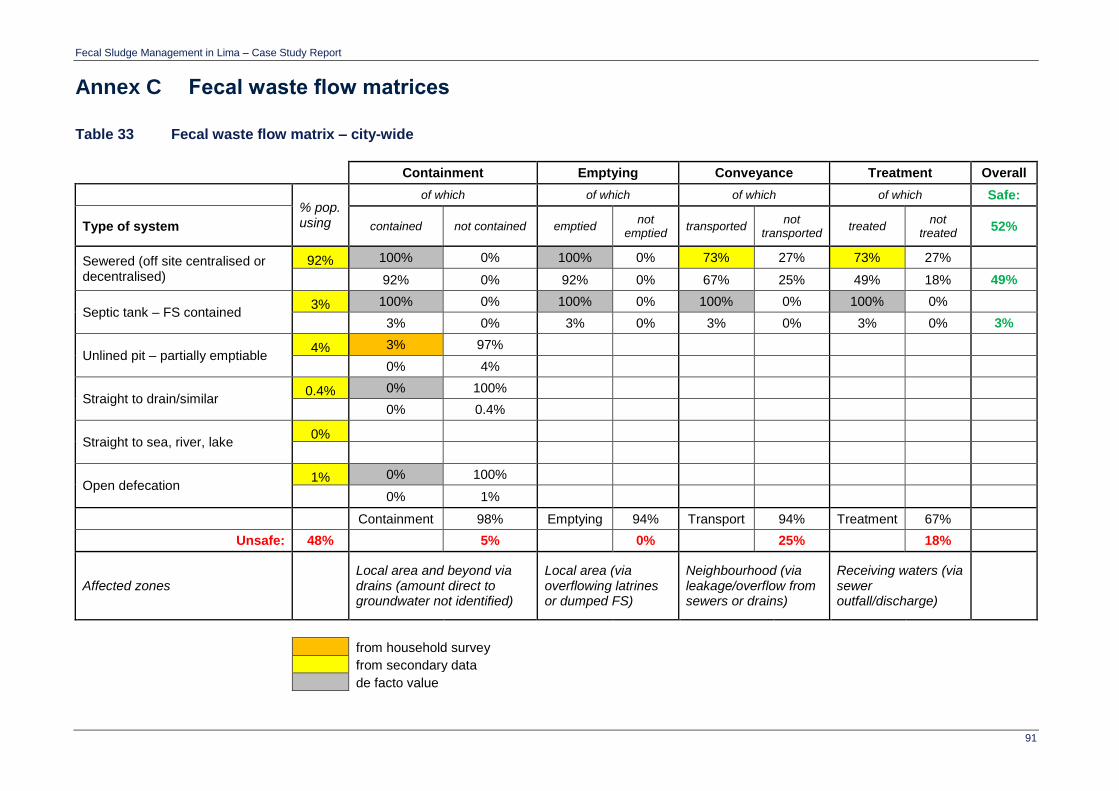
Fecal Sludge Management in Lima – Case Study Report
91
Annex C Fecal waste flow matrices
Table 33 Fecal waste flow matrix – city-wide
Containment Emptying Conveyance Treatment Overall
% pop. using
of which of which of which of which Safe:
Type of system contained not contained emptied not
emptied transported
not transported
treated not
treated 52%
Sewered (off site centralised or decentralised)
92% 100% 0% 100% 0% 73% 27% 73% 27%
92% 0% 92% 0% 67% 25% 49% 18% 49%
Septic tank – FS contained 3% 100% 0% 100% 0% 100% 0% 100% 0%
3% 0% 3% 0% 3% 0% 3% 0% 3%
Unlined pit – partially emptiable 4% 3% 97%
0% 4%
Straight to drain/similar 0.4% 0% 100%
0% 0.4%
Straight to sea, river, lake 0%
Open defecation 1% 0% 100%
0% 1%
Containment 98% Emptying 94% Transport 94% Treatment 67%
Unsafe: 48% 5% 0% 25% 18%
Affected zones
Local area and beyond via drains (amount direct to groundwater not identified)
Local area (via overflowing latrines or dumped FS)
Neighbourhood (via leakage/overflow from sewers or drains)
Receiving waters (via sewer outfall/discharge)
from household survey
from secondary data
de facto value

Fecal Sludge Management in Lima – Case Study Report
92
Table 34 Fecal waste flow matrix – non-sewered areas
Containment Emptying Conveyance Treatment Overall
% pop. using
of which of which of which of which Safe:
Type of system contained not
contained emptied
not emptied
transported not
transported
treated not
treated 1%
Sewered (off site centralised or decentralised)
0%
Septic tank – FS contained 1% 100% 0% 100% 0% 100% 0% 100% 0%
1% 0% 1% 0% 1% 0% 1% 0% 1%
Unlined pit – partially emptiable 96% 3% 97% 90% 10% 44% 56% 0% 100%
3% 93% 3% 0% 1% 2% 0% 1%
Straight to drain/similar 3% 0% 100%
0% 3%
Straight to sea, river, lake 0%
Open defecation 0% 0% 100%
0% 0%
Containment 97% Emptying 1% Transport 1% Treatment 1%
Unsafe: 99% 96% 0% 2% 1%
Affected zones
Local area and beyond via drains (amount direct to groundwater not identified)
Local area (via overflowing latrines or dumped FS)
Neighbourhood (via leakage/overflow from sewers or drains)
Receiving waters (via sewer outfall/discharge)
from household survey
from secondary data
de facto value

Fecal Sludge Management in Lima – Case Study Report
93
Annex D CSDA scoring table criteria
Sub-question Question
Co
nta
inm
en
t
Em
pty
ing
Co
nv
ey
an
ce
Tre
atm
en
t
En
d-u
se
/dis
po
sa
l
Indicator/ Score Comments
Enabling:
What are current policies, planning issues and budgetary arrangements?
1. Policy
1.1 Policy: Is FSM
included in an appropriate, acknowledged and available policy document (National/ local or both)?
0 0.5 0.5 0 0
1: policy is appropriate, approved (or in draft form), acknowledged and available
Legislation exists for the sanitation sector as a whole, but there are no specific provisions for FSM. Law 26338 (General Law for Sanitation Services) encompasses the disposal of feces from latrines and septic tanks as part of service provision. Law 30045 (Modernisation of Sanitation Services) also encompasses feces disposal in both urban and rural areas (besides water supply and sewerage) according to the following principles: universal access, social inclusion, environmental protection, firm independence and efficiency. Law 30045 also defines competencies across different sector stakeholders (e.g. regulatory agencies, service providers). Other relevant laws include 28611 (General Environmental Law), 27314 (General Solid Waste Law) and 27972 (Municipalities Law). Nothing specific for fecal sludge treatment and just one mention of 'residual water reuse' in Law 28611.
0.5: policy is appropriate, approved (or in draft form), but not clearly acknowledged / available
0: policy not available, or inappropriate to the context
1.2 Institutional roles: Are the
institutional roles and responsibilities for FSM service delivery clearly defined and operationalized?
0 0 0 0 0
1: roles defined and operationalised Competencies are defined in Law 30045 for the provision of sanitation services, including feces disposal. A large proportion of the Law refers to service providers (EPSs), which are currently in charge mainly of solid waste management and FSM for public institutions (e.g. Mega Pack Trading). There is no explicit regulation for the provision of FSM services, but rather general principles that apply to all sanitation services. Interviews suggest that roles and responsibilities are neither operationalised (as FSM services are not provided) nor clear (Sedapal, SUNASS, DIGESA, DESA).
0.5: roles clearly defined but not operationalised, or not-defined by work in practice
0: roles not defined / not operationalised

Fecal Sludge Management in Lima – Case Study Report
94
Sub-question Question
Co
nta
inm
en
t
Em
pty
ing
Co
nv
ey
an
ce
Tre
atm
en
t
En
d-u
se
/dis
po
sa
l
Indicator/ Score Comments
There is a National Building Regulation that determines the standards for sanitation facilities, but only considers septic tanks and sewerage.
1.3 Regulation: Are
there national and/or local regulatory mechanisms (i.e. bylaws and means of enforcement) for FSM?
0 0.5 0.5 0 0
1: regulatory mechanisms for FSM exist and are operational
Regulation for FSM services would be the same as that applicable to service providers more broadly (defined in Law 30045). There is very limited regulation in place for the provision of services to households in urban areas; KIIs have mixed opinions, but generally lean more towards 'no regulation'.
0.5: regulatory mechanisms for FSM exist but are not operational
0: no regulatory mechanisms for FSM exist
1.4 Service provision: does the
policy, legislative and regulatory framework enable investment and involvement in FSM services by appropriate service providers (private or public)?
0.5 0.5 0 0 0
1: legal framework enables investment, with evidence of increasingly formalised involvement
Question was not addressed, but Law 30045 (Modernisation of Sanitation Services) makes provisions for public sector investment and encourages PPPs. However, KIIs mentioned that there are no clear incentives for private sector involvement in the provision of FSM services // Provision of on-site sanitation in urban areas by NGOs, such as XRUNNER.
0.5: legal framework doesn't address investment, but evidence of involvement (through formal or informal mechanisms) in practice
0: legal framework doesn't enable investment and/or no evidence of involvement (through formal or informal mechanisms)
2. Planning
2.1 Targets: Are
there service targets for (each part of) the FSM service chain in the city development plan, or a national development plan that is being adopted at the city level?
0 0 0 0 0
1: targets are clearly included The national target is 100% sewerage by 2017, with no mention of FSM as a short-, medium- or long-term alternative. The possibility of a national or local plan is hindered by the fact that there are no designated responsibilities among key stakeholders for FSM.
0.5: service levels are included, but no targets stated
0: no reference to service levels or targets

Fecal Sludge Management in Lima – Case Study Report
95
Sub-question Question
Co
nta
inm
en
t
Em
pty
ing
Co
nv
ey
an
ce
Tre
atm
en
t
En
d-u
se
/dis
po
sa
l
Indicator/ Score Comments
2.2 Investment: Is
FSM incorporated into an approved and used investment plan (as part of sanitation) - including ensuring adequate human resources and Technical Assistance? (Ideally a medium term plan, but if not, at least an annual plan)
0 0 0 0 0
1: investment plan for FSM exists, based on identified needs and addressing human resource and TA needs
Investment plans with on-site sanitation mainly address rural areas through the National Rural Sanitation Programme. It is not clear if the National Urban Sanitation Programme also encompass on-site sanitation & FSM, but KIIs suggest that this is not the case.
0.5: investment plan for FSM exists, but does not address human resource or TA needs
0: no investment plan for FSM
3. Budget
3.1 Fund flows:
Does government have a process for coordinating FSM investments (domestic or donor, e.g. national grants, state budgets, donor loans and grants etc.)?
0 0 0 0 0
1: coordination of investments is defined and operationalised
KIIs were not aware of a coordination process for FSM. However, funds are always insufficient to meet investment needs in sanitation.
0.5: coordination of investments is defined, but not operationalised
0: no coordination of investments defined
3.2 Adequacy & structure: Are the
annual public financial commitments to FSM commensurate with meeting needs/targets for Capex and Opex (over the coming 5 years)?
0 0 0 0 0
1: annual public financial commitments are sufficient to meet >75% of requirements (estimated need if no targets set)
FSM is not established and there are no public financial commitments over the coming 5 years to address FSM in peri-urban areas. More generally, as mentioned above, sanitation funds have always been insufficient to meet the needs identified.
0.5: annual public financial commitments are sufficient to meet >50% of requirements (estimated need if no targets set)

Fecal Sludge Management in Lima – Case Study Report
96
Sub-question Question
Co
nta
inm
en
t
Em
pty
ing
Co
nv
ey
an
ce
Tre
atm
en
t
En
d-u
se
/dis
po
sa
l
Indicator/ Score Comments
0: annual public financial commitments insufficient to meet 50% of requirements (estimated need if no targets set)
Developing:
What is the level of expenditure, degree of equity and level of output?
4. Capital expenditure
4.1 Capital funding:
What is Capex expenditure per capita on FSM (3 year average)?
0 0 0 0 0
Range of Capex expenditure Question was not addressed, but FSM is not established.
(This will be matched to service levels and needs)
5. Equity
5.1 Choice: Is there a
range of affordable, appropriate, safe and adaptable technologies for FSM services available to meet the needs of the urban poor?
0 0 0 0 0
1: range of technical options exist (i.e. are “offered” formally) and are used by the urban poor
Formal services are very expensive for the urban poor. FSM services are only available for beach houses in rich areas, and for public establishments. The Ministry of Environment suggests there may be some informal provision of services, for all residual water (greywater and blackwater), but not exclusively for FS. Informal providers would empty contents in nearby drains.
0.5: range of options exist, but are not accessed by the urban poor, or just not used
0: options are not present
5.2 Reducing inequity: Are there
specific and adequate funds, plans and measures to ensure FSM serves all users, and specifically the urban poor?
0 0 0 0 0
1: funds, plans and measures are codified and in use
There are no specific measures to provide services for the urban poor. KIIs mentioned that they would need to carry out a demand diagnosis to know if service provision for the poor is a feasible option. Law 30045 does include universal access and social inclusion as principles for service provision.
0.5: funds, plans and measures are codified but not in use
0: no funds, plans and measures codified
6. Outputs
6.1 Quantity / capacity: Is the
capacity of each part of the FSM value chain growing at the
0 0 0 0 0 1: capacity growing at a pace to meet >75% of the needs/demands and targets to protect health
No FSM services - there were some previous initiatives to expand access to latrines, and currently there is provision of dry sanitation facilities, but there is nothing beyond containment.

Fecal Sludge Management in Lima – Case Study Report
97
Sub-question Question
Co
nta
inm
en
t
Em
pty
ing
Co
nv
ey
an
ce
Tre
atm
en
t
En
d-u
se
/dis
po
sa
l
Indicator/ Score Comments
pace required to ensure access to FSM meets the needs/demands and targets that protects public and environmental health?
0.5: capacity growing at a pace to achieve >50% of needs/demands and targets to protect health
KIIs of SWM service providers suggests that they may have the capacity to undertake FSM services. These providers are currently subject to environmental and public health regulation, which would also apply if FSM services were to be formalised. However, there is no demand analysis available to determine if quantity / capacity at each stage of the FSM chain is sufficient.
0: capacity insufficient to meet 50% of the needs/demands and targets to protect health
6.2 Quality: Is the
quality of FSM sufficient to ensure functioning facilities and services that protect against risk through the service chain?
0 0 0 0 0
1: >75% of services that protect against risk and are functional through the service chain
No FSM services. Formal solid waste management service providers transport waste to approved disposal sites (e.g. landfills or Sedapal collection sites), but informal service providers do not. Illegal dumping is partly due to lack of adequate monitoring on behalf of local authorities (e.g. DIGESA, Lima Municipality).
0.5: >50% of services that protect against risk and are functional through the FSM service chain
0: less than 50% of services that protect against risk and are functional through the FSM service chain
6.3 Reporting: Are
there procedures and processes applied on a regular basis to monitor FSM access and the quality of services and is the information disseminated?
1: regular reporting on both access and quality of FSM services, with information disseminated
THIS QUESTION WAS MOVED TO SERVICE OUTCOMES – ALL SCORES ARE ZERO.
0.5: regular reporting on either access or quality of FSM services (with information disseminated or not)
0: no regular reporting on either access or quality of FSM services
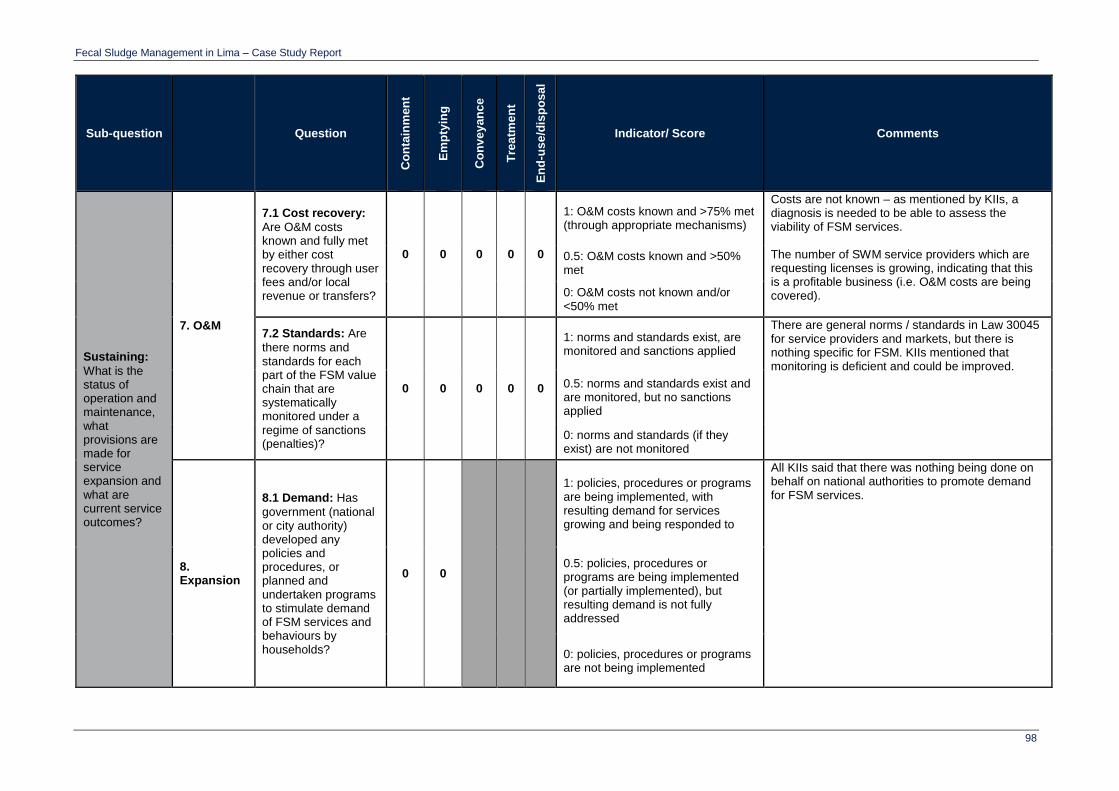
Fecal Sludge Management in Lima – Case Study Report
98
Sub-question Question
Co
nta
inm
en
t
Em
pty
ing
Co
nv
ey
an
ce
Tre
atm
en
t
En
d-u
se
/dis
po
sa
l
Indicator/ Score Comments
Sustaining:
What is the status of operation and maintenance, what provisions are made for service expansion and what are current service outcomes?
7. O&M
7.1 Cost recovery:
Are O&M costs known and fully met by either cost recovery through user fees and/or local revenue or transfers?
0 0 0 0 0
1: O&M costs known and >75% met (through appropriate mechanisms)
Costs are not known – as mentioned by KIIs, a diagnosis is needed to be able to assess the viability of FSM services. The number of SWM service providers which are requesting licenses is growing, indicating that this is a profitable business (i.e. O&M costs are being covered).
0.5: O&M costs known and >50% met
0: O&M costs not known and/or <50% met
7.2 Standards: Are
there norms and standards for each part of the FSM value chain that are systematically monitored under a regime of sanctions (penalties)?
0 0 0 0 0
1: norms and standards exist, are monitored and sanctions applied
There are general norms / standards in Law 30045 for service providers and markets, but there is nothing specific for FSM. KIIs mentioned that monitoring is deficient and could be improved.
0.5: norms and standards exist and are monitored, but no sanctions applied
0: norms and standards (if they exist) are not monitored
8. Expansion
8.1 Demand: Has
government (national or city authority) developed any policies and procedures, or planned and undertaken programs to stimulate demand of FSM services and behaviours by households?
0 0
1: policies, procedures or programs are being implemented, with resulting demand for services growing and being responded to
All KIIs said that there was nothing being done on behalf on national authorities to promote demand for FSM services.
0.5: policies, procedures or programs are being implemented (or partially implemented), but resulting demand is not fully addressed
0: policies, procedures or programs are not being implemented

Fecal Sludge Management in Lima – Case Study Report
99
Sub-question Question
Co
nta
inm
en
t
Em
pty
ing
Co
nv
ey
an
ce
Tre
atm
en
t
En
d-u
se
/dis
po
sa
l
Indicator/ Score Comments
8.2 Sector development: does
the government have ongoing programs and measures to strengthen the role of service providers (private or public) in the provision of FSM services, in urban or peri-urban areas?
0 0 0 0 0
1: programs and measures to strengthen service provision have been/are being implemented; service providers are organized, their actions are coordinated and the FSM services they provide are expanding.
The majority of government stakeholders do not provide any programs to strengthen the role of service providers. Apparently, DIGESA does offer some support to service providers, mainly for capacity building, but none of the local stakeholders or NGOs were aware of this support.
0.5: programs and measures to strengthen service providers have been implemented or partially implemented; the majority of service providers remain largely disorganized and the FSM services they provide are not expanding at an appropriate rate.
0: programs and measures to strengthen the service providers do not exist (or exist on paper only and have not been implemented); the service providers remain disorganized and the FSM services they provide are not expanding.
9. Service outcomes
9.1 Public Health:
What is the magnitude of public
0.5 0 0 0 0 1: low level risk identified (compare to Excellent result from PHRA)
The practice in Lima is to dig a new pit once the one in use is filled-up. Pits are sometimes not deep enough (esp. in rocky soils in the hills) or not

Fecal Sludge Management in Lima – Case Study Report
100
Sub-question Question
Co
nta
inm
en
t
Em
pty
ing
Co
nv
ey
an
ce
Tre
atm
en
t
En
d-u
se
/dis
po
sa
l
Indicator/ Score Comments
health risk associated with the current fecal sludge flows (through the stages of the fecal sludge service chain)?
0.5: medium level risk identified (compare to Good or Bad result from PHRA)
sealed properly. TWs suggest some households dump fecal sludge along with other solid HH waste. Around 92% of the city has sewerage.
0: high level risk identified (compare to Terrible result from PHRA)
9.2 Quantity:
Percentage of total fecal sludge generated by the city that is managed effectively, within each part of the service chain
0 0 0 0 0
Identify a score for each stage of the service chain (containment / emptying / transport / treatment / disposal / end-use):
Scores are based on the SFD for lowest-income areas, as this is where the absence of FSM services is affecting effective management of FS. The practice of abandoning pits once full that has been used for many years is proving to be a hazardous and unsustainable practice.
1: >75% of fecal sludge generated is managed effectively, at that stage of the service chain
0.5: >50% of fecal sludge generated is managed effectively, at that stage of the service chain
0: <50% of fecal sludge generated is managed effectively, at that stage of the service chain
9.3 Equity: To what
extent do the city's FSM systems serve low-income communities? (Containment, Emptying and Transport services only)
1: FSM systems and services are widespread and readily available in low-income communities
THIS IS CONSIDERED AS PART OF QUESTION 5.2.
0.5: FSM systems and services are available on a partial / piecemeal basis in low-income communities (or in some)
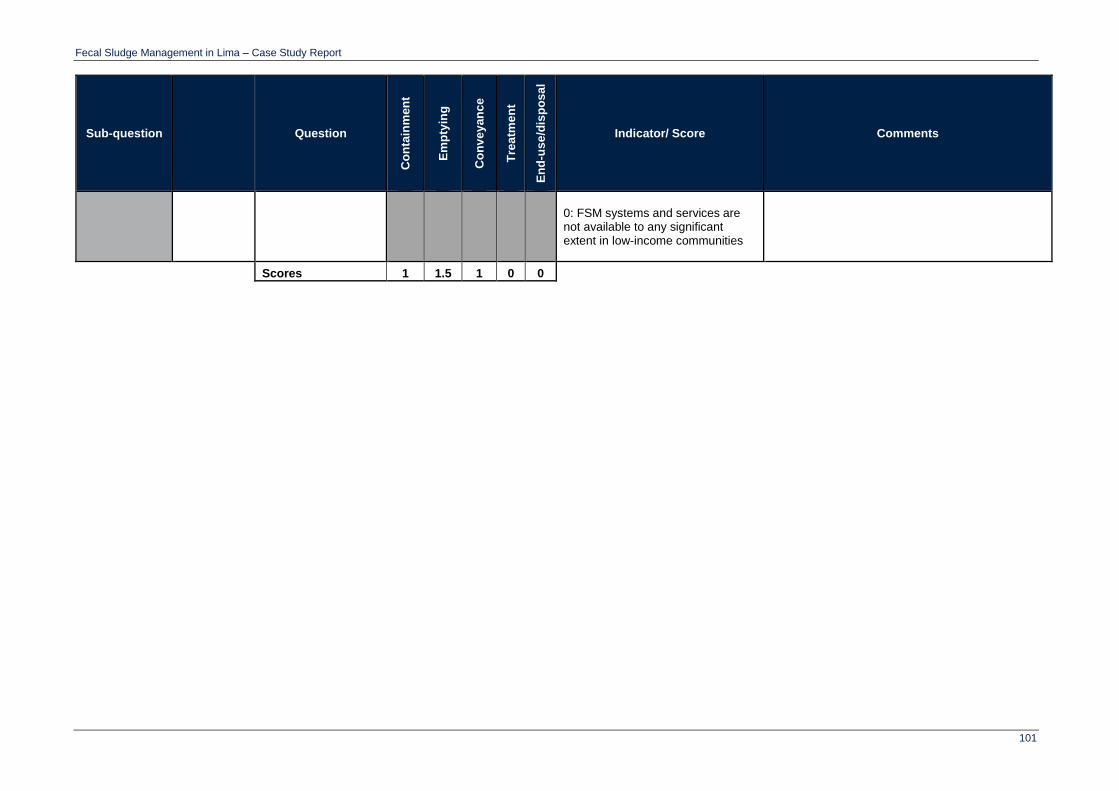
Fecal Sludge Management in Lima – Case Study Report
101
Sub-question Question
Co
nta
inm
en
t
Em
pty
ing
Co
nv
ey
an
ce
Tre
atm
en
t
En
d-u
se
/dis
po
sa
l
Indicator/ Score Comments
0: FSM systems and services are not available to any significant extent in low-income communities
Scores 1 1.5 1 0 0

Fecal Sludge Management in Lima – Case Study Report
102
Annex E Public health risk assessment: scoring used
Observations: To standardise this process, a number of pre-set questions are answered by the
observer at each stage of the process, with the observer selecting the most appropriate response
from a pre-selected list (including ‘Other’ and ‘Don’t know’ options) in each case. Each set of
responses is ranged to indicate a High / Medium and Low risk activity, with a score allocated to each
response High risk = 3, Medium risk = 2, Low risk = 1. ‘Other’ or ‘Don’t know’ responses had to be
considered separately and an appropriate score allocated depending on additional information
provided (photographs, notes, etc.).
For example, one Transport stage question was “During the transport of faecal sludge, does
sludge spill into the surrounding environment?” Response categories were: Sludge spillage
occurs along the route at various times (scores 3 = High risk); Slight sludge spillage occurs
at specific times, e.g. going down slopes or over rough ground (scores 2 = Medium risk); No
spillage occurs – equipment contains all of the sludge during transport (scores 1 = Low risk).
Tables showing the full set of observation questions and the rating values of responses are available
from the links in Annex F.
For each stage of the service chain, a collated score was put into a risk category based on scoring
ranges (again, High / Medium / Low ranges). These scoring ranges were based on experience of
approaches for assessing risk to water supplies and from sanitation facilities in other studies. In
some cases, the highest risk score would be considered as the most relevant to identify – particularly
in relation to contact between fecal sludge and drinking water supplies or human directly (through
hands, feet, etc.).
Table 35 Risk scores along the service chain
Stage of the service chain Max risk score
per stage
Score range for risk level
Low Med High
Containment 27 9-14 15-21 22-27
Emptying 9 1-4 5-7 8-9
Transportation 9 1-4 5-7 8-9
Treatment 15 1-8 9-11 12-15
Disposal 18 1-9* 10-14* 15-18*
End use 12 1-6 7-9 10-12
* Note relating to Disposal scores:
If Qn1 scores 2 or 3, and Qn2 or Qn3 score 2 or 3, this implies medium (no scores of 3) or high (one or more scores of 3) risk If Qn1 scores 2 or 3, and Qn4 and Qn5 both score 2 or 3, this implies medium (no scores of 3) or high (one or more scores of 3) risk
Using the rating and scoring process during observations of emptying practices, a summary of
identified risks is shown in Table 11. The observations follow the practice as far along the service
chain as is possible – which changes depending on the latrine type. Although the number of
observations carried out is small, these results may be taken as somewhat representative of what
emptying practices occur in Lima, given the limited extent to which this happens at all.
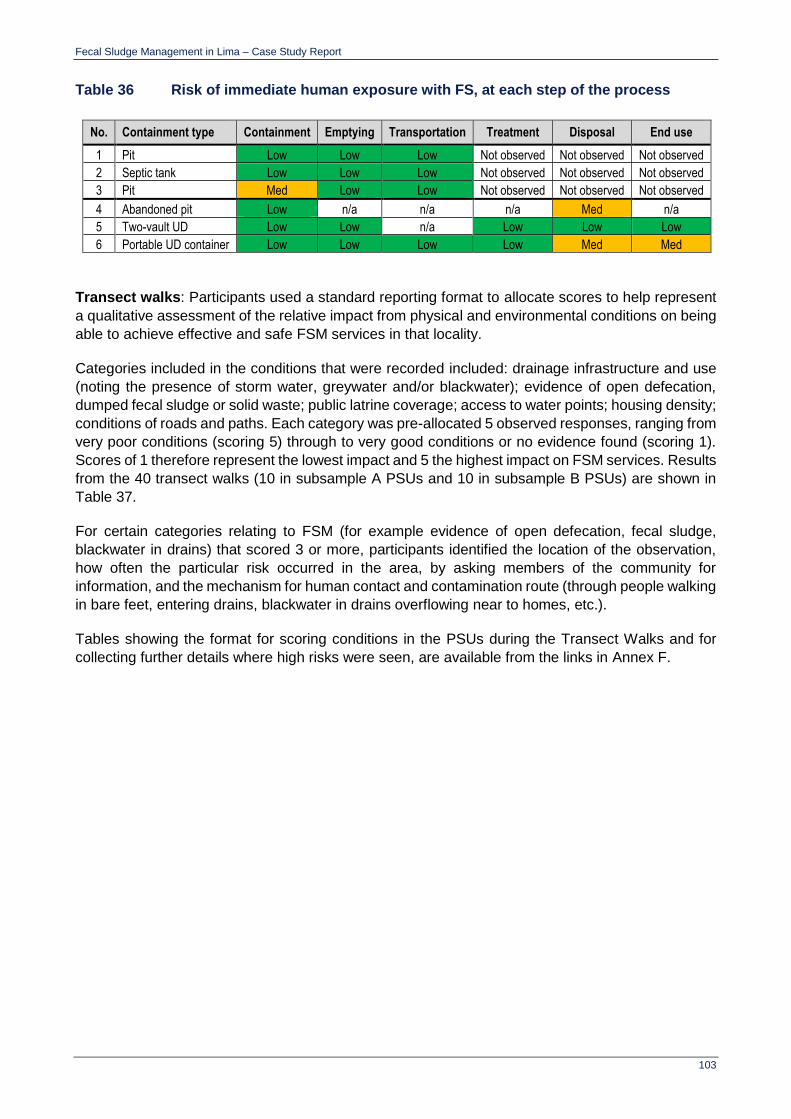
Fecal Sludge Management in Lima – Case Study Report
103
Table 36 Risk of immediate human exposure with FS, at each step of the process
No. Containment type Containment Emptying Transportation Treatment Disposal End use
1 Pit Low Low Low Not observed Not observed Not observed
2 Septic tank Low Low Low Not observed Not observed Not observed
3 Pit Med Low Low Not observed Not observed Not observed
4 Abandoned pit Low n/a n/a n/a Med n/a
5 Two-vault UD Low Low n/a Low Low Low
6 Portable UD container Low Low Low Low Med Med
Transect walks: Participants used a standard reporting format to allocate scores to help represent
a qualitative assessment of the relative impact from physical and environmental conditions on being
able to achieve effective and safe FSM services in that locality.
Categories included in the conditions that were recorded included: drainage infrastructure and use
(noting the presence of storm water, greywater and/or blackwater); evidence of open defecation,
dumped fecal sludge or solid waste; public latrine coverage; access to water points; housing density;
conditions of roads and paths. Each category was pre-allocated 5 observed responses, ranging from
very poor conditions (scoring 5) through to very good conditions or no evidence found (scoring 1).
Scores of 1 therefore represent the lowest impact and 5 the highest impact on FSM services. Results
from the 40 transect walks (10 in subsample A PSUs and 10 in subsample B PSUs) are shown in
Table 37.
For certain categories relating to FSM (for example evidence of open defecation, fecal sludge,
blackwater in drains) that scored 3 or more, participants identified the location of the observation,
how often the particular risk occurred in the area, by asking members of the community for
information, and the mechanism for human contact and contamination route (through people walking
in bare feet, entering drains, blackwater in drains overflowing near to homes, etc.).
Tables showing the format for scoring conditions in the PSUs during the Transect Walks and for
collecting further details where high risks were seen, are available from the links in Annex F.

Fecal Sludge Management in Lima – Case Study Report
104
Table 37 Transect walk – results of scored observations
PSU/Category
Drainage (storm water and greywater)
Drainage (blackwater)
Access to water points
Evidence of solid wastes in paths/roads
Evidence of human fecal materials (OD/dumped FS)
Evidence of animal fecal materials
Household latrine coverage
Public latrine coverage
Presence of wastewater and/or fecal sludge treatment facilities
Housing density
Paths Roads
SAMPLE A
PSU 2 5 5 3 4 1 3 3 1 1 2 3 2
PSU 3 4 1 3 4 1 3 4 1 1 2 4 4
PSU 4 5 5 3 4 1 4 3 1 1 3 2 2
PSU 6 5 5 2 4 1 4 4 1 1 2 2 3
PSU 7 4 5 4 3 1 1 3 3 1 3 2 2
PSU 8 4 1 3 4 1 4 3 2 1 3 4 3
PSU 11 4 1 3 3 1 4 3 1 1 2 3 2
PSU 14 4 1 3 4 1 4 4 1 1 4 4 4
PSU 16 4 1 3 4 1 4 3 1 1 2 3 2
PSU 18 4 1 3 4 1 4 3 1 1 4 2 2
PSU 19 4 1 4 4 1 5 3 1 1 2 2 2
PSU 20 4 1 3 4 3 3 4 1 1 4 4 5
PSU 22 4 1 3 4 1 3 3 1 1 2 2 3
PSU 23 4 1 3 4 4 4 3 1 1 2 3 3
PSU 24 4 4 3 3 1 4 3 1 1 1 2 2
PSU 25 4 1 3 4 1 3 3 1 1 3 3 3
PSU 26 4 1 2 4 2 5 3 2 1 2 3 3
PSU 27 5 1 3 4 1 4 3 1 1 2 3 2
PSU 28 4 1 3 3 1 1 4 4 1 3 4 4
PSU 29 4 1 3 4 2 3 3 1 1 4 4 4

Fecal Sludge Management in Lima – Case Study Report
105
PSU/Category
Drainage (storm water and greywater)
Drainage (blackwater)
Access to water points
Evidence of solid wastes in paths/roads
Evidence of human fecal materials (OD/dumped FS)
Evidence of animal fecal materials
Household latrine coverage
Public latrine coverage
Presence of wastewater and/or fecal sludge treatment facilities
Housing density
Paths Roads
PSU 30 4 1 5 4 1 1 4 1 1 5 5 5
PSU 31 5 1 3 4 1 3 3 1 1 3 3 3
PSU 32 5 5 3 4 1 4 3 1 3 4 3 4
PSU 33 4 1 4 4 1 1 4 1 1 4 4 4
PSU 35 5 1 3 4 1 3 3 1 1 4 2 3
PSU 36 4 1 3 4 1 4 3 3 1 4 2 3
PSU 37 4 1 3 5 1 5 3 1 1 4 2 2
PSU 38 4 1 3 4 1 1 3 1 4 4 2 2
PSU 39 4 1 3 3 1 4 3 3 1 4 2 2
PSU 40 4 1 3 4 1 4 3 2 1 4 2 2
SAMPLE B
PSU 1 4 1 3 4 1 1 3 3 1 3 3 2
PSU 5 5 5 4 4 1 4 3 1 1 3 2 2
PSU 9 4 1 3 4 1 4 4 3 1 3 4 2
PSU 10 4 1 3 4 1 4 4 1 1 4 3 3
PSU 12 4 1 3 3 1 1 4 1 1 5 5 5
PSU 13 4 1 3 3 1 4 3 1 1 4 3 2
PSU 15 4 1 3 4 1 5 4 1 1 4 2 4
PSU 17 5 1 3 4 1 4 3 1 1 3 2 2
PSU 21 5 5 4 4 1 4 3 1 1 3 2 2
PSU 34 4 1 3 2 1 5 4 1 1 4 2 2
Note: 5 = highest risk observed, 1 = lowest risk observed.
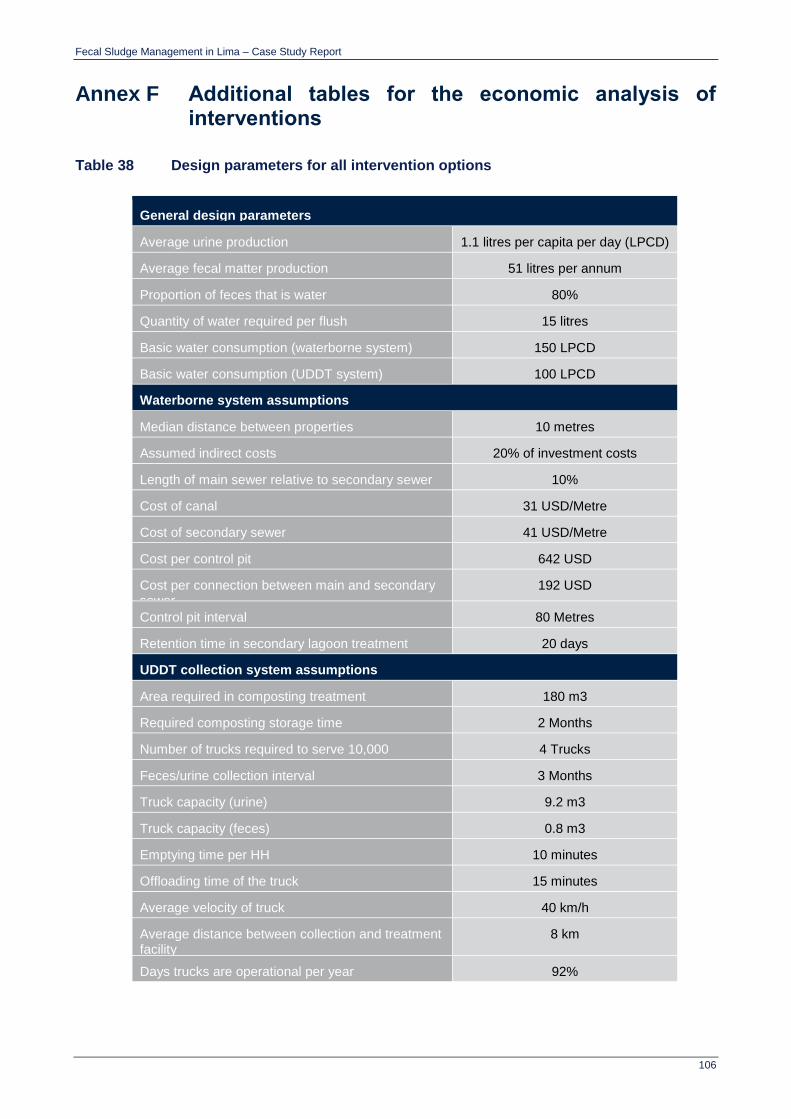
Fecal Sludge Management in Lima – Case Study Report
106
Annex F Additional tables for the economic analysis of interventions
Table 38 Design parameters for all intervention options
General design parameters
Average urine production 1.1 litres per capita per day (LPCD)
Average fecal matter production 51 litres per annum
Proportion of feces that is water 80%
Quantity of water required per flush 15 litres
Basic water consumption (waterborne system) 150 LPCD
Basic water consumption (UDDT system) 100 LPCD
Waterborne system assumptions
Median distance between properties 10 metres
Assumed indirect costs 20% of investment costs
Length of main sewer relative to secondary sewer 10%
Cost of canal 31 USD/Metre
Cost of secondary sewer 41 USD/Metre
Cost per control pit 642 USD
Cost per connection between main and secondary sewer
192 USD
Control pit interval 80 Metres
Retention time in secondary lagoon treatment 20 days
UDDT collection system assumptions
Area required in composting treatment 180 m3
Required composting storage time 2 Months
Number of trucks required to serve 10,000 4 Trucks
Feces/urine collection interval 3 Months
Truck capacity (urine) 9.2 m3
Truck capacity (feces) 0.8 m3
Emptying time per HH 10 minutes
Offloading time of the truck 15 minutes
Average velocity of truck 40 km/h
Average distance between collection and treatment facility
8 km
Days trucks are operational per year 92%
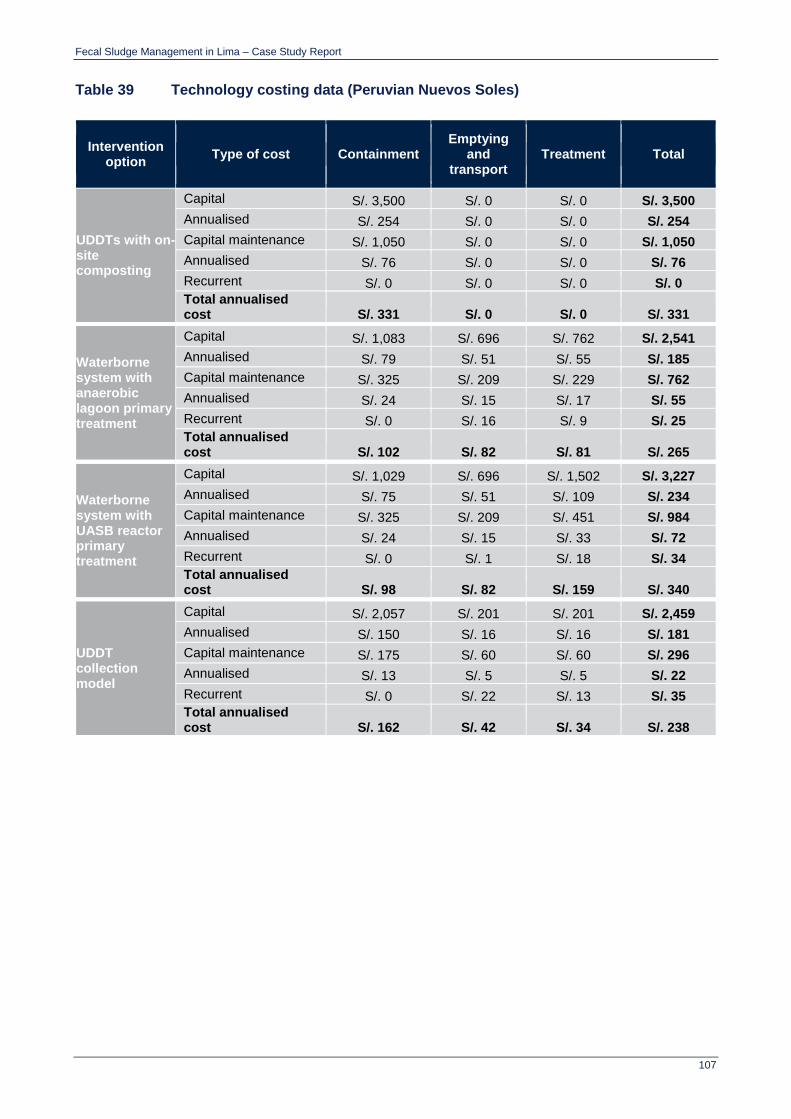
Fecal Sludge Management in Lima – Case Study Report
107
Table 39 Technology costing data (Peruvian Nuevos Soles)
Intervention option
Type of cost Containment Emptying
and transport
Treatment Total
UDDTs with on-site composting
Capital S/. 3,500 S/. 0 S/. 0 S/. 3,500
Annualised S/. 254 S/. 0 S/. 0 S/. 254
Capital maintenance S/. 1,050 S/. 0 S/. 0 S/. 1,050
Annualised S/. 76 S/. 0 S/. 0 S/. 76
Recurrent S/. 0 S/. 0 S/. 0 S/. 0
Total annualised cost S/. 331 S/. 0 S/. 0 S/. 331
Waterborne system with anaerobic lagoon primary treatment
Capital S/. 1,083 S/. 696 S/. 762 S/. 2,541
Annualised S/. 79 S/. 51 S/. 55 S/. 185
Capital maintenance S/. 325 S/. 209 S/. 229 S/. 762
Annualised S/. 24 S/. 15 S/. 17 S/. 55
Recurrent S/. 0 S/. 16 S/. 9 S/. 25
Total annualised cost S/. 102 S/. 82 S/. 81 S/. 265
Waterborne system with UASB reactor primary treatment
Capital S/. 1,029 S/. 696 S/. 1,502 S/. 3,227
Annualised S/. 75 S/. 51 S/. 109 S/. 234
Capital maintenance S/. 325 S/. 209 S/. 451 S/. 984
Annualised S/. 24 S/. 15 S/. 33 S/. 72
Recurrent S/. 0 S/. 1 S/. 18 S/. 34
Total annualised cost S/. 98 S/. 82 S/. 159 S/. 340
UDDT collection model
Capital S/. 2,057 S/. 201 S/. 201 S/. 2,459
Annualised S/. 150 S/. 16 S/. 16 S/. 181
Capital maintenance S/. 175 S/. 60 S/. 60 S/. 296
Annualised S/. 13 S/. 5 S/. 5 S/. 22
Recurrent S/. 0 S/. 22 S/. 13 S/. 35
Total annualised cost S/. 162 S/. 42 S/. 34 S/. 238
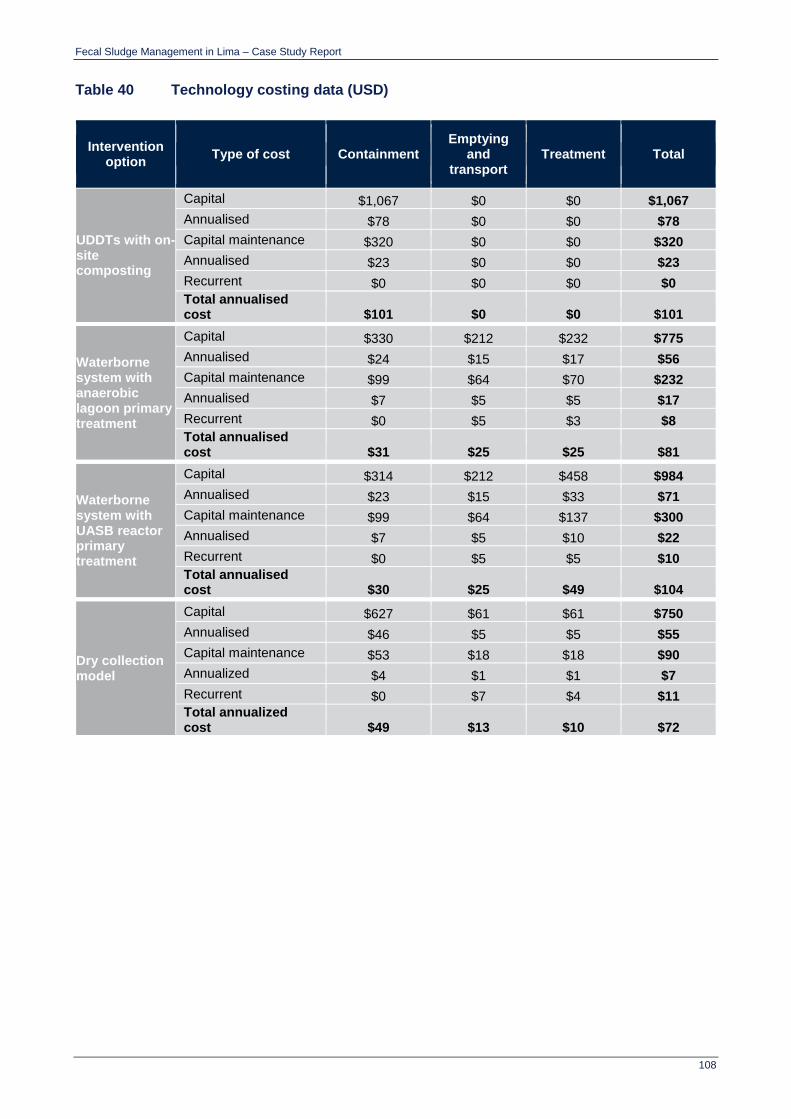
Fecal Sludge Management in Lima – Case Study Report
108
Table 40 Technology costing data (USD)
Intervention option
Type of cost Containment Emptying
and transport
Treatment Total
UDDTs with on-site composting
Capital $1,067 $0 $0 $1,067
Annualised $78 $0 $0 $78
Capital maintenance $320 $0 $0 $320
Annualised $23 $0 $0 $23
Recurrent $0 $0 $0 $0
Total annualised cost $101 $0 $0 $101
Waterborne system with anaerobic lagoon primary treatment
Capital $330 $212 $232 $775
Annualised $24 $15 $17 $56
Capital maintenance $99 $64 $70 $232
Annualised $7 $5 $5 $17
Recurrent $0 $5 $3 $8
Total annualised cost $31 $25 $25 $81
Waterborne system with UASB reactor primary treatment
Capital $314 $212 $458 $984
Annualised $23 $15 $33 $71
Capital maintenance $99 $64 $137 $300
Annualised $7 $5 $10 $22
Recurrent $0 $5 $5 $10
Total annualised cost $30 $25 $49 $104
Dry collection model
Capital $627 $61 $61 $750
Annualised $46 $5 $5 $55
Capital maintenance $53 $18 $18 $90
Annualized $4 $1 $1 $7
Recurrent $0 $7 $4 $11
Total annualized cost $49 $13 $10 $72

Fecal Sludge Management: Diagnostics
for Service Delivery in Urban Areas
Case study in Santa Cruz, Bolivia
Supporting document Final April 2016

Fecal Sludge Management in Santa Cruz, Bolivia – Case Study Report
© Oxford Policy Management i
Acknowledgements
This report is a city case study of a World Bank Economic and Sector Work on Fecal Sludge
Management: Diagnostics for Service Delivery in Urban Areas (P146128). The Task Team Leaders
were Isabel Blackett and Peter Hawkins. Other World Bank team members included Zael Sanz,
Ravikumar Joseph, Chris Heymans and Guy Hutton.
This report is based on work conducted between January 2014 and February 2015 by Oxford Policy
Management (OPM) in partnership with the Water, Engineering and Development Centre (WEDC)
at Loughborough University. The core research team was Ian Ross (OPM), Rebecca Scott (WEDC),
Ana Mujica (OPM) and Mike Smith (WEDC). The broader team included Zach White, Rashid Zaman
and Simon Brook from OPM, as well as Andy Cotton and Sam Kayaga from WEDC. Andy Peal
(Independent Consultant) also contributed to certain aspects of the methodology.
Key inputs in terms of data collection for the Santa Cruz study were also made by SNV Bolivia under
the leadership of Gonzalo Ameller. In addition, Humberto Cáceres (World Bank consultant)
interviewed key informants and made an initial assessment of the political, social and economic
situation of the city.

Fecal Sludge Management in Santa Cruz, Bolivia – Case Study Report
© Oxford Policy Management ii
Table of contents
Acknowledgements i
List of tables and figures iii
List of abbreviations v
1 Introduction and research framework 1
1.1 About this report 1
1.2 Study rationale and objectives 1
1.3 Research framework 2
2 Background to Santa Cruz city 3
2.1 Santa Cruz overview 3
2.2 Santa Cruz sanitation context 4
2.3 FSM in Santa Cruz 6
3 Fecal waste flow diagrams 8
3.1 Introduction 8
3.2 Methodology 9
3.3 Results 12
3.3.1 Census and household survey results as an input to the SFD 12 3.3.2 Presentation of SFDs 15
3.4 Implications of the SFDs for FSM in Santa Cruz 17
4 FSM services: Potential Demand and Supply Management 18
4.1 Introduction 18
4.2 Methodology 18
4.2.1 Demand 19 4.2.2 Supply 20
4.3 Findings: household demand for services 21
4.3.1 Determinants of household demand 21
4.4 Findings: supply of FSM services 25
4.4.1 Services effectively supplied 25 4.4.2 Service provider capacity 27
5 City Service Delivery Assessment 30
5.1 Introduction 30
5.2 Methodology 30
5.3 Findings 33
5.3.1 Enabling 33 5.3.2 Developing 34 5.3.3 Sustaining 34 5.3.4 Implications of the CSDA scorecard 35
6 Prognosis for Change 37
6.1 Introduction 37
6.2 Methodology 38
6.3 Findings 38
6.3.1 Santa Cruz’ FSM context 39 6.3.2 Mapping institutional responsibilities 39 6.3.3 Influence and interests of stakeholders 44 6.3.4 Illustrating the incentive problem 45
Fecal Sludge Management in Santa Cruz, Bolivia – Case Study Report
© Oxford Policy Management iii
6.3.5 Implications for FSM in Santa Cruz 47
7 Conclusions and recommendations 49
References 50
Annex A Methodology 52
A.1 Overall design 52 A.2 Sampling 53 A.2.1 Household survey 53 A.2.2 Other instruments 54 A.3 Fieldwork implementation 54 A.4 Limitations 55
Annex B Fecal waste flow matrices 56
Annex C CSDA scoring table criteria 59
List of tables and figures
Figure 1 Service areas of the cooperatives operating in Santa Cruz ............................................ 4 Figure 2 Sanitation coverage by wealth quintiles in Santa Cruz ................................................... 5 Figure 3 The sanitation service chain .......................................................................................... 6 Figure 5 Definitions of sanitation facilities and containment ....................................................... 13 Figure 6 Faecal Waste Flow Diagram for Santa Cruz ................................................................ 16 Figure 7 Faecal Waste Flow Diagram for Santa Cruz – ............................................................. 17 Figure 8 Elements of FS emptying services that could be improved – non-sewered areas ........ 27 Figure 9 CSDA scorecard for Santa Cruz .................................................................................. 32 Figure 10 Key concepts in PFC assessment............................................................................... 38 Figure 11 Stakeholder matrix for creating a FSM services call centre ......................................... 44 Figure 12 Process mapping for a septic tank filling up ................................................................ 47
Table 1 Drinking water coverage by municipalities in Santa Cruz ............................................... 4 Table 2 Sanitation coverage by municipalities in Santa Cruz ...................................................... 5 Table 3 Roles assigned to key FSM stakeholders ...................................................................... 6 Table 4 Fecal Waste Flow Matrix template ............................................................................... 11 Table 5 Type of sanitation facility / containment ....................................................................... 13 Table 6 Type of sanitation facility use by JMP category – non-sewered areas ......................... 14 Table 7 Management of blackwater – non-sewered areas ........................................................ 15 Table 8 Action after pit or tank filled up – non-sewered areas ................................................... 15 Table 9 Physical determinants of demand for FSM services..................................................... 19 Table 10 Economic determinants of demand for FSM services .................................................. 20 Table 11 Type of residence occupied and ownership status – non-sewered areas ..................... 21 Table 12 Access point for emptying equipment – non-sewered areas ........................................ 21 Table 13 Average estimated volume for soakaways and septic tanks – non-sewered areas ...... 22 Table 14 Average time taken for soakaways and septic tanks to fill up – non-sewered areas .... 23 Table 15 Number of people using the same sanitation facility by type – non-sewered areas ...... 23 Table 16 Costs of different sanitation facilities ............................................................................ 24 Table 17 Willingness to pay for emptying services – non-sewered areas ................................... 25 Table 18 Type of service provider – non-sewered areas ............................................................ 26 Table 19 Discharge point of pit/tank contents after emptying – non-sewered areas .................... 26 Table 20 Type of service and cost – non-sewered areas ............................................................ 26 Table 21 Capacity of ERTLs operating in Santa Cruz, 2013 ....................................................... 28 Table 22 Number of discharges and FS volume transported by ERTLs, 2011-2013 ................... 29 Table 23 CSDA framework for FSM ........................................................................................... 30 Table 24 Example of an CSDA question, criteria and scoring ..................................................... 31 Table 25 Institutional responsibility mapping for FSM ................................................................. 41
Fecal Sludge Management in Santa Cruz, Bolivia – Case Study Report
© Oxford Policy Management iv
Table 26 Summary table of data collection instruments .............................................................. 52 Table 27 Fecal waste flow matrix – city-wide sample (based on primary & secondary data) ...... 56 Table 28 Fecal waste flow matrix – non-sewered sample ........................................................... 57

Fecal Sludge Management in Santa Cruz, Bolivia – Case Study Report
© Oxford Policy Management v
List of abbreviations
AAPS Autoridad de Fiscalización y Control Social de Agua Potable y Saneamiento
Básico
ATP Ability to Pay
CSDA City Service Delivery Assessment
EPSA Empresa Prestadora de Servicios de Agua Potable y Alcantarillado
ERTL Empresa de Recolección y Transporte de Lodos
ESI Economics of Sanitation Initiative
FGD Focus Group Discussion
FS Fecal Sludge
FSM Fecal Sludge Management
FWFD Fecal Waste Flow Diagram
JMP WHO / UNICEF Joint Monitoring Programme
KII Key Informant Interview
NGO Non-Governmental Organisation
OD Open Defecation
ODI Overseas Development Institute
OPM Oxford Policy Management
OSS On-site Sanitation
O&M Operation and maintenance
PCA Principal Component Analysis
PFC Prognosis for Change
PHRA Public Health Risk Assessment
PSU Primary Sampling Unit
RF Research Framework
SAGUAPAC Servicio de Agua Potable y Alcantarillado de Santa Cruz
SFD Shit-Flow Diagram
SNI Servicio Nacional de Impuestos
SSU Secondary Sampling Unit
TOR Terms of Reference
UNICEF United Nations Children’s Fund
WB World Bank
WEDC Water, Engineering and Development Centre, Loughborough University
WHO World Health Organisation
WSP Water and Sanitation Programme
WSS Water Supply and Sanitation
WTP Willingness to Pay

Fecal Sludge Management in Santa Cruz, Bolivia – Case Study Report
© Oxford Policy Management 1
1 Introduction and research framework
1.1 About this report
This report summarises the main findings of a case study on fecal sludge management in Santa
Cruz, Bolivia. It is part of ‘Fecal Sludge Management: Diagnostics for Service Delivery in Poor Urban
Areas’, hereafter “the FSM research project”. This work is funded by the World Bank Water and
Sanitation Programme (WSP). There are five city case studies as part of this project (Balikpapan,
Dhaka, Hawassa, Lima and Santa Cruz). The overall objective of this assignment is to “work with
the WSP urban sanitation team to develop the methodology, design and survey instruments,
undertake analysis of data collected from five field case studies (linked to World Bank operations
projects), refine the diagnostic tools, and develop decision-making tools and guidelines for the
development of improved FSM services.” Specific objectives of the Santa Cruz case study are listed
in the next section.
This document is part of a project deliverable designed to be internal at this stage. Therefore, it does
not contain much background information, and the assumed audience is the WSP project team and
other stakeholders familiar with the Santa Cruz FSM context.
The report’s structure is detailed below. It begins with a background to the research and the city,
moving into several sections analysing the urban sanitation context, which are not specific to FSM.
Thereafter, the report’s focus is FSM services in particular.
1.2 Study rationale and objectives
It is very common for poor people living in urban areas of most low-income countries to either use
on-site sanitation facilities or defecate in the open. Even when improved on-site options are used to
contain feces, there generally exist few services for collection, transport and disposal or treatment
of the resulting fecal sludge. Fewer opportunities for resource recovery through end-use of fecal
sludge exist. The service delivery gaps within and between stages of the sanitation service chain
become more apparent as sanitation coverage increases in poor urban areas. Failure to ensure
strong links throughout the fecal sludge management (FSM) service chain results in untreated fecal
sludge (FS) contaminating the environment, with serious implications for human health.
Despite increasing demands for FSM services, there are few tools and guidelines to help city
planners navigate complex FSM situations. This study aims to build on existing frameworks and
tools, in particular the City Service Delivery Assessment (CSDA) scorecard and the Fecal Waste
Flow Diagram (FWFD). The aim is to produce diagnostic and decision-making tools that are based
in tried-and-tested strategic planning approaches and frameworks, with a focus on practicality.
Critically, updates to the tools and guidelines will be based on primary data collection in five cities.
In most of the cities, this is supported by interaction with city stakeholders involved in ongoing World
Bank lending. Acknowledging the difficulty of reforming FSM services in cities, political economy
questions around FSM are explicitly included as part of the overall analysis.
The specific objectives of the study are:
To provide quantitative and qualitative data on the sanitation situation in Santa Cruz from a
socio-economic perspective, specifically as it relates to FSM;
To do the above in such a way that the data is representative of non-sewered areas of Santa
Cruz, which are also the lowest-income sectors of the city; and
Fecal Sludge Management in Santa Cruz, Bolivia – Case Study Report
© Oxford Policy Management 2
To inform the development of analytical tools and guidelines, by “road-testing” draft tools
using primary data collection.
The study was therefore primarily socio-economic rather than technical. It did not aim to carry out
technical inspections of infrastructure or produce detailed maps with neighbourhood-level analysis
and recommendations. For those who have previously worked in the sanitation sector in Santa Cruz,
there may be few surprises, but the report does offer representative data to back-up what has
previously been reported in smaller or more general studies.
1.3 Research framework
During the inception stage, the OPM/WEDC team developed a Research Framework (RF), based
on the overarching research questions implicit in the TOR and draft research protocol. From these
questions, a logical set of project components was developed. These became the basis for the
design of data collection instruments that would enable information to be collected for the indicators
making up each component.
The approach is to place all components – as well as ensuing results – of the study within the context
of the FSM service chain, to optimise its relevance and effectiveness. The Tools and Guidelines
document provides the data and analytical framework used to produce the outputs, and how to apply
them.
This report is sub-divided into three groups of chapters. The initial chapter describes the city
background and there are three chapters which cover the urban sanitation context without a specific
focus on FSM. The rest of the report considers FSM services and service delivery.
Background
Section 2 provides a background to the city
Urban sanitation context
Section 0 describes the Fecal Waste Flow Diagrams
Analysis of FSM services
Section 4 assesses the demand and supply for FSM services
Section 5 contains a City Service Delivery Assessment
Section 6 provides a Prognosis for Change based on the current situation
Section 7 concludes
Annexes
Annex A summarises the study methodology
Annex B contains the detailed Fecal Waste Flow matrices
Annex C provides the full CSDA scoring table
Fecal Sludge Management in Santa Cruz, Bolivia – Case Study Report
© Oxford Policy Management 3
2 Background to Santa Cruz city
2.1 Santa Cruz overview
The Santa Cruz Metropolitan Area (referred to Santa Cruz hereinafter) is the second largest urban
area in Bolivia, encompassing six municipalities (Santa Cruz de la Sierra, Cotoca, Porongo, La
Guardia, El Torno and Warnes) and having around 1.9 million inhabitants. Santa Cruz is located in
eastern Bolivia at an altitude of 416 m above sea level, experiencing a subtropical climate with an
average humidity of 68% and an annual average temperature of 25°C. Maximum temperatures of
up to 38°C can be reached in the summer months (December to March), while minimum
temperatures of around 6°C can be experienced in the winter months (June to August) (Cáceres
Magnus, 2015; WSP, 2010).
As a major economic centre in Bolivia, Santa Cruz has faced high population growth since the 1980s,
mainly driven by rural-urban migration, with growth averaging around 5% between 1996 and 2001
and 4% between 2001 and 2012 (Caceres Magnus, 2015; Rivera, 2010). Most of these new urban
inhabitants have settled in the suburbs or peri-urban areas of the city, where growth has been
reported to almost double that observed in the “core” area – population growth in peri-urban areas
of Santa Cruz was estimated at 7% between 1992 and 2012 (WSP, 2016).
As has been observed in other Latin American countries, urbanisation trends have not been coupled
with equal access to basic services, mainly electricity, water and sanitation. For the country as a
whole, access to piped water on premises in urban areas increased from 80 to 96% between 1990
and 2015. However, access to improved sanitation (excluding shared facilities) was just 61% by
2015, with 4% of urban dwellers still practising open defecation (WHO/UNICEF JMP, 2015).
Moreover, 2013 estimates suggest that only 30% of all urban wastewater in Bolivia is effectively
treated, with only 74% of municipalities across the country having a wastewater treatment plant
(WSP, 2016).
Water supply and sewerage services in Santa Cruz are provided by 10 different cooperatives, as
shown in Figure 1 below. Altogether they provide drinkable water to over 96% of the population (both
piped into premises and through public taps). SAGUAPAC (Cooperativa de Servicios Públicos de
Santa Cruz Ltda.) is the main and largest service provider.
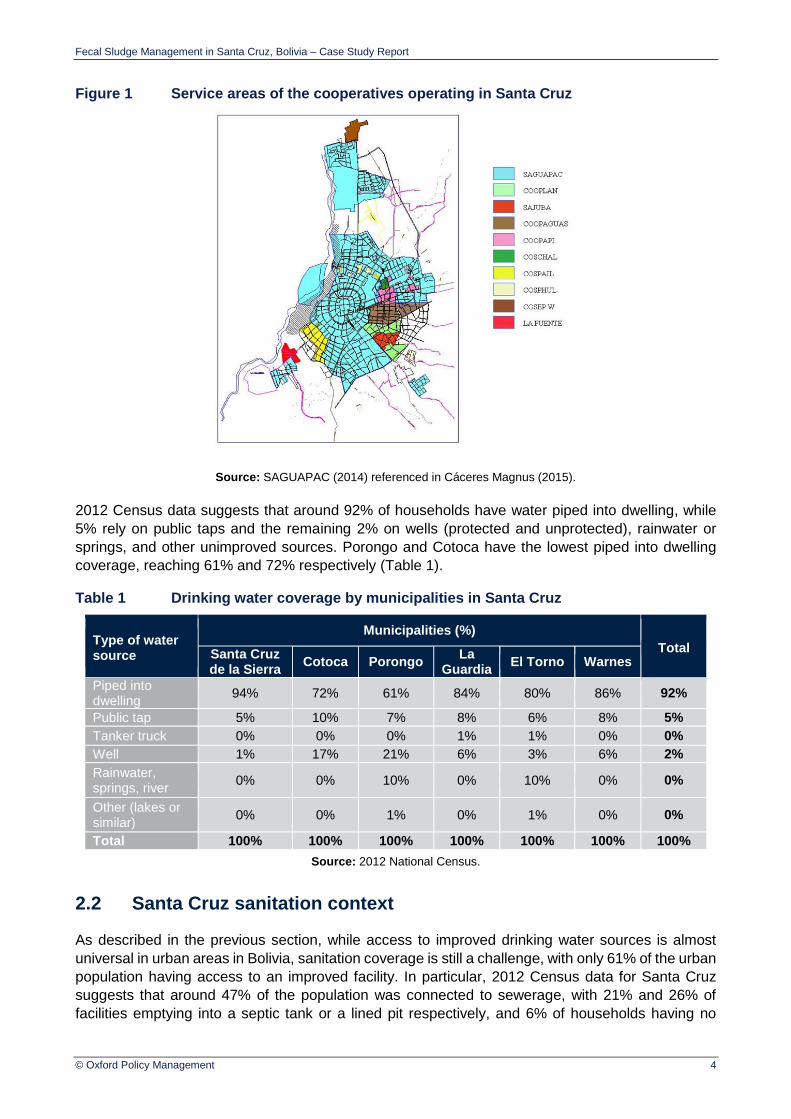
Fecal Sludge Management in Santa Cruz, Bolivia – Case Study Report
© Oxford Policy Management 4
Figure 1 Service areas of the cooperatives operating in Santa Cruz
Source: SAGUAPAC (2014) referenced in Cáceres Magnus (2015).
2012 Census data suggests that around 92% of households have water piped into dwelling, while
5% rely on public taps and the remaining 2% on wells (protected and unprotected), rainwater or
springs, and other unimproved sources. Porongo and Cotoca have the lowest piped into dwelling
coverage, reaching 61% and 72% respectively (Table 1).
Table 1 Drinking water coverage by municipalities in Santa Cruz
Type of water source
Municipalities (%)
Total Santa Cruz de la Sierra
Cotoca Porongo La
Guardia El Torno Warnes
Piped into dwelling
94% 72% 61% 84% 80% 86% 92%
Public tap 5% 10% 7% 8% 6% 8% 5%
Tanker truck 0% 0% 0% 1% 1% 0% 0%
Well 1% 17% 21% 6% 3% 6% 2%
Rainwater, springs, river
0% 0% 10% 0% 10% 0% 0%
Other (lakes or similar)
0% 0% 1% 0% 1% 0% 0%
Total 100% 100% 100% 100% 100% 100% 100%
Source: 2012 National Census.
2.2 Santa Cruz sanitation context
As described in the previous section, while access to improved drinking water sources is almost
universal in urban areas in Bolivia, sanitation coverage is still a challenge, with only 61% of the urban
population having access to an improved facility. In particular, 2012 Census data for Santa Cruz
suggests that around 47% of the population was connected to sewerage, with 21% and 26% of
facilities emptying into a septic tank or a lined pit respectively, and 6% of households having no
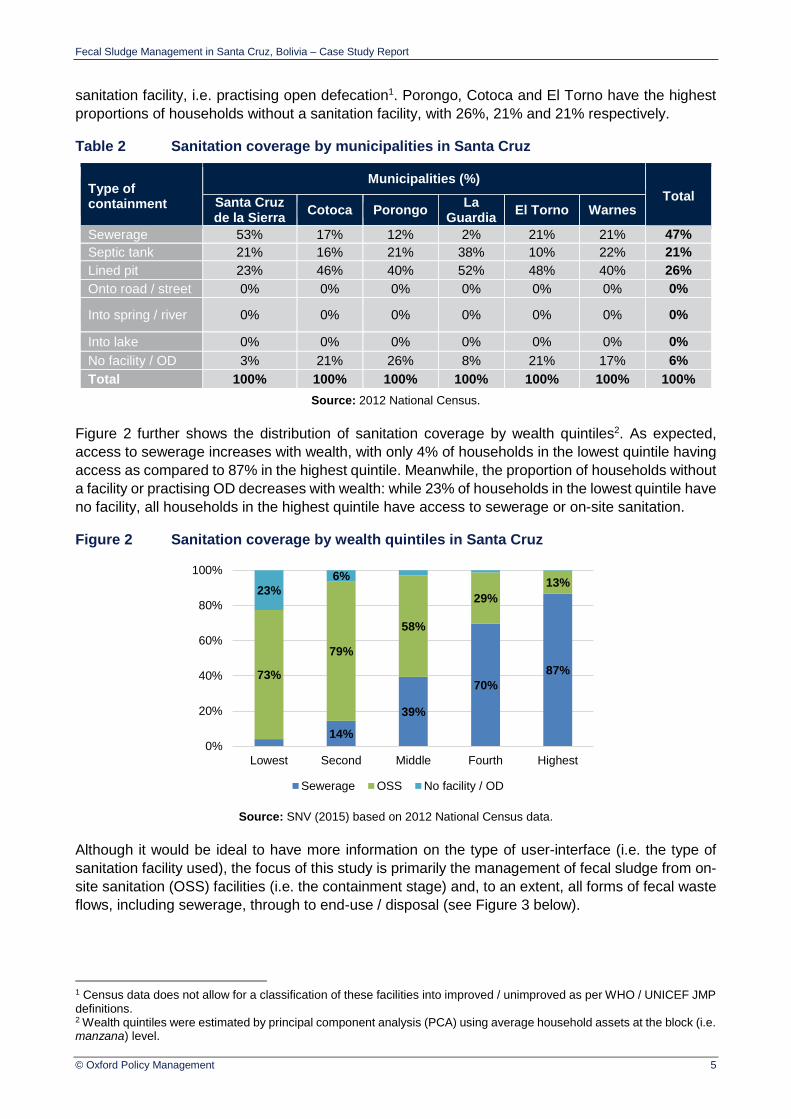
Fecal Sludge Management in Santa Cruz, Bolivia – Case Study Report
© Oxford Policy Management 5
sanitation facility, i.e. practising open defecation1. Porongo, Cotoca and El Torno have the highest
proportions of households without a sanitation facility, with 26%, 21% and 21% respectively.
Table 2 Sanitation coverage by municipalities in Santa Cruz
Type of containment
Municipalities (%)
Total Santa Cruz de la Sierra
Cotoca Porongo La
Guardia El Torno Warnes
Sewerage 53% 17% 12% 2% 21% 21% 47%
Septic tank 21% 16% 21% 38% 10% 22% 21%
Lined pit 23% 46% 40% 52% 48% 40% 26%
Onto road / street 0% 0% 0% 0% 0% 0% 0%
Into spring / river 0% 0% 0% 0% 0% 0% 0%
Into lake 0% 0% 0% 0% 0% 0% 0%
No facility / OD 3% 21% 26% 8% 21% 17% 6%
Total 100% 100% 100% 100% 100% 100% 100%
Source: 2012 National Census.
Figure 2 further shows the distribution of sanitation coverage by wealth quintiles2. As expected,
access to sewerage increases with wealth, with only 4% of households in the lowest quintile having
access as compared to 87% in the highest quintile. Meanwhile, the proportion of households without
a facility or practising OD decreases with wealth: while 23% of households in the lowest quintile have
no facility, all households in the highest quintile have access to sewerage or on-site sanitation.
Figure 2 Sanitation coverage by wealth quintiles in Santa Cruz
Source: SNV (2015) based on 2012 National Census data.
Although it would be ideal to have more information on the type of user-interface (i.e. the type of
sanitation facility used), the focus of this study is primarily the management of fecal sludge from on-
site sanitation (OSS) facilities (i.e. the containment stage) and, to an extent, all forms of fecal waste
flows, including sewerage, through to end-use / disposal (see Figure 3 below).
1 Census data does not allow for a classification of these facilities into improved / unimproved as per WHO / UNICEF JMP definitions. 2 Wealth quintiles were estimated by principal component analysis (PCA) using average household assets at the block (i.e. manzana) level.
14%
39%
70%
87%73%
79%
58%
29%
13%23%
6%
0%
20%
40%
60%
80%
100%
Lowest Second Middle Fourth Highest
Sewerage OSS No facility / OD
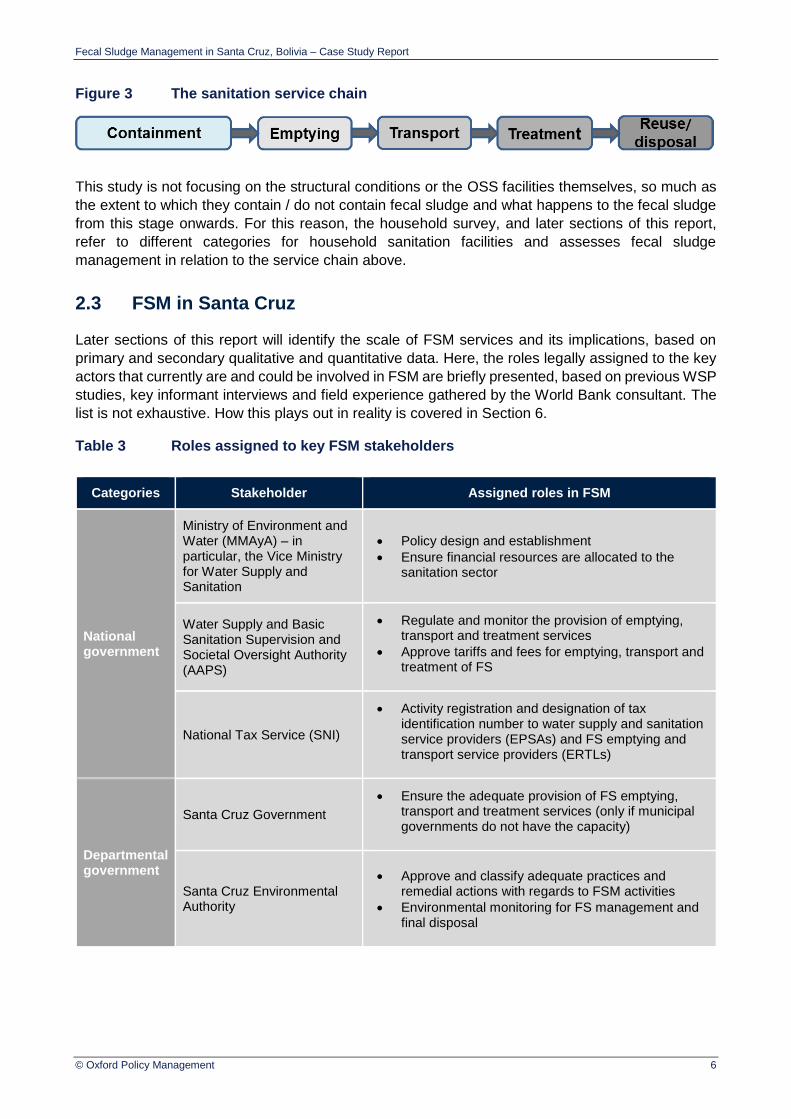
Fecal Sludge Management in Santa Cruz, Bolivia – Case Study Report
© Oxford Policy Management 6
Figure 3 The sanitation service chain
This study is not focusing on the structural conditions or the OSS facilities themselves, so much as
the extent to which they contain / do not contain fecal sludge and what happens to the fecal sludge
from this stage onwards. For this reason, the household survey, and later sections of this report,
refer to different categories for household sanitation facilities and assesses fecal sludge
management in relation to the service chain above.
2.3 FSM in Santa Cruz
Later sections of this report will identify the scale of FSM services and its implications, based on
primary and secondary qualitative and quantitative data. Here, the roles legally assigned to the key
actors that currently are and could be involved in FSM are briefly presented, based on previous WSP
studies, key informant interviews and field experience gathered by the World Bank consultant. The
list is not exhaustive. How this plays out in reality is covered in Section 6.
Table 3 Roles assigned to key FSM stakeholders
Categories Stakeholder Assigned roles in FSM
National government
Ministry of Environment and Water (MMAyA) – in particular, the Vice Ministry for Water Supply and Sanitation
Policy design and establishment
Ensure financial resources are allocated to the sanitation sector
Water Supply and Basic Sanitation Supervision and Societal Oversight Authority (AAPS)
Regulate and monitor the provision of emptying, transport and treatment services
Approve tariffs and fees for emptying, transport and treatment of FS
National Tax Service (SNI)
Activity registration and designation of tax identification number to water supply and sanitation service providers (EPSAs) and FS emptying and transport service providers (ERTLs)
Departmental government
Santa Cruz Government
Ensure the adequate provision of FS emptying, transport and treatment services (only if municipal governments do not have the capacity)
Santa Cruz Environmental Authority
Approve and classify adequate practices and remedial actions with regards to FSM activities
Environmental monitoring for FS management and final disposal

Fecal Sludge Management in Santa Cruz, Bolivia – Case Study Report
© Oxford Policy Management 7
Municipal government
Municipal Governments
Ensure the adequate provision of FS emptying, transport and treatment services, directly or through public, communal or mixed service providers or cooperatives
Establish the fees for FS emptying, transport and treatment (if services are directly provided)
Grant operative licenses to ERTLs
Water supply and sanitation service providers (EPSAs)
Provide FS emptying, transport and treatment services directly or through a third party (when this responsibility is delegated by municipal governments)
Estimate and propose fees (to be considered by the AAPS) for FS emptying, transport and treatment services
FS emptying and transport service providers (ERTLs)
Supply and provide FS emptying and transport services
Private sector
Households Ensure adequate FS containment, and demand and
use FS emptying and transport services
Commercial establishments Ensure adequate FS containment, and demand and
use FS emptying and transport services
Industry and oil businesses Ensure adequate FS containment, and demand and
use FS emptying and transport services
Source: Cáceres Magnus (2012).

Fecal Sludge Management in Santa Cruz, Bolivia – Case Study Report
© Oxford Policy Management 8
3 Fecal waste flow diagrams
3.1 Introduction
Fecal Waste Flow Diagrams (also known as ‘shit flow’ diagrams or SFDs) are an innovation arising
from WSP’s 12-city study of FSM (Peal & Evans, 2013). In short, an SFD is a visualisation of how
fecal waste (fecal sludge or wastewater) flows along the sanitation service chain. At each stage of
the chain, the proportion of fecal waste that is or is not effectively managed to the next stage of the
chain is indicated.3
This means that where fecal waste is deemed to be:
Effectively managed from one stage of the chain to the next (for example, where wastewater
from cistern flush toilets is effectively transported through sewers to a designated treatment
site, or fecal sludge is transported by a tanker to a designated disposal site), the SFD shows
the flow of fecal waste continuing along the chain – and the arrow representing that flow of
fecal waste to the next stage remains green;
Not effectively managed from one stage of the chain to the next (for example, where
wastewater leaks from sewers before reaching a designated treatment site, or fecal sludge
is dumped into the environment or drainage channels), then the SFD shows the fecal waste
“dropping out” of the service chain – and the arrow representing that flow of fecal waste turns
brown.
The proportion of fecal waste that is effectively managed all the way to the end of the service chain
is indicated as “safely managed”, with the remaining proportion that has dropped-out of the chain
deemed “unsafely managed”. The primary destination of that “unsafe” fecal waste is indicated (e.g.
receiving waters, general environment, drains, etc.).4 Thus far, SFDs in different cities have been
undertaken using different methodologies, as is often necessary in the context of poor data
availability. Furthermore, most SFDs so far (including those in the 12-city study) were undertaken
using secondary data and expert estimates. This study is amongst the first to use primary household
survey data and field-based observations to construct SFDs. A group of urban sanitation experts is
currently discussing the ‘roll-out’ of the use of SFDs, for which other methodologies will be
developed.5
For this study, SFDs are being developed which are indicative of (i) the city-wide situation, and (ii)
the situation in low-income settlements (see Annex A for more information). For Santa Cruz, the
former is based on both primary and secondary data, whereas the latter is based solely on primary
data collection in non-sewered areas (which are generally low-income areas), as part of sub-sample
A.
3 Previous iterations of SFDs distinguished between safe and unsafe practices, but here we refer to effective / ineffective management. This progression has been made because it is difficult be sure of the safety of the process, but if the fecal waste is managed to the next stage of the sanitation service chain, we can say it is considered an effective process. 4 It is acknowledged that FS may pass from irrigation channels into other water bodies, e.g. rivers, but the diagram focuses on the primary destination. It was beyond the scope of this study to be able to track the pathways of sludge beyond the household, e.g. which canals did it pass through and where was its eventual destination. 5 See website for the SFD promotion initiative here.
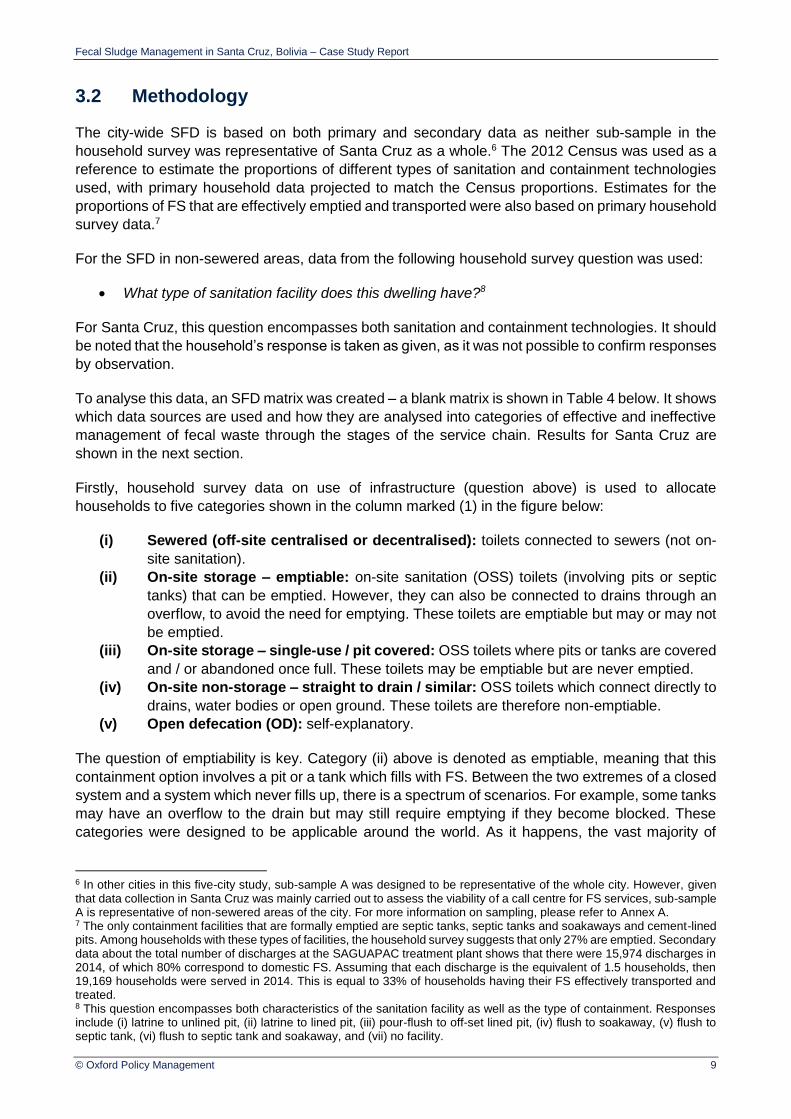
Fecal Sludge Management in Santa Cruz, Bolivia – Case Study Report
© Oxford Policy Management 9
3.2 Methodology
The city-wide SFD is based on both primary and secondary data as neither sub-sample in the
household survey was representative of Santa Cruz as a whole.6 The 2012 Census was used as a
reference to estimate the proportions of different types of sanitation and containment technologies
used, with primary household data projected to match the Census proportions. Estimates for the
proportions of FS that are effectively emptied and transported were also based on primary household
survey data.7
For the SFD in non-sewered areas, data from the following household survey question was used:
What type of sanitation facility does this dwelling have?8
For Santa Cruz, this question encompasses both sanitation and containment technologies. It should
be noted that the household’s response is taken as given, as it was not possible to confirm responses
by observation.
To analyse this data, an SFD matrix was created – a blank matrix is shown in Table 4 below. It shows
which data sources are used and how they are analysed into categories of effective and ineffective
management of fecal waste through the stages of the service chain. Results for Santa Cruz are
shown in the next section.
Firstly, household survey data on use of infrastructure (question above) is used to allocate
households to five categories shown in the column marked (1) in the figure below:
(i) Sewered (off-site centralised or decentralised): toilets connected to sewers (not on-
site sanitation).
(ii) On-site storage – emptiable: on-site sanitation (OSS) toilets (involving pits or septic
tanks) that can be emptied. However, they can also be connected to drains through an
overflow, to avoid the need for emptying. These toilets are emptiable but may or may not
be emptied.
(iii) On-site storage – single-use / pit covered: OSS toilets where pits or tanks are covered
and / or abandoned once full. These toilets may be emptiable but are never emptied.
(iv) On-site non-storage – straight to drain / similar: OSS toilets which connect directly to
drains, water bodies or open ground. These toilets are therefore non-emptiable.
(v) Open defecation (OD): self-explanatory.
The question of emptiability is key. Category (ii) above is denoted as emptiable, meaning that this
containment option involves a pit or a tank which fills with FS. Between the two extremes of a closed
system and a system which never fills up, there is a spectrum of scenarios. For example, some tanks
may have an overflow to the drain but may still require emptying if they become blocked. These
categories were designed to be applicable around the world. As it happens, the vast majority of
6 In other cities in this five-city study, sub-sample A was designed to be representative of the whole city. However, given that data collection in Santa Cruz was mainly carried out to assess the viability of a call centre for FS services, sub-sample A is representative of non-sewered areas of the city. For more information on sampling, please refer to Annex A. 7 The only containment facilities that are formally emptied are septic tanks, septic tanks and soakaways and cement-lined pits. Among households with these types of facilities, the household survey suggests that only 27% are emptied. Secondary data about the total number of discharges at the SAGUAPAC treatment plant shows that there were 15,974 discharges in 2014, of which 80% correspond to domestic FS. Assuming that each discharge is the equivalent of 1.5 households, then 19,169 households were served in 2014. This is equal to 33% of households having their FS effectively transported and treated. 8 This question encompasses both characteristics of the sanitation facility as well as the type of containment. Responses include (i) latrine to unlined pit, (ii) latrine to lined pit, (iii) pour-flush to off-set lined pit, (iv) flush to soakaway, (v) flush to septic tank, (vi) flush to septic tank and soakaway, and (vii) no facility.
Fecal Sludge Management in Santa Cruz, Bolivia – Case Study Report
© Oxford Policy Management 10
households in Santa Cruz fall into category (i), as there is 49% sewerage. In non-sewered areas,
most households fall into category (ii), as most households have a septic tank.
Data collected through the household survey are allocated in column (2) below (a key shows the
meaning of the colour-coding of cells by data source). Next, the proportions for each of the stages
of the chain are allocated. As can be seen from the emptying column, marked (3), a certain proportion
of the population’s FS which is collected is emptied by a service provider, with the remaining FS not
emptied (e.g. overflows to drains).
The rest of the matrix follows a similar logic. Full SFD matrices for Santa Cruz (city-wide) and non-
sewered areas (sub-sample A) are presented in Annex B, along with further methodological notes.
This section has given a brief overview of where the data underlying the SFDs comes from. The
SFDs themselves are more intuitively appealing and are presented in the next section.
It should be noted that since data comes from a household survey and the Census, the proportions
in the matrices are proportions of households rather than FS volumes.9
9 The impression given by the SFD therefore involves assumptions that (i) each person produces the same amount of FS, and (ii) pit accumulation rates are constant across the city. This is an approximation but the most pragmatic approach in the context of uncertainty around FS volumes. FS volume only really becomes an issue when considering the extent of change in service levels needed to deal with the amounts. This study is primarily about identifying the broader picture of where the management of FS is or is not effective, not what volumes are being managed or mismanaged.
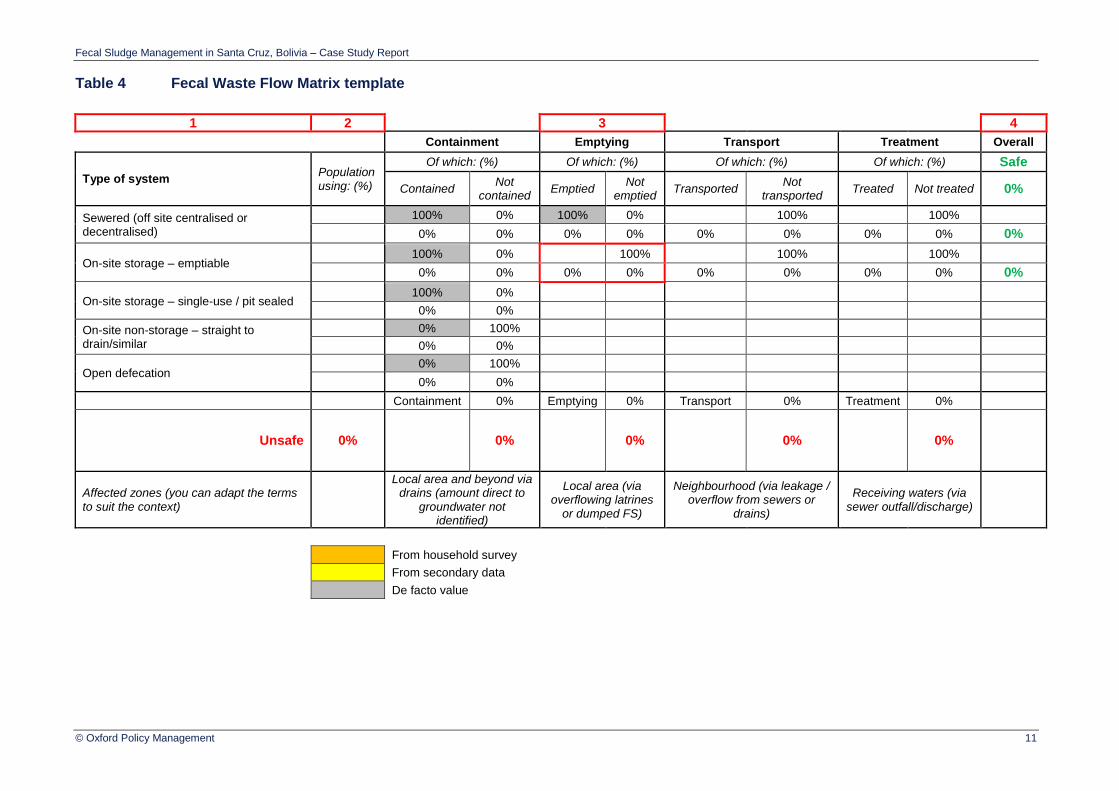
Fecal Sludge Management in Santa Cruz, Bolivia – Case Study Report
© Oxford Policy Management 11
Table 4 Fecal Waste Flow Matrix template
1 2 3 4
Containment Emptying Transport Treatment Overall
Type of system Population using: (%)
Of which: (%) Of which: (%) Of which: (%) Of which: (%) Safe
Contained Not
contained Emptied
Not emptied
Transported Not
transported Treated Not treated 0%
Sewered (off site centralised or decentralised)
100% 0% 100% 0% 100% 100%
0% 0% 0% 0% 0% 0% 0% 0% 0%
On-site storage – emptiable 100% 0% 100% 100% 100%
0% 0% 0% 0% 0% 0% 0% 0% 0%
On-site storage – single-use / pit sealed 100% 0%
0% 0%
On-site non-storage – straight to drain/similar
0% 100%
0% 0%
Open defecation 0% 100%
0% 0%
Containment 0% Emptying 0% Transport 0% Treatment 0%
Unsafe 0% 0% 0% 0% 0%
Affected zones (you can adapt the terms to suit the context)
Local area and beyond via drains (amount direct to
groundwater not identified)
Local area (via overflowing latrines
or dumped FS)
Neighbourhood (via leakage / overflow from sewers or
drains)
Receiving waters (via sewer outfall/discharge)
From household survey
From secondary data
De facto value

Fecal Sludge Management in Santa Cruz, Bolivia – Case Study Report
© Oxford Policy Management 12
3.3 Results
Firstly, the secondary data and household survey results, which are inputs to the SFD, are shown in
the tables below. They are reported separately for the whole city of Santa Cruz and non-sewered
areas (sub-sample A). After that, a separate SFD matrix and diagram for each area are presented.
3.3.1 Census and household survey results as an input to the SFD
In most countries, national household surveys usually collect data on the type of sanitation facility
(e.g. cistern flush, pour/manual flush, pit latrine, hanging toilet, etc.). However, in Bolivia only the
type of containment/facility discharge is inquired about in the Census and other similar surveys.
Nonetheless, the household survey asks about both sanitation and containment technologies,
allowing for projections to be made to estimate city-wide coverage. Figure 4 below depicts the
definitions used for primary data collection. The household survey also provides information about
the emptying rate for septic tanks, septic tanks with soakaways, and cement-lined pits (all other
technologies are deemed to be non-emptiable). Finally, the proportion of households for which FS
is effectively transported was estimated using the number of discharges recorded at SAGUAPAC
treatment plants, assuming that (i) 80% of total discharges are domestic; and (ii) each discharge is
equivalent to 1.5 households.
The SFD for non-sewered areas only relies on household survey data (i.e. type of sanitation and
containment technologies, and proportion of households that empty their tanks) and estimations for
the proportion of households for which FS is effectively transported, as described above.
Table 5 shows the type of sanitation and containment systems for Santa Cruz city-wide (based on
the 2012 Census and the household survey) and non-sewered areas of the city (only household
survey data). City-wide, 41% of households have a facility that discharges into a septic tank, as
compared to 70% in non-sewered areas. Surprisingly, while 5% of households city-wide have no
sanitation facility, only 1% of households in non-sewered areas reported not having a facility – this
is likely due to sampling issues.
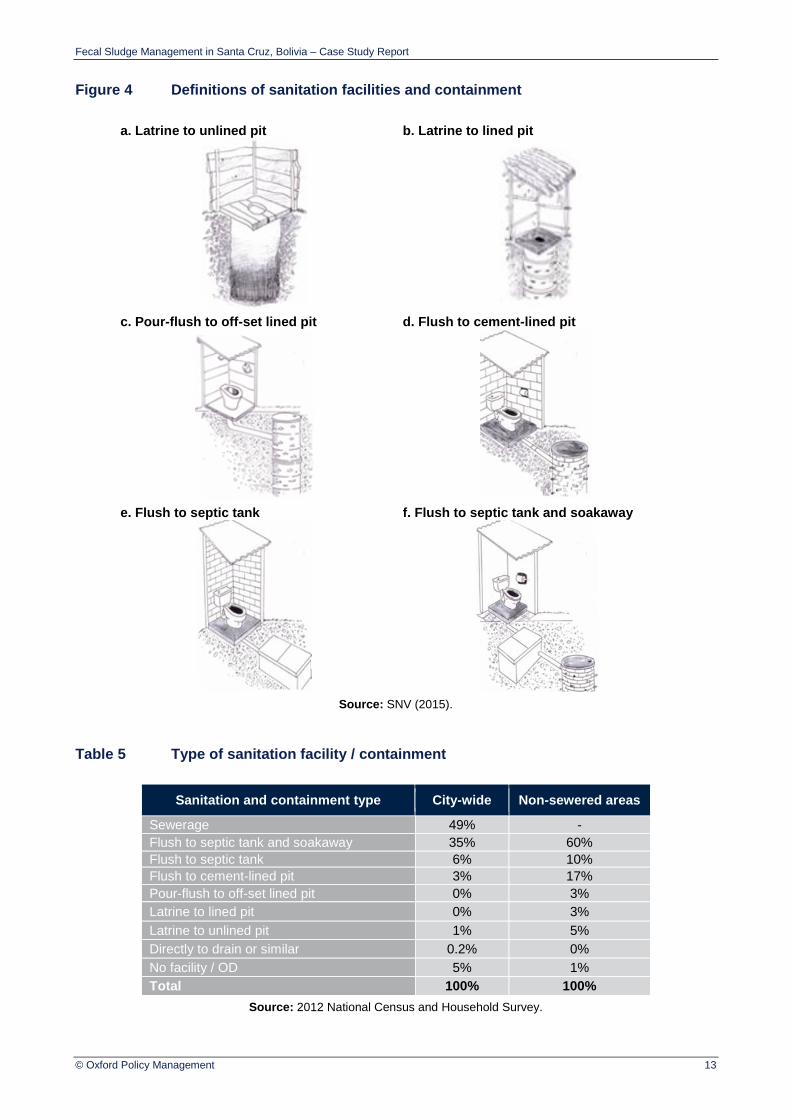
Fecal Sludge Management in Santa Cruz, Bolivia – Case Study Report
© Oxford Policy Management 13
Figure 4 Definitions of sanitation facilities and containment
a. Latrine to unlined pit b. Latrine to lined pit
c. Pour-flush to off-set lined pit d. Flush to cement-lined pit
e. Flush to septic tank f. Flush to septic tank and soakaway
Source: SNV (2015).
Table 5 Type of sanitation facility / containment
Sanitation and containment type City-wide Non-sewered areas
Sewerage 49% -
Flush to septic tank and soakaway 35% 60%
Flush to septic tank 6% 10%
Flush to cement-lined pit 3% 17%
Pour-flush to off-set lined pit 0% 3%
Latrine to lined pit 0% 3%
Latrine to unlined pit 1% 5%
Directly to drain or similar 0.2% 0%
No facility / OD 5% 1%
Total 100% 100%
Source: 2012 National Census and Household Survey.
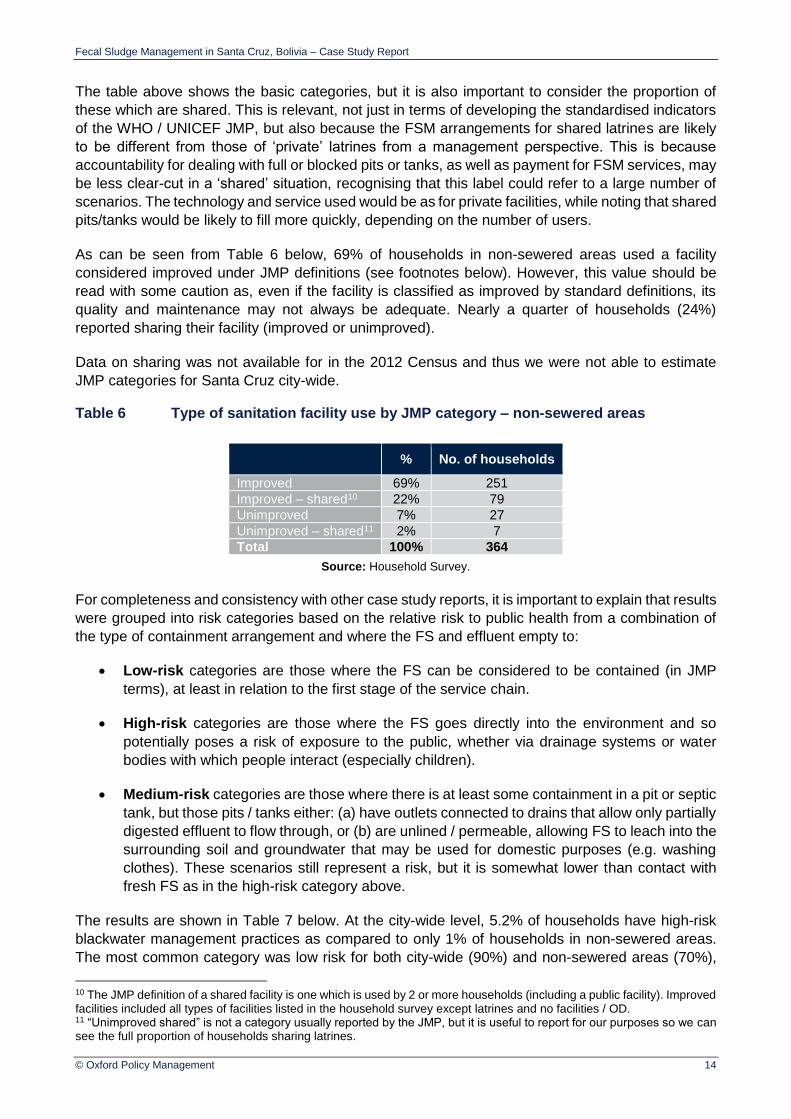
Fecal Sludge Management in Santa Cruz, Bolivia – Case Study Report
© Oxford Policy Management 14
The table above shows the basic categories, but it is also important to consider the proportion of
these which are shared. This is relevant, not just in terms of developing the standardised indicators
of the WHO / UNICEF JMP, but also because the FSM arrangements for shared latrines are likely
to be different from those of ‘private’ latrines from a management perspective. This is because
accountability for dealing with full or blocked pits or tanks, as well as payment for FSM services, may
be less clear-cut in a ‘shared’ situation, recognising that this label could refer to a large number of
scenarios. The technology and service used would be as for private facilities, while noting that shared
pits/tanks would be likely to fill more quickly, depending on the number of users.
As can be seen from Table 6 below, 69% of households in non-sewered areas used a facility
considered improved under JMP definitions (see footnotes below). However, this value should be
read with some caution as, even if the facility is classified as improved by standard definitions, its
quality and maintenance may not always be adequate. Nearly a quarter of households (24%)
reported sharing their facility (improved or unimproved).
Data on sharing was not available for in the 2012 Census and thus we were not able to estimate
JMP categories for Santa Cruz city-wide.
Table 6 Type of sanitation facility use by JMP category – non-sewered areas
% No. of households
Improved 69% 251
Improved – shared10 22% 79
Unimproved 7% 27
Unimproved – shared11 2% 7
Total 100% 364
Source: Household Survey.
For completeness and consistency with other case study reports, it is important to explain that results
were grouped into risk categories based on the relative risk to public health from a combination of
the type of containment arrangement and where the FS and effluent empty to:
Low-risk categories are those where the FS can be considered to be contained (in JMP
terms), at least in relation to the first stage of the service chain.
High-risk categories are those where the FS goes directly into the environment and so
potentially poses a risk of exposure to the public, whether via drainage systems or water
bodies with which people interact (especially children).
Medium-risk categories are those where there is at least some containment in a pit or septic
tank, but those pits / tanks either: (a) have outlets connected to drains that allow only partially
digested effluent to flow through, or (b) are unlined / permeable, allowing FS to leach into the
surrounding soil and groundwater that may be used for domestic purposes (e.g. washing
clothes). These scenarios still represent a risk, but it is somewhat lower than contact with
fresh FS as in the high-risk category above.
The results are shown in Table 7 below. At the city-wide level, 5.2% of households have high-risk
blackwater management practices as compared to only 1% of households in non-sewered areas.
The most common category was low risk for both city-wide (90%) and non-sewered areas (70%),
10 The JMP definition of a shared facility is one which is used by 2 or more households (including a public facility). Improved facilities included all types of facilities listed in the household survey except latrines and no facilities / OD. 11 “Unimproved shared” is not a category usually reported by the JMP, but it is useful to report for our purposes so we can see the full proportion of households sharing latrines.
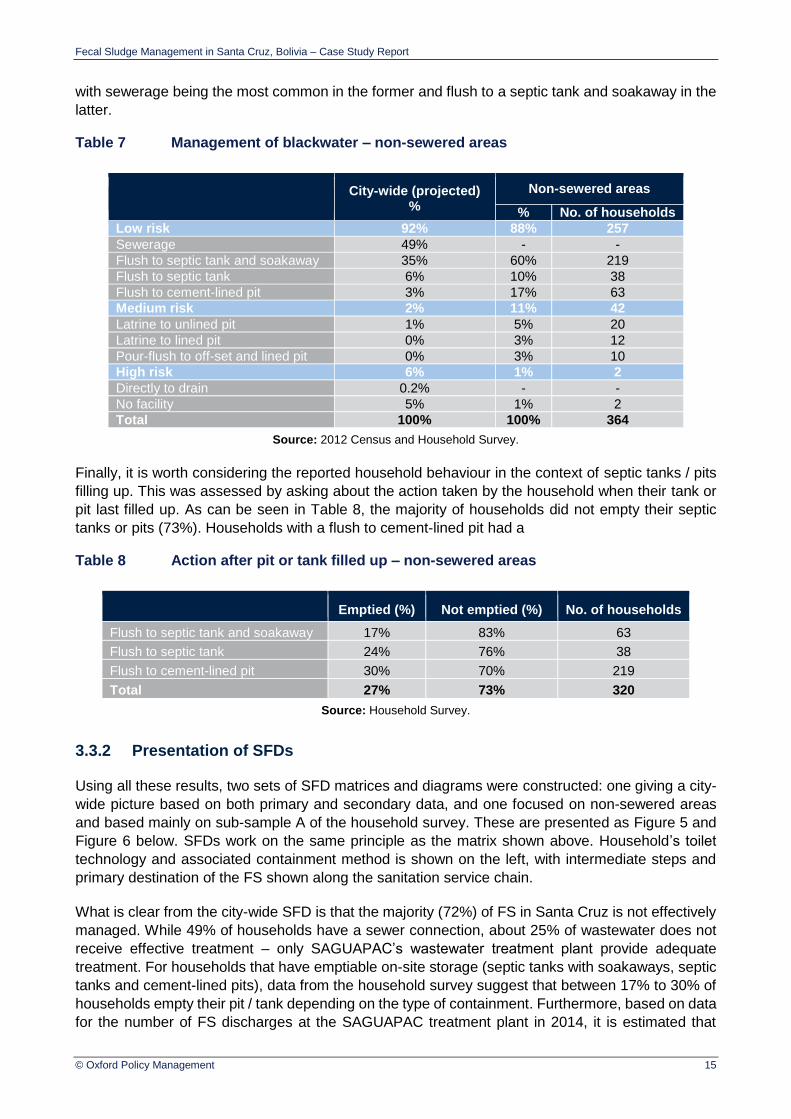
Fecal Sludge Management in Santa Cruz, Bolivia – Case Study Report
© Oxford Policy Management 15
with sewerage being the most common in the former and flush to a septic tank and soakaway in the
latter.
Table 7 Management of blackwater – non-sewered areas
City-wide (projected)
%
Non-sewered areas
% No. of households
Low risk 92% 88% 257
Sewerage 49% - -
Flush to septic tank and soakaway 35% 60% 219
Flush to septic tank 6% 10% 38
Flush to cement-lined pit 3% 17% 63
Medium risk 2% 11% 42
Latrine to unlined pit 1% 5% 20
Latrine to lined pit 0% 3% 12
Pour-flush to off-set and lined pit 0% 3% 10
High risk 6% 1% 2
Directly to drain 0.2% - -
No facility 5% 1% 2
Total 100% 100% 364
Source: 2012 Census and Household Survey.
Finally, it is worth considering the reported household behaviour in the context of septic tanks / pits
filling up. This was assessed by asking about the action taken by the household when their tank or
pit last filled up. As can be seen in Table 8, the majority of households did not empty their septic
tanks or pits (73%). Households with a flush to cement-lined pit had a
Table 8 Action after pit or tank filled up – non-sewered areas
Emptied (%) Not emptied (%) No. of households
Flush to septic tank and soakaway 17% 83% 63
Flush to septic tank 24% 76% 38
Flush to cement-lined pit 30% 70% 219
Total 27% 73% 320
Source: Household Survey.
3.3.2 Presentation of SFDs
Using all these results, two sets of SFD matrices and diagrams were constructed: one giving a city-
wide picture based on both primary and secondary data, and one focused on non-sewered areas
and based mainly on sub-sample A of the household survey. These are presented as Figure 5 and
Figure 6 below. SFDs work on the same principle as the matrix shown above. Household’s toilet
technology and associated containment method is shown on the left, with intermediate steps and
primary destination of the FS shown along the sanitation service chain.
What is clear from the city-wide SFD is that the majority (72%) of FS in Santa Cruz is not effectively
managed. While 49% of households have a sewer connection, about 25% of wastewater does not
receive effective treatment – only SAGUAPAC’s wastewater treatment plant provide adequate
treatment. For households that have emptiable on-site storage (septic tanks with soakaways, septic
tanks and cement-lined pits), data from the household survey suggest that between 17% to 30% of
households empty their pit / tank depending on the type of containment. Furthermore, based on data
for the number of FS discharges at the SAGUAPAC treatment plant in 2014, it is estimated that

Fecal Sludge Management in Santa Cruz, Bolivia – Case Study Report
© Oxford Policy Management 16
around a third of FS collected is actually transported to the SAGUAPAC treatment facility. Thus, only
4% of households that use emptiable systems manage their FS effectively. Open defecation and
facilities that empty straight to drains account for around 5% of households. Finally, single-use on-
site storage (i.e. latrines with unlined pits), which eventually allow FS to leach into the surrounding
environment, account for around 1% of households. Overall, 31% of emptiable OSS is deemed to
be ineffectively managed, mainly driven by the lack of guidance and standards for their construction,
but also by poor knowledge on adequate maintenance practices.
Figure 5 Faecal Waste Flow Diagram for Santa Cruz – city-wide, based on Census data and household survey
Considering next the SFD for the non-sewered sample (Figure 6), it is observed that the vast majority
of households (70%) have a septic tank or a septic tank and a soakaway, with an additional 17%
having a cement-lined pit, all of which are emptiable technologies. As is the case for the city-wide
SFD, around 17% of cement-lined pits, 24% of septic tanks and 30% of septic tanks with soakaways
are emptied. Assuming as well that the proportion of ERTLs that reach a SAGUAPAC treatment
facility is the same across city-wide and non-sewered areas, then only 8% of the FS collected is
effectively treated. Only 9% of households use single-use on-site storage (lined and unlined pits),
for which none of the FS is effectively managed: these containment systems are reported to allow
FS to seep into the surrounding environment. Overall, 92% of FS in non-sewered areas in Santa
Cruz is ineffectively managed.
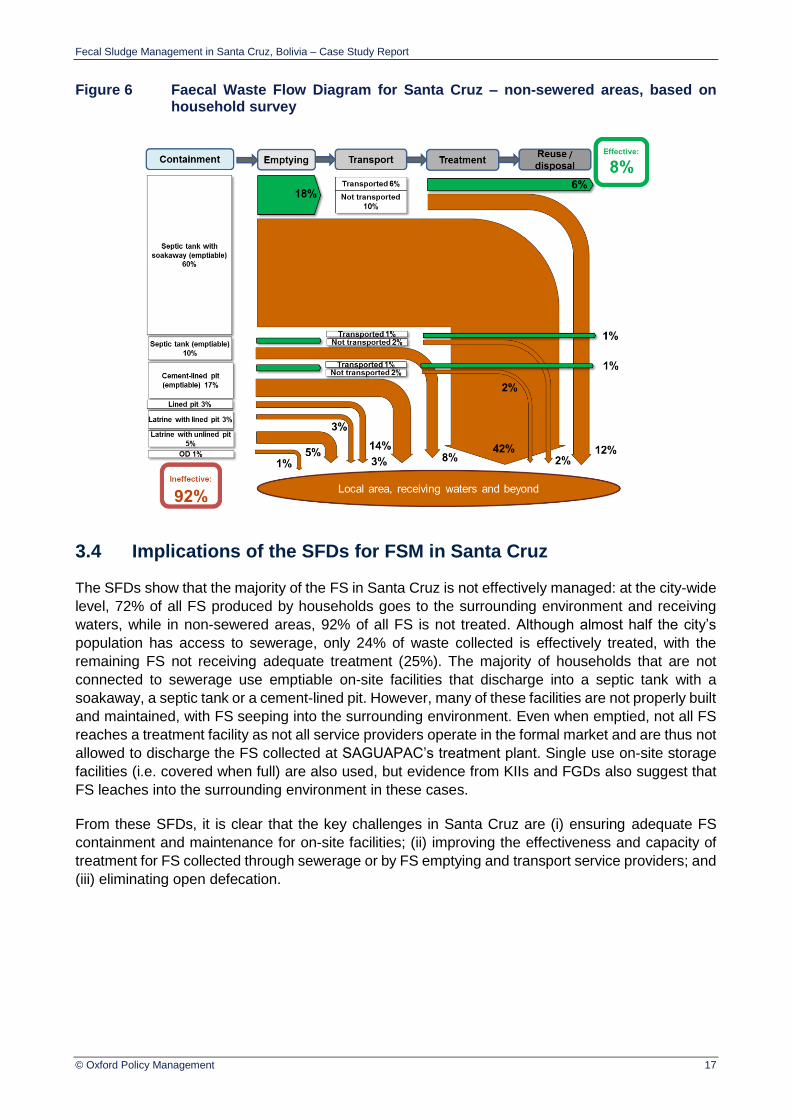
Fecal Sludge Management in Santa Cruz, Bolivia – Case Study Report
© Oxford Policy Management 17
Figure 6 Faecal Waste Flow Diagram for Santa Cruz – non-sewered areas, based on household survey
3.4 Implications of the SFDs for FSM in Santa Cruz
The SFDs show that the majority of the FS in Santa Cruz is not effectively managed: at the city-wide
level, 72% of all FS produced by households goes to the surrounding environment and receiving
waters, while in non-sewered areas, 92% of all FS is not treated. Although almost half the city’s
population has access to sewerage, only 24% of waste collected is effectively treated, with the
remaining FS not receiving adequate treatment (25%). The majority of households that are not
connected to sewerage use emptiable on-site facilities that discharge into a septic tank with a
soakaway, a septic tank or a cement-lined pit. However, many of these facilities are not properly built
and maintained, with FS seeping into the surrounding environment. Even when emptied, not all FS
reaches a treatment facility as not all service providers operate in the formal market and are thus not
allowed to discharge the FS collected at SAGUAPAC’s treatment plant. Single use on-site storage
facilities (i.e. covered when full) are also used, but evidence from KIIs and FGDs also suggest that
FS leaches into the surrounding environment in these cases.
From these SFDs, it is clear that the key challenges in Santa Cruz are (i) ensuring adequate FS
containment and maintenance for on-site facilities; (ii) improving the effectiveness and capacity of
treatment for FS collected through sewerage or by FS emptying and transport service providers; and
(iii) eliminating open defecation.

Fecal Sludge Management in Santa Cruz, Bolivia – Case Study Report
© Oxford Policy Management 18
4 FSM services: Potential Demand and Supply Management
4.1 Introduction
In economic theory, markets for goods and services operate on the basis of demand and supply.
This chapter provides a brief assessment of demand and supply for FSM services in Santa Cruz. At
this stage, it is important to note the difference between potential (or notional) demand and effective
demand. The potential demand for FSM services is the quantity (and type) of services which would
be demanded in the absence of any market failures or distortions. This is different from effective
demand, which is the quantity (and type) of services actually purchased in the context of current
supply and prices.
A simple way of illustrating this is to note that 45% of households city-wide use OSS (i.e. potential
demand), of which only 12% are emptied, suggesting a relatively low effective demand. Reasons for
a gap between potential demand and effective demand in Santa Cruz include: (i) poorly built
infrastructure (pits or septic tanks) that either leach into the ground and have never filled up or do
not allow for adequate maintenance activities to be carried out; (ii) practice of building a new pit when
the one in use fills up; (iii) lack of knowledge about the required maintenance for emptiable facilities;
(iv) lack of knowledge or disregard for environmental concerns; and (v) tariffs for FS emptying and
transport services being higher than consumers’ willingness and/or ability to pay (Cáceres Magnus,
2015; SNV, 2015; WSP, 2010).
There can be different definitions of potential demand in the context of FSM, with varying layers of
complexity. The simplest definition is as per the above, i.e. services that would be demanded if all
households with OSS used emptying services and were willing and able to pay. Qualifications could
be added for different scenarios, for example given (i) emptying of pits/tanks every 10 years on
average, (ii) regularly desludging once a year, (iii) 30% of households unable to pay the market price
and a further 20% are unwilling, and so on. For this study, we have kept things simple.
Santa Cruz has a relatively developed FSM market, with the first emptying service providers
appearing around 25 years ago. There are currently 27 registered FS emptying and transport service
providers (ERTLs) – however, only 14 of them currently transport the collected FS to a SAGUAPAC
wastewater treatment plant, the only cooperative that currently has an adequate treatment facility
(WSP, 2016). Tariffs for services have been reported to be high by households – indeed, WSP
studies suggest that ERTLs operate under oligopolistic competition (i.e. service providers make
informal agreements about tariffs to guarantee some level of profit) (WSP, 2010).
Demand is mainly driven by the need for corrective (e.g. pit/tank is overflowing) rather than
preventive measures (e.g. regular desludging). Poorly built infrastructure also reduces the demand
for FS emptying and transport services, as few pits/tanks are reported to fill up. Moreover, in some
cases, there is no hatch for emptying, forcing ERTLs to break through the floor to reach the pit/tank,
leaving many households unsatisfied with the service provided. Households that rely on traditional
latrines, where FS is contained in unlined pits, also have a tendency to build a new pit once the one
in use fills up, further discouraging demand for FSM services.
4.2 Methodology
This sub-section sets out key dimensions of demand and supply, and the data collected that is
related to these aspects. It was not intended to collect comprehensive data on demand and supply,
given the broad scope of the research and the limitations of some of the instruments used.

Fecal Sludge Management in Santa Cruz, Bolivia – Case Study Report
© Oxford Policy Management 19
4.2.1 Demand
The research framework (see Section 1.3) poses the following question: What is the existing
customer demand and preferences for FSM services? i.e. the current effective demand. This is
discussed in three parts: (a) physical and economic determinants of household demand, (b)
household satisfaction with current services, and (c) barriers faced by households in obtaining FSM
services12. This list is not meant to be exhaustive, but rather considers key elements for answering
the questions in the research framework.
Physical and economic determinants of household demand
It is useful to separate the physical and economic determinants of household demand because the
differences between them have implications for any potential interventions, either in stimulating or
responding to demand. Physical determinants are related to geography and infrastructure, whereas
economic determinants are more to do with markets and finance.
The main determinants are set out in Table 9 and Table 10 below, describing its relevance and the
way they have been measured by the research instruments (if data is available).
Table 9 Physical determinants of demand for FSM services
Dimension Relevance Instrument used to collect
quantitative data
1. Accessibility of location
Equipment access
Likelihood of equipment of different
sizes (manual emptier, tanker truck,
etc.) being able to access the facility to
empty it
Household survey questions about
equipment access and emptying point.
Type of building
Whether single-storey or multi-storey,
and privately owned or in shared
ownership
Household survey question
2. Fill rate
Volume of
containment
The nature of the containment method
(e.g. whether a pit, tank, or no real
containment) and its volume
Household survey question on type of
containment and dimensions of pits or
septic tanks (which allow for volume
estimations)
Number of users
The number of household members
(i.e. the owner household plus any
sharing households) determines the
volume entering the pit
Household survey questions around
household size and numbers of
households sharing the sanitation
facility
Climate, soil type
and groundwater
Ambient temperature, soil type and
groundwater table can all strongly
influence the rate of filling and
digestion of fecal sludge
Available secondary data
12 Given our focus on household demand, the primary concern is demand for emptying and transport services rather than for the remaining components of the sanitation service chain.
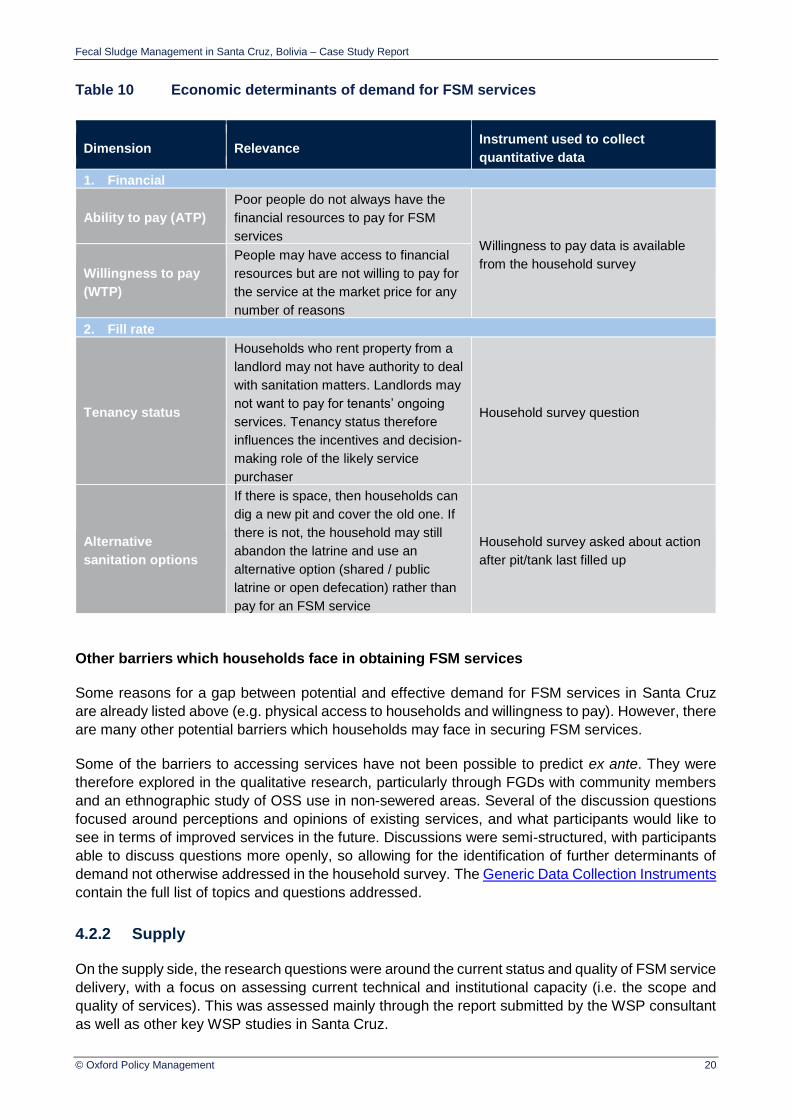
Fecal Sludge Management in Santa Cruz, Bolivia – Case Study Report
© Oxford Policy Management 20
Table 10 Economic determinants of demand for FSM services
Dimension Relevance Instrument used to collect
quantitative data
1. Financial
Ability to pay (ATP)
Poor people do not always have the
financial resources to pay for FSM
services Willingness to pay data is available
from the household survey Willingness to pay
(WTP)
People may have access to financial
resources but are not willing to pay for
the service at the market price for any
number of reasons
2. Fill rate
Tenancy status
Households who rent property from a
landlord may not have authority to deal
with sanitation matters. Landlords may
not want to pay for tenants’ ongoing
services. Tenancy status therefore
influences the incentives and decision-
making role of the likely service
purchaser
Household survey question
Alternative
sanitation options
If there is space, then households can
dig a new pit and cover the old one. If
there is not, the household may still
abandon the latrine and use an
alternative option (shared / public
latrine or open defecation) rather than
pay for an FSM service
Household survey asked about action
after pit/tank last filled up
Other barriers which households face in obtaining FSM services
Some reasons for a gap between potential and effective demand for FSM services in Santa Cruz
are already listed above (e.g. physical access to households and willingness to pay). However, there
are many other potential barriers which households may face in securing FSM services.
Some of the barriers to accessing services have not been possible to predict ex ante. They were
therefore explored in the qualitative research, particularly through FGDs with community members
and an ethnographic study of OSS use in non-sewered areas. Several of the discussion questions
focused around perceptions and opinions of existing services, and what participants would like to
see in terms of improved services in the future. Discussions were semi-structured, with participants
able to discuss questions more openly, so allowing for the identification of further determinants of
demand not otherwise addressed in the household survey. The Generic Data Collection Instruments
contain the full list of topics and questions addressed.
4.2.2 Supply
On the supply side, the research questions were around the current status and quality of FSM service
delivery, with a focus on assessing current technical and institutional capacity (i.e. the scope and
quality of services). This was assessed mainly through the report submitted by the WSP consultant
as well as other key WSP studies in Santa Cruz.
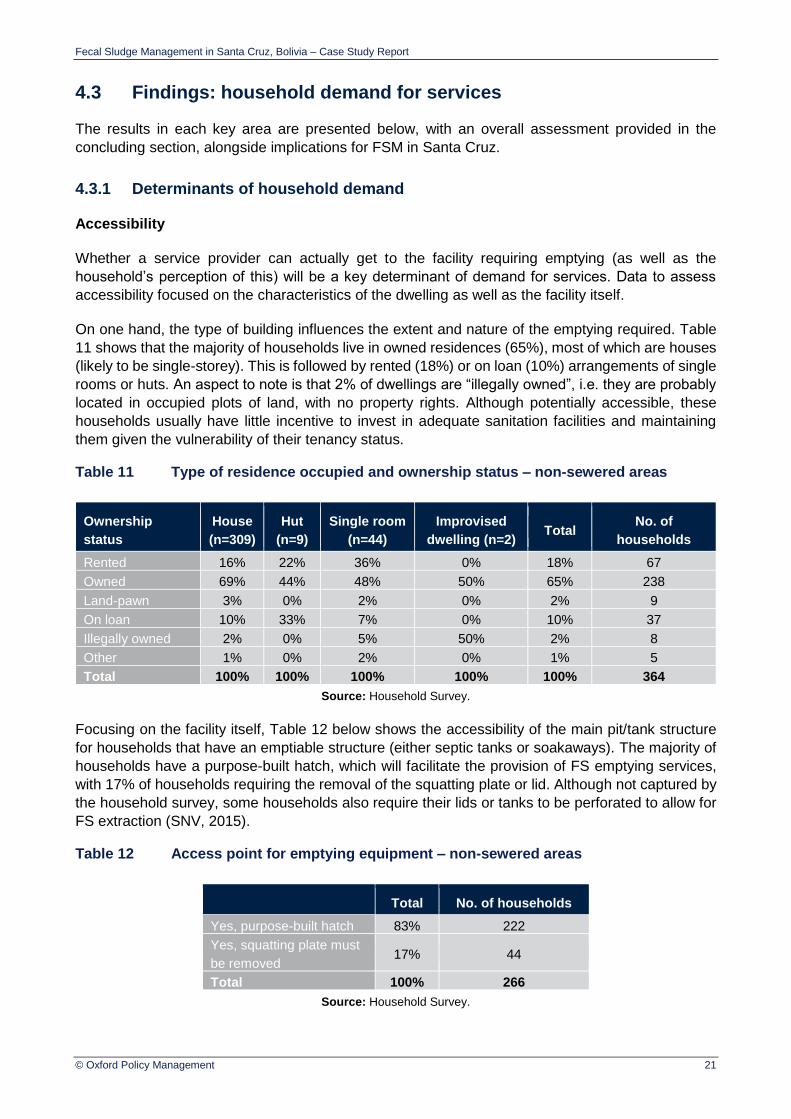
Fecal Sludge Management in Santa Cruz, Bolivia – Case Study Report
© Oxford Policy Management 21
4.3 Findings: household demand for services
The results in each key area are presented below, with an overall assessment provided in the
concluding section, alongside implications for FSM in Santa Cruz.
4.3.1 Determinants of household demand
Accessibility
Whether a service provider can actually get to the facility requiring emptying (as well as the
household’s perception of this) will be a key determinant of demand for services. Data to assess
accessibility focused on the characteristics of the dwelling as well as the facility itself.
On one hand, the type of building influences the extent and nature of the emptying required. Table
11 shows that the majority of households live in owned residences (65%), most of which are houses
(likely to be single-storey). This is followed by rented (18%) or on loan (10%) arrangements of single
rooms or huts. An aspect to note is that 2% of dwellings are “illegally owned”, i.e. they are probably
located in occupied plots of land, with no property rights. Although potentially accessible, these
households usually have little incentive to invest in adequate sanitation facilities and maintaining
them given the vulnerability of their tenancy status.
Table 11 Type of residence occupied and ownership status – non-sewered areas
Ownership
status
House
(n=309)
Hut
(n=9)
Single room
(n=44)
Improvised
dwelling (n=2) Total
No. of
households
Rented 16% 22% 36% 0% 18% 67
Owned 69% 44% 48% 50% 65% 238
Land-pawn 3% 0% 2% 0% 2% 9
On loan 10% 33% 7% 0% 10% 37
Illegally owned 2% 0% 5% 50% 2% 8
Other 1% 0% 2% 0% 1% 5
Total 100% 100% 100% 100% 100% 364
Source: Household Survey.
Focusing on the facility itself, Table 12 below shows the accessibility of the main pit/tank structure
for households that have an emptiable structure (either septic tanks or soakaways). The majority of
households have a purpose-built hatch, which will facilitate the provision of FS emptying services,
with 17% of households requiring the removal of the squatting plate or lid. Although not captured by
the household survey, some households also require their lids or tanks to be perforated to allow for
FS extraction (SNV, 2015).
Table 12 Access point for emptying equipment – non-sewered areas
Total No. of households
Yes, purpose-built hatch 83% 222
Yes, squatting plate must
be removed 17% 44
Total 100% 266
Source: Household Survey.

Fecal Sludge Management in Santa Cruz, Bolivia – Case Study Report
© Oxford Policy Management 22
Overall, from the perspective of accessibility it is clear that there do not seem to be any significant
difficulties in accessing neither the dwelling nor the facilities themselves. However, there is no
evidence related to the quality of the roads and other geographical characteristics (e.g. hilly areas)
that may hinder ease of access for ERTLs.
Fill rate
Data on the type of containment was already shown in Table 5 above. The household survey also
collected information on the dimensions of the pit/tank as reported by the household, as well as the
time taken between the previous and the last emptying, which allow for an estimation of the average
fill rate for on-site facilities.
Table 13 shows the average estimated volume for soakaways and septic tanks in non-sewered
areas. Soakaways are commonly deeper and are thus able to contain a larger volume of FS (i.e.
20.0m3) as compared to septic tanks, which on average contain around 6.0m3.
Table 13 Average estimated volume for soakaways and septic tanks – non-sewered areas
Type of containment Average dimensions and volume No. of households
Soakaway
Diameter 2.36m 137
Depth 4.56m 116
Volume 20.00m3
Septic tank
Length 1.78m 169
Width 1.51m 170
Depth 2.22m 136
Volume 5.96m3
Source: Household Survey.
Households were also asked how long it usually took for their pit to fill up, which is considered more
relevant and also a more reliable indicator for households to estimate. The results are shown in
Table 14 below for soakaways and septic tanks separately. The data shows that among the 11
households using soakaways, the majority take between 7 to 12 months to fill up (36%). For the 71
households using septic tanks, a fifth reported their tank filling in less than 6 months, followed by
18% of households who said their tank took between 2 to 3 years to fill up. Long fill-up rates for
septic tanks may be associated with poor construction or installation, with some reported to have
leakages and punctures to delay the need for emptying (Herreira Patiño et al, 2015).
Despite differences in the time ranges between the two types of containment systems, the average
time does not seem to differ as widely, with soakaways taking, on average, 2.6 years (standard
deviation of 1.04) to fill up as compared to 2.4 years (standard deviation of 0.27) for septic tanks.

Fecal Sludge Management in Santa Cruz, Bolivia – Case Study Report
© Oxford Policy Management 23
Table 14 Average time taken for soakaways and septic tanks to fill up – non-sewered areas
Soakaways Septic tanks
% No. of households % No. of households
Less than 6 months 18% 2 20% 14
7 – 12 months 36% 4 15% 11
13 – 18 months 9% 1 8% 6
19 – 24 months 18% 2 17% 12
2 – 3 years 0% 0 18% 13
3 – 4 years 0% 0 10% 7
4 – 5 years 0% 0 3% 2
5 – 10 years 18% 2 7% 5
More than 10 years 0% 0 1% 1
Total 100% 11 100% 71
Source: Household Survey.
Moving on to data on shared facilities, the average number of households per sanitation facility in
non-sewered areas was 1.2.13 It is also worth considering the number of people which were sharing
facilities in more detail, as shown in Table 15 below.14 This comes directly from data reported by
households. It should be noted that the average household size in non-sewered areas was 5.8
people.
As shown below, the majority of sanitation facilities were shared with fewer than 6 people (56%).
This also holds for all types of facilities, with the exception of latrines to lined pits, of which 50% are
shared with 6-10 people. Flush to septic tanks are generally more private, with 71% of them being
shared with less than 6 people. About a quarter of facilities are shared between 6 to 10 people.
Table 15 Number of people using the same sanitation facility by type – non-sewered areas
Latrine to
unlined
pit
Latrine
to lined
pit
Pour-flush
to off-set
lined pit
Flush to
cement-
lined pit
Flush to
septic
tank
Flush to
septic tank
& soakaway
Total
1 to 5 people 45% 42% 60% 48% 71% 57% 56%
6 to 10 people 30% 50% 20% 29% 24% 25% 26%
11 to 15 people 0% 0% 0% 3% 0% 5% 4%
16 to 20 people 15% 0% 10% 6% 3% 5% 5%
21 to 25 people 5% 0% 10% 5% 0% 3% 3%
More than 25
people 5% 8% 0% 10% 3% 5% 6%
Total 100% 100% 100% 100% 100% 100% 100%
No. of
households 20 12 10 63 38 219 362
Source: Household Survey.
13 For this estimate, households with private facilities (not sharing with other households) are included and coded as 1. If these households are excluded, the average number of households per facility increases to 2.5. 14 These data are drawn from the following household survey questions: “How many households share this dwelling or plot?”, “How many people live in this dwelling or plot?” and “How many sanitation facilities are functioning in this dwelling or plot?”
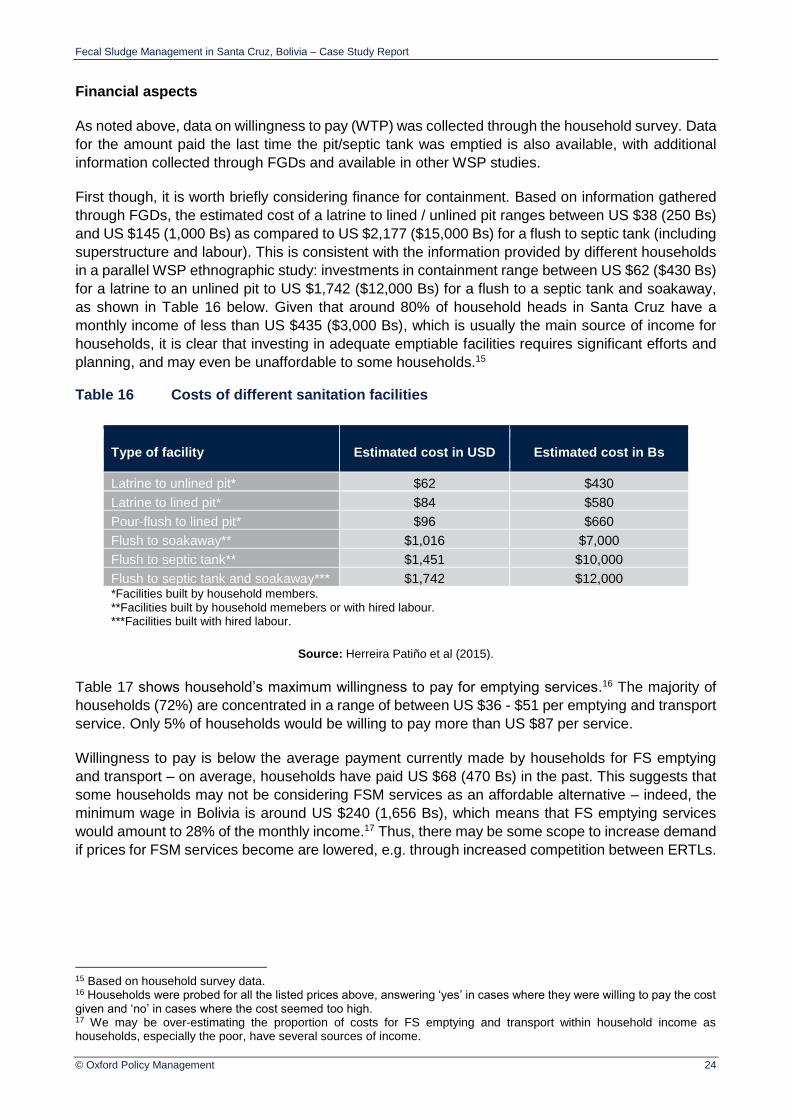
Fecal Sludge Management in Santa Cruz, Bolivia – Case Study Report
© Oxford Policy Management 24
Financial aspects
As noted above, data on willingness to pay (WTP) was collected through the household survey. Data
for the amount paid the last time the pit/septic tank was emptied is also available, with additional
information collected through FGDs and available in other WSP studies.
First though, it is worth briefly considering finance for containment. Based on information gathered
through FGDs, the estimated cost of a latrine to lined / unlined pit ranges between US $38 (250 Bs)
and US $145 (1,000 Bs) as compared to US $2,177 ($15,000 Bs) for a flush to septic tank (including
superstructure and labour). This is consistent with the information provided by different households
in a parallel WSP ethnographic study: investments in containment range between US $62 ($430 Bs)
for a latrine to an unlined pit to US $1,742 ($12,000 Bs) for a flush to a septic tank and soakaway,
as shown in Table 16 below. Given that around 80% of household heads in Santa Cruz have a
monthly income of less than US $435 ($3,000 Bs), which is usually the main source of income for
households, it is clear that investing in adequate emptiable facilities requires significant efforts and
planning, and may even be unaffordable to some households.15
Table 16 Costs of different sanitation facilities
Type of facility Estimated cost in USD Estimated cost in Bs
Latrine to unlined pit* $62 $430
Latrine to lined pit* $84 $580
Pour-flush to lined pit* $96 $660
Flush to soakaway** $1,016 $7,000
Flush to septic tank** $1,451 $10,000
Flush to septic tank and soakaway*** $1,742 $12,000 *Facilities built by household members. **Facilities built by household memebers or with hired labour. ***Facilities built with hired labour.
Source: Herreira Patiño et al (2015).
Table 17 shows household’s maximum willingness to pay for emptying services.16 The majority of
households (72%) are concentrated in a range of between US $36 - $51 per emptying and transport
service. Only 5% of households would be willing to pay more than US $87 per service.
Willingness to pay is below the average payment currently made by households for FS emptying
and transport – on average, households have paid US $68 (470 Bs) in the past. This suggests that
some households may not be considering FSM services as an affordable alternative – indeed, the
minimum wage in Bolivia is around US $240 (1,656 Bs), which means that FS emptying services
would amount to 28% of the monthly income.17 Thus, there may be some scope to increase demand
if prices for FSM services become are lowered, e.g. through increased competition between ERTLs.
15 Based on household survey data. 16 Households were probed for all the listed prices above, answering ‘yes’ in cases where they were willing to pay the cost given and ‘no’ in cases where the cost seemed too high. 17 We may be over-estimating the proportion of costs for FS emptying and transport within household income as households, especially the poor, have several sources of income.
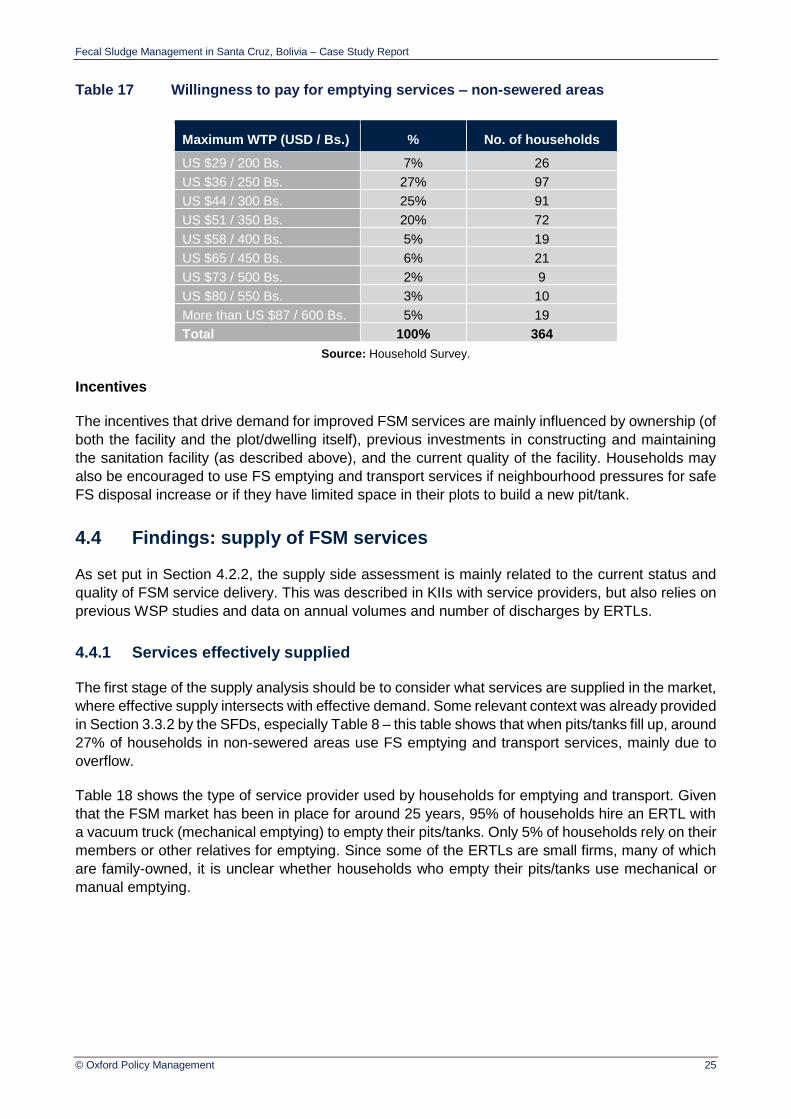
Fecal Sludge Management in Santa Cruz, Bolivia – Case Study Report
© Oxford Policy Management 25
Table 17 Willingness to pay for emptying services – non-sewered areas
Maximum WTP (USD / Bs.) % No. of households
US $29 / 200 Bs. 7% 26
US $36 / 250 Bs. 27% 97
US $44 / 300 Bs. 25% 91
US $51 / 350 Bs. 20% 72
US $58 / 400 Bs. 5% 19
US $65 / 450 Bs. 6% 21
US $73 / 500 Bs. 2% 9
US $80 / 550 Bs. 3% 10
More than US $87 / 600 Bs. 5% 19
Total 100% 364
Source: Household Survey.
Incentives
The incentives that drive demand for improved FSM services are mainly influenced by ownership (of
both the facility and the plot/dwelling itself), previous investments in constructing and maintaining
the sanitation facility (as described above), and the current quality of the facility. Households may
also be encouraged to use FS emptying and transport services if neighbourhood pressures for safe
FS disposal increase or if they have limited space in their plots to build a new pit/tank.
4.4 Findings: supply of FSM services
As set put in Section 4.2.2, the supply side assessment is mainly related to the current status and
quality of FSM service delivery. This was described in KIIs with service providers, but also relies on
previous WSP studies and data on annual volumes and number of discharges by ERTLs.
4.4.1 Services effectively supplied
The first stage of the supply analysis should be to consider what services are supplied in the market,
where effective supply intersects with effective demand. Some relevant context was already provided
in Section 3.3.2 by the SFDs, especially Table 8 – this table shows that when pits/tanks fill up, around
27% of households in non-sewered areas use FS emptying and transport services, mainly due to
overflow.
Table 18 shows the type of service provider used by households for emptying and transport. Given
that the FSM market has been in place for around 25 years, 95% of households hire an ERTL with
a vacuum truck (mechanical emptying) to empty their pits/tanks. Only 5% of households rely on their
members or other relatives for emptying. Since some of the ERTLs are small firms, many of which
are family-owned, it is unclear whether households who empty their pits/tanks use mechanical or
manual emptying.
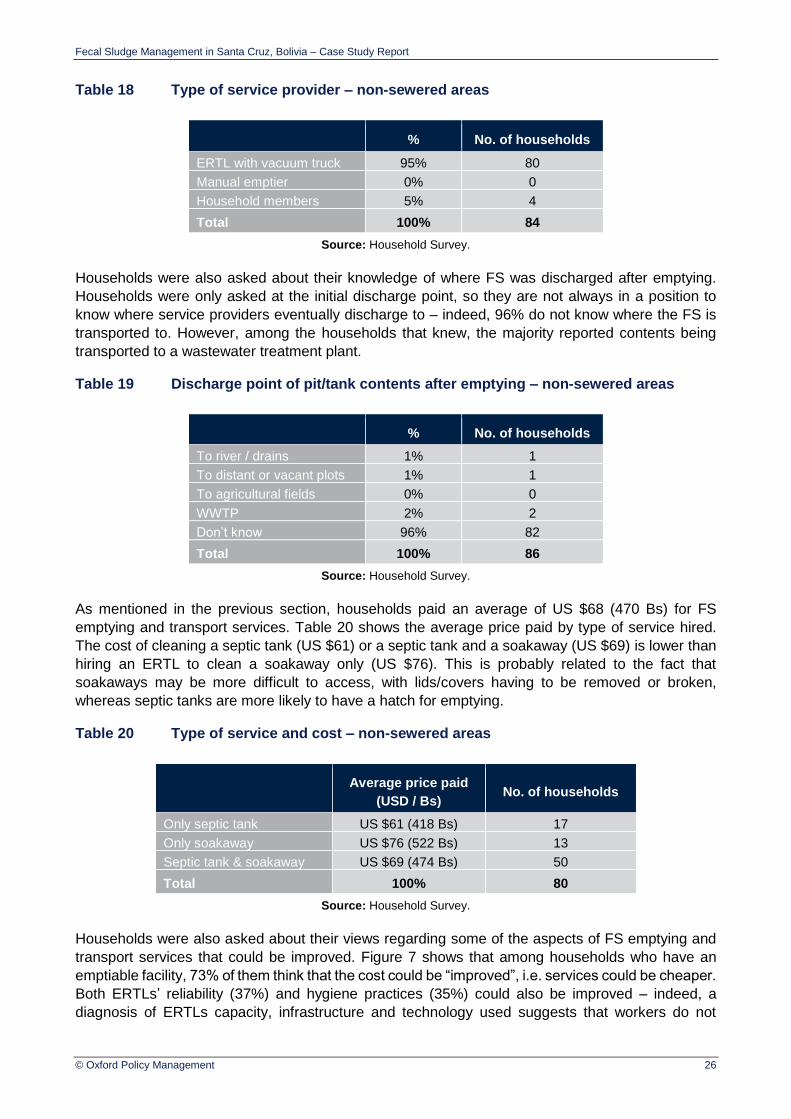
Fecal Sludge Management in Santa Cruz, Bolivia – Case Study Report
© Oxford Policy Management 26
Table 18 Type of service provider – non-sewered areas
% No. of households
ERTL with vacuum truck 95% 80
Manual emptier 0% 0
Household members 5% 4
Total 100% 84
Source: Household Survey.
Households were also asked about their knowledge of where FS was discharged after emptying.
Households were only asked at the initial discharge point, so they are not always in a position to
know where service providers eventually discharge to – indeed, 96% do not know where the FS is
transported to. However, among the households that knew, the majority reported contents being
transported to a wastewater treatment plant.
Table 19 Discharge point of pit/tank contents after emptying – non-sewered areas
% No. of households
To river / drains 1% 1
To distant or vacant plots 1% 1
To agricultural fields 0% 0
WWTP 2% 2
Don’t know 96% 82
Total 100% 86
Source: Household Survey.
As mentioned in the previous section, households paid an average of US $68 (470 Bs) for FS
emptying and transport services. Table 20 shows the average price paid by type of service hired.
The cost of cleaning a septic tank (US $61) or a septic tank and a soakaway (US $69) is lower than
hiring an ERTL to clean a soakaway only (US $76). This is probably related to the fact that
soakaways may be more difficult to access, with lids/covers having to be removed or broken,
whereas septic tanks are more likely to have a hatch for emptying.
Table 20 Type of service and cost – non-sewered areas
Average price paid
(USD / Bs) No. of households
Only septic tank US $61 (418 Bs) 17
Only soakaway US $76 (522 Bs) 13
Septic tank & soakaway US $69 (474 Bs) 50
Total 100% 80
Source: Household Survey.
Households were also asked about their views regarding some of the aspects of FS emptying and
transport services that could be improved. Figure 7 shows that among households who have an
emptiable facility, 73% of them think that the cost could be “improved”, i.e. services could be cheaper.
Both ERTLs’ reliability (37%) and hygiene practices (35%) could also be improved – indeed, a
diagnosis of ERTLs capacity, infrastructure and technology used suggests that workers do not

Fecal Sludge Management in Santa Cruz, Bolivia – Case Study Report
© Oxford Policy Management 27
always use adequate protection equipment (e.g. gloves, masks, etc.), while some of the hoses and
connections used for emptying have leakages (Pacheco Civera, 2014).
Figure 7 Elements of FS emptying services that could be improved – non-sewered areas
No. of households = 86.
Source: Household Survey.
4.4.2 Service provider capacity
Manual emptying
There are no legal/formal manual emptying services in Santa Cruz. Manual emptying is likely to be
practiced by households who empty their pits/tanks themselves and potentially, some informal
service providers.
Mechanical emptying
Mechanical emptying is provided by FS emptying and transport service providers (ERTLs), of which
27 are legally registered to the Water Supply and Basic Sanitation Supervision and Societal
Oversight Authority (AAPS). However, given the constitutional ban on private-sector participation in
the provision of water supply and sanitation services in Bolivia, there may be some private sector
firms illegally operating in the Santa Cruz market – previous studies mentioned there were over 40
ERTLs (see Rivera, 2010); whether these firms have been forced out of the market because of
increased competition or they have entered the informal market is unknown. It must also be noted
that the registration and formalisation process for ERTLs has 14 different steps, some of which are
not easy to comply, so some of the ERTLs that are currently operating in the market may actually
be in the process of becoming formalised.
ERTLs are generally subcontracted by one of the ten utilities/cooperatives (EPSAs) that currently
provide water supply and sanitation (WSS) services in Santa Cruz. Through this subcontract, ERTLs
agree on a fee rate to use the EPSAs’ treatment facilities for FS discharge after emptying. However,
only SAGUAPAC, the main WSS cooperative has an adequate wastewater treatment facility.
SAGUAPAC currently has contracts with only 14 of the 27 ERTLs, meaning that all other FS collected
1%
7%
12%
14%
16%
22%
35%
37%
73%
0% 20% 40% 60% 80%
Quality
None
Means of communication
Control of volume emptied
Timeliness of response
Include sealing of pit/tank
Hygiene
Reliability
Price

Fecal Sludge Management in Santa Cruz, Bolivia – Case Study Report
© Oxford Policy Management 28
is treated inadequately or dumped illegally to the surrounding environment. WSP (2016) estimates
that around 24,000 m3 of FS are illegally dumped every year.
Table 21 shows the capacity of ERTLs operating in Santa Cruz for which data is available and that
serve household demand for FS emptying and transport. Total capacity in 2013 was equal to 778,591
litres, provided by 64 vacuum trucks and 21 different firms. Between 60 and 65% of trucks are
refurbished (e.g. vacuums, container) in Santa Cruz. All of the ERTLs are small enterprises, having
a total of between 2 and 6 employees – indeed, some of these firms are actually family-owned
entrepreneurships.
Table 21 Capacity of ERTLs operating in Santa Cruz, 2013
Firm name No. of
employees
No. of vacuum
trucks
Total capacity
(Lts)
Bazan 4 1 14,000
Belén 4 1 4,850
Bolivia 6 4 43,420
La Económica 4 4 69,127
La Económica Uno 3 8 135,762
Mercado San Antonio 1 9,150
El Pauro 4 42,019
Pirai Económico 2 3 30,613
Playon 2 3 30,294
Santa Barbara 6 7 91,250
San Jorge 6 5 58,070
Santa Cruz 3 1 13,619
San Miguel 2 39,500
Servi Master 6 7 65,805
Socorro Camba 3 3 32,481
Soruco Oriental 5 2 14,046
Soruco Peto 3 2 16,674
El Tiluchi 2 2 21,965
La Veloz 2 2 15,446
Serv. Transporte Sanchez 4 1 17,500
Serv. Transporte Padilla 1 13,000
Total 65 64 778,591
Source: Cáceres Magnus (2015).
Table 22 shows the number of discharges and volume of FS transported by ERTLs between 2011
and 2013. For the majority of ERTLs, both the number of discharges and volume transported have
increased across time, although some smaller firms seem to be shrinking or are being displaced
(e.g. Belen) by larger competitors (e.g. San Jorge, Servi Master). Overall, the number of discharges
has grown by 20% while the volume transported has grown by 31% between 2011 and 2013.

Fecal Sludge Management in Santa Cruz, Bolivia – Case Study Report
© Oxford Policy Management 29
Table 22 Number of discharges and FS volume transported by ERTLs, 2011-2013
Firm name
2011 2012 2013
No.
discharges Volume (Lts)
No.
discharges Volume (Lts)
No.
discharges Volume (Lts)
Bazan 359 4,020,800 306 3,427,200
Belén 35 135,800 20 77,600 16 62,080
Bolivia 111 872,070 135 1,533,150 394 3,327,250
La Económica 3,248 46,300,785 2,313 32,932,817 1,043 15,088,084
La Económica Uno 1,463 17,945,350 3,153 42,457,457
El Pauro 195 1,571,702 173 1,312,426 230 1,680,496
Pirai Económico 482 4,190,990 543 4,721,385 537 4,669,215
Playon 430 3,851,565 721 6,420,750 742 6,597,465
Santa Barbara 2,195 17,829,452 2,404 24,447,027 2,317 21,607,217
San Jorge 2,239 19,786,580 2,642 23,812,268 2,797 28,392,131
Santa Cruz 48 522,960
San Miguel 270 3,520,549 722 9,933,608 915 14,660,000
Servi Master 1,287 11,050,798 1,144 11,606,454 1,517 19,869,903
Socorro Camba 317 2,000,163 324 3,264,685
Soruco Oriental 220 1,640,326 232 1,841,990 252 1,888,775
Soruco Peto 266 1,729,047 316 2,308,728 289 2,167,500
El Tiluchi 420 2,730,162 492 3,814,184 490 4,851,268
La Veloz 421 2,536,250 389 2,345,211 463 3,241,000
Serv. Transporte
Sanchez 0 0 2 28,000 2 28,000
Serv. Transporte
Padilla 359
4,020,800 306 3,427,200
Total 14,006 142,235,349 16,031 176,284,940 16,860 185,915,294*
*Some data for 2013 is missing, so the total reported volume does not match the addition of all volumes for all ERTLs.
Source: Cáceres Magnus (2015).
Based on these data and demand projections for FS emptying and transport services, it seems
ERTLs have sufficient flexibility to cope with increasing demand in the medium-term (see SNV,
2015). However, in the extreme case in which all OSS facilities were to become emptiable (e.g.
changing lined and unlined pits into cement-lined pits or other emptiable type of containment) and
maintenance was carried out on a frequent basis (e.g. once per year), then current ERTLs capacity
would be insufficient to meet demand, and investments would be needed to either increase the fleet
number or its capacity.

Fecal Sludge Management in Santa Cruz, Bolivia – Case Study Report
© Oxford Policy Management 30
5 City Service Delivery Assessment
5.1 Introduction
The FSM City Service Delivery Assessment (CSDA) is a crucial part of the analysis of FSM services.
It answers an overarching question around the quality of the FSM enabling environment, the level of
FSM service development and the level of commitment to FSM service sustainability. The aim of the
CSDA is to allow an objective assessment of FSM service performance through all stages of the
service chain, so as to identify priorities for reform. The Prognosis for Change (in the next section)
then attempts to explain why the CSDA looks like it does.
The CSDA format builds on an approach developed under the 12-city study (Peal & Evans, 2013).
In turn, the 12-city method was based on similar exercises in water and sanitation (e.g. Country
Status Overviews produced by WSP).
The CSDA is arranged around three broad areas: (1) enabling services, (2) developing services, and
(3) sustaining services. This is illustrated in Table 23 below, alongside the key question associated
with each area, and the indicators used.
Table 23 CSDA framework for FSM
Area Question in research framework Indicator
Enabling What are current policies, planning issues and
budgetary arrangements?
Policy
Planning
Budget
Developing What is the level of expenditure, degree of equity and
level of output?
Expenditure
Equity
Output
Sustaining
What is the status of operation and maintenance, what
provisions are made for service expansion and what are
the current service outcomes?
Maintenance
Expansion
Service Outcomes
5.2 Methodology
The CSDA aims to be fully objective and transparent, so the analysis is clear and stakeholders can
engage with it and update it over time as the situation improves. It is primarily a qualitative analysis,
based on a review of key documents and interviews with stakeholders at the city level. WSP’s overall
study design was that the OPM/WEDC team designed the methodology, but did not do primary data
collection (for more information, please refer to Annex A). For analyses such as the CSDA and PFC,
it is very hard to separate data collection from analysis. Therefore, the collection and preliminary
analysis was conducted by a short-term consultant contracted by WSP, Humberto Cáceres Magnus.
There are several questions beneath each of the nine overall indicators in Table 23 above, with 19
questions in total. For each question, there are objective criteria to enable a score to be given for the
city, with 0 (poor), 0.5 (developing) or 1 (good) on that question. Each question is scored along the
whole service chain from containment to disposal. An example is given in Table 24 below, for the
first question under the “policy” indicator.

Fecal Sludge Management in Santa Cruz, Bolivia – Case Study Report
© Oxford Policy Management 31
Table 24 Example of an CSDA question, criteria and scoring
Question
Co
nta
inm
en
t
Em
pty
ing
Tra
nsp
ort
Tre
atm
en
t
En
d-u
se/
dis
po
sal
Indicator/ Score
Policy: Is FSM included in an appropriate, acknowledged and available policy document (national / local or both)?
0.5 0 0 0 0
1: policy is appropriate, approved (or in draft
form), acknowledged and available
0.5: policy is appropriate, approved (or in draft
form), but not clearly acknowledged / available
0: policy not available, or inappropriate to the
context
Once all 19 questions are scored, the next step is to aggregate those scores into a city scorecard,
by summing together the scores for each indicator (policy, planning, etc.). Because there are
different numbers of questions for each indicator, a final step is required, which is to normalise the
scores to a total out of 3 for each indicator. This is achieved by dividing the city score for that indicator
by the maximum possible city score, multiplying by 3, and finally rounding to the nearest 0.5. This
process delivers the overall CSDA scorecard. The output for Santa Cruz is shown in Figure 8 below.

Fecal Sludge Management in Santa Cruz, Bolivia – Case Study Report
© Oxford Policy Management 32
Figure 8 CSDA scorecard for Santa Cruz
Containment Emptying Transport Treatment End-use/ Disposal
Enabling
Policy
Planning
Budget
Developing
Expenditure
Equity
Output
Sustaining
O&M
Expansion
Service
City typology
Enabling Developing Sustaining
Poor
Developing
Good
1 1.5 1.5 1.5 1
0 0 0 0 0
0 0 0 0 0
0 0 0 0 0
1 1 1 1 0
1.5 3 2.5 2.5 0
1 2.5 2.5 2.5 0
0 1 1.5 1.5 0
1 1.5 2.5 1.5 0
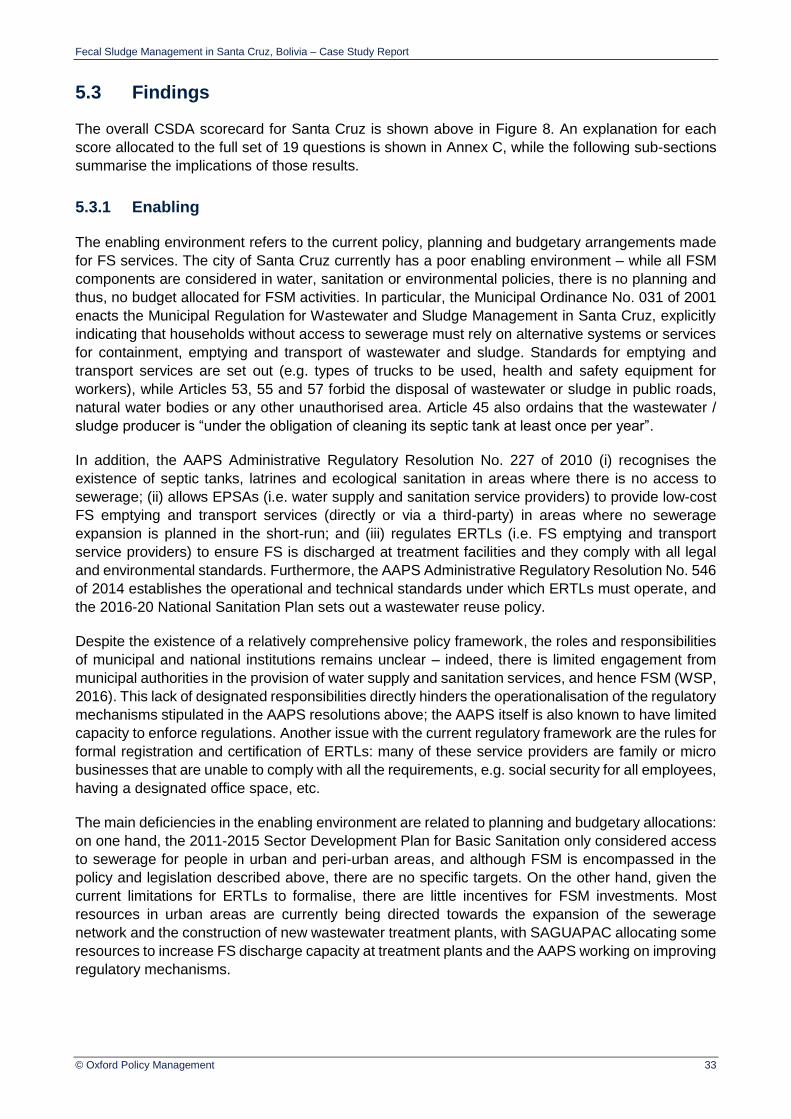
Fecal Sludge Management in Santa Cruz, Bolivia – Case Study Report
© Oxford Policy Management 33
5.3 Findings
The overall CSDA scorecard for Santa Cruz is shown above in Figure 8. An explanation for each
score allocated to the full set of 19 questions is shown in Annex C, while the following sub-sections
summarise the implications of those results.
5.3.1 Enabling
The enabling environment refers to the current policy, planning and budgetary arrangements made
for FS services. The city of Santa Cruz currently has a poor enabling environment – while all FSM
components are considered in water, sanitation or environmental policies, there is no planning and
thus, no budget allocated for FSM activities. In particular, the Municipal Ordinance No. 031 of 2001
enacts the Municipal Regulation for Wastewater and Sludge Management in Santa Cruz, explicitly
indicating that households without access to sewerage must rely on alternative systems or services
for containment, emptying and transport of wastewater and sludge. Standards for emptying and
transport services are set out (e.g. types of trucks to be used, health and safety equipment for
workers), while Articles 53, 55 and 57 forbid the disposal of wastewater or sludge in public roads,
natural water bodies or any other unauthorised area. Article 45 also ordains that the wastewater /
sludge producer is “under the obligation of cleaning its septic tank at least once per year”.
In addition, the AAPS Administrative Regulatory Resolution No. 227 of 2010 (i) recognises the
existence of septic tanks, latrines and ecological sanitation in areas where there is no access to
sewerage; (ii) allows EPSAs (i.e. water supply and sanitation service providers) to provide low-cost
FS emptying and transport services (directly or via a third-party) in areas where no sewerage
expansion is planned in the short-run; and (iii) regulates ERTLs (i.e. FS emptying and transport
service providers) to ensure FS is discharged at treatment facilities and they comply with all legal
and environmental standards. Furthermore, the AAPS Administrative Regulatory Resolution No. 546
of 2014 establishes the operational and technical standards under which ERTLs must operate, and
the 2016-20 National Sanitation Plan sets out a wastewater reuse policy.
Despite the existence of a relatively comprehensive policy framework, the roles and responsibilities
of municipal and national institutions remains unclear – indeed, there is limited engagement from
municipal authorities in the provision of water supply and sanitation services, and hence FSM (WSP,
2016). This lack of designated responsibilities directly hinders the operationalisation of the regulatory
mechanisms stipulated in the AAPS resolutions above; the AAPS itself is also known to have limited
capacity to enforce regulations. Another issue with the current regulatory framework are the rules for
formal registration and certification of ERTLs: many of these service providers are family or micro
businesses that are unable to comply with all the requirements, e.g. social security for all employees,
having a designated office space, etc.
The main deficiencies in the enabling environment are related to planning and budgetary allocations:
on one hand, the 2011-2015 Sector Development Plan for Basic Sanitation only considered access
to sewerage for people in urban and peri-urban areas, and although FSM is encompassed in the
policy and legislation described above, there are no specific targets. On the other hand, given the
current limitations for ERTLs to formalise, there are little incentives for FSM investments. Most
resources in urban areas are currently being directed towards the expansion of the sewerage
network and the construction of new wastewater treatment plants, with SAGUAPAC allocating some
resources to increase FS discharge capacity at treatment plants and the AAPS working on improving
regulatory mechanisms.

Fecal Sludge Management in Santa Cruz, Bolivia – Case Study Report
© Oxford Policy Management 34
5.3.2 Developing
The developing environment has to do with the level of expenditure or investments, the degree of
equity, and the quality and quantity of services provided across the FSM chain. Santa Cruz is
currently at a developing stage, with a good range of FS emptying and transport services of decent
quality and with enough capacity to meet current demand.
Despite the existence of several ERTLs, the FS emptying and transport services are offered under
oligopolistic competition (as described in Section 4.2.2), where there is a tacit agreement between
service providers on the price for emptying and transport that allows for higher profits to be made as
compared to purely competitive markets. With these prices, services remain largely unaffordable to
the poorest households, amounting to almost a third of the current minimum wage. The costs for
containment are more aligned with households’ ability to pay – however, the type of OSS facilities
built by the poorest are rarely deemed as effective containment.
Given the above, as well as the prioritisation of investments in sewerage and treatment facilities,
services cannot be deemed equitable, which is one of the areas where Santa Cruz significantly
under-performs. Although the city has made significant investments in improving FS services,
especially with the support of WSP, most of the focus so far has been on the supply side, i. e.
standardising and formalising EPSAs and ERTLs activities. Recent initiatives aimed at increasing
competitiveness across ERTLs (e.g. a call centre for FSM services) may reduce prices and allow for
increased access among the urban poor. However, more emphasis needs to be placed on these
populations, especially with increasing rural-urban migration and urbanisation trends.
Regarding the quantity and quality of the services provided, FSM emptying, transport and treatment
services are generally good, but there are still improvements to be made with regards to the
availability of treatment facilities for FS discharge (currently, ERTLs can only discharge at the main
SAGUAPAC treatment facility), ensuring that all FS emptied is actually transported to a treatment
plant, and also guaranteeing that ERTLs comply with all administrative and technical standards (e.g.
AAPS registration, provision of health and safety equipment, use of adequate trucks and emptying
tools, etc.). There are still no formal services for FS reuse in Santa Cruz, so this is also an area that
requires prioritisation.
5.3.3 Sustaining
The sustaining environment captures the status of operation and maintenance (O&M), the provisions
made for service expansion and the current outcomes with regards to public health and the
percentage of FS that is effectively managed. Overall, the city of Santa Cruz is at a developing stage.
Regarding O&M, although ERTLs do not systematically keep financial records, especially the
smallest firms, both Caceres Magnus (2015) and SNV (2015) show that the majority of ERTLs are
currently making profits after discounting O&M costs. As mentioned in the enabling and developing
sections above, the Municipal Ordinance No. 031 of 2011, all other AAPS regulations, and the
documents drafted with WSP support have set out the norms, standards and sanctions for FS
emptying, transport and treatment services. Although the local environmental authority is in charge
of defining the norms and standards for OSS facilities (i.e. containment), these do not seem to be
available, except for septic tanks and soakaways. There are no specific standards and sanctions for
FS reuse either.
Moreover, reporting for FS emptying, transport and treatment is currently being undertaken for
registered ERTLs, but there is no data for firms that operate in the informal market, nor is there
adequate monitoring of how much FS is effectively contained and the frequency of maintenance of

Fecal Sludge Management in Santa Cruz, Bolivia – Case Study Report
© Oxford Policy Management 35
OSS facilities. The AAPS Administrative Regulatory Resolution No. 546 of 2014 provides some
guidance on the frequency of reporting on to the AAPS, but this is yet to be fully operationalised.
In what concerns FS services expansion, so far no policies and procedures have been developed to
stimulate demand. Although the creation of a call centre for FS emptying and transport services may
encourage demand, especially among low-income households, investments also need to be made
to ensure that containment facilities are adequately built and maintained to ensure the sustainability
of demand. However, government measures for sector development have been taken forwards
through the Technical Assistance provide by WSP for emptying, transport and treatment. Further
efforts are required to ensure these measures are sustainable, e.g. by including specific targets in
national or city-level sanitation plans, and also to strengthen FS containment and reuse sub-sectors.
Finally, performance with regards to service outcomes is relatively good: the percentage of total FS
generated by the city that is managed effectively at containment, emptying and transport stages is
above 50% (as shown in Figure 5), and thus the public health risks at these stages are between low
and medium. Health risks at containment are deemed to be high as some of the OSS facilities are
not built properly, leaching into the surrounding environment, while many other overflow due to poor
maintenance. Risk is deemed at a medium level for emptying as some ERTLs use faulty equipment
and not all personnel is adequately protected.
5.3.4 Implications of the CSDA scorecard
The resulting CSDA scorecard for Santa Cruz suggests that service delivery is poor for the enabling
environment, but developing across the developing and sustaining environments. Indeed, Santa
Cruz has a relatively developed FSM context for Latin America with a comprehensive regulatory
framework for emptying, transport and treatment, as well as 27 operational and formal FS emptying
and transport service providers that seem to be financially sustainable (i.e. current demand allows
firms to cover their O&M expenses and in some cases, make some profit).
Nonetheless, there are several issues that need to be improved. On one hand, although there are
containment standards for rural areas, where OSS is more predominant, there are limited standards
or regulations for containment, which are only existent for septic tanks and soakaways, and are not
necessarily acknowledged. These are key to ensure that FS does not end-up in the surrounding
environment or receiving waters, but also to encourage household demand for FS emptying and
transport services. Efforts should also be made to ensure containment standards are disseminated
across non-sewered areas to increase compliance, especially given the limited capacity for
monitoring and enforcement. A regulatory framework is also required for FS reuse – although there
have been some initiatives directed at regulating wastewater reuse in other cities of Bolivia, there
are no frameworks for FS reuse in urban areas. On the other hand, more capacity (both financially
and with human resources) needs to be given to the AAPS and other local authorities to improve the
enforcement of regulations, especially regarding ERTL formalisation and adequate FS treatment.
Another issue that needs to be addressed is the lack of equity of the current FSM market – the
average cost of a FS emptying and transport service is US $68, which amounts to almost a third of
the Bolivian minimum wage and thus remains unaffordable to the poorest households. Indeed, there
have been reports of some households puncturing their septic tanks to delay fill-up rates. Costs
could be reduced by increasing market competition or providing some sort of cross-subsidy for the
poorest households. Service provision could also be improved by enforcing technical standards for
FS emptying and transport as to minimise health risks for both consumers and suppliers.
Finally, although significant efforts have been made since 2009 with WSP’s support, ways to
maintain political buy-in need to be explored to ensure the FSM sector is also prioritised and focus
Fecal Sludge Management in Santa Cruz, Bolivia – Case Study Report
© Oxford Policy Management 36
is not solely directed towards expanding the sewerage network or building new treatment plants.
Planning and budget allocations need to include FSM to ensure services are sustainable in the
medium- to long-term – this cannot be achieved without a full commitment all relevant stakeholders
(including government, private sector, civil society, etc).

Fecal Sludge Management in Santa Cruz, Bolivia – Case Study Report
© Oxford Policy Management 37
6 Prognosis for Change
6.1 Introduction
This chapter provides a Prognosis for Change (PFC), by considering the positions of various
stakeholders, in particular the institutions and incentives at play. In the sanitation sector, key studies
considering these questions include a multi-country study carried out by WSP with OPM (WSP,
2010) and a series of papers by the Overseas Development Institute (ODI, 2013). In addition,
SANDEC’s recent FSM book includes a chapter on stakeholder analysis, which is a key methodology
for this kind of analysis (Strande et al, 2014). Through this prognosis for change, it is intended to
understand three elements, which are briefly outlined below and in Figure 9.
Firstly, a PFC considers how institutions function. Here, institutions are defined as “the rules and
norms governing human interaction”, rather than a narrower definition of organisations. Institutions
can be formal – such as codified laws, e.g. a by-law about where FS can be legally dumped – and
informal, as is the case of social norms, such as prevailing attitudes towards reusing FS in
agriculture.
Secondly, a PFC considers the incentives which institutions provide to different stakeholders. A
stakeholder is any individual or group with an interest in the outcomes of a policy. In FSM,
stakeholders may include sludge truck companies, the municipality, or poor households.
Stakeholders can be defined broadly or narrowly defined as required by the breadth and depth of
the analysis. For example, the former stakeholders could be narrowed to recent entrants to the
sludge truck market, the planning department of the municipality, or poor female dwellers. This
allows for a more nuanced analysis rather than taking all organisations as homogeneous.
Third, a PFC considers how stakeholders exert influence. Here, influence is defined as the formal or
informal power to cause something or to prevent it from occurring. In FSM, it might be worth
considering municipality by-laws on fecal sludge. A municipality may have formal legal power, but if
all their by-laws are openly flouted by service providers without fear of punishment, then their
influence is very low by that measure. They may however have informal power to influence the FSM
market in other ways, such as the actions undertaken by employees when they identify a blocked
sewer pipe.
Finally, for a PFC to be practically useful, it should also consider the implications of the findings for
effective engagement in a reform or change process. This involves the assessment of the options
for engagement, and weighing them up in the context of the prevalent power dynamics and likely
response of stakeholders.
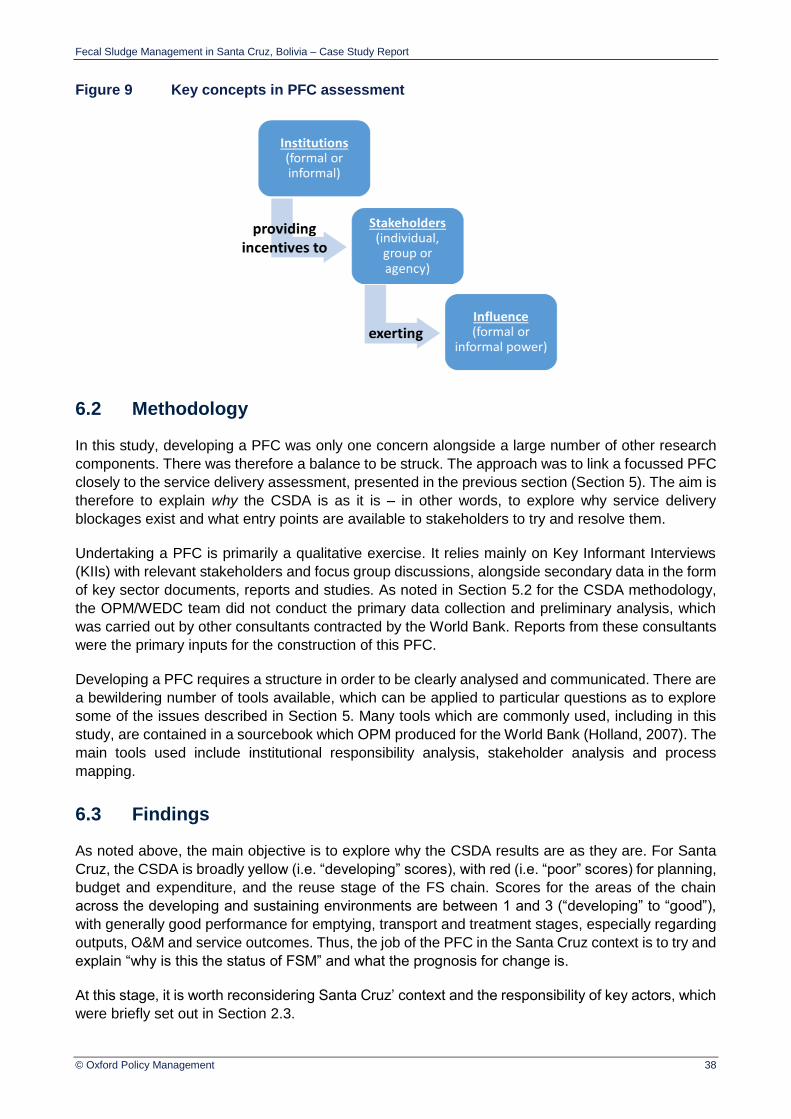
Fecal Sludge Management in Santa Cruz, Bolivia – Case Study Report
© Oxford Policy Management 38
Figure 9 Key concepts in PFC assessment
6.2 Methodology
In this study, developing a PFC was only one concern alongside a large number of other research
components. There was therefore a balance to be struck. The approach was to link a focussed PFC
closely to the service delivery assessment, presented in the previous section (Section 5). The aim is
therefore to explain why the CSDA is as it is – in other words, to explore why service delivery
blockages exist and what entry points are available to stakeholders to try and resolve them.
Undertaking a PFC is primarily a qualitative exercise. It relies mainly on Key Informant Interviews
(KIIs) with relevant stakeholders and focus group discussions, alongside secondary data in the form
of key sector documents, reports and studies. As noted in Section 5.2 for the CSDA methodology,
the OPM/WEDC team did not conduct the primary data collection and preliminary analysis, which
was carried out by other consultants contracted by the World Bank. Reports from these consultants
were the primary inputs for the construction of this PFC.
Developing a PFC requires a structure in order to be clearly analysed and communicated. There are
a bewildering number of tools available, which can be applied to particular questions as to explore
some of the issues described in Section 5. Many tools which are commonly used, including in this
study, are contained in a sourcebook which OPM produced for the World Bank (Holland, 2007). The
main tools used include institutional responsibility analysis, stakeholder analysis and process
mapping.
6.3 Findings
As noted above, the main objective is to explore why the CSDA results are as they are. For Santa
Cruz, the CSDA is broadly yellow (i.e. “developing” scores), with red (i.e. “poor” scores) for planning,
budget and expenditure, and the reuse stage of the FS chain. Scores for the areas of the chain
across the developing and sustaining environments are between 1 and 3 (“developing” to “good”),
with generally good performance for emptying, transport and treatment stages, especially regarding
outputs, O&M and service outcomes. Thus, the job of the PFC in the Santa Cruz context is to try and
explain “why is this the status of FSM” and what the prognosis for change is.
At this stage, it is worth reconsidering Santa Cruz’ context and the responsibility of key actors, which
were briefly set out in Section 2.3.
Fecal Sludge Management in Santa Cruz, Bolivia – Case Study Report
© Oxford Policy Management 39
6.3.1 Santa Cruz’ FSM context
Overall, 49% of households in Santa Cruz are connected to the sewerage network, with the
remaining households using on-site sanitation (46%) or practising open defecation (5%). In addition,
household survey data suggests that, among households using OSS or practising OD, around 69%
have an improved sanitation facility, 22% have a shared facility, and the remaining 9% have an
unimproved facility.
Focussing exclusively on the demand for FSM services, among households using OSS, 27% claim
to empty their tanks / pits, with 95% of them using FS emptying and transport services provided by
ERTLs. Services seem to be mainly used for facilities discharging into a septic tank with soakaway
or a septic tank, with a frequency of 6 months for the majority of septic tanks and between 7 to 12
months for most soakaways – however, the average reported fill-up rate is around 2.5 years for all
types of OSS facilities. Although around 83% of containment facilities have an access point for
emptying, the majority are not properly built (e.g. some household perforate their septic tanks to
reduce the fill-up rate, recent proliferation of lined but bottomless pits) with FS leaching into the
surrounding environment. Considering that around two thirds of the FS collected does not reach a
treatment facility, estimates suggest that in non-sewered areas of Santa Cruz only around 8% of
total FS is effectively managed (see Figure 6).
Santa Cruz has a relatively developed FSM market, with 27 ERTLs formally (i.e. registered)
operating. Previous studies suggest that the price setting occurs under oligopolistic competition, with
ERTLs making higher profits than expected in a purely competitive market. On average, households
pay US $68 per FS emptying and transport service, which amounts to almost a third of the current
Bolivian minimum wage. When asked about FS service satisfaction, 73% of households consider
that prices could be “improved”, suggesting that the cost for FS emptying and transport is indeed too
high for the average household in non-sewered areas.
Although the developing and sustaining environments are both at a developing stage, the enabling
environment remains poor – despite the existence of FSM policy, there are very limited planning and
budgetary arrangements. FSM services remain inequitable (i.e. unaffordable to the very poor) and
without clear governmental support – most of the focus is still on sewerage expansion and the
construction of wastewater treatment plants. Another area that requires further attention is FS reuse:
there is some policy development happening with the support of WSP, but it mainly refers to
wastewater reuse for irrigation with no explicit mention of FS reuse in urban or peri-urban areas.
6.3.2 Mapping institutional responsibilities
The focus of the PFC is on how institutions function, the incentives which those institutions provide
to stakeholders, and how those stakeholders exert influence. It is therefore important to understand
who those stakeholders are, alongside their formal and informal roles. A useful tool to do this is
institutional responsibility mapping, as set out in Table 25 below. Stakeholders have been
categorised by sector (e.g. national or local government, private, etc.), and both their formal
responsibilities (‘what should be happening’) and the reality (‘what actually happens’) in FSM in
Santa Cruz are described. A final column summarises some of the main challenges faced.
The main messages are the following:
Roles and responsibilities across national, departmental and municipal governments may be
clearly defined but are not clearly understood / practiced, with the Ministry of Environment
and Water having limited participation in the design of FSM policies, the Santa Cruz
department also remaining relatively inactive given that services seem to be adequately

Fecal Sludge Management in Santa Cruz, Bolivia – Case Study Report
© Oxford Policy Management 40
provided by the municipalities, and the municipalities subsequently remaining on the margin
and trusting EPSAs to be adequately managing and monitoring ERTLs.
The lack of defined roles and responsibilities for FSM impacts on the availability and
allocation of financial and human resources for FSM both regarding budget and planning but
also for the effective implementation of the regulatory framework. For instance, the AAPS
has limited capacity to support ERTLs in fulfilling all registration and certification requirements
and also ensure that services are adequately provided. The focus on ERTL registration and
certification (which pertains more to the AAPS and the SNI) may also be distracting national,
departmental and municipal governments from broader FSM issues.
Regarding the supply of FSM services, EPSAs have contracted ERTLs for the provision of
FS emptying and transport services, but only SAGUAPAC has adequate facilities for FS
discharge and treatment. This reduces competition among EPSAs and does not allow ERTLs
to comply with environmental standards. Moreover, given the nature of some of the ERTLs
(i.e. small or family-businesses), almost half of them remain unregistered and thus operate
partially or fully in the informal market. Given the limited capacity of the AAPS and SNI to do
effective monitoring, ERTLs sometimes also engage in tax evasion.
On the demand side, households, commercial establishments and the industry / oil
businesses all seem to be paying higher prices than they would otherwise pay in a
competitive market. There are also issues regarding the quality of construction of OSS
facilities (not all of them are emptiable or leach into the surrounding environment) and
awareness of the required frequency of maintenance activities.

Fecal Sludge Management in Santa Cruz, Bolivia – Case Study Report
© Oxford Policy Management 41
Table 25 Institutional responsibility mapping for FSM
Categories Stakeholder Formal role The reality Core challenge
National government
Ministry of Environment and Water (MMAyA) – in particular, the Vice Ministry for Water Supply and Sanitation
Policy design and establishment
Ensure financial resources are allocated to the sanitation sector
Policies and regulations for the design of wastewater treatment plants and the construction of OSS facilities (i.e. septic tanks) for areas with less than 10,000 inhabitants are available. However, the implementation of these regulations has been limited and there are no specific provisions for FS services across the whole chain at a national level
They have had very limited active participation in the design of FSM policy
Limited financial and human capacity
FSM considered a short- to medium term sanitation alternative
Water Supply and Basic Sanitation Supervision and Societal Oversight Authority (AAPS)
Regulate and monitor the provision of emptying, transport and treatment services
Approve tariffs and fees for emptying, transport and treatment of FS
The registration of all ERTLs is currently underway (with 14 out of 27 already registered) but no official monitoring and enforcement of regulations has been implemented
Limited capacity to carry out monitoring and enforcement of regulatory framework
National Tax Service (SNI)
Activity registration and designation of tax identification number to water supply and sanitation service providers (EPSAs) and FS emptying and transport service providers (ERTLs)
Generally, ERTLs that are formally registered comply with tax regulations. However, small, family-businesses and informal firms do not provide receipts / proof of purchase to costumers to avoid taxes. There is limited monitoring from SNI to prevent this from occurring
Limited financial and human resources to carry out proper vigilance
Departmental government
Santa Cruz Government
Ensure the adequate provision of FS emptying, transport and treatment services (only if municipal governments do not have the capacity)
Limited involvement from the departmental government as FSM services seem to be adequately provided by the municipality
Limited financial and human capacity
Prioritisation of other sectors with a focus on expanding the sewerage network vs.
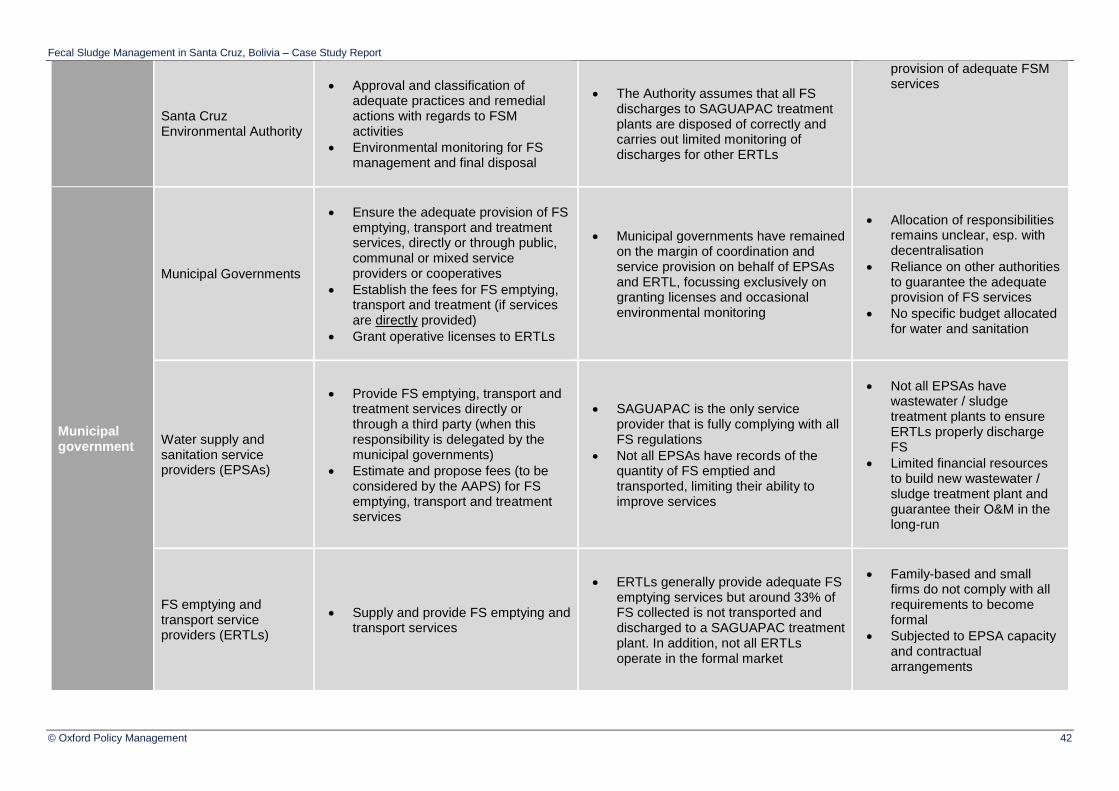
Fecal Sludge Management in Santa Cruz, Bolivia – Case Study Report
© Oxford Policy Management 42
Santa Cruz Environmental Authority
Approval and classification of adequate practices and remedial actions with regards to FSM activities
Environmental monitoring for FS management and final disposal
The Authority assumes that all FS discharges to SAGUAPAC treatment plants are disposed of correctly and carries out limited monitoring of discharges for other ERTLs
provision of adequate FSM services
Municipal government
Municipal Governments
Ensure the adequate provision of FS emptying, transport and treatment services, directly or through public, communal or mixed service providers or cooperatives
Establish the fees for FS emptying, transport and treatment (if services are directly provided)
Grant operative licenses to ERTLs
Municipal governments have remained on the margin of coordination and service provision on behalf of EPSAs and ERTL, focussing exclusively on granting licenses and occasional environmental monitoring
Allocation of responsibilities remains unclear, esp. with decentralisation
Reliance on other authorities to guarantee the adequate provision of FS services
No specific budget allocated for water and sanitation
Water supply and sanitation service providers (EPSAs)
Provide FS emptying, transport and treatment services directly or through a third party (when this responsibility is delegated by the municipal governments)
Estimate and propose fees (to be considered by the AAPS) for FS emptying, transport and treatment services
SAGUAPAC is the only service provider that is fully complying with all FS regulations
Not all EPSAs have records of the quantity of FS emptied and transported, limiting their ability to improve services
Not all EPSAs have wastewater / sludge treatment plants to ensure ERTLs properly discharge FS
Limited financial resources to build new wastewater / sludge treatment plant and guarantee their O&M in the long-run
FS emptying and transport service providers (ERTLs)
Supply and provide FS emptying and transport services
ERTLs generally provide adequate FS emptying services but around 33% of FS collected is not transported and discharged to a SAGUAPAC treatment plant. In addition, not all ERTLs operate in the formal market
Family-based and small firms do not comply with all requirements to become formal
Subjected to EPSA capacity and contractual arrangements
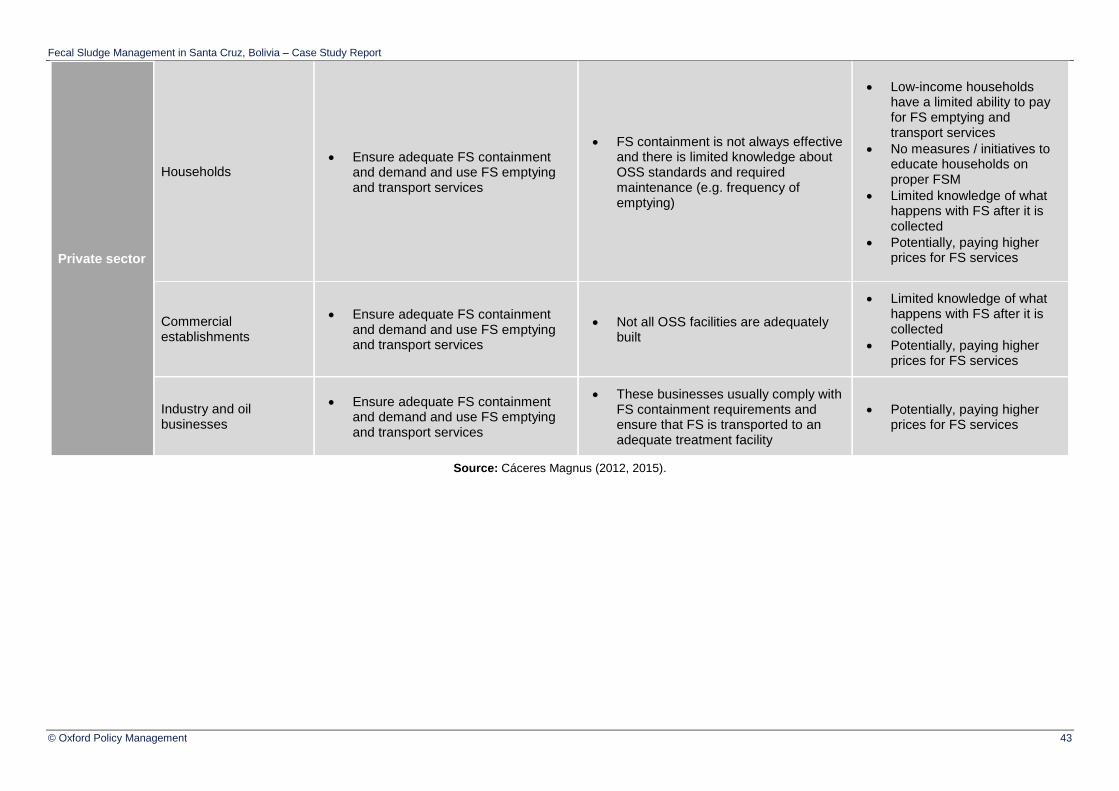
Fecal Sludge Management in Santa Cruz, Bolivia – Case Study Report
© Oxford Policy Management 43
Private sector
Households Ensure adequate FS containment
and demand and use FS emptying and transport services
FS containment is not always effective and there is limited knowledge about OSS standards and required maintenance (e.g. frequency of emptying)
Low-income households have a limited ability to pay for FS emptying and transport services
No measures / initiatives to educate households on proper FSM
Limited knowledge of what happens with FS after it is collected
Potentially, paying higher prices for FS services
Commercial establishments
Ensure adequate FS containment and demand and use FS emptying and transport services
Not all OSS facilities are adequately built
Limited knowledge of what happens with FS after it is collected
Potentially, paying higher prices for FS services
Industry and oil businesses
Ensure adequate FS containment and demand and use FS emptying and transport services
These businesses usually comply with FS containment requirements and ensure that FS is transported to an adequate treatment facility
Potentially, paying higher prices for FS services
Source: Cáceres Magnus (2012, 2015).
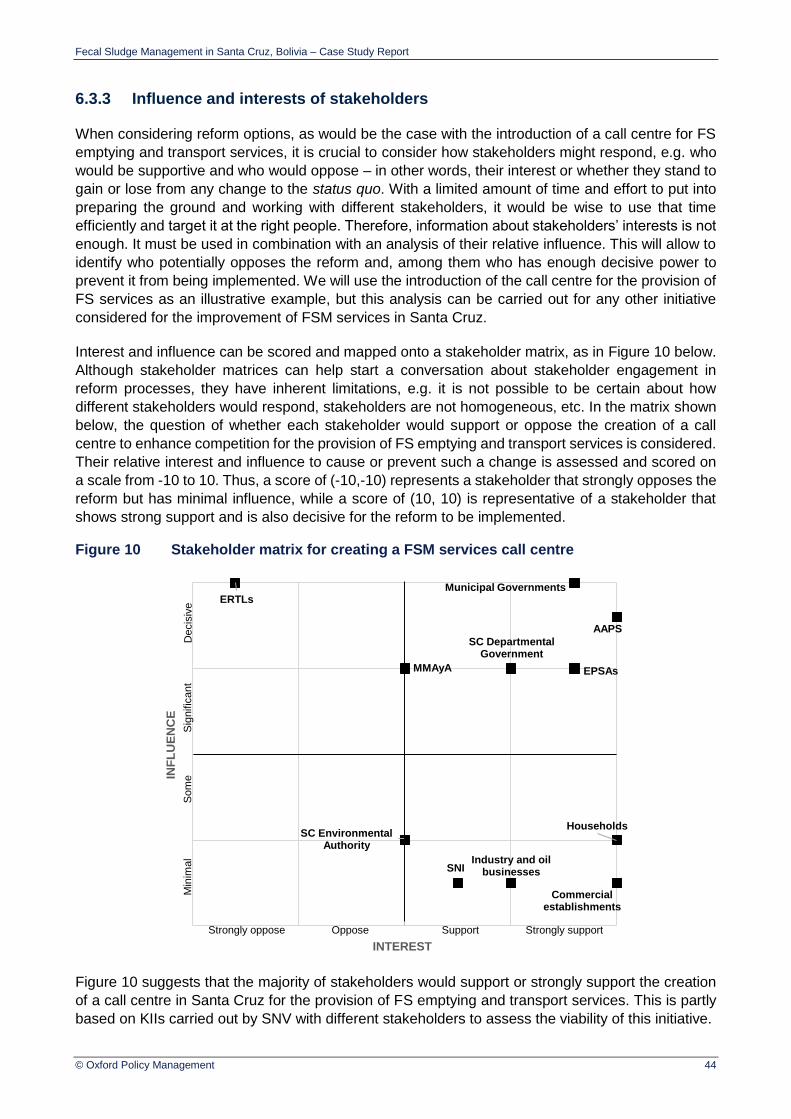
Fecal Sludge Management in Santa Cruz, Bolivia – Case Study Report
© Oxford Policy Management 44
6.3.3 Influence and interests of stakeholders
When considering reform options, as would be the case with the introduction of a call centre for FS
emptying and transport services, it is crucial to consider how stakeholders might respond, e.g. who
would be supportive and who would oppose – in other words, their interest or whether they stand to
gain or lose from any change to the status quo. With a limited amount of time and effort to put into
preparing the ground and working with different stakeholders, it would be wise to use that time
efficiently and target it at the right people. Therefore, information about stakeholders’ interests is not
enough. It must be used in combination with an analysis of their relative influence. This will allow to
identify who potentially opposes the reform and, among them who has enough decisive power to
prevent it from being implemented. We will use the introduction of the call centre for the provision of
FS services as an illustrative example, but this analysis can be carried out for any other initiative
considered for the improvement of FSM services in Santa Cruz.
Interest and influence can be scored and mapped onto a stakeholder matrix, as in Figure 10 below.
Although stakeholder matrices can help start a conversation about stakeholder engagement in
reform processes, they have inherent limitations, e.g. it is not possible to be certain about how
different stakeholders would respond, stakeholders are not homogeneous, etc. In the matrix shown
below, the question of whether each stakeholder would support or oppose the creation of a call
centre to enhance competition for the provision of FS emptying and transport services is considered.
Their relative interest and influence to cause or prevent such a change is assessed and scored on
a scale from -10 to 10. Thus, a score of (-10,-10) represents a stakeholder that strongly opposes the
reform but has minimal influence, while a score of (10, 10) is representative of a stakeholder that
shows strong support and is also decisive for the reform to be implemented.
Figure 10 Stakeholder matrix for creating a FSM services call centre
Figure 10 suggests that the majority of stakeholders would support or strongly support the creation
of a call centre in Santa Cruz for the provision of FS emptying and transport services. This is partly
based on KIIs carried out by SNV with different stakeholders to assess the viability of this initiative.
MMAyA
AAPS
SNI
SC Departmental Government
SC Environmental Authority
Municipal Governments
EPSAs
ERTLs
Households
Commercial establishments
Industry and oil businesses
INF
LU
EN
CE
INTEREST
Strongly oppose SupportOppose Strongly support
Decis
ive
Sig
nific
ant
Min
imal
Som
e
Fecal Sludge Management in Santa Cruz, Bolivia – Case Study Report
© Oxford Policy Management 45
Starting with national level stakeholders, the Ministry of Environment and Water (MMAyA) was
placed in a neutral position with significant influence, given its overview of all the water supply and
sanitation sector, but also its limited involvement in the design and implementation of FSM policies
in urban areas, especially with decentralisation of responsibilities to departmental and municipal
levels. On the contrary, the National Tax Service (SNI) would potentially have minimal influence (as
the call centre would only operate with registered ERTLs), but may display some support as the call
centre would help enforce monitoring and thus reduce tax evasion. Finally, the AAPS, given its
regulatory functions and vigilance over tariffs and prices, as well as its active involvement in the
design and implementation of FSM policies, is deemed to be decisive and also highly supportive as
the call centre would help it fulfil its monitoring obligations by providing key information on the number
of discharges, FS volume treated, FS origin, etc. The AAPS also believes the call centre would
improve the quality of FSM services and would guarantee a fair price to consumers (SNV, 2015).
At the departmental level, the Santa Cruz government could potentially have some significant
influence, given its mandate over municipalities, and would likely support the call centre as it would
contribute to its responsibility of guaranteeing adequate FS emptying, transport and treatment
services. However, the Santa Cruz Environmental Authority is likely to have little influence and take
a neutral position: although the call centre may increase demand and thus the proportion of FS that
is effectively managed, it may also divert more active investments on treatment plants or other
initiatives directly targeted at environmental management.
At the municipal level, local governments are decisive (given their direct mandate over the provision
of water supply and sanitation services) and will strongly support the call centre given the potential
benefits to consumers and also its possibility for enhancing monitoring and enforcement of FSM
policy and regulations. Similarly, the EPSAs will strongly support the creation of the call centre, but
have a lower level of influence. In particular, EPSAs believe that there is likely to be an increase in
demand and thus increased competition and improved price-setting (SNV, 2015). Finally, the ERTLs
will strongly oppose the initiative: they argue that firms are highly heterogeneous in terms of size,
interests and market development capacity, which would difficult price-setting. They would also
distrust the transparency of the call centre in monitoring and allocating FS emptying and transport
services to the cheapest supplier. ERTLs are deemed to be decisive in this case because a call
centre cannot be established or maintained without their full cooperation (Ibid, 2015).
Lastly, with regards to households, commercial establishments and industry, all of them have
minimal or some influence – since households are likely to be the main beneficiaries, a higher level
of influence has been allocated to them. Assuming prices for FS emptying and transport services
are likely to decrease in a context of higher competition between ERTLs, then these stakeholders
would also be supportive of the introduction of a call centre. However, the industry and oil
businesses, given their higher ability to pay, would potentially express more indifference; thus, their
lower level of support.
6.3.4 Illustrating the incentive problem
It is also helpful to consider the problem of poor FSM in Santa Cruz in two dimensions. The first
dimension is static, that is, the way households, service providers and government stakeholders are
currently dealing with OSS and FSM (partly described in Table 25 above). The second dimension is
dynamic – the city is changing both spatially and demographically (e.g. increased migration from
rural areas). In terms of policy, the static problem requires an action that could be implemented
immediately but may have a slow response over time – for example, there may be ways of
persuading households to improve their OSS facilities and carry out maintenance on a frequent
basis. However, the dynamic problem requires long-term involvement and engagement in areas that
are more the domain of urban planning than sanitation policy and practice, e.g. ensuring that rural

Fecal Sludge Management in Santa Cruz, Bolivia – Case Study Report
© Oxford Policy Management 46
migrants settle in adequate areas that allow for the effective provision of water supply and sanitation
services.
A useful tool to illustrate these problems is process mapping. This tool aims to understand the
interaction between formal and informal “steps” in a process and identify entry points for
engagement. Similarly to the stakeholder matrix, it is important to assess the roles of the key
stakeholders in a process, how and where they exert influence, and the incentives they face in both
formal and informal systems.
For this analysis, we have focussed on the process for requesting FS emptying and transport
services when a septic tank fills up. This is shown in Figure 11 below. The central column shows the
formal process that is supposed to be followed by the household, while the right column shows
elements of the informal processes, i.e. what really happens.
Once a septic tank fills up, the household calls an ERTL to request an FS emptying and transport
service. The ERTL should then provide the services, ideally within the day, and transport the FS to
an EPSA treatment facility to ensure effective management. In reality, however, not all septic tanks
are properly built or adequately maintained, making demand more unreliable and also making it more
difficult for ERTLs to provide an adequate service. Once an ERTL is reached, they are not always
readily available and may not be able to provide FSM services in a timely manner. Moreover, even
if the services are provided, these are not necessarily of the highest quality, with some ERTLs not
having adequate or properly maintained equipment. Only around half of ERTLs are currently
registered, with the remaining ones operating in an informal environment and possibly, evading
taxes. Finally, once FS is collected from the household, only 33% is effectively transported and
discharged at a treatment plant, with the remaining FS being discharged in the surrounding
environment or at treatment facility that does not provide effective treatment for FS.
The divergence between formal and informal processes gives rise to different entry points to improve
FSM services. All of these entry points are aligned with some of the deficiencies identified in the
enabling, developing and sustaining environments in the CSDA. First, it would be helpful for
households if there were publicly available standards for the construction of OSS containment
facilities and these were adequately disseminated – enforcement is likely to be more difficult given
that many households are built by informal contractors or families themselves. Second, the AAPS
and EPSAs should continue their efforts to encourage ERTLs formalisation, but efforts should also
be directed towards consumers (e.g. households, commercial establishments, etc.) to encourage
them to request receipts for the services received from ERTLs. Third, to ensure that services are
adequately provided, the administrative and technical standards encompassed in the AAPS
Administrative Regulatory Resolution No. 546 of 2014 should be enforced. Finally, to increase the
proportion of FS that is effectively managed, it is necessary to either invest in the construction of
new wastewater and FS treatment facilities to be managed by other EPSAs besides SAGUAPAC,
or the latter’s wastewater and FS treatment capacity needs to be increased. Flexibility in the
contracts between ERTLs and EPSAs to ensure SAGUAPAC treatment facilities are always used in
the meantime may also improve the effectiveness of FS management.

Fecal Sludge Management in Santa Cruz, Bolivia – Case Study Report
© Oxford Policy Management 47
Figure 11 Process mapping for a septic tank filling up
Entry points Formal Process Informal Process
Develop guidance for the construction and maintenance of
septic tanks and disseminate across non-sewered households
Household septic tank fills
Not all septic tanks are properly built, e.g. no emptying hatch or
leach to the surrounding environment
Enforce ERTL registration, make households aware which are
operating in the formal market and encourage them to request receipts
for FSM services
Household calls an ERTL to request an FS emptying
and transport service
Not all ERTLs are registered or operate in the formal market.
ERTLs are not always available and reliable
Improve enforcement of technical standards for FSM services
ERTL provides FS emptying and transport
service
ERTLs sometimes have to remove break through the floor to reach the septic tank, which is then left open.
Personnel does not have safety equipment and trucks and hoses are sometimes poorly maintained
Support other EPSAs to improve or build WWTPs, expand the capacity
of SAGUAPAC WWTP and encourage EPSAs to make
agreements with SAGUAPAC for FS discharge and treatment
ERTL discharges FS at EPSA treatment facility
Only 33% of ERTLs discharge at SAGUAPAC treatment plants.
There is limited interest on behalf of consumers to ensure FS is dumped
at permitted locations
Process is repeated
6.3.5 Implications for FSM in Santa Cruz
This chapter has explained why the CSDA for Santa Cruz is poor for the enabling environment and
at a developing stage across the developing and sustaining environments. As described in earlier
sections, although the regulatory framework and services are relatively well developed across the
emptying, transport and treatment stages of the FSM chain, a stakeholder mapping analysis reveals
that the roles and responsibilities across different government levels are not clearly understood, with
central/national and departmental governments remaining largely inactive in the design of FSM
policy and provision of services. This is partly explained by the decentralisation of water and
sanitation services in the 90s, which allocated responsibilities to the lowest levels of government in
an attempt to increase government accountability to the electorate, among other concerns. However,
for decentralisation to be effective, financial resources need to be allocated to the sector, and more
specifically, to FSM. This requires more political buy-in for FSM, and subsequently, more active
participation in the design of FSM policies and programmes.
Regarding the actual supply of FSM services, although the contractual arrangements between
EPSAs and ERTLs seem to be operating relatively well, SAGUAPAC is currently the only WSS utility
that can offer adequate treatment for FS. This may reduce competition between EPSAs and also
limits the ability of ERTLs to comply with technical and environmental standards. ERTLs service
provision is also hindered by the existence of very demanding requirements for formalisation as
compared to their average size (e.g. number of employees, emptying trucks, etc.) and nature (e.g.
Fecal Sludge Management in Santa Cruz, Bolivia – Case Study Report
© Oxford Policy Management 48
micro-firms or family businesses). On the demand side, households in non-sewered areas,
especially the very poor, are not familiar or are unable to afford adequate containment options, with
many pits, soakaways and septic tanks leaching into the surrounding environment. Although the law
suggests that septic tanks should be emptied or checked once per year, households do not seem to
be aware of this legislation nor is it enforced.
If a reform to develop or improve FSM was proposed, the stakeholder matrix analysis suggests that,
given the limited involvement in FSM to date from central/national and departmental governments,
they are likely to take a neutral or slightly supportive position, despite them being highly influential
for the implementation of any initiative in the WSS sector. Both the AAPS and the SNI, given their
direct role in the formalisation of ERTLs, are likely to be supportive and decisive/highly influential,
with the likely exception of cases in which revenues collected through formalisation processes are
reduced. At the departmental level, stakeholders are also likely to be supportive, mainly because
reforms to improve FSM would contribute to their responsibility of guaranteeing adequate access to
water and sanitation within the department of Santa Cruz, although potentially less influential than
central-level government institutions. Finally, both municipal stakeholders and consumers
(households, commercial establishments and industry) will likely support all measures to improve
FSM, with the exception of reforms that increase competition among ERTLs, as this will lead to a
reduction in profits and the exit of the most inefficient operators, which may deter some EPSAs and
ERTLs to give their full support. However, all of these stakeholders, on their own, are less decisive,
and they would only be able to drive a reform is some sort of “collective action” is undertaken.
Lastly, a process mapping analysis points to some of the interventions that could be carried out to
improve FSM services. These include: (i) developing standards for OSS containment, which are
publicly accessible and acknowledged by all citizens and government counterparts; (ii) support ERTL
formalisation with consumer education or sanctions if formal service providers are not contracted;
(iii) enforce ERTLs administrative and technical standards; and (iv) increase FS treatment capacity.

Fecal Sludge Management in Santa Cruz, Bolivia – Case Study Report
© Oxford Policy Management 49
7 Conclusions and recommendations
The study has identified several key challenges in ensuring continued provision of safe sanitation
services to all citizens in Santa Cruz. Besides inherent issues related to heightened rural-urban
migration and thus, increased urbanisation, other concerns relate to:
Lack of adequate containment facilities and maintenance – many of the pits / tanks built in
peri-urban areas leach into the surrounding environment. Given a high water table and poor
maintenance on behalf of households, sanitation facilities also tend to overflow. It is mainly
in these “emergency” cases when FS emptying and transport services are demanded. Poor
containment is also reinforced by the lack of or unawareness of construction standards and
guidelines, and insufficient vigilance.
High inequity across the FSM service provision chain – while there are 27 different ERTLs
operating in Santa Cruz, FS emptying and transport services remain unaffordable for the
poorest and most vulnerable households. The cost of adequate sanitation and containment
infrastructure is also high.
No frameworks for FS reuse – although wastewater reuse for irrigation has been explored,
FS reuse has not been considered yet. FS is currently discharged at one of SAGUAPAC’s
treatment plants with other EPSAs not having the capacity or the facilities to receive collected
FS.
Whatever interventions are proposed as a result of detailed, extensive and focused studies to
address these challenges, and recognising that Santa Cruz citizens will need to rely on on-site
sanitation facilities for the next 15-20 years (as sewerage coverage will not grow as fast as the urban
population), the findings of this study recommend:
1. Ensuring adequate infrastructure is available at all stages of the FSM chain, focussing mainly
on containment and treatment. As mentioned in WSP (2016), technical norms and guidelines
for the construction of sanitation, containment and treatment facilities need to be established
and enforced by municipal governments.
2. Procedures and regulations for ERTL formalisation should be more flexible and aligned with
the nature of service providers (i.e. small micro or family businesses), which currently face
significant barriers to meet AAPS and SNI requirements. Besides the direct benefits
perceived by these firms with formalisation, competition will increase as more businesses
become formal, increasing the efficiency and equity of the FSM market.
3. Affordability and access to FS emptying and transport services needs to be guaranteed.
Besides finding ways to increase competition among ERTLs, cross-subsidies or alternative
payment schemes should also be considered to increase access for the poorest and most
vulnerable.
4. Although the FSM market is relatively developed in Santa Cruz, the enabling environment is
still focussed on the provision of sewerage services. FSM is encompassed in policy at
different stages, but with several gaps containment and reuse. However, national or
municipal water and sanitation plans have no targets for FSM components or OSS, and thus,
there are no budget allocations for them either. Public sector institutions are already
struggling to monitor and enforce recent FSM regulations, so more resources (including
personnel) are needed by the sector. Established plans and budgets may also encourage
political buy-in, especially at lower levels of government.
Fecal Sludge Management in Santa Cruz, Bolivia – Case Study Report
© Oxford Policy Management 50
References
AUTORIDAD DE AGUA POTABLE Y SANEAMIENTO (AAPS), Resolución Administrativa
Regulatoria AAPS No. 227 (2010).
AUTORIDAD DE AGUA POTABLE Y SANEAMIENTO (AAPS), Resolución Administrativa
Regulatoria AAPS No. 546 (2014).
CACERES MAGNUS, H. (2012, July). Propuesta para la gestión de lodos fecales en zonas
periurbanas de Bolivia - Informe Final.
CACERES MAGNUS, H. (2015, February). The political economy of fecal sludge management in
the city of Santa Cruz de la Sierra.
CONSEJO MUNICIPAL SANTA CRUZ DE LA SIERRA. Gobierno Municipal de Santa Cruz de la
Sierra - Manual Municipal para la Gestión de Aguas Residuales y Lodos, Ordenanza
Municipal No. 031 (2001).
HERREIRA PATIÑO, V., CUELLAR HERREIRA, Y., & E. TORRES FLORES. (2015, May). Estudio
Etnográfico “Soluciones de saneamiento in situ” - Pautas etnográficas sobre tecnologías de
saneamiento in situ vinculados al servicio de recolección de lodos fecales y servicio de call
center.
HOLLAND, J. (2007). Tools for institutional, political and social analysis of policy reform: A
sourcebook for development practitioners. Washington, D. C: The World Bank.
MINISTERIO DE MEDIO AMBIENTE Y AGUA (MMAyA). (2011, May). Plan Sectorial de Desarrollo
de Saneamiento Básico 2011 - 2015.
PACHECO CIVERA, J. P. (2014, May). Propuesta para la certificación y regularización de empresas
de recolección y transporte de lodos. Ministerio de Medio Ambiente y Agua
(MMAyA)/Autoridad en Fiscalización y Control Social de Agua Potable y Saneamiento
(AAPS).
RIVERA, J. (2010, February). Los servicios de limpieza de cámaras sépticas, recolección y
disposición final de lodos fecales en zonas periurbanas de la ciudad de Santa Cruz (Bolivia).
Water and Sanitation Program (WSP).
ROJAS ORTUSTE, F. (2012, March). Living without Sanitary Sewers in Latin America - The
Business of Collecting Fecal Sludge in Four Latin American Cities. The World Bank.
SNV. (2015a). Informe analítico de los grupos focales.
SNV. (2015b, November). Market research for a septic tank cleaning services’ call centre of the
metropolitan area of Santa Cruz – Final Report.
STRANDE, L., RONTELTAP, M. & D. BRDJANOVIC. (2014). Faecal Sludge Management: Systems
Approach for Implementation and Operation. London, UK: IWA Publishing.
WATER AND SANITATION PROGRAM (WSP). (2014a). The Missing Link in Sanitation Service
Delivery - A Review of Fecal Sludge Management in 12 Cities. International Bank for
Reconstruction and Development / The World Bank.
Fecal Sludge Management in Santa Cruz, Bolivia – Case Study Report
© Oxford Policy Management 51
WATER AND SANITATION PROGRAM (WSP). (2014b). The Missing Link in Sanitation Service
Delivery - A Review of Fecal Sludge Management in 12 Cities. Research Brief.
WATER AND SANITATION PROGRAM (WSP). (2016, January). Bolivia: Strengthening Institutional
Capacity to Improve Wastewater Management in Peri-Urban Areas - Technical Assistance
P132278.
WATER AND SANITATION PROGRAM (WSP), MINISTERIO DE MEDIO AMBIENTE Y AGUA
(MMAyA), & AUTORIDAD DE AGUA POTABLE Y SANEAMIENTO (AAPS). (2013,
November). Guía para la constitución y regularización de empresas de recolección y
transporte de lodos.
WATER AND SANITATION PROGRAM (WSP), MINISTERIO DE MEDIO AMBIENTE Y AGUA
(MMAyA), & AUTORIDAD DE AGUA POTABLE Y SANEAMIENTO (AAPS). (2014a, April).
Guía para la elaboración de procedimientos técnicos y administrativos para descargas de
efluentes industriales, especiales y lodos al alcantarillado sanitario.
WATER AND SANITATION PROGRAM (WSP), MINISTERIO DE MEDIO AMBIENTE Y AGUA
(MMAyA), & AUTORIDAD DE AGUA POTABLE Y SANEAMIENTO (AAPS). (2014b, May).
Propuesta para la certificación y regularización de empresas de recolección y transporte de
lodos.
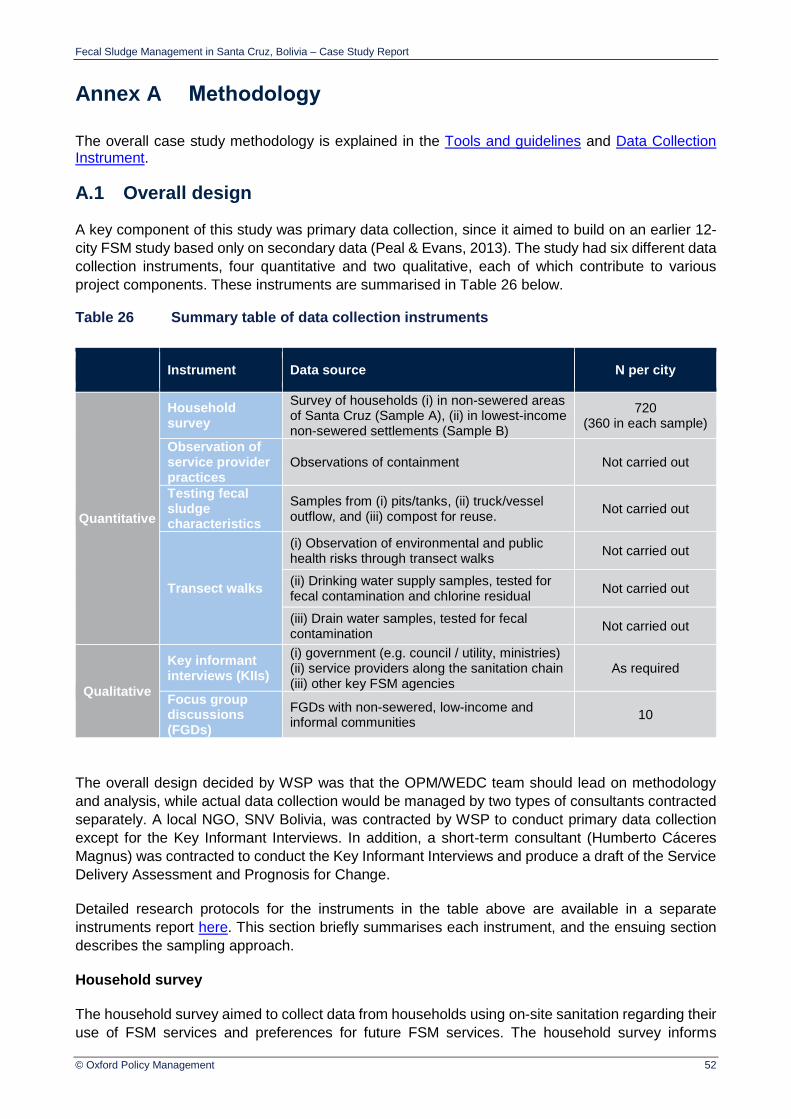
Fecal Sludge Management in Santa Cruz, Bolivia – Case Study Report
© Oxford Policy Management 52
Annex A Methodology
The overall case study methodology is explained in the Tools and guidelines and Data Collection Instrument.
A.1 Overall design
A key component of this study was primary data collection, since it aimed to build on an earlier 12-
city FSM study based only on secondary data (Peal & Evans, 2013). The study had six different data
collection instruments, four quantitative and two qualitative, each of which contribute to various
project components. These instruments are summarised in Table 26 below.
Table 26 Summary table of data collection instruments
Instrument Data source N per city
Quantitative
Household survey
Survey of households (i) in non-sewered areas of Santa Cruz (Sample A), (ii) in lowest-income non-sewered settlements (Sample B)
720 (360 in each sample)
Observation of service provider practices
Observations of containment Not carried out
Testing fecal sludge characteristics
Samples from (i) pits/tanks, (ii) truck/vessel outflow, and (iii) compost for reuse.
Not carried out
Transect walks
(i) Observation of environmental and public health risks through transect walks
Not carried out
(ii) Drinking water supply samples, tested for fecal contamination and chlorine residual
Not carried out
(iii) Drain water samples, tested for fecal contamination
Not carried out
Qualitative
Key informant interviews (KIIs)
(i) government (e.g. council / utility, ministries) (ii) service providers along the sanitation chain (iii) other key FSM agencies
As required
Focus group discussions (FGDs)
FGDs with non-sewered, low-income and informal communities
10
The overall design decided by WSP was that the OPM/WEDC team should lead on methodology
and analysis, while actual data collection would be managed by two types of consultants contracted
separately. A local NGO, SNV Bolivia, was contracted by WSP to conduct primary data collection
except for the Key Informant Interviews. In addition, a short-term consultant (Humberto Cáceres
Magnus) was contracted to conduct the Key Informant Interviews and produce a draft of the Service
Delivery Assessment and Prognosis for Change.
Detailed research protocols for the instruments in the table above are available in a separate
instruments report here. This section briefly summarises each instrument, and the ensuing section
describes the sampling approach.
Household survey
The household survey aimed to collect data from households using on-site sanitation regarding their
use of FSM services and preferences for future FSM services. The household survey informs
Fecal Sludge Management in Santa Cruz, Bolivia – Case Study Report
© Oxford Policy Management 53
multiple components of this research. The sampling was carefully planned so as to allow
representative conclusions to be drawn from households in non-sewered areas of Santa Cruz
Metropolitan Area18, and separate conclusions for lowest-income non-sewered areas19 in particular,
on a purposive basis. Questionnaire sections included a household roster, dwelling characteristics,
use of water and sanitation infrastructure, satisfaction and planning on sanitation, maintenance and
emptying, and interest in the development of a call centre and willingness to pay.
Key informant interviews
Key informant interviews (KIIs) are the way in which primary information was sought to address key
questions about how both the ‘enabling environment’ and the operating environment affects FSM
services (past, current and future). KIIs were held with stakeholders having responsibility or interest
in FSM services at city-level and beyond, allowing the enabling and operating environments to be
better understood in relation to their influence within the city.
Focus group discussions
The objective of focus group discussions (FGDs) with residents of informal settlements was to gather
qualitative data that would complement, validate, or perhaps challenge responses made during the
household survey. Questions focused on obtaining information relating to household sanitation and
FSM practices (particularly identifying the practices of “others”, as individuals are reluctant to talk
honestly about their own, or their families’ practices), service levels, past interventions, risks and
other issues associated with FSM services that affect their community.
A.2 Sampling
A.2.1 Household survey
The main sampling method design was for the household survey, with the sampling approaches for
other instruments using the selected clusters as a basis. Therefore, the household survey is
discussed first, and the remaining instruments are covered afterwards. Overall, it is crucial to
understand that in the sampling, two pictures were being sought: the first to give an understanding
of the situation of households in (1) non-sewered areas of Santa Cruz, and (2) a specific
understanding of the situation in lowest-income areas.
Given that the main purpose of the household survey was to assess the feasibility of creating a call
centre to provide FS emptying and transport services, the study population were households that
rely on on-site sanitation and are not prioritised in any sanitation plan to get access to sewerage in
the short term. There were two sub-sample areas (denoted A and B). Sub-sample A was
representative of non-sewered areas (4,425 eligible households) while sub-sample B focused on the
lowest-income non-sewered households (5,151 eligible households). Sub-sample B is not
representative as households were purposively selected to be able to locate and focus on the most
vulnerable on-site sanitation users. The aim was to get estimates at minimum cost and administrative
burden. Hence, the sample has a relatively small size as compared to what would be necessary for
studies with different objectives (e.g. an evaluation aiming to attribute impact to a specific sanitation
intervention).
18 In the other case country studies, sampling was designed to draw representative conclusions for the city as a whole, and lowest-income non-sewered areas in particular. 19 Lowest-income areas were selected based on an estimated wealth index based on average household assets at the block (i.e. manzana) level.
Fecal Sludge Management in Santa Cruz, Bolivia – Case Study Report
© Oxford Policy Management 54
Sub-samples and sampling units
For sub-sample A, the Primary Sampling Units (PSUs) were blocks or manzanas. For sub-sample
B, households were chosen among the lowest-income blocks (i.e. lowest and second quintiles). The
latter were chosen based on an estimated assets wealth index at the block level – household assets
were averaged across the entire block, and these were then used in the Principal Component
Analysis (PCA) for the estimation of the wealth index. The Secondary Sampling Units (SSUs) were
households using on-site sanitation in both cases.
Sample sizes
To be consistent with other city case studies, the sample size for each sub-sample was 360
households, giving a total number of 720 households surveyed across both sub-samples.
A.2.2 Other instruments
Key informant interviews
The total number of interviews required, as well as the range and extent of questioning, was
influenced by the availability of current and reliable data from other sources, as well as constraints
on time and resources. Selection of interviewees was purposive, based on advice received from
stakeholders and existing knowledge of the World Bank consultant.
Focus group discussions
FGDs were distributed as follows:
2 FGDs were held in public and private institutions (e.g. schools, health facilities, etc.);
2 FGDs were held with high- or medium-level income households that have septic tanks;
2 FGDs were held with low-income households that have septic tanks and use FS emptying
and transport services;
2 FGDs were held with low-income households that have a soakaway or lined pit and carry
out maintenance activities;
1 FGD was held with low-income households who have lined pits (as a temporary sanitation
alternative) and do not use FS emptying and transport services; and
1 FGD was held with low-income households who have an unlined pit and thus do not use
or require FS emptying and transport services.
A.3 Fieldwork implementation
Pretesting, training and piloting
Initial pre-testing was carried out by SNV to refine the instruments –data collection instruments were
piloted in one urban community, excluding those PSUs which were part of the sample.
Field team composition and data collection

Fecal Sludge Management in Santa Cruz, Bolivia – Case Study Report
© Oxford Policy Management 55
For the quantitative survey, field teams were composed by one Supervisor and four Household
Enumerators. An experienced Field Manager was responsible for ensuring overall management,
field implementation and quality assurance.
The field teams collected the majority of the data from the 60 sampled PSUs in 4 weeks during April
2015.
Data entry, cleaning and analysis
The quantitative survey data were entered into SPSS at SNV’s offices in Bolivia, using various data
quality checks, including range checks, skips and internal consistency checks. After data cleaning
checks, data were then transferred into the statistical software Stata. Data were analysed using Stata
in OPM’s offices in Oxford.
A.4 Limitations
This study has two key limitations which need to be considered to understand the strengths and
weaknesses of the data and the conclusions that can and cannot be drawn from the analysis. These
should be considered in the context of the objectives of the study (see Section 1.2 in the main report).
These are:
Socio-economic survey – household surveys with enumerators skilled in social research
can only really ask questions of householders. Although enumerators were trained to observe
and identify different characteristics of sanitation facilities, they cannot always make accurate
technical inspections of the infrastructure, which would require a different skillset. Therefore,
it is necessary to take the household’s responses at face value (e.g. about the destination of
their blackwater).
Sampling method – sample surveys are designed to estimate indicators for a broader
population. Therefore, they cannot produce detailed data for specific neighbourhoods without
dramatically increasing the sample size and appropriate stratification. The sample size for
this study is relatively small compared to what would be necessary for an impact evaluation,
for example. In a similar vein, transect walks aimed to build up a broad picture rather than
specific maps or explanations for individual neighbourhoods. Finally, the study only focuses
on non-sewered residential areas and households of Santa Cruz, excluding sewered
residential areas, and all public establishments and institutions.

Fecal Sludge Management in Santa Cruz, Bolivia – Case Study Report
© Oxford Policy Management 56
Annex B Fecal waste flow matrices
Table 27 Fecal waste flow matrix – city-wide sample (based on primary & secondary data)
Containment Emptying Transport Treatment Overall
% pop. using
of which of which of which of which Safe:
Type of system contained not contained emptied not
emptied transported
not transported
treated not
treated 28%
Sewerage 49% 100% 0% 100% 0% 100% 0% 49% 51%
49% 0% 49% 0% 49% 0% 24% 25% 24%
Septic tank and soakaway – emptiable
35% 100% 0% 30% 70% 33% 67% 100% 0%
35% 0% 10% 25% 3% 7% 3% 0% 3%
Septic tank – emptiable 6% 100% 0% 24% 76% 33% 67% 100% 0%
6% 0% 2% 4% 1% 1% 1% 0% 1%
Cement-lined pit – emptiable 3% 100% 0% 17% 83% 33% 67% 100% 0%
3% 0% 1% 2% 0% 1% 0% 0% 0%
Flush to lined pit – not emptiable 0%
Latrine to lined pit – not emptiable 0%
Latrine to unlined pit – not emptiable 1% 1% 100%
0% 1%
Directly to drain 0.2% 0% 100%
0% 0.2%
Open defecation 5% 0% 100%
0% 5%
Containment 90% Emptying 90% Transport 61% Treatment 53%
Unsafe: 72% 8% 31% 8% 25%

Fecal Sludge Management in Santa Cruz, Bolivia – Case Study Report
© Oxford Policy Management 57
Affected zones
Local area and beyond via drains (amount direct to groundwater not identified)
Local area (via overflowing latrines or dumped FS)
Neighbourhood (via leakage/overflow from sewers or drains)
Receiving waters (via sewer outfall/discharge)
from household survey
from secondary data
de facto value
Table 28 Fecal waste flow matrix – non-sewered sample
Containment Emptying Transport Treatment Overall
% pop. using
of which of which of which of which Safe:
Type of system contained not contained emptied not
emptied transported
not transported
treated not
treated 8%
Sewerage 0%
Septic tank and soakaway – emptiable
60% 100% 0% 30% 70% 33% 67% 100% 0%
60% 0% 18% 42% 6% 12% 6% 0% 6%
Septic tank – emptiable 10% 100% 0% 24% 76% 33% 67% 100% 0%
10% 0% 2% 8% 1% 2% 1% 0% 1%
Cement-lined pit – emptiable 17% 100% 0% 17% 83% 33% 67% 100% 0%
17% 0% 3% 14% 1% 2% 1% 0% 1%
Flush to lined pit – not emptiable 3% 0% 100%
0% 3%
Latrine to lined pit – not emptiable 3% 0% 100%
0% 3%
Latrine to unlined pit – not emptiable 5% 1% 100%
0% 5%
Directly to drain 0%

Fecal Sludge Management in Santa Cruz, Bolivia – Case Study Report
© Oxford Policy Management 58
Open defecation 1% 0% 100%
0% 1%
Containment 71% Emptying 71% Transport 21% Treatment 8%
Unsafe: 92% 12% 64% 16% 0%
Affected zones
Local area and beyond via drains (amount direct to groundwater not identified)
Local area (via overflowing latrines or dumped FS)
Neighbourhood (via leakage/overflow from sewers or drains)
Receiving waters (via sewer outfall/discharge)
from household survey
from secondary data
de facto value

Fecal Sludge Management in Santa Cruz, Bolivia – Case Study Report
© Oxford Policy Management 59
Annex C CSDA scoring table criteria
Sub-question Question
Co
nta
inm
en
t
Em
pty
ing
Tra
ns
po
rt
Tre
atm
en
t
En
d-u
se
/dis
po
sa
l
Indicator/ Score Comments
Enabling:
What are current policies, planning issues and budgetary arrangements?
1. Policy
1.1 Policy: Is FSM
included in an appropriate, acknowledged and available policy document (National/ local or both)?
0.5 0.5 0.5 0.5 0.5
1: policy is appropriate, approved (or in draft form), acknowledged and available
The AAPS Administrative Regulatory Resolution No. 227/2010: (i) recognises the existence of septic tanks, latrines and ecological latrines that are not connected to sewerage; (ii) allows EPSAs to provide alternative FSM services for people relying on OSS solutions - services are to be provided at a low cost to peri-urban dwellers in areas where no sewerage expansion is planned in the short-run; (iii) AAPS will authorise ERTLs to provide services ensuring FS is discharged in EPSA treatment plants; (iv) ERTLs must comply with environmental standards; (v) AAPS will monitor implementation with the support of municipal governments. This is complemented by the AAPS Administrative Regulatory Resolution No. 546/2014, which approves the guidance document developed with WSP support to standardise administrative and technical processes for FS discharge. WSP is also helping GoB to standardise ERTLs registration and certification. The 2016-20 National Sanitation Plan develops a wastewater reuse policy and sets the goal of introducing wastewater irrigation schemes on agricultural land.
0.5: policy is appropriate, approved (or in draft form), but not clearly acknowledged / available
0: policy not available, or inappropriate to the context
1.2 Institutional roles: Are the
institutional roles and responsibilities for FSM service delivery clearly defined and operationalized?
0.5 0 0 0.5 0
1: roles defined and operationalised According to WSP (2016), the roles and responsibilities of public institutions are still unclear. For example, many municipalities are not engaged in the provision of WSS services, despite being formally responsible. // A Wastewater Reuse Joint Commission was created in 2011 to stimulate dialogue and coordination between key WSS and irrigation stakeholders, but it is now losing momentum.
0.5: roles clearly defined but not operationalised, or not-defined by work in practice
0: roles not defined / not operationalised
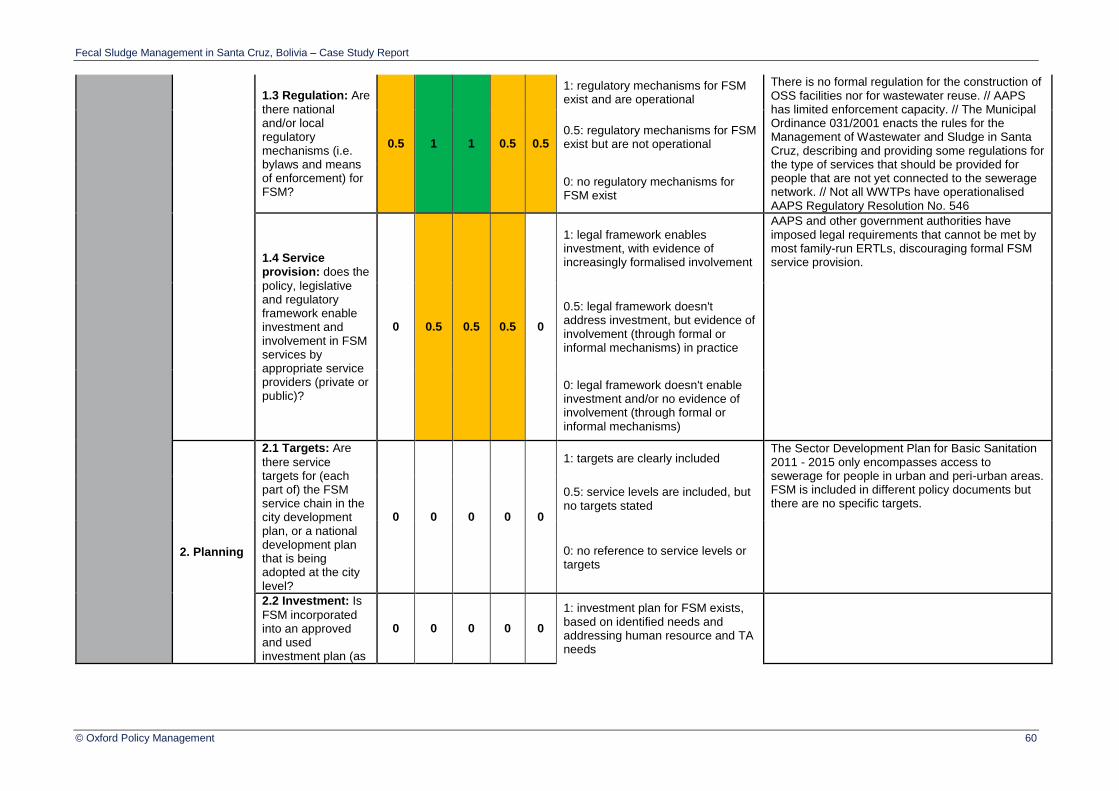
Fecal Sludge Management in Santa Cruz, Bolivia – Case Study Report
© Oxford Policy Management 60
1.3 Regulation: Are
there national and/or local regulatory mechanisms (i.e. bylaws and means of enforcement) for FSM?
0.5 1 1 0.5 0.5
1: regulatory mechanisms for FSM exist and are operational
There is no formal regulation for the construction of OSS facilities nor for wastewater reuse. // AAPS has limited enforcement capacity. // The Municipal Ordinance 031/2001 enacts the rules for the Management of Wastewater and Sludge in Santa Cruz, describing and providing some regulations for the type of services that should be provided for people that are not yet connected to the sewerage network. // Not all WWTPs have operationalised AAPS Regulatory Resolution No. 546
0.5: regulatory mechanisms for FSM exist but are not operational
0: no regulatory mechanisms for FSM exist
1.4 Service provision: does the
policy, legislative and regulatory framework enable investment and involvement in FSM services by appropriate service providers (private or public)?
0 0.5 0.5 0.5 0
1: legal framework enables investment, with evidence of increasingly formalised involvement
AAPS and other government authorities have imposed legal requirements that cannot be met by most family-run ERTLs, discouraging formal FSM service provision.
0.5: legal framework doesn't address investment, but evidence of involvement (through formal or informal mechanisms) in practice
0: legal framework doesn't enable investment and/or no evidence of involvement (through formal or informal mechanisms)
2. Planning
2.1 Targets: Are
there service targets for (each part of) the FSM service chain in the city development plan, or a national development plan that is being adopted at the city level?
0 0 0 0 0
1: targets are clearly included The Sector Development Plan for Basic Sanitation 2011 - 2015 only encompasses access to sewerage for people in urban and peri-urban areas. FSM is included in different policy documents but there are no specific targets.
0.5: service levels are included, but no targets stated
0: no reference to service levels or targets
2.2 Investment: Is
FSM incorporated into an approved and used investment plan (as
0 0 0 0 0
1: investment plan for FSM exists, based on identified needs and addressing human resource and TA needs

Fecal Sludge Management in Santa Cruz, Bolivia – Case Study Report
© Oxford Policy Management 61
part of sanitation) - including ensuring adequate human resources and Technical Assistance? (Ideally a medium term plan, but if not, at least an annual plan)
0.5: investment plan for FSM exists, but does not address human resource or TA needs
0: no investment plan for FSM
3. Budget
3.1 Fund flows:
Does government have a process for coordinating FSM investments (domestic or donor, e.g. national grants, state budgets, donor loans and grants etc.)?
0 0 0 0 0
1: coordination of investments is defined and operationalised
Investment plans seem to be primarily related to expanding the sewerage network and building new treatment plants.
0.5: coordination of investments is defined, but not operationalised
0: no coordination of investments defined
3.2 Adequacy & structure: Are the
annual public financial commitments to FSM commensurate with meeting needs/targets for Capex and Opex (over the coming 5 years)?
0 0 0 0 0
1: annual public financial commitments are sufficient to meet >75% of requirements (estimated need if no targets set)
Some investments on regulatory frameworks and adapting WWTPs for FS discharge.
0.5: annual public financial commitments are sufficient to meet >50% of requirements (estimated need if no targets set)
0: annual public financial commitments insufficient to meet 50% of requirements (estimated need if no targets set)
Developing:
What is the level of expenditure, degree of
4. Capital expenditure
4.1 Capital funding: What is
Capex expenditure per capita on FSM (3 year average)?
0 0 0 0 0
Range of Capex expenditure
(This will be matched to service levels and needs)

Fecal Sludge Management in Santa Cruz, Bolivia – Case Study Report
© Oxford Policy Management 62
equity and level of output?
5. Equity
5.1 Choice: Is there
a range of affordable, appropriate, safe and adaptable technologies for FSM services available to meet the needs of the urban poor?
0.5 0.5 0.5 0.5 0
1: range of technical options exist (i.e. are “offered” formally) and are used by the urban poor
In Santa Cruz, services remain unaffordable to the poorest, with emptying costs amounting to around a third of the minimum wage.
0.5: range of options exist, but are not accessed by the urban poor, or just not used
0: options are not present
5.2 Reducing inequity: Are there
specific and adequate funds, plans and measures to ensure FSM serves all users, and specifically the urban poor?
0 0 0 0 0
1: funds, plans and measures are codified and in use
0.5: funds, plans and measures are codified but not in use
0: no funds, plans and measures codified
6. Outputs
6.1 Quantity / capacity: Is the
capacity of each part of the FSM value chain growing at the pace required to ensure access to FSM meets the needs/demands and targets that protects public and environmental health?
0.5 1 1 0.5 0
1: capacity growing at a pace to meet >75% of the needs/demands and targets to protect health
There is still a segment of the population that practices OD and relies on unimproved facilities. Lack of norms and regulation for pit/tank construction also leads to households having inadequate facilities. // There are not enough WWTP for ERTLs to discharge all the FS collected, encouraging illegal dumping in nearby areas. 0.5: capacity growing at a pace to
achieve >50% of needs/demands and targets to protect health
0: capacity insufficient to meet 50% of the needs/demands and targets to protect health
6.2 Quality: Is the
quality of FSM sufficient to ensure functioning facilities and services that protect against risk through the service chain?
0.5 1 0.5 1 0
1: >75% of services that protect against risk and are functional through the service chain
Not all facilities have hatches for emptying and many households still rely on unimproved facilities. // Not all FS collected is transported to a treatment plant, with a relatively high proportion being dumped illegally. // Not all WWTP operate effectively and provide efficient treatment (only SAGUAPAC's WWTP are reliable).
0.5: >50% of services that protect against risk and are functional through the FSM service chain

Fecal Sludge Management in Santa Cruz, Bolivia – Case Study Report
© Oxford Policy Management 63
0: less than 50% of services that protect against risk and are functional through the FSM service chain
6.3 Reporting: Are
there procedures and processes applied on a regular basis to monitor FSM access and the quality of services and is the information disseminated?
1: regular reporting on both access and quality of FSM services, with information disseminated
EXCLUDED FROM THIS COMPONENT AND INCLUDED AS PART OF 7.2 BASED ON WORKSHOPS HELD IN SANTA CRUZ.
0.5: regular reporting on either access or quality of FSM services (with information disseminated or not)
0: no regular reporting on either access or quality of FSM services
Sustaining:
What is the status of operation and maintenance, what provisions are made for service expansion and what are current service outcomes?
7. O&M
7.1 Cost recovery:
Are O&M costs known and fully met by either cost recovery through user fees and/or local revenue or transfers?
0 1 1 0.5 0
1: O&M costs known and >75% met (through appropriate mechanisms)
ERTLs do not systematically keep financial records, but other studies show that firms are making profits - this is partly explained by the fact that markets are under oligopolistic competition.
0.5: O&M costs known and >50% met
0: O&M costs not known and/or <50% met
7.2 Standards & monitoring: Are
there norms and standards for each part of the FSM value chain that are systematically monitored under a regime of sanctions (penalties)?
0.5 0.5 0.5 1 0
1: norms and standards exist, are monitored and sanctions applied
Both the Municipal Ordinance 031/2001 and the documents drafted through the TA P132278 have set out standards for emptying, transport and treatment FS services.
0.5: norms and standards exist and are monitored, but no sanctions applied
0: norms and standards (if they exist) are not monitored
8. Expansion
8.1 Demand: Has
government (national or city authority) developed any policies and
0 0
1: policies, procedures or programs are being implemented, with resulting demand for services growing and being responded to
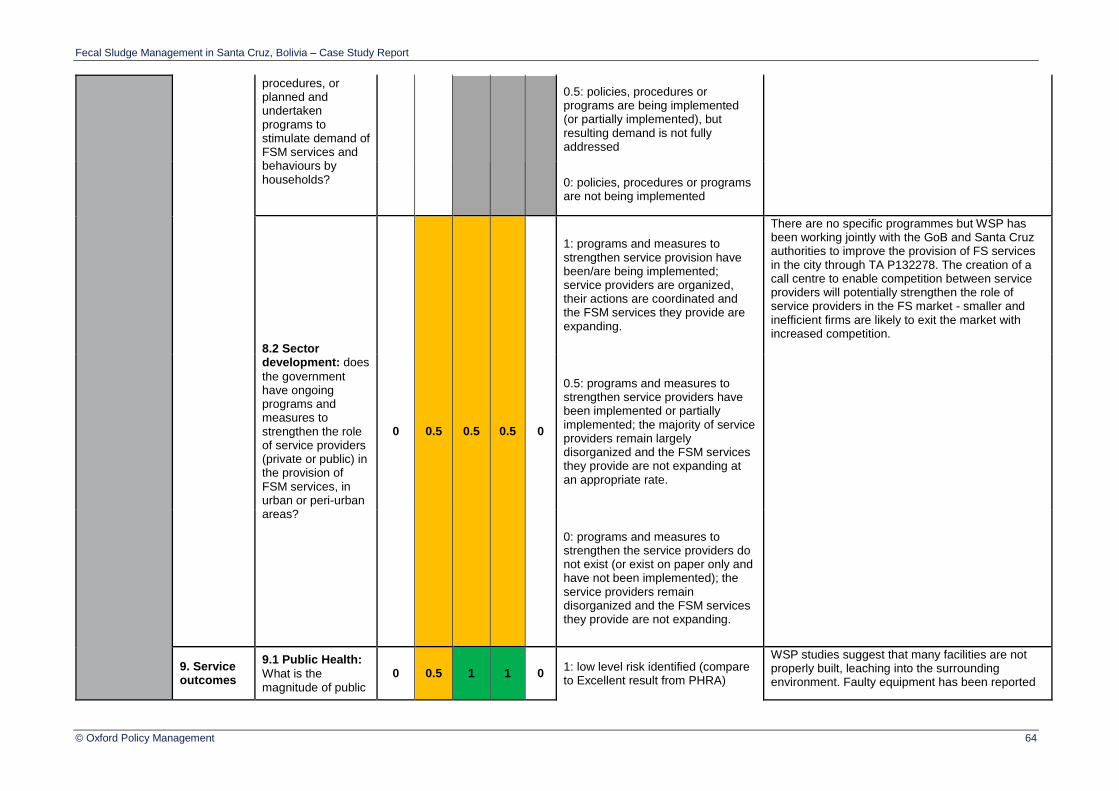
Fecal Sludge Management in Santa Cruz, Bolivia – Case Study Report
© Oxford Policy Management 64
procedures, or planned and undertaken programs to stimulate demand of FSM services and behaviours by households?
0.5: policies, procedures or programs are being implemented (or partially implemented), but resulting demand is not fully addressed
0: policies, procedures or programs are not being implemented
8.2 Sector development: does
the government have ongoing programs and measures to strengthen the role of service providers (private or public) in the provision of FSM services, in urban or peri-urban areas?
0 0.5 0.5 0.5 0
1: programs and measures to strengthen service provision have been/are being implemented; service providers are organized, their actions are coordinated and the FSM services they provide are expanding.
There are no specific programmes but WSP has been working jointly with the GoB and Santa Cruz authorities to improve the provision of FS services in the city through TA P132278. The creation of a call centre to enable competition between service providers will potentially strengthen the role of service providers in the FS market - smaller and inefficient firms are likely to exit the market with increased competition.
0.5: programs and measures to strengthen service providers have been implemented or partially implemented; the majority of service providers remain largely disorganized and the FSM services they provide are not expanding at an appropriate rate.
0: programs and measures to strengthen the service providers do not exist (or exist on paper only and have not been implemented); the service providers remain disorganized and the FSM services they provide are not expanding.
9. Service outcomes
9.1 Public Health:
What is the magnitude of public
0 0.5 1 1 0 1: low level risk identified (compare to Excellent result from PHRA)
WSP studies suggest that many facilities are not properly built, leaching into the surrounding environment. Faulty equipment has been reported
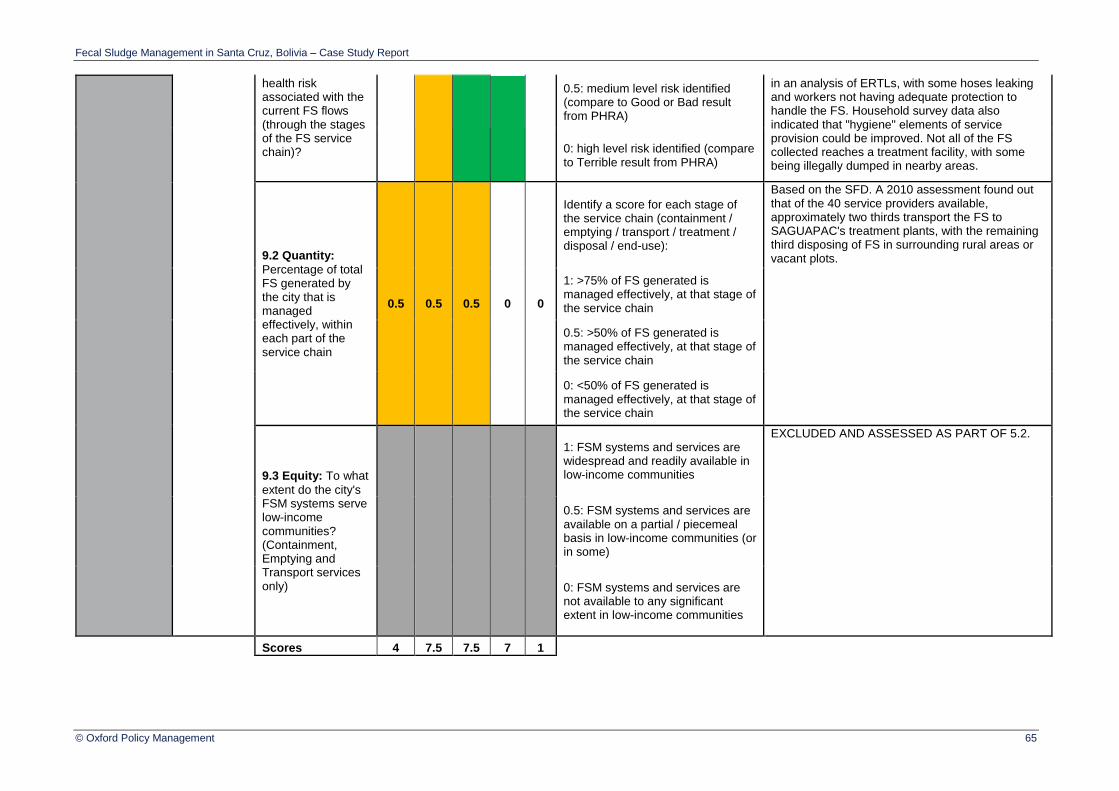
Fecal Sludge Management in Santa Cruz, Bolivia – Case Study Report
© Oxford Policy Management 65
health risk associated with the current FS flows (through the stages of the FS service chain)?
0.5: medium level risk identified (compare to Good or Bad result from PHRA)
in an analysis of ERTLs, with some hoses leaking and workers not having adequate protection to handle the FS. Household survey data also indicated that "hygiene" elements of service provision could be improved. Not all of the FS collected reaches a treatment facility, with some being illegally dumped in nearby areas.
0: high level risk identified (compare to Terrible result from PHRA)
9.2 Quantity:
Percentage of total FS generated by the city that is managed effectively, within each part of the service chain
0.5 0.5 0.5 0 0
Identify a score for each stage of the service chain (containment / emptying / transport / treatment / disposal / end-use):
Based on the SFD. A 2010 assessment found out that of the 40 service providers available, approximately two thirds transport the FS to SAGUAPAC's treatment plants, with the remaining third disposing of FS in surrounding rural areas or vacant plots.
1: >75% of FS generated is managed effectively, at that stage of the service chain
0.5: >50% of FS generated is managed effectively, at that stage of the service chain
0: <50% of FS generated is managed effectively, at that stage of the service chain
9.3 Equity: To what
extent do the city's FSM systems serve low-income communities? (Containment, Emptying and Transport services only)
1: FSM systems and services are widespread and readily available in low-income communities
EXCLUDED AND ASSESSED AS PART OF 5.2.
0.5: FSM systems and services are available on a partial / piecemeal basis in low-income communities (or in some)
0: FSM systems and services are not available to any significant extent in low-income communities
Scores 4 7.5 7.5 7 1


