A cognitive architecture-based model of expert graph comprehension David Peebles University of Huddersfield July, 2013 David Peebles (University of Huddersfield) Graph Comprehension CogSci Berlin, 2013 1 / 11
Transcript
A cognitive architecture-based modelof expert graph comprehension
David Peebles
University of Huddersfield
July, 2013
David Peebles (University of Huddersfield) Graph Comprehension CogSci Berlin, 2013 1 / 11
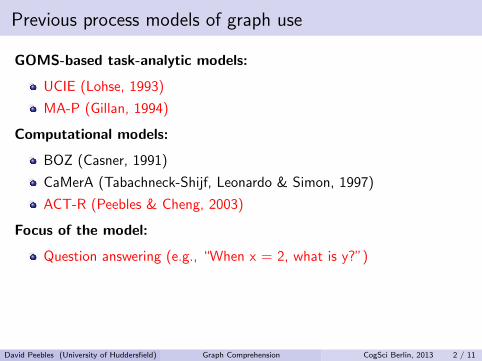
Previous process models of graph use
GOMS-based task-analytic models:
UCIE (Lohse, 1993)
MA-P (Gillan, 1994)
Computational models:
BOZ (Casner, 1991)
CaMerA (Tabachneck-Shijf, Leonardo & Simon, 1997)
ACT-R (Peebles & Cheng, 2003)
Focus of the model:
Question answering (e.g., “When x = 2, what is y?”)
Automated graph design based on task specification
Multiple representations in expert problem solving
None of the above address graph comprehension
David Peebles (University of Huddersfield) Graph Comprehension CogSci Berlin, 2013 2 / 11
Graph comprehension
Initial familiarisation stage priorto other tasks involving:
Identification & classificationof variables into IV(s) and DVAssociation of variables withaxes and representationalfeatures (e.g., colours, shapes,line styles)Identification ofrelationship(s) depicted
May be an end in itself or aprerequisite for other tasks
David Peebles (University of Huddersfield) Graph Comprehension CogSci Berlin, 2013 3 / 11
Interaction graphs
Low High
10
20
30
40
50
60
70
80
90
100
Percent Error as a function of Experience and Time of Day
Per
cent
Err
or
Experience
Time of Day
Day
Night
Students more likely tomisinterpret (Zacks & Tversky,1999) or inadequately interpretline graphs (Peebles & Ali,2009, Ali & Peebles, 2013)
Low High
10
20
30
40
50
60
70
80
90
100
●
●
Percent Error as a function of Experience and Time of Day
Per
cent
Err
or
Experience
Time of Day
Day
Night
Line graphs better at depictingcommon relationships forexperts (Kosslyn, 2006)
Interpretation facilitated byrecognition of familiar patterns
David Peebles (University of Huddersfield) Graph Comprehension CogSci Berlin, 2013 4 / 11
An example expert verbal protocol
High Low
0
25
50
75
100
125
150
175
200
225
250
●
●
●
●
Glucose Uptake as a function of Fasting and Relaxation Training
Glu
cose
Upt
ake
Fasting
Relaxation Training
Yes
No
1 (Reads) “Glucose uptake as a functionof fasting and relaxation training”
2 Alright, so we have. . . you’re eitherfasting or you’re not. . .
3 You have relaxation training or youdon’t. . .
4 And so. . . not fasting. . . er. . .
5 So there’s a big effect of fasting. . .
6 Very little glucose uptake when you’renot fasting. . .
7 And lots of glucose uptake when youare fasting. . .
8 And a comparatively small effect ofrelaxation training. . .
9 That actually interacts with fasting.
David Peebles (University of Huddersfield) Graph Comprehension CogSci Berlin, 2013 5 / 11
The ACT-R cognitive architecture
Elements of the architecture:
Hybrid architecture with symbolic and subsymbolic componentsProduction system model of procedural memory & cognitive controlSemantic network model of declarative memoryActivation-based learning, memory retrieval & forgetting mechanismsSimulated eyes & hands for interacting with computer-based tasks
Value for diagrammatic reasoning research:
Allows modelling of complex tasks with graphical elementsImposes valuable cognitive constraints on models
David Peebles (University of Huddersfield) Graph Comprehension CogSci Berlin, 2013 6 / 11
The ACT-R cognitive architecture
Elements of the graph comprehension model:
Prior graph knowledge (general and specific) required
Information extracted and knowledge structures generated
Sequence of cognitive & perceptual operations involved
Strategic processes that control comprehension
Behavioural output to be compared with human data:
Sequence of propositions to compare with expert verbal protocols
Scan paths to compare with expert eye movements
David Peebles (University of Huddersfield) Graph Comprehension CogSci Berlin, 2013 7 / 11
Stages of comprehension
Comprehension proceeds in the following order:
1 Read title. Identify variable names and create declarative chunks.
2 Seek variable labels, identify what they are by their location and ifrequired, associate with label levels
3 Associate variable levels with indicators (position or colour)
4 Look at plot region and attempt to interpret distances. If a highlysalient pattern exists (e.g., cross, large gap) process that first
Individual production rule for each patternNo production rule then pattern not processed
5 Continue until no more patterns are recognised
David Peebles (University of Huddersfield) Graph Comprehension CogSci Berlin, 2013 8 / 11
An example model protocol
Artificial Natural
0
5
10
15
20
25
30
35
40
45
50
●
●
●
●
Chick Weight as a function of Diet and Hormone Supplement
Chi
ck W
eigh
t
Diet
Hormone Supplement
MPE
GCE
text at top of display. . .[chickweight] [= variable][as] [a] [function] [of] [diet] [= variable][and] [hormonesupplement] [= variable]
text at bottom of display. . .[diet] at [bottom] [= IV]look to nearest text. . .[natural] is a level of [diet][natural] is [right][artificial] is a level of [diet][artificial] is [left]
text at far right of display. . .[hormonesupplement] at [far-right] [= IV]look to nearest text. . .[mpe] is a level of [hormonesupplement][gce] is a level of [hormonesupplement]
David Peebles (University of Huddersfield) Graph Comprehension CogSci Berlin, 2013 9 / 11
An example model protocol
Artificial Natural
0
5
10
15
20
25
30
35
40
45
50
●
●
●
●
Chick Weight as a function of Diet and Hormone Supplement
Chi
ck W
eigh
t
Diet
Hormone Supplement
MPE
GCE
objects in plot region. . .a [green] [line]no memory for [green] look to legend. . .[green] [rectangle]. look for nearest text. . .[green] represents [gce][blue] [rectangle]. look for nearest text. . .[blue] represents [mpe]
text at far left of display. . .[chickweight] at [far-left] [= DV]


![[Alexander Von Humboldt] Letters of Alexander Von Humboldt](https://static.documents.pub/doc/80x56/577c79791a28abe05492c6ea/alexander-von-humboldt-letters-of-alexander-von-humboldt.jpg)


