40
DID DOLLARS FOLLOW STRATEGY? ANALYSIS OF THE 2020 DEFENSE BUDGET REQUEST TRAVIS SHARP

DID DOLLARS FOLLOW STRATEGY?
ANALYSIS OF THE 2020 DEFENSE BUDGET REQUEST
TRAVIS SHARP


DID DOLLARS FOLLOW STRATEGY?
ANALYSIS OF THE 2020 DEFENSE BUDGET REQUEST
TRAVIS SHARP
2019

The Center for Strategic and Budgetary Assessments is an independent, nonpartisan policy research institute established to promote innovative thinking and debate about national security strategy and investment options. CSBA’s analysis focuses on key questions related to existing and emerging threats to U.S. national security, and its goal is to enable policymakers to make informed decisions on matters of strategy, security policy, and resource allocation.
ABOUT THE CENTER FOR STRATEGIC AND BUDGETARY ASSESSMENTS (CSBA)
©2019 Center for Strategic and Budgetary Assessments. All rights reserved.

ABOUT THE AUTHOR
Travis Sharp is a Research Fellow at the Center for Strategic and Budgetary Assessments. He directs the budget program and works to educate and inform policymakers, senior leaders, and the general public about the defense budget and issues pertaining to resourcing national security. He also serves as an officer in the U.S. Navy Reserve while completing his Ph.D. in security studies at Princeton University’s Woodrow Wilson School of Public and International Affairs. Travis has held positions with academic and policy organizations, including George Washington University’s Institute for Security and Conflict Studies, West Point’s Modern War Institute, the Office of the Secretary of Defense, the Center for a New American Security, and the Center for Arms Control and Non-Proliferation. He has published think tank monographs, journal articles, and commentaries on defense spending and strategy, cybersecurity, and military-to-military contacts between great power rivals, the topic of his dissertation. Mr. Sharp is a past recipient of the Sasakawa Young Leaders Fellowship, the A.B. Krongard and John Parker Compton Fellowships at Princeton, the 1LT Bacevich Fellowship at CNAS, the Harold Rosenthal Fellowship in International Relations, and the Herbert Scoville Peace Fellowship.

This report is the 35th in a series of annual budget analyses published since 1983 by CSBA and its predecessor organization, the Defense Budget Project. The author wishes to begin this report, his first contribution to the series, by thanking his predecessors, including Gordon Adams, Steven Kosiak, Todd Harrison, and Katherine Blakeley, for establishing a tradition of excellence. For feed-back on earlier drafts, he thanks John-Michael Arnold, John Speed Meyers, Kyle Libby, Billy Fabian, Evan Braden Montgomery, and Thomas G. Mahnken. Special thanks go to Kamilla Gunzinger for editing and designing the report. The analysis and findings presented here are solely the responsi-bility of the author. CSBA receives funding from a broad and diverse group of contributors, including private foundations, government agencies, and corporations. A complete list of these organizations can be found on our website at www.csbaonline.org/about/contributors.
Cover: U.S. Marines disembark a Landing Craft, Utility during a tactics exercise for BALTOPS, an annual joint, multinational maritime-focused exercise, on June 10, 2019. U.S. Marine photo by Lance Cpl. Antonio Garcia.
ACKNOWLEDGMENTS

ContentsEXECUTIVE SUMMARY . . . . . . . . . . . . . . . . . . . . . . . . . . . . . . . . . . . . . . . . . . . . . . . . . . . . . . . . . . . . . . . . . . I
FY 2020 DEFENSE BUDGET REQUEST OVERVIEW . . . . . . . . . . . . . . . . . . . . . . . . . . . . . . . . . . . . . . . . . . . .1
Sizing Up Defense Spending Under Trump . . . . . . . . . . . . . . . . . . . . . . . . . . . . . . . . . . . . . 2
Conclusion . . . . . . . . . . . . . . . . . . . . . . . . . . . . . . . . . . . . . . . . . . . . . . . . . . . . . . . . . . . 6
DID DOLLARS FOLLOW STRATEGY? THREE DIAGNOSTIC TESTS . . . . . . . . . . . . . . . . . . . . . . . . . . . . . . . . .7
The Case for Diagnostic Tests . . . . . . . . . . . . . . . . . . . . . . . . . . . . . . . . . . . . . . . . . . . . . 8
Findings in Brief . . . . . . . . . . . . . . . . . . . . . . . . . . . . . . . . . . . . . . . . . . . . . . . . . . . . . . . 9
Topline Test: Real Growth in the Base Budget . . . . . . . . . . . . . . . . . . . . . . . . . . . . . . . . . 10
Scenarios Test: Dividing Dollars among Force Planning Priorities . . . . . . . . . . . . . . . . . . . . 12
Winners Test: Ranking Shifts in Spending Shares . . . . . . . . . . . . . . . . . . . . . . . . . . . . . . . 17
CONCLUSION . . . . . . . . . . . . . . . . . . . . . . . . . . . . . . . . . . . . . . . . . . . . . . . . . . . . . . . . . . . . . . . . . . . . . . . . 25
FIGURES
FIGURE 1: NATIONAL DEFENSE DISCRETIONARY BUDGET AUTHORITY, FY10 TO FY24 . . . . . . . . . . . . . .3
FIGURE 2: ANNUAL REAL GROWTH RATES IN DOD TOTAL OBLIGATIONAL AUTHORITY BY PRESIDENTIAL YEAR, FY 1949 TO FY 2020 . . . . . . . . . . . . . . . . . . . . . . . . . . . . . . . . . . . . . . . . . .5
TABLES
TABLE 1: NATIONAL DEFENSE DISCRETIONARY BUDGET AUTHORITY IN PRESIDENT’S BUDGET REQUEST, FY19 TO FY24 . . . . . . . . . . . . . . . . . . . . . . . . . . . . . . . . . . . . . . . . .2
TABLE 2: MAJOR FORCE PROGRAM SHARES OF DOD TOTAL OBLIGATIONAL AUTHORITY, FY16 VS. FY20 . . . . . . . . . . . . . . . . . . . . . . . . . . . . . . . . . . . . . .19
TABLE 3: CUMULATIVE YEAR-TO-YEAR SHIFTS IN MAJOR FORCE PROGRAM SHARES OF DOD TOTAL OBLIGATIONAL AUTHORITY, FY16 TO FY20 . . . . . . .20
TABLE 4: MISSION AREA SHARES OF INVESTMENT DISCRETIONARY BUDGET AUTHORITY, FY16 VS. FY20 . . . . . . . . . . . . . . . . . . . . . . . . . . . . . . . . . . . .22
TABLE 5: CUMULATIVE YEAR-TO-YEAR SHIFTS IN MISSION AREA SHARES OF INVESTMENT DISCRETIONARY BUDGET AUTHORITY, FY16 TO FY20 . . . . . . . . . . . . . . . . . . . . . . . . . .23

www.csbaonline.org i
Executive SummaryThe fiscal year (FY) 2020 national defense budget would continue the spending increases that have become a hallmark of President Trump’s tenure in office, although those increases appear to be ending. If Congress approves $738 billion in FY 2020 national defense spending, the amount agreed to by the White House and congressional leaders in a deal unveiled July 22, that budget would increase national defense spending in real terms for the fifth consec-utive year, a buildup stretching back to the President Obama years. Yet, the budget deal provides only $740.5 billion for national defense in FY 2021, a 1.6 percent cut in real terms relative to the deal’s FY 2020 level. The budget deal thus ends the real growth in national defense spending that has prevailed each year since FY 2016.
A $738 billion FY 2020 national defense budget would provide the Department of Defense (DoD) with less inflation-adjusted total obligational authority than it received annually from FY 2007 to FY 2012, a period featuring intense combat operations in Afghanistan and Iraq. The president’s oft-repeated claim that the defense budget has reached unprecedented highs is therefore inaccurate.1 That being said, a $738 billion FY 2020 budget would grant DoD more inflation-adjusted funding than it received annually during the Korean War, the Vietnam War, and the Reagan buildup. At that size, the FY 2020 budget will stand as the largest peacetime defense budget since World War II—though “peacetime” might not accurately describe today’s situation.
During Trump’s tenure in office from FY 2017 to FY 2020, DoD’s base budget has received about $160 billion more in nominal terms than called for under Obama’s final budget, assuming Congress appropriates a $640 billion FY 2020 base budget. Trump stands to become only the fourth president—after Truman, Reagan, and George W. Bush—to attain positive real growth in DoD total obligational authority in each of his first three annual budgets, assuming FY 2020 spending comports with the new budget deal.
1 The White House, “Remarks by President Trump at the Salute to Service Dinner,” July 3, 2018, available at https://www.whitehouse.gov/briefings-statements/remarks-president-trump-salute-service-dinner/.
www.csbaonline.org i

ii CSBA | DID DOLLARS FOLLOW STRATEGY?
The defense budget’s size matters because it affects the strength of the U.S. military, the severity of the U.S. deficit, and the standing of U.S. leadership at home and abroad. Yet, how DoD allocates funds across programs also matters greatly. Chapter 2 develops and admin-isters three new diagnostic tests to determine whether the FY 2020 defense budget request aligns with the 2018 National Defense Strategy (NDS). Analysts can apply these tests to future strategies and budgets. The tests specify what traits the FY 2020 request should exhibit if DoD embraced the NDS:
• Topline Test: If dollars followed strategy, then the FY 2020 base budget request should have increased by 3 to 5 percent in real terms compared to the FY 2019 enacted level.
• Scenarios Test: If dollars followed strategy, then the FY 2020 request should have divided DoD funds in accordance with the force planning scenarios that the NDS prioritized.
• Winners Test: If dollars followed strategy, then the FY 2020 request should have enlarged the shares of DoD’s total spending devoted to priority NDS mission areas.
Chapter 2 concludes that the FY 2020 DoD request passes the topline and scenarios tests but fails the winners test. Measured as proportional shares of DoD’s total budget, winners in the FY 2020 request included general purpose forces, research and development, and space systems. Those investments reflect the emphasis of the NDS on military competition against China and Russia. Yet the request also featured other winners, including support of other nations, special operations forces, and munitions, especially replenishing munitions expended against violent extremist organizations. The fact that those activities won indicates that DoD continues to prioritize the Middle East and counterterrorism operations despite the direction of the NDS to reduce, although not abandon, efforts in those areas.
Passing two out of three tests demonstrates that the FY 2020 request is not the major failure declaimed by some analysts. However, the request also falls short of fully supporting the NDS, meaning a strategy-resource gap will exist for the foreseeable future. Eliminating the gap is impractical since ambitions inevitably exceed abilities. Policymakers instead should decide how much risk associated with the gap they can tolerate and allocate future defense funds accordingly.

www.csbaonline.org 1
CHAPTER 1
FY 2020 Defense Budget Request Overview The FY 2020 national defense budget would continue the spending increases that have become a hallmark of the President Trump era, although those increases appear to be ending. The president’s budget released in March requested $750 billion for national defense, a catchall category including the DoD base budget, DoD overseas contingency operations (OCO) funding, Department of Energy nuclear weapons activities funding, and budgets for other non-DoD defense programs. At $718 billion, DoD’s portion of the defense request was 2.8 percent larger in real terms than what it received last year (see Table 1).
On July 22, the White House and congressional leaders announced a deal to increase the Budget Control Act (BCA) caps, which would have mandated lower discretionary spending levels starting with the new fiscal year in October. Under the deal, national defense spending in FY 2020 and FY 2021 shall not exceed $738 billion and $740.5 billion, respectively.2 A $738 billion FY 2020 budget represents about 1 percent real growth relative to FY 2019 enacted spending. That growth rate generally matches the historical average when the United States is not fighting a full-scale war and has divided government.3 If Congress approves a $738 billion FY 2020 topline, that budget would increase national defense spending in real terms for the fifth consecutive year, a buildup stretching back to the President Obama years (see Figure 1).4 Yet a $740.5 billion FY 2021 budget represents a 1.6 percent cut in real terms relative to
2 John M. Donnelly, “Analysis: Parties Agree on Another Epic Defense Budget,” Congressional Quarterly, July 22, 2019.
3 Author’s analysis of Office of the Under Secretary of Defense (OUSD) (Comptroller), National Defense Budget Estimates for FY 2020, green book (Washington, DC: DoD, May 2019), Table 6-1, pp. 80–86, available at https://comptroller.defense.gov/Portals/45/Documents/defbudget/fy2020/FY20_Green_Book.pdf.
4 Office of Management and Budget (OMB), Historical Tables, Budget of the United States Government, Fiscal Year 2020 (Washington, DC: Government Publishing Office, March 2019), Table 5.6, pp. 120–121, available at https://www.whitehouse.gov/wp-content/uploads/2019/03/hist-fy2020.pdf.

2 CSBA | DID DOLLARS FOLLOW STRATEGY?
the deal’s $738 billion FY 2020 level. The deal thus ends the real growth in national defense spending that has prevailed each year since FY 2016.
The budget deal effectively locks in national defense spending for the next two years, barring any future changes necessitated by unforeseen military requirements. It establishes the context for debating defense spending during the 2020 presidential campaigns. It also ends the BCA’s decade-long reign over discretionary spending, opening a new chapter in U.S. budget policy.
TABLE 1: NATIONAL DEFENSE DISCRETIONARY BUDGET AUTHORITY IN PRESIDENT’S BUDGET REQUEST, FY19 TO FY24
In billions nominal $. Totals might not add due to rounding. Adjusted for inflation using OMB deflator. Data from OUSD(C), National Defense Budget Estimates for FY 2020, Table 1-2, pp. 7–9. FY 2021 OCO and OCO-to-base figures are from OUSD(C), CFO, Defense Budget Overview, p. 1-4. *In FY 2019, budget authority decreased in real terms but total obligational authority increased. That accounts for the seeming contradiction between Table 1 and the “fifth consecutive year” claim in the text.
Sizing Up Defense Spending Under Trump
A $738 billion FY 2020 national defense budget would provide DoD with less inflation-adjusted total obligational authority than it received annually from FY 2007 to FY 2012, a period featuring intense combat operations in Afghanistan and Iraq.5 Describing the current budget as historic, unprecedented, or “most amount ever [sic]” is therefore inaccurate.6
That being said, a $738 billion FY 2020 budget would grant DoD more inflation-adjusted funding than it received annually during the Korean War, the Vietnam War, and the Reagan buildup.7 At that size, the FY 2020 budget will stand as the largest peacetime U.S. defense
5 This assertion assumes no major discrepancies when budget authority is converted to total obligational authority. OUSD(C), National Defense Budget Estimates for FY 2020, Table 6-1, pp. 85–86.
6 “Remarks by President Trump at the Salute to Service Dinner.”
7 OUSD(C), National Defense Budget Estimates for FY 2020, Table 6-1, pp. 80–86.
FY 19 enacted
FY 20 requested
FY 21 projected
FY 22 projected
FY 23 projected
FY 24 projected
Base budget 616 545 558 707 722 737
OCO 69 66 62 20 20 10
Base-to-OCO na 98 94 na na na
Emergency na 9 na na na na
Subtotal DoD (051) 685 718 713 727 742 747
Atomic energy defense activities 22 23 24 24 25 25
Defense-related activities 9 8 9 9 12 12
Subtotal National Defense (050) 716 750 746 760 778 784
DoD nominal growth (%) 2.1 4.8 -0.7 2.0 2.1 0.7
DoD real growth (%) -0.1* 2.8 -2.7 -0.3 -0.2 -1.5

www.csbaonline.org 3
budget since World War II—though “peacetime” might not accurately describe today’s situa-tion in which the United States supports over 20,000 American troops and 30,000 American and foreign contractors serving in Afghanistan, Iraq, Syria, and elsewhere.8 If today does qualify as peacetime, then Trump has topped Reagan as DoD’s most generous peacetime bene-factor, though analysts might debate whether Trump or Reagan allocated defense resources with greater consideration for strategy.
FIGURE 1: NATIONAL DEFENSE DISCRETIONARY BUDGET AUTHORITY, FY10 TO FY24
In billions constant FY 2020 $. Adjusted for inflation using OMB deflator. Data from OMB, Historical Tables, Table 5.6, pp. 120–121; and OUSD(C), National Defense Budget Estimates for FY 2020, Table 2-1, pp. 21–22.
8 Office of the Under Secretary of Defense (OSD)(Comptroller), Chief Financial Officer (CFO), Department of Defense Fiscal Year 2020 Budget Request: Defense Budget Overview (Washington, DC: DoD, March 2019), p. 6-4; Congressional Research Service (CRS), Armed Conflict in Syria: Overview and U.S. Response (Washington, DC: CRS, March 25, 2019), p. 6, available at https://fas.org/sgp/crs/mideast/RL33487.pdf; and CRS, Department of Defense Contractor and Troop Levels in Afghanistan and Iraq: 2007–2018 (Washington, DC: CRS, May 10, 2019), pp. 8, 14, available at https://fas.org/sgp/crs/natsec/R44116.pdf.
0
250
500
750
2010 2011 2012 2013 2014 2015 2016 2017 2018 2019 2020 2021 2022 2023 2024
projected OCO
Republican FY 2020 mark: $750b
Democratic FY 2020 mark: $733b
old BCA capsenacted OCO
projected national defense
enacted national defense new BCA caps

4 CSBA | DID DOLLARS FOLLOW STRATEGY?
During Trump’s tenure in office from FY 2017 to FY 2020, DoD’s base budget has received about $160 billion more in nominal terms than called for under President Obama’s final budget, assuming Congress appropriates a FY 2020 base budget of about $640 billion.9 Congress played an essential role adding those funds, not least by modifying the BCA several times. Regardless of whether the White House or Congress bears more responsibility, however, executive and legislative actions have combined to produce a significant defense budget buildup under the Trump administration.
One novel way to evaluate Trump’s legacy is to compare how defense spending real growth rates have changed under different presidential administrations. Growth rates offer a fairer criterion for evaluating policy change than absolute spending levels because each new presi-dent inherits their predecessor’s budget.10 Since presidents do not all start with the same-sized budget, they do not all have the same opportunity to reach historic highs or lows. As a prac-tical matter, presidents rarely oversee truly dramatic swings in defense spending on their own.11 Most big spenders, from Reagan to George W. Bush, have built on the increases initi-ated by their outgoing predecessors, from Carter to Clinton.
Figure 2 shows how DoD real growth rates under Trump compare to presidents since Truman. After normalizing the spending level inherited by each administration, the chart shows how budgets evolved under each president. From year to year, a rising line indicates a real increase, whereas a falling line indicates a real decrease. Lines located in the green shaded area above 0 percent indicate aggregate budget buildups. Lines in the beige shaded area below 0 percent represent aggregate drawdowns.
The varying trajectories contextualize Trump’s achievements in three ways. First, the epithet “historic” should apply to one president and one president only since World War II: Harry S. Truman. The growth rates he oversaw while fighting the Korean War and implementing NSC-68 are literally off the chart. Second, Trump is only the fourth president—after Truman, Reagan, and George W. Bush—to attain positive real growth in each of his first three budgets, assuming FY 2020 spending comports with the new budget deal. Trump’s growth rates track most closely with Kennedy’s, except in Kennedy’s third and final year in which the rate declined, whereas Trump is on track to achieve another increase. Third, although absolute
9 The president’s FY 2020 request included $31 billion for non-DoD defense activities and $66 billion for OCO. Subtracting that $97 billion from the budget deal’s $738 billion national defense topline results in a FY 2020 DoD base budget of $641 billion. Total nominal dollars added since FY 2017 would be larger if one included a portion of the supplemental appropriations added to OCO in FY 2017. The calculation uses base funding, not total DoD funding, because DoD does not forecast OCO for the outyears, making it impractical to establish a counterfactual for the Obama baseline. OUSD(C), CFO, Department of Defense Fiscal Year 2017 Budget Request: Defense Budget Overview (Washington, DC: DoD, February 2016), p. 1-5, available at https://comptroller.defense.gov/Portals/45/Documents/defbudget/fy2017/FY2017_Budget_Request_Overview_Book.pdf; and OUSD(C), National Defense Budget Estimates for FY 2020, Table 2-1, p. 22.
10 Travis Sharp, President Trump’s 2019 Defense Budget: Where Does It Really Rank, Historically? (West Point, NY: Modern War Institute, April 27, 2018), available at https://mwi.usma.edu/president-trumps-2019-defense-budget-really-rank-historically/.
11 Travis Sharp, “Wars, Presidents, and Punctuated Equilibriums in US Defense Spending,” Policy Sciences 52, no. 3, September 2019, pp. 367–396, available at https://doi.org/10.1007/s11077-019-09349-z.

www.csbaonline.org 5
spending levels under Trump have topped those under Reagan, Reagan’s annual growth rates were larger, steadier, and lasted throughout his first term, despite the Democrats’ control of the House of Representatives the entire time and the absence of a “hot war” to justify major spending increases.12 Regardless of whether one views Reagan’s buildup favorably, one should recognize that it altered the status quo dramatically—probably more dramatically than the Trump-era budget buildup since 2017.
FIGURE 2: ANNUAL REAL GROWTH RATES IN DOD TOTAL OBLIGATIONAL AUTHORITY BY PRESIDENTIAL YEAR, FY 1949 TO FY 2020
Percentage change calculated from constant FY 2020 $. Includes base budget and OCO funding. Data from OUSD(C), National Defense Budget Estimates for FY 2020, Table 6-1, pp. 80–86. For FY 2020 the analysis assumes a DoD topline of $707 billion consistent with the budget deal. The periodization starts two fiscal years after presidents are first elected to reflect when they gained control of the budget. For example, President Trump won the election in November 2016 and submitted his first full budget—for fiscal year 2018—six months later. Truman and LBJ complicate this method because each assumed office after his predecessor died and maintained his predecessor’s policies for some time. In Truman’s case, the peri-odization follows his 1948 election to show how he changed things after winning without FDR on the ballot. Using budget authority versus total obli-gational authority does not change the substantive results with respect to the relative positions of the presidents.
12 This assertion is not meant to ignore the military operations that occurred during the Reagan administration, including the missions in the Sinai, Lebanon, Grenada, Germany, Japan, Korea, and the United Kingdom, among others. The horrific 1983 Beirut barracks bombing remind us that U.S. troops faced hardships and made sacrifices.
0 1 2 3 4 5 6 7 8
0%
20%
40%
60%
-20%
Drawdowns
Year of Presidential Administration
Buildups
FordKennedy
Carter
Johnson
Bush I
Nixon
Truman post-1948 (off the chart . . . literally)
Bush II
Reagan
Clinton
Obama
Eisenhower

6 CSBA | DID DOLLARS FOLLOW STRATEGY?
Conclusion
The size of the defense budget matters because it affects the strength of the U.S. military, the severity of the U.S. deficit, and the standing of U.S. leadership at home and abroad. Yet, how DoD allocates funds across programs also matters greatly, even though it often receives less attention than the topline. Understanding how DoD divides its budget pie has motivated CSBA’s defense budget research for 35 years and remains a central concern today. Properly evaluating the FY 2020 budget requires assessing whether the dollars requested align with the strategy selected. Chapter 2 performs that task by running a series of diagnostic tests on the 2020 budget request.

www.csbaonline.org 7
CHAPTER 2
Did Dollars Follow Strategy? Three Diagnostic TestsThe U.S. defense budget contains so many programs that the thoughtful analyst suffers from choice overload. Selecting what to study feels impossible, like picking what to watch on Netflix or what to eat at Cheesecake Factory. Thankfully, the choice is easier for analysts concerned with force planning—the art and science of determining what military capabilities, forces, and posture are most appropriate for a nation.13 Dutiful force planners eyeing a new budget concentrate on one question: Do the resources requested align with the strategy selected? The question cuts to the heart of the matter by asking whether the military has what it might need to protect the nation.
This year, the force planner’s question has become popular. Informed observers are debating whether the 2020 defense budget aligns with the NDS.14 Four factors explain the surge of interest. First, adopting a new strategy historically spurs questions about budgetary implica-tions, and this year marks the NDS’s turn under the microscope.15 Second, the NDS clearly articulated that great power competition should guide the budget, providing a rubric for evaluating the 2020 request. Third, the Trump administration set above-average expecta-tions, thus attracting above-average attention. Former Deputy Defense Secretary Patrick Shanahan pledged the 2020 budget would be a “masterpiece” that consummated DoD’s efforts
13 The definition comes from David Ochmanek’s syllabus at Georgetown University. For more insight, see David Ochmanek, Improving Force Development Within the U.S. Department of Defense: Diagnosis and Potential Prescriptions (Santa Monica, CA: RAND Corporation, July 2018).
14 Paul Sonne, “Pentagon Takes Aim at China and Russia in Proposed $750 Billion Budget,” Washington Post, March 12, 2019.
15 In 1969, abandoning the two-and-a-half war strategy spurred interest in the budgetary impact. “Overruns: Laird Figures Cost at $16 Billion and Going Higher,” Newark Star-Ledger, December 2, 1969.

8 CSBA | DID DOLLARS FOLLOW STRATEGY?
to implement the NDS.16 Before leaving office he said, “Every line of our FY 2020 request is designed to implement our Strategy.”17 Fourth, prominent defense policy elites from both parties support the NDS and care whether the budget sustains it.18 Since elite agreement does not equal infallibility, additional critique of the NDS would prove beneficial. Still, greater consensus among policy elites exists about the NDS than other defense issues, stimulating greater interest in the budget.
The Case for Diagnostic Tests
Despite the surge of interest, no blueprint exists for determining whether resources match strategy. Perhaps the best techniques involve using wargaming, combat modeling, or related analytical methods to assess how the programmed U.S. force fares against an adver-sary force in a plausible conflict scenario. Though useful, these techniques have limitations. Assumptions, methods, and participants influence the outcome, but those nuanced details can get overlooked when discussing the result. Classification compounds the challenge by restricting what decision makers can say publicly. Wargaming and combat modeling are often labor intensive and technically complex, limiting their scalability and accessibility to non-specialists. In sum, existing techniques provide great insight but should not be the only tools for assessing whether resources align with strategy.
Beyond these existing techniques, the defense policy community has developed few widely accepted methods for identifying a strategy-resources mismatch.19 Lacking any common meth-odology, assessments often reflect the analyst’s preferences. From year to year and budget to budget, certain types of analysts always seem to reach certain conclusions. Analysts from research institutions that support higher defense spending argue that the budget underfunds the strategy and thus the budget should grow.20 Analysts from institutions that oppose higher defense spending argue that the strategy outstrips the budget and thus the strategy should
16 Aaron Mehta, “Pentagon Expects On-Time Budget for 2019 but Trump’s ‘Masterpiece’ Will Be in 2020,” Defense News, December 22, 2017.
17 Patrick Shanahan, testimony before the Senate Armed Services Committee, March 14, 2019, p. 17, available at https://www.armed-services.senate.gov/imo/media/doc/Shanahan_03-14-19.pdf.
18 Elbridge Colby and James Miller, “Is the Pentagon Truly Committed to the National Defense Strategy?” Defense One, March 12, 2019.
19 Government Accountability Office (GAO), Defense Strategy: Revised Analytic Approach Needed to Support Force Structure Decision-Making (Washington, DC: GAO, March 2019).
20 Rick Berger and Mackenzie Eaglen, “‘Hard Choices’ and Strategic Insolvency: Where the National Defense Strategy Falls Short,” War on the Rocks, May 16, 2019.

www.csbaonline.org 9
shrink.21 Analysts aligned with one of the military services argue that both the strategy and budget underemphasize their service’s unique capabilities.22
These varying perspectives enrich the debate by illuminating potential misalignments between strategy and resources. The perspectives play the same vital role in policy that theories play in scholarship: They help organize and interpret the infinite number of facts relevant to a given subject. What the perspectives generally do not provide, however, is any objective sense of whether DoD is doing relatively better or worse aligning resources with strategy. The defense policy community would benefit from developing a few diagnostic tests that perform this func-tion. To avoid the limitations of wargaming and combat modeling, the tests should strive for transparency, replicability, and simplicity. They should primarily use budgetary data, saving information on force levels, kill probabilities, and logistics requirements for more complex applications. Ideally, any congressional staffer, journalist, or concerned citizen should be able to apply them using off-the-shelf data and Microsoft Excel.
Findings in Brief
This chapter administers three diagnostic tests to determine whether the FY 2020 defense budget request aligns with the NDS: the topline test, the scenarios test, and the winners test. Analysts can apply the tests to future strategies and budgets. To be clear, the tests do not judge the NDS’s quality or the budget’s size independently of each other. Instead, the tests more narrowly assess the degree of alignment between the NDS and the budget. Put differently, the tests take the NDS as a given and focus on its observable implications in spending terms. The question then becomes, if DoD has embraced the NDS then what outcomes should we observe in the FY 2020 request? Observing those outcomes increases confidence that DoD has aligned resources with strategy. Not observing them, in contrast, decreases confidence.
The chapter finds that the FY 2020 request passed the topline test and the scenarios test, at least as far as unclassified assessment can discern. In contrast, the request failed the winners test. Passing two out of three tests establishes that the FY 2020 request is not the “major failure” declaimed by some analysts with scant empirical support.23 However, the request also falls short of fully supporting the NDS, meaning a strategy-resource gap will exist for the fore-seeable future.
21 Lawrence J. Korb, What the FY 2020 Defense Budget Gets Wrong (Washington, DC: Center for American Progress, April 29, 2019).
22 David Deptula and Doug Birkey, “Mitchell Weighs In: More F-35s or New, Old F-15s?” Breaking Defense, March 4, 2019; and Sam J. Tangredi, “Running Silent and Algorithmic: The U.S. Navy Strategic Vision in 2019,” Naval War College Review 72, no. 2, Spring 2019, pp. 135–171.
23 Anthony H. Cordesman, The FY2020 Defense Budget Request and the Need for a Real “Strategy Driven Budget” (Washington, DC: Center for Strategic and International Studies, March 27, 2019), p. 2.

10 CSBA | DID DOLLARS FOLLOW STRATEGY?
Topline Test: Real Growth in the Base Budget
Test: If dollars followed strategy, then the FY 2020 base budget request should have increased by 3 to 5 percent in real terms compared to the FY 2019 enacted level.
Result: Passed (in spirit)
Assessment: In 2017, former Defense Secretary Jim Mattis and Chairman of the Joint Chiefs of Staff General Joseph Dunford told Congress that DoD’s base budget required 3 to 5 percent real growth each year to compete effectively against China and Russia.24 In 2018, the congres-sionally mandated NDS Commission endorsed the 3–5 percent benchmark, describing it as “indicative of the level of investment needed to meet the ends the NDS establishes.”25
The FY 2020 base and base-to-OCO requests, which together equal $643 billion, propose 2.4 percent real growth, falling short of the benchmark. The budget deal agreed to by the White House and congressional leaders in July likely will set the base budget around $640 billion, also falling short of the mark. However, the math works out such that if FY 2020 base spending were $647 billion, then real growth would meet the 3 percent threshold. DoD’s OCO budget assuredly contains at least a few billion that could reside in the base budget but instead went into OCO to evade the BCA caps. The FY 2020 base budget request thus falls short of the 3 percent benchmark because DoD prefers slipping base funds into OCO, not because DoD underfunded the base budget. Given these circumstances, the FY 2020 request passes the topline test, at least in spirit.
When rearranging a few billion in a $718 billion budget determines whether dollars followed strategy, one must question the validity of the underlying test. The 3–5 percent benchmark is useful for some things but not for others, as the NDS commissioners have emphasized.26 On the plus side, the benchmark helps DoD outpace the pernicious effects of internal cost growth without invoking the problem’s esoteric details, which leave most members of Congress bored to tears (see “The Cost Growth Problem”). On the minus side, the benchmark does not illumi-nate whether DoD has allocated its dollars wisely and conveys an artificially precise notion of DoD requirements. President Eisenhower described this limitation best:
Words like “essential” and “indispensable” and “absolute minimum” become the common coin of the realm—and they are spent with wild abandon. One military man will argue hotly for a given number of aircraft as the “absolute minimum” . . . and others will earnestly advocate the “indispensable” needs for ships or tanks or rockets or guided missiles or artillery—all totaled in
24 Aaron Mehta, “DoD Needs 3–5 Percent Annual Growth through 2023, Top Officials Say,” Defense News, June 13, 2017.
25 NDS Commission, Providing for the Common Defense: The Assessment and Recommendations of the National Defense Strategy Commission (Washington, DC: United States Institute of Peace, 2018), p. xii.
26 Tony Bertuca, “A Tale of Two—Or Three—Toplines Emerges as Budget Battle Consumes Defense Bill,” Inside Defense, June 14, 2019.

www.csbaonline.org 11
numbers that are always called “minimum.” All such views are argued with vigor and tenacity. But obviously all cannot be right.27
Three to five percent real growth will not markedly improve U.S. security if the extra money goes toward capabilities that are irrelevant to plausible conflicts involving likely adversaries. Judging whether dollars followed strategy requires digging deeper.
The Cost Growth Problem
The purchasing power of the U.S. defense budget continues to decline due to cost growth in multiple spending accounts, including military personnel, operation and maintenance, and procurement. The cost growth problem emanates from complex causes and defies easy solu-tions.28 Until it is fixed, if it ever is, DoD essentially needs real growth to maintain the current force, let alone field a bigger or upgraded force. DoD could cut the current force to eliminate the need for real growth, but that solution would only suffice temporarily. Eventually, cost growth in the scaled-down force would require another round of cuts, unleashing a cuts → cost growth → cuts spiral. That dynamic inspired aerospace executive Norman Augustine’s tongue-in-cheek forecast of cost growth’s long-term impact: “In the year 2054, the entire defense budget will purchase just one aircraft. The aircraft will have to be shared by the Air Force and Navy, 3.5 days each per week except for leap year, when it will be made available to the Marines for the extra day.”29 Augustine almost had it right: Surely the Marine Corps of 2054 will convince Congress to pass a law requiring that the Marines use the aircraft 56 hours per week—the exact same amount as their Air Force and Navy brethren.
27 Charles J. Hitch and Roland N. McKean, The Economics of Defense in the Nuclear Age (Cambridge, MA: Harvard University Press, 1960), p. 48.
28 Todd Harrison, Defense Modernization Plans through the 2020s: Addressing the Bow Wave (Washington, DC: Center for Strategic and International Studies, January 2016); and Congressional Budget Office (CBO), Analysis of the Long-Term Costs of the Administration’s Goals for the Military (Washington, DC: CBO, December 4, 2017).
29 Norman R. Augustine, Augustine’s Laws (New York: Viking, 1986), p. 143.

12 CSBA | DID DOLLARS FOLLOW STRATEGY?
Scenarios Test: Dividing Dollars among Force Planning Priorities
Test: If dollars followed strategy, then the FY 2020 request should have divided DoD funds in accordance with the force planning scenarios that the NDS prioritized
Result: Passed (as best we can tell)
Assessment: The NDS adopted a “2+3” framework to guide DoD’s force planning. As General Dunford explained to Congress, the framework designates China and Russia as the two primary priorities along with North Korea, Iran, and violent extremism as the three secondary priorities.30 Shanahan testified to Congress that the FY 2020 budget reflects the 2+3 framework.31 But is that true, and how can we tell?
Dividing spending by force planning scenario is tricky. A U.S. aircraft carrier operating in the Western Pacific might simultaneously perform tasks related to deterring China, Russia, and North Korea. Its mobility allows it to fight different adversaries in different locations without being tied to a single conflict scenario. How then should we divvy up the carrier’s cost by force planning priority? Should we assume one third per adversary? Should we survey the crew to determine how they spent their time? The methodological challenges involved here are enor-mous, particularly for unclassified research.32
30 Joseph F. Dunford Jr., testimony before the House Armed Services Committee, March 26, 2019, p. 3, available at https://armedservices.house.gov/_cache/files/2/d/2d8bf602-2ea5-41e8-a752-75563a1daa59/5EFD2ED5A60D595FFF4A96D2B7C1C741.26-mar-hasc-cjcs-final-statement.pdf.
31 Shanahan, testimony, p. 11.
32 The difficulty explains why few analysts have estimated annual spending by scenario. Those who have, such as William Kaufmann, employed heuristics that remain difficult to replicate. William W. Kaufmann, Assessing the Base Force: How Much Is Too Much? (Washington, DC: Brookings Institution Press, 1992), p. 3. Kaufmann reportedly left behind little information about how he derived his estimates. Michael O’Hanlon, The Science of War (Princeton, NJ: Princeton University Press, 2009), pp. 51–52. DoD’s Cost Assessment and Program Evaluation (CAPE) office reports making little progress tackling the issue (based on DoD think tank roundtable on the FY 2020 budget, April 26, 2019). A decade ago, former Defense Secretary Robert Gates said that 50 percent of DoD’s budget went to strategic and conventional forces, 40 percent went to dual-purpose forces, and 10 percent went to irregular warfare forces. Robert Gates, “DoD News Briefing with Secretary Gates from the Pentagon,” April 6, 2009, available at https://archive.defense.gov/Transcripts/Transcript.aspx?TranscriptID=4396. Former DoD Comptroller Robert Hale said Gates’s comment was based on internal DoD assessments, presumably produced by CAPE (based on teleconference call by Robert Hale for think tank analysts, February 2010).
CHINA IRAN NORTH KOREA
VIOLENT EXTREMISM
Na�onal Defense Strategy 2+3 framework
RUSSIA

www.csbaonline.org 13
Despite these limitations, the 2+3 framework does allow us to deduce a few useful proposi-tions. The framework implies that the budget meets three conditions:
Condition 1 says each priority receives some of DoD’s budget. Condition 2 says the five priori-ties together receive all of DoD’s budget. That is an oversimplification, but it suffices for analytical purposes. Condition 3 says the China portion and Russia portion each exceed the portions for any of the other three priorities individually. Put differently, North Korea, Iran, or violent extremism each do not receive a larger portion than China, or than Russia. If they did, then the budget would not prioritize great power competition over other challenges. Condition 3 does not specify whether the China or Russia portion is bigger, but future research could add that condition.
RUSSIA CHINA
>0% >0%
Condi�on 1
IRAN
>0%
NORTH KOREA
>0%
VIOLENT EXTREMISM
>0%
DoD Spending
RUSSIA CHINA IRAN
NORTH KOREA
VIOLENT EXTREMISM
100%
DoD Spending
Condi�on 2
Condi�on 3
IRAN NORTH KOREA
VIOLENT EXTREMISM >
>
, ,
IRAN NORTH KOREA
VIOLENT EXTREMISM
, , RUSSIA
CHINA
14 CSBA | DID DOLLARS FOLLOW STRATEGY?
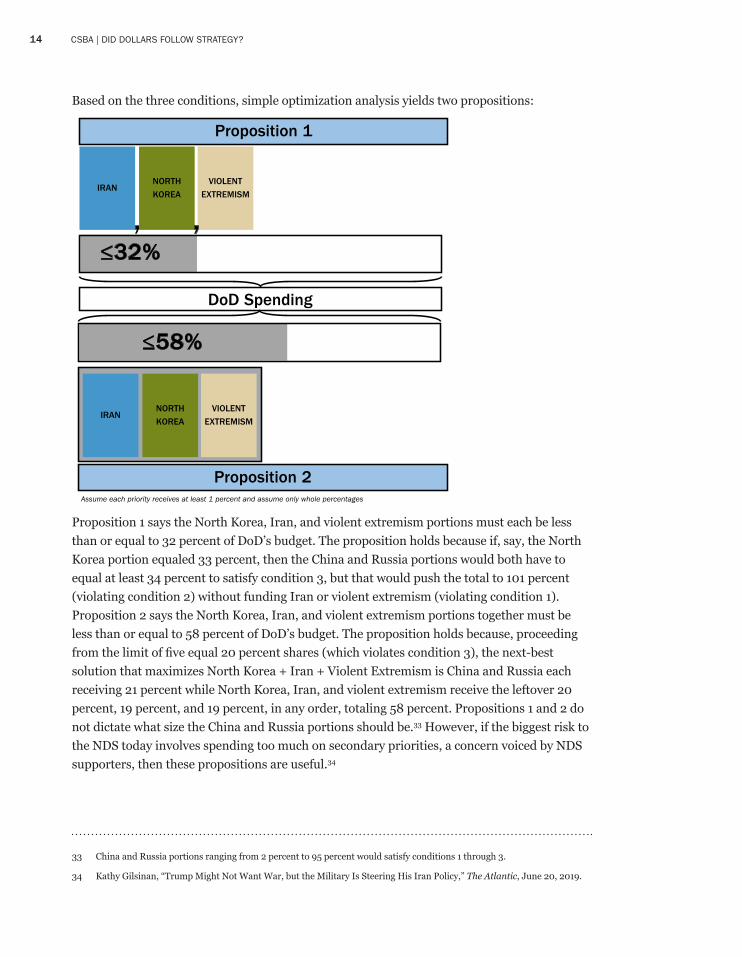
Based on the three conditions, simple optimization analysis yields two propositions:
Proposition 1 says the North Korea, Iran, and violent extremism portions must each be less than or equal to 32 percent of DoD’s budget. The proposition holds because if, say, the North Korea portion equaled 33 percent, then the China and Russia portions would both have to equal at least 34 percent to satisfy condition 3, but that would push the total to 101 percent (violating condition 2) without funding Iran or violent extremism (violating condition 1). Proposition 2 says the North Korea, Iran, and violent extremism portions together must be less than or equal to 58 percent of DoD’s budget. The proposition holds because, proceeding from the limit of five equal 20 percent shares (which violates condition 3), the next-best solution that maximizes North Korea + Iran + Violent Extremism is China and Russia each receiving 21 percent while North Korea, Iran, and violent extremism receive the leftover 20 percent, 19 percent, and 19 percent, in any order, totaling 58 percent. Propositions 1 and 2 do not dictate what size the China and Russia portions should be.33 However, if the biggest risk to the NDS today involves spending too much on secondary priorities, a concern voiced by NDS supporters, then these propositions are useful.34
33 China and Russia portions ranging from 2 percent to 95 percent would satisfy conditions 1 through 3.
34 Kathy Gilsinan, “Trump Might Not Want War, but the Military Is Steering His Iran Policy,” The Atlantic, June 20, 2019.
Proposition 2
IRAN NORTH
KOREA
VIOLENT
EXTREMISM
DoD Spending
≤32%
≤58%
IRAN NORTH
KOREA
VIOLENT
EXTREMISM
, ,
Assume each priority receives at least 1 percent and assume only whole percentages
Proposition 1
www.csbaonline.org 15
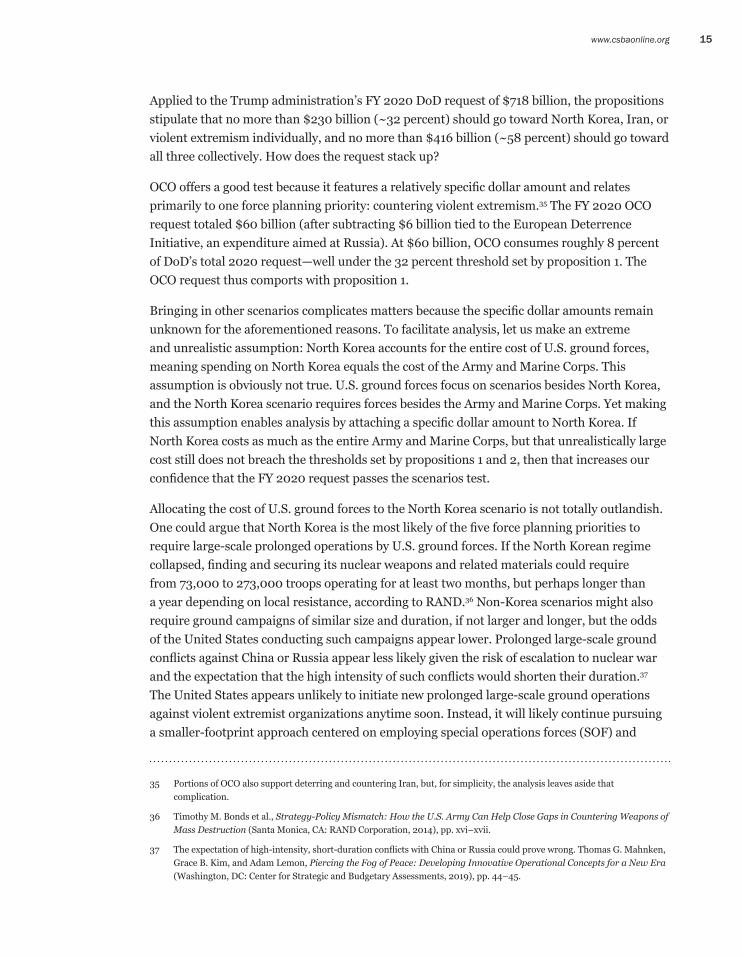
Applied to the Trump administration’s FY 2020 DoD request of $718 billion, the propositions stipulate that no more than $230 billion (~32 percent) should go toward North Korea, Iran, or violent extremism individually, and no more than $416 billion (~58 percent) should go toward all three collectively. How does the request stack up?
OCO offers a good test because it features a relatively specific dollar amount and relates primarily to one force planning priority: countering violent extremism.35 The FY 2020 OCO request totaled $60 billion (after subtracting $6 billion tied to the European Deterrence Initiative, an expenditure aimed at Russia). At $60 billion, OCO consumes roughly 8 percent of DoD’s total 2020 request—well under the 32 percent threshold set by proposition 1. The OCO request thus comports with proposition 1.
Bringing in other scenarios complicates matters because the specific dollar amounts remain unknown for the aforementioned reasons. To facilitate analysis, let us make an extreme and unrealistic assumption: North Korea accounts for the entire cost of U.S. ground forces, meaning spending on North Korea equals the cost of the Army and Marine Corps. This assumption is obviously not true. U.S. ground forces focus on scenarios besides North Korea, and the North Korea scenario requires forces besides the Army and Marine Corps. Yet making this assumption enables analysis by attaching a specific dollar amount to North Korea. If North Korea costs as much as the entire Army and Marine Corps, but that unrealistically large cost still does not breach the thresholds set by propositions 1 and 2, then that increases our confidence that the FY 2020 request passes the scenarios test.
Allocating the cost of U.S. ground forces to the North Korea scenario is not totally outlandish. One could argue that North Korea is the most likely of the five force planning priorities to require large-scale prolonged operations by U.S. ground forces. If the North Korean regime collapsed, finding and securing its nuclear weapons and related materials could require from 73,000 to 273,000 troops operating for at least two months, but perhaps longer than a year depending on local resistance, according to RAND.36 Non-Korea scenarios might also require ground campaigns of similar size and duration, if not larger and longer, but the odds of the United States conducting such campaigns appear lower. Prolonged large-scale ground conflicts against China or Russia appear less likely given the risk of escalation to nuclear war and the expectation that the high intensity of such conflicts would shorten their duration.37 The United States appears unlikely to initiate new prolonged large-scale ground operations against violent extremist organizations anytime soon. Instead, it will likely continue pursuing a smaller-footprint approach centered on employing special operations forces (SOF) and
35 Portions of OCO also support deterring and countering Iran, but, for simplicity, the analysis leaves aside that complication.
36 Timothy M. Bonds et al., Strategy-Policy Mismatch: How the U.S. Army Can Help Close Gaps in Countering Weapons of Mass Destruction (Santa Monica, CA: RAND Corporation, 2014), pp. xvi–xvii.
37 The expectation of high-intensity, short-duration conflicts with China or Russia could prove wrong. Thomas G. Mahnken, Grace B. Kim, and Adam Lemon, Piercing the Fog of Peace: Developing Innovative Operational Concepts for a New Era (Washington, DC: Center for Strategic and Budgetary Assessments, 2019), pp. 44–45.

16 CSBA | DID DOLLARS FOLLOW STRATEGY?
building the capacity of foreign security forces. A prolonged large-scale ground war with Iran is somewhat more probable, but still less likely than in North Korea. Leaving aside a possible U.S. ground invasion to overthrow the Iranian regime, a campaign that would be operation-ally forbidding and politically problematic, the most plausible ground-force scenario with Iran involves regime collapse. Yet regime collapse in Iran might be less inimical to U.S. inter-ests than regime collapse in North Korea because Iran does not possess nuclear weapons that could fall into the hands of rogue states or extremist groups, meaning American leaders might feel less compelled to intervene.
If North Korea is most likely to require large-scale prolonged ground operations, then it can function as an illustrative benchmark for sizing U.S. ground forces.38 Since size affects cost, the cost of the Army and Marine Corps can thus be assigned to North Korea for the purposes of this thought experiment.
The FY 2020 DoD request included $191 billion for the Army and $46 billion for the Marine Corps, totaling $237 billion for ground forces. At 33 percent of DoD’s total request, that proportion just barely exceeds proposition 1’s single-scenario threshold of 32 percent. Thus, even under the extreme assumption that virtually all Army and Marine Corps spending goes toward North Korea, the FY 2020 request comports with proposition 1, at least under this styl-ized hypothetical.
Adding $60 billion for OCO to the $237 billion for ground forces totals $297 billion. At 41 percent of DoD’s total request, that proportion sits comfortably below proposition 2’s triple-scenario threshold of 58 percent. DoD could spend $119 billion for Iran on top of the $297 billion for OCO plus North Korea and still remain under proposition 2’s threshold. Considering that $119 billion covers about one-third of the Air Force budget plus one-third of the Navy budget (excluding the Marine Corps), but the Air Force and Navy each likely devote less than one-third of their total effort to Iran, DoD likely spends less than $119 billion on Iran (beyond the $297 billion in OCO, Army, and Marine Corps spending already tallied). As a result, the FY 2020 request seems to satisfy proposition 2 and thus passes the scenarios test, at least as best we can tell in this plausibility probe.
Analysts might argue that DoD should not spend $60 billion per year fighting violent extremism because those resources would be better used elsewhere. That is an entirely legiti-mate perspective. The point here, however, is that in a $718 billion budget request, spending $60 billion per year (or more) on violent extremism conforms with the NDS force plan-ning priorities, at least so far as DoD has explained them publicly. Analysts might find this result inconsistent with the NDS as they understand it. Such reactions highlight an important
38 To be clear, scenarios involving Russia or other adversaries also ought to serve as benchmarks for assessing the size and capability of U.S. ground forces. This section focuses strictly on North Korea as a simplifying assumption for analysis.

www.csbaonline.org 17
truth: Translating a strategy’s broad words to specific numbers inevitably leaves room for interpretation.39
Winners Test: Ranking Shifts in Spending Shares
Test: If dollars followed strategy, then the FY 2020 request should have enlarged the shares of DoD’s total spending devoted to priority NDS mission areas.
Result: Failed
Assessment: DoD officials claimed that the FY 2020 request supported the NDS by making tradeoffs. Shanahan told Congress, “We have made tough choices that align finite resources with our strategic priorities, reducing some day-to-day operational requirements.”40 Comptroller Elaine McCusker said, “The F.Y. ‘20 budget request carries out the NDS by prior-itizing resources and shifting investments to prepare for a potential future high-end fight.”41 These statements do not claim merely that DoD increased funding for NDS priorities. That would be easy to do with the budget growing. Instead, the statements claim more ambitiously that DoD prioritized key NDS mission areas over other things.
The NDS identified the following eight mission areas as ones that DoD needed to prioritize, including by devoting additional resources to them:
1. Nuclear forces
2. Space and cyberspace as warfighting domains
3. Command, control, communications, computers, intelligence, surveillance, and recon-naissance (C4ISR)
4. Missile defense
5. Joint lethality in contested environments42
6. Forward force maneuver and posture resilience
7. Advanced autonomous systems
8. Resilient and agile logistics43
39 Samuel P. Huntington, The Common Defense (New York: Columbia University Press, 1961), p. 167; and Harvey M. Sapolsky, Eugene Gholz, and Caitlin Talmadge, US Defense Politics, 2nd edition (New York: Routledge, 2014), p. 115.
40 Emphasis added. Shanahan, testimony, p. 11.
41 Emphasis added. Elaine McCusker, “Department of Defense News Briefing on the President’s Fiscal Year 2020 Defense Budget,” March 12, 2019.
42 Lethality has become something of a codeword used by analysts involved with the NDS to refer to capabilities that can survive and fight within and through enemy A2/AD networks.
43 DoD, Summary of the 2018 National Defense Strategy of the United States of America: Sharpening the Military’s Competitive Edge (Washington, DC: DoD, January 2018), pp. 6–7.

18 CSBA | DID DOLLARS FOLLOW STRATEGY?
If defense officials’ statements are true, then these eight priorities should have ranked among the biggest winners in the FY 2020 request.44 A winner does not necessarily receive the most money. Some programs receive more funding than others by virtue of their scale. A winner also does not necessarily receive the most real growth. DoD might have scheduled a program to grow in advance, meaning DoD did not alter its underlying plan. Furthermore, a program might receive zero real growth but still prove a winner if funding for everything else shrank, meaning the program fared well by comparison.
Instead, a winner is best defined as one that receives the largest increase in its proportional share of DoD’s total spending compared to what DoD’s prior outyear plans forecasted.45 In other words, a winner receives a larger slice of the DoD budget pie than called for previously, indicating that the Pentagon has shifted priorities. In contrast, if budget shares remain stable, even as spending increases, then DoD likely has adhered to the pie-slicing status quo.
Major Force Programs
Table 2 summarizes shifts in spending shares among major force programs, a data series useful for understanding DoD’s priorities. The analysis begins in FY 2016 to establish the baseline inherited by the Trump administration. It assesses DoD budget requests, not enacted funding, to focus strictly on DoD’s performance at prioritizing. It examines data at a high level of aggregation to illustrate broad trends. (A more granular analysis of investment spending follows afterward).
Four programs won by enlarging their FY 2020 shares relative to both their FY 2016 shares and their prior-year projections: general purpose forces (GPF), research and development (R&D), support of other nations, and SOF. All other programs lost ground in relative terms except for space, a new addition to the data series that lacks the prior-year information needed to draw conclusions.
To convey the winners’ margin of victory and verify that the results are multiyear trends, Table 3 sums the year-to-year shifts contained in the requests from FY 2016 to FY 2020 and ranks the cumulative changes by program. The results confirm that under the Trump admin-istration, DoD’s budget requests prioritized the four programs identified above. The biggest single-year shift involved the GPF share growing from 39.4 percent in FY 2019 to 41.9 percent in FY 2020, an immense change to what is already DoD’s largest major force program.
44 Mara Karlin, “How to Read the 2018 National Defense Strategy,” Order from Chaos blog, Brookings Institution, January 21, 2018, available at https://www.brookings.edu/blog/order-from-chaos/2018/01/21/how-to-read-the-2018-national-defense-strategy/; and Elbridge A. Colby, testimony before the Senate Armed Services Committee, January 29, 2019, p. 15, available at https://www.armed-services.senate.gov/imo/media/doc/Colby_01-29-19.pdf.
45 Using budget shares to identify winners is developed in William K. Domke, “Waste, Weapons, and Resolve: Defense Posture and Politics in the Defense Budget,” Policy Sciences 16, no. 4, March 1984, pp. 371–390.

www.csbaonline.org 19
TABLE 2: MAJOR FORCE PROGRAM SHARES OF DOD TOTAL OBLIGATIONAL AUTHORITY, FY16 VS . FY20
Includes base and OCO. Data from OUSD(C), National Defense Budget Estimates, Table 6-4, various years. Column B averages the FY 2020 outyear projections contained in the FY 2016, FY 2017, and FY 2019 requests. The FY 2018 request did not contain a FY 2020 outyear projection. The FY 2019 request’s FY 2020 outyear projection set aside $53 billion for “OCO to base.” The analysis subtracts that $53 billion from the DoD topline before computing the shares that fed into column B’s averages. DoD presumably shifted funds from “C3, intel & space” to “Space” when forming the latter category, a hypothesis supported by the size of the space share (~2 percent) compared to the decline in the C3, intel & space share (~1.4 percent). As a result, C3, intel & space did not necessarily lose and might actually have won. The FY 2019 edition of National Defense Budget Estimates was the first to include a separate major force program category for space (MFP-12). Data for MFP-12 only go back to FY 2017, although presumably DoD or some enterprising outside analyst could create backward compatibility to FY 1962. The FY 2016 National Defense Authorization Act directed DoD to estab-lish MFP-12. On MFP-12’s genesis, see Benjamin S. Lambeth, Mastering the Ultimate High Ground: Next Steps in the Military Uses of Space (Santa Monica, CA: RAND Corporation, 2003), pp. 75–78.
A B C D E
FY16 shares FY20 projections FY20 shares FY20 vs FY16 FY20 projections vs shares
Strategic forces 2.2% 2.6% 2.1% -0.1 % points -0.5 % points
General purpose forces 38.7% 39.6% 41.9% 3.2 % points 2.3 % points
C3, intel & space 15.1% 14.1% 13.7% -1.4 % points -0.4 % points
Mobility forces 2.7% 2.6% 2.4% -0.3 % points -0.2 % points
Guard & reserve forces 7.9% 7.6% 6.5% -1.4 % points -1.1 % points
R&D 8.8% 8.3% 9.0% 0.2 % points 0.7 % points
Central supply & maint 4.3% 4.0% 3.7% -0.6 % points -0.3 % points
Training, medical & other 15.1% 15.1% 12.6% -2.5 % points -2.5 % points
Admin & assoc 2.5% 2.6% 1.9% -0.6 % points -0.7 % points
Support of other nations 0.3% 0.4% 1.4% 1.1 % points 1.0 % points
Special ops forces 2.5% 2.4% 2.8% 0.3 % points 0.4 % points
Space na 2.1% 2.1% na 0.0 % points

20 CSBA | DID DOLLARS FOLLOW STRATEGY?
TABLE 3: CUMULATIVE YEAR-TO-YEAR SHIFTS IN MAJOR FORCE PROGRAM SHARES OF DOD TOTAL OBLIGATIONAL AUTHORITY, FY16 TO FY20
Includes base and OCO. Data from OUSD(C), National Defense Budget Estimates, Table 6-4, various years.
Based on these results, did dollars follow strategy? Enlarging the GPF and R&D shares seems broadly consistent with the NDS. Competing more effectively against China and Russia, including in militarized interactions below the threshold of conflict, seems to necessitate prioritizing GPF, the conventional forces allocated to one theater of operations at a time to perform missions ranging from theater security cooperation to deterrence to warfighting.46 Unfortunately, the data lack the granularity to clarify whether the GPF investments focused more on improving the force’s quality or increasing the force’s size, the so-called “capability versus capacity” tradeoff.47 Meanwhile, preserving key U.S. technological advantages over
46 GPF do not move between theaters on a day-to-day basis. “Future Years Defense Program (FYDP) Structure,” DoD 7045.7-H, April 2004, pp. 6–7, available at http://www.acqnotes.com/Attachments/DoD%2070450.7H%20FYDP%20Structure.pdf. Although still useful as a reference item, DoD 7045.7-H was cancelled by DoDD 7045.14, issued August 29, 2017.
47 Many analysts regard the capability versus capacity tradeoff as decisive, arguing that quality should supplant quantity under the NDS. Susanna V. Blume, Strategy to Ask: Analysis of the 2020 Defense Budget Request (Washington, DC: Center for a New American Security, May 2019), p. 7; James N. Miller and Michael O’Hanlon, Quality over Quantity: U.S. Military Strategy and Spending in the Trump Years (Washington, DC: Brookings Institution, January 2019); and Jim Mitre, “A Eulogy for the Two-War Construct,” Washington Quarterly 41, no. 4, Winter 2019, p. 9. Interest in the capability versus capacity tradeoff dates back at least to the 2013 Strategic Choices and Management Review. Unfortunately, to the author’s knowledge no framework or empirical technique exists for distinguishing a capability-force budget from a capacity-force budget, forcing analysts to argue their cases by referencing force size in general or by cherry picking a few programs that supposedly represent decisive litmus tests. Future research should improve upon these techniques and take care not to turn the capability-capacity tradeoff into a false dilemma. A good place to start would be the force structures illustrated in David Ochmanek et al., U.S. Military Capabilities and Forces for a Dangerous World: Rethinking the U.S. Approach to Force Planning (Santa Monica, CA: RAND Corporation, 2017).
Winners
General purpose forces 3.2 % points
Support of other nations 1.1 % points
Special ops forces 0.3 % points
R&D 0.3 % points
Space 0.1 % points
Losers
Strategic forces -0.1 % points
Mobility forces -0.2 % points
Admin & assoc -0.6 % points
Central supply & maint -0.6 % points
Guard & reserve forces -1.4 % points
C3, intel & space -1.4 % points
Training, medical & other -2.5 % points

www.csbaonline.org 21
increasingly well-armed adversaries seems to require prioritizing R&D, the lifeblood of future capability breakthroughs.
In contrast, support of other nations and SOF likely should not have won under the NDS.48 Support of other nations skews heavily toward the Middle East, so its growth appears incon-sistent with the strategy. In the FY 2020 request, 76 percent of DoD’s $9.2 billion security cooperation budget funded Central Command (CENTCOM).49 This CENTCOM focus does not match the NDS’s emphasis on China and Russia.50 Relatedly, SOF’s larger budget share likely reflects their continuing involvement in counterterrorism operations in Afghanistan, Iraq, Syria, and elsewhere. Under the NDS these operations should consume fewer resources and SOF’s budget share should shrink accordingly. That said, SOF will play a crucial role in great power competition by conducting special reconnaissance, countering adversary influence, and neutralizing enemy SOF, among other missions.
Strategic forces likely should not have lost under the NDS. Strategic forces spending is a central plank in the NDS’s plan to modernize the U.S. nuclear weapons triad. Nuclear weapons ranked first on the NDS’s list of priority mission areas cited above. Relative to the FY 2019 request, the FY 2020 request cut strategic forces spending within DoD by 8.4 percent in real terms.51 The FY 2020 FYDP provided less total nominal funding than the FY 2019 FYDP for the B-21 bomber, long range standoff weapon, and Columbia-class SSBN, though it provided more funding for the ground based strategic deterrent.52 The shrinking budget share devoted to strategic forces does not jive with the importance the NDS placed on upgrading the nuclear triad. That said, strategic forces spending remains an imperfect indicator of nuclear weapons investments, strategic forces lost by less than other losers, and much nuclear spending is fixed because the supporting infrastructure is essentially invariant.53
Guard and reserve forces potentially should not have lost under the NDS, either. They could play a critical role in executing the NDS, particularly if they were trained and equipped to
48 There is at least one major caveat to this claim. If the larger spending shares dedicated to support of other nations and SOF freed up GPF and other forces to concentrate on great power competition, then boosting the support and SOF shares would align with the NDS.
49 OSD, Fiscal Year 2020 President’s Budget: Justification for Security Cooperation Program and Activity Funding (Washington, DC: DoD, March 2019), p. 72, available at https://comptroller.defense.gov/Portals/45/Documents/defbudget/fy2020/FY2020_Security_Cooperation_Book_FINAL.pdf. For FY 2020, support of other nations includes $9.99 billion, whereas the security cooperation justification book includes $9.2 billion, suggesting that the two exhibits overlap but are not fully congruent.
50 Benjamin Denison, “Confusion in the Pivot: The Muddled Shift from Peripheral War to Great Power Competition,” War on the Rocks, February 12, 2019.
51 OUSD(C), National Defense Budget Estimates, Table 6-4, various years.
52 Author’s analysis of Air Force and Navy RDT&E and Procurement requests, various years.
53 The strategic forces MFP includes things besides nuclear weapons and excludes things related to nuclear weapons, making it an imperfect indicator of DoD’s nuclear weapons effort. Todd Harrison and Evan Braden Montgomery, The Cost of U.S. Nuclear Forces: From BCA to Bow Wave and Beyond (Washington, DC: Center for Strategic and Budgetary Assessments, 2015), pp. 8–9; and Kingston Reif and Mackenzie Eaglen, “The Ticking Nuclear Budget Time Bomb,” War on the Rocks, October 25, 2018.

22 CSBA | DID DOLLARS FOLLOW STRATEGY?
make an immediate contribution in a major war with a great power. According to studies by RAND and Jim Mitre, a former DoD official who served as executive director of the NDS, defeating aggression by China or Russia while simultaneously deterring opportunistic aggres-sion elsewhere might require the United States to mobilize large portions of the reserve component.54 Preparing for potential large-scale mobilization entails upgrading infrastructure and training, suggesting that the Guard and reserves should perhaps maintain or even gain budget share, not lose it.
Investment Spending by Mission Area
Although analyzing major force programs illuminates DoD’s priorities, the data lack the gran-ularity to showcase tradeoffs in modernization, a central focus of the NDS. For that topic, a different data series, investment spending by mission area, represents a good test. Investment spending includes procurement and R&D funds added together. Table 4 summarizes an anal-ysis of that data. The analysis follows the same procedure as before, beginning in FY 2016 and assessing DoD requests rather than enacted funding. Since the data exclude outyear projec-tions, the analysis excludes them, too. The data categories do not perfectly overlap with the eight NDS priority mission areas, but the congruence is reasonable, particularly for off-the-shelf data. As before, Table 5 sums and ranks year-to-year shifts from FY 2016 to FY 2020 to verify the results.
TABLE 4: MISSION AREA SHARES OF INVESTMENT DISCRETIONARY BUDGET AUTHORITY, FY16 VS . FY20
Includes base and OCO. Data from DoD Comptroller, Program Acquisition Cost by Weapon System, various years.
54 Timothy M. Bonds et al., America’s Strategy-Resource Mismatch: Addressing the Gaps Between U.S. National Strategy and Military Capacity (Santa Monica, CA: RAND Corporation, 2019), p. xviii; and Mitre, “A Eulogy for the Two-War Construct,” p. 25.
A B C
FY16 shares FY20 shares FY20 vs FY16
Aircraft and related systems 27.5% 23.3% -4.2 % points
C4I systems 4.2% 4.1% -0.1 % points
Ground systems 4.6% 5.9% 1.3 % points
Missile defeat and defense programs 5.0% 4.7% -0.3 % points
Missiles and munitions 6.7% 8.7% 2.0 % points
Shipbuilding and maritime systems 14.4% 14.0% -0.4 % points
Space based systems 4.0% 4.8% 0.8 % points
Science and technology 6.9% 5.7% -1.2 % points
Mission support activities 26.7% 28.7% 2.0 % points

www.csbaonline.org 23
The analysis identifies four winners: missiles and munitions, mission support activities, ground systems, and space-based systems. Missiles and munitions clearly should win under the NDS. Yet DoD officials have characterized the FY 2020 request as marking a “transition” from replenishing munitions expended against violent extremist organizations to stockpiling munitions needed to deter and defeat China and Russia.55 According to one recent analysis, 50 percent of the FY 2020 munitions request funds replenishing stocks expended in coun-terterrorism operations.56 Certain types of munitions are relevant to both counterterrorism and great power competition, so the choice is not binary. Still, the growing budget share for munitions identified here does not yet augur a significant improvement in America’s striking power relative to China and Russia. That is particularly true given the shrinking budget share devoted to missile defeat and defense programs, a capability that anchors the denial concepts championed by the NDS.57
TABLE 5: CUMULATIVE YEAR-TO-YEAR SHIFTS IN MISSION AREA SHARES OF INVESTMENT DISCRETIONARY BUDGET AUTHORITY, FY16 TO FY20
Includes base and OCO. Data from DoD Comptroller, Program Acquisition Cost by Weapon System, various years.
The budget share for ground systems might conceivably grow under the NDS, particularly as the Army and Marine Corps transition from conducting counterinsurgency to fielding new forces that can survive and fight great power adversaries in highly contested environments.58 The growing budget share identified here largely funds existing combat and tactical vehicles, with the exception of the next generation combat vehicle, reflecting the Army prioritizing
55 John A. Tirpak, “Maximum Effort on Munitions to Refill USAF Stockpiles,” Air Force Magazine, March 12, 2019.
56 Govini, The 2019 Federal Scorecard (Arlington, VA: Govini, 2019), pp. 14–15.
57 Thomas Karako and Wes Rumbaugh, Masterpiece Theater: Missed Opportunities for Missile Defense in the 2020 Budget (Washington, DC: Center for Strategic and International Studies, March 2019); and Mike Gallagher, “State of (Deterrence by) Denial,” Washington Quarterly 42, no. 2, Summer 2019, pp. 32–34.
58 Thomas G. Mahnken, Travis Sharp, Billy Fabian, and Peter Kouretsos, Tightening the Chain: Implementing a Strategy of Maritime Pressure in the Western Pacific (Washington, DC: Center for Strategic and Budgetary Assessments, 2019).
Winners
Missiles and munitions 2.0 % points
Mission support activities 2.0 % points
Ground systems 1.3 % points
Space based systems 0.8 % points
C4I systems -0.1 % points
Losers
Missile defeat and defense programs -0.3 % points
Shipbuilding and maritime systems -0.4 % points
Science and technology -1.2 % points
Aircraft and related systems -4.2 % points

24 CSBA | DID DOLLARS FOLLOW STRATEGY?
near-term readiness over longer-term modernization.59 Emphasizing near-term readiness is not necessarily incongruent with the NDS, particularly if it slows the decline in the Army’s combat power relative to Russia. In future budget requests, however, the Army will have to devote a larger share of its investment spending to capabilities optimized for high-end warfare if it wants to stay aligned with the NDS.
Summing Up the Winners Test
The FY 2020 DoD request shifted several Pentagon priorities, supporting the claims made by defense officials. The real question is whether the winners and losers identified above, along with their margins of victory and defeat, comport with the NDS. On the one hand, the request favored certain investments consistent with the NDS’s emphasis on high-end mili-tary competition against China and Russia, including GPF, R&D, and space systems. On the other hand, the larger spending shares devoted to support of other nations, SOF, and replen-ishing munitions expended against violent extremist organizations demonstrate that DoD continues to favor the Middle East and counterterrorism operations despite the NDS’s direc-tion to reduce, although not abandon, those efforts. This state of affairs remains an unresolved tension in DoD budgeting under the NDS. In the author’s view, it provides sufficient evidence to conclude that the FY 2020 request failed the winners test.
59 As the budget overview noted, for the Army, “The first priority is readiness and this budget puts us on track to reach the required NDS readiness level by FY 2022. The next priority is modernization and this budget positions the Army to reach the NDS driven modernization goals by 2028.” OUSD(C), CFO, Defense Budget Overview, p. 9-2.

www.csbaonline.org 25
CHAPTER 3
ConclusionThe gap between strategy and resources identified in this report is historically typical as well as bureaucratically unsurprising, and policymakers should not hope to eliminate it—but it is still worth revisiting constantly. After all, DoD sets requirements that exceed available funds to pressure Congress for more money.60 As Alain Enthoven and Wayne Smith observed, “the Service [requests] have been 25 to 35 percent greater than the budget judged to be adequate by the President and the Congress. This pattern has prompted some cynics to remark that ‘a military requirement is 30 percent more than what we’ve got now, whatever we have now’.”61 Recent experience confirms the observation, as DoD’s future spending projections regularly exceed what it ultimately receives.62 If strategy outpaces resources by design, then insisting that strategy should match resources—a common refrain among the defense policy cogno-scenti—amounts to nothing but “a frequently repeated myth,” as William Kaufmann jibed.63
Rather than eliminating the strategy-resource gap, policymakers instead should recognize, understand, and accept it as part of managing risk under resource constraints—which always exist in one form or another. Eliot Cohen ably described this goal: “Everyone does agree that budgets and organizations can and do change, at least at the margin. If this is the case, statesmen should know in which direction to push such marginal changes, because a series of small alterations can in time amount to a fundamental transformation of policy.”64 This report has advanced that goal by identifying areas where the FY 2020 DoD request may have over- or under-invested relative to the NDS.
60 Hitch and McKean, The Economics of Defense, p. 121.
61 Alain C. Enthoven and K. Wayne Smith, How Much Is Enough? Shaping the Defense Program 1961–1969 (New York: Harper & Row, 1971), p. 201.
62 Todd Harrison, Analysis of the FY 2015 Defense Budget (Washington, DC: Center for Strategic and Budgetary Assessments, 2014), p. 28.
63 William W. Kaufmann, The 1986 Defense Budget (Washington, DC: Brookings Institution, 1985), p. 3. The author pleads guilty to having perpetuated the myth. Travis Sharp, “Over-Promising and Under-Delivering? Ambitions and Risks in US Defence Strategy,” International Affairs 88, no. 5, September 2012, p. 991.
64 Eliot A. Cohen, “When Policy Outstrips Power—American Strategy and Statecraft,” The Public Interest 75, 1984, p. 6.

26 CSBA | DID DOLLARS FOLLOW STRATEGY?

www.csbaonline.org 27


1667 K Street, NW, Suite 900
Washington, DC 20006
Tel. 202.331.7990 • Fax 202.331.8019
www.csbaonline.org


