DID THE FISCAL STIMULUS WORK FOR UNIVERSITIES? * MICHAEL F. DINERSTEIN CAROLINE M. HOXBY JONATHAN MEER PABLO VILLANUEVA Abstract We investigate how stimulus-motivated federal funding directed to universities affected their revenues, expenditures, employment, tuition, student aid, endowment spending, and receipt of state government appropriations. We also investigate how these funds affected the economies of the counties in which the institutions are located. To overcome the potential endogeneity of federal funds (for instance, federal student aid rising when students become poorer), we employ: (i) an instrument that applies nation-wide rates of increase in research funding by agency to universities whose initial dependence on these agencies differs; and (ii) an instrument that applies the change in the maximum Pell Grant to institutions with varying initial numbers of students eligible for the maximum grant. Our results suggest that federal funds induced private universities to increase research, reduce tuition, raise student aid, spend slightly more on many categories of expenditure, and slightly reduce endowment spending rates. These results are consistent with private universities maximizing objectives that require them to allocate funds over a broad array of activities. Our results suggest that public universities used federal funds as leverage to gain independence from state governments--gaining the ability to set tuition and other prices closer to market-based rates but losing state appropriations in the bargain. Overall, the stimulus apparently caused universities to increase their investments in research and human capital. We find no evidence that federal funds directed to universities propped up aggregate demand or generated local economic multipliers in the classic Keynesian sense, but this is not surprising because only a small share of the federal funds "stuck where they hit." JEL codes: E12, E63, H7, I22, I23, I25, I28 corresponding author: Caroline M. Hoxby, Department of Economics, Stanford University, Stanford CA 94305, fax 650-204-6173, telephone 650-725-8719, email [email protected]Acknowledgements: We thank John Griswold of the Commonfund Institute for his generous help with * NACUBO-Commonfund data. We thank Rachel Croson, David Croson, and Nancy Lutz for explaining the complexities of the databases that record federal research grants. We thank Eric Bettinger, Jeffrey Brown, Keith Brown, David Chambers, Raj Chetty, Stephen Dimmock, Elroy Dimson, John Etchemendy, Amy Finkelstein, John Friedman, William Goestmann, Bridget Long, Michael McPherson, Sharon Oster, James Poterba, Christian Tiu, Sarah Turner, and Scott Weisbenner for providing us with data and very helpful comments. We acknowledge support from NSF Grant SES-0922005 for access to the Quarterly Workforce Indicators data. The authors are solely responsible for the content of the paper.
Transcript
DID THE FISCAL STIMULUS WORK FOR UNIVERSITIES?*
MICHAEL F. DINERSTEIN
CAROLINE M. HOXBY
JONATHAN MEER
PABLO VILLANUEVA
AbstractWe investigate how stimulus-motivated federal funding directed to universities affected their revenues,expenditures, employment, tuition, student aid, endowment spending, and receipt of state governmentappropriations. We also investigate how these funds affected the economies of the counties in which theinstitutions are located. To overcome the potential endogeneity of federal funds (for instance, federalstudent aid rising when students become poorer), we employ: (i) an instrument that applies nation-widerates of increase in research funding by agency to universities whose initial dependence on these agenciesdiffers; and (ii) an instrument that applies the change in the maximum Pell Grant to institutions withvarying initial numbers of students eligible for the maximum grant. Our results suggest that federal fundsinduced private universities to increase research, reduce tuition, raise student aid, spend slightly more onmany categories of expenditure, and slightly reduce endowment spending rates. These results areconsistent with private universities maximizing objectives that require them to allocate funds over abroad array of activities. Our results suggest that public universities used federal funds as leverage togain independence from state governments--gaining the ability to set tuition and other prices closer tomarket-based rates but losing state appropriations in the bargain. Overall, the stimulus apparently causeduniversities to increase their investments in research and human capital. We find no evidence thatfederal funds directed to universities propped up aggregate demand or generated local economicmultipliers in the classic Keynesian sense, but this is not surprising because only a small share of thefederal funds "stuck where they hit."
JEL codes: E12, E63, H7, I22, I23, I25, I28
corresponding author: Caroline M. Hoxby, Department of Economics, Stanford University, Stanford CA94305, fax 650-204-6173, telephone 650-725-8719, email [email protected]
Acknowledgements: We thank John Griswold of the Commonfund Institute for his generous help with*
NACUBO-Commonfund data. We thank Rachel Croson, David Croson, and Nancy Lutz for explaining thecomplexities of the databases that record federal research grants. We thank Eric Bettinger, Jeffrey Brown, KeithBrown, David Chambers, Raj Chetty, Stephen Dimmock, Elroy Dimson, John Etchemendy, Amy Finkelstein, JohnFriedman, William Goestmann, Bridget Long, Michael McPherson, Sharon Oster, James Poterba, Christian Tiu,Sarah Turner, and Scott Weisbenner for providing us with data and very helpful comments. We acknowledgesupport from NSF Grant SES-0922005 for access to the Quarterly Workforce Indicators data. The authors are solelyresponsible for the content of the paper.
DINERSTEIN ET AL DID THE STIMULUS WORK FOR UNIVERSITIES? 1
I. INTRODUCTION
The American Recovery and Reinvestment Act (ARRA) was enacted in February 2009
with the objective of "saving and creating jobs" in the immediate future--that is, 2009 and 2010.
ARRA's 831 billion dollars were intended to offset at least some of the decrease in aggregate
demand associated with the financial crisis and Great Recession. Other key parts of this
essentially Keynesian policy were the federal budget signed by President Obama in March 2009,
which contained 400 billion dollars in spending beyond what had been proposed by the G.W.
Bush administration for the 2009 fiscal year (October 2008-September 2009), and the unusually
high budget (3.72 trillion) enacted for fiscal year 2010 (October 2009-September 2010).
Postsecondary institutions were important recipients of stimulus funds--both funds
officially designated as ARRA and funds contained in the unusually large budgets for fiscal years
2009 and 2010. Federal revenue received by postsecondary institutions comes mainly in two
forms: research-related funds (in the form of grants and contracts) and student aid (most of
which is directed to low-income students). Between the 2007-08 and 2009-10 school years,
federal research-related revenues rose, in real dollars, by 14 percent and federal spending on
student aid rose by 80 percent. These funding increases were a stark departure from the 2002-03
to 2007-08 period, when real federal revenues received by postsecondary institutions were
approximately flat.
There are a few key criticisms of stimulus policies as an anti-recessionary tool. First,
because budgeting, legislating, disbursing funds, and creating jobs all take time, the revenues
may not reach the intended recipients fast enough. Second, the U.S. is not a closed economy, so
1
DINERSTEIN ET AL DID THE STIMULUS WORK FOR UNIVERSITIES? 2
some of the intended effect of the stimulus may "leak" out. That is, a recipient of funds may
purchase goods produced overseas or hire foreign workers--lessening the effect on domestic
aggregate demand. Third, the recipients of the funds may "save" them rather than spend them
immediately on employees' wages or purchasing goods. We do not mean to suggest that the
recipients might literally save the stimulus funds. Rather, they might increase their spending
relative to the counterfactual (in which they received no stimulus funds) by only a fraction of the
funds they receive. In many expectations scenarios, this is a logical response to explicitly
temporary funds. For instance, recipients may expect that stimulus funds they receive now will
translate into higher taxes or lower funding in the future, in which case they may save for those
eventualities. Or, the stimulus funds may be large relative to what the recipient thinks he can
spend productively and quickly on the intended use--a research project, say. In that case, he may
withdraw non-federal funds that he would have spent on the project and save those funds for
future projects. Or, the recipient may not wish to hire a person to whom he will be committed
even after the stimulus funds disappear. Instead, he may hire only a fraction of the intended
employees and save some other funds to keep those employees on when the stimulus funds are
gone. It is important to note that "saving" may take the form of a recipient dis-saving less--that
is, borrowing less--than he would have in the absence of stimulus funds.
(Henceforth, we use the word "save" to refer to any change in a postsecondary
institution's finances that had the effect of increasing total spending by less than a dollar-for-
dollar of its stimulus-motivated federal funds. It is important to understand this locution because
it rarely refers to literal saving. Another phrase that is useful is a "full flypaper effect". This is
2
DINERSTEIN ET AL DID THE STIMULUS WORK FOR UNIVERSITIES? 3
the phenomenon in which federal funds increase spending in the intended area dollar-for-dollar. 1
If the advent of stimulus-motivated federal funds does not cause a full flypaper effect, then it
means that the institution has moved some of its other funds away from the relevant activity--but
not to the future, which would be saving. In this case, we will say that the institution has
"reallocated" some of the federal funding. This locution does not refer to literal reallocation that
would violate the terms of the federal funding.)
Interestingly, some of the criticisms of stimulus policies likely apply less to
postsecondary institutions than to typical contractors. As an administrative matter,
postsecondary institutions are well-equipped to receive and spend federal funds quickly.
Undergraduate students can receive increased aid almost immediately, and revenue can quickly
fund graduate and post-doctoral students to work on research projects. Student assistants, post-
doctoral students, and non-tenure-track instructors can be hired without the creation of
"permanent" positions. Some postsecondary institutions have a queue of research projects in the
funding pipeline (already proposed but not yet funded), and the timing of such queued projects
can possibly be accelerated with little or no loss of productivity. Although some stimulus funds
could be used to purchase equipment that is produced overseas, both instruction and research
tend to occur through interpersonal interactions so that leakage to foreign countries is minimal.
Commentators have even argued that leakage outside of the institutions' immediate neighborhood
is limited so that stimulus funding could buoy up the economy of a "college town" or county
The "flypaper effect" is so named because it describes the phenomenon in which money "sticks where it1
hits"--that is, spending in the intended area increases by the full amount of the transfer from the government.
3
DINERSTEIN ET AL DID THE STIMULUS WORK FOR UNIVERSITIES? 4
dominated by a university.2
On the other hand, some criticisms of stimulus policies may be particularly applicable to
postsecondary institutions. Colleges and universities may save some of the stimulus funds by
reducing (relative to the counterfactual in which they received no funds) their borrowing or their
rate of spending from their endowment. Public colleges and universities may receive smaller
appropriations from their state legislatures when they receive stimulus funds--that is, it may be
the state government that ultimately receives some of the funds. Indeed, some states' financial
aid formulas are such that the state automatically reduces the aid it gives students when the Pell
Grant increases. Both private and public universities may hesitate to create long-term positions3
and may find it difficult to accelerate the timing of projects because they do not want to invest in
capital (labs, equipment, offices) that will be excessive in normal times.
In short, postsecondary institutions provide an important environment for investigating
the effects of stimulus funds. They give us a window on how stimulus policies work, and they
provide a testing environment that is likely more favorable to stimulus policies than the rest of
the economy. Moreover, the question of how the stimulus affected postsecondary institutions is
interesting for its own sake because it reveals a great deal about their objectives and constraints.
We are especially interested in how federal stimulus spending--whether classified as ARRA or
not--affected universities' expenditures (on research, student aid, on other activities), universities'
employment, universities' endowment spending, state governments' appropriations to their public
See, for instance, Belkin 2012.2
See Bettinger's chapter in this volume.3
4
DINERSTEIN ET AL DID THE STIMULUS WORK FOR UNIVERSITIES? 5
universities, and economic activity in the counties containing universities.
It is crucial to understand that we will not argue that postsecondary institutions did
something wrong if they saved or reallocated some stimulus dollars by whatever means. This
may in fact be wise policy--not just wise policy for advancing instruction and research, but
potentially wise policy for the economy. To the extent that universities contribute to the
economy by producing useful human capital, inventions, and other public goods (as opposed to
merely generating make-work jobs and incomes to prop up aggregate demand), society would
prefer that universities allocate funds to their most productive use. Such allocation is probably
not consistent with a full flypaper effect. We return to this topic in our conclusions.
The main empirical obstacle to our investigation is establishing what would have
occurred in the counterfactual case with no or much less stimulus funding. Specifically, we face
endogeneity and omitted variables problems. The endogeneity problem is particularly obvious in
the case of student aid, which--like unemployment insurance--is something of an automatic
stabilizer. When a recession hits, family incomes fall and students become more needy. Given
the way federal financial aid formulas work, student aid automatically increases--even if
Congress enacts no increase in the Pell Grant or other aid formulas. Colleges whose local
economies are harder hit will experience a larger increase in student need and, thus, a larger
increase in federal aid funding. Thus, with a naive empirical strategy, reverse causality would
likely confound the causal effects of increased federal student aid. Such reverse causality may
affect research funding as well. If a legislator's local college or university was particularly hard
hit by the recession or financial crisis, he may have made greater effort to obtain federal research
5
DINERSTEIN ET AL DID THE STIMULUS WORK FOR UNIVERSITIES? 6
money for it. A naive strategy would then understate the causal effect of stimulus spending.
However, there is an omitted variables problem that would likely cause overstatement: a
university that is particularly "up and coming" in research may have more projects in the pipeline
that get funded quickly when stimulus funds arise. Such a university would likely have enjoyed
increased spending and employment (relative to other universities) even without the stimulus.
To overcome these empirical challenges, we employ two instrumental variables: (i) a
Bartik-style instrument (Bartik 1991) that applies nation-wide rates of increase in research
funding by agency to universities whose initial dependence on these agencies differs; and (ii) a
simulated instrument that applies the change in the maximum Pell Grant to institutions with
varying initial numbers of students eligible for the maximum grant.
To see how the first instrument works, consider two universities, the first of which had
most of its federal research funding through the National Aeronautics and Space Administration
(NASA) before the recession and the second of which had most of its federal research funding
through the National Institutes of Health (NIH) before the recession. Nationally, NASA research
funding grew by 29 percent from the 2007-08 school year to the 2009-10 school year. Over the
same period, national NIH research funding grew by 16 percent. If each university simply got its
preexisting share of the national increases in funding, then the first university would receive
more stimulus spending than the second university. This difference between the two universities'
receipt of stimulus spending would not be a function of their need for money or of their upward
trajectory since it is not plausible that the national spending increases were set with a mind to the
impact on these two universities. Indeed, we definitively eliminate this possibility by excluding
6
DINERSTEIN ET AL DID THE STIMULUS WORK FOR UNIVERSITIES? 7
each university from the calculation of the nation-wide increase applied to its initial conditions.
Thus, we have a credible instrument for the increases in federal research funding that were
experienced by otherwise similar universities.
To see how the second instrument works, consider two universities, the first with
numerous students eligible for the maximum Pell Grant prior to the recession and the second
with few students eligible for the Pell Grant prior to the recession. We compute the change in
funding that each university would have experienced had each of its students who were initially
eligible for the maximum grant received the change in the maximum grant that was enacted
between 2006-07 ($4,050) and 2009-10 ($5,350). This increase is solely a function of each
university's initial conditions and the national policy change in the maximum Pell Grant. It is not
a function of the change in the neediness of each school's students. This formula-and-initial-
conditions change in federal student aid is a plausible instrument--especially for universities that
recruit students from the nation or a fairly large region. Below, we elaborate on this and other
issues regarding the instruments.
The remainder of the paper is organized as follows. In section II, we describe federal
funding directed to postsecondary institutions before and during the stimulus period. We briefly
review what economics predicts about what universities should do with stimulus funds in section
III. We describe our data in section IV and our empirical strategy in section V. We show results
for university outcomes (revenues, expenditures, employment, and so on) in sections VI and VII.
Results for local economy outcomes are presented in section VIII. Finally, in section IX, we
discuss our findings and draw conclusions.
7
DINERSTEIN ET AL DID THE STIMULUS WORK FOR UNIVERSITIES? 8
II. FEDERAL FUNDING FOR POSTSECONDARY INSTITUTIONS, BEFORE AND DURING THE STIMULUS
The three key events in stimulus spending are the ARRA itself, the much-augmented
budget for the 2009 fiscal year, and the large budget for the 2010 fiscal year. Hereafter, we refer
to all federal spending for fiscal years 2009 and 2010, not just official ARRA spending, as
"stimulus-motivated." Given the timing of federal disbursements, we expect most stimulus-
motivated funding to affect postsecondary institutions' revenues in the 2009-10 school year,
although a small fraction may show up as early as the 2008-09 school year. Of course,
institutions may have begun to anticipate increased federal funding as early as midway through
the 2008-09 school year.
Federal funds directed to postsecondary institutions come in three basic forms: (i) grants
and contracts, (ii) student aid, and (iii) appropriations. Federal grant and contract funds are
revenues intended to support specific research projects or similar activities. Federal student aid4
is primarily directed toward low-income students, and its most important component by far is the
Pell Grant. Appropriations are funds received by an institution through an act of Congress,5
except grants and contracts. Institutions are meant to use appropriations to meet their normal
operating expenses, not to conduct specific projects. The most important examples are federal
In our study, we consistently exclude Pell and all other student aid funds from grants and contracts, even4
if they are included as non-operating grants by the institution. In this way, we avoid double-counting Pell and otheraid revenue.
In terms of federal expenditures, other important forms of aid are Supplemental Educational Opportunity5
Grants (SEOG) and State Student Incentive Grants (SSIG). However, the Pell program alone made up 87 percent offederal grant aid in 2009-10. There are also a number of federal tax breaks related to higher education--mostimportantly the tuition tax credits. These "tax expenditures" are important to the federal budget but they do not flowto postsecondary institutions in a direct way and they were largely unaffected by the recession or urge for stimulusspending.
8
DINERSTEIN ET AL DID THE STIMULUS WORK FOR UNIVERSITIES? 9
appropriations to Land Grant institutions, Tribal Colleges, and Historically Black Colleges and
Universities. State Fiscal Stabilization Funds, temporary revenues received by universities under
ARRA, are also appropriations.
Most federal funds directed to postsecondary institutions fund activities that are closely
related to the primary missions of the institutions--undergraduate and/or doctoral instruction and
research. We expect closely related funding to be at least somewhat fungible with other streams
of revenue--thus allowing at least some of the saving and reallocation behavior described above.
For instance, a private institution could presumably use federal revenue to fund research that it
would otherwise have funded with income from its endowment. Or, a public institution might be
able to use federal revenue to aid students whom it would otherwise have aided with revenue
from the state government. However, we recognize that some federal revenue has low
fungibility. Most obviously, a small share (slightly less than 10 percent) of grants and contracts
fund "independent operations"--federally funded programs directed by postsecondary
institutions.6
For the purposes of this study, the key distinction is between federal student aid funds
(hereafter "federal aid funds") and all other federal funds, including appropriations, directed to
postsecondary institutions. This distinction is key because (i) the latter type of funds is more
likely to be intended for research, (ii) the latter type of funds is inherently institution-specific, not
driven by a formula that applies to all institutions, and (iii) both types of funds can be increased
Examples include Argonne National Laboratory at the University of Chicago, the Jet Propulsion Lab at6
California Institute of Technology, SLAC National Accelerator Laboratory at Stanford University, and the Lawrence Livermore National Laboratory of the University of California.
9
DINERSTEIN ET AL DID THE STIMULUS WORK FOR UNIVERSITIES? 10
as a stimulus measure, but only the former type of funds automatically increases as the incomes
of an institution's students fall (the automatic stabilizer property).
II.A. Federal Funding for Postsecondary Institutions in a "Base" Year: 2006-07
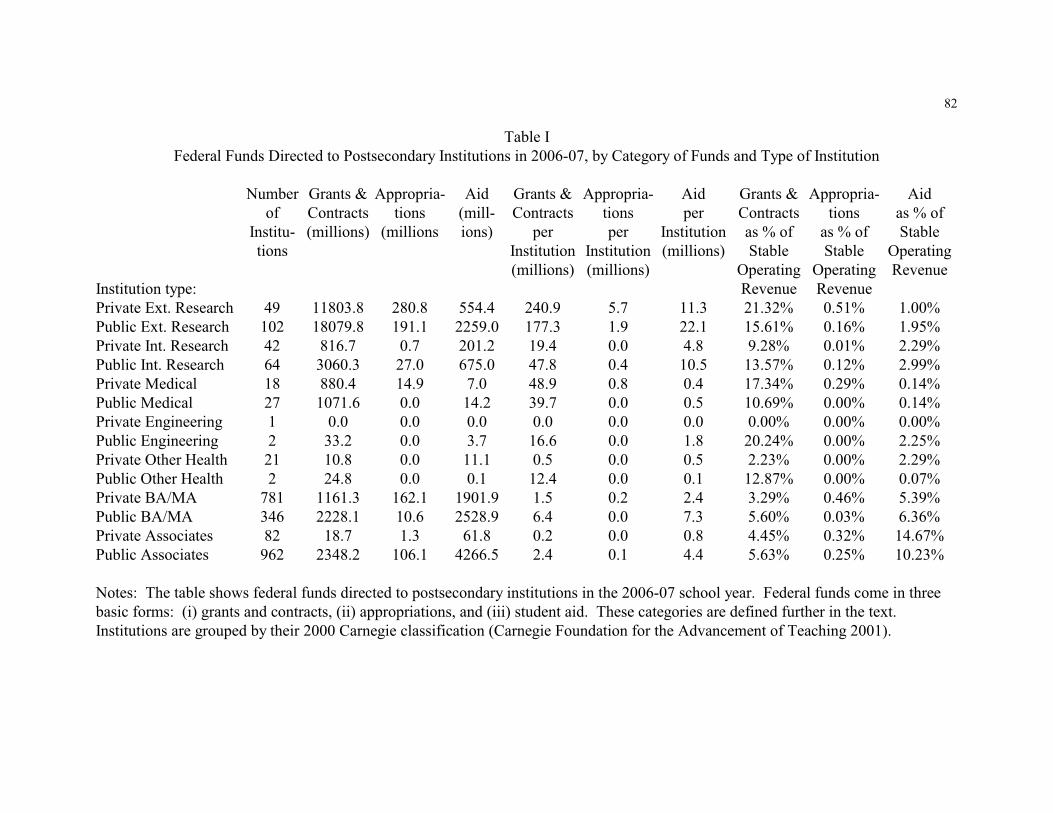
Table I shows how federal funds were distributed among postsecondary institutions in
2006-07, the last school year before the financial crisis and Great Recession hit. The table7
shows amounts in 2010 dollars, adjusted using the GDP deflator. The first column of the table8
classifies institutions by their Carnegie Classification and their control (private or public). The9
only classifications that are not fairly intuitive are the two types of research universities. Both
types offer a wide range of baccalaureate programs and are "committed to graduate education
through the doctorate." However, the "Extensive" ones award 50 or more doctoral degrees per10
year across at least fifteen disciplines, while the "Intensive" ones need to award only at least 10
doctoral degrees per year across three or more disciplines or at least twenty doctoral degrees per
year overall.
The second column of Table I shows the number of institutions in each category. For
reasons that will become clear in Section IV, we have omitted for-profit schools, which would
The 2007-08 school year actually looks very similar because most spending was determined before the7
financial crisis was recognized. The key data for Table I are from the Delta Cost Project database (U.S. Departmentof Education 2012), which we describe in Section III.
Revenue and expenditure patterns are very similar when deflated using the Consumer Price Index (CPI-8
U). These results are available from the authors.
We use the year 2000 Carnegie Classifications to exclude the possibility that the impact of the financial9
crisis or recession might influence a classification.
For a detailed description and justification of the Carnegie classifications, see Carnegie Foundation for10
the Advancement of Teaching (2001).
10
DINERSTEIN ET AL DID THE STIMULUS WORK FOR UNIVERSITIES? 11
nearly all fit into either the Associates or Baccalaureate/Masters category. The third through fifth
columns show the federal funding--grants and contracts, appropriations, student aid--for each
category of institution. The next three columns show federal funding per institution, and the
final three columns show federal funding as a share of the institutions' stable operating revenue.
(Appendix Table I shows alternative versions of the final three columns, with institutions' total
revenue defined more broadly than stable operating revenue is defined. The magnitudes differ,
but the pattern is similar.)
The first thing to observe in Table I is that the vast majority (86 percent) of federal grant
and contract funding goes to Research Universities and Medical Schools. There are a fairly small
number (302) of such institutions, so their per-institution amounts of federal grant and contract
funding dwarf the per-institution amounts received by any other category of schools. Federal
grant and contract funding represents between 9 and 21 percent of these institutions' stable
operating revenue.11
Although Research Universities and Medical Schools also receive a large share (65
percent) of federal appropriations funding, the per-institution amounts are very small relative to
grants and contracts, and appropriations funding never reaches even one percent of their stable
operating revenues. These institutions receive 30 percent of all federal student aid, and such aid
funding represents as much as 3 percent (Public Intensive Research Universities) of stable
operating revenue.
Summing up, Research Universities and Medical Schools play the dominant role in
Even when their total revenue is most broadly defined (see Appendix Table I), federal grant and contract11
funding represents between 6 and 14 percent of the total revenue of research universities and medical schools.
11
DINERSTEIN ET AL DID THE STIMULUS WORK FOR UNIVERSITIES? 12
federal grant and contract funding and federal grant and contract funding plays an important role
in the finances of these schools. Federal student aid also plays a non-trivial role in Research
Universities' finances. Thus, we should expect these institutions to be affected by stimulus-
motivated federal funding.
The picture is fairly different for Associates and Baccalaureate/Masters institutions,
which are shown toward the bottom of Table I. Although they receive 14 percent of federal grant
and contract funding, the per-institution amounts are small and such funding represents only 3 to
6 percent of their stable operating revenues. In contrast, they receive 70 percent of all federal aid
funds, and such funds represent between 5 and 15 percent of their stable operating revenues.
(Appropriations funding plays only a very small role). In short, Associates and Baccalaureate/
Master institutions--of which there are many--have finances in which federal aid funds play an
important role and in which federal grants and contracts play a much smaller role.12
The remaining categories of institutions are so thinly populated that it is not useful to
discuss them here, although we analyze some of them later.
II.B. Stimulus Period Increases in Federal Funding for Postsecondary Institutions
Did postsecondary institutions actually receive notable increases in federal funding during
the stimulus period--especially in the 2009-10 school year? In this section, we show--using time-
We suspect that the federal grant and contract numbers are overstated for Associates and12
Baccalaureate/Masters institutions. This is because Pell Grants often appear as non-operating federal grants in theiraccounts. The Delta Cost Project database attempts to remove Pell and other aid from "grants and contracts," but webelieve--based on cross-validation with other data sources--that some share of federal aid is not removed from non-operating grants.
12
DINERSTEIN ET AL DID THE STIMULUS WORK FOR UNIVERSITIES? 13
series figures--that they did.13
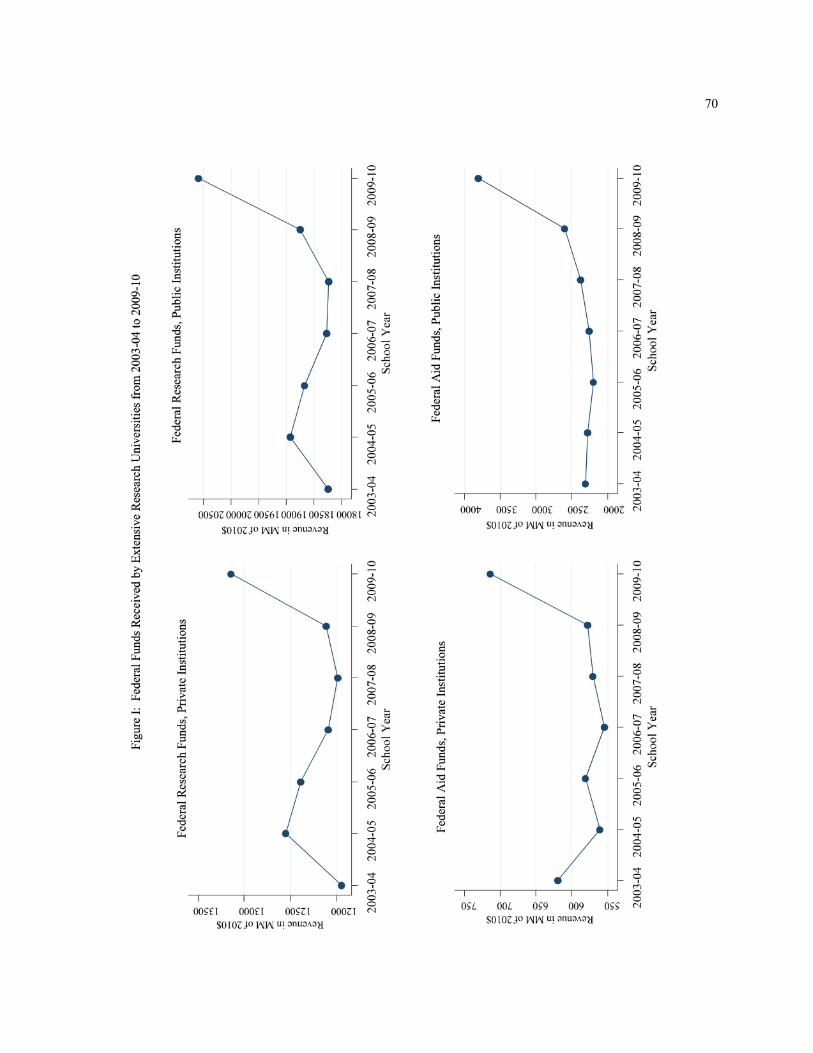
Figures I through V show federal funds, by category of institution, from the 2003-04
school year through the 2009-10 school year. All amounts are in 2010 dollars, adjusted using14
the GDP deflator. Each figure has four sub-figures: (i) federal grants, contracts, and
appropriations for private institutions; (ii) federal grants, contracts, and appropriations for public
institutions; (iii) federal student aid funds for private institutions; and (iv) federal student aid
funds for public institutions. We consolidate appropriations with grants and contracts because of
their nature (see above) and their small magnitude (Table I).
Consider Figure I, which focuses on Extensive Research Universities. Between 2006-07
(the base year we employed in Table I) and 2009-10, real federal research funds jump by 16
percent for private Extensive Research Universities and 20 percent for public Extensive Research
Universities. Over the same period, federal aid funds jump by 37 percent for private Extensive
Research Universities and by 79 percent for public Extensive Research Universities. (Keep in
mind that the larger percentage increases in aid add up to fewer total dollars than the substantial
but more modest percentage increases in research-related funding. This is because federal aid
funds make up much less of Extensive Research Universities' total revenue than do federal
research-type funds. This is evident if one looks at the scale of the sub-figures' vertical axes.) In
The key data for these figures are from the Delta Cost Project database (2012), which we describe in13
Section IV.
We select 2003-04 as the first school year in the figures because, prior to that, some institutions were14
reporting their finances using a form that can be hard to reconcile with the form used from 2003-04 onwards (GASB34/35). To avoid apparent but spurious changes in revenues due solely to reporting, we do not show prior years. However, the period from 2000-01 through 2003-04 was fairly stable for most federal funding streams, and this canbe seen for institutions that reported in the same manner throughout.
13
DINERSTEIN ET AL DID THE STIMULUS WORK FOR UNIVERSITIES? 14
any case, the key conclusion from Figure I is that Extensive Research Universities experienced a
full dose of the federal stimulus.
The picture is slightly more mixed for Intensive Research Universities, shown in Figure
II. On the one hand, federal student aid grew between 2006-07 and 2009-10 by a massive 68
percent at private Intensive Research Universities and by an even greater 82 percent at public
Intensive Research Universities. Note--though--that these growth rates were from smaller per-
institution bases than those of the Extensive Research Universities. Over the same period, the
public Intensive Research Universities saw their federal research-type funding rise by 20 percent.
Private Intensive Research Universities also experienced a rise of 8 percent in federal research-
type funding in 2009-10 owing to the stimulus. This rise, however, only reversed a fall in such
funding from a peak amount in 2005-06. In short, all of the Intensive Research Universities
experienced stimulus funding, but the research funding pattern is slightly less consistent than that
of Extensive Research Universities. This is probably because the per-institution amounts of
research-type funding are sufficiently small in the base year that each year's federal research-type
funding represents a fairly small number of grants. Thus, these funding streams are inherently
less stable than the parallel streams for Extensive Research Universities, whose base year funding
per institution is as much as ten times larger.
The story for Medical Schools (Figure III) is also one in which stimulus funding reversed
a decline in federal funding rather than caused fairly flat federal funding to increase to a notable
peak. Both private and public Medical Schools experienced falling federal research-type funding
from 2003-04 onwards--right up until stimulus motives increased their federal funding in 2009-
14
DINERSTEIN ET AL DID THE STIMULUS WORK FOR UNIVERSITIES? 15
10 (by 11 percent for privates and 13 percent for publics). Their federal student aid also grew
substantially in the stimulus period, but it started from such a small base that it is not important
to their finances.
The time patterns for Baccalaureate/Masters and Associate schools (Figures IV and V)
are fairly similar--albeit on a much smaller scale--to those for Intensive Research Universities.
Stimulus motives generate massive percentage increases in federal aid funds. The
Baccalaureate/Masters and the public Associates schools also see large percentage increases in
federal research-type funding. However, for Baccalaureate/Masters and Associates schools, the15
per-institution amounts of research-type funding are an order of magnitude smaller than those of
Intensive Research Universities and as much as two orders of magnitude smaller than those of
Extensive Research Universities. Thus, even large percentage increases in research-type funding
translate into small percentage increases in these schools' total revenues. Thus, it is the increases
in federal aid funds that are potentially important for their finances.
Overall, we conclude from Figures I through V that stimulus motives generated
substantial increases in all federal funds directed to postsecondary institutions. Extensive
Research Universities and public Intensive Research Universities are likely to be the easiest to
analyze because (i) the increases in funding that they experienced were substantial relative to
their total revenues, both for research-type and aid funding and (ii) their federal funding was
fairly flat in the pre-stimulus period so that it is not difficult to predict what they would have
experienced if stimulus funding had not occurred. Other institutions are somewhat harder to
For private Baccalaureate/Masters schools, this stimulus-driven increase in research-type funding15
reverses a previous decline.
15
DINERSTEIN ET AL DID THE STIMULUS WORK FOR UNIVERSITIES? 16
analyze because their pre-stimulus federal funding was falling or their federal research-type
funding was too small to be important to their finances or their federal student aid increased
greatly but presents us with an endogeneity problem at which we hinted in the Introduction and
take up in detail in Section V.
II.C. Federal Research and Development Funding by Source
As mentioned above, our first instrument exploits the fact that various sources of federal
research funding--NIH, NASA, the National Science Foundation (NSF), Defense, Energy,
Agriculture, and so on--did not all enjoy the same stimulus-driven increase in federal funding.
We therefore turn to a different database (National Science Foundation 2012) to construct
Figure VI, which shows federal research funding for each of the main agencies or departments
that directs funds to postsecondary institutions, from 2003-04 to 2009-10. These are:
Agriculture, Defense, Energy, Health and Human Services (HHS, the vast majority of which is
NIH), NASA, and the NSF. In each figure, the amount for each year (in real dollars) is shown
relative to the amount in 2006-07, the base year. Thus, the value of 1.16 for HHS in 2009-10
shows that federal research funding from HHS increased by 16 percent in real terms between
2006-07 and 2009-10.
Among all the major agencies/departments, only Agriculture shows no stimulus-
motivated boost in research funding. The others have quite widely differing percentage
increases. The lowest is that of HHS at 16 percent and the highest is Defense at 58 percent. NSF
16
DINERSTEIN ET AL DID THE STIMULUS WORK FOR UNIVERSITIES? 17
funding jumped by 23 percent, Energy by 28 percent, and NASA by 29 percent.16
III. WHAT ECONOMIC THEORY PREDICTS ABOUT UNIVERSITIES' USE OF STIMULUS FUNDS
In this section, we briefly review what economic theory predicts about how universities
should use federal stimulus funds. This theory is related to fiscal federalist theory regarding the
manner in which lower level governments, like states or municipalities, should react to grants
from higher level governments, like the federal government.
Consider a federal research grant that arrives at a university owing to the stimulus. It is a
windfall that is formally intended to be spent on research. Suppose that the university normally
allocates funds among numerous uses of which research spending is only one. Other key uses of
funds would typically include instruction, student aid, public service, maintenance and operation
of plant and equipment, construction, and saving money for the future through an endowment. In
its last pre-recession base year, the university might be allocating funds according to Figure VII,
which shows a division of funds between research expenses and all other activities. If the
university is allocating money to maximize its objectives, the division of funds will be such that
an indifference curve representing those objectives is just tangent to the budget constraint that
represents the trade-off between research and all other activities.
The stimulus-motivated federal research funds shift the university's budget constraint out
by the amount of the windfall. If the windfall is smaller than what the university planned to
spend on research from fairly unrestricted sources, the shift in the budget constraint does not
We still need to allocate 2.03 billion dollars of ARRA research funding whose associated16
agency/department information is not yet available in the NSF database.
17
DINERSTEIN ET AL DID THE STIMULUS WORK FOR UNIVERSITIES? 18
affect its slope: an extra dollar for research might as well be an extra dollar that is unrestricted. 17
This is shown in Figure VIIIb. If the windfall is so large that it exceeds what the university
planned to spend from fairly unrestricted sources, it may make a dollar of research effectively
less expensive than a dollar allocated to any other activity. As a result, the windfall would not
shift the budget constraint but affect its slope as well, as shown in Figure VIIIc.
If the university were to spend every dollar of the windfall on research and leave all its
other fund allocation unchanged, it would arrive at a point like B in Figure VIIIa. This represents
a full flypaper effect. Every federal research dollar "sticks where it hits" not only because it itself
is spent on research (which is legally necessary) but because it does not trigger any reallocation
of other revenue. Except under extraordinary conditions, a full flypaper effect is not consistent
with a university previously having been maximizing its objectives. This is shown in Figures
VIIIb and VIIIc, where the university's post-windfall, objectives-maximzing allocations are
illustrated by the points marked C. At points like these, the university spends some of each
windfall dollar on research but reallocates or saves some of it for other activities. We expect the
post-windfall budget to be more skewed toward research when the restrictions on the university's
funds are greater.
We have used federal research funds as an example, but the analysis goes through for
federal aid funds as well. The main difference is that there are quite different restrictions that
constrain institutions' use of aid funds. In particular, an institution that initially has low tuition
By "fairly unrestricted," we do not mean funds that are classified as "unrestricted," but only funds that17
can be shifted forward in time to another fiscal year or shifted to a somewhat different research or instructional use.
18
DINERSTEIN ET AL DID THE STIMULUS WORK FOR UNIVERSITIES? 19
might be constrained to raise its tuition if it wants to reallocate or save federal aid funds for other
activities. See Turner (2012) for an analysis of how an institution might achieve this.
Later in this paper, we discuss the possibility that public universities were not
maximizing their objectives prior to the arrival of the windfall. While even private universities
might fail to maximize their objectives--owing to restrictions placed on their spending by
governments or donors--there is a much more obvious struggle that affects public universities.
These universities' decisions can be highly constrained by the state governments that ultimately
control an important source of their revenues (state appropriations) and often also exercise
control over admissions (often limiting the number of out-of-state students), tuition, aid
programs, public service programs, salaries, and even line-item spending. The degree to which
state governments exercise control over their public universities differs greatly from state to state
and often differs substantially among the institutions within a state.18
Consider a public university that, pre-recession, had objectives represented by the
indifference curve marked "University" in Figure IX. Its state government's objectives are
represented by the indifference curve marked "State" in the same figure. (The objectives shown
are such that the university has a stronger preference for research than the state government, but
this is not necessarily the case.) Pre-recession, the state might offer high appropriations if the
university complies with the state government's objections, creating the possibility of point A, or
low appropriations if the university pursues its own objectives, creating point B. The figure is set
up so that university chooses point A, with high appropriations and acceptance of the
See Aghion, Dewatripont, Hoxby, Mas-Colell, and Sapir (2009).18
19
DINERSTEIN ET AL DID THE STIMULUS WORK FOR UNIVERSITIES? 20
government's objectives.
Now consider what occurs if the university receives a windfall in the form of federal
research funds at the same time that the state government's tax revenue falls. If the state
government did nothing, then the university's budget constraint would shift, just as it did in
Figure VIIIC, and the university might choose a point like that labeled C in Figure Xa. But,
appropriations to the university are more difficult for the state government to fund at just the
same time that federal research funds arrive, so it is quite possible that the state's high
appropriations offer will become less generous, causing the university to choose the low
appropriations state in which it is allowed to pursue its own objectives. This is illustrated by
point D in Figure Xb. Observe that the university has now allocated more money towards
research--and not just because of the direct effect of the federal research funds. The federal funds
essentially change the bargaining position of the university with the state, and allow the
university to switch from the state government's objectives to its own. This switch may have
consequences that reach far beyond allocating dollars to research. The university may shift
towards all activities and policies that it prefers more than the state does. This could include
admitting different students, charging different tuition, or allocating aid funds differently.
The theory we have presented is overly simple. Negotiations between universities and
state governments are not only complex but repeated over time. Similarly, all universities
(private and public) interact with the federal government repeatedly. The repeated nature the
interactions colors how universities respond to federal funding. Also, universities' other (non-
government) sources of revenue are constrained in numerous ways, not only by formal
20
DINERSTEIN ET AL DID THE STIMULUS WORK FOR UNIVERSITIES? 21
restrictions on how funds are spent but also by fundamental elasticities. A university cannot, for
instance, raise its tuition without expecting some effect on which students enroll. Nevertheless,
the theory we have presented brings out some key predictions:
(i) Universities should spend more of the stimulus-motivated federal funds on the purposes for
which it is formally intended when restrictions are such that it effectively reduces the cost of
intended-area spending relative to spending on all other uses.
(ii) We should not expect a full flypaper effect unless universities' budget allocations are highly
restricted.
(iii) Universities that allocate stimulus-motivated federal funds in a manner that is fairly similar
to how they allocated a marginal dollar of funds pre-recession are probably demonstrating that
they were maximizing their objectives prior to the recession and that they have sufficient fairly-
unrestricted funds to keep doing this.19
(iv) Universities that were not maximizing their own objectives pre-recession (possibly, public
universities) may be triggered to choose a different bargain with their state governments or other
sources of non-federal funds.
The alternative interpretation would be that, pre-recession, universities were already constrained to spend19
more on the intended uses for windfall federal funds than they have liked. In this case, if the restrictions imposed bythe windfall were very similar to those that constrained the universities pre-recession, they would spend the windfallsimilarly but be maximizing their objectives in neither situation.
21
DINERSTEIN ET AL DID THE STIMULUS WORK FOR UNIVERSITIES? 22
IV. DATA
We use three main types of data: (i) data based on postsecondary institutions' reports of
their finances and employment; (ii) data based on the federal government's records of its transfers
to postsecondary institutions, and (iii) data based on states' reports of their workforce.
IV.A. Data Based on Postsecondary Institutions' Reports of their Finances and Employment
The "backbone" of our data is the Integrated Postsecondary Education Data System
(IPEDS, U.S. Department of Education 2012) which is based on mandatory self-reporting by
institutions. IPEDS contains many elements that we use: institutional characteristics (location,
control, Carnegie classification, and so on), financial reports (detailed revenues and
expenditures), and employment reports. The IPEDS variables relevant to this study are available
on an annual basis and cover a specific school year or, in the case of financial variables, an
institution's fiscal year. All postsecondary institutions relevant to this study have fiscal years that
begin and end in a summer month. For instance, 2006-07 is the school/fiscal year that contains
September 2006 through May 2007, plus some combination of summer months.20
By combining data from the annual IPEDS surveys, we can construct a fairly complete
history for each institution. In the case of financial variables, however, such construction is
tricky because the reporting procedures have changed over time and public and private
institutions use somewhat different accounting traditions. Fortunately, the Delta Cost Project
Database (U.S. Department of Education 2012) contains IPEDS data that have been translated
Among the Research Universities and Medical Schools on which we focus our analysis in Sections V and20
VI, 85 percent have a fiscal year that ends on June 30, 10 percent have a fiscal year that ends on August 31, 4percent have a fiscal year that ends on May 31, and 1 percent have some other fiscal year end date.
22
DINERSTEIN ET AL DID THE STIMULUS WORK FOR UNIVERSITIES? 23
into consistent measures so that we can confidently conduct longitudinal analyses of trends. We
use this version of the IPEDS data for financial variables whenever it is more consistent than the
normal IPEDS data.
Because its endowment survey is much more detailed than the IPEDS survey, we use the
NACUCO-Commonfund Study of Endowments (NCSE, Commonfund Institute and National
Association of College and University Business Officers 2009 and 2010) for outcomes related to
endowments. In particular, we take the spending rate on the endowment from this source. This21
dataset has an extraordinarily useful combination of objective data on what universities do with
their business officers' explanations of why they do them.
Unfortunately, the most recent financial data that are available--through IPEDS, the Delta
Cost database, or NCSE--cover 2009-10 rather than 2010-11.
IV.B. Data on the Federal Government's Transfers to Postsecondary Institutions
We constructed a history of federal government funds received by the Research
Universities, Medical Schools, and Other Health Professional Schools that received at least one
million dollars of transfers in 2005-06. Constructing this history is a painstaking process, as22
described in the Data Appendix, owing to the fact that federal agencies' records are designed for
tracking the history of specific grants, not for constructing time-series of federal revenues. These
For years prior to 2009, we use the Commonfund Study of Endowments (Commonfund Institute 2003 to21
2008).
The million dollar threshold is in terms of fiscal year 2010 dollars. We have NSF, NIH, and NASA data22
on 263 instititutions but have data on federal funding for Agriculture, Energy, and Defense for only 206 of theseinstitutions. We include the University of California-Merced despite the fact that it was not classified in the year2000 Carnegie classification.
23
DINERSTEIN ET AL DID THE STIMULUS WORK FOR UNIVERSITIES? 24
data have important benefits, however. They allow us to identify the exact source and timing of
each stream of federal revenue. Since stimulus funding is predicated on the idea that federal
spending will affect economic outcomes soon, we want to know when federal funds are actually
received.
Although not all federal agencies have funding data available, especially for the pre-
stimulus period, we obtained detailed administrative data from the sources that generate the vast
majority of transfers to postsecondary institutions: NIH, NSF, NASA, and the Pell Grant
program. These sources generate 99 percent of all federal transfers to postsecondary institutions
and 75 percent of all research-type transfers. Our NIH data come from the Research Portfolio
Online Reporting Tool (RePORT, National Institutes of Health 2012); our NSF and NASA data
come from research.gov (National Science Foundation 2012); and our Pell data come from the
Federal Student Aid Data Center (U.S. Department of Education, Office of Federal Student Aid
2012). We take other agencies' data (Defense, Energy, and Agriculture are the key ones) from
National Science Foundation (2012).
In the Data Appendix, we describe these sources and our exact procedures for recording
the recipient and timing of each transfer in detail. However, our basic procedure is as follows:
Data on the number of Pell Grant recipients and total aid is matched to the postsecondary
institution to which the funds are disbursed and to the quarter when the funds are disbursed.23
Grant and contract data are more difficult. We identify each project that has a university as a
recipient. We take care to include research grants to university-affiliated hospitals and
Prior to fiscal year 2007, we can only match disbursements to the year, not the quarter. Therefore, we23
use the quarterly pattern from fiscal year 2007 to backcast disbursement by quarters in prior years.
24
DINERSTEIN ET AL DID THE STIMULUS WORK FOR UNIVERSITIES? 25
independent operations. We allocate funding to the relevant university uniformly by month
starting with the project's budget start date and ending with the budget end date. We can thus24
aggregate the disbursements by year or by quarter, as needed. Grants hosted by the National
Bureau of Economic Research are matched to the university(ies) of the Principal Investigator(s).
IV.C. Data Based on States' Reports of Their Workforce
We obtain accurate, up-to-date data on local economic activity from the Quarterly
Workforce Indicators Database (QWI, U.S. Department of Commerce 2012). The QWI25
contains very current data because it is largely based on administrative data that the U.S. Bureau
of the Census gathers from unemployment wage records and from businesses. The key suppliers
of these data are the state labor market agencies. The Census merges these administrative data
with demographic information from the U.S. Census and other surveys.
We obtain the QWI information at the county-by-quarter level--associating each
university with the county in which it is located. Our key outcomes from the QWI are26
employment and payroll variables. Massachusetts is, unfortunately, not included in the QWI.
V. EMPIRICAL STRATEGY
If all the variation in federal funds directed to postsecondary institutions were exogenous,
we would estimate the following simple regression that is standard for exercises of this sort (for
We use the project start and end dates if budget start and end dates are unavailable.24
For a very useful description of the QWI, see Abowd et al 2009.25
There are a few cases in which an institution is located in more than one county. In such cases, we assign26
an institution to the county in which it primarily operates.
25
DINERSTEIN ET AL DID THE STIMULUS WORK FOR UNIVERSITIES? 26
instance, estimating a local government's response to a grant from the federal government):
(1)
or its first-differenced version:
(2) ,
where i indexes the postsecondary institution, t indexes time, a t-1 subscript indicates a variable
itlagged one period, Exp is the institution's expenditure or some other outcome likely to be
affected (revenue, research expenditures, the payroll, employment, the spending rate from the
it itendowment), FederalFunds is federal funding received by institution i in period t, X is a vector
itof control variables, and å is a white noise error term.
If the outcome is total expenditure, we would interpret an estimated coefficient on
itFederalFunds that is not statistically significantly different from one as "no saving." If the
outcome and federal funding are aligned--for instance, research spending regressed on federal
research funds--then an estimated coefficient that is not that is statistically significantly different
from one is a full flypaper effect. Coefficients less than one are generally indicators of the
institution reallocating or saving federal funds. An estimated coefficient greater than one would
suggest that the federal funding induced the institution to match the federal funds with some
funds from its other sources.
In practice, we make a few modifications to equation (2), which is the basis of our
preferred specification. First, because we observe that different institutions had different typical
growth in expenditures (and other outcomes), prior to the base year, we compute each
institution's average preexisting growth in each outcome variable using 2003-04 to 2006-07 as
26
DINERSTEIN ET AL DID THE STIMULUS WORK FOR UNIVERSITIES? 27
the "pre" period. We subtract these preexisting growth estimates from our outcome variables.
This ensures that we start from a realistic counterfactual for each institution. We also allow for a
non-zero intercept in the estimating equation.27
Second, we do not necessarily expect private and public institutions to respond similarly
to federal funding, owing to the differences in their governance, alternative funding, and
objectives. Thus, we estimate the above equation separately by an institution's control.
Third, we do not expect institutions to respond identically to funds from different sources.
Most obviously, responses to research-type funds and aid funds are likely to differ because they
are differentially fungible, they are intended for very different uses, and--most obviously--they
flow to the institution in somewhat different ways. Unlike research funds, aid funds are intended
to flow to students, so an institution can reallocate them only by changing its tuition or changing
its institutional grant aid to students.
In short, we estimate regressions of the form:
(3) ,
i it i,t-1separately for private and public institutions. PreGrowth is the average value of Exp -Exp28
We get similar results if we impose a zero intercept.27
We would also like to be able estimate separate effects for each source of research-type funds--the NSF28
versus the NIH, for instance. However, we do not believe that we can do this credibly. This point is discussedbelow.
27
DINERSTEIN ET AL DID THE STIMULUS WORK FOR UNIVERSITIES? 28
for institution i during the period from 2003-04 to 2006-07. We estimate equation (3) using29
data from our base year (2006-07) onwards.
Finally, we slightly modify equation (3) for use with the QWI data in which county
employment and payroll are the outcomes. We can do better than estimate a preexisting growth
rate because there are many counties that do not contain a relevant postsecondary institution but
that are otherwise economically similar to a county that does. We therefore construct a synthetic
control county for each county with a relevant institution. We subtract the outcome for the30
synthetic control county from the dependent variable rather than subtract the preexisting growth
rate:
(4) .
V.A. The Potential Endogeneity of Federal Research-Type Stimulus Funding
There are two main reasons why federal research-type stimulus funding may not be
exogenous. First, institutions whose revenues are particularly hard hit by the crisis or recession
may be more aggressive about obtaining federal research funds, perhaps with the assistance of
Congressmen and Senators from their state. Such reverse causality would cause equations (3)
and (4) to understate the stimulative effect of transfers. Second, institutions that are going to
have especially fast future growth anyway (regardless of the stimulus) may have a
We do not remove institution-specific preexisting growth in federal funds because, as will be seen, such29
institutional differences are excluded automatically by our instrumental variable, by construction.
Synthetic control methods are described by Abadie, Diamond, and Hainmueller (2010, 2011). We30
construct a synthetic control county for each county that contains a relevant postsecondary institution.
28
DINERSTEIN ET AL DID THE STIMULUS WORK FOR UNIVERSITIES? 29
disproportionate share of projects that are "in the pipeline"--with the consequence that their
federal funding would increase disproportionately in the stimulus period. This would cause
overstatement of the stimulative effect. Overstatement would also occur if the institutions best
able to generate research projects that receive stimulus funds happen to be institutions that are
unusually unaffected by the crisis and recession, perhaps because of their location or their non-
federal sources of funding.
We need an instrument that contains credibly exogenous variation in the stimulus-driven
increase in federal research-type funds that institutions experience. We propose an instrument
based on (i) an institution's pre-stimulus funding from each federal source and (ii) the stimulus-
period percentage increase in funding from each of these sources that is directed to all institutions
other than the institution in question. Specifically, if year t=0 is the base year, our instrument for
it i,t-1(FederalResearchFunds -FederalResearchFunds ) is:
(5)
-i,0 to twhere p is the percentage increase from year 0 to year t in federal research-type fundingSource
from source "Source" directed to all postsecondary institutions except institution i. By excluding
institution i's own funding from the percentage increase calculation, we eliminate the possibility
that an intention to affect institution i specifically motivated the percentage increases in the
29
DINERSTEIN ET AL DID THE STIMULUS WORK FOR UNIVERSITIES? 30
federal funding it received.
Our proposed instrument fulfils the exclusion restriction if (i) the percentage increases in
each source of federal funding (excluding the relevant institution) were not motivated by the
potential effect on the relevant institution, and (ii) institutions with different initial federal
funding-by-source allocations were not going to diverge differentially from their past behavior
anyway (that is, in the counterfactual with no stimulus-motivated funding). The latter restriction
is a bit complex, so an intuitive example might help. Suppose that there are two types of
research universities--(i) those in which NIH accounts for two-thirds of federal funding and
NASA accounts for one-third and (ii) those in which NIH accounts for one-third of federal
funding and NASA accounts for two-thirds. Then our instrument would indicate that the latter
group of universities gets a substantially larger boost in federal research funding in the stimulus
period (because NASA's percentage increase was much bigger than NIH's). Since equation (3) is
in first-differences--that is, comparing every university to its own previous year--our instrument
would only be problematic if the NIH-dominated universities were going to change their
behavior anyway (in the counterfactual with no stimulus) in a manner that was systemically
different from the way the NASA-dominated universities were going to change their behavior
anyway (in the counterfactual with no stimulus). We are not aware of a narrative that suggests
that this problem exists--always remembering that the narrative must be about systematic
differences in changes, not systematic differences in levels. Our identifying assumptions are
standard for a Bartik-type instrument based on the interaction between an entity's initial
30
DINERSTEIN ET AL DID THE STIMULUS WORK FOR UNIVERSITIES? 31
conditions and policy-driven changes over which the entity itself has no control.31
V.B. The Endogeneity of Federal Student Aid to Local Family Incomes
In Figures I through V, we demonstrated that postsecondary institutions of all types
experienced substantial, stimulus-driven increases in federal aid funds. A key reason was that
the aid formulas themselves became more generous. In fact, the formula changes were touted as
being one of the best channels for the stimulus because they could take effect quickly and were
intended to put money into the hands of young, low-income people who might be especially
likely to spent it. The main change in the formula was an increase in the maximum Pell Grant
from $4,050 in 2006-07 to $5,350 in 2009-10. Thus, a postsecondary institution could expect to
receive increased federal aid funds roughly in proportion to the number of students it enrolled
who already received the maximum Pell Grant. Our empirical strategy uses this policy-driven
variation in the federal aid revenue that institutions received, and we take steps to ensure that it is
exogenous.
Unfortunately, not all of the increases in federal aid funds were driven by stimulus policy.
Aid funds also increased because family incomes and liquid assets fell with the crisis and
recession, and this creates an endogeneity problem. A student's aid is a function of his Expected
Family Contribution (EFC), which is determined by applying the current federal formula to his
family's income, liquid assets, and other dependents' needs. The lower are family's income and
The alert reader will observe that we could construct an instrument for each separate funding source and31
thereby estimate a version of equation (3) in which NIH, NSF, NASA, and other federal research-type funding allentered separately. However, the coefficients would then be identified by functional form (specifically, theassumption that all the effects are linear in the scale of federal funding), and we would not argue for the credibility ofsuch estimates. Our proposed instrument is much more credible because it exploits idiosyncratic variation in thefederal funding mix among institutions of comparable scale.
31
DINERSTEIN ET AL DID THE STIMULUS WORK FOR UNIVERSITIES? 32
assets, the greater is the federal aid for the student--unless the student's EFC is such that he
already receives the maximum Pell Grant.32
The relationship between family income and federal aid funds generates an endogeneity
problem. Suppose that a postsecondary institution's students suffer owing to the financial crisis
or Great Recession. Their families might lose employment, income, or assets. Then, even if the
institution were to enroll precisely the same students and the aid formulas did not change, it
would likely find that its federal aid funds increased because its students had grown more needy.
Such a change in the institution's finances would be caused by the crisis and recession--not by
stimulus-motivated changes in federal aid. Thus, a naive correlation between federal aid and a
university's outcomes would partly reflect causality that runs from crisis/recession to outcomes,
not just from stimulus funding to outcomes.
Our empirical strategy breaks apart the two strands of causality by exploiting the
nationwide change in the maximum Pell Grant. Recall that a student at the maximum Pell Grant
does not receive more aid if his family income falls. He only receives more aid if the maximum
Pell Grant rises--a policy over which he has no control. To form our proposed instrument, we
take the pre-stimulus (2006-07) number of students at each institution who are at the maximum
Pell and compute the increase in federal aid funds that the institution would see if every pre-
stimulus student at the maximum got the new maximum and there were no change in the
The formula for a student's EFC is, in fact, quite complicated because it takes account of a wide array of32
possible family circumstances. However, the relationship between a student's family income and his federal aid isstrong (R-squared of 0.93) if he is not at the maximum Pell Grant and does not come from an above-median incomefamily. The R-squared statistics is based on authors' calculations based on the National Postsecondary Student AidSurvey 2008 (U.S. Department of Education 2009).
32
DINERSTEIN ET AL DID THE STIMULUS WORK FOR UNIVERSITIES? 33
students enrolled and there were no changes in the incomes of the students already enrolled.
it i,t-1That is, our proposed instrument for (FederalAidFunds -FederalAidFunds ) is:
(6)
where year t=0 is the base year. This instrument is an example of a simulated instrument, the
distinctive feature of which is applying a policy change to an un-changing group of actors.
In practice, constructing our instrument is slightly more complicated because we have to
estimate each institution's number of students at the maximum Pell Grant in the base year. We
estimate it because, unfortunately, this number is not reported in the Federal Student Aid
database. We perform the estimation by analyzing how prior (to the stimulus period) changes in
the maximum Pell Grant affected schools' aid funds. On these prior occasions, the schools' aid
funds should have changed only because of students who were at the maximum--at least, so long
as the economy was not falling into a recession at the same time. Thus, we can back out how
many students were at the maximum. Details are in the Data Appendix. We are not terribly
concerned about estimation error in this procedure because (i) the resulting measurement error is
likely to be classical and classical measurement error in an instrument is not a problem for
estimation and (ii) the stimulus-motivated change in the maximum Pell Grant is so large that its
change would dwarf minor errors that come from estimating the number of students eligible for
the maximum grant.
The concern we have about our instrument is rather different, in fact. As with our other
instrument, a restriction necessary for validity is that schools with different initial conditions (in
this case, different numbers of students eligible for the maximum Pell grant) were not going to
33
DINERSTEIN ET AL DID THE STIMULUS WORK FOR UNIVERSITIES? 34
diverge differentially from their past behavior anyway (that is, in the counterfactual with no
stimulus-motivated boost in the Pell Grant). More precisely, the part of a school's counterfactual
change in behavior that cannot be predicted by the covariates in X should not be systemically
related to its value of the instrument. This assumption will be problematic in the case of schools
that recruit their students almost entirely from their local labor market. It should not be
problematic in the case of schools that recruit their students on a national or large regional
market.
To see this, consider two research universities that both recruit their students nationally.
Suppose that although they are otherwise quite similar, the first places more emphasis on majors
that appeal to high aptitude low-income students (engineering, medicine) and therefore enrolls
more students eligible for the maximum Pell Grant. When the maximum Pell Grant increases,
the first research university will receive a bigger increase in its federal aid funds than the second,
but there is little reason to think that their behavior would have anyway diverged differentially at
this same time. Even if part of the reason that the first research university recruits more low-
income students is that it is located in a low-income neighborhood, the low-income
neighborhood is unlikely to determine the school's outcomes in the crisis/recession period. For
instance, Yale's being located in a low-income neighborhood could have very little effect on
year-over-year changes in its student body, alumni donations, ability to attract research funds, or
earnings from its endowment. In the short term, all of these Yale outcomes are determined at a
far more national level--on national financial markets, for example. In fact, we can and do
control for the initial employment and wages in Yale's and all other research universities' and
34
DINERSTEIN ET AL DID THE STIMULUS WORK FOR UNIVERSITIES? 35
medical schools' local labor markets and find that our instrument still has ample statistical power.
This is evidence that much of these institutions' variation in Pell-eligible students comes from
their idiosyncratic recruiting, not just their neighborhood.
To see why the instrument is less credible among schools that recruit students very
locally, consider two public Associates (community) colleges, each of which draws its students
almost exclusively from the county whose government supports it. Suppose that the first county
is blue-collar and the second is white-collar. The first community college is initially likely to
have more students who are eligible for the maximum Pell Grant because its local families have
lower incomes. In the counterfactual where no stimulus-motivated change in the Pell Grant
occurred, the first community college would probably suffer more in the recession than the
second. This is because, in the recession, blue-collar employees suffered greater losses in
employment and income--systemically--than white-collar employees. Thus, our proposed33
instrument would be correlated with the error term--the change in the school's counterfactual
behavior that cannot be predicted by the covariates in X. Of course, we could add numerous
indicators of the counties' initial labor market conditions (the share of workers in each occupation
and so on) to the vector X in an attempt to make our instrument more credible. However, since
the differences in the schools' Pell-eligible population came from precisely those labor market
conditions, our instrument would then have no statistical power.
Summing up, we have a powerful (and, we believe) very credible simulated instrument
for the stimulus-motivated change in federal aid funds--but only for institutions that do not draw
This fact is shown by numerous studies--for instance, Hoynes, H., Miller, D. L., and Schaller, J. (2012)33
or U.S. Bureau of Labor Statistics (2012).
35
DINERSTEIN ET AL DID THE STIMULUS WORK FOR UNIVERSITIES? 36
nearly all their students from a local labor market. This eliminates virtually all the Associates
institutions and a good share of the Baccalaureate/Masters institutions as well. Since these two
categories of institution could only have been much affected by stimulus-motivated changes in
federal aid (federal research funding is unimportant to them), we hereafter focus our analysis on
Research Universities, Medical Schools, and a few Other Health institutions that receive very
substantial federal funding.34
VI. INFORMAL, GRAPHICAL ILLUSTRATIONS OF THE EFFECT OF STIMULUS FUNDING
Before proceeding to the formal econometric analysis, we illustrate some of our basic
results using figures that are the graphical analog of the estimating equations. The advantage of
the figures is that they provide solid intuition. The disadvantages, relative to the econometric
analysis, are two-fold. First, in order to show the results clearly, we focus on the schools that
were most or least affected by stimulus-driven funding, omitting the schools in intermediate
situations. Thus, although the main graphical findings carry over to the full set of universities,
minor aspects of the graphs are probably best ignored because they are insufficiently
representative. Second, the figures do not deal with the endogeneity problems that the
instrumental variables remedy. Thus, we focus the figures on federal research funding, which is35
See below for our exact selection criteria. A small number of very selective liberal arts colleges do, in34
fact, recruit students from a national or large regional market. The Pell-based instrument should be credible andhave statistical power for them. They should therefore be susceptible to analysis--although not for the effects offederal research funds, of which they have only a small amount. Medical and Other Health Schools are interesting tous because they account for such a large amount of federal research funding (as opposed to federal aid).
Of course, we can construct figures that are the analog of the reduced-form of our instrumental variables35
procedure. In practice, these figures --which are available from the authors-- simply look like muted versions ofFigures XI and XII. This appearance is to be expected since the research instrument and actual research funding are
36
DINERSTEIN ET AL DID THE STIMULUS WORK FOR UNIVERSITIES? 37
less likely to be endogenous than aid funding.
Figure XI shows sources of revenue (panels a and b) and categories of expenditure
(panels c and d) for private institutions from 2003-04 through 2009-10. The left-hand panels (a
and c) are based on the 12 institutions that were most affected by federal stimulus-driven research
funding: each of them experienced at least a 25 percent increase in funding relative to 2006-07.
The right-hand panels (b and d) are based on the 5 institutions that were least affected by
stimulus-driven research funding: each of them experienced only a minor (inflation-adjusted)
increase in funding relative to 2006-07. (There are no private institutions that experienced a zero
increase or a decrease in funding.)
Importantly, each revenue or expenditure line in the figure is based on the residual of that
variable from its 2003-04 through 2006-07 time trend. This allows us to focus on the changes in
each variable from its preexisting trend. It is the use of these residuals that makes the figures into
the analog of the estimating equation. A consequence of using the residuals is that all the lines
are centered around zero in the pre-stimulus period.
Figure XIa shows that, for the most affected schools, revenue from all federal sources
rose dramatically in 2009-10 relative to the preexisting trend. There is a smaller increase in
2008-09. This is not surprising because the schools were selected based on the increase in their
federal research funding, but it does show that other federal funding did not simultaneously fall
to offset the increase in research funding. What is noteworthy is that, during the same period, all
other sources of revenue either fell or stayed on trend. Most strikingly, revenue from tuition
not perfectly correlated. See the results of the first stage regression, below.
37
DINERSTEIN ET AL DID THE STIMULUS WORK FOR UNIVERSITIES? 38
payments and the sales of educational activities fell substantially.36
Figure XIb shows the same revenue streams for the least affected private schools. Of
course, their federal revenue rises by a much smaller amount than it does for the most affected
schools. What is noteworthy, however, is that their revenue from tuition rises, and their revenues
from other sources also rise modestly or stay on trend. Comparing panels a and b, we surmise
that increased federal research funds may have allowed schools to maintain their financial aid
promises and otherwise keep tuition down during the recession.
Figure XIc shows the expenditures of the private institutions most affected by stimulus-
driven research funding. The first thing to observe is that their research expenditures rise but not
by the full amount of the increase in federal funding (the vast majority of which is research
funding for the schools in question). This is because, as we noted in panel a, the schools' other
sources of revenue fell when their federal funding rose--making it impossible for them to
increase research expenditures by the full amount of the federal funding increase unless they
were to cut other categories of expenditure sufficiently to balance the books. The institutions'
expenditures on other categories (instruction, academic support, student support, and so on) do
fall but they fall too modestly to balance the books.
Figure XId shows the same expenditure categories for the private institutions least
affected by stimulus-driven federal research funding. Their research expenditures rise modestly--
and not by the full extent of their increase in federal funding (compare panels b and d). Notably,
Revenues from educational activities are revenues from the sales of goods or services that are "incidental36
to the conduct of instruction, research or public service." For research universities, common examples include therental of university-owned buildings and equipment, sales of publications, and sales of analytic services.
38
DINERSTEIN ET AL DID THE STIMULUS WORK FOR UNIVERSITIES? 39
their expenditures in some other areas fall substantially: expenditures on operations and
maintenance, expenditures on academic support. This fits with a narrative in which schools defer
maintenance when their budgets are tight.
Considered together, panels a through d suggest that not all of the federal research
funding sticks where it hits. Private universities appear to reallocate some of the money that they
would otherwise have spent on research to goals such as holding down tuition and keeping up
expenditures in areas other than research. We can assess these relationships in a more rigorous,
causal manner in the econometric analysis.
Figure XII is the same as Figure XI except that it shows data for public research
universities. The left-hand panels (a and c) are based on the 13 institutions most affected by
federal stimulus-driven research funding: each of them experienced at least a 25 percent increase
in funding relative to 2006-07. The right-hand panels (b and d) are based on the 14 institutions
that were least affected. Each experienced only a modest inflation-adjusted increase in federal
research funding
Figure XIIa shows that, for the most affected public schools, revenue from federal sources
rose dramatically in 2009-10 relative to the preexisting trend. This is to be expected given the
selection of schools, so what is striking is that revenue from state sources fell by approximately
the same amount as the increase in federal revenue. Moreover, revenue from tuition and from
education activities rose very substantially in 2009-10. Overall, even with the decrease in state
revenue, the public schools that experienced the greatest increases in stimulus-driven federal
research funding ended up with greater revenue in 2009-10 than we would have expected based
39
DINERSTEIN ET AL DID THE STIMULUS WORK FOR UNIVERSITIES? 40
on their preexisting trends.
Figure XIIb shows the same revenue streams for the least affected public schools. Their
federal revenue rises modestly compared to the increases for the most affected schools.
Interestingly, though, their revenue from tuition and educational activities rises modestly as well.
This pattern is a muted version of what we see for the most affected public schools. Moreover,
their state revenue falls by more than their federal revenue rises. Overall, their 2009-10 revenues
are above what we would expect based on their preexisting trend, but they only achieve these
higher revenues through the combination of higher tuition revenue, higher educational activity
revenue, and higher federal revenue.
Figure XIIc shows the expenditures of the public institutions most affected by stimulus-
driven research funding. The first thing to observe is that their research expenditures rise very
substantially--not by the full amount of the increase in federal funding but by an amount quite
close to it (especially when we recall that not all of their federal revenue is for research). Their
expenditures on instruction and public service rise modestly. Their expenditures on operations
and maintenance fall very substantially. Overall, their expenditures in 2009-10 are above the
pre-existing trend. This, recall, is made possible by the fact that their revenue in 2009-10 is also
above the preexisting trend, owing to increases in federal, tuition, and educational activity
revenue.
Figure XIId shows the same expenditure categories for the public institutions least
affected by stimulus-driven federal research funding. Their research expenditures rise just
slightly--not by the full extent of their increase in federal funding (compare panels b and d).
40
DINERSTEIN ET AL DID THE STIMULUS WORK FOR UNIVERSITIES? 41
Interestingly, their expenditures on instruction rise. Their expenditures on operations and
maintenance fall.
Analyzed simultaneously, panels a through d of Figure XV indicate a fascinating
narrative (one that we will confirm below). A public institution that was able to get substantial
federal research funding during the stimulus period may have made a bargain with its state
government in which it lost state appropriations (of an amount equal to its increase in federal
revenue) but gained the ability to raise its tuition and to sell more educational activities. Since
the public universities in question were setting their tuition and other prices well below what the
market would bear previous to 2009-10 (especially if one looks at the tuition of competing
private universities), this is plausible. Put another way, the public institutions used the crisis to
move closer to the private institutions on key dimensions: market-based tuition, market-driven
sales of educational activities, and the like. Of course, we need econometric analysis to confirm
that these relationships are likely causal.
VII. THE EFFECT OF STIMULUS FUNDING ON UNIVERSITIES' REVENUES, EXPENDITURES,
EMPLOYMENT, AND OTHER OUTCOMES
In this section, we use econometric analysis to show plausibly causal effects of stimulus
funding on postsecondary institutions' revenues, expenditures, employment, and institutional aid
to students. We also show the effects on other outcomes that the institutions themselves only
influence or partially control: their endowment spending and state appropriations.
VII.A. The First Stage of the Instrumental Variables Estimations
41
DINERSTEIN ET AL DID THE STIMULUS WORK FOR UNIVERSITIES? 42
Before showing the effects that are our main interest, it is useful to demonstrate that our
instrumental variables have considerable explanatory power and have coefficients that are in the
range of what we expect, given how they are constructed. Table II shows these results. The two
instruments are the Bartik-type instrument for federal research funds and the simulated
instrument based on the Pell Grant formula and the institution's pre-recession number of students
at the maximum grant. Columns 1 and 3 show the first stage estimates for private institutions;
columns 2 and 4 show the first stage estimates for public institutions. The standard errors in the
table are robust and clustered at the institution level.
Table II shows estimates from our preferred specification, in which we do not include
controls for the pre-recession economic characteristics of the county in which the institution is
located. We prefer this specification because the pre-recession economic characteristics of small
counties are not published so that we must fill them in using less precise state economic
characteristics. However, Appendix Table II shows exactly parallel estimates based on equations
in which we do include the controls, all measured in the year 2006 unless otherwise specified:
the unemployment rate, per capita income, a house price index, the change in the house price
index from 2000 to 2006, the number of stable jobs, the number of stable hires, the average
earnings in stable jobs, farm income as a share of all personal income, and population. These
controls help to ensure that the Pell-based instrument is not correlated with omitted economic
characteristics that might predict how the area fares in the recession.
Recall that the Bartik-type instrument for federal research funds is constructed so that no
institution's own needs or research trajectory can affect the instrument. This construction should
42
DINERSTEIN ET AL DID THE STIMULUS WORK FOR UNIVERSITIES? 43
produce first stage coefficients on the instrument that are fairly close to one. In columns 1 and37
2 in Table II, we see coefficients of the expected magnitude: 1.0 for private institutions and 1.1
for public institutions. The relevant instrument is statistically powerful: the t-statistics on the
coefficients are 5.5 for private institutions and 7.6 for public institutions (of which there are
about twice as many as there are private institutions).
Similarly, the Pell formula-based instrument is highly statistically significant, with the
relevant t-statistics being 5.5 for private institutions and 7.9 for public institutions. The relevant
coefficients are constructed in such a way that their coefficients should be greater than one. 38
The relevant coefficients are 4.1 for private institutions and 5.0 for public institutions--within the
range that we expect.
VII.B. How the Stimulus Affected Private Universities' Expenditures, Employment, and Other
Outcomes
Table III presents estimates based on private research universities and medical schools.
For these institutions, endowments are a potentially important source of income and a means of
The coefficient should not be equal to one because the institutions are not all of the same size.37
Of course, the magnitude of the coefficients does not affect the instrumental variables results. The38
construction of the instrument merely affects the scale of the coefficient in the first stage equation. This simulatedinstrument is specifically designed to exclude endogenous responses embedded in the actual change in Pell revenues. There is no reason to design it to produce any particular coefficient in the first stage. However, to see why we expectthe coefficient to be greater than one, recall that the instrument is the number of students estimated to be eligible forthe maximum Pell Grant times the change in the maximum Pell Grant. The first reason why the coefficient on theinstrument should be greater than one is that we estimated the number of students at the maximum grant using pre-recession changes in the maximum grant, and these changes took place several years ago when institutions enrolledfewer students. The second reason why the coefficient on the instrument should be greater than one is thatinstitutions with more students at the maximum grant also have students who are Pell-eligible but below themaximum grant. These students may become eligible for additional Pell aid either because (i) the institutionresponds to the change in the maximum Pell Grant by raising tuition or (ii) because their families become poorer as aresult of the recession. We show evidence below that phenomenon (i) does occur.
43
DINERSTEIN ET AL DID THE STIMULUS WORK FOR UNIVERSITIES? 44
saving federal research funds. On the other hand, state appropriations are not important to these
institutions. Thus, Table III shows key outcomes like expenditures, employment, tuition revenue,
institutional student aid, and the spending rate from endowments, but it does not show state
appropriations.
Private universities' research expenditures rose by about 23 cents for every dollar of
stimulus-motivated federal research funds. This suggests that they reallocated or saved some
funds they would otherwise have spent on research for other purposes, and the other outcomes
shown in Table III give us some idea what those other purposes were. Their net tuition revenue
fell by 10 cents and their institutional grant aid rose by 2 cents for every dollar of stimulus-
motivated federal research funds they received. This suggests that they reallocated some funds to
keep tuition down and aid up for their students. The point estimates for their total employees and
payroll are positive but statistically insignificant--more because of large standard errors than
because the point estimates are small. Thus, it is possible that some of the reallocated funds were
used to protect jobs.
The spending rate variable requires a bit of explanation. We want to focus as much as
possible on policy variables that the institution can control, and the spending rate is much more
under an institution's control than total spending from the endowment (the spending rate times
the base used by the institution). A typical base is something like "a running average of the last
three year's market value of the endowment," and institutions change the definitions of their
bases infrequently. Most of the change in the base from year to year is driven by past market
performance, over which the university has no control at the time it makes spending decisions.
44
DINERSTEIN ET AL DID THE STIMULUS WORK FOR UNIVERSITIES? 45
In short, we want to focus on the spending rate and not spending from the endowment, but we
must scale the spending rate in such a way that it could logically have the same relationship with
a dollar of federal funds if the rate is applied to a massive base like Harvard's or a smaller base
like Pace University's. Therefore, we multiply each spending rate by its base in the base year and
use this "scaled spending rate." This makes the coefficient easy to interpret: a dollar increase in
federal funding generates a change of X dollars in endowment spending, purely through the
change in the spending rate, which is under the institution's control.
We find that spending rates from private universities' endowment fell such that
endowment spending fell by 10 cents for every dollar of stimulus-motivated federal research
funds. This result is not surprising given the clear tension in the 2008-09 fiscal year when many
private universities felt constrained to maintain spending rates that were difficult when many of
their funds were underwater. Thus, when stimulus-motivated funds arrived--mainly in the39
2009-10 fiscal year--schools that could use them to relieve a little of the tension appear to have
done so.
Interestingly, instructional spending fell by about 47 cents for every dollar of stimulus-
motivated federal research funds. At first this result seems surprising, but at least part of it is
explained by the fact that private research universities have quite a large number of people on
their payroll who divide their time between instruction and research. These people appear to
have shifted toward doing more research when stimulus-motivated federal funds were available
but the universities' budgets were otherwise very tight. For instance, using IPEDS data, we found
This is authors' interpretation of comments in the NCSE surveys of 2009 and 2010.39
45
DINERSTEIN ET AL DID THE STIMULUS WORK FOR UNIVERSITIES? 46
that stimulus-motivated federal research funds were associated with a substantial shift of
graduate assistants from teaching duties (instructional spending) to research duties (research
spending). We found a similar shift from instruction to research among employees with faculty40
status who are not part of tenure system. (Many such employees are found in laboratories and
medical schools.) These are only two of the fairly obvious ways in which such shifts can take
place. For instance, faculty who remain primarily instructors can buy out a course or an
undergraduate student who would have done an independent project (using instructional funds)
can work on a research project headed by a faculty member. In short, we believe that at least
some of the fall in instructional spending was a reallocation of the universities' resources toward
research, and this reallocation may have enabled the universities to protect jobs and student
support.
We estimated the effects of stimulus-motivated federal funds on several categories of
expenditures not shown in Table III. These suggest that money reallocated from federal research
funds was broadly distributed as small percentage increases across all other areas (student
services, academic support, public service, and so on). This is consistent with the highly41
imprecise point estimate suggesting that total expenses rose by 9.4 cents for every stimulus-
motivated federal research dollar. In other words, part of the windfall research dollar was
allocated to research (including the shifting of people from instruction to research), but much of
the windfall dollar was probably allocated in much the same way that an unrestricted, additional
These calculations are available from the authors.40
These results are available from the authors.41
46
DINERSTEIN ET AL DID THE STIMULUS WORK FOR UNIVERSITIES? 47
dollar of revenue would be at the university in question. This is what economic theory predicts42
would occur in a university whose pre-recession allocation of revenue was approximately
optimal and whose funds were somewhat but not wholly restricted.
At private universities, stimulus-motivated Pell Grant receipts had no statistically
significant effects except on institutional grant aid, which rose by 67 cents for every dollar of Pell
funds. This result is probably not a strictly causal effect but a reflection of the tendencies of
private universities that have an unusually large number of Pell Grant-eligible students. These
universities increased their own institutional aid to students as the maximum Pell Grant
increased. Since the students were made better off by the increase in the maximum grant, these
schools must have either given such students an even bigger increase in aid than they received
through the increase in the grant or--more likely--given an increase in aid to other students whose
incomes were modest but too high to qualify for the maximum grant.
The overall picture that emerges from private universities is as follows They appear not
to have reacted much to stimulus-motivated Pell funds, but they did react to stimulus-motivated
federal research funds. When they received an extra dollar of such funds, they spent part of it on
research but implicitly reallocated some of it to keep tuition down, keep student aid up, possibly
protect some jobs, and relieve the pressure on their endowments (by allowing the spending rate to
fall relative to the counterfactual).
We performed a variety of specification tests on our estimates for private universities.
These are shown in Appendix Table III. When we add covariates for pre-existing economic
That is, if every institution spends the additional funds in a broad manner that is idiosyncratic, the overall42
estimates end up being imprecise.
47
DINERSTEIN ET AL DID THE STIMULUS WORK FOR UNIVERSITIES? 48
conditions in the county, the coefficient estimates generally exhibit the same pattern but the
standard errors rise. For private universities, we consider this an important specification test only
for the effect of stimulus-motivated Pell Grant funds on institutional aid. This is the only effect
likely to biased by a correlation between the Pell-based instrument and pre-existing economic
conditions. This effect survives the addition of covariates. When we estimate the equation by
ordinary least squares, the pattern of coefficients on stimulus-motivated federal research funds is
very similar except that the change in instructional spending is substantially smaller. This
suggests, if anything, it was the universities that were less likely to shift instructors to research
that received more stimulus-motivated funding for non-exogenous reasons.
VII.C. How the Stimulus Affected Public Universities' Expenditures, Employment, and Other
Outcomes
The effects of stimulus-motivated federal funds turn out to be quite different for public
research universities and medical schools. The estimates are shown in Table IV.43
Public universities' research expenditure rose approximately dollar-for-dollar with
stimulus-motivated federal research funds, and instructional spending rose by about 62 cents for
every dollar. State appropriations fell by about 29 cents for every dollar of stimulus-motivated
federal research funds. The greater expenditure on instruction may have been paid for by
increases in net tuition (36 cents for every dollar of federal research funds) and small decreases in
institutional grant aid (3 cents for every dollar of federal research funds). The negative but
statistically insignificant coefficients on total employees and payroll suggest that, if anything,
Table IV shows state appropriations as an outcome because they are highly relevant to public43
universities. However, it does not show endowment-related outcomes, as these turned out to be largely irrelevant.
48
DINERSTEIN ET AL DID THE STIMULUS WORK FOR UNIVERSITIES? 49
public universities that received federal research funds cut jobs. Overall, a consistent and
interesting picture arises. A public research university that enjoyed stimulus-motivated federal
research funds reoriented itself toward research and instruction, raised tuition (by increasing in-
state tuition, enrolling more out-of-state students who pay higher tuition, or both), and reduced
institutional grant aid (perhaps by substituting out-of-state students for low-income in-state
ones). These institutions may have been able to make these changes, which have a flavor of
greater independence from state government, precisely because their ability to bring in federal
research funds caused their state governments to wish to reduce appropriations. Put another way,
this quantitative evidence is in line with the theory in section III and with the graphical evidence
of the previous section: prominent public research universities may gain independence from
state governments during recessions by increasing their reliance on research funding and tuition
and decreasing their reliance on state appropriations. In fact, we have heard several narratives
from public university trustees who participated in making such "bargains." The public
universities' greater independence has been (at least anecdotally) associated with greater
emphasis on research and instruction, more out-of-state students, and prices that are closer to
market-based pricing. We believe that our study provides the first systematic, as opposed to
anecdotal, evidence of this phenomenon.
Stimulus-motivated Pell Grant receipts had important effects on public universities.
Their net tuition revenue rose dollar-for-dollar with Pell Grant revenue generated by the increase
in the maximum grant. Net tuition revenue excludes tuition paid by Pell Grants, so this effect is
not mechanical. Instead, this effect indicates that public universities responded logically to the
49
DINERSTEIN ET AL DID THE STIMULUS WORK FOR UNIVERSITIES? 50
incentives provided by the Pell Grant formula. The formula is such that, when the maximum Pell
grant rises, institutions with sufficiently low tuition have an incentive to raise their tuition to fully
tap the change in the maximum grant, thereby maximizing revenue from the federal Pell
program. Students who receive the maximum Pell grant before and after the tuition increase may
be no worse off, but higher-income students pay (at least some of) the higher tuition from their
own funds. Institutional grant aid also rose by 8 cents for every dollar of stimulus-motivated Pell
funds. This was probably not a strictly causal effect but--like the corresponding estimate for
private universities--evidence that public universities with more Pell-eligible students also had
more students with modest incomes who did not qualify for the new maximum grant but who
needed greater aid because of the recession or the tuition increase.
Even more interesting, state governments appear to have taken all the increases in
revenue from the stimulus-motivated changes in the maximum Pell grant and all the increases in
revenue from the related tuition increases: State appropriations fell by about 2 dollars for every
dollar of additional Pell funds generated by the increase in the maximum grant. Of course, this is
not to say that state governments did not use the money they might otherwise have appropriated
to universities. They must have used it for other programs or to keep taxes lower than they
otherwise would have been in the recession.
Finally, it is worth noting that instructional spending rose when a public university
received more Pell revenue as a result of the increase in the maximum grant. We interpret this as
further evidence of what public universities do when they can act more independently because
they become more reliant on tuition revenue and less reliant on state appropriations.
50
DINERSTEIN ET AL DID THE STIMULUS WORK FOR UNIVERSITIES? 51
In Appendix Table IV, we show specification tests for our baseline public university
results, shown in Table IV. Adding pre-recession economic characteristics of the county does
not change any of the coefficients in a meaningful way. This lack of change is especially
important for the coefficients on stimulus-motivated Pell funds since it was the Pell-based
instrument that we thought might be correlated with area's economic characteristics.
Appendix Table IV also shows that OLS results are generally very similar to the IV
results. The OLS results suggest that the public research universities that were disproportionately
good at getting federal research funds in the stimulus period for non-exogenous reasons were
those that raised net tuition by less and experienced lower losses in state appropriations.
We examined the effects of more detailed categories of expenditure and employment.
These enrich but do not change the picture that emerges from the results already described. In
particular, stimulus-motivated federal research funds raised spending on research salaries (15
cents for every dollar), academic support services, and student services.44
We also examined the public universities' receipt of State Fiscal Stabilization Funds,
which were part of ARRA. These appear as appropriations in Section II. As anticipated (see
Table I), we found that these funds made such small contributions to the revenues of major
public research universities that their effects, if any, could not be discerned.
All in all, the picture that emerges from the public universities is as follows. Federal
stimulus-motivated research and Pell funds made public universities less reliant on state
appropriations and more reliant on tuition revenue (as well as on the federal funds themselves).
These results are available from the authors.44
51
DINERSTEIN ET AL DID THE STIMULUS WORK FOR UNIVERSITIES? 52
The consequence was apparently a re-orientation towards research and instruction. The re-
orientation toward research is not at all surprising given that many federal funds were intended
for research. The re-orientation toward instruction is probably a sign that public research
universities were moving toward a tuition-dependent model of finance, in which attracting out-
of-state students is important.
VII.D. A Note on "Adding Up"
All revenue is either spent or saved, so one might expect that, when an additional dollar
of federal funds arrived at a university, it would be easy to see how the changes in (i) spending,
(ii) saving, and (iii) other sources of revenue sum to one. The numbers do sum to one for each
institution, but it is actually difficult to present regression estimates that demonstrate this in a
transparent way. The reason is two-fold. First, outside of the major, generic categories like
research and instructional, many spending categories are highly institution-specific. For instance,
institutions with independent operations or medical schools have idiosyncratic spending patterns.
Second, institutions have many ways to save and dissave: endowments; debt; additions to and
subtractions from land, infrastructure, buildings, equipment, and art and library collections;
changes in capital leases; changes in construction schedules. We found that we had two
alternatives, neither of which was informative. We could sum up all of the idiosyncratic
categories into motley aggregates that would mechanically satisfy the sum-to-one rule, but these
did not admit of coherent interpretation. Alternatively, we could show regressions for fairly
disaggregated categories, but these required so much interpretation (for instance, knowing which
institutions had independent operations) that they were far from transparent. These problems
52
DINERSTEIN ET AL DID THE STIMULUS WORK FOR UNIVERSITIES? 53
were apparently aggravated by the fact that, when universities, governments, or other institutions
fall on temporarily hard times, they often employ their budgetary ingenuity in exactly the areas
that were most idiosyncratic in the first place. Suffice it to say that adding up does occur for each
institution and that a good share of the reconciliation occurred in areas that are not highly salient.
VIII. THE EFFECT OF STIMULUS FUNDING ON AREAS WHERE UNIVERSITIES ARE LOCATED
Some commentators on universities sanguinely predicted that stimulus funds would prop
up the local economies surrounding universities. In this section, we investigate this possibility.
However, our results in the previous section lead us to expect less than dramatic results,
especially for public universities. It appears that a good share, if not the majority, of stimulus
funds made their way into the hands of students' families, non-university beneficiaries of state
spending, and possibly state taxpayers. These people may have spent the stimulus money to prop
up aggregate demand, but there is little reason to think that they spent it in the immediate vicinity
of the universities themselves. Stimulus funds that found their way into students' hands would
presumably be spent around the universities, but the federal funds provoked tuition increases at
public universities so that many students would presumably feel poorer, not richer. Research
spending rose, but the lack of increase in university employment suggests that employees were
moved around within universities with little net increase in universities' local employment.
Table V shows estimates of how federal stimulus funding affected employment and
payroll in counties in which universities are located. The outcomes are based on the QWI, and
the estimates are from IV regressions. The left-hand side of the table shows results for counties
53
DINERSTEIN ET AL DID THE STIMULUS WORK FOR UNIVERSITIES? 54
in which private universities are located, and the right-hand side of the table shows results for
counties in which public universities are located.
We observe no statistically significant effect of stimulus-motivated Pell funds on the
employment or payrolls of counties in which private institutions are located. We also observe no
statistically significant effect of stimulus-motivated federal aid funds on employment or payroll
in counties where public universities are located. We observe a small but statistically significant
negative effect of stimulus-motivated federal research funds on employment in counties where
public universities are located: the estimates suggests that a dollar of stimulus-motivated
research funds reduces employment in the county by 0.0001 jobs. When we examine more
detailed sub-categories of employment, the last of these results is not clarified. It is also not
sensitive to our including or excluding pre-recession county economic characteristics. Since the
result does not carry over to the payroll (jobs may have been lost but no payroll was), we are
inclined to think that the negative effect on employment is spurious.
In any case, we find no evidence that federal stimulus funds directed to universities
propped up employment or payroll in the counties immediately surrounding them.
Even the most generous interpretation of the QWI results suggests that there is no local
multiplier.
IX. DISCUSSION AND CONCLUSIONS
As we stated in the introduction, there are two quite different ways to evaluate whether
the stimulus worked for universities. First, we could evaluate whether universities served as an
54
DINERSTEIN ET AL DID THE STIMULUS WORK FOR UNIVERSITIES? 55
effective means to prop up aggregate demand quickly--by getting money into the hands of
(university and individual) consumers who would spend it right away rather than save it, thereby
creating a multiplier as envisioned by Keynesian logic. Second, we could evaluate whether
universities spent stimulus funds in a manner that was likely to be productive for society, with a
large share of the benefits likely arising in the mid-to-long term owing to the fact that human
capital and research investments do not pay off immediately even if they are superbly made.
Ambivalence about the manner in which the stimulus for universities should be evaluated shows
up clearly in commentators' and analysts' anecdotal reports. Some of them tout universities for
creating jobs and propping up aggregate demand in "university towns." Others say that
universities used stimulus funds to keep students in school (raising human capital in the mid-to-
long run), to invent technology that would ultimately increase economic growth, or to conduct
research that would otherwise help society (through better medical care, for example).45
We conclude that there is little evidence in this paper that universities were a good route
for stimulus funds if the only goal was propping up local aggregate demand. While our estimates
We found many examples of both types of arguments on the ScienceWorksForUs website, which features45
reports and commentary by numerous university leaders and researchers. As examples of the first type of argument,consider that the University of California claimed that $837 million in ARRA research funds created over 1,400 jobsat its schools. The University of Chicago claimed that its $75 million in ARRA funding "preserv[ed] and creat[ed],on average, close to 100 jobs." As an example of the other type of argument, consider Stanford's statement that"SLAC National Accelerator Laboratory, a facility that serves 3,000 visiting scientists and students each year, hasreceived $90.2 million for infrastructure improvements, accelerator research support and cutting-edgeinstrumentation for advanced X-ray studies." This appears to be a claim about long-run benefits to research, not jobcreation. Some universities' statements contain a mixture of both arguments. For instance, the University ofVermont stated that “In Vermont to date, over $20 million in ARRA funds have advanced research and created orleveraged more than 50 paid positions at UVM and throughout the State." Seehttp://www.scienceworksforus.org/images/stories/PDFs/uc%20arra%20brochure.pdf;http://www.scienceworksforus.org/press-releases/universities-highlight-benefits-of-stimulus-research-funding;http://www.scienceworksforus.org/images/stories/PDFs/university%20leaders%20comment%20on%20benefits%20of%20recovery%20act%20final.pdf.
55
DINERSTEIN ET AL DID THE STIMULUS WORK FOR UNIVERSITIES? 56
have standard errors that do not allow us to rule this out as a possibility, there are many pieces of
evidence that run counter to this idea. Most obviously, there is at best very weak evidence that
universities created jobs or increased their payrolls as a result of stimulus funding. There is
certainly no evidence for a multiplier. Also, state governments essentially took all of the
stimulus funding directed to public universities--albeit by indirect means. While the states might
have allocated these funds in such a way that they stimulated the state's--as opposed to the local--
economy, it would surely have been more in keeping with Keynesian logic to give state
governments the funds in the first place and mandate that they spend them quickly. Giving the
funds to universities and subsequently re-negotiating the implicit bargain between state
government and universities must have slowed down stimulus spending. Similarly, it appears
that some of the stimulus funds for private universities ended up in the hands of the families
whose students were enrolled. While these families may well have consumed more in
consequence, Keynesian logic would indicate that the money should simply have been sent to
them in the first place (perhaps through a tax credit) rather than make its way to them in a round-
about and necessarily slow manner. Private universities appear to have saved a small share of
their federal research funds for future use. This policy may have been wise, but it is not one that
boosts aggregate demand immediately. Finally, public universities seem to have used the
stimulus funds to set their tuition higher, as part of their gaining independence from state
governments. The higher tuition probably depressed the consumption of middle- to upper-
income students.
So far as we know, there is no plausibly causal evidence that contradicts our conclusion
56
DINERSTEIN ET AL DID THE STIMULUS WORK FOR UNIVERSITIES? 57
that federal stimulus funds did little to prop up aggregate demand. Universities' own claims
about jobs created or preserved were purely formulaic. They simply divided their extra federal
funds by their average salary or some similar number. None, so far as we know, analyzed its46
payroll in a plausibly causal way. There is at least one simulation based on input-output tables:
Ash and Palacio (2012). However, this method is also formulaic: it does not attempt to identify
exogenous variation in federal funds or to construct credible counterfactuals.
In contrast to the lack of evidence for the stimulus funds propping up aggregate demand,
an array of evidence indicates that universities used stimulus funds to improve their investments
in research and instruction.
Private universities used the federal research funds to do additional research, presumably
thereby complying with the terms of their research grants and contracts. They shifted some
graduate students and other employees from teaching to research to fulfil their greater research
needs, to support their students, and to protect jobs. They reallocated some funds that they would
otherwise have spent on research and used them to keep tuition down, increase institutional grant
aid, and--possibly--maintain jobs that they would otherwise have had to eliminate. They saved
some funds for the future by slightly reducing the spending rate on the endowment. Private
universities passed the entirety of the stimulus-motivated increase in the maximum Pell Grant to
students. This lack of reaction may have been due to their having such high initial tuition that the
Pell formula contains no incentive to raise it. Their lack of reaction may also be because Pell
Grant funds are not terribly important to them, as shown in Section II.
See Kelderman (2009).46
57
DINERSTEIN ET AL DID THE STIMULUS WORK FOR UNIVERSITIES? 58
In short, private research universities and medical schools undoubtedly care about
research, but they also appear to feel impelled to maintain implicit or explicit commitments to
keep tuition from accelerating quickly, to provide aid, to support graduate students, to maintain
employment, and to protect their endowment funds for future use. In fact, private universities
appear to have used stimulus-motivated federal funds as economic theory suggests they would if
(i) they were attempting to maximize the same objectives both before and after receiving the
federal windfall, (ii) these objectives require them to spend on a broad array of activities, and (iii)
restrictions on the uses of funds made it efficient (cheaper) to use a disportionate share of the
windfall funds in the areas for which they were formally intended. That is, private universities
are roughly described by Figure VIIIC.
Public universities apparently used the stimulus to gain independence from state
legislatures, increase tuition for students who could afford it, and re-orient their activities toward
research and instruction. Both federal research and federal Pell Grant funds induced substantial
reductions in state appropriations that were offset by tuition increases. This suggests that some
combination of the following are true: (i) During recessions, state governments have different
priorities than maintaining their appropriations to postsecondary institutions. (ii) State
governments and/or public universities conclude that a sufficiently large number of prospective
students can actually afford higher tuition that it can be raised during recessions without causing
enrollments to fall so much that the universities' finances get worse instead of better. Some of
this ability-to-afford is mechanical because low-income students receive increased Pell Grants,
but much of it is not mechanical. (iii) State governments and/or public universities are willing to
58
DINERSTEIN ET AL DID THE STIMULUS WORK FOR UNIVERSITIES? 59
accept the trade-off of lower appropriations in return for greater independence (to set tuition,
enroll out-of-state students, and allocate resources within the university). (iv) When they are
more reliant on tuition and federal funds and less on state appropriations, public research
universities spend more on research and instruction and less on other categories of spending.
In short, if we evaluate the stimulus directed to universities based on the second criteria--
did they use it to benefit society--our evidence is about as positive as could be expected for short-
run evidence. Only a longer-term study--something in the manner of Aghion, Dewatripont,47
Hoxby, Mas-Coleil, and Sapir (2010)--could investigate whether the research and human capital
investments made by universities during the stimulus period actually paid off by raising
economic growth, patentable inventions, and the like.
Overall, we conclude that the stimulus for universities probably did not work well if the
goal was quickly propping up aggregate demand, especially in the areas surrounding the schools.
However, we also conclude that universities used stimulus funds in a manner that was consistent
with an intention to benefit society in the mid- to long-term. We must leave an evaluation of
these benefits to future investigators.
Even raising public university tuition likely benefits society. This is because highly subsidized tuition at47
public universities can distort human capital investment choices in a manner that is likely to reduce social welfarerelative to more individuated solutions to the human capital investment problem, such as student loans orindividual-specific financial aid. Peltzman (1973) and Hansen and Weisbrod (1969) drew economists' attention tothese distortions long ago.
59
DINERSTEIN ET AL DID THE STIMULUS WORK FOR UNIVERSITIES? 60
X. REFERENCES
Abadie, Alberto, Alexis Diamond, and Jens Hainmueller. 2010. "Synthetic Control Methods for
Comparative Case Studies of Aggregate Interventions: Estimating the Effect of
California's Tobacco Control Program. Journal of the American Statistical Association,
105(490), 493-505.
Abadie, Alberto, Alexis Diamond, and Jens Hainmueller. 2011. "Synth: An R Package for
Synthetic Control Methods in Comparative Case Studies." Journal of Statistical
Software, Vol. 42, Issue 13 (June).
Abowd, John M., Bryce E. Stephens, Lars Vilhuber, Fredrik Andersson, Kevin L McKinney,
Marc Roemer, and Simon Woodcock. 2009. "The LEHD infrastructure files and the
creation of the Quarterly Workforce Indicators," in Timothy Dunne, J. Bradford Jensen,
and Mark J. Roberts, editors, Producer Dynamics: New Evidence From Micro Data.
(Chicago: University of Chicago Press). 149-230.
Aghion, Philippe, Matthias Dewatripont, Caroline Hoxby, Andreu Mas-Colell, and Andre Sapir.
2009. "The Governance and Performance of Research Universities: Evidence from
Europe and the U.S.," Economic Policy, Vol 25, Number 61, 7-59.
Ash, Michael and Shantal Palacio. 2012. "Economic Impact of Investment in Public Higher
Education in Massachusetts: Short-Run Employment Stimulus, Long-Run Public
Returns," University of Massachusetts unpublished report.
Bartik, Timothy J. 1991. "The Effects of Metropolitan Job Growth on the Size Distribution of
60
DINERSTEIN ET AL DID THE STIMULUS WORK FOR UNIVERSITIES? 61
Family Income," Upjohn Working Papers 91-06, W.E. Upjohn Institute for Employment
Research.
Belkin, Douglas. "Tough Times for Colleges--and College Towns," The Wall Street Journal, 23
July 2012, A2.
Carnegie Foundation for the Advancement of Teaching. 2001. The Carnegie Classification of
Institutions of Higher Education. 2000 edition with a foreword by Lee S. Shulman.
(Menlo Park, CA: Carnegie Foundation for the Advancement of Teaching.)
Commonfund Institute. NCSE: NACUBO - Commonfund Stud of Endowments. 2009 and 2010
editions. Electronic database. Versions current as of August 2012.
Commonfund Institute. Commonfund Benchmarks Study. 2003 to 2008 annual editions.
Electronic database. Versions current as of August 2012.
Hansen, W. Lee and Burton A. Weisbrod. 1969. "The Distribution of Costs and Direct Benefits
of Public Higher Education: The Case of California," The Journal of Human Resources,
Vol. 4, No. 2 (Spring), 176-191.
Hoynes, H., Miller, D. L., and Schaller, J. 2012. "Who suffers during recessions?" Journal of
Economic Perspectives, 26(3):27-48.
Kelderman, Eric. "How Many Higher-Education Jobs Stimulus Saved Remains Unclear," The
Chronicle of Higher Education, November 2 2009.
National Association of College and University Business Officers. NCSE: NACUBO -
Commonfund Stud of Endowments. 2009 and 2010 editions. Electronic database.
Versions current as of August 2012.
61
DINERSTEIN ET AL DID THE STIMULUS WORK FOR UNIVERSITIES? 62
National Institutes of Health. Research Portfolio Online Reporting Tools (RePORT). 2004 to
2012. Online database available at http://projectreporter.nih.gov/reporter.cfm. August
2012 edition.
National Science Foundation, National Center for Science and Engineering Statistics. Higher
Education Research and Development Survey. 2003 to 2010. Online database available
at http://caspar.nsf.gov. August 2012 edition.
National Science Foundation, National Center for Science and Engineering Statistics.
Research.gov. 2005 to 2012. Online database available at http://www.research.gov.
August 2012 edition.
Peltzman, Sam. 1973. "The Effect of Government Subsidies-in-Kind on Private Expenditures:
The Case of Higher Education," Journal of Political Economy, Vol. 81.1
(January/February), 1-27.
ScienceWorksForUS. 2010. "American Recovery and Reinvestment Act One Year Later:
Recovery Act-Funded Research Advancing Science, Aiding the Economy and
Contributing to America’s Prosperous Future." Online report available at
http://www.scienceworksforus.org.
Turner, Leslie. 2012. "The Incidence of Student Financial Aid: Evidence from the Pell Grant
Program," Columbia University typescript. Available at
Notes: The table shows federal funds directed to postsecondary institutions in the 2006-07 school year. Federal funds come in threebasic forms: (i) grants and contracts, (ii) appropriations, and (iii) student aid. These categories are defined further in the text. Institutions are grouped by their 2000 Carnegie classification (Carnegie Foundation for the Advancement of Teaching 2001).
83
Table IIFirst-Stage Estimates: Regressions of Federal Funding Variables on Instruments
Dependent variable: Dependent variable: Year-over-year Change in Federal Research
Funds
Dependent variable: Year-over-year Change in Federal Pell Funds
Type ofpostsecondary
institution:
Privateresearch
universities andmedical schools
Publicresearch
universities andmedical schools
Privateresearch
universities andmedical schools
Publicresearch
universities andmedical schools
(1) (2) (3) (4)Explanatory variable:
Bartik-type Instrumentbased on Change inFederal Research Funds
1.004***(0.183)
1.103***(0.146)
0.010*(0.005)
0.092***(0.019)
Simulated Instrumentbased on Change inMaximum Pell Grant
7.421(6.555)
0.067(0.751)
4.134***(0.750)
5.043***(0.639)
Observations 300 524 300 524
R-squared 0.403 0.483 0.219 0.464
Notes: The table shows estimates of the first-stage equations described in the text. Each columnrepresents a regression. Robust standard errors clustered at the institution level are shown inparentheses. Asterisks indicate p-values: *** p<0.01, ** p<0.05, * p<0.1. An observation is apostsecondary research university or medical school in a year between the 2006-07 and 2009-10school years, inclusive. All amounts are in real dollars, adjusted for inflation using the GDPdeflator. The dependent variables are the year-over-year change, in dollars, of federal researchfunds (columns 1 and 2) and federal Pell Grant funds (columns 3 and 4). The Bartik instrumentis constructed by applying the national rate of growth in a given federal agency's funding(national excluding the institution itself) to the institution's base year funding from that agencyand then summing over all agencies. See equation (4) in the text. The Pell-based simulatedinstrument is constructed by applying the change in the maximum Pell Grant to each institution'sestimated number of students eligible for the maximum grant in the base year. See equation (5)in the text.
84
Table IIIThe Effect of Stimulus-Motivated Federal Funds on Private Research Universities and Medical Schools
Dependent variable is Year-over-year Change (minus pre-recession trend) in...Total
expenditureResearch
expenditureInstructionalexpenditure
Number ofemployees
(per $1000 offunds)
Total payroll Net tuitionrevenue
Institutionalgrant aid
Scaledspending rate
fromendowment
(1) (2) (3) (4) (5) (6) (7) (8)
Year-over-yearChange in FederalResearch Funds
0.094(0.451)
0.231*(0.136)
-0.474*(0.275)
0.031(0.041)
0.123(0.186)
-0.103*(0.060)
0.017*(0.009)
-0.102*(0.057)
Year-over-yearChange in FederalPell Funds
3.683(3.580)
2.941(1.976)
1.090(1.839)
0.020(0.406)
10.892(9.957)
-0.993(1.381)
0.677*(0.374)
-0.010(0.463)
Dependent variablecontrols for thepre-recession trend(per equation 3)
yes yes yes yes yes yes yes yes
Pre-recessioneconomiccharacteristics
no no no no no no no no
Instrumentalvariables estimates
yes yes yes yes yes yes yes yes
Observations 300 300 300 300 300 255 255 296
Notes: The table shows estimates of equation (3) described in the text. Each column represents a regression. Robust standard errorsclustered at the institution level are shown in parentheses. Asterisks indicate p-values: *** p<0.01, ** p<0.05, * p<0.1. Anobservation is a private postsecondary research university or medical school in a year between the 2006-07 and 2009-10 school years,inclusive. All amounts are in real dollars, adjusted for inflation using the GDP deflator. The dependent variables are the year-over-year change in various expenditures and other outcomes. The units are dollars unless otherwise specified. See text and equations (4)and (5) for a description of the instrumental variables. In regressions with fewer observations, some institution did not report data.
85
Table IVThe Effect of Stimulus-Motivated Federal Funds on Public Research Universities and Medical Schools
Dependent variable is Year-over-year Change (minus pre-recession trend) in...Total
expenditureResearch
expenditureInstructionalexpenditure
Number ofemployees
(per $1000 offunds)
Total Payroll Net tuitionrevenue
Institutionalgrant aid
StateAppropria-
tions
(1) (2) (3) (4) (5) (6) (7) (8)
Year-over-yearChange in FederalResearch Funds
-0.238(0.393)
1.238***(0.159)
0.618**(0.247)
-0.039(0.054)
-0.070(0.195)
0.360***(0.104)
-0.030***(0.011)
-0.287*(0.171)
Year-over-yearChange in FederalPell Funds
0.125(1.121)
0.238(0.275)
1.341***(0.375)
0.082(0.107)
-0.526(0.538)
1.007***(0.342)
0.079*(0.043)
-2.122***(0.626)
Dependent variablecontrols for thepre-recession trend(per equation 3)
yes yes yes yes yes yes yes yes
Pre-recessioneconomiccharacteristics
no no no no no no no no
Instrumentalvariables estimates
yes yes yes yes yes yes yes yes
Observations 515 524 524 524 524 460 460 524
Notes: The table shows estimates of equation (3) described in the text. Each column represents a regression. Robust standard errorsclustered at the institution level are shown in parentheses. Asterisks indicate p-values: *** p<0.01, ** p<0.05, * p<0.1. Anobservation is a public postsecondary research university or medical school in a year between the 2006-07 and 2009-10 school years,inclusive. All amounts are in real dollars, adjusted for inflation using the GDP deflator. The dependent variables are the year-over-year change in various expenditures and other outcomes. The units are dollars unless otherwise specified. See text and equations (4)and (5) for a description of the instrumental variables.
86
Table VThe Effect of Stimulus-Motivated Federal Funds on the Economies of Counties
in which Research Universities and Medical Schools are Located
Dependent variable is Year-over-year Change (minus pre-recessiontrend) in Control Counties or Counties Containing
At least 1 Private ResearchUniversity or Medical School
Only Public ResearchUniversities or Medical Schools
Employment Total Payroll Employment Total Payroll
(1) (2) (3) (4)
Year-over-year Change inFederal Research Funds
-0.0004(0.0004)
-51.598(33.744)
-0.0001*(0.00005)
-6.357(4.882)
Year-over-year Change inFederal Pell Funds
0.0003(0.0010)
-22.318(87.537)
-0.0003(0.0004)
-31.347(23.972)
Dependent variable controlsfor the pre-recession trend(per equation 3)
yes yes yes yes
Synthetic control countiesincluded to establish timeeffects (see text)
yes yes yes yes
Pre-recession economiccharacteristics of the county
yes yes yes yes
Instrumental variablesestimates
yes yes yes yes
Observations
Notes: The table shows estimates of equation (3) described in the text. Each column representsa regression. Robust standard errors clustered at the county level are shown in parentheses. Asterisks indicate p-values: *** p<0.01, ** p<0.05, * p<0.1. An observation is a county in ayear between the 2006-07 and 2009-10 school years, inclusive. All monetary amounts are in realdollars, adjusted for inflation using the GDP deflator. The dependent variables are the year-over-year change in employment and payroll. The units are dollars unless otherwise specified. Seetext and equations (4) and (5) for a description of the instrumental variables.
87
Appendix Table IFederal Funds Directed to Postsecondary Institutions in 2006-07, by Category of Funds and Type of Institution
Notes: The table shows federal funds directed to postsecondary institutions in the 2006-07 school year, as a share of total revenuedefined in two different ways. Related statistics are shown in Table I. Federal funds come in three basic forms: (i) grants andcontracts, (ii) appropriations, and (iii) student aid. These categories are defined further in the text. Institutions are grouped by their2000 Carnegie classification (Carnegie Foundation for the Advancement of Teaching 2001).
88
Appendix Table IIFirst-Stage Estimates: Regressions of Federal Funding Variables on Instruments and Pre-
Recession Economic Characteristics of Counties in which Postsecondary Institutions are Located
Dependent variable: Dependent variable: Year-over-year Change in Federal Research
Funds
Dependent variable: Year-over-year Change in Federal Pell Funds
Type ofpostsecondary
institution:
Privateresearch
universities andmedical schools
Publicresearch
universities andmedical schools
Privateresearch
universities andmedical schools
Publicresearch
universities andmedical schools
(1) (2) (3) (4)Explanatory variable:
Bartik-type Instrumentbased on Change inFederal Research Funds
1.004***(0.183)
1.103***(0.146)
0.010*(0.005)
0.092***(0.019)
Simulated Instrumentbased on Change inMaximum Pell Grant
7.421(6.555)
0.067(0.751)
4.134***(0.750)
5.043***(0.639)
Pre-recession economiccharacteristics of county
yes, see notes yes, see notes yes, see notes yes, see notes
Observations 300 524 300 524
R-squared 0.403 0.483 0.219 0.464
Notes: The table shows estimates of the first-stage equations described in the text. Each columnrepresents a regression. Robust standard errors clustered at the institution level are shown inparentheses. Asterisks indicate p-values: *** p<0.01, ** p<0.05, * p<0.1. An observation is apostsecondary research university or medical school in a year between the 2006-07 and 2009-10school years, inclusive. All amounts are in real dollars, adjusted for inflation using the GDPdeflator. The dependent variables are the year-over-year change, in dollars, of federal researchfunds (columns 1 and 2) and federal Pell Grant funds (columns 3 and 4). The Bartik instrumentis constructed by applying the national rate of growth in a given federal agency's funding(national excluding the institution itself) to the institution's base year funding from that agencyand then summing over all agencies. See equation (4) in the text. The Pell-based simulatedinstrument is constructed by applying the change in the maximum Pell Grant to each institution'sestimated number of students eligible for the maximum grant in the base year. See equation (5)in the text. The pre-recession economic characteristics of the county are the following, all for the2006 year unless otherwise noted: the unemployment rate, per capita income, a house priceindex, the change in the house price index from 2000 to 2006, the number of stable jobs, thenumber of stable hires, the average earnings in stable jobs, farm income as a share of all personalincome, and population.
89
Appendix Table IIISpecification Checks for the Effect of Stimulus-Motivated Federal Funds on Private Research Universities and Medical Schools
Dependent variable is Year-over-year Change (minus pre-recession trend) in...
Totalexpenditure
Researchexpenditure
Instructionalexpenditure
Number ofemployees
(per $1000 offunds)
Total payroll Net tuitionrevenue
Institutionalgrant aid
Endowment
Year-over-yearChange in FederalResearch Funds
0.404(0.464)
0.097(0.162)
-0.270(0.243)
0.069(0.048)
0.193(0.212)
-0.063(0.087)
0.016(0.014)
Year-over-yearChange in FederalPell Funds
4.048(3.617)
2.558(1.873)
0.076(2.959)
-0.303(0.269)
12.285(10.096)
-1.198(1.049)
0.481*(0.290)
Ordinary LeastSquaresEstimates
Dependent variable is Year-over-year Change (minus pre-recession trend) in...
Totalexpenditure
Researchexpenditure
Instructionalexpenditure
Number ofemployees
(per $1000 offunds)
Total payroll Net tuitionrevenue
Institutionalgrant aid
Endowment
Year-over-yearChange in FederalResearch Funds
0.166(0.129)
0.268**(0.107)
-0.151**(0.069)
0.019(0.013)
0.181(0.137)
-0.073*(0.041)
0.027***(0.008)
Year-over-yearChange in FederalPell Funds
1.434(2.878)
1.026(0.618)
0.654(1.216)
0.103(0.190)
2.605(2.543)
0.791(0.585)
0.078(0.112)
Notes: The table shows estimates of equation (3) that are alternatives to the estimates shown in Table III. The notes for that tableapply, except that the bottom panel of this table reports ordinary least squares estimates and the top panel reports regressions thatinclude the pre-recession economic characteristics of the county in which the institution is located. These are: the unemployment rate,per capita income, a house price index, the change in the house price index from 2000 to 2006, the number of stable jobs, the numberof stable hires, the average earnings in stable jobs, farm income as a share of all personal income, and population.
90
Appendix Table IVSpecification Checks for the Effect of Stimulus-Motivated Federal Funds on Public Research Universities and Medical Schools
Dependent variable is Year-over-year Change (minus pre-recession trend) in...
Totalexpenditure
Researchexpenditure
Instructionalexpenditure
Number ofemployees
(per $1000 offunds)
Total payroll Net tuitionrevenue
Institutionalgrant aid
StateAppropria-
tions
Year-over-yearChange in FederalResearch Funds
-0.396(0.359)
1.205***(0.170)
0.612**(0.271)
-0.062(0.060)
-0.181(0.196)
0.377***(0.109)
-0.026**(0.013)
-0.313*(0.161)
Year-over-yearChange in FederalPell Funds
-0.008(1.398)
0.406(0.311)
1.249***(0.417)
0.156(0.141)
-0.527(0.669)
0.986***(0.337)
0.086*(0.046)
-2.361***(0.683)
Ordinary LeastSquaresEstimates
Dependent variable is Year-over-year Change (minus pre-recession trend) in...
Totalexpenditure
Researchexpenditure
Instructionalexpenditure
Number ofemployees
(per $1000 offunds)
Total payroll Net tuitionrevenue
Institutionalgrant aid
StateAppropria-
tions
Year-over-yearChange in FederalResearch Funds
-0.335(0.283)
0.852***(0.084)
0.320**(0.127)
-0.007(0.026)
-0.121(0.130)
0.220***(0.056)
-0.005(0.008)
-0.205*(0.120)
Year-over-yearChange in FederalPell Funds
0.049(0.548)
0.525**(0.209)
1.374***(0.267)
0.010(0.060)
-0.618(0.427)
0.950***(0.185)
0.022(0.023)
-1.617***(0.341)
Notes: The table shows estimates of equation (3) that are alternatives to the estimates shown in Table IV. The notes for that tableapply, except that the bottom panel of this table reports ordinary least squares estimates and the top panel reports regressions thatinclude the pre-recession economic characteristics of the county in which the institution is located. These are: the unemployment rate,per capita income, a house price index, the change in the house price index from 2000 to 2006, the number of stable jobs, the numberof stable hires, the average earnings in stable jobs, farm income as a share of all personal income, and population.