Available at: http://publications.ictp.it IC/2010/031 United Nations Educational, Scientific and Cultural Organization and International Atomic Energy Agency THE ABDUS SALAM INTERNATIONAL CENTRE FOR THEORETICAL PHYSICS DIELECTRIC RELAXATION OF WATER: THEORY AND EXPERIMENT Narayan Prasad Adhikari 1 Central Department of Physics, Tribhuvan University, Kirtipur, Kathmandu, Nepal and The Abdus Salam International Centre for Theoretical Physics, Trieste, Italy, Harihar Paudyal 2 Department of Physics, Birendra Multiple Campus, Tribhuvan University, Bharatpur, Chitwan, Nepal and The Abdus Salam International Centre for Theoretical Physics, Trieste, Italy and Manoj Johri 3 Department of Physics and Electronics, DA-V College, CSJM University, Kanpur 208 001, India and The Abdus Salam International Centre for Theoretical Physics, Trieste, Italy. MIRAMARE - TRIESTE June 2010 ________________ 1 Regular Associate of ICTP. 2 Junior Associate of ICTP. 3 Junior Associate of ICTP. Corresponding author. [email protected]
Transcript
Available at: http://publications.ictp.it IC/2010/031
United Nations Educational, Scientific and Cultural Organization and
International Atomic Energy Agency
THE ABDUS SALAM INTERNATIONAL CENTRE FOR THEORETICAL PHYSICS
DIELECTRIC RELAXATION OF WATER: THEORY AND EXPERIMENT
Narayan Prasad Adhikari1 Central Department of Physics, Tribhuvan University, Kirtipur, Kathmandu, Nepal
and The Abdus Salam International Centre for Theoretical Physics, Trieste, Italy,
Harihar Paudyal2 Department of Physics, Birendra Multiple Campus, Tribhuvan University,
Bharatpur, Chitwan, Nepal and
The Abdus Salam International Centre for Theoretical Physics, Trieste, Italy
and
Manoj Johri3
Department of Physics and Electronics, DA-V College, CSJM University, Kanpur 208 001, India and
The Abdus Salam International Centre for Theoretical Physics, Trieste, Italy.
MIRAMARE - TRIESTE
June 2010
________________ 1 Regular Associate of ICTP. 2 Junior Associate of ICTP. 3 Junior Associate of ICTP. Corresponding author. [email protected]
1
Abstract
We have studied the hydrogen bond dynamics and methods for evaluation of probability and relaxation time for hydrogen bond network. Further, dielectric relaxation time has been calculated by using a diagonalization procedure by obtaining eigen values (inverse of relaxation time) of a master equation framed on the basis of Fokker-Planck equations. Microwave cavity spectrometer has been described to make measurements of relaxation time. Slater’s perturbation equations are given for the analysis of the data. A comparison of theoretical and experimental data shows that there is a need for improvements in the theoretical model and experimental techniques to provide exact information about structural properties of water.
2
1. Introduction Liquid water is the most extraordinary substance. Liquid water has importance as a solvent, a solute, a reactant and a bio-molecule, for the structuring of proteins, nucleic acids and. H2O is the second most common molecule in the universe (after H2), the most abundant solid material and fundamental to star formation. The physical and chemical properties of water are of fundamental importance in numerous fields of science including planetary, physics, chemistry and biology [1]. Experimental techniques such as x-ray and neutron diffraction [2] have provided structural information on both ice and liquid water and their electronic and optical properties have been probed by x-ray Raman and x-ray absorption spectroscopy [3]. Nevertheless, many questions remain open to provide exact information about structural properties of water. From a theoretical point of view, ab initio calculations based on Density Functional Theory (DFT) [4] (has been shown to qualitatively account for various structural and dynamical properties of ice and water [5]. Recently Johnson et al. [6] have used broadband dielectric spectroscopy to study the dynamics of some hydrogen bonded glass forming liquids.
A great deal of theoretical and experimental studies for normal [7-11] and associated liquids [11-24] have been performed using molecular dynamics. The most important of the theoretical approaches for non-polar molecules (benzene, carbontetrachloride, cyclohexane etc.) are based on the linear response theory, (LRT) [25-29]. This approach takes into account the principles of Gaussian Statistics. The superposition of many uncorrelated events, produced by microscopic non-linearity, result in Gaussian Statistics. Exact predictions have been given [30] for normal liquids which do not possess the associated character. But because of non-linear behavior arising due to interactions between molecules and hydrogen bonding in liquids like water, significant departures from LRT have been reported [31] and Non-Gaussian statistics has been suggested [31] to interpret the relaxation mechanism in water. Bertolini et al. [14] have calculated time relaxation following an approach in which an adiabatic elimination procedure (AEP) has been applied to the Fokker-Planck equation to obtain an equation for rotational diffusion (dielectric relaxation). This five state model includes the transition rate from one molecular state to another and a stochastic variable to simulate the random change with time for the number of hydrogen bonds of the tagged molecule. These relaxation times are in reasonable agreement with the experiment values of Bertolini et al. [14] and Kaatze and Uhlendorf [15]. The results of these authors [12, 14, 15] do not give any indication about the phase transition and discontinuities observed by other workers [11, 13] in the temperature range −24oC to 50oC. Therefore we need to look into the details of the theoretical models and experimental techniques to conclude about necessary improvements in the model used by Bertolini et al. to explain the phase transition and discontinuities observed by Dahiya et al. [11], and Johri and Roberts [13]. The purpose of this paper is to review briefly the molecular dynamics discussed using the “reduced” model theory [RMT] for simple liquids to see the influence of intense external field and non-linear effects [32]. The RMT will be used to account for hydrogen bond dynamics in water. The AEP is
3
applied to the Fokker-Planck equation to obtain an equation for rotational diffusion. The solution of this equation is obtained with a diagonalization procedure which gives the eigen values (inverse of relaxation time) depending upon the transition rate from one molecular state to another and the stochastic variable. The correlation function, as a function of time and diffusion coefficient characterized by stochastic variable, is considered as the quantity which depends upon the environment. Microwave cavity perturbation technique will be discussed and Slater’s perturbation theory will be summarized to analyze the data of measured resonance frequency shift and width of the resonance profile as functions of permittivity ( '∈ ) and dielectric loss ( ''∈ ), respectively. The relaxation time is calculated using the method proposed by Johri and Roberts [13]. A comparison of experimental and theoretical data of relaxation time obtained by various workers is made.
2. Brief Review of Molecular Dynamics Using Reduced Model Theory (RMT) The molecular dynamics of simple and associated liquids has been studied using various theoretical approaches. Some of them currently in use are: (i) Adiabatic Elimination Procedure (AEP) (ii) Continued Fraction Procedure (CFP) (iii) Reduced Model Theory (RMT).
These three mathematical tools stem from the same theoretical background i.e., the Zwanzig-Mori projection technique. The memory function formalism and the projection techniques developed by Zwanzig and Mori give suitable theoretical support for a successful description of a wide variety of relaxation problems. The unifying role and the wealth of the perspective opened up by these techniques in the theory of relaxation can be compared with the ones provided by the renormalization group in field theory and co-operative phenomena. The AEP allows us to derive a reliable Fokker-Planck type of equation, CFP is founded on the projection technique applied to the Heisenberg picture. The RMT has recently been applied to molecular examination in the liquid state. Earlier attempts using the modeling approach are based mainly on the generalized Langevin equation of Mori, which is linear in nature. The non-linear version of this approach using AEP and CFP is given in reference [8]. The linear version of RMT has been given by Evans et al. [33]. The main aim of the RMT is to replace complex models consisting of multidimensional variables to the variables influenced by friction and stochastic forces. Although RMT is not purely phenomenological and its choice is not completely free but it has been tested by many workers in the case of intense external field and unassociated and associated liquids. Grigolini [32] has given a good description of these theoretical approaches.
4
Various other theoretical models [34-42] have been developed which more or less allow the anomalies of static behaviour of liquid water to be explained qualitatively. Belch et al. [34] and Rice et al. [35] have given an effective Hamiltonian approach which describes the structure of water and is limited to the short time dynamics of water in the stable region 0oC < T < 1000 C. These models are based on the discrete stochastic variables [36, 37]. These workers in [36, 37] and Stillinger [38] studied microregions in water, especially when supercooled region in water is attained. The two state theories of water are also available [39, 40]. The multistate system (five states system) of water considering stochastic variable has been given by Grigolini and his co-workers [7, 12].
2.1 Hydrogen Bonded Liquids (associated liquids) In our earlier discussion RMT was applied to normal (unassociated or simple) liquids. We can summarize that RMT can provide a theoretical background for the description of the macroscopic effect of hydrogen bonded dynamics in liquids like H2O. As mentioned above the fluctuating character of the virtual potential naturally stems from the H-bond dynamics. To make this intriguing feature clear it is useful to emphasize on water, even if the model can be used to describe other H-bonded liquids both in the stable and metastable (super cooled) conditions, water has [19, 43] properties which turn out to be anomalous even when compared with other H-bonded liquids (alcohols, for instance). The characteristic features can be traced back to the indigenous aqueous properties of connectivity and to co-operative phenomena [44] of the H-bond network. As to the longtime diffusional properties, the remarkable deviation from Arrhenius behavior in the super-cooled region can be related to some structural contributions coming from the hydrogen bond and its dynamics within the frame. Agreement of these points is fairly general. However, one can find in the literature only a few attempts at developing an exhaustive theory for rotational diffusion (dielectric relaxation) and translational diffusion (self diffusion) in the longtime and short time scales. However, the small corrections to the classical relaxation introduced to describe water behavior do not involve H-bond dynamics. It will be interesting to obtain a coherent description of dielectric relaxation and self diffusion on H-bond dynamics in order to explain the experimental data at temperature where the H-bond plays a fundamental role. It is also important to find a possibility of relating longtime to the short time dynamics. The time range for computer simulation experiment is 14 1610 10 s− −τ = − (structure I) for mean vibrational structure 1310v s−τ = (structure V). For ice Ih, at the melting temperature 1310v s−τ = and
110 1.8 10 s−τ = × , respectively. The mean life time of the hydrogen bond τHB assumes [15] values
intermediate between the characteristic time of structure V and structure D (τHB = 9 × 10⁻¹³ s). In the following discussion we will describe the structure D of water. For such a discussion, we need two
5
parameters out of three parameters [the probability that a randomly considered hydrogen bond is intact Pβ, the mean time during which the hydrogen bond remain broken (τf) i.e., death time and the mean “life time of the hydrogen bond τHB]. These parameters can be calculated from experimental data (density and depolarized Rayleigh scattering at various temperatures) and compared the prediction of theory with the observed diffusional properties of water. It is useful to define the hydrogen bond. The hydrogen bond is intact if the energy V(x) is less than a threshold value VHB otherwise the bond is broken. The hydrogen bond is intact if the distance R between two molecules is shorter than a value Rmax and at the same time the angles are smaller than some threshold values δ0 and θ0 otherwise the bond is broken. The definitions given above are on-off definitions which lead us to associate with the hydrogen bond mean bond breaking energy, probability PB that a bond is randomly intact. The statistical description of the H-bond network will be greatly simplified (independently of the potential one assumes). If a sufficiently “strong” definition of the bond is used (VHB = (-3)-4 kcal/mol). With this assumption for the hydrogen bond, it turns out that a water molecule is able to form in the liquid at most four bonds and the fractions of the molecules with i intact hydrogen bonds ( 0,1....4)if i = follows binomial
distribution [36, 45, 46]
14)1(4 −−⎟⎟⎠
⎞⎜⎜⎝
⎛= B
iBi PP
if
(2.1)
where4
BB
nHP = .
Fig. 2.3: Liquid water maintains a memory of the tetrahedral structure of ice.
In Fig 2.3 liquid water maintains a “memory” of the tetrahedral structure of ice and moreover in the liquid phase, the four hydrogen bonds (the “natural bonds”) are virtually equivalent. Using a “weak” definition of the bond, a greater number of hydrogen bonds than the “natural” is obtained, and the quantity HBn tends to be the number of nearest neighbours of a molecule.
6
The computer experiment suggests six bonds, four bonds to be equivalent, with probability PB and the other two, with probabilities '
BP and ''BP , are bonds with an attractive energy lower than that of the four
equivalent bonds. If 0''' == BB PP , the two bonds with probability 'BP and ''
BP are bonds with an
attractive energy lower that of the four equivalents bonds with probability PB. If a “strong” definition of the hydrogen bond is used, the two low probability bonds are not important. The mole fractions fi can be calculated using the following equations.
40 (1 )Bf P d= −
3 41 4 (1 ) (1 )B B Bf P P d P m= − + −
SPmPPdPPf BBBBB4322
2 )1()1(4)1(6 −+−+−=
mPPSPPdPPf BBBBBB2233
3 )1(6)1(4)1(4 −+−+−= 2234
4 )1(6)1(4 BBBBB PPmPPdPf −+−+=
4 35 4 (1 )B B Bf P m P P S= + −
SPf B4
6 = (2.2)
where ' ''(1 )(1 )B Bd P P= − −
' '' '' '(1 ) (1 )B B B Bm P P P P= − + −
' ''B BS P P=
Different potentials have been used for the calculation of if of water molecules with i intact bonds.
The ST2 potential [47] gives ' ''0.867, 0.13, 0.06B B BP P P= = = and from SPC potential [47], given PB =
0.837, ' 0.13BP = and 06.0" =BP using the parameter HBτ and fτ , it is possible to define PB through
the following relations [48].
PB = fHB
HB
τττ+
or f
HB
ττ
= B
B
PP−1
The transition rate from the ith to the jth molecular state is denoted by ijK and its value is drawn as a
function of 1−HBτ and. 1−
fτ . We must derive the parameter PB and HBτ necessary to describe the H-bond
dynamics, and the number of unbroken (intact) bonds per molecule ( 4 )nB BH P= . The calculation of PB
has been done by Stanley and Teixeira [36]. The hydrogen bond life time HBτ , a fundamental
parameter for water has been considered by other workers, some of whom [21, 49, 50, 51] suggested the use of depolarized Rayleigh scattering experiments to measure this quantity. These experimental results are themselves different from each other. In these experiments the observed frequency spectrum consists of two distinct Lorentzians, the line width of broader one, being interpreted by these authors as the inverse of HBτ . This has been explained through the fact that the scattering amplitude is
7
proportional to the optical anisotropy correlation function, a quantity which the breaking of a hydrogen bond modulates in time a process that effects the optical anisotropy of water therefore the linewidth is the inverse of the average life time of the hydrogen bond. An Arrhenius like behaviour for HBτ is
always observed
HBτ = A’ exp ⎟⎟⎠
⎞⎜⎜⎝
⎛−
T
S
RE
(2.3)
with ES = 2.5 to 3 kcal/mol. Figure 2.4 gives Arrhenius fitting of the experimental values obtained by authors in [21].
Figure 2.4: Arrhenius fitting of the experimental values obtained by authors [21].
Recently some authors [52, 53] succeeded using differential potential in molecular dynamics experiment in evaluating the dependence on temperature of HBτ . Although the values so obtained are quite different from those in Fig. 2.4, ( )Tfτ , which is the time during which the hydrogen bond remains broken, has been calculated using the relation BBHBf PP /)1()( −= ττ and it is nearly temperature independent in the range considered. The different behavior of HBτ and fτ with varying
temperature depends on the different meanings of these two times, the breaking of a hydrogen bond depends on thermal phenomena alone, while the formation process depends, on both the same thermal phenomena and the number of the broken hydrogen bonds available. These are the phenomena of the opposite types which in the stable region of water tend to cancel one another. A reasonable way of calculating PB (T) when the geometrical properties of the patches f4 are taken into account is the use of the following formula ρ = uρ uρ + gelρ (1-fu ) (2.4)
from which we derive
8
PB = ( ) ( )[ ] 4/14/ ρρρρ −− gelgel (2.5)
where f4 = 4/1
BP , ρ = average density. The micro-region of molecules with four intact hydrogen bonds can be thought of as having a density uρ , virtually equal to that of the tetrahedral structure of ice Ih at the same temperature. The remainder of the liquid will have an average density gelρ which can be
derived by extrapolating to low temperatures the behaviors of the density of water below the percolation threshold. In this region the connective phenomena concerning the fraction fu =
1/ 4
BP are probably negligible. A fitting procedure is used for calculation of gelρ
The disagreement is the same (within 0.1%) as reported in different experiments [54, 55]. Moreover, Lebland and Hareng [56] have obtained almost the same result for gelρ by extrapolating the super heated water. The ice density to be used is obtained by fitting the ice density from -100oC to 0oC [57, P.104] and extrapolating this fitting up to a temperature greater than 0oC. The following relation was used.
67378.191671.0 −== iceu ρρ x 10-4 T -3.58125 x 10⁻⁷ T2 + 2.0833x10⁻¹⁰T3 (2.7)
where T is in 0oC. The values of ρ assumed are from ref. [58] for water in the stable region and ref.
[59] for the super-cooled region. Thus with the knowledge of ρ , gelρ and 4ρ we can calculate ( )BP T
using the usual relation for the rate processes, obtaining the activation energy EHB for H bond formation by using the following equation
1 ( )( ) exp( )B HB
B
P T EK T AP T RT− ⎡ ⎤= = −⎢ ⎥⎣ ⎦
(2.8)
which shows the Arrhenius trend in the range −20oC to 100oC with A = 28, a value which is much greater than A = 1, as predicted by two state theory. The value EHB = 2.4 kcal/mol agrees with the one calculated with data from different experimental techniques [60]. Various other workers [61, 62] have used different approximations for evaluating ρ using geometrical properties. The value of PB (T) has
also been obtained [63, 64] using infrared and Raman spectroscopy data.
9
3. Fokker-Planck Equation and Calculation of Dielectric Relaxation Time for Water RMT is especially suitable for organizing information provided by both computer and real experiment into a coherent and unified way. A master equation is used to present a model for the diffusional dynamics of water. The rotational diffusion leads to the dielectric relaxation mechanism. We introduce a stochastic variable n to simulate the random change with time of the number of the hydrogen bonds. Four possible “states” for the molecule are obtained as the number of hydrogen bonds changes from 0 to 4. The corresponding state of the liquid can be written as
4
0( ) ( ) |i i
lt P t n
=ψ = >∑ (3.1)
The time evolution of the probability ( )iP t is given by the following master equation.
inji
ijni tPKtPKdt
tdP)]([)()(
)( 4
0== ∑
= (3.2)
where ijK is the transition rate from the thi to the thj molecular state. It is assumed that
simultaneously breaking or forming of two bonds are statistically negligible. Fig. 3.1 shows hydrogen-bond dynamics of water.
Figure 3.1: Sketch of H-bond dynamics of H2O, if is the mole fraction with i intact hydrogen bonds
(•) and (o) broken hydrogen bonds
K ii - 1 = HBτ10
1(i=1,……..4); K ii +1 =
f
iτ10
4 −(i=0,……..3)
There are two important points to be mentioned (i) After time equal to HBτ (Tf), one hydrogen bond of
the molecule must have been broken (or formed) in the five molecular states. For example, for a molecule in state |n4> there are four ways to get the state |n3> each corresponding to breaking one of its
hydrogen bond (4 in 4→3, 3 in 3→2, 2 in 2→1, 1 in 1→0). We get for the velocity K43=HBτ10
4 . (ii)
The breaking and forming of a bond are statistically independent events.
10
The main steps of RMT are given below: (i) The set of dynamical variables of interest is enlarged via inclusion of a few additional variables
(usually termed auxiliary or virtual). This serves the two fold purpose of providing a simplified picture of the real thermal bath and recovering a distinct time scale separation between relevant and irrelevant parts. The system of interest plus the set of virtual variables behaves like a mesoscopic system. [The experimental signals usually slowly by moving are relevant and are termed macroscopic. The remaining variables, called degrees of freedom, usually fast moving, do not exert a direct influence on the experiential signals are called irrelevant].
(ii) Projection techniques are applied to this mesoscopic system (between microscopic and macroscopic) so as to serve the important purpose of exploring the long time behavior with simple analytical expansions which are further related to the short time behavior. Now we will apply these ideas to water. RMT suggests that we should simulate the environment of the tagged molecule through the rototranslating virtual body. The potential V governing the interaction between the real and virtual bodies will be assumed to depend on relative orientation and translation co-ordinates. We assume that V and the fluctuation and dissipation process driving the virtual body depends on variable n so as to simulate the effects of the H-bond dynamics. The random motion of the stochastic variable n will also explore the stages with intermediate values of potential and stochastic torques (forces). The macroscopic properties of the system will depend on the averages of all these states. This leads to the following system of equations [from five state generalization of equation (3) of ref. [16] called Fokker Planck equations].
•μ = ω × μ (3.3) •
iω = )(/
RiIV θ∂∂− + )(R
ir kj ωω . (3.4)
))(()),((../ )()()()( tnfvttnrvvr
IVv v
iiv
ikjv
ivi
i +−+∂∂
−=• ψ (3.5)
ΩΔ•
= →k ( ΔΩ,, ii ων ) (3.6)
R
ii m
xvv ∂∂−=
• / (3.7)
))(),)(()),(( )()( ttnfwttnrm
yv wii
wi
v
iiw +−
∂∂−=
• (3.8)
vwt rr−=Δ (3.9)
The tagged molecules with mass mR and moments of inertia ( )R
iI interact via the potential V with a virtual body with mass mv and moments of inertia ( )v
iI . The moments of inertia are related to the corresponding principal axis system. ΔΩ and TΔ
→→−≡ ry orientation and position of virtual body
11
relative to real body fixed frame, xr and yr are the co-ordinates of the centers of the gravity of real and virtual body, respectively. The corresponding velocities are defined by
•→− rV ,
•→= YW . The orientation
of the principal axis system, the real body, is referred to as the laboratory frame v1 with the Euler angles Ω = (α, β, γ), whereas the orientation of the virtual body is related to this principal axis system via ΔΩ = (α′, β′, γ′).
The best way of expressing the equation of motion of the angular velocity ω is to refer it to the principal axis system of the real body. This makes the non-linear term kj
Rir ωω)( (the Euler term).
Here
)/( )()()()( Ri
Rk
Rj
Ri IIIr −= (3.10)
, ,i j k are the cyclic permutation of the indices 1, 2, 3. The translational motion is described easily in
the laboratory frame. The influence of the virtual body on the time evolution of ω is exerted via the
derivative
⎟⎟⎠
⎞⎜⎜⎝
⎛ΔΔ
Δ=⎟⎟
⎠
⎞⎜⎜⎝
⎛∂∂
→ iii
Vvθθθ 0
lim
where θi is an angle of rotation around the ith principal axis. In a similar way we can define , , .v
i j kv r v vr
via the infinitesimal rotational angle Δψi around the ith axis of the virtual body. Equations (3.5) and (3.6) are just standard Langevin equations where v
iγ and ωγ i are the rotational and translational friction
coefficient of the virtual body. ( ) ( ),v wi if f are the corresponding stochastic torques and forces, ( )v
if and ( )w
if are supposed to be Gaussian white noises defined by following equations
)(.).(2)()( )(
1 tnDtfof ijij δδννν = (3.11) ( ) 2 ( )( )v vi i iD n v= γ (3.12)
( ) ( ) ( )(0) ( ) 2 .( ). . ( )w w wi j if f t D n ij t= δ δ (3.13)
Dωi . (n) = ωγ i (3.14)
Equation (3.6) expresses the time derivative of ΔΩ (the relative orientation between real and virtual
body) in terms of →υ ,
→ω and ΔΩ themselves. The corresponding translational term is given by
equation (3.9). Although equations (3.3) to (3.9) formally depend on n, no relevant assumptions have been made so far about the statistical properties needed to simulate correctly the environment of the tagged molecule. In principle, since the potential V is not linear equations (3.3) to (3.9) can be used to
simulate the non-Gaussian, non-Markovian behavior of the variable →ω and
→υ , as well as the
rototranslational phenomena [61].
12
It is worth mentioning that the non-Gaussian non-Markovian behavior depends on the presence of the virtual body and the non-linear nature of the potential V in spite of the Markovian Gaussian character of the fluctuation dissipation process governing the stochastic torques v
if and the stochastic forces )(ω
if . Also the multiplicative nature of the stochastic variable produced significant non-Gaussian
effects on the variables of interest. The Fokker-Planck equation associated with equations (3.3) to (3.9) belongs to the family of stochastic Liouville equation [62]. By applying adiabatic elimination procedure (AEP) to the Fokker-Planck equations (3.3) to (3.9) we can obtain an equation for dielectric relaxation (rotational diffusion)
( ) 4( ) ( )
0
( )( ) ( ) ( ) ( )
ii j
R i n ijj
d tD n t K t
dtμ
μ μ=
φ= − φ + φ∑ (3.15)
0,1....., 4i = where ( )n ijK is defined by equation (3.2) and ( )i
μφ is a correlation function
ii nt);().0()( μμφμ = (3.16)
Here we have to remember first of all that the equations corresponding to the rotational part are all written in the reference frame of the molecular principal axis. By making a transformation from this reference system to that of the laboratory we have
∑ Ω=i
lklk TD )()1(μ (3.17)
where kμ and Tl are the spherical components of the dipole moment in the laboratory and the molecular frame of reference, respectively. (1)
klD are the first rank Wigner matrices [63]. In equation
(3.15) the quantities depending on the environment are ( )i tμφ and the diffusion coefficients )(niDR in
the solution of equation (3.15) can be obtained with the diagonalization procedure which gives for the eigen values ( )iλ equations
det || [ ( ) ] || 0R i nD n K I− λ + = (3.18)
In consequence, to determine the eigen values which are the inverse of the relaxation times, we simply need to find a way of evaluating the coefficients of rotational diffusion DR(ni) in the various environments and to solve equations (3.18). A reasonable evaluation of DR( iη ) can be given in the following consideration and hypotheses.
13
(i) DR( iη ) vs 1/T shows an Arrhenius – like behavior on activation energy Ei. increasing with
(i=1….). (ii) The condition DR( 4η ) , DR( 3η ) << K ij is valid.
(iii) The rotational diffusion process related to DR(η i) is responsible for the observed deviations from
Debye behavior of water in the tetrahertz region. (iv) The activation energies of DR( 0η ) and DR ( 1η ) are assumed equal to the corresponding
activation energies of DT( 0η ) and DT( 1η ), respectively.
The physical basis of this assumption is the observed temperature independence of the quantity . DD τ
r
for a non-associated liquid, Dr
being the self diffusion coefficient.
An illustrative example: Let us consider ( )RD nμ . The tetrabonded molecules ( )uf tend to clump with each other, so we are led
to assume that the diffusion coefficient in this environment is given by a mean value with the same
order of magnitude as 17 )(101 −−= psiceDτ
at 0oC. ( 10 )iceD sτ = μ . As to DR( 0η ), the rotational diffusion
coefficient in the environment without intact hydrogen bonds, this coefficient must be of the same order of magnitude as the rotational diffusion time found in very dilute aqueous solution in non-polar liquids [8] like benzene, carbon-tetrachloride, cyclo-hexane etc., i.e. D sol
R ( 0η )= 25(ps)-1 at 25oC. On the other hand in the range from −30oC to 100oC the coefficients ijk , which define the H-bond
dynamics turn out to be 0.1 < 11.5( )ijk ps −< . As a consequence DR( 4η ) << k ij ; whereas
0( )R ijD n k>> . These results suggest a first approximation corresponding to the condition
0 1( ), ( )R R ijD n D n k>> (3.19)
and
3 2( ), ( ), ( )R u R R ijD n D n D n k<< (3.20)
On an intuitive ground basis we can imagine the molecules with 2, 3, 4 intact hydrogen bonds as being dynamically hindered, thereby characterized by low diffusion coefficients, whereas molecules with 0 or 1 bonds, placed either outside or at the boundary of the most structured regions have longer diffusion coefficients. This point of view is similar to that of Magat and Reinisch [18, 64]. When H-bond network is structured enough to bring water above the percolation threshold the largest relaxation time can be regarded as being at a first level of approximation, the time of resident in the structured region (“immobile” fraction [14, 36]). This relaxation time corresponds to the characteristic time of the principal dielectric relaxation bond.
14
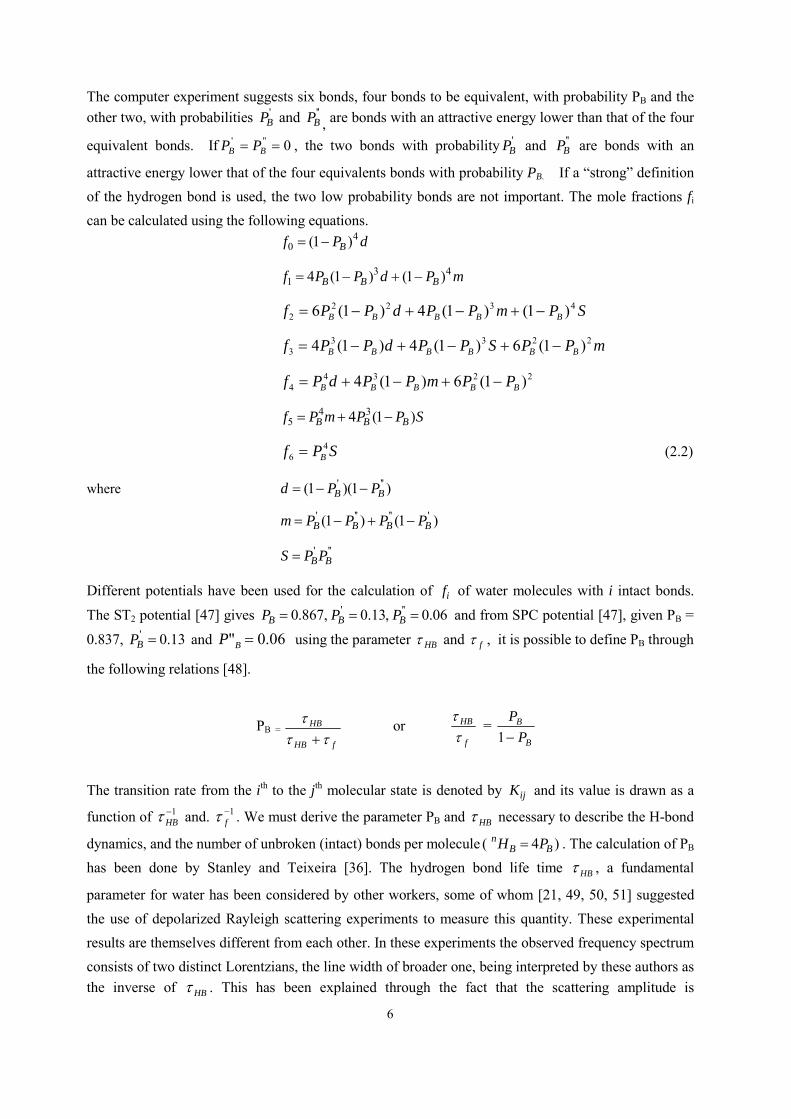
4. Cavity Perturbation Equations and dielectric Relaxation Time There are three important common possibilities of cavity perturbation
(1) tan 0E ≠ over S ∴ ˆ 0S
n Eda× ≠∫r
walls may not be perfect conductors i.e., there may be some
resistive losses. (2) Cavity may have certain windows or waveguide output therefore there will be some escape of
energy i.e.,
tan 0H ≠ i.e., ( ) 0asn H E da× ≠∫
r rr
(3) The cavity may contain current in phase with voltage to give resistive losses obeying ohm’s law.
. 0J Ea dv ≠∫r r
.
In the presence of these conditions there will be damped oscillations. For a damped condition of the
cavity one can write 010
0=+⎟⎟
⎠
⎞⎜⎜⎝
⎛−
Qj
ωω
ωω
For small perturbation we can write the resonant frequency 0ωω ≠a where aω is the frequency for any mode and 0ω is for any oscillation but if 0ωω ≠a then aa ωωω Δ+≈0 where Δ ω a is a small
perturbation then
a
aa
aj
Qj
ωω
ωω
ωω Δ
=+⎟⎟⎠
⎞⎜⎜⎝
⎛− 21
Arranging the terms and assuming 2( ) 0awΔ →
aa
a Qj ωω
ωω Δ++=2
02
)(2 0 =Δ
+−
−a
a
aQj
ωω
ωωω
aa
a jjQ ω
ωωωω 02
21 −−=
Δ−
(4.1)
Using the solution of the type eiω t in equation
( )2
20 0 0 '2 . . . ( . (a a a a S a a aS
d E E dv K E E dv J E dv n da K n dadtdt
⎡ ⎤∂∈ μ + = μ − ×Η).Ε − ×Ε).Η⎢ ⎥⎣ ⎦
∫ ∫ ∫ ∫ ∫r r r r r r r r rr r
Now dividing the previous equation by 0 0 0 aE E dvμ ∈ ∫
r r and equation 4.1 we have
∫
∫
∫
∫∫∈
+×
∈−
∈×
−=Δ
−
∧∧
dvEEdvEJ
dvEE
dEHndaHEnjJ
Q a
a
a
aaS
a
aS
a
ai
.
.1.
).(1)(
.)(1
000021
002 ωωμωω
ω
15
The first two parts of the equations deal with perturbation (1st and 2nd possibility) which depend upon construction and connection of the cavity under the no load condition. The third term on the RHS deals with losses and frequency displacement due to currents in the cavity. For using these expressions either first or second term should be zero by taking perfect conductor. Further, there should be no energy loss due to outputs connection of the cavity which may not be possible practically. The second possibility is to take the measurement relative to these terms under the relative measurement one can write
0
1 1 1Q Q Q− = Δ
0
1Q
= 1st and 2nd term.
0
.1 2.
aa V
a a a
J E dvWjQ W w E E dv
⎛ ⎞ ΔΔ − =⎜ ⎟⎝ ⎠ ∈
∫∫r
This equation is applicable in the situation in which perturbation is due to the current produced within the cavity by introduction of the sample. For the first derivative
⎟⎟⎠
⎞⎜⎜⎝
⎛ Δ=Δ
031
fQω
The second derivative for our purpose
0
1fQωΔ
=⎟⎟⎠
⎞⎜⎜⎝
⎛Δ
Then ∫
∫=Δ
−Δ
dvEEdEJ
ffj
fa
a
...
20000 ωε
ω νν
The only problem left is to find J where J is the current density due to currents in the sample
)exp(0 BztiEE −=∴ ω .
J may have ohmic character or J may have non-ohmic character. This will depend on the type of the sample used. In the case of liquids E in the numerator will not be E but a value corresponding to the sample. Let that internal field or local field be ES. Then
16
0
.1 ''.
s av
av
E E dvWQ f E E dv
⎛ ⎞ ΔΔ = =∈⎜ ⎟⎝ ⎠
∫∫
r r
(4.2)
0 0
.' 12 .
s a
a
E E dvff E E dvΔ ∈ −
= − ∫∫
(4.3)
The negative sign represents dielectric sample and negative shift. Dividing equation (4.2) by equation (4.3) we get for the second derivative of the resonance profile
'' ''tan2 ' 1 '
Wf
Δ ∈ ∈δ = = ≈
Δ ∈ − ∈
which is true only if Debye relaxation is assumed and ' 1∈ >> . But for the case of water neither the Debye relaxation mechanism is true nor approximation taken for tan δ. For water a formula recommended by Johri and Roberts [13] should be used to calculate the relaxation time;
⎟⎠⎞
⎜⎝⎛+
⎟⎠⎞
⎜⎝⎛
=−′′′
∞
2sin1
2sin
π
π
εεε
Pr
Pr
P
P
where ααωτ ,1, −== pr is Cole-Cole distribution parameter and ω is the angular frequency. For water 4.9∞∈ ≈ may be assumed.
Figure 4.1: A block diagram of the experimental apparatus used to conduct this investigation.
17
5. Method of Measurement Using Microwave Cavity Spectrometer A block diagram of the microwave cavity spectrometer used in the laboratory is given in Figure 5.1. A reflex klystron was used to generate a signal frequency near the cavity resonance by setting voltage and mechanical tuning. A saw tooth ramp voltage, derived from the time base of a Tektronic model 561oA oscillator sweeps the klystron over the range of the frequency derived while simultaneously a chopper signal of 31 KHz is impressed upon klystron repeller electrode to produce an a.c. signal of that frequency at the detector. This arrangement allows for a synchronized sweep of frequency with the voltage scan of the oscilloscope. Moreover, the 31 KHz signal enables high gain tuned amplifiers to be employed to detect the signal arriving at the r.f. detector. The second derivative of the signal was displayed on one channel of H oscilloscope. The other channel of the oscilloscope serves as a means of calibrating the frequency axis of the sweep. This channel consists of the Klystron and C marker mixer arrangement. Signals from the Klystron are sent to the marker mixer, along with the harmonic of the frequency standard, and comparison is made between these two signals using a tuned receiver (Hammuland model HQ180A). Two markers k sf nf− and s knf f− , where kf is the Klystron frequency and snf is the proper harmonic of the standard signal source, were generated and displayed
on the second channel of the oscilloscope. The separation of this marker was set to 4 MHz. To have a permanent record of the second derivative of the cavity resonance frequency ar, the markers, a chart recorder was also used. A cylindrical microwave cavity with internal diameter 4.9 and a quality factor of about 5000 was used to open in the TM010 mode. Temperature control of the sample was achieved by flushing chilled or steam heated air around the resonance cavity with the help of a copper pipe heat exchanger placed in a Dewar flask or in boiling water. The rate of flow was adjusted as required to maintain the sample and the cavity at the equilibrium temperature. The cavity was thermally isolated and shielded in order to help in maintaining the temperature as stable as possible. The sample temperature was measured by a thermocouple, attached to the sample holder and read by an analog voltmeter calibrated and referenced in the standard manner. H2O, 0.0279 cm3 volume, in a glass tube was placed along the symmetry axis of the cavity. The measurements of the resonance frequency, shift and width were taken before and after putting the sample in the cavity at specific temperature. Then the temperature was changed in suitable steps over the temperature range of interest. Higher temperatures above than 323 K were not attempted as temperature affects cavity and the shape of the resonance profile is deformed, which makes it difficult to locate exact points to measure the width of resonance.
6. Comparison of theoretical and experimental results A comparison of the theoretical results obtained [12] with conditions (3.19) and (3.20) along with the measured data of Bertolini et al. [12]; Kaatze and Uhlendorf [15]; Dahiya et al. [11] and Johri and
Roberts [13] are given in Fig. (6.1). The agreement between Dτ and 0
1λ
is specially get in the low
18
temperature region when the theoretical [12] and experimental [13] results are compared. But discrepancies are found between these theoretical relaxation times and the measured value of Kaatze
and Uhlendof [15] and Johri and Robets [13] for higher temperatures. Also the theory outlined in this work is far off the experimental relaxation times of Dahiya et al. for low temperature. Interesting features of phase transition [11] and discontinuities observed [13] need an improved model for their interpretation. Furthermore, the eigen values of eqn. (3.18) correspond to frequencies much higher than the characteristic frequency of the first bond. Therefore, this theoretical result only partly reproduces the experimental data at microwave frequencies using the single relaxation mechanism proposed by Debye [65]. It appears that the model used [12] does not explain the multi relaxation mechanism and is limited in its application to the specific range of frequency. For water one must use a relaxation mechanism different from the Debye relaxation mechanism.
Figure 6.1: A plot of the relaxation time τ (pico-seconds) for water as a function of temperature. Results from this work and those available in the literature are given. (a) Stearn and Eyring [14]; (b) Hand Book of Chemistry and Physics [17]; (c) Dhaiya et al. [11] and (d) present work.
7. Concluding Remarks RMT is a good model to provide useful predictions concerning the structure of normal and associated liquids, although it is not completely phenomenological. A simple analytical expression can be obtained only in the rotational case, where complete agreement between theory and experiment can be achieved. Comparatively good agreement in the translational case requires further investigation. It may be interesting to obtain a coherent description of dielectric relaxation and self diffusion based on H-bond dynamics in order to explain the experimental data at temperatures where the H-bond plays a fundamental role. Also, it is important to find the possibility of relating long-time to short-time dynamics, weak coupling and strong coupling cases and influences of weak and strong fields. The networks of hydrogen bonds and the dynamics associated with them give water special non-Gaussian properties distinct from those of simple fluids i.e. the macroscopic properties of water cannot be fully accounted for in terms of linear physics. In case of Gaussian statistics the linear response theory (LRT)
19
would lead to exact predictions. These points have been recently emphasized by Grigolini in his work. At fields on equilibrium, the Grigolini decoupling effect appears from a slightly more complicated RMT. The models which are invalidated by RMT cannot reproduce the same basic features such as the de-excitation effect. RMT is a method imposed by the most general theories of relaxation. The slowing down of average associated with angular velocity and therefore the acceleration of the fall transient, are both natural outcomes of RMT. The non-linear statistics stem from the mesoscopic level, a system with a time scale intermediate between microscopic and macroscopic systems. The probability PB and relaxation time for hydrogen bonding HBτ are important fundamental
parameters to discuss H-bonded dynamics and to calculate the activation energies. The evaluation of these parameters although having different values reported by theoretical and experimental works are not too far off the true values. PB cannot be derived in a straightforward manner from the computer simulation, even if this turns out to be useful as a checking tool. In the theoretical model, based on Fokker-Planck equations, use of AEP and RMT including stochastic variable for five states explain the dielectric relaxation behavior well within the principal dielectric bond in water governed essentially by the H-bond network, where the molecule interacts only with its first neighbors through the hydrogen bond. The effect of high order neighbours may improve the discrepancies between theoretical and experiment results at higher temperature greater than 0oC. When corrections for dipole moment for various stochastic variables are included, agreement is improved as noted by Evans et al. [7]. For a more accurate calculation given by Bertolini et al. [7] knowledge of DR(ni) is necessary, whereas with assumptions (3.19) and (3.20), the result is independent of the particular values of their coefficient. The experimental result reported by Dahiya et al. [11] and Johri and Roberts [13] and Johri et al. [66] are not explained by the theoretical model proposed by Bertolini et al. [7]. For a completely satisfactory model which allows prediction of the observed dielectric spectrum of water much work is still necessary. A theory for dynamics should be comprehensive and coherent to account for the thermodynamic and structure properties of waters. Finally, it is concluded that there is need for improvements in theoretical model and experimental techniques to provide exact information about structural properties of water. Acknowledgments: The present work has been carried out within the framework of the Associateship Scheme of the Abdus Salam International Centre for Theoretical Physics (ICTP), Trieste, Italy. The authors (NPA, HP and MJ) are grateful to ICTP for providing the necessary facilities and literature for the present work. MJ also thanks Prof. Paulo Grigolini and James A. Roberts (UNT, USA) for useful discussions and measurements and the late Prof. GK Johri for inspiration.
20
References 1. F. Franks, Water: A matrix of life, Roy. Soc. Chem., Cambridge, UK, 2nd Ed., (2000). 2. T. Head- Gordon and M.E. Johnson, Proc. Natl. Acad. Sci. USA. 103 7973 (2006); A. K. Soper,
J. Phys. Condensed Matter 19, 335206 (2007). 3. M. Leetman et al., J Chem. Phys. 125, 244510 (2006). 4. P. Hohenberg and W. Kohn, Phys. Rev., 136. B864 (1964); W. Kohn and L J Sham, Phys. Rev.
140. A1133, (1965). 5. J.C. Grossmann, E. Schwegler, and G. Galli, J. Phys. Chem. B 108, 15865 (2004); E.
Schwegler, J.C. Grossmann, F. Gygi and G. Galli, J. Chem. Phys. 121, 5400 (2004). 6. Helen Jansson, Rikard Bergman and Jan Swenson, J. Mol. Struct. (2010). Doi: 610,1016/J.
molstruct.2010.01.172. 7. M.W. Evans. P. Grigolini and G.P. Parravicini. Memory Function Approaches to Stochastic
Problem in Condensed Matter, Adv. Chem. Phy. 62, 1985. John Wiley & Sons New York. 8. C.J. Reid and M.W.Evans, In Molecular Interactions Vol 3, H. Ratajezak and W.J. Orville –
Thomas, eds., Willy, New York (1982). 9. M. Ferrario, P. Grigolini, A. Tani, R. Vallauri and B. Zambo “Non linear effects in molecular
dynamics of the liquid state, Adv. Chem. Phy 62 225-275 (1985). 10. M. W. Evans. “Molecular Dynamics: Intense External fields.” Adv Chem. Phy 62 183−223
(1985). 11. J. N. Dahiya, S.K. Jani and J.A. Roberts, “Phase transition studies in polar and non-polar liquids
at microwave frequencies”. J. Chem. Phys. 74 3609-3615 (1981). 12. D. Bertolini. M. Cassetari, M. Ferrario, P.Grigolini and G. Solvetti “Dynamical properties of
hydrogen bonded liquids”. Adv. Chem. Phys. 62 277-320 (1985). 13. G. K. Johri and J.A. Roberts. ‘A study of the dielectric response of water using a resonant
microwave cavity a probe, J. Phy. Chem. 7386-7391 (1990). 14. D. Bertolin, M. Cassetari and G. Salvetti, J. Chem. Phys. 76, 3285 (1982). 15. V. Kaatze and V. Uhlendorf, Z. Phys. Chem. NF, 126, 151(1981) 16. J. B. Hasted, In Water, A comprehensive Treatise, Vol. 1, Franks, ed. Plenum, New York, 1972. 17. M. N. Afsar and J.B. Hasted, Infrared Phys. 18, 835 (1978). 18. J. E. Anderson, J. Chem. Phys. 47, 4879 (1967). 19. C. A. Angell, In Water, a comprehensive Treatise, Vol. 7 F. Franks ed, Plenum, New York,
1982. 20. F. H. Stillinger in liquid state of matter; Fluids simple and complex, E.W. Montrall and J.L.
Lebowitz, ed. North Holland Amsterdam, 1982. 21. O. Conde and J. Teixera, J.Phys. (Paris) 44, 525 (1983) 22. C. Brot, G.Bossis, and C.Hesse-Bezot, Mol Phys 40, 1053 (1980) 23. G.H. Haggis, J.B. Hasted and T.J. Buchanan, J. Chem. Phys 20, 1052 (1952). 24. S.L. Carnie and G.N. Patey, Mol. Phys. 47 1129 (1982).
21
25. R. Kubo, J. Phys. Soc. Jap. 12, 570 (1957) 26. L. Onsager, Phy. Rev. 37, 405 (1931); 38, 2265 (1931). 27. L.E. Reicha, A modern course in statistical physics, University of Texas Press, Austin (1980). 28. D. Chandler, Introduction to modern statistical Mechanics, Oxford University Press, New York
(1987). 29. N.G. Vankampen, Phys. Norv. 5, 279 (1971). 30. M. Ferrario, P. Grigolini, A. Tani, R. Vallauri and B. Zamban, Adv. Chem. Phys. 62 225 (1985). 31. P Grigolini, “Non Gaussian statistics of simple fluids and associated liquids”. 32. P. Grigolini, “Theoretical Foundations”. Adv. Chem. Phys 62, 1-27 (1980). 33. M.W. Evans, G.J. Evans, W.T. coeffey, and P. Grigolini, Molecular dynamics and theory of
broad band spectroscopy, Wiley Interscience New York, 1982, Chapters 9 and 10.
34. A.C. Belch, S.A. Rice and M.G. Sceats, J. Chem. Phys 77 455 (1981) 35. S.A. Rice, A.C. Belch and M.G. Sceats, Chem. Phys 84, 245 (1981) M.G. Sceats and S.A.Rice
in water, A comprehensive treatise Vol. 7, F.Franks, ed. Plenum, New York (1982). 36. H.E. Stanley and J.Teixeira, J. Chem. Phys. 73 3404 (1980) 37. A. Geiger and H.E. Stanley, Phys. Rev. Lett – 49, 1749, 1895, (1980) 38. F.H. Stillinger, science 209, 4455 (1980), in water, in polymers S.P. Rowland, ed. Am Chem.
Soc. Washington D.C. 1980 P 11-22. 39. C.M. Davies and J. Jarzynski, Adv Mol Relax. Proc J, 155 (1968). 40. W. Kauzmann, L’ Eall, Etles Systems Bioligiques, Colloque International aux de CMRS, 246,
63 (1976). 41. A.C. Belch and S.A. Rice, J. Chem. Phys. 78, 4817 (1983). 42. M.G. Sceats and S.A. Rice, J. Chem. Phys. 72, 3248 (1980) 43. E.W. Lang and H.D. Ludeman, Angew, Chem 21, 315 (1982). 44. C.A. Angell, J. Phys. Chem. 75, 3698 (1971) 45. M. Mezel and D.L. Beveridge, J. Chem. Phys. 74, 622 (1981). 46. Y. Katooka, H. Hamada, S. Hose, and T. Yamamoto, J. Chem. Phys. 77, 5699 (1982). 47. W.L. Jorgensen, J. Chandrashekhar, J.D. Madura, R. W. Impey and M.L. Klein, J. Chem. Phys
79, 926(1983) 48. H.G. Hertz, in water, A comprehensive Treatise, Vol-3 F. Franks ed., Plenum, New York. 1973. 49. S. Chandrashekhar, In selected Topics on Noise and stochastic processes, N . Wax, ed., Dover
New York, 1959, P.3. 50. C. J. Montrose, J. A. Bucaro, J. Marshall-coakley and T.A. Litovitz, J. Chem. Phys. 60. 5025
(1974). 51. W. Danninger and G. Zundal, J. Chem. Phys. 74, 2769 (1981) 52. D.C. Rapaport, Mol. Phys. 50, 1151 (1983) 53. Geiger, P. Mausback, R Schnitker, R.L. Blumberg and H.E. Stanley J. Phys. (Paris) C7, 31
(1984).
22
54. R.C. Weast, ed. Handbook of chemistry and Physics, 51st ed chemic Rubber Publishing Co Cincinnati. 1970-1971 steam table, Page E12.
55. J.R. Heiks, M.K. Burnett, L.V. Jones and E.Orban, J. Phys. Chem. 58, 488 (1954). 56. J. Lebland and M. Hareng, J. Phys. (Paris) 45, 373 (1984). 57. D. Eisemberg and W. Kauzmann, The structure and properties of water, Clavendon Press,
Oxford, 1969, P.219. 58. G.S. Kell, J. Chem. Engg. Data, 20, 97 (1975). 59. B.V. Zhelenyi, Russ. J. Chem. Phys. 42, 950 (1968); 43, 1311 (1969) 60. G.E. Walrafen, In water, A comprehensive Treatise Vol 1, F. Friend. Plenum, New York 1972. 61. M.W. Evans, Phys Rev. Lett. 50, 371 (1983). 62. R. Kobo, Stochastic Liouville equations, J Math Phys, 4, 174, (1963). 63. E. Wigner, Characteristic vector of bordered matrices with infinite dimensions, Ann Math , 62,
548-564, (1955). 64. M. Magat and L Reinisch, Kolloid-Z, 134, 101 (1953). 65. P. Debye, Polar Molecules, Dover, New York (1929). 66. G.K. Johri, M Johri and J A Roberts, J Microwave Power and Electromagnetic Energy, 26, 81-


![THE DIFFERENTIAL-GEOMETRIC ASPECTS OF ...users.ictp.it/~pub_off/preprints-sources/2007/IC2007030P.pdfstructure group G and base manifold N, on which the Lie group G acts [2, 1, 6]](https://static.documents.pub/doc/80x56/60a6b677bb7468503103064b/the-differential-geometric-aspects-of-usersictpitpuboffpreprints-sources2007.jpg)