nutrients Article Dietary Intake in Population with Metabolic Syndrome: Is the Prevalence of Inadequate Intake Influenced by Geographical Area? Cross-Sectional Analysis from PREDIMED-Plus Study Naomi Cano-Ibáñez 1,2, * , Aurora Bueno-Cavanillas 1,2 , Miguel A. Martínez-González 3,4,5 , Dolores Corella 5,6 , Jordi Salas-Salvadó 5,7 , M. Dolors Zomeño 8,9 , Manoli García-de-la-Hera 2,10 , Dora Romaguera 5,11 , J. Alfredo Martínez 5,12,13 , F. Javier Barón-López 5,14 , Antonio García-Ríos 5,15 , Ramón Estruch 5,16 , Laura García-Molina 1,2 , Ángel Alonso Gómez 5,17 , Josep A. Tur 5,18 , Francisco Tinahones 5,19 , Lluis Serra-Majem 5,20 , Naiara Cubelos-Fernández 21 , José Lapetra 5,22 , Clotilde Vázquez 5,23 , Xavier Pintó 5,24 , Josep Vidal 25,26 , Lidia Daimiel 13 , José Juan Gaforio 2,27 , Pilar Matía 28 , Emilio Ros 5,29 , Javier Diez-Espino 3,5,30 , Rebeca Fernández-Carrión 5,6 , Josep Basora 5,7 , Montse Fitó 5,8 , Juan Manuel Zazo 2,10 , Antoni Colom 5,11 , Estefanía Toledo 3,5 , AndrésDíaz-López 5,7 , Miguel Ángel Muñoz 31 , Miguel Ruiz-Canela 3,4,5 and Alfredo Gea 3,5 1 Department of Preventive Medicine and Public Health, University of Granada, 18011 Granada, Spain; [email protected] (A.B.-C.); [email protected] (L.G.-M.) 2 CIBER of Epidemiology and Public Health (CIBERESP), Carlos III Institute of Health, 28029 Madrid, Spain; [email protected] (M.G.-d.-l.-H.); [email protected] (J.J.G.); [email protected] (J.M.Z.) 3 Department of Preventive Medicine and Public Health, Medical School, University of Navarre, 31008 Pamplona, Spain; [email protected] (M.A.M.-G.); [email protected] (J.D.-E.); [email protected] (E.T.); [email protected] (M.R.-C.); [email protected] (A.G.) 4 Department of Nutrition, Harvard T.H. Chan School of Public Health, Boston, MA 02115, USA 5 CIBER Physiopathology of Obesity and Nutrition (CIBEROBN), Carlos III Institute of Health, 28029 Madrid, Spain; [email protected] (D.C.); [email protected] (J.S.-S.); [email protected] (D.R.); [email protected] (J.A.M.); [email protected] (F.J.B.-L.); [email protected] (A.G.-R.); [email protected] (R.E.); [email protected] (Á.A.G.); [email protected] (J.A.T.); [email protected] (F.T.); [email protected] (L.S.-M.); [email protected] (J.L.); [email protected] (C.V.); [email protected] (X.P.); [email protected] (E.R.); [email protected] (R.F.-C.); [email protected] (J.B.); mfi[email protected] (M.F.); [email protected] (A.C.); [email protected] (A.D.-L.) 6 Department of Preventive Medicine, University of Valencia, 46010 Valencia, Spain 7 Human Nutrition Unit, Biochemistry and Biotechnology Department, IISPV, Universitat Rovira i Virgili, 43002 Reus, Spain 8 Unit of Cardiovascular Risk and Nutrition, Institut Hospital del mar de Investigaciones Médicas Municipal d’Investigació Médica (IMIM), 08003 Barcelona, Spain; [email protected]9 Human Nutrition Unit, Blanquerna-Ramon Llull University, 08001 Barcelona, Spain 10 Miguel Hernández University, ISABIAL-FISABIO, 03202 Alicante, Spain 11 Health Research Institute of the Balearic Islands (IdISBa), 07120 Palma de Mallorca, Spain 12 Department of Nutrition, Food Sciences and Physiology, Center for Nutrition Research, University of Navarra, 31008 Pamplona, Spain 13 Nutritional Genomics and Epigenomics Group, IMDEA Food, CEI UAM + CSIC, 28049 Madrid, Spain; [email protected]14 Department of Public Health, University of Málaga-IBIMA, 29016 Málaga, Spain 15 Lipids and Atherosclerosis Unit, Department of Internal Medicine, Maimonides Biomedical Research Institute of Córdoba (IMIBIC), Reina Sofía University Hospital, University of Córdoba, 14004 Córdoba, Spain 16 Department of Internal Medicine, IDIBAPS, Hospital Clinic, University of Barcelona, 08036 Barcelona, Spain 17 Department of Cardiology, OSI ARABA, University Hospital Araba, University of the Basque Country (UPV/EHU), 48940 Vitoria-Gasteiz, Spain Nutrients 2018, 10, 1661; doi:10.3390/nu10111661 www.mdpi.com/journal/nutrients
Transcript
nutrients
Article
Dietary Intake in Population with MetabolicSyndrome: Is the Prevalence of Inadequate IntakeInfluenced by Geographical Area? Cross-SectionalAnalysis from PREDIMED-Plus Study
Naomi Cano-Ibáñez 1,2,* , Aurora Bueno-Cavanillas 1,2 , Miguel A. Martínez-González 3,4,5 ,Dolores Corella 5,6 , Jordi Salas-Salvadó 5,7 , M. Dolors Zomeño 8,9,Manoli García-de-la-Hera 2,10 , Dora Romaguera 5,11, J. Alfredo Martínez 5,12,13 ,F. Javier Barón-López 5,14 , Antonio García-Ríos 5,15, Ramón Estruch 5,16 ,Laura García-Molina 1,2, Ángel Alonso Gómez 5,17, Josep A. Tur 5,18 , Francisco Tinahones 5,19,Lluis Serra-Majem 5,20 , Naiara Cubelos-Fernández 21, José Lapetra 5,22, Clotilde Vázquez 5,23,Xavier Pintó 5,24 , Josep Vidal 25,26, Lidia Daimiel 13 , José Juan Gaforio 2,27 , Pilar Matía 28,Emilio Ros 5,29 , Javier Diez-Espino 3,5,30, Rebeca Fernández-Carrión 5,6, Josep Basora 5,7,Montse Fitó 5,8, Juan Manuel Zazo 2,10, Antoni Colom 5,11 , Estefanía Toledo 3,5 ,Andrés Díaz-López 5,7, Miguel Ángel Muñoz 31, Miguel Ruiz-Canela 3,4,5 and Alfredo Gea 3,5
1 Department of Preventive Medicine and Public Health, University of Granada, 18011 Granada, Spain;[email protected] (A.B.-C.); [email protected] (L.G.-M.)
4 Department of Nutrition, Harvard T.H. Chan School of Public Health, Boston, MA 02115, USA5 CIBER Physiopathology of Obesity and Nutrition (CIBEROBN), Carlos III Institute of Health, 28029 Madrid,
6 Department of Preventive Medicine, University of Valencia, 46010 Valencia, Spain7 Human Nutrition Unit, Biochemistry and Biotechnology Department, IISPV, Universitat Rovira i Virgili,
43002 Reus, Spain8 Unit of Cardiovascular Risk and Nutrition, Institut Hospital del mar de Investigaciones Médicas Municipal
d’Investigació Médica (IMIM), 08003 Barcelona, Spain; [email protected] Human Nutrition Unit, Blanquerna-Ramon Llull University, 08001 Barcelona, Spain10 Miguel Hernández University, ISABIAL-FISABIO, 03202 Alicante, Spain11 Health Research Institute of the Balearic Islands (IdISBa), 07120 Palma de Mallorca, Spain12 Department of Nutrition, Food Sciences and Physiology, Center for Nutrition Research,
University of Navarra, 31008 Pamplona, Spain13 Nutritional Genomics and Epigenomics Group, IMDEA Food, CEI UAM + CSIC, 28049 Madrid, Spain;
[email protected] Department of Public Health, University of Málaga-IBIMA, 29016 Málaga, Spain15 Lipids and Atherosclerosis Unit, Department of Internal Medicine, Maimonides Biomedical Research
Institute of Córdoba (IMIBIC), Reina Sofía University Hospital, University of Córdoba, 14004 Córdoba, Spain16 Department of Internal Medicine, IDIBAPS, Hospital Clinic, University of Barcelona, 08036 Barcelona, Spain17 Department of Cardiology, OSI ARABA, University Hospital Araba, University of the Basque
18 Research Group on Community Nutrition & Oxidative Stress, University of Balearic Islands,07122 Palma de Mallorca, Spain
19 Virgen de la Victoria Hospital, Department of Endocrinology, University of Málaga, 29010 Málaga, Spain20 Institute for Biomedical Research, University of Las Palmas de Gran Canaria, 35016 Las Palmas, Spain21 Institute of Biomedicine (IBIOMED), University of León, 24071 León, Spain; [email protected] Department of Family Medicine, Research Unit, Distrito Sanitario Atención Primaria, 41013 Sevilla, Spain23 Department of Endocrinology, Fundación Jiménez-Díaz, 28040 Madrid, Spain24 Lipids and Vascular Risk Unit, Internal Medicine, Hospital Universitario de Bellvitge,
Hospitalet de Llobregat, 08907 Barcelona, Spain25 Department of Endocrinology, IDIBAPS, Hospital Clinic, University of Barcelona, 08036 Barcelona, Spain;
[email protected] CIBER Diabetes y Enfermedades Metabólicas (CIBERDEM), Instituto de Salud Carlos III (ISCIII),
28029 Madrid, Spain27 Centro de Estudios Avanzados en Olivar y Aceites de Oliva, University of Jaén, 23071 Jaén, Spain28 Department of Endocrinology and Nutrition, Instituto de Investigación Sanitaria Hospital Clínico San
Carlos (IdISSC), 28040 Madrid, Spain; [email protected] Lipid Clinic, Department of Endocrinology and Nutrition, Institut d’Investigació Biomédiques August Pi
Sunyer (IDIBAPS), Hospital Clinic, 08036 Barcelona, Spain30 Servicio Navarro de Salud, Osasunbidea, 31002 Pamplona, Spain31 Primary Care Division of Barcelona, Institut Català de la Salud-IDIAP Jordi Gol, 08007 Barcelona, Spain;
Received: 15 October 2018; Accepted: 31 October 2018; Published: 4 November 2018�����������������
Abstract: Inadequate diet influences chronic diseases such as cardiovascular disease (CVD), theleading cause of death in Spain. CVD figures vary from one geographical region to another; this couldbe associated with different food choices. Our aim was to analyse the influence of geographical area onnutrient intakes among the Spanish adult population with Metabolic Syndrome (MetS). We analysedcross-sectional baseline data from the PREDIMED-Plus study: 6646 Spanish adults, aged 55–75 years,with overweight/obesity and MetS in four geographical areas. A validated 143-item Food FrequencyQuestionnaire (FFQ) was used to assess energy and nutrient intakes. The prevalence of inadequatenutrient intake was estimated according to Dietary Reference Intakes (DRIs). Multivariable-adjustedlogistic regression was used to assess the relationship between geographical area (North, Central, Eastand South areas) and inadequate nutrient intake. People in the North area consumed significantlylower amounts of vegetables and fish but more sugar and alcohol (p < 0.001) than other areas. Dietaryfibre, vitamin A, E, calcium and magnesium intakes were all lower among men of North area than inthe other areas (p < 0.001). Sex (women), non-smoker and physical activity were also associated toadequate nutrient intake. Geographical area influences nutrient intakes. Its effect on dietary qualityshould be taken into account when planning food policies.
Keywords: dietary intake; PREDIMED-Plus study; metabolic syndrome; place of residence;geographical area; nutrient adequacy
1. Introduction
Over the last decades, overweight and obesity have increased in most regions and countriesworldwide [1]. A similar situation has been described in Spain. The prevalence of overweight hasincreased in the last 20 years with obesity figures now twice what they were twenty years ago andthey have especially increased in the aged adult Spanish population [2]. The global burden of obesityand overweight can be explained by the increase in the consumption of diets with high energy densityand low nutritional value, a consequence of the acquisition of Westernized dietary patterns [3].
A healthy dietary pattern which includes low amounts of saturated fat, salt and refinedcarbohydrates and promotes the consumption of high amounts of fruit, vegetables and whole grainshave proved not only to reduce the risk of overweight and obesity but also to have a direct effect onchronic diseases incidence and prognosis which affect global health [4].
The traditional Mediterranean diet (MedDiet) described in the 1950s and 1960s [5], is characterizedby frugality or moderation on food consumption, a high intake of vegetables, legumes, fruits andnuts, unrefined cereals, fish and olive oil and a low intake of saturated lipids, dairy productsand red meat [6]. MedDiet prevents diseases that especially affect the aged population, such asneurodegenerative diseases, diabetes mellitus and some types of cancer [7–10]. Furthermore, MedDiethas also been associated with protection against some of the leading causes of morbidity and mortalityworldwide, in particular cardiovascular disease (CVD) and metabolic syndrome (MetS) [11,12]. MetS isa well-described condition in the causative pathway of cardiovascular disease attributable to clusteringfactors that includes central obesity, insulin resistance, dyslipidaemia and hypertension [13].
Moreover, accumulated evidence suggests that the elevated overweight and obesity rates aroundthe world are linked to MetS, coexisting with nutritional deficits in the adult population [14]. In thiscontext, it is important to note that an increase in adherence to MedDiet is associated with better dietquality and lower prevalence of deficient intake of certain micronutrients. That is, the MedDiet hasdemonstrated supportive effects, not only on the protection against chronic diseases but also on theaged population’s nutritional status [15].
The nutritional status of the aged population is an important public health issue; adequate dietaryintake plays an important role in the healthy aging process. For a variety of reasons, that includeeconomic, social and physiologic changes, aged adults are at risk of low dietary quality. Aging isaccompanied by an increased need in several nutrients, such as vitamins and minerals, whereas theoverall caloric requirements decline [16,17]. In this sense, the consumption of a high-quality diet suchas MedDiet is essential to reduce malnutrition figures in older adults. Although some studies suggestthat the adherence to MedDiet in Spain is greater than in other Mediterranean countries [18], recentlypublished data on dietary patterns in Spanish adults indicated that adherence to the MedDiet hassubstantially declined [19].
In fact, besides age, sex or cultural level, the adherence to the MedDiet in Spain varies significantlyamong geographical areas. As an example, the Southern regions of Spain had the lowest score foradherence to the MedDiet in comparison with Northern regions [20,21], even though other authorshave reported that place of residence has limited influence on dietary intake in the adult and senioradult population [22]. Therefore, differences in dietary intake do not only differ among Mediterraneancountries but also within the same country, most likely because each area has its own gastronomicculture influenced by particular socioeconomic and cultural factors related to food choices and otherdeterminants of dietary intake [20]: This could be responsible for the North-South cardiovascularmortality gradient in Spain [23].
To our knowledge little is known about dietary intake and inadequate nutrient intake among theolder Spanish adults with MetS from different geographical areas of Spain. Our aim was to analyse theinfluence of geographical area on nutrient intakes among the Spanish adult population with MetS.
2. Materials and Methods
2.1. Study Design
This research represents a cross-sectional study on baseline data of the PREDIMED-Plus trial study.PREDIMED-Plus study is a 6-year Spanish multicentre ongoing randomized, parallel-group clinicaltrial testing the effect on CVD morbimortality of an intensive weight-loss intervention program basedon an energy-restricted traditional MedDiet, physical activity promotion and behavioural support, incomparison with a usual care intervention only with energy-unrestricted Mediterranean diet (controlgroup). The participant recruitment methods and data collection are fully described in a publication
Nutrients 2018, 10, 1661 4 of 19
by Martinez-Gonzalez MA et al. [24] and at http://predimedplus.com/. The PREDIMED-Plusstudy protocol was approved according to the ethical standards of the Declaration of Helsinki bythe respective Institutional Review Board (IRB) in each centre and registered at the InternationalStandard Randomized Controlled Trial (ISRCT), with number 89898870. For more information,http://www.isrctn.com/ISRCTN89898870. Registration date: 24 July 2014. Informed consent wasobtained from all individual participants included in the study.
2.2. Participants and Data Collection Procedures
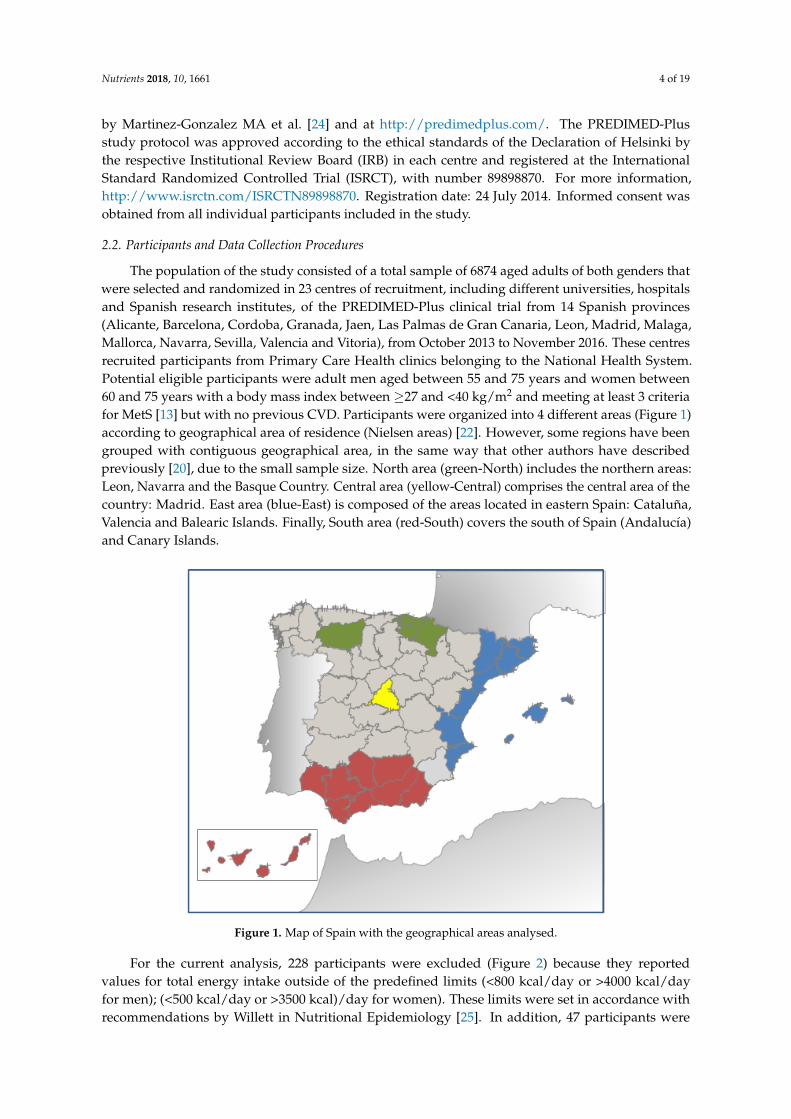
The population of the study consisted of a total sample of 6874 aged adults of both genders thatwere selected and randomized in 23 centres of recruitment, including different universities, hospitalsand Spanish research institutes, of the PREDIMED-Plus clinical trial from 14 Spanish provinces(Alicante, Barcelona, Cordoba, Granada, Jaen, Las Palmas de Gran Canaria, Leon, Madrid, Malaga,Mallorca, Navarra, Sevilla, Valencia and Vitoria), from October 2013 to November 2016. These centresrecruited participants from Primary Care Health clinics belonging to the National Health System.Potential eligible participants were adult men aged between 55 and 75 years and women between60 and 75 years with a body mass index between ≥27 and <40 kg/m2 and meeting at least 3 criteriafor MetS [13] but with no previous CVD. Participants were organized into 4 different areas (Figure 1)according to geographical area of residence (Nielsen areas) [22]. However, some regions have beengrouped with contiguous geographical area, in the same way that other authors have describedpreviously [20], due to the small sample size. North area (green-North) includes the northern areas:Leon, Navarra and the Basque Country. Central area (yellow-Central) comprises the central area of thecountry: Madrid. East area (blue-East) is composed of the areas located in eastern Spain: Cataluña,Valencia and Balearic Islands. Finally, South area (red-South) covers the south of Spain (Andalucía)and Canary Islands.Nutrients 2018, 10, x FOR PEER REVIEW 5 of 19
Figure 1. Map of Spain with the geographical areas analysed.
Figure 2. Flow-chart of participants.
2.3. Assessment of Dietary Intake
Trained nutritionists collected baseline food intake data in their baseline interview using the PREDIMED FFQ, which has been previously validated in Spanish subjects [26,27]. The FFQ included 143 food items, arranged into 11 food groups, taking into account the similarities of their nutrient profiles (vegetables, fruits, legumes, cereals, milk and dairy products, meat and meat products, fish and seafood, olive oil, nuts, sugars and sweets and eggs). The FFQ includes 9 possible answers for consumption frequency ranging from never/seldom to >6 servings/day. The indicated frequencies of consumption were converted to intakes per day and multiplied by the weight of the portion size indicated by the participant and expressed as grams per day [28]. Nutrient information was derived using Spanish food composition tables [29,30]. Subjects were asked about MedDiet adherence via a
Figure 1. Map of Spain with the geographical areas analysed.
For the current analysis, 228 participants were excluded (Figure 2) because they reportedvalues for total energy intake outside of the predefined limits (<800 kcal/day or >4000 kcal/dayfor men); (<500 kcal/day or >3500 kcal)/day for women). These limits were set in accordance withrecommendations by Willett in Nutritional Epidemiology [25]. In addition, 47 participants were
excluded because they did not complete the Food Frequency Questionnaire (FFQ). After applyingthese exclusion criteria, a final sample of 6646 participants was analysed.
Nutrients 2018, 10, x FOR PEER REVIEW 5 of 19
Figure 1. Map of Spain with the geographical areas analysed.
Figure 2. Flow-chart of participants.
2.3. Assessment of Dietary Intake
Trained nutritionists collected baseline food intake data in their baseline interview using the PREDIMED FFQ, which has been previously validated in Spanish subjects [26,27]. The FFQ included 143 food items, arranged into 11 food groups, taking into account the similarities of their nutrient profiles (vegetables, fruits, legumes, cereals, milk and dairy products, meat and meat products, fish and seafood, olive oil, nuts, sugars and sweets and eggs). The FFQ includes 9 possible answers for consumption frequency ranging from never/seldom to >6 servings/day. The indicated frequencies of consumption were converted to intakes per day and multiplied by the weight of the portion size indicated by the participant and expressed as grams per day [28]. Nutrient information was derived using Spanish food composition tables [29,30]. Subjects were asked about MedDiet adherence via a
Figure 2. Flow-chart of participants.
2.3. Assessment of Dietary Intake
Trained nutritionists collected baseline food intake data in their baseline interview using thePREDIMED FFQ, which has been previously validated in Spanish subjects [26,27]. The FFQ included143 food items, arranged into 11 food groups, taking into account the similarities of their nutrientprofiles (vegetables, fruits, legumes, cereals, milk and dairy products, meat and meat products, fishand seafood, olive oil, nuts, sugars and sweets and eggs). The FFQ includes 9 possible answers forconsumption frequency ranging from never/seldom to >6 servings/day. The indicated frequenciesof consumption were converted to intakes per day and multiplied by the weight of the portion sizeindicated by the participant and expressed as grams per day [28]. Nutrient information was derivedusing Spanish food composition tables [29,30]. Subjects were asked about MedDiet adherence viaa 17-item screening questionnaire, which contains modifications to a previously validated 14 itemsquestionnaire [31], used to evaluate compliance with the intervention and was also a key element toguide the motivation interviews during the study follow-up. Compliance with each of the 17 itemsrelating to characteristic food habits was scored with 1 point and 0 points for non-adherence. Therefore,the total score range was 0–17, with 0 meaning no adherence and 17 meaning maximum adherence.Adherence to MedDiet was categorised in tertiles, as low level of adherence (1st tertile, ≤7 points),medium (2nd tertile, 8–10 points) or high level of adherence (3rd tertile, ≥11 points). Dietary intakeof total energy, total fat and fatty acids: monounsaturated (MUFAs), polyunsaturated (PUFAs) andsaturated (SFAs), proteins and carbohydrates were estimated. Dietary fibre and alcohol intake were alsomeasured. Inadequate nutrient intake of dietary fibre and vitamins A, D, E, B12, B6, B9 and mineralssuch as calcium, magnesium and phosphorus were analysed according to the Dietary Reference Intakes(DRIs) for the American population for each participant [32]. DRIs is the general term for a set ofreference values used to plan and assess nutrient intakes of healthy people. These values vary byage and sex and include the Recommended Dietary Allowance (RDA): average daily level of intakesufficient to meet the nutrient requirements of nearly all (97–98%) healthy people, Adequate Intake(AI): established when evidence is insufficient to develop an RDA and is set at a level assumed toensure nutritional adequacy and Tolerable Upper Intake Level (UL): maximum daily intake unlikelyto cause adverse health effects [33]. Intake levels above DRI imply a low likelihood of inadequateintake. To decrease possible measurement errors derived from FFQ, we estimated the proportion of
Nutrients 2018, 10, 1661 6 of 19
individuals with intakes below two thirds (2/3) of the DRIs, correcting the possible bias introducedby the FFQ and assuming in any case that the actual inadequate intake should be higher than thefigures which were estimated [34]. Furthermore, we have estimated the inadequate intake accordingto the European Food Safety Agency (EFSA) average requirements (AR), taking as reference AI whenAR were not available [35]. We also studied the proportion of participants with inadequate intakeof 3 or more out of 6 nutrients. Results were based on dietary intake data only, excluding intakeof supplements.
2.4. Assessment of Non-Dietary Intake
During the baseline visit, trained staff of PREDIMED-Plus trial documented information using abaseline questionnaire on sociodemographic data and lifestyle behaviours. The variables includedwere sex, age (55–70 years and >70 years), geographical area (North, Central, East or South area),education level (primary level, secondary level and tertiary level that includes university studies), civilstatus (married, widowed, divorced/singled or others) and whether they lived alone or not. Otherlifestyle variables such as smoking habits, alcohol intake (grams per day) and physical activity weretaken into account. Physical activity information was gathered using the validated Spanish version ofthe Minnesota questionnaire [36,37].
2.5. Statistical Analysis
We used the PREDIMED-Plus baseline database generated in August 2017. Qualitative variableswere analysed through their frequency distribution, whereas quantitative variables were expressed asmeans and standard deviations (SD). Pearson’s chi-square tests and Analysis of Variance (ANOVA)(for categorical and continuous variables, respectively) were used to assess differences in baselinecharacteristics of participants according to geographical area. Also, ANCOVA was used to estimatedietary intakes, adherence to MedDiet and nutrient profiles according to geographical area adjusted forsex and age. The significance level was set at 5%. The main outcome of this analysis was inadequateintake of micronutrients, defined for each nutrient as a daily intake below 2/3 of DRIs and set at95% confidence interval (CI). We also repeated the analysis defining inadequate intake according toAR/AI proposed by EFSA. Geographical area was the principal independent variable. The associationsbetween geographical area and inadequate intakes were summarized using odds ratios and 95% CIobtained via multiple-adjusted logistic regression models. The logistic regression model was adjustedfor sex, age (55–70 years and >70 years), adherence to MedDiet (low, medium and high adherence),total energy intake, smoking habits (current, former or never smoker), physical activity (less active,moderately active and active), living alone, diabetic status and educational level (primary, secondaryand tertiary). A logistic regression model was used to examine the associations between the place ofresidence and inadequate nutrient intake (defined as deficient intake for 3 or more nutrients) adjustedfor the same potential confounding factors mentioned above.
Vitamins B6, B12 and phosphorus intakes were excluded from the logistic regression model,because a binary test showed these to be asymmetrically distributed and also a low proportion ofsubjects presented inadequate intake of these micronutrients. In addition, the intake of vitamin Dwas also excluded from the statistical analysis because it was deficient in a high proportion of thepopulation (over 80%). All analysis were cross-sectional and performed using Stata (12.0, StataCorpLP, College Station, TX, USA).
Nutrients 2018, 10, 1661 7 of 19
3. Results
3.1. Baseline Characteristics of the Population and Food Intake
The baseline characteristics of participants and the food group intake in grams per day bygeographical area are shown in Table 1. Mean patient age was 65.0 ± 4.9 years and 51.6% (n = 3431)of participants were male. When baseline characteristics were compared according to the fourgeographical areas included, differences were found in age, smoking habits, physical activity, culturallevel and civil status. Regarding physical activity, 21.3% reported they were active, while 59.8% didnot. Central area had the highest rates of active population (37.0%). The majority of the population hada primary educational level (48.3%, primary school) but, differences were evident among the 4 areas.The highest percentage of participants with only primary school (54.9%) was observed in South area.
Table 1. Baseline characteristics of the PREDIMED-Plus study participants by geographical areas(total population n = 6646).
Values are presented as mean ± SD for continuous variables and n (%) for categorical variables. Pearson’schi-square test was performed for categorical variables and ANOVA test for continuous variables. a includes singleand religious.
Nutrients 2018, 10, 1661 8 of 19
3.2. Description of Food Intake, Adherence to MedDiet and Nutrient Profiles in the Different GeographicalAreas Analysed
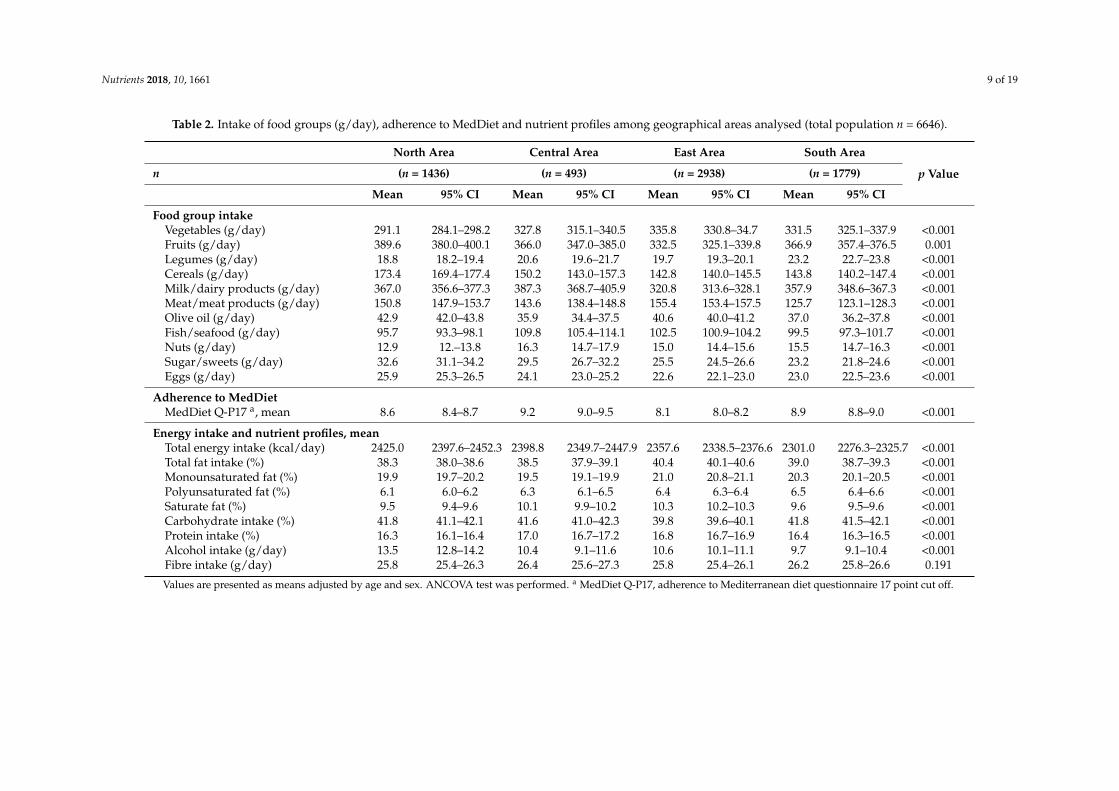
Evaluation of food group intake, adherence to MedDiet and nutrient profiles among geographicalareas of Spain adjusted for age and sex are shown in Table 2. According to the geographical area,the estimated adjusted mean intakes of fruits, sugar and sweets, olive oil, cereals and eggs weresignificantly higher among those participants living in North area than among those living in the otherareas (p < 0.001). Whereas the intake of vegetables, nuts, legumes, fish and seafood were the lowestcompared with the others geographical territories analysed (p < 0.001). The evaluation of food intakeby sex and age among the geographical areas is shown in the Supplementary Materials (Table S1).In order to evaluate differences in MedDiet adherence across the geographical areas, we compared themean score. The overall adherence score was 8.5 ± 2.7 (data not shown). According to geographicalarea, the East area showed the worst mean score of adherence, which was significantly lower thanthe mean score obtained in Central and South areas. The South area showed the lowest total energyintake, although, the contribution of healthy fats such as MUFAs and PUFAs was higher compared tothe other geographical areas. Alcohol intake was higher in North area. The adherence to MedDiet andnutrients profile among areas stratified by sex and age is presented in Supplementary Table S2. Meanadherence to MedDiet increased in aged population (more than 70 years) in both sexes, being higher inwomen than in men. Total energy intake decreased with age in both sexes. Alcohol intake was higherin men than in women independently of age or place of residence, being the highest in the North area.
3.3. Evaluation of Inadequate Nutrient Intake According to Recommended Intakes
Table 3 shows the proportion of participants who showed nutrient intake below 2/3 of DRIs bygeographical area. An inadequate intake of dietary fibre, vitamins A, B9, E and calcium was commonin all the analysed groups of participants. Comparing the inadequate intakes by sex, men showeda higher prevalence than women of inadequate intake for most of the nutrients analysed. For themajority of nutrients, the prevalence of inadequate intake increased in women in older ages butnot in men, except for calcium. In accordance to geographical areas, the North area presented thehighest prevalence of inadequate intake for most nutrients analysed, except for vitamin B9 and dietaryfibre, while East area presented the lowest prevalence of deficient intake for all the micronutrientsanalysed but differences are statistically significant only among the youngest participants and only forvitamins A, D and E. These results are similar if the EFSA recommendations are used (Table S3).
Nutrients 2018, 10, 1661 9 of 19
Table 2. Intake of food groups (g/day), adherence to MedDiet and nutrient profiles among geographical areas analysed (total population n = 6646).
Values are presented as means adjusted by age and sex. ANCOVA test was performed. a MedDiet Q-P17, adherence to Mediterranean diet questionnaire 17 point cut off.
Nutrients 2018, 10, 1661 10 of 19
Table 3. Participants with nutrient intake below 2/3 of DRIs by geographical areas, age and sex.
DRI a: Dietary Reference Intake. Pearson’s Chi-Square test was used to estimate differences among prevalence ofinadequate nutrient intakes according to geographical area for each age and sex strata (p value 1) and also to estimatedifferences among prevalence of inadequate nutrient intakes according to age and sex, for each geographical area(p value 2).
3.4. Assessment of the Influence of the Geographical Area on Inadequate Nutrient Intake
We examined the possible effect of geographical area on the inadequate intake of nutrients(Table 4), with North area as the reference category. The unadjusted logistic regression model revealedthat the geographical area influenced the inadequate intake for all the nutrients analysed except fordietary fibre. In this sense, not living in the North area was significantly associated with a lowerlikelihood of inadequate intake of vitamin A, E, calcium and magnesium (p < 0.001). However, forvitamin B9, the East and the South areas had a higher probability of inadequate intake in comparisonwith the Northern reference area (OR = 1.19 and 1.31 respectively, p < 0.001). When we used the EFSAdietary recommendations, we obtained very similar results (Table S4). The influence of demographics(age, sex and place of residence) and other socioeconomic and lifestyle variables on inadequate nutrientintake according to the DRIs criteria is presented in the Supplementary Materials (Table S5). Inadequatenutrient intake was influenced by geographical area and sex. It was also inversely associated with
Nutrients 2018, 10, 1661 11 of 19
better adherence to the MedDiet, total energy intake, not diabetic, being moderately active and being anon-smoker (p < 0.001). The Supplementary Table S6, shows similar associations according to EFSAcriteria for all nutrients except for calcium.
Table 4. Results from the logistic regression model of micronutrient inadequate intakes according to2/3 DRIs by geographical areas.
Nutrient North Area Central Area East Area South Area
Values are presented as OR and 95% CI for the inadequate intake of micronutrients as categorical variable accordingto area of residence. Model 1: This model has not been adjusted for any variable. Model 2: has been adjusted bysex, age, smoking habits, physical activity, educational status, diabetic status, living alone, total energy intake andadherence to MedDiet.
3.5. Multivariable Logistic Regression Model for Inadequate Intake of 3 or More out 6 MicronutrientsAccording to Place of Residence
Table 5 shows the result from the logistic regression model fitted using inadequate intake of 3 ormore out of 6 micronutrients as the dependent variable. In the North area, 19.0% of participants showedinadequate intake for 3 or more. Dwellers of Central, East and South areas had a lower probabilityof inadequate intake for 3 or more micronutrients (p < 0.05). When we used AR/AI provided by theEFSA, we obtained higher figures (Table S7), reaching 40.8% of participants with inadequate intake inthe North area.
Table 5. Multivariable logistic regression model for inadequate intake of 3 or more out 6 micronutrientsaccording to geographical area.
≥3 Inadequate Intake% Prevalence (95% CI)
Adjusted Odds Ratio(95% CI) p Value
Geographical area
North area 19.0 (17.0–21.1) 1 (Ref.)Central area 16.3 (12.8–19.7) 0.65 (0.46–0.94) 0.021East area 15.9 (14.6–17.2) 0.57 (0.47–0.70) <0.001South area 16.8 (15.0–18.5) 0.59 (0.47–0.74) <0.001
Results are expressed as OR and 95% CI for the inadequate intake of ≥3 micronutrients ascategorical variables according to geographical area. The model has been adjusted for sex, age,smoking habits, physical activity, educational status, diabetic status, living alone, total energy intakeand adherence to MedDiet.
Nutrients 2018, 10, 1661 12 of 19
4. Discussion
Our results show significant differences between dietary intake patterns among the differentgeographical areas included, characterized by cultural, economic and gastronomic diversity. Thesedifferences are maintained across the different age and sex strata, coinciding with differences in theprevalence of inadequate intake of micronutrients such as vitamin A, E, B9, Ca and Mg. The differencesfound in adequate nutrient intake among the geographical areas studied could be attributable todifferent dietary intakes that were also influenced by sex, not being smoker, not being diabetic andbeing active.
The traditional MedDiet pattern has been associated with a higher consumption of vegetables,fruits, fish, legumes and nuts [38]. However, the current dietary pattern in Spain is turning into aWesternized diet, including the overweight or obese adult population, with high consumption ofsugar and meat products and a decline in the consumption of vegetables and fruits [39]. Although ourresults suggest that the main estimated food groups consumed were vegetables and fruits, meat andprocessed meat intake were elevated, while fish, seafood and legumes consumption seemed to be loweraccording to the recommended intakes. However, compared to a Spanish food consumption surveycarried out in 2013, our estimate intake of fish and legumes was slightly higher (100.7 g/day/personversus 88.7 g/day/person and 22.1 g/day/person versus 13.9 g/day/person for fish and legumes,respectively). In contrast, egg intake was somewhat lower (23.5 versus 27.1) [40]. Egg consumption inour study was under the usually recommended levels [41], probably due to the general (but unfounded)concern that egg consumptions may increase blood cholesterol levels [42].
Depending on geographical areas, differences in food intake were found. The inhabitants of Northarea, especially men, consumed more sugars, sweets and alcohol than the other three areas. These dataare also reflected in another Spanish study which reported that adult males from the North of Spainhad higher intakes of these food groups than adult males from other Spanish areas [22]. Surprisingly,East area, the main area of fruit production in Spain, showed the lowest fruit consumption. The samewas observed for olive oil consumption in South area, in spite of being the greatest olive oil producingregion in the world. These data are also consistent with findings in another Spanish survey [20].
Food choices depend on individual’s elections, conditioned by cultural influences, demographicand socio-economic factors [43]. In addition to the geographical area, age and sex were importantfactors in determining food intake. According to our data, a higher consumption of vegetables,fruits and fish or seafood was found in women compared with men. Other previous studies alsocorroborated these findings, highlighting that females consumed more fruit and vegetables than males,decreasing the risk of nutrient deficiencies [44]. In our study, oldest people (more than 70 years) tendto have a higher consumption of vegetables, fruits, legumes, nuts and fish compared to a youngeradult population. Similar findings have been previously reported in a Swiss community-dwellingsample [45].
People in Mediterranean countries such as Spain, have decreased their adherence to the MedDietpattern, which was traditionally high [46]. Our results show only a moderate MedDiet adherencein most of the areas analysed. Other studies indicated a similar adherence to MedDiet at baselineinterview [47]. According to the geographical area, the lowest mean score of adherence to MedDiet wasfound in East area, especially in younger adult men, which barely reached a compliance score of 8 outof 17 points. This finding can be explained by the low intake of fish and fruits, a surprising outcome asthe geographical location of this area is on the Mediterranean coast and has an extensive agriculturaltradition. This result is similar to previous findings reported in the DIMERICA study [20]. Furthermore,the percentage of the population in the first tertile of adherence to MedDiet (low adherence) reached amaximum of 48.9% in men (55–70 years) in the East area and a minimum of 16.7% in women (>70 years)in the Central area. The data described by other authors consistently show a high adherence to MedDietin women and the aged population [48,49]. However, this phenomenon could be attributable to agenerational effect (cohort effect).
Nutrients 2018, 10, 1661 13 of 19
Energy and nutrient intakes in our population revealed a diet high in proteins and lipids and lowin carbohydrates. In this sense, protein intake and total fat intake were above the upper recommendedlimits (15% and 30% of total energy intake, respectively) [50]. Other authors have shown a similarnutrient distribution in Spanish population [51]. Despite the fact that in our study total fat intake washigher than recommended for adult population, recent results from PREDIMED study have postulatedthat fat quality intake is a major nutritional determinant of quality of diet and cardiovascular benefitscan be obtained with a relatively fat-rich diet [52]. Particularly, the adequate intake of MUFAs andPUFAs in our study, mainly due to a high consumption of olive oil, has been previously associated witha lower risk of CVD [53]. On the one hand, the intake of SFAs was not higher than 10% in most of theareas analysed, except in the East area, probably because this area recorded the highest consumptionof meat and meat products compared to the other geographical territories. On the other hand, lowintakes of carbohydrates and dietary fibre may be linked to low consumption of cereals, vegetablesand fruits in our population study, influenced by an abandonment of traditional eating choices [54].
Nutrient availability can be compromised by unbalanced dietary patterns, especially for specificpopulation groups whose requirements are increased because of age or diseases [55]. In elderly,the decrease of energy, as a result of lower food consumption has been described as an essentialfactor for inadequate nutrient intake [56]. Despite our population having a higher energy intake, theresults in the present study suggest that they present several nutritional inadequate intakes (dietaryfibre, vitamins A, B9, E, calcium and magnesium). Consequently, other authors put forward thatmicronutrient deficiencies occur frequently in overweight or obese subjects due to poor-nutritionalhabits and high intake of energy-dense foods [57]. In our study, the prevalence of inadequate intakewas increased in elderly women but not in men for the majority of nutrients, except for calcium. Thisfact can be explained by an increase of milk and dairy products consumption, due to the generalconcern about their effects and properties on aged women bones [58]. In accordance with place ofresidence, the North area presented the highest prevalence of inadequate nutrient for most of thenutrients analysed, except for vitamin B9 and dietary fibre. This may be as consequence of theirhigh intake of meat and meat products and cereals, as shown in Table 3, compared with the othergeographical areas.
Determinants of diet quality are multilevel and include food choices influenced by demographicvariables, socioeconomic and cultural factors [59]. When comparing data from this study with a recentone which suggested that place of residence has a limited influence on dietary intake [22], our studyshows that geographical area was a predictive factor of nutrient adequacy, with the highest inadequatenutrient intake in inhabitants of the North area for the majority of the nutrients analysed. In thesame line, the analysis of the association between place of residence and dietary intake among NorthAmerican adult women showed regional disparities in dietary intake influenced by food environmentand food customs [60]. Furthermore, findings from this study, suggest that lifestyle behaviours,in particular smoking status (not being a smoker) and physical activity (being more active), wereassociated in a significant positive way the adequacy of nutrient intakes. Other study carried out inBrazil found a similar association for adequate minerals intake [61]. Other factors, for instance sex,have been postulated as criterion for an adequate dietary intake [62]. A study that assessed the roleof diet knowledge, reported that women followed a healthy diet compared with men due to higherknowledge about food choices [63]. These results are consistent with findings in our work in whichwomen had lower risk of inadequate nutrient intake than men.
Finally, micronutrient intakes in elderly adults are related to socioeconomic and cultural levelfactors, so that participants with a high educational level and from a high social class had overallhigher micronutrient intakes [64,65]. Nevertheless, we have not found this relationship, presumablybecause most of our participants had a similar socioeconomic and cultural level, so variability in thesedeterminants was small.
Nutrients 2018, 10, 1661 14 of 19
Our study has some limitations and several strengths. Firstly, the methodological nature ofa cross-sectional analysis, does not allow to address causality, although the possibility of reversecausality bias as an alternative, non-casual, explanation of our results is unlikely (nutrient intakecannot predict geographical area). Secondly, the present findings cannot be extrapolated to otherpopulation groups given that our study participants are aged adults with overweight/obesity andMetS and the sample is not representative of the general population. However, our sample is largeenough to be representative of this specific population group. Thirdly, the exposure measurement ofdietary intake could be influenced by the retrospective way to assess dietary intake. Although the FFQused has been validated in adult Spanish population and has good reproducibility and a relativelygood validity [28], this questionnaire may be subject to potential bias with under-reporting being acommon error. For this reason, we have considered that there is an inadequate intake only when theintake does not reach 2/3 of the DRIs, with the aim to compensate the possible bias introduced by theFFQ and assuming in any case that the actual inadequate micronutrient intake should be superior tothe estimated figures. However, the bias introduced would be non-differential, affecting uniformlythe different geographical areas. Finally, it is unknown if the participants have always resided in thesame geographical area, however, the internal migration fluxes in Spain have been low in the lasttwenty years, affecting mainly young people [66,67]. Among the strengths of the PREDIMED-Plusstudy we must point out the use of a standardized protocol which reduces information bias about foodintake, socioeconomic and lifestyles variables and the election of a large sample highly representativeof the Spanish older adults with MetS (n = 6646), as well as the inclusion of community-dwelling olderpopulation that contributes to determine the modification on nutrient intakes related to geographicaldisparities. Finally, to our knowledge, no study in Spain has analysed the influence of geographicalarea on nutrient intake in older adult population at high risk of CVD.
5. Conclusions
Despite the higher figures of overweight and obesity in older adult population at high risk ofCVD, there are significant inadequate nutritional intakes. Even within the same country, geographicalarea was significantly associated with inadequate nutrient intake. The dietary pattern of the agedadult population leaves sufficient room from improvement in relationship with the promotion ofthe MedDiet adherence, as well as to ensure adequate micronutrients intake. If we want to changedietetic habits in a population we need to take into account their roots and peculiarities. Therefore, itis important to show the basal differences in nutrient intake among the different study centres. Thiswill be useful to fully understanding the results of the PREDIMED-Plus study and in addition, if thisintervention is successful to extend it to other countries.
Supplementary Materials: The following materials are available online at http://www.mdpi.com/2072-6643/10/11/1661/s1, Table S1: Intake of food groups (g/day) in both sexes divided by geographical areas and age,Table S2: MedDiet adherence, total energy intake and profile of macronutrients, fibre and alcohol intake bygeographical areas (total population n = 6646) among 55–75 years population, Table S3: Participants with nutrientintake below AR/AI proposed by EFSA by geographical areas, age and sex, Table S4: Logistic regression modelof micronutrients inadequate intake according to EFSA by geographical areas, Table S5: Logistic regressionmodel of micronutrients deficiency intake according to 2/3 DRIs by areas, Table S6: Logistic regression modelof micronutrients deficiency intake according to EFSA by areas, Table S7: Multivariable logistic regressionmodel for inadequate intake of 3 or more out 6 micronutrients in accordance with criteria by EFSA according togeographical area.
Author Contributions: N.C.-I., A.B.-C., M.A.M.-G., D.C., J.S.-S., M.D.Z., M.G.-H., D.R., J.A.M., F.J.B.-L., A.G.-R.,R.E., L.G.-M., A.A.G., J.A.T., F.T., L.S.-M., N.C.-F., J.L., C.V., X.P., J.V., L.D., J.J.G., P.M., E.R., J.D.-E., R.F.-C., J.B., M.F.,J.M.Z., A.C., E.T., A.D.-L., M.A.M., M.R.-C., and A.G. collected all the data from the PREDIMED-Plus trial. N.C.-I.,A.G. and A.B.-C. designed the study; performed the analysis; and wrote the first draft of the manuscript and allauthors contributed to the editing of the manuscript. All authors approved the final version of the manuscript.
Funding: The PREDIMED-Plus trial was supported by the official funding agency for biomedical research ofthe Spanish government, ISCIII through the Fondo de Investigación para la Salud (FIS), which is co-fundedby the European Regional Development Fund (three coordinated FIS projects led by J.S.-S and J.V., includingthe following projects: PI13/00673, PI13/00492, PI13/00272, PI13/01123, PI13/00462, PI13/00233, PI13/02184,
PI13/00728, PI13/01090, PI13/01056, PI14/01722, PI14/00636, PI14/00618, PI14/00696, PI14/01206, PI14/01919,PI14/00853, PI14/01374, PI16/00473, PI16/00662, PI16/01873, PI16/01094, PI16/00501, PI16/00533, PI16/00381,PI16/00366, PI16/01522, PI16/01120, PI17/00764, PI17/01183, PI17/00855, PI17/01347, PI17/00525, PI17/01827,PI17/00532, PI17/00215, PI17/01441, PI17/00508, PI17/01732, PI17/00926), the Especial Action Project entitled:Implementación y evaluación de una intervención intensiva sobre la actividad física Cohorte PREDIMED-Plusgrant to J.S.-S, the European Research Council (Advanced Research Grant 2013–2018; 340918) grant to M.A.M.-G.,the Recercaixa grant to J.S.-S (2013ACUP00194), the grant from the Consejería de Salud de la Junta de Andalucía(PI0458/2013; PS0358/2016), the PROMETEO/2017/017 grant from the Generalitat Valenciana, the SEMERGENgrant and FEDER funds (CB06/03). None of the funding sources took part in the design, collection, analysis orinterpretation of the data, or in the decision to submit the manuscript for publication. The corresponding authorshad full access to all the data in the study and had final responsibility to submit for publication.
Acknowledgments: The first author would like to acknowledge support by the Ministry of Education of Spain(FPU14/03630). The authors especially thank the PREDIMED-Plus participants for their collaboration and thePREDIMED-Plus staff for their support and effort. The authors would like to thank Ingrid de Ruiter, MBChB forEnglish language assistance.
Conflicts of Interest: J.S.-S. reports serving on the board of and receiving grant support through his institutionfrom International Nut and Dried Fruit Council; receiving consulting personal fees from Danone, Font VellaLanjarón, Nuts for Life and Eroski; and receiving grant support through his institution from Nut and DriedFruit Foundation and Eroski. E.R., reports grants, non-financial support and other fees from California WalnutCommission and Alexion; personal fees and non-financial support from Merck, Sharp & Dohme; personal fees,non-financial support and other fees from Aegerion and Ferrer International; grants and personal fees fromSanofi Aventis; grants from Amgen and Pfizer and; personal fees from Akcea, outside of the submitted work.X.P., reports serving on the board of and receiving consulting personal fees from Sanofi Aventis, Amgen andAbbott laboratories; receiving lecture personal fees from Esteve, Lacer and Rubio laboratories. L.D. reports grantsfrom Fundación Cerveza y Salud. J.J.G. reports receiving grants from the Diputación Provincial de Jaén and theFundación Caja Rural de Jaén. All other authors declare no competing interests.
References
1. Abarca-Gómez, L.; Abdeen, Z.A.; Hamid, Z.A.; Abu-Rmeileh, N.M.; Acosta-Cazares, B.; Acuin, C.;Adams, R.J.; Aekplakorn, W.; Afsana, K.; Aguilar-Salinas, C.A.; et al. Worldwide trends in body-massindex, underweight, overweight, and obesity from 1975 to 2016: A pooled analysis of 2416 population-basedmeasurement studies in 128·9 million children, adolescents, and adults. Lancet 2017, 390, 2627–2642.[CrossRef]
2. Basterra-Gortari, F.J.; Bes-Rastrollo, M.; Ruiz-Canela, M.; Gea, A.; Martinez-Gonzalez, M.Á. Prevalence ofobesity and diabetes in Spanish adults 1987–2012. Med. Clin. 2017, 148, 250–256. [CrossRef] [PubMed]
3. Pérez-Rodrigo, C.; Gianzo-Citores, M.; Gil, Á.; González-Gross, M.; Ortega, R.M.; Serra-Majem, L.;Varela-Moreiras, G.; Aranceta-Bartrina, J. Lifestyle patterns and weight status in Spanish adults: TheANIBES study. Nutrients 2017, 9, 606. [CrossRef] [PubMed]
4. Kimokoti, R.W.; Millen, B.E. Nutrition for the Prevention of Chronic Diseases. Med. Clin. N. Am. 2016, 100,1185–1198. [CrossRef] [PubMed]
5. Varela-Moreiras, G.; Ávila, J.M.; Cuadrado, C.; del Pozo, S.; Ruiz, E.; Moreiras, O. Evaluation of foodconsumption and dietary patterns in Spain by the Food Consumption Survey: Updated information. Eur. J.Clin. Nutr. 2010, 64, S37–S43. [CrossRef] [PubMed]
7. Dinu, M.; Pagliai, G.; Casini, A.; Sofi, F. Mediterranean diet and multiple health outcomes: An umbrellareview of meta-analyses of observational studies and randomised trials. Eur. J. Clin. Nutr. 2018, 72, 30–43.[CrossRef] [PubMed]
8. Knight, A.; Bryan, J.; Murphy, K. The Mediterranean diet and age-related cognitive functioning: A systematicreview of study findings and neuropsychological assessment methodology. Nutr. Neurosci. 2017, 20, 449–468.[CrossRef] [PubMed]
9. Wang, Y.; Hao, Q.; Su, L.; Liu, Y.; Liu, S.; Dong, B. Adherence to the Mediterranean Diet and the Risk ofFrailty in Old People: A Systematic Review and Meta-Analysis. J. Nutr. Health Aging 2018, 22, 613–618.[CrossRef] [PubMed]
10. Godos, J.; Zappalà, G.; Bernardini, S.; Giambini, I.; Bes-Rastrollo, M.; Martinez-Gonzalez, M. Adherence tothe Mediterranean diet is inversely associated with metabolic syndrome occurrence: A meta-analysis ofobservational studies. Int. J. Food Sci. Nutr. 2017, 68, 138–148. [CrossRef] [PubMed]
11. Grosso, G.; Marventano, S.; Yang, J.; Micek, A.; Pajak, A.; Scalfi, L.; Galvano, F.; Kales, S.N. A comprehensivemeta-analysis on evidence of Mediterranean diet and cardiovascular disease: Are individual componentsequal? Crit. Rev. Food Sci. Nutr. 2017, 57, 3218–3232. [CrossRef] [PubMed]
12. Martínez-González, M.A.; Salas-Salvadó, J.; Estruch, R.; Corella, D.; Fitó, M.; Ros, E. Benefits of theMediterranean Diet: Insights from the PREDIMED Study. Prog. Cardiovasc. Dis. 2015, 58, 50–60. [CrossRef][PubMed]
13. Alberti, K.G.; International Diabetes Federation Task Force on Epidemiology and Prevention; HationalHeart, Lung, and Blood Institute; American Heart Association; World Heart Federation; InternationalAtherosclerosis Society; International Association for the Study of Obesity. Harmonizing the metabolicsyndrome: A joint interim statement of the international diabetes federation task force on epidemiology andprevention; National heart, lung, and blood institute; American heart association; World heart federation;International atherosclerosis society; And international association for the study of obesity. Circulation 2009,120, 1640–1645. [PubMed]
14. Agarwal, S.; Reider, C.; Brooks, J.R.; Fulgoni, V.L. Comparison of Prevalence of Inadequate Nutrient IntakeBased on Body Weight Status of Adults in the United States: An Analysis of NHANES 2001–2008. J. Am.Coll. Nutr. 2015, 34, 126–134. [CrossRef] [PubMed]
15. Martí, A.Z.; Ferrer Cascales, R.; Sánchez, J.A.H.; Pérez, A.L. Adherence to the mediterranean diet and itsrelation to nutritional status in older people. Nutr. Hosp. 2015, 31, 1667–1674.
16. Fávaro-Moreira, N.C.; Krausch-Hofmann, S.; Matthys, C.; Vereecken, C.; Vanhauwaert, E.; Declercq, A.;Bekkering, G.E.; Duyck, J. Risk factors for malnutrition in older adults: A systematic review of the literaturebased on longitudinal data. Adv. Nutr. 2016, 7, 507–522. [CrossRef] [PubMed]
17. Bernstein, M. Nutritional Needs of the Older Adult. Phys. Med. Rehab. Clin. N. Am. 2017, 28, 747–766.[CrossRef] [PubMed]
18. Benhammou, S.; Heras-González, L.; Ibáñez-Peinado, D.; Barceló, C.; Hamdan, M.; Rivas, A.;Mariscal-Arcas, M.; Olea-Serrano, F.; Monteagudo, C. Comparison of Mediterranean diet compliancebetween European and non-European populations in the Mediterranean basin. Appetite 2016, 107, 521–526.[CrossRef] [PubMed]
19. León-Munoz, L.M.; Guallar-Castillón, P.; Graciani, A.; López-García, E.; Mesas, A.E.; Aguilera, M.T.;Banegas, J.R.; Rodríguez-Artalejo, F. Adherence to the mediterranean diet pattern has declined in Spanishadults. J. Nutr. 2012, 142, 1843–1850. [CrossRef] [PubMed]
20. Abellán Alemán, J.; Zafrilla Rentero, M.P.; Montoro-García, S.; Mulero, J.; Pérez Garrido, A.; Leal, M.;Guerrero, L.; Ramos, E.; Ruilope, L.M. Adherence to the “Mediterranean diet” in Spain and its relationshipwith cardiovascular risk (DIMERICA study). Nutrients 2016, 8, 680. [CrossRef] [PubMed]
21. Katsarou, A.; Tyrovolas, S.; Psaltopoulou, T.; Zeimbekis, A.; Tsakountakis, N.; Bountziouka, V.; Gotsis, E.;Metallinos, G.; Polychronopoulos, E.; Lionis, C.; et al. Socio-economic status, place of residence anddietary habits among the elderly: The Mediterranean islands study. Public Health Nutr. 2010, 13, 1614–1621.[CrossRef] [PubMed]
22. Samaniego-Vaesken, M.D.; Partearroyo, T.; Ruiz, E.; Aranceta-Bartrina, J.; Gil, Á.; González-Gross, M.;Ortega, R.M.; Serra-Majem, L.; Varela-Moreiras, G. The influence of place of residence, gender and ageinfluence on food group choices in the Spanish population: Findings from the ANIBES study. Nutrients 2018,10, 392. [CrossRef] [PubMed]
23. Bertomeu, V.; Castillo-Castillo, J. Cardiovascular disease in Spain today. From risk factors to morbidity.Rev. Esp. Cardiol. Supl. 2008, 8, 2E–9E.
24. Martínez-González, M.Á.; Corella, D.; Salas-Salvadó, J.; Ros, E.; Covas, M.I.; Fiol, M.; Wärnberg, J.; Arós, F.;Ruíz-Gutiérrez, V.; Lamuela-Raventós, R.M.; et al. Cohort Profile: Design and methods of the PREDIMEDstudy. Int. J. Epidemiol. 2018, 41, 377–385. [CrossRef] [PubMed]
25. Willet, W. Nutritional Epidemiology, 3rd ed.; Oxford University Press: New York, NY, USA, 2013.26. Martin-moreno, J.M.; Boyle, P.; Gorgojo, L.; Maisonneuve, P.; Fernandez-rodriguez, J.C.; Salvini, S.;
Willett, W.C. Development and validation of a food frequency questionnaire in Spain. Int. J. Epidemiol. 1993,22, 512–519. [CrossRef] [PubMed]
27. De La Fuente-Arrillaga, C.; Vzquez Ruiz, Z.; Bes-Rastrollo, M.; Sampson, L.; Martinez-González, M.A.Reproducibility of an FFQ validated in Spain. Public Health Nutr. 2010, 13, 1364–1372. [CrossRef] [PubMed]
28. Fernández-Ballart, J.D.; Piñol, J.L.; Zazpe, I.; Corella, D.; Carrasco, P.; Toledo, E.; Perez-Bauer, M.;Martínez-González, M.Á.; Salas-Salvadó, J.; Martín-Moreno, J.M. Relative validity of a semi-quantitativefood-frequency questionnaire in an elderly Mediterranean population of Spain. Br. J. Nutr. 2010, 103,1808–1816. [CrossRef] [PubMed]
29. Moreiras, O.C.A.; Cabrera, L.; Cuadrado, C. Tablas de Composición de Alimentos; (Spanish Food CompositionTables); Pirámide: Madrid, Spain, 2003.
30. Mataix-Verdú, J.; García Diz, L.; Mañas Almendros, M.; Emilio, M.d.V.; Llopis González, J. Tablas deComposición de Alimentos, 4th ed.; Universidad de Granada: Granada, Spain, 2009.
31. Schröder, H.; Fitó, M.; Estruch, R.; Martínez-González, M.A.; Corella, D.; Salas-Salvadó, J.;Lamuela-Raventós, R.; Ros, E.; Salaverría, I.; Fiol, M.; et al. A Short Screener Is Valid for AssessingMediterranean Diet Adherence among Older Spanish Men and Women. J. Nutr. 2011, 141, 1140–1145.[CrossRef] [PubMed]
32. IOM. Nutrient Recommendations: Dietary Reference Intakes. Available online: https://www.ncbi.nlm.nih.gov/books/NBK56068/table/summarytables.t2/?report=objectonly (accessed on 10 May 2018).
33. Health NIo. Nutrient Recommendations: Dietary Reference Intakes (DRI) 2018. Available online: https://ods.od.nih.gov/Health_Information/Dietary_Reference_Intakes.aspx (accessed on 10 May 2018).
34. Ortiz-Andrellucchi, A.; Sánchez-Villegas, A.; Doreste-Alonso, J.; de Vries, J.; de Groot, L.; Serra-Majem, L.Dietary assessment methods for micronutrient intake in elderly people: A systematic review. Br. J. Nutr.2009, 102 (Suppl. 1), S118–S149. [CrossRef] [PubMed]
35. EFSA. Dietary Reference Values and Dietary Guidelines. Available online: https://www.efsa.europa.eu/en/topics/topic/dietary-reference-values (accessed on 26 September 2018).
36. Elosua, R.; Marrugat, J.; Molina, L.; Pons, S.; Pujol, E. Validation of the minnesota leisure time physicalactivity questionnaire in Spanish men. Am. J. Epidemiol. 1994, 139, 1197–1209. [CrossRef] [PubMed]
37. Elosua, R.; Garcia, M.; Aguilar, A.; Molina, L.; Covas, M.I.; Marrugat, J. Validation of the Minnesota leisuretime physical activity questionnaire in Spanish women. Med. Sci. Sports Exerc. 2000, 32, 1431–1437.[CrossRef] [PubMed]
38. Martínez-González, M.Á.; Hershey, M.S.; Zazpe, I.; Trichopoulou, A. Transferability of the Mediterraneandiet to non-Mediterranean countries. What is and what is not the Mediterranean diet. Nutrients 2017, 9, 1226.[CrossRef] [PubMed]
39. Ruiz, E.; Ávila, J.M.; Valero, T.; del Pozo, S.; Rodriguez, P.; Aranceta-Bartrina, J.; Gil, Á.; González-Gross, M.;Ortega, R.M.; Serra-Majem, L.; et al. Energy intake, profile, and dietary sources in the spanish population:Findings of the ANIBES study. Nutrients 2015, 7, 4739–4762. [CrossRef] [PubMed]
40. Varela-Moreiras, G.; Ruiz, E.; Valero, T.; Ávila, J.M.; del Pozo, S. The Spanish diet: An update. Nutr. Hosp.2013, 28 (Suppl. 5), 13–20. [PubMed]
41. Aranceta, J.B.; Arija, V.V.; Maíz, E.A.; Martínez, E.D.; Ortega, R.A.; Pérez-Rodrigo, C.; Quiles, J.I.;Rodríguez, A.M.; Román, B.V.; Salvador, G.C.; et al. Dietary Guidelines for the Spanish population (SENC,diciembre 2016); the new graphic icon of healthy food. Nutr. Hosp. 2016, 33, 1–48.
42. Vazquez-Ruiz, Z.; de la Fuente-Arrillaga, C.; Bes-Rastrollo, M.; Zazpe, I.; Santiago, S.; Razquin, C.; Toledo, E.;Martinez-Gonzalez, M.Á. Egg consumption and dyslipidemia in a mediterranean cohort. Nutr. Hosp. 2018,35, 153–161. [PubMed]
43. Beydoun, M.A.; Fanelli-Kuczmarski, M.T.; Allen, A.; Beydoun, H.A.; Popkin, B.M.; Evans, M.K.;Zonderman, A.B. Monetary value of diet is associated with dietary quality and nutrient adequacy amongurban adults, differentially by sex, race and poverty status. PLoS ONE 2015, 10, e0140905. [CrossRef][PubMed]
44. Oconnor, L.; Walton, J.; Flynn, A. Dietary energy density: Estimates, trends and dietary determinants for anationally representative sample of the Irish population (aged 5–90 years). Br. J. Nutr. 2015, 113, 172–180.[CrossRef] [PubMed]
45. Schuh, D.S.; Pellanda, L.C.; Guessous, I.; Marques-Vidal, P. Trends and determinants of change in complianceto dietary guidelines in a Swiss community-dwelling sample. Prev. Med. 2018, 111, 198–203. [CrossRef][PubMed]
46. Bonaccio, M.; Bes-Rastrollo, M.; de Gaetano, G.; Iacoviello, L. Challenges to the Mediterranean diet at a timeof economic crisis. Nutr. Metab. Cardiovasc. Dis. 2016, 26, 1057–1063. [CrossRef] [PubMed]
47. Zazpe, I.; Sanchez-Tainta, A.; Estruch, R.; Lamuela-Raventos, R.M.; Schröder, H.; Salas-Salvado, J.; Corella, D.;Fiol, M.; Gomez-Gracia, E.; Aros, F.; et al. A Large Randomized Individual and Group InterventionConducted by Registered Dietitians Increased Adherence to Mediterranean-Type Diets: The PREDIMEDStudy. J. Am. Diet. Assoc. 2008, 108, 1134–1144. [CrossRef] [PubMed]
48. Jurado, D.; Burgos-Garrido, E.; Diaz, F.J.; Martínez-Ortega, J.M.; Gurpegui, M. Adherence to theMediterranean Dietary Pattern and Personality in Patients Attending a Primary Health Center. J. Acad.Nutr. Diet. 2012, 112, 887–891. [CrossRef] [PubMed]
49. Patino-Alonso, M.C.; Recio-Rodríguez, J.I.; Belio, J.F.; Colominas-Garrido, R.; Lema-Bartolomé, J.;Arranz, A.G.; Agudo-Conde, C.; Gomez-Marcos, M.A.; García-Ortiz, L.; EVIDENT Group. Factors associatedwith adherence to the mediterranean diet in the adult population. J. Acad. Nutr. Diet. 2014, 114, 583–589.[CrossRef] [PubMed]
50. Dietary Reference Intakes. Dietary Reference Intakes: Applications in Dietary Assessment; National AcademyPress: Washington, DC, USA, 2000.
51. Ruiz, E.; Ávila, J.M.; Valero, T.; del Pozo, S.; Rodriguez, P.; Aranceta-Bartrina, J.; Gil, Á.; González-Gross, M.;Ortega, R.M.; Serra-Majem, L.; et al. Macronutrient distribution and dietary sources in the spanish population:Findings from the ANIBES study. Nutrients 2016, 8, 177. [CrossRef] [PubMed]
52. Sánchez-Tainta, A.; Zazpe, I.; Bes-Rastrollo, M.; Salas-Salvadó, J.; Bullo, M.; Sorlí, J.V.; Corella, D.; Covas, M.I.;Arós, F.; Gutierrez-Bedmar, M.; et al. Nutritional adequacy according to carbohydrates fat quality. Eur. J. Nutr.2016, 55, 93–106. [CrossRef] [PubMed]
53. Guasch-Ferré, M.; Babio, N.; Martínez-González, M.A.; Corella, D.; Ros, E.; Martín-Peláez, S.; Estruch, R.;Arós, F.; Gómez-Gracia, E.; Fiol, M.; et al. Dietary fat intake risk of cardiovascular disease all-cause mortalityin a population at high risk of cardiovascular disease. Am. J. Clin. Nutr. 2015, 102, 1563–1573. [PubMed]
54. Naska, A.; Trichopoulou, A. Back to the future: The Mediterranean diet paradigm. Nutr. Metab.Cardiovasc. Dis. 2014, 24, 216–219. [CrossRef] [PubMed]
55. Agarwal, E.; Miller, M.; Yaxley, A.; Isenring, E. Malnutrition in the elderly: A narrative review. Maturitas2013, 76, 296–302. [CrossRef] [PubMed]
56. ter Borg, S.; Verlaan, S.; Hemsworth, J.; Mijnarends, D.M.; Schols, J.M.; Luiking, Y.C.; de Groot, L.C.Micronutrient intakes and potential inadequacies of community-dwelling older adults: A systematic review.Br. J. Nutr. 2015, 113, 1195–1206. [CrossRef] [PubMed]
57. Roussel, A.M. Micronutrient deficiencies in obesity: Metabolic and clinical consequences. Nutr. Clin. Metab.2017, 31, 268–275. [CrossRef]
58. Hallkvist, O.M.; Johansson, J.; Nordström, A.; Nordström, P.; Hult, A. Dairy product intake and boneproperties in 70-year-old men and women. Arch. Osteoporos. 2018, 13, 9. [CrossRef] [PubMed]
59. Shatenstein, B.; Gauvin, L.; Keller, H.; Richard, L.; Gaudreau, P.; Giroux, F.; Gray-Donald, K.; Jabbour, M.;Morais, J.A.; Payette, H. Baseline determinants of global diet quality in older men and women from theNuAge cohort. J. Nutr. Health Aging 2013, 17, 419–425. [CrossRef] [PubMed]
60. Newby, P.K.; Noel, S.E.; Grant, R.; Judd, S.; Shikany, J.M.; Ard, J. Race and region have independent andsynergistic effects on dietary intakes in black and white women. Nutr. J. 2012, 11, 25. [CrossRef] [PubMed]
61. Sales, C.H.; Fontanelli, M.D.M.; Vieira, D.A.S.; Marchioni, D.M.; Fisberg, R.M. Inadequate dietary intake ofminerals: Prevalence and association with socio-demographic and lifestyle factors. Br. J. Nutr. 2017, 117,267–277. [CrossRef] [PubMed]
62. de Souza Fernandes, D.P.; Duarte, M.S.L.; Pessoa, M.C.; Franceschini, S.D.C.C.; Ribeiro, A.Q. Evaluationof diet quality of the elderly and associated factors. Arch. Gerontol. Geriatr. 2017, 72, 174–180. [CrossRef][PubMed]
63. Mercille, G.; Richard, L.; Gauvin, L.; Kestens, Y.; Shatenstein, B.; Daniel, M.; Payette, H. The food environmentand diet quality of urban-dwelling older women and men: Assessing the moderating role of diet knowledge.Can. J. Public Health 2016, 107, 5309. [CrossRef] [PubMed]
64. Mendonça, N.; Hill, T.R.; Granic, A.; Davies, K.; Collerton, J.; Mathers, J.C.; Siervo, M.; Wrieden, W.L.;Seal, C.J.; Kirkwood, T.B.; et al. Micronutrient intake and food sources in the very old: Analysis of theNewcastle 85+ Study. Br. J. Nutr. 2016, 116, 751–761. [CrossRef] [PubMed]
65. Schoufour, J.D.; de Jonge, E.A.; Kiefte-de Jong, J.C.; van Lenthe, F.J.; Hofman, A.; Nunn, S.P.; Franco, O.H.Socio-economic indicators and diet quality in an older population. Maturitas 2018, 107, 71–77. [CrossRef][PubMed]
66. Arbucias, J.S. The evolution of internal migration in Spain: An assessment of available demographic sources.Papers 2011, 96, 853–881.
67. (INE) INE. Estadística de Variaciones Regionales en España. Variaciones Residenciales Interiores. Serie1998–2017. Available online: https://www.ine.es/dynt3/inebase/es/index.htm?type=pcaxis&path=/t20/p307/serie&file=pcaxis&dh=0&capsel=02018 (accessed on 11 October 2018).