Page 1
Dietary practices in patients with chronic kidney
disease not yet on maintenance dialysis:
What are the relevant components?
3rd International Conference of
European Renal Nutrition Working Group of ERA-EDTA
T. Alp Ikizler, MD
Vanderbilt University Medical Center
Page 2
Considerations for Nutritional Requirements in Kidney Disease
Protein intake
CKD - Progression
ESRD - Protein wasting
CKD and ESRD
Na/K/PO4 (HTN; Hyperkalemia; Bone Mineral Disorders)
Metabolic Disorders (Inflammation; Oxidative Stress)
Calorie intake
CKD - Obesity; Insulin Resistance
ESRD - Wasting-Obesity Paradox
Page 3
1. Sanches FM, et al. Am J Kidney Dis. 2008;52:66-73.
2. Campbell KL, et al. Clin Nutr. 2008;27:537-544.
PEW is present in 12-18% of stages 3 and 4 CKD patients
2 studies reported PEW prevalence up to 18% in patients with early-stage CKD (3 and 4)
• 18% prevalence in CKD stages 3 and 4 patients in Brazil using SGA (n=122, age 55 ±11)1
• 12% prevalence in CKD stage 4 patents in Australia, using SGA (n=56, age 70 ±14)2
Page 4
Appetite decreases as CKD progresses
Carrero JJ. J Ren Nutr. 2009;19:10-15.
eGFR<90 mL/min
Retention of uremic toxins – suppress
appetite Increased dialysis dose improves feeding behavior
Dialysisbegins
Transplantation
Starts when eGFR<10-25% of normal
eGFR<60 mL/min
Ap
pet
ite
eGFR<30 mL/min
eGFR<15 mL/min
Page 5
5Mitch and Ikizler
Handbook of Nutrition and The KidneyUremic Toxins
Page 6
Rates of Death and CV Events in Patients
According to GFR
Page 7
CVD
Frailty
InfectionCo-Morbid Conditions(Diabetes, CVD, Depression)
Dialysis-Associated Catabolism
Metabolic Derangements(Insulin Resistance, Metabolic Acidosis, IGF-1/GH Resistance)
Dietary Nutrient Intake
Loss of Kidney Function Uremic Toxin Retention
Protein-Energy WastingSarcopenia
Inflammation
Etiology and Consequences of Protein Energy Wasting in CKD
Carrero JJ et al on behalf of ISRNM; JREN 2013
Page 8
Slide courtesy of Peter Stenvinkel
Stenvinkel et al. CJASN 2007
Page 9
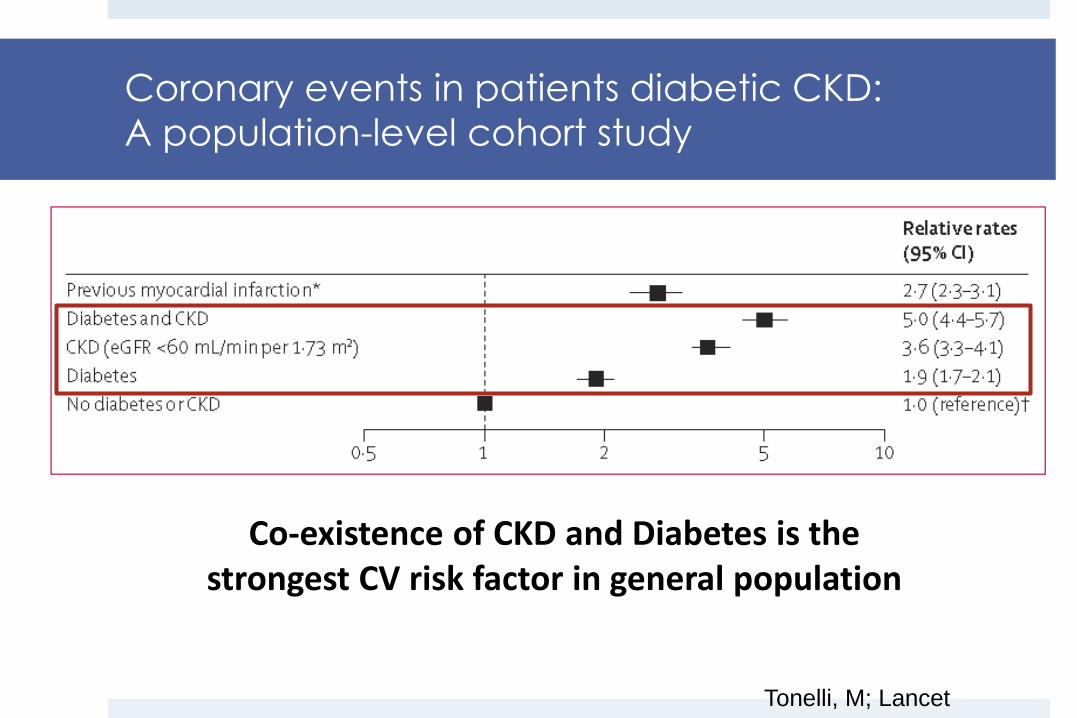
Coronary events in patients diabetic CKD:
A population-level cohort study
Tonelli, M; Lancet
Co-existence of CKD and Diabetes is the strongest CV risk factor in general population
Page 10
Obesity is a global health issue that seems to worsen overtime
Page 11
Consequences of Obesity in Kidney Disease
Stenvinkel, Ikizler, Zoccali
JASN 2014
Page 12
Decreased clearance
Adipokine
imbalance
Increased fat mass
Adipose tissueAdiponectin
Muscle tissue
• Insulin resistance
• Lipid accumulation
• Muscle breakdown
Vasculature
• Endothelial activation
• Inflammation
• Oxidative stress
• Vascular calcification
Leptin
Resistin
TNF-a
IL-6
• Anorexia
• Depression
• Increased REE
• Sympathetic overactivity
Brain
BBB
Slide courtesy of Dr. Peter Stenvinkel
Page 13
BMI (Adiposity) is the Primary Determinant of
Insulin Resistance in Stage 3-4 CKD
Trirogoff et al, AJCN 2007
Page 14
BMI (Adiposity) is an Independent Determinant of Oxidative
Stress in Stage 3-4 CKD
Ramos et al, JASN 2008
Page 15
A Proposed Mechanism for Uremia-Induced CVD Risk
Page 16
Interventions Targeted at Non-Traditional CV Risk
Factors in Uremia – Lifestyle Interventions
Uremia Oxidative stress
Inflammation
Endothelial Dysfunction
Insulin resistance
CV
Risk
Diet
Page 18
Interventions Targeted at Non-Traditional CV
Risk Factors in Uremia
Uremia Inflammation
Oxidative stress
Endothelial Dysfunction
Insulin resistance
CV
Risk
Anti-inflammatoryAnti-cytokine - Omega 3
Page 19
Study Design
Patient screening &Enrollment
Rilonacept (IL-1 blocker)*160 mg subcutaneously
weekly X 12 weeks
Placebo X 12 weeks
1:1 Randomization
Pilot & Feasibility Study
Double blinded
Placebo Control-RCT
* Loading dose 320 mg
NCT 00897715 & NCT01663103
IL-1Beta Inhibition in Moderate CKD
Hung, Novak, Ikizler, Chonchol
Page 20
Outcomes • Primary outcomes:
Measurements of vascular health: endothelial
function ( brachial FMD%) and arterial stiffness (aPWV)
• Secondary outcomes:
Biomarkers of inflammation
Adiponectin and other markers of insulin resistance
FGF23 and other markers of MBD
Page 21
Rilonacept effectively reduced hsCRP levels in patients with CKD stages 3 & 4
0
2
4
6
8
10
12
14
16
18
20
1 2 3 4
P=0.006
hsC
RP,
mg/d
l
Rilonacept Placebo
4.62.1 3.3 2.8
* Analysis done using a mixed effect model
Page 22
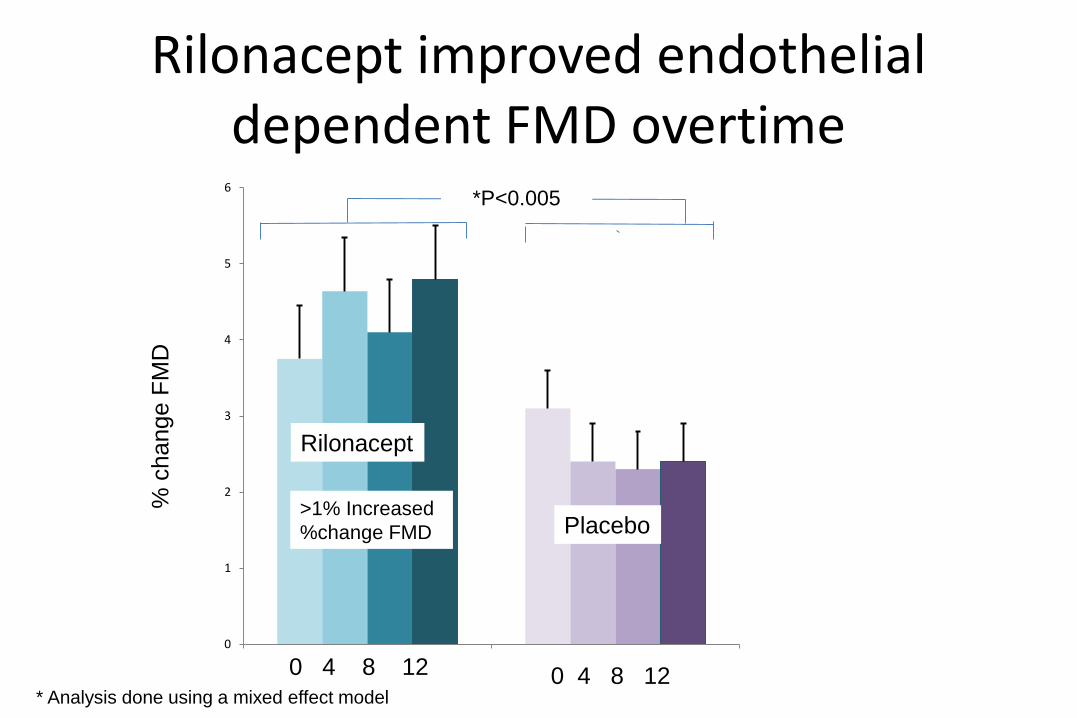
Rilonacept improved endothelial dependent FMD overtime
0
1
2
3
4
5
6
IL-1 Trap Placebo
*P<0.005
% c
hange F
MD
>1% Increased
%change FMD
Placebo0 4 8 12 0 4 8 12
Rilonacept
Placebo
* Analysis done using a mixed effect model
Page 23
Rilonacept did not improveaortic pulse-wave velocity (aPWV)
0
200
400
600
800
1000
1200
1400
1600
Rilonacept Placebo
aP
WV
(cm
/sec)
0 4 8 12 0 4 8 12
Week
Rilonacept Placebo
P=0.56
Page 24
Rilonacept Increased Serum
Adiponectin Levels Compared to Placebo
0
5
10
15
20
25
30
35
40
45
IL-1 Trap Placebo
baseline
Week 12
P=0.03
1412.7
29.8
21
*adip
onectin, μ
g/m
l
Rilonacept Placebo
Page 25
Uremia Oxidative Stress
Inflammation
Endothelial Dysfunction
Insulin Resistance
CV
Risk
Antioxidants
Interventions Targeted at Non-Traditional CV
Risk Factors in Uremia
Page 26
Tocopherols and Alpha Lipoic Acid Therapy
(TALAT) in CKD Trial
Randomized, double-blind, placebo-controlled trial
N = 80 Stage 3-4 CKD patients
Tocopherols + a-lipoic acid vs. placebo x 8 weeks
Primary endpoint, change in F2-isoprostanes
Secondary endpoints
Inflammatory biomarkers
Insulin resistance
Endothelial dysfunction
CH3CHCH33
H3CHH33CC
HOHOHO
OOO
CH3CHCH33
H3CHH33CC
HOHOHO
OOO
OH
O
S S
Page 27
TALAT in CKD TrialF2-isoprostane
F2-Iso
0
0.02
0.04
0.06
0.08
0.1
0.12
Placebo VitE/ALA
F2
-Is
op
ros
tan
es
Baseline
Month2
Page 28
Diet and Exercise Intervention to Improve CV Risk Factors in
Stage 3-4 CKD Patients
Uremia Oxidative stress
Inflammation
Endothelial Dysfunction
Insulin resistance
CV
Risk
Diet & Exercise
Ikizler, Himmelfarb et al, JASN 2017
Page 29
• 122 subjects – 92 completed
• 2x2 Factorial Design
• 4 month Randomized, non-blinded
• Interventions
• Diet: 500 -700 kcal/d restriction
• Exercise: Supervised Endurance 3 X Week
• Primary Outcomes:
• Weight; F2Isoprostane; IL-6; VO2Peak
Ikizler Himmelfarb JASN 2017
Page 30
Diet and Exercise Intervention to Improve CV
Risk Factors in Stage 3-4 CKD Patients
Primary Outcomes:
F2-isoprostane; Weight; VO2peak
Secondary Outcomes:
Interleukin-6; Adipocytokines; Physical Activity
Page 31
Changes in VO2 peak in Response to Diet and Exercise Interventions Compared to Changes in Control Group
Page 32
Changes in Weight and Body % Fat in Response to Diet and Exercise Interventions Compared to Changes in Control Group
Page 33
Changes in F2-isoprostane and Interleukin-6 in Response to Diet and Exercise Interventions Compared to Changes in Control Group
Page 34
Changes in Adipocytokine levels in Response to Diet and Exercise Interventions Compared to Changes in Control Group
Alsouqi, Ikizler, Himmelfarb Submitted
Page 35
Changes in Total Daily Physical Activity in Response to Diet and Exercise Interventions Compared to Changes in Control Group
Taylor, Ikizler, Himmelfarb Submitted
Page 36
Prevalence and severity of kidney disease in patients admitted with Acute Decompensated Heart Failure
118,465 Patients Hospitalized with ADHF (ADHERE Database)
Page 37
CKD, Heart Failure & Nutrition
• Similar etiological factors
– Na, Obesity, Inflammation, Altered Metabolism
• Epidemiology of Chronic disease (? paradox)
• Difficulty in nutritional assessment
– Na intake; Dietary patterns; Body Composition
• Lack of evidence based guidelines
Page 38
23Na Magnetic Resonance Imaging of Tissue Sodium
Page 40
Muscle and Skin Sodium Content are
Elevated in MHD patients
MHD
(n=10)
Control
(n=8)
p
Muscle Na
Content
(mmol/L)
21 (18, 25) 17 (15, 19) 0.02
MHD
(n=10)
Control
(n=8)
p
Skin Na
Content
(mmol/L)
18 (15, 21) 17 (14, 19) 0.36
Page 41
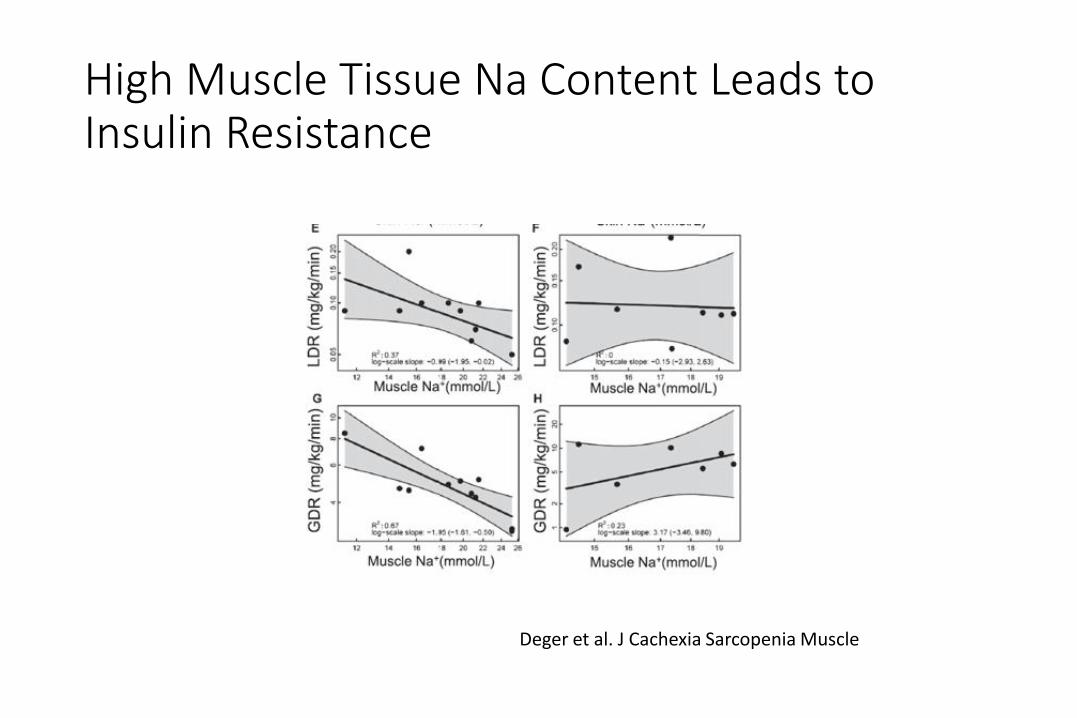
Deger et al. J Cachexia Sarcopenia Muscle
High Muscle Tissue Na Content Leads to Insulin Resistance
Page 42
Special Considerations for Fat Intake in CKD
CKD patients are recommended to follow general advice for hearth health, including:
– Saturated fat <7% of total calories;
– Unsaturated fat to substitute saturated fat
Omega 3 fatty acids demonstrate promising benefits:
– triglyceride levels, dialysis access patency, and cardiovascular risk factors
Kris-Etherton et al Circulation (2002) 106: p2747-57;
Allomon & Moe CJASN (2006) 2: p182-192
Page 43
Lipid-lowering therapy in CKD: SHARP Study
Page 44
Vitamins and Trace Elements
• Water-soluble vitamins (esp B6, C and folate)
– Losses: Dialysis removal > normal urinary losses
• Fat-soluble vitamins
– Usually only Vit D supplemented
– Vit A & E (risk of toxicity), intake should meet RDI
• Trace elements
– Zinc, selenium, copper, aluminium & magnesium
– Iron (oral supplements not recommended)
Page 45
Nutritional Considerations in CKD
Loss of kidney function leads to number of metabolic
derangements
A multitude of dietary and other nutritional strategies can
be applied in the setting of moderate to advanced CKD
Healthy lifestyle interventions
Anti-inflammatory; Anti-oxidant; Insulin Sensitizing
Novel targets
Interventions personalized to individual patients are more
likely to succeed in CKD.
Page 46
Funding/Other Support
NIH/NIDDK/NHLBI/NIEHS
RCG/FMC/Abbott/Baxter
NKF/AKF/ASN/ISRNM
SatelliteHealth grant program
Vanderbilt Clinical and Translational Research Award
Vanderbilt Center for Kidney Disease - Clinical
Research Group
Kidney Research Institute – UW; J. Himmelfarb