-MEICAL A -A255 090 ýýDIEVILOPMENT - ENGINEERING CENTER l ... CRDEC-T-8 VAPOR PRESSURE DATA ANALYSIS METHODOLOGY, STATISTICS, AND APPLICATIONS DTIC Elwin C. Penski S 'E-LECTE .SEP04.1992 RESEARCH DIRECTORATE S A July 1992 Approved for public release; distribution Is unlimited. ARMAMENT MUNITIONSN CHEMICAL COMMAND Aberdeen Pftoven Ground. Merytand 21010-=23 -, 92-24541 3 ,1 1 I,,I ,,I ,/ 1
Transcript
-MEICAL A -A255 090
ýýDIEVILOPMENT -ENGINEERINGCENTERl ... CRDEC-T-8
VAPOR PRESSURE DATA ANALYSIS METHODOLOGY,STATISTICS, AND APPLICATIONS
DTIC Elwin C. PenskiS 'E-LECTE
.SEP04.1992 RESEARCH DIRECTORATE
S A
July 1992
Approved for public release; distribution Is unlimited.
ARMAMENT
MUNITIONSNCHEMICAL COMMAND
Aberdeen Pftoven Ground. Merytand 21010-=23
-, 92-245413 ,1 1 I ,,I ,,I ,/ 1
A.M-
Disclaimer
The findings in this report are not to be construed as an officialDepartment of the Army position unless so designated by otherauthorizing documents.
Form ApprovedREPORT DOCUMENTATION PAGE OMB No 0704-0188
gathieuw% end masleontlng the datale ie4d. end cO.mlietl and revue,enq the collection of inforw.etuon. $end ommqnms elrding thNt bgrdn eltimate Q, any oth,, avect'< of th*hitOn"1 of unfoqsnmei . ,ncluin hone ice rel udo g this burde, to Wasington h jam artemrservices. Ourect t n1o 1t Mfor n I OIn 0etions and Reports. 1215 lefferson
Oavt44ghwo•, Su'e 1204. A lhqlon. VA 2Z020.41302. ad•4o the Office of Manaen ment and ludget. PeOrwori Reduction Project (0?A.0111).Wftshington. VC 20 01
1. AGENCY USE ONLY (Leave blank) 2. REPORT DATE 3. REPORT TYPE AND DATES COVERED1992 July Final, 69 Mar - 92 May
4. TITLE AND SUBTITLE 5. FUNDING NUMBERSVapor Pressure Data Analysis Methodology, Statistics, PR-1L162706A553Land Applications
6. AUTHOR(S)
Penski, Elwin C.
7. PERFORMING ORGANIZATION NAME(S) AND ADDRESS(ES) 8. PERFORMING ORGANIZATIONREPORT NUMBER
9. SPONSORING/ MONITORING AGENCY NAME(S) AND ADDRESS(RS) 10. SPONSORING / MONITORINGAGENCY REPORT NUMBER
IT. SUPPLEMENTARY NOTES
12s. DISTRIBUTION /AVAILABILITY STATEMENT 12b. DISTRIBUTION CODE
Approved for public release; distribution is unlimited.
13. ABSTRACT (Maximum 200 words)
A method of fitting vapor pressure temperature data to the Antoineequation is described along with a detailed statistical analysis of the fitsand calculations of vapor pressures, enthalpies of vaporization, volatilities(concentration of saturated vapors), and boiling points with the Antoineconstants. It is shown that the number of digits required to accuratelyperform vapor pressure calculations is greater than previously believed. Thesystem permits calculation of the limt-'s of error for any level of confidence.A program is used to analyze and plot the available vapor pressure data fordiethyl malonate.
14. SUBJECT TERMqS 15. NUMBER OF PAGES
Vapor pressure Antoine equation Volatility 70Temperature Statistics Plotting 16. PRICE CODEConfidence level (continued on page 2)
17. SECURITf CLASSIFICATION 18. SECURITY CLASSIFICATION 19. SECURITY CLASSIFICATION 20. LIMITATION OF ABSTRACTOF REPORT OF THIS PAGE OF ABSTRACT IO
UNCLASSIFIED UNCLASSIFIED UNCLASSIFIEDtJSN 7540.01-280-5500 Standard Form 298 (Rev 2 89)
r,*Av."id bv aiNti %1d 1l9-e21 112
14. SUBJECT TERMS (continued)
Enthalpy of vaporizationConcentration of saturated vaporExperimental methods"Diethyl malonateConfidence limits
2
PREFACE
The work described in this report was authorized underProject No. 1L162706A553L, Toxin Defense Technology. This workwas started in March 1969 and completed in May 1992.
The use of trade names or manufacturers' names in thisreport does not constitute an official endorsement of anycommercial products. This report may not be cited for purposesof advertisement.
Reproduction of this document in whole or in part isprohibited except with permission of the Commander, U.S. ArmyChemical Research, Development and Engineering Center (CRDEC),ATTN: SMCCR-SPS-T, Aberdeen Proving Ground, MD 21010-5423.However, the Defense Technical Information Center and theNational Technical Information Service are authorized toreproduce the document for U.S Government purposes.
This report has been approved for release to thepublic.
Acknowledaments
Special thanks are due to Corkey Smith and Patsy A.D'Eramo, Jr., of the Information Services Division, ManagementInformation Systems Directorate, CRDEC, for their extensive helpin locating reports and information. The comments of Dr. KennethCollins, Helen M. Walker, and Ann Brozena of the PhysicalChemistry Branch, Chemical Division, Research Directorate, CRDEC,are also greatly appreciated. The suggestions of Mary CarrollCroarkin, Statistical Engineering Division, National Institute ofStandards and Technology, are greatly appreciated. Thanks aredue to Ronald J. Kassel, Organic Chemistry Branch, ChemicalDivision, Research Directorate, CRDEC, for assistance inobtaining plots.
2.1 Estimation Methods for the Vapor Pressures ofComplex Organic Compounds ...................... e
*2 .2 The Antoine Equati~on ........0......................0 0 * * * 92.3 Least Squares Pits .......... ............ .. . ..... 122.4 Statistics of Data Fitted to a Linear Equation .... 142.5 Enthalpy of Vaporization .......................... 152.6 Concentration of Saturated Vapor ................. 16
3.1 Errors of Vapor Pressure Calculations ............. 173.2 Errors of Boiling Point Calculations .............. 183.3 Errors in Enthalpy of Vaporization Calculations.... 203.4 General Computation Methodology ................... 223.5 The Computer Program .............................. 22
LITERATURE CITED .................................... 31
APPENDIXES
A. GLOSSARY OF TERMS ........................ 33B. CALCULATION OF F FROM F-DISTRIBUTION ..... 35C. DEFINITION OF VOLATILITY OR CONCENTRATION
OF SATURATED VAPOR ...................... 37D. EMPIRICAL FORMULA INDEXING OF ORGANIC
COMPOUNDS .............................. 39a. CHEMICAL THERMODYNAMICS DATA CENTER (NIST)
REFERENCE CODE ......................... 41F. DEFINITIONS OF COMPUTER TERMS ............ 43G. COMPUTER PROGRAM ......................... 49H. DATA INPUT FORMAT ......................... 61I. SAMPLE COMPUTER RUN ....................... 63
5
LIST OF FIGURES
1. Comprehensive Plot of Logarithm of Vapor PressureVersus - /(t+C) ....... ........ ............... 24
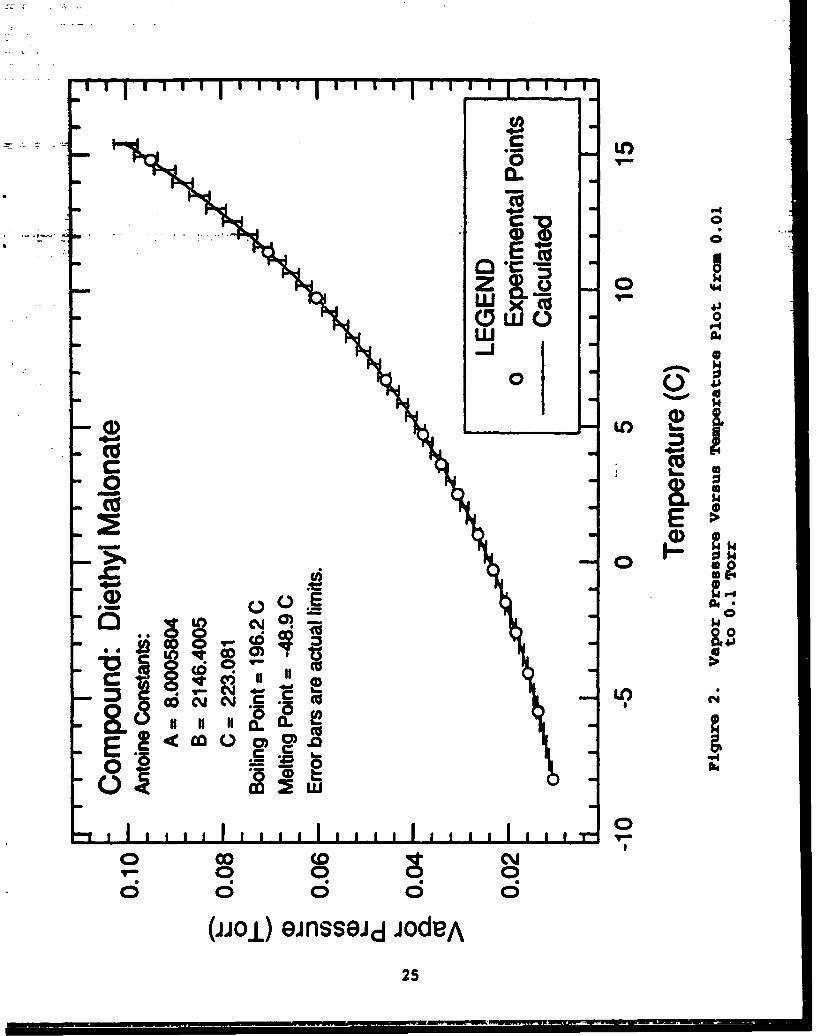
2. Vapor Pressure Versus Temperature Plot from 0.01to 0.1 Torr ................................... 25
3. Vapor Pressure Versus Temperature Plot from 0.1.. .to 1.0 Tort ................................... 26
4. Vapor Pressure Versus Temperature Plot from 1.0to 10. Torr ................................... 27
5. Vapor Pressure Versus Temperature Plot from 10.0to 100. Tort .................................. 28
6. Vapor Pressure Versus Temperature Plot from 100.to 1000. Torr ................................. 29
LIST OF TABLES
1. Accuracy of the Vapor Pressure Estimation Method ofof Banerjee, Howard, and Lande .................. 8
2. The Advantages and the Disadvantages of the AntoineEquation ........................................ 9
3. Deficiencies of Currently Available Software ..... 11
4. The Numbers Used to Represent Each ExperimentalMethod ......................................... 23
6
VAPOR PRESSURE DATA ANALYSIS METHODOLOGY, STATISTICS, ANDAPPLICATIONS
1. INTRODUCTION
Vapor pressure is one of the most important liquidproperties. Vapor pressures have a strong influence on thevolatility, roactivity, persistency, toxicity, flammability,solubility, and transfer processes of chemicals. It is a strongfunction of temperature - increasing from 20 to 1000 % every tendegrees Celsius. For that reason it is usually plotted againsttemperature on a logarithmic scale. The slope of a plot of vaporpressures versus temperatures is used to calculate the enthalpyof vaporization which is used to calculate other thermodynamicproperties. For such reasons a very precise knowledge of vaporpressures is required for both basic research and practicalapplications.
Many of the vapor pressure equations or values found inthe literature or commercial computerized data bases need to bere-evaluated. Errors run as high as several hundred percent andcareful statistical analysis is required.
Decontamination is a typical example of the applicationof vapor pressure data. In many hazardous chemical situations,there are probably few alternatives other than relying on naturaldecontamination. Calculations hazardous chemical persistencerequires the use of models largely dependent on vapor pressuredata. Since tests with hazardous chemicals may not be possible,reliable calculations are essential. Knowledge of thestatistical reliability of vapor pressure data permits engineersto include meaningful safety factors in their designs andanalyses.
Due to the high cost of experimental measurements, thepurpose of this report is to provide a computation method thatyields interpolated and extrapolated values of vapor pressure ofthe maximum accuracy. Also the objective is to provide 95 % orother confidence intervals and other types of statistics formeasured, interpolated and extrapolated values of vaporpressures, boiling points, concentration of saturated vapors, andenthalpies of vaporization. Commercial statistical softwarepackages will perform some oi the operations included in thiseffort, but such packages will not include all the detailedcalculations provided here. Furthermore, the detailed,referenced, and complete documentation included here is notprovided in most software packages. In addition, this reportincludes software and plotting compatible with currentlyavailable DOS based PCs. Diethyl malonate (DEM) vapor pressuredata is used to demonstrate the method.
7
2. BACKGROUND
2.1 Estimation Methods for the Vapor Pressures of ComplexOraanic Compounds.
Banerjee, Howard, and Lande, 1 describe astructure-vapor pressure relationship for complex organiccompounds that probably is one of the best methods available.Their relationship is based on the following type of parameters:Kamlet-Taft solvatochromic, structural, molecular volume, andUNIFAC. The type of errors in the Banerjee, Howard, and Landemethod are given in table 1.
Table 1. Accuracy of the Vapor Pressure Estimation Method ofBanerjee, Howard, and Lande.
% Difference BetweenCompound Experiment and Calculation
Outliers
octamethyltetrasiloxane 4,800,000%
ethylene glycol 15,500
hexamethyldisiloxane 11,000
acetic acid 2,137
propionic acid 1,950
diisopropyl ether 1,820
1,1,1-trichloroethane 1,740
hexane 1,300
formic acid 1,200
Typical Errors 500-1,100%
Table 1 illustrates the fact that to obtain datasufficiently accurate for most practical purposes, it isnecessary to make at least some measurements at a fewtemperatures.
8
2.2 The Antoine Eauation.
The Antoine equation2 is given in equation 1.
log1 oP - A - B/(t + C) (1)where
P - vapor pressure in Torr*t - temperature in CA, B, C - constants
For many reasons listed in table 2, the Antoineequation has been selected as the equation of choice for fittingmost vapor pressure data.
Table 2. The Advantages and the Disadvantages of the AntoineEquation
Disadvantaaes
I There is no rigorous theoretical basis for the Antoineequation. (There is no rigorous theoretical basis for anytolerably simple vapor pressure-temperature equation useful forfitting and extrapolating data.)
@ It is inadequate for high precision data over the temperaturerange from the triple point to reduced pressures of 0.75.
AdvayntaQes
@ It requires only three constants.
@ It is quite similar to the Clausius-Clapeyron equation whichhas an accepted theoretical basis.
m Temperature may be made the dependent variable by arudimentary inversion.
a Extrapolations and interpolations with the Antoine equationare strikingly more trustworthy than most other equations.
a It may be effortlessly transformed to a linear equation.
n Is the most widely employed equation for fitting vaporpressure measurements.
• Appendix A provides a glossary of terms used in this report.
9
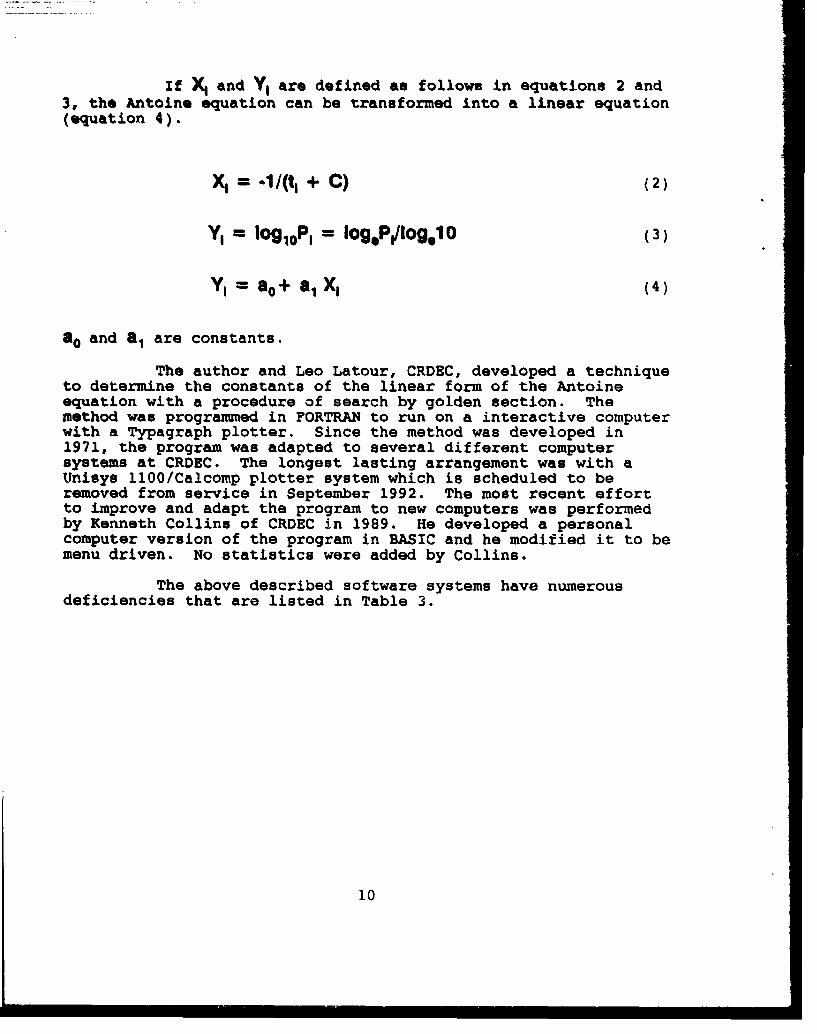
If )q and Y! are defined as follows in equations 2 and3, the Antoine equation can be transformed into a linear equation(equation 4).
= -1/(t, + C) (2)
Y,= ogo10P = log*PV1logolO (3)
Yi a0+ a, X, (4)
a0 and a, are constants.
The author and Leo Latour, CRDEC, developed a techniqueto determine the constants of the linear form of the Antoineequation with a procedure of search by golden section. Themethod was programmed in FORTRAN to run on a interactive computerwith a Typagraph plotter. Since the method was developed in1971, the program was adapted to several different computersystems at CRDEC. The longest lasting arrangement was with aUnisys 1100/Calcomp plotter system which is scheduled to beremoved from service in September 1992. The most recent effortto improve and adapt the program to new computers was performedby Kenneth Collins of CRDEC in 1989. He developed a personalcomputer version of the program in BASIC and he modified it to bemenu driven. No statistics were added by Collins.
The above described software systems have numerousdeficiencies that are listed in Table 3.
10
Table 3. Deficiencies of Currently Available Software
s The number of digits of accuracy required to performthe computation is not calculated. The number of digits requiredappears to vary from data set to data set. As a result, computerround off error may have a significant effect on the results insome cases.
a In the least squares minimization procedure, more than oneminimum may exist that goes undetected.
a Very little statistics is provided. No calculations of 95 %or other confidence limits of boiling points, vapor pressures,volatilities, or enthalpies of vaporization are given. Some ofthese limits change drastically with temperature and areessential in utilizing the data for practical applications.
@ Methodology and references are not kept with each data point.Keeping methodology and references with each data point aids inthe analysis of the data.
@ No standard deviations of the Antoine constants are provided.
a No correlation coefficient is provided.
a Data editing is difficult.
a Plotting does not include 95 % or other confidence limitenvelops.
a The computer that it is written for, the UNISYS 1100, is beingremoved from service.
11
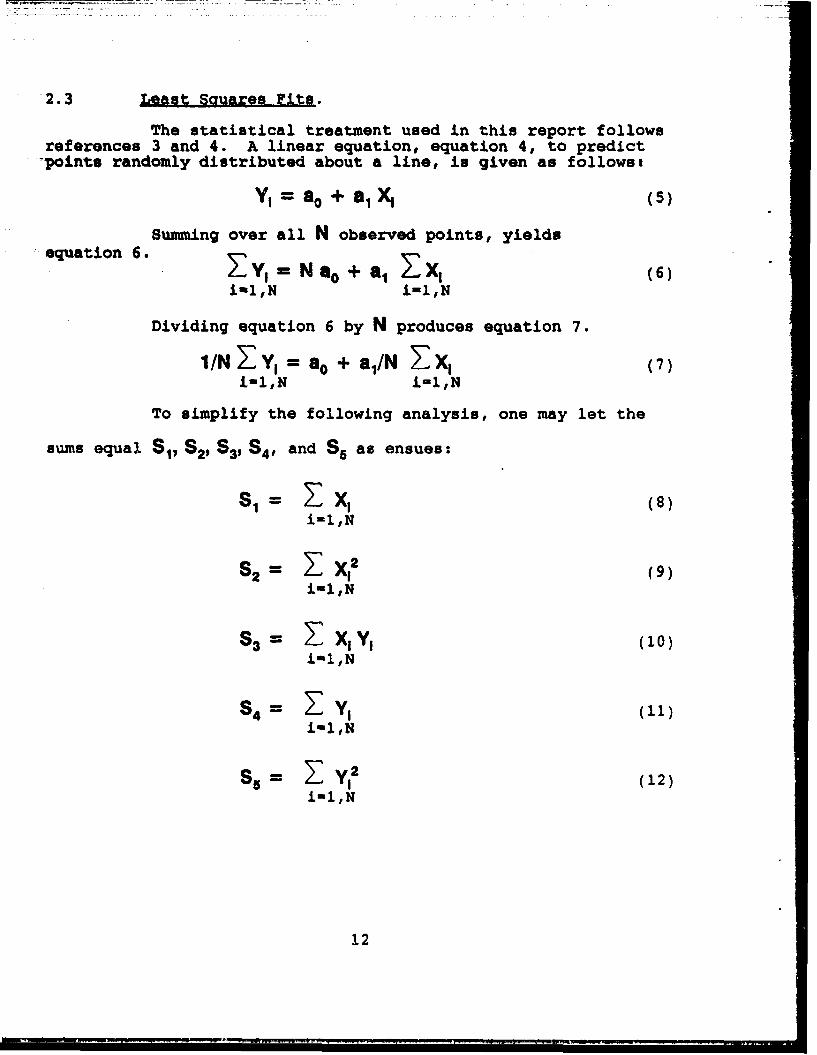
2.3 Least Sauares Fits.
The statistical treatment used in this report followsreferences 3 and 4. A linear equation, equation 4, to predict
-points randomly distributed about a line, is given as follows:
Y 1 = a0 + a4 X, (5)
Summing over all N observed points, yieldsequation 6.
Z Y, = Nao+ a, EX, (6)il, N i=l,N
Dividing equation 6 by N produces equation 7.
1/N Z: Y1 = ao + a1 /N Z X, (7)i-l,N i=l,N
To simplify the following analysis, one may let the
sums equal S1, S29 S3, S 4 , and S. as ensues:
S1 = ZX1 (8)iinl,N
S2 = Z- Xl2 (9)iIl,N
S3 = XjYj (10)iml,N
S4 = 7 Y1 (11)iu.1,N
S 5 = Zv 1Y (12)i-l,N
12
The means of XI and Yl values are found as follows inequationu 13 and 14.
Mean of q = ,= 1I/N Z X• = SI/N (13)i-1,N
Mean of Y, = = 1/N 2 Y, = S./N (14)Si-il,N
Substituting the mean values from equations 13 and 14into equation 7 leads to equations 15 and 16.
V = so + a, R 1 (15)
S 4 = Nao + a1 S 1 (16)
The sum, S, of the squared deviations of thecalculated Y, values subtracted from measured values squared isgiven by equation 17.
S Z:y(Y1 -o-a X,) (17)i-1,N
Squaring the term in parenthesis in equation 17,substituting values from equations 8 to 12, and combining termsyields equations 18 and 19.
S = So + Nao2 -2aOS 4 -2aS 3 +2aoalS 1 +a 12 s 2 (18)
a1 = (N S 3 -S 1 S4/(N S2- S12 ) (19)
Equation 16 rearranges to equation 20.
a 0 = (S 4 -a 1 Sl)/N (20)
Equations 18, 19, and 20 permit the easy calculation ofS, a1 , and So, respectively.
13
The computer program as developed by the author andLatour varied C and recalculated S until a minimum S was located.Since S represents the difference between calculated and measuredvalues, the C that gave the minimum S was the chosen C. Once Cwas chosen, a, and a0 were calculated with equations 19 and 20
respectively. The differences in logarithms of vapor pressuresas opposed to vapor pressures were minimized to get the fit.Otherwise, the lower values of vapor pressure are ignored by thefitting procedures.
2.4 Statistics of Data Fitted to a Linear Eguation.
Natrella3 defines a number of statistical quantitiesas follows:
Varianco - Va = S/(N-2) (21)
Standard deviation of Y over all X's = YI= v.1/2 (22)
D is defined by equation 23.
D = N S2 - S 12 (23)
Standard deviation of slope = (V, N/D)1 /2 (24)
Standard deviationof intercept = [Ve (1.0 + S,2/D)/N 11/2 (25)
Correlation coefficient is the square root of thefraction of the squared variation that is explained by the fit tothe data.
Correlation coefficient = (I-S/S9 )1/2 (26)
where S9 Z4y, )2 (27)i-1,N
14
The variation of the standard deviation of Y, with XIand the F-distribution are discussed in reference 4 and AppendixB, respectively. The F-distribution is used to calculate thelimits of error at the 95 % or some other confidence level.
2.5 EnthalDv of Vaporization.The relation of the enthalpy of vaporization (or
-evaporation) to other variables is usually expressed as the
Clapeyron-Clausius equation5 (equation 28).
dP AHHV- = -(28)
dT TAVtwhere
T - temperature in Kelvin
A Hv - enthalpy of vaporization
AV1 - increase in liquid volume on evaporationat temperature t
If the Antoine equation, equation 1, is differentiatedwith respect to T and substituted into equation 28, the followingequation results3
dP PB logs10 A Hv-- a - - (29)dT (C + t) 2 TA Vt
where
A Vt = V(vapor) - V(llquld)
In order to compare the two terms, V(vapor) and
V(liquid), the "ideal gas law" is introduced. 5 The "ideal gaslaw" that follows is applicable to vapors at low pressures.
PV = nRT
whereR - ideal gas law constantn a number of moles of vaporV - volume of vapor
15
In order to establish the relative importance of thetwo terms, V(vapor) and V(liquid), they are calculated below forDEN at 25 OC.
V(vapor) - RT/PV(vapor) - 82.05x10⁴ atm m3/mol x 298.15 K x 760 Torr/0.2231 Torr
Since the V(liquid) is over 5 orders of magnitudesmaller than V(vapor), V(liquid) can be safely ignored incomputing AHv. On substituting V(vapor) for (IVt in equation 29and rearranging terms, equation 30 follows:
logs10 RBT2AHv = (30)(C+t)2
Equation 30 makes it possible to calculate enthalpies ofvaporization from the temperature and the Antoine constants.
2.6 Concentration of Saturated Vapor.
Since the early 20-th century, the term "volatility"has been defined as follows by the military of the world (SeeAppendix C).
Volatility - PM/RT (31)
Volatility as thus defined is the concentration ofsaturated vapor as calculated from the following variables:
P - saturation vapor pressureT - absolute temperature in KelvinM - compound molecular weight
It is based on the ideal gas law that is fairlyaccurate at vapor pressures below one atmosphere in pressure.The units of grams or milligrams per cubic meter have been nearlyalways used. Since many definitions of volatility appear in theliterature, the data should be used with caution. Otherdefinitions of volatility that have been used are given inAppendix C.
16
3. ANALYSIS
3.1 Errors of Vapor Pressure Calculations.
Since the error is extracted from a fit to varioustypes of data, it is assumed in this analysis that all the erroris in the vapor pressure values. The experimental temperaturecontrol errors are usually so small relative to other errors thatthey are not reported. The equation for the propagation oferrors in terms of variance of vapor pressures,, <4pl, is equation32.
4: = IdP1 /dY1 12 <p'2 (32)
ýpl2 is a function of X1, and 4yl2 is a standard deviation of Yj
that is a function of X1. YI was defined in equation 3.
Y, = IOgloP1 (3)
Equation 33 is equation 3 rearranged.
P i = lOIl (33)
Taking the derivative of equation 33 with respect toYI yields equation 34.
dP/dYj = le Iog,10 = P, 10g910 (34)
When equation 34 is substituted into equation 32,equation 35 results.
=pl2 = (Pi Iog,1l0)2 4ýyi2 (35)
17
t 4 Equation 36 is used to vary the standard deviation
(X - S1IN)2
41 2 I = C ly 1iN + - (36)(S2 -S12 N)
is calculated from equation 22. The error in vapor pressureis given by equation 37.
Error in vapor pressure : k (3F)•"2 Pp (37)at a given temperature
The value, F, is the percentile value of the ?-distribution forthe selected confidence level. Appendix B explains how F iscalculated at any confidence level.
3.2 Errors of Boilina Point Calculations.
Equation 1, the Antoine equation,
Iog 1oP 1 = A- B/(t + C) (1)
may be rearranged to provide the boiling point, tb, as inequation 38.
tb = B/(A - IlogP - C (38)
18
The variance of the boiling point, (Yt is calculated
with equation 39. -b
CYtb 2 1Iat./5pjI4 12 1 (39)
Taking the derivative of equation 38 with respect toP1 yields equation 40.
6tM/5P, = B(A-IOg 10P)2" (PI IOg*lO)"1 (40)
On substituting equation 40 into equation 39 andtaking the square root yields a standard deviation for theboiling point, atb.
a b = B(A-Iog,0P1) (PI log,10)"1 <P (41)
On substituting equation 35 into equation 41, equation42 results when P in set at 760 Torr, the vapor pressure at theboiling point under standard conditions.
-= B (A - Iog, 0760)"Z cYy(760 ) (42)
(aY(70.) is the standard deviation of Y at 760 Torr.
The error in the boiling point is given by equation 43.
Error in boiling point = * (3)/2 (43)
7 is the percentile values of the F-distribution for thethe selected confidence level. Appendix B explains how F iscalculated at any confidence level.
19
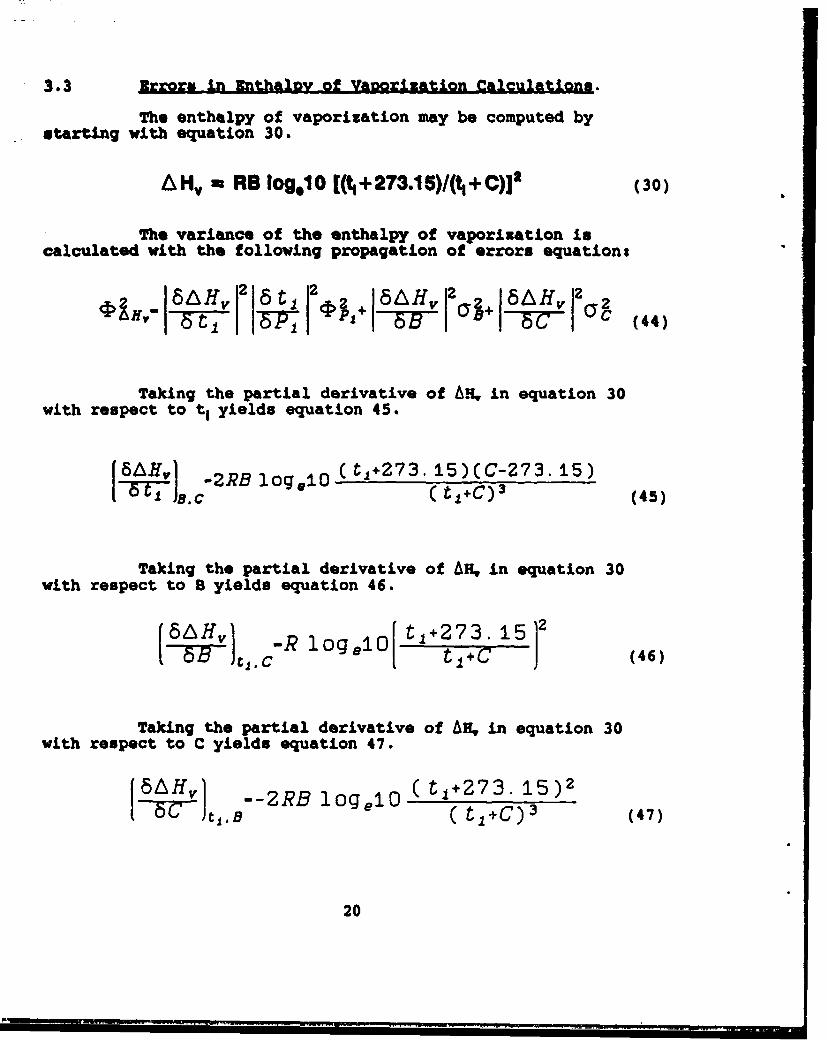
3.3 Errors i& Enth~alov of VA22rization Cal~culations.
The enthalpy of vaporization may be computed by
starting with equation 30.
A HV ~RS Iog.1 0 [(% + 273.1 5)/(%, + C)12 (30)
The variance of the enthalpy of vaporization incalculated with the following propagation of errors equations
2 tH 121 ) 1()
Taking the partial derivative of AH, in equation 30with respect to t1 yields equation 45.
[8AtHv __________t1273_15_C-73.15
6t BC-( tl+C)3 (45)
Taking the partial derivative of AR, in equation 30with respect to B yields equation 46.
(k 8 fHV R ioge.o[ t1+273. 15)2 (6
Taking the partial derivative of An, in equation 30with respect to C yields equation 47.
5A~v2RB 1og.1O ( ti+273. 15)2
20
Taking the partial derivative of t, in equation 30 withrespect to Pl yields equation 48:
6t, J -B(A-1og1 oP1 )-2 (P1 loge4O)' (48)
Substituting equations 45-48 into equation 44 yieldsequation 49.
4i - R 2T(C-273. i5) +2( t+C) 3 (A-log'oP 1 ) 2P1
jRlogelO ( 2-C) I~ +T2 2z 2 +49
j2RB log.1O T2 j2 2
The error in the enthalpy of vaporization at a giventemperature is furnished by equation 50.
Error in the enthalpy ofvaporization at a given - (31 v (50)temperature
21
3.4 General Computation Methodoloav.
The computation is performed differently from previousmethods. First a series of values of C are used to calculate aseries of S values. Then the S values are searched for minimumsand maximums to see if there is more than one minimum. Then theC values are fine tuned to give the C that yields the minimum S.The C that yields the minimum S is then usod to calculate theother Antoine constants and the statistics. No effort is made touse an optimized search strategy to conserve computer time sincethe running time is less than 2 minutes on a Swan Technologies386/33.
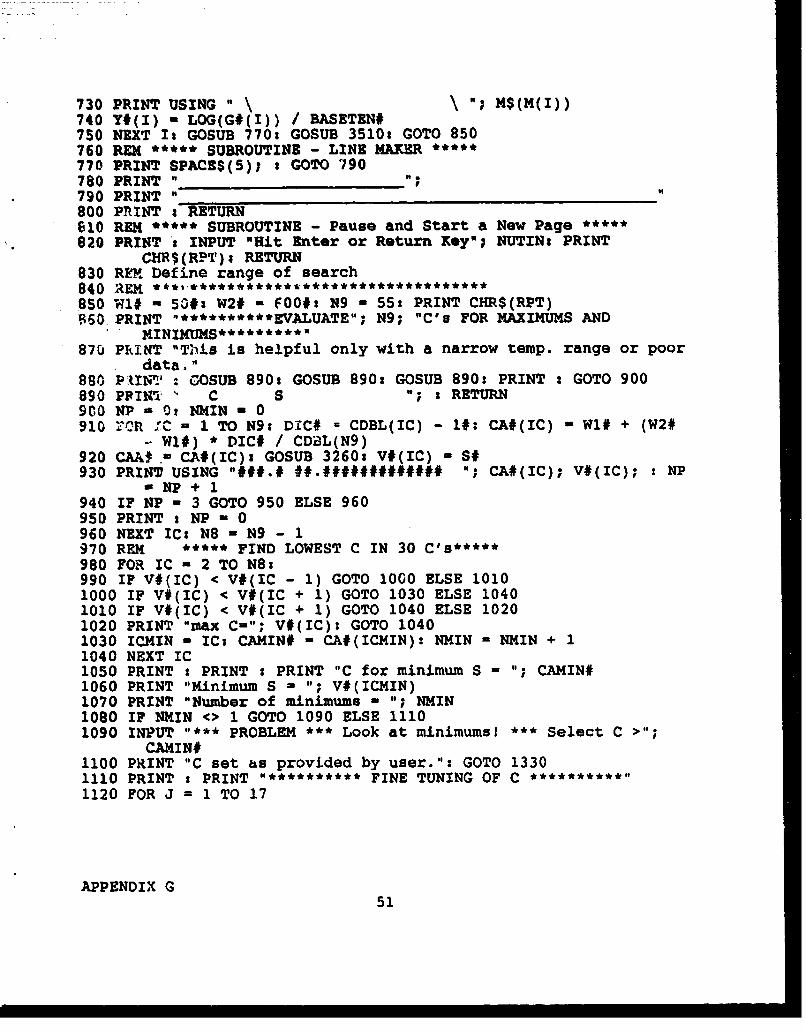
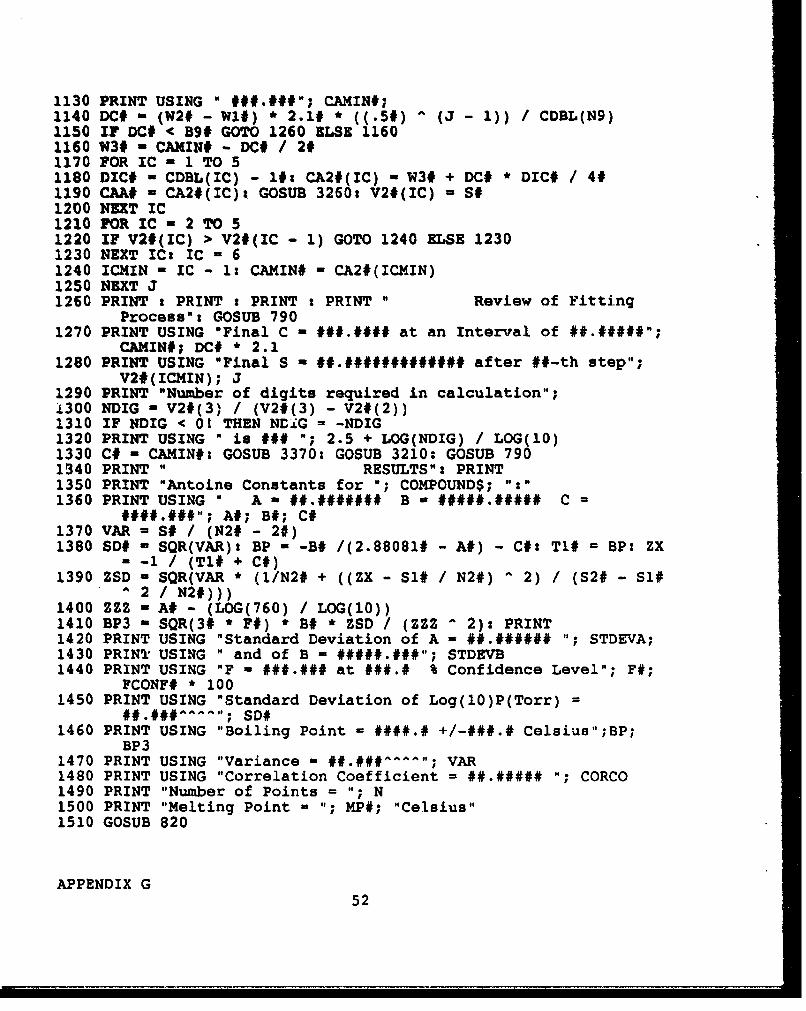
3.5 The Computer Program.
The program used is named "ANT592.BAS" and is writtenin MS-DOS GW-BASIC for IBM compatible personal computers. Themethods of indexing organic compounds and abbreviating referencesused in the program are given in Appendices D and E respectively.Concentrations of saturated vapor or volatilities (Appendix C)are calculated as a function of temperature. Definitions of theterms used in the program are given in appendix F. The programis listed in Appendix G. When vapor pressure points are entered,an experimental method by which they were obtained and areference is entered at the same time. The numbers used torepresent each method are given in table 4. The data is enteredinto a BASIC file to preserve the editing capabilities of eitherGW-BASIC, QBASIC, or any editor that can create a DOS file. Thedata input format is given in Appendix H.
"ANT592.BAS" produces a "command file" ("ANTPLT.PLT")which includes the data for plotting plus detailed plottingdirections. "ANT592.BAS" gives the user a number of options increating the "command file." After "ANT592.BAS" is run, the usermust terminate GW-BASIC with a "SYSTEM" command and switch to"ProPLOT" software. In "ProPLOT" the user may view the plots onthe screen before plotting, edit the plots, and send them to alaser printer. "ProPLOT" is a 2-D scientific plotting softwarepackage sold by Cogent Software that creates PostScript printeroutput.
22
Table 4. The Numbers Used to Represent Each Experimental Method.
Method
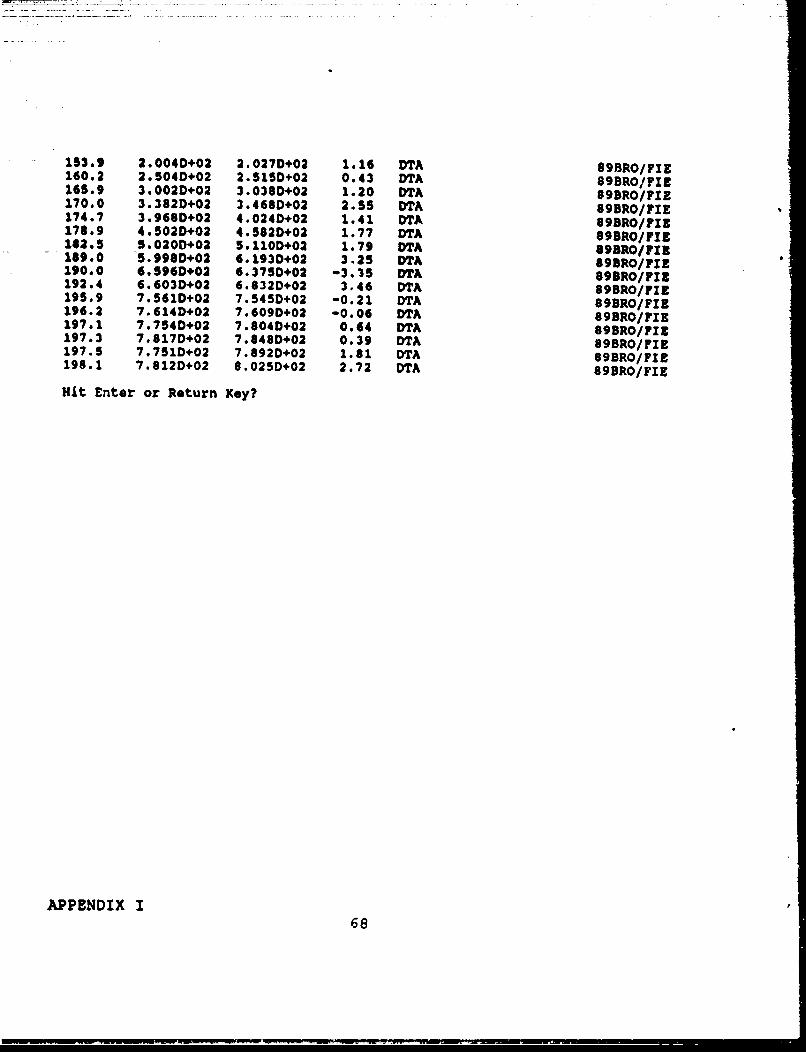
1 Isoteniscope2 Boiling Point3 Effusion4 Dynamic Gas Saturation5 Manometer6 Tensimeter7 Gas Chromatography8 DTA9 Ebulliometry
10 Calculated11 Method Not Given12 Droplet Evaporation
4. RESULTS
A sample calculation for DEM is provided in Appendix I.
Brozena and Fielder's 8 data for DEM was chosen to demonstrate themethodology. As is apparent from Appendix I, the fit is good andthere are more statistically significant digits, three, availablethan is normally expected from vapor pressure data. At leastthree digits for the enthalpy of vaporization are significant andfour should be reported. The error estimation techniques usedare worst case methods; they are so inclusive that errors areprobably over-estimated.
Figure 1 shows that a plot of logarithm of vaporpressure versus -1/(t+C) which gives a very linear plot of thedata. The data fits the Antoine equation fit so well that theerror bars are expanded 20 times the actual error limits topermit their being easily observable. Clearly the DEM datt isexcellent. Figures 2-6 provide simple vapor pressure verLustemperature plots with error bars.
The program "ANT592.BAS" takes about 20 minutes runningtime more or less on a number of early model IBM compatible PCs,but on a Swan 386/33 it runs in minute or so. The program hasestimated that ten decimal digits accuracy is required for theDEM data set.
23
0~
-CVJ
-N x
.j Lo
'44'0-0
CD 00
(!w
Ln ~140'- 'a! --
0.O
W9 U9 - i.
V- --
(ujojL) einssG~d joduA24
Ul
0
00
cow '-m0w
CdC Yc ( C4
o c0
0*0
c0 0 m
(jjo_) ejns9Jd odLR
~ 8 0cJ~.~ 25
CC
a-
w
AA
vi Noo (M c. cI
-9
oc
6 C3 C; ci
(jjoj) eJflSS8Jd JodBA26
C)
w.
0 0
C) =)
0 a
'0 cIIcu
(ijoj.) ejnssGJd bodBA27
00
00
fag
00
8 0o
VIIIIIIII
(jjoj) eJflssGJd jod8A28
09000 .01
Ecu
za.cw P-LJ
do af
CC0
2 29
5. DISCUSSIONS
In MS-DOS GW-BASIC for IBM compatible personal
computers, single precision goes from 1038 to i0+38 with 6decimal digits and double precision covers the same range with 16decimal digits. The program calculates the number of digitsrequired to avoid significant round off errors. Since twelvedigits were required for the DEM data given in this report and asmany as 14 digits with other sets of data were required, doubleprecision is definitely necessary for an Antoine fit.
Statistical error analysis is often a much larger taskthan making measurements and analyzing the data withoutstatistics.
In addition to being used to fit vapor pressure data,the Antoine may be used to fit densities, fugacities of liquids,viscosities, relative vapor pressures, and other types of data.The only time that the program was found to give more than oneminimum was when it was run in the single precision mode.
The analysig performed in this report shows thatBrozena and Fielder's- data for DEM is one of the best series ofvapor pressure data found anywhere in the scientific literature.
6. CONCLUSIONS
I The program "ANT592.BAS" performs all the calculationsof previous programs satisfactorily, plus it provides detailedstatistical analysis and error envelopes for any confidence levelfor vapor pressures, enthalpies of vaporization, concentrationsof saturated vapor, and boiling points.
I More statistically significant decimal digits areavailable for vapor pressure data, three, than has beenpreviously believed. In the future four digits should bepublished.
I Five decimal digits for the enthalpy of vaporizationvalues are significant and should be reported.
a Double precision computations (10-16 decimal digits)are required for maintaining the full significance of carefullymeasured vapor pressure data.
§ The ANT592.BAS"/"ProPLOT" system produces greatlyimproved plots with error limits.
30
LITERATURE CITED
1. Banerjee, S., Howard, P.H., and Lando, S.S., "GeneralStructure-Vapor Pressure Relationships for Organics,"Chnmophere, Vol. 21, Nos. 10-11, 1173 (1990).
2. Thomson, G.W., "The Antoine Equation for VaporPressure Data," Chemical Reviews, Vol. 38, 1 (1946).
3. Ostle, B., and Mensing, R.W., Statistics in Research,* Third Edition, The Iowa State University Press, Ames, Iowa, 1975.
4. Natrella, M.G., Experimental Statistics, NationalBureau of Standards (NBS) Handbook 91, NBS, U.S. Department ofCommerce, Gaithersburg, MD, October 1966.
6. Brozena, A. and Fielder, D., Vapor Pressure of Diethvlk an , CRDEC-TR-120, November 1989, UNCLASSIFIED Report
31
BLANK
32
APPENDIX A
GLOSSARY OF TERMS
A - constant for the Antoine equation, equation I
a0 - intercept in equation 4
a0 a slope in equation 4
- constant for the Antoine equation, equation 1
C - constant for the Antoine equation, equation 1
D - value defined by equation 23
F - percentile value of the F-distribution forthe selected confidence level
ARV - enthalpy of vaporization
x - molecular weight of vapor
N - number of observed points
n - number of moles of vapor
p - vapor pressure in Torr
R - ideal gas law constant
- sum of the deviations of the Y valuessquared, defined by equation 17
S1 = sum of X, s, defined by equation 8
S- sum of X12 s, defined by equation 9
S3 - sum of X1Y1 s, defined by equation 10
84 - sum of Yi s, defined by equation 11
Be - sum of YI2 s, defined by equation 12
so - value defined by equation 27
33
t - temperature, ST - temperature in Kelvin
tb -boilinlg point, OC
V - volume of vapor
VO - varl3-!ce of Y
=Change in volume of a given amount of fluid onevaporation at a given temperature andpressure
X,- -l/(t I + C)
X1- mean of X, a
Y,- logl0Pi
'I mean of Ya
as - standard deviation of B
LIC - standard deviation of C
7HV = standard deviation of enthalpy of vaporization
Gtb - standard deviation of boiling point
Y, ~ - standard deviation of Ya
- standard deviation of enthalpy offAHV vaporization that is a function of t
+P1 - standard deviation of vapor pressures that,pI is a function of t
+ - standard deviation of TI that in aY,y function of the size of X1or ti.
APPENDIX A
34
APPENDIX B
CALCULATION OF F FROM F-DISTRIBUTION
Equation I provides the equation that is integrated tothe required level of confidence to obtain the standardstatistical value, ..
r U2V *VS\FZ V+UF dF (1f (F)- U 4 1
whoresf(F) - F-distributionr- gamma functionsu - degrees of freedom in the numerator of Fv - degrees of freedom in the denominator of F
The gamma 2function, r, was calculated with thefollowing equations
loger(x) X-7-1. + 7 (2)
360x 3 1260xs 1680x(
where x is the argument of the gamma function.
For the calculations for errors in this report v istaken as the number of points minus three and u is taken asthree.
1. Beyer W.H., Handbook of Tables for Probability and1iatisti, The Chemical Rubber Company, Cleveland, Ohio, p304,1968.2. Abramowitz, M. and Stegun, I.A., Handbook of MathematicalI3-_unionoIn, Applied Mathematics Series 55, National Bureau ofStandards, Washington, D.C., p257, 1970.
35
Blank
36
APPENDIX C
DEFINITION OF VOLATILITY OR CONCENTRATION OF SATURATED VAPOR
Parker1 claims volatility is a thermodynamic quantitywith the following qualitative definition: "The quality of havinga low boiling point or subliming temperature at ordinary pressureor equivalently, of having a high vapor pressure at ordinary* emeatures.'
According to Bridgeman 2 of the National Bureau ofStandards the "volatility of gasoline is the temperature atwhich a given air-vapor mixture is formed under equilibriumconditions at a pressure of one atmosphere, when a givenpercentage is evaporated."
The Kirk-Othmer Encyclopedia of Chemical Technology3
deals with volatility as follows. "The volatility of kerosinefuel is measured not by its vapor pressure but by its temperatureat the point where its vapors prove to be flammable, ie, theflash point or lean flammability temperature.'
Some reports seem to use the Reid vapor pressure as4 ameasure of volatility. It is defined by the U.S. Coast Guard asthe equilibrium vapor pressure exerted by vapor over the liquidat 100 O., expressed as pounds per square inch absolute, asdefined by the 46 Code of Federal Regulations 30.10-59.
The United Nationse defined volatility as theconcentration of saturated vapor at 20 *C in units of mg/m 3.This the standard definition used by the military of mostnations, but the U.S. Coast Guard4 refers to this quantity as thesaturated vapor density.
Volatility has been historically defined as follows bythe U.S. Department of Defense:
Volatility - PM/RT
This is the concentration of vapor as calculated fromthe vapor pressure, P, and the absolute temperature, T. It isbased on the ideal gas law that is fairly accurate at vaporpressures below one atmosphere in pressure. The units of gramsor milligrams per cubic meter have always been used.
37
Since the term volatility has multitude of definitionsin the literature, it is recommended that "volatility" not beused by the U.S. Army in the future and the term "concentrationof saturated vapor" at a given temperature be used instead. Theunits should remain grams or milligrams per cubic meter.
LITERATURE CITED
1. Parker, S.P., McGraw-Hill Dictionary of Scientific and1echnical Terms, 4th Edition, McGraw-Hill Book Company, New York,1989.
2. Considine, D.M., and Considine, G.D., Encyclopedia ofC, 4th Edition, Van Nostrand Reinhold Company Inc., p701,1984.
3. Kirk, R.E., et al, Kirk-Othmer Encyclovedia of ChemicalTechnology, Vol. 3, John Wiley & Sons Inc., New York, p343, 1978.
4. CHRIS Hazardous Chemical Data, U.S. Department ofTransportation, U.S. Coast Guard, Commandant Instruction,M.16465.12A, November 1984.
5. Secretary-General, Chemical and Bacteriological (Bioloaical1eapons and the Effects of Their Possible Use, United Nations,
New York, p90, 1969.
APPENDIX C
38
APPENDIX D
EMPIRICAL FORMULA INDEXING OF ORGANIC COMPOUNDS
Generally the simplest way to index organic compoundsis a empirical formula index (better named an elemental formula).
:This index that is usually used to locate compounds is given as-follows
CnHmXoYpZq
where
C a Carbon
n a Number of carbon atoms in molecule
H - Hydrogen
m - Number of hydrogen atoms in mol.ecule
X,Y,Z - Elements other than carbon and hydrogen(Usually given in alphabetical order)
o,p,q - Number of elements other than carbon andhydrogen
The elemental formula are listed in alphabetical andnumerical order(lower numbers first). Lange's Handbook ofChemistry provides examples.*
* Dean, J.A., Lange's Handbook of Chemistry, 13th ed., McGraw-Hill Book Co., New York, page 7-54, 1985.
39
Blank
40
APPENDIX 9
CHEMICAL THERMODYNAMICS DATA CENTER (NIST) REFERENCE CODE
The following method of handling references* has been
found to be more useful than simply numbering references:
"Codes .XXAAA/BBB N
where
XX - Last two digits of year
AAA - First 3 letters of the last name of first author
BBB - First 3 letters of the last name of second author
N - Digit from 2 to 9 used to represent a second orthird paper of the first and second author in thesame year.
Thus 60A&A/LnQ 4 would be used to represent the 4-thpaper by Adams and Brown in 1960 referenced in the report. 80SXIwould represent the only paper by Smith in 1980 referenced in thereport.
* Domalski, B.S., Nvans, W.H., and Hearing, E.D., -HeatCapacities and Entropies of Organic Compounds in the CondensedPhase,- J. Phys. Chem. Ref. Data Vol. 13, Suppl. 1 (1984).
41
Blank
42
APPENDIX F
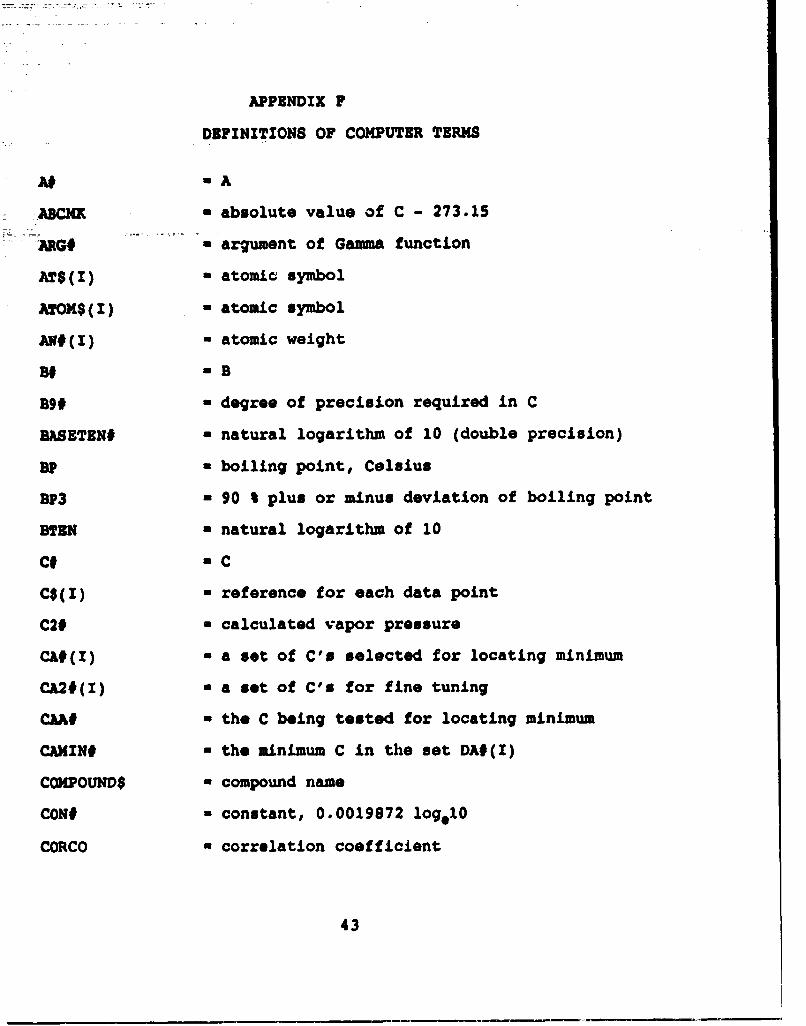
DEFINITIONS OF COMPUTER TERMS
ACMX a absolute value of C - 273.15
ARG# a argument of Gamma function
AT$(I) a atomic symbol
ATOM$(I) - atomic symbol
AN#(I) - atomic weight
B# =B
B29 # degree of precision required in C
BASETBN# * natural logarithm of 10 (double precision)
BP = boiling point, Celsius
BP3 = 90 % plus or minus deviation of boiling point
BTEN - natural logarithm of 10
C C
C$(I) - reference for each data point
C2# - calculated vapor pressure
Ch#(I) * a set of C's selected for locating minimum
CA2#(I) a a set of C's for fine tuning
CAW - the C being tested for locating minimum
CAMIN# - the minimum C in the set DA#(I)
COMPOUND$ - compound name
CON# - constant, 0.0019872 logs10
CORCO a correlation coefficient
43
D# - n S2 -s 12
D3 - 95 % or other confidence limit deviation invapor pressure
DC# - increment in C used fine tune C
-DIC# - double precision integer used in finetuning C
DIST - distance along Celsius axis for plotting
-LM ORXULA$ - elemental formula
FCONF# - % confidence level chosen/100
FF# -F
FILES$ - name of file containing experimental data
G#(I) - experimental vapor pressure at I-thtemperature, Torr
Hi- highest temperature chosen to calculateproperties, Celsius
HEAT - enthalpy of vaporization
ICMIN - an integer for minimum C in theCA#(I) set
INTERVALU - the number of degrees chosen betweencalculation of properties
KEL - 273.15
KELVINi - 273.15, double precision
LU - lowest temperature chosen to calculateproperties, Celsius
Li# - logarithm of Gamma function
L2# - term in Gamma function
LOGGAMMA - LI#
APPENDIX F
44
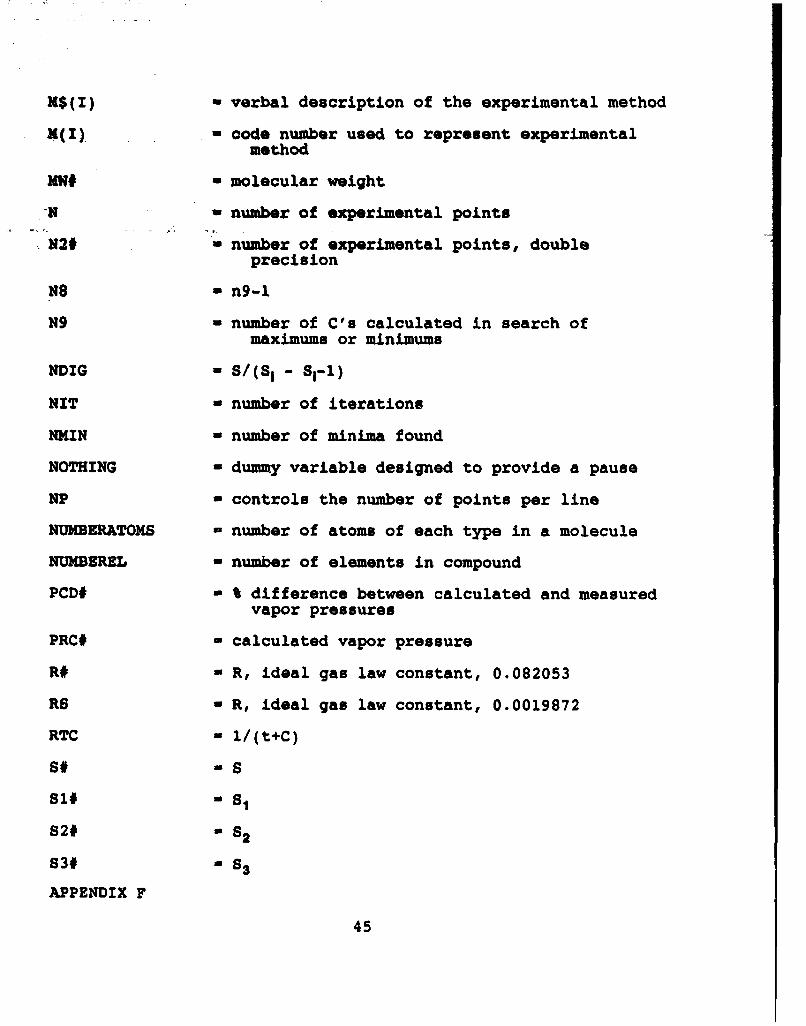
- verbal description of the experimental method
M(I) -code number used to represent experimentalmethod
MW, - molecular weight
N - number of experimental points
.-N2# - number of experimental points, doubleprecision
NS - n9-1
N9 - number of C's calculated in search ofmaximums or minimums
NDIG - S/(SI - SI-1)
NIT - number of iterations
NMIN - number of minima found
NOTHING - dummy variable designed to provide a pause
NP a controls the number of points per line
NUMBERATOMS - number of atoms of each type in a molecule
NUMBEREL - number of elements in compound
PCD# - % difference between calculated and measuredvapor pressures
PRC# - calculated vapor pressure
R# - R, ideal gas law constant, 0.082053
RS - R, ideal gas law constant, 0.0019872
RTC - 1/(t+C)
S# -6Sl# - S
S2# S S2
S3# S3
APPENDIX F
45
4O = S4
5#5 = S5
S9# w S 9
SD - standard deviation of YIs
SIGH a standard deviation of enthalpy of vaporization
SIGHB - contribution of B to the variance of theenthalpy of vaporization
SIGHC - contribution of C to the variance of theenthalpy of vaporization
SIGHP a contribution of P to the variance of theenthalpy of vaporization
ST a F
STDEVA - standard deviation of A
STDEVB - standard deviation of B
T#(I) - experimental temperature, Celsius
T1# - temperature for calculations, Celsius
TK# - temperature in Kelvin
TPC - temperature in Celsius plus Antoineconstant C
U2# - u/2
Us - Y or N (yes or no)
UV# - (u+v)/2
V#(I) - array of initial S values
V2#(I) - array of S values for fine tuning
V# "V
APPENDIX F
46
VAR - variance of Yis
.VOL - volatility
Wl# - minimum value of C considered
W2# - maximum value of C considered
W3# - lowest C in a CA2#(I) set
X# - XI
XMAX - maximum value of Xj used in plotting
XMIN - minimum value of Xi used in plotting
XX# - value used to calculate F
Y#(I) " 1
Y$- selector taking values of Y(yes) or N(no).
YY# YI"
Z#- value used to calculate F
ZSD m ay2
zX - -1/(t + C)
ZZZ - A - 1ogi 0 760
APPENDIX F
47
Blank
48
APPENDIX G
COMPUTER PROGRAM
10 REM Program Name: ANT592.bas Programmed by: El Penski20 REM Language: MS-DOS, BASIC Computers SWAN 386/3330 REM Directions: Store data in BASIC program starting with
line 4000. To enter BASIC, type BASICA/d40 REM See Appendix H for data input format.50 4EM Save with "A" option -- SAVE "XXXXX",A --60 REM To run LOAD "ANT592"; MERGE "XXXXX"; and
type RUN70 REM To run with printer type ([Ctrl] (Print
Scrn]) and RUN80 REM Command file for ProPLOT is stored in
"A:\Antplt.plt"90 REM After run, type "SYSTEM" to leave BASIC.100 REM At the A:> type "C:\Pro\ProPLOT" to plot.110 REM Enter command files, translate, view, and
TEST2# - 1#210 IF TEST# - 0# GOTO 220 ELSE 230220 PRINT "Double precision problem230 REM ***** Select Type of Output *****
240 PRINT "Run date is "; DATE$250 PRINT "Is 95% confidence level OK? (Y or N) "; : INPUT US260 IF US - "y" OR US - "Y" GOTO 290 ELSE 270270 PRINT "What confidence level do you want? Answer in %.";
INPUT FCONF#280 FCONF# - FCONF# / 100#: PRINT290 PRINT USING "The ###.# % confidence level was chosen.";
FCONF# * 100300 INPUT "Do you intend to plot? (Y or N) "; US310 IF US = "y" OR US - "Y" GOTO 320 ELSE 330320 OPEN "a:\antplt.plt" FOR OUTPUT AS #1330 DIM T#(100), G#(100), Y#(100), C$(100), M(100), CA#(200),
V#(200)340 DIM AT$(20), ATOM$(20), AW#(20), M$(20), V2#(6), CA2#(6)
49
350 REM*****SET UP MOLECULAR WEIGHT CALCULATION360 FOR I - 1 TO 10: READ AT$(I), AW#(I): NEXT I: MW# = 0370 DATA "C",12.011,"H"1.i0079, "Br" 79 904,"Cl",35 453,"F",
18.9984380 DATA "N",14.0067, "0",15.9994, "P" ,30.9738,,"S",32.06, Si",
Method"670 PRINT " Celsius Torr"680 GOSUB 770690 REM ***** Read and Print Input *****700 FOR I = 1 TO N: READ T#(I), G#(I), C$(I), M(I)710 PRINT USING ###.# ##.###^ "; T#(I); G#(I);720 PRINT USING " \ "; C$(I);
APPENDIX G50
730 PRINT USING " \ "; M$(M(I))740 Y#(I) - LOG(G#(I)) / BASETEN#750 NEXT Is GOSUB 770a GOSUB 3510: GOTO 850760 REM ***** SUBROUTINE - LINE MAKER *770 PRINT SPACE$(5)i : GOTO 790780 PRINT "_"_790 PRINT "800 PRINT a RETURN610 REM ***** SUBROUTINE - Pause and Start a New Page *820 PRINT a INPUT "Hit Enter or Return Key"; NUTINt PRINT
CHR$(RPT)i RETURN830 REM. Define range of search840 RE ************************************850 'WI# - 50#: W2# - OO#: N9 - 55: PRINT CHR$(RPT)B60 PRINT -**********EVALUATE"; N9; "C's FOR MAXIMUMS AND
?MINIMUMS*********"87C PRINT "This is helpful only with a narrow temp. range or poor
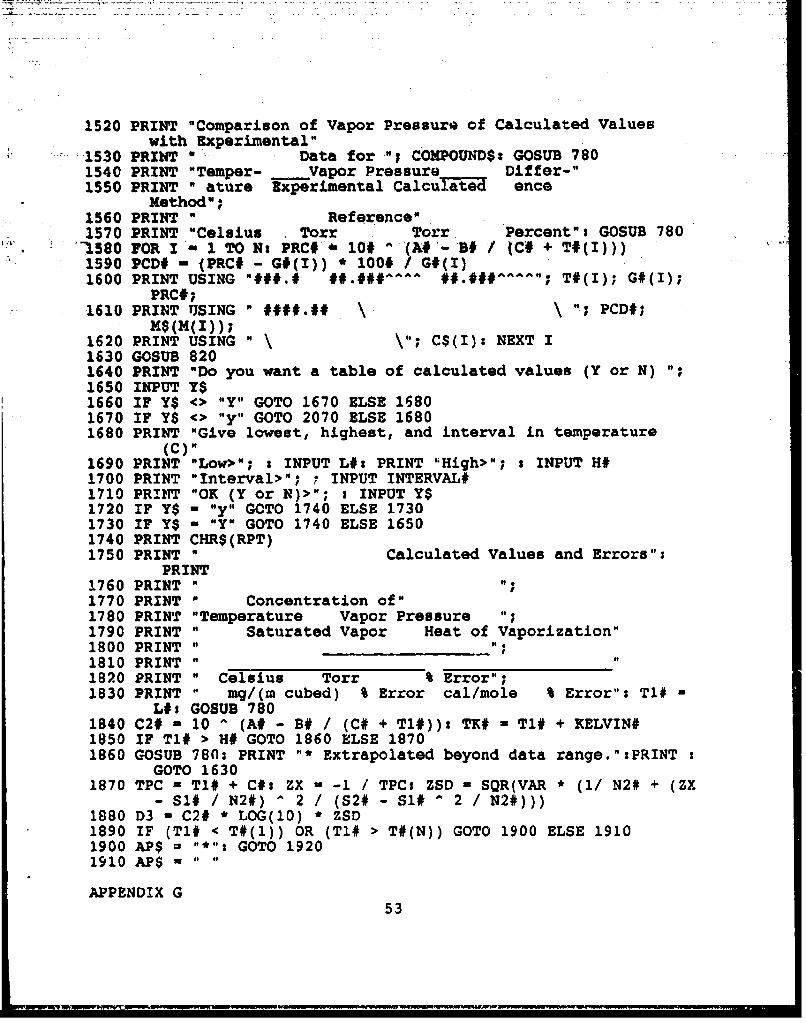
t V 1580 FOR I -I TO N: PRC# 10# (A# -. a# (C# + T#(I)))1590 PCD# - (PRC# - GO(I)) * 100# / G#(I)1600 PRINT USING "###.# ##.### .... ##.###. "; T#(I); G#(I);PRC#;1610 PRINT USING " ####.## \ \ "; PCD#;
M$(M(I));1620 PRINT USING " \"; C$(I): NEXT I1630 GOSUB 8201640 PRINT "Do you want a table of calculated values (Y or N) ";1650 INPUT Y$1660 IF Y$ <> "Y" GOTO 1670 ELSE 16801670 IF Y$ <> "y" GOTO 2070 ELSE 16801680 PRINT "Give lowest, highest, and interval in temperature
(C)"1690 PRINT "Low>"; : INPUT L#: PRINT 'High>"; s INPUT H#1700 PRINT "Interval>"; 7 INPUT INTERVAL*1710 PRINT "OK (Y or N)>"; s INPUT Y$1720 IF Y$ - "y" GOTO 1740 ELSE 17301730 IF Y$ - "Y" GOTO 1740 ELSE 16501740 PRINT CHR$(RPT)1750 PRINT " Calculated Values and Errors":
-1990 PRINT "The melting point is "I MP# p "deg. Celsius.";2000 PRINT " The above are for supercooled liquid."2010 PRINT USING "####.#\\ ##.##A^^A +/-#### ";T1*; AP$; C2#;
2060 PRINT "Sending directions for plotter to file:A:\ANTplt.plt"2070 PRINT "For a master plot (M), narrow plot (N), stop (S),
table(T) >";2080 INPUT Y$: IF Y$ = "S" OR Y$ - "sll GOTO 2090 ELSE 21002090 CLOSE #1: PRINT "File #1 closed. Normal halt": STOP2100 IF Y$ - "T" OR Y$ - "t" GOTO 1640 ELSE 21102110 IF Y$ - "M" OR Y$ - "in" GOTO 2140 ELSE 21202120 IF Y$ - ON" OR Y$ - "n" GOTO 2570 ELSE 20702130 REM ____ ____PLOT ALL DATA
2140 PRINT "MASTER PLOT: Temperature Range: ";T#(1);" to "; T#(N)2150 PRINT "Enter Temperature Limits in Celsius(lower,upper) >"1;2160 INPUT TB, TT: XMIN - -11 / (TB + C#): XMAX - -11 / (TT + C#)2170 INPUT "Enter number of times error bars should be
expanded :"; BAR2180 GOSUB 3000: GOSUB 3010: GOSUB 2910: GOSUB 30802190 PRINT #1, "SET SYMBOL 4NW2200 PRINT #1, "SET ORDER X Y DY"2210 FOR I - 2 TO 24: RTC -XMIN + (XMAX - XMIN) * I1 2512220 PCD# - 10#$ (A# + B# * RTC): SF# - SQR(3 *F#)
2230 ZX - RTC: ZSD -SQR(VAR k (1 / N2# + (ZX S 1# N2#) A2/
(S2# - S1# 2 / N2#)))2240 D3 - PCD# * LOG(l0) * ZSD *BA2250 PRINT #11 R-.'C, PCD#, D3 * SF#: NEXT I2260 GOSUB 31802270 PRINT #1, "SET SYMBOL 9P": PRINT #1,, "SET ORDER X Y"12280 FOR I - 1 TO N: RTC -- 1# / (T#(I) + C#), r",NT #1, RTC,
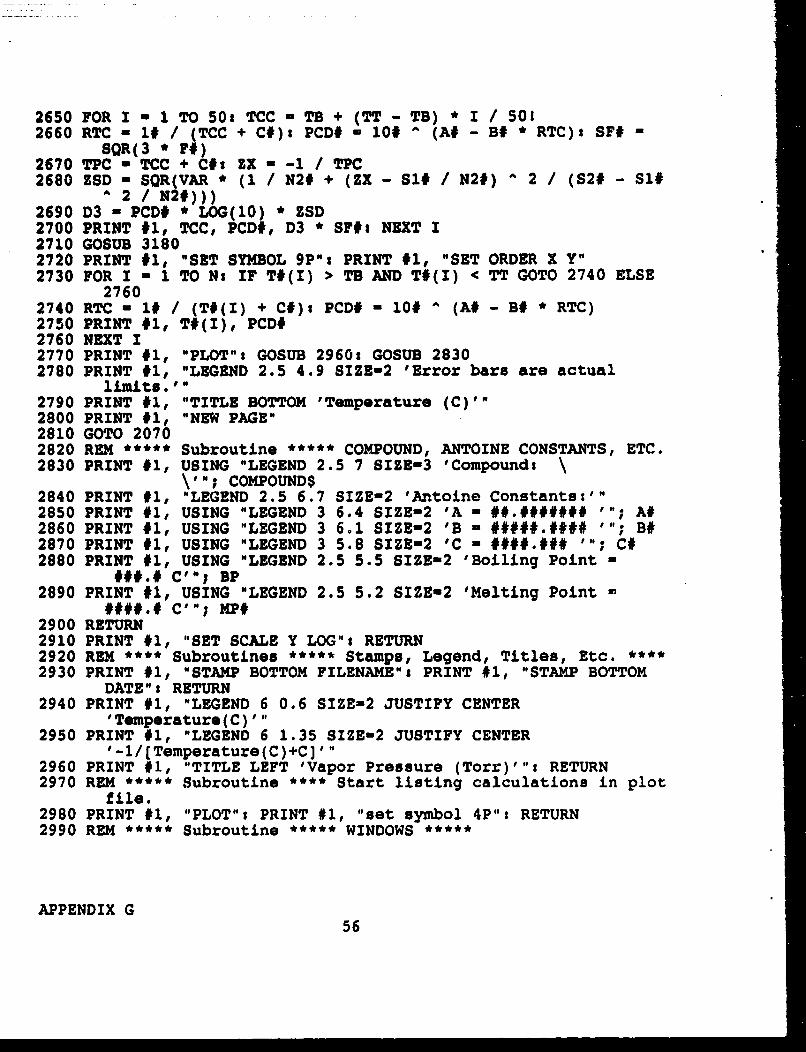
A 2 / N2#)))2690 D3 - PCD# * LOG(10) * ZSD2700 PRINT #1, TCC, PCD#, D3 * SF#: NEXT I2710 GOSUB 31802720 PRINT #I, "SET SYMBOL 9P": PRINT #1, "SET ORDER X Y"2730 FOR I - 1 TO Ns IF T#(I) > TB AND T#(I) < TT GOTO 2740 ELSE
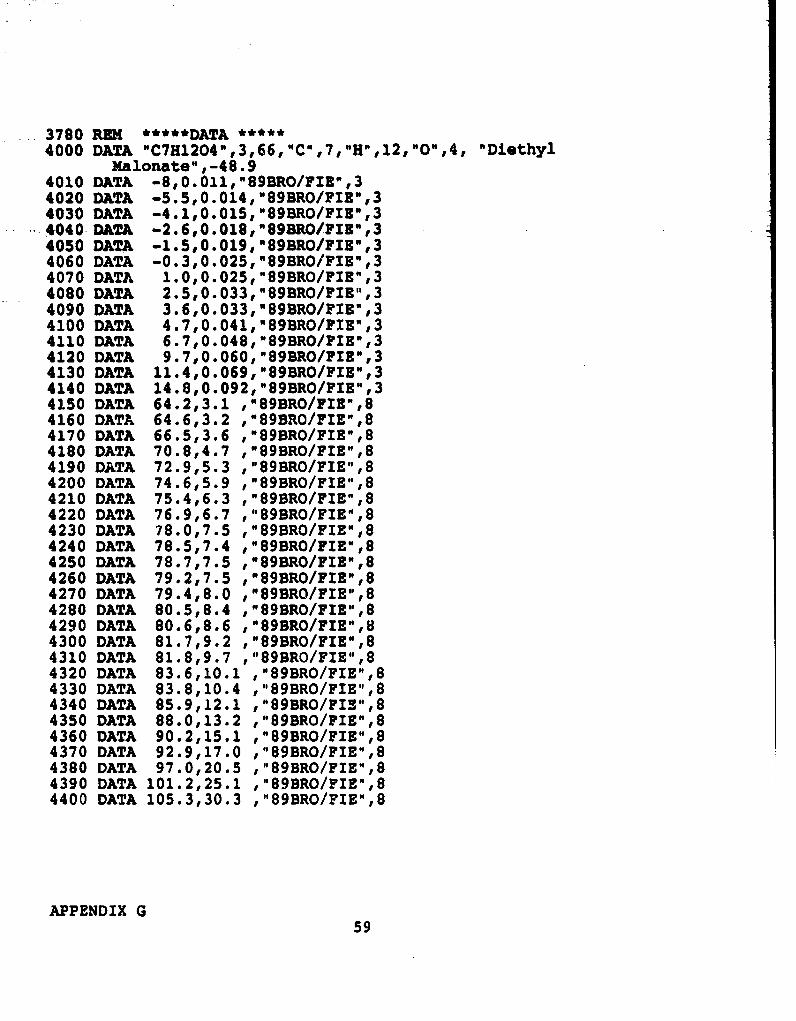
3780 REM *****DATA***4000 DATA -C7H1204",3,66,"C",7,"H",12,"O",4, -Diethyl
Maloriate", -48.94010 DATA -810.0111"89BR0/FIE",34020 DATA -5.5,0.014,"89BR0/PIE",34030 DATA -4.110.0151-89BRO/FIB-,34040 DATA -2.6;0.018,w899a0/FIRw,34050 DATA -1.5s0.019,"893R0/FIE",34060 DATA -0.310.025,-89BRO/FIE-,34070 DATA 1.0,0.0251"89BR0/FIB",34080 DATA 2.5,0.033,"89BR0/PIE-",34090 DATA 3.6,0.033,'S98RO/FIE,134100 DATA 4.7,0.041,"89BR0/FIE",34110 DATA 6.7,0.048,w89BR0/FIEN,34120 DATA 9.710.0601-89BR0/PIE",34130 DATA 11.410.069,-89BR0/PIE",34140 DATA 14.8,0.092,WS9BRO/PIEH,34150 DATA 64.2,3.1 i-89BR0/FIBNI84160 DATA 64.6,3.2 1-89BR0/PIE"184170 DATA 66.513.6 ,"89BR0/FIE'tB4180 DATA 70.8,4.7 i"89BR0/FIE",84190 DATA 72.9,5.3 ,'189BR0/FIE",,84200 DATA 74.615.9 ,"89BR0/FIE",,84210 DATA 75.4,6.3 t"89BR0/FIE",84220 DATA 76.9,6.7 1-89BR0/FIE-,84230 DATA 78.0,7.5 i"89BRO/FIE"',84240 DATA 78.5,7.4 ,"89BR0/FIE",84250 DATA 78.7,7.5 ,-893R0/FIE",84260 DATA 79.2,7.5 1"89BR0/FIE",84270 DATA 79.418.0 1-89BR0/FIE",84280 DATA 80.5,8.4 1"S9BRO/FIE",84290 DATA 80.6,8.6 1-89BRO/FIE"184300 DATA 81.7,9.2 1-89BR0/FIE",84310 DATA 81.8,9.7 1"89BRO/FIE",84320 DATA 83.6110.1 1"89BR0/FIE",84330 DATA 83.8,10.4 ,"89BR0/FIE",84340 DATA 85.9,12.1 1-89BR0/FIZ",84350 DATA 88.0113.2 ,"89BR0/PIE"184360 DATA 90.2,15.1 1"89BR0/FIE",84370 DATA 92.9117.0 1189BR0/PIE--184380 DATA 97.0120.5 ,'89BR0/FIE"184390 DATA 101.2,25.1 ,"89BR0/FIE-184400 DATA 105.3,30.3 ,"89BR0/FIE--,8
APPENDIX G59
4410 DATA 111.1,39.5 ,"89BR0/FIE',84420 DATA 116.6,49.8 ,"89BR0/FIE"184430 DATA 121.2,60.0 1-89BR0/PIE",84440 DATA 124.5,69.3 ,"89B2R0/FIE",84450 DATA 128.3,80.3 t"89BR0/FIE",84460 DATA 131.0189.8 j-89ER0/FIE",84470 DATA 133.2,97.8 t"89BR0/FIE",84480 DATA 138.5,117.4 ,w89BRO/FIZ-184490 DATA 143.0,139.0,-89BR0/PIE",84500 DATA 148.8,169.9,-89BR0/FIE",84510 DATA 153.91200.41-89BR0/FIE",84520 DATA 160.2,250.4 1-89BR0/FIE",84530 DATA 165.9,300.2 ,w89BR0/FIEU,84540 DATA 170.0,338.2,-89BR0/FIE"l84550 DATA 174.7,396.8 1-89BR0/FIE",84560 DATA 178.9,450.2,"89BR0/FIE-184570 DATA 182.51502.0,"89BR0/FIE,184580 DATA 189.0,599.8, "89ER0/FIE",84590-DATA 190.0,659.6,"89BR0/FIE-184600 DATA 192.4,660.3,"89BR0/FIE-184610 DATA 195.9,756.1l"898R0/FIE-,84620 DATA 196.21761.4,-89BR0/FIE",84630 DATA 197.11775.4,"89BR0/FIE-184640 DATA 197.3,781.7,"89BR0/FlE",r84650 DATA 197.5,775.11-89BR0/FIE",8B4660 DATA 198.1,781.21-89BRO/EIE-18
APPENDIX G60
APPENDIX H
DATA INPUT FORMAT
Line 4000 of Appendix G is the first line of a sampledata input. It is recommended that data points be entered inier from low to high temperature. Data points must be storeda basic file starting with line 4000. Save the file with the* option (SAVE *DATAFIL .BAS",A). To merge with the programkd the program (LOAD "ANT592.BAS;), and merge with the dataLe (MERGE "DATAPILE.BASO). If the data file is not saved withi "AW option, merging will not be possible. The data is:ered into a basic file to preserve the full screen editing?abilities of GW BASIC or QBASIC.
Data is entered in the following order separated by
imental formula in quotes,.ber of elements in compound,ober of data points,cst element symbol in quotes,aber of atoms of first element,:ond element symbol in quotes,ober of atoms of second element,
apound name in quotes,mezing point in Celsius,
Lrst data pointloperature(Celsius), Vapor Pressure (Torr), Reference Code*,aber for Experimental Method**,
See Appendix E.See Table 4 in section 3.5 of the report.
61
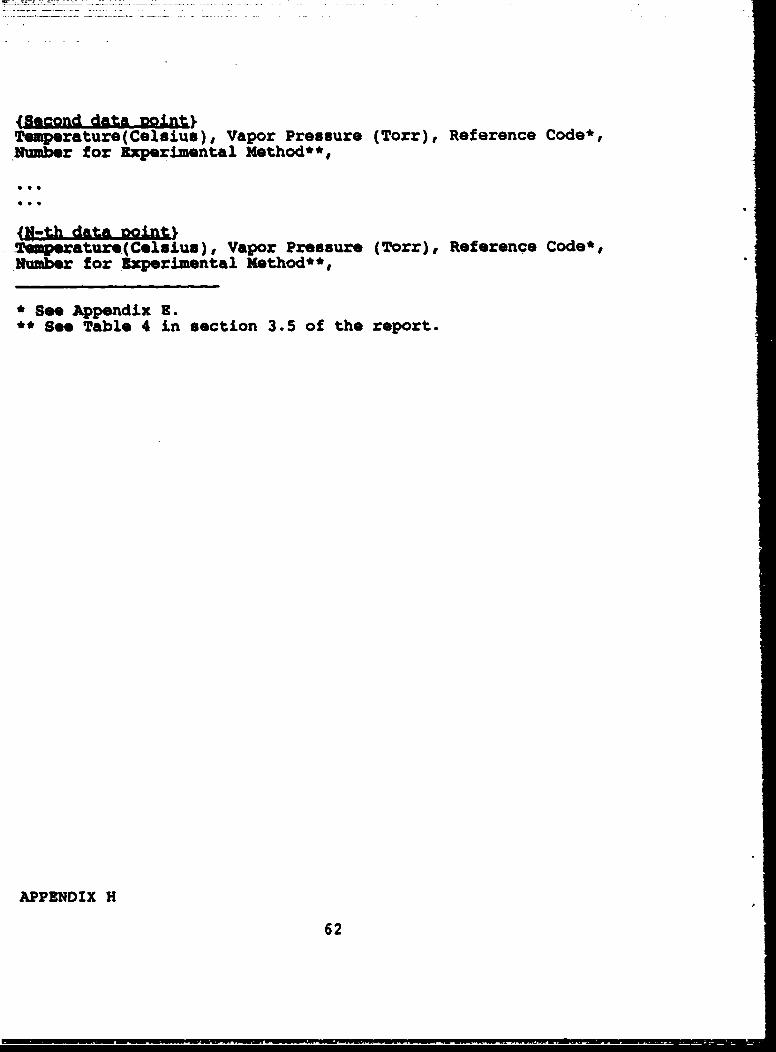
(Becond data Doint)Temperature(Celsius), Vapor Pressure (Torr), Reference Code*,Number for Experimental Method**,
{IN-Q data point)Temperaturm(Celsius), Vapor Pressure (Torr), Reference Code*,Number for Experimental Method**,
* See Appendix E.8* See Table 4 in section 3.5 of the report.
APPENDIX H
62
APPENDIX I
SAMPLE COMPUTER RUN
runADVANCED VAPOR PRESSURE DATA ANALYSIS AND PLOTTING
PROGRAMs ANT592. BASRun date is 06-06-1992Is 95% confidence level OK? (Y or N) ? yThe 95.0 % confidence level was chosen.Do you intend to plot? (Y or N) ? n
Final C - 223.0010 at an Interval of 0.00135Final 8 - 0.0211210814095 after 16 th stepNumber of digits required in calculation is 12
RESULTS
Antoine Constants for Diethyl Malonate:A a 8.0005804 B - 2146.40052 C - 223.081
Standard Deviation of A - 0.020955 and of B - 3.200F - 2.752 at 95.0 t Confidence LevelStandard Deviation of Log(l0)P(Torr) a 1.8170-02Boiling Point - 196.2 +/- 0.8 CelsiusVariance - 3.3006-04Correlation Coefficient - 0.99993Number of Points - 66Melting Point - -48.9 Celsius
Hit Enter or Return Key?
APPENDIX I66
Comparison of Vapor Pressure of Calculated Values vith ExperimentalData for Diethyl Malonate