Difference in anisotropic vortex pinning in pristine and proton-irradiated (Ca0.85La0.15)10(Pt3As8) (Fe2As2)5 single crystals W. J. Choi Daegu Gyeongbuk Institute of Science and Technology Y. I. Seo Daegu Gyeongbuk Institute of Science and Technology K. Park Daegu Gyeongbuk Institute of Science and Technology Yong Seung Kwon ( [email protected]) Daegu Gyeongbuk Institute of Science and Technology Research Article Keywords: vortex dynamics, proton irradiation, thermally activated ァux motion, vortex pinning anisotropy Posted Date: May 5th, 2021 DOI: https://doi.org/10.21203/rs.3.rs-476287/v1 License: This work is licensed under a Creative Commons Attribution 4.0 International License. Read Full License
Transcript
Difference in anisotropic vortex pinning in pristineand proton-irradiated (Ca0.85La0.15)10(Pt3As8)(Fe2As2)5 single crystalsW. J. Choi
Daegu Gyeongbuk Institute of Science and TechnologyY. I. Seo
Daegu Gyeongbuk Institute of Science and TechnologyK. Park
Daegu Gyeongbuk Institute of Science and TechnologyYong Seung Kwon ( [email protected] )
Daegu Gyeongbuk Institute of Science and Technology
(TAFM)27 have been performed. Recently, TAFM experiments27 have already been performed for La-
3
doped Ca10-3-8 in the B//c-axis direction up to B=6 T. The result of TAFM analysis for this experiment
showed the magnetic field dependence of U0 ~ B-α on the zero-temperature activation energy in the
entire measured magnetic field region, which was suggested to be due to the entanglement of vortex
lines pinned to the point defect. To understand this more clearly in this paper, we performed TAFM
experiments in two directions of B//c-axis and B//ab-plane up to 13 T for Ca8.5La1.5(Pt3As8)(Fe2As2)5
single crystal. In addition, the TAFM experiment was performed under the same conditions in the
Ca8.5La1.5(Pt3As8)(Fe2As2)5 single crystal irradiated with protons. For the B//c-axis, both pristine and
proton irradiated samples showed magnetic field dependence on the zero-temperature activation energy
of U0 ~ B-α, similar to the previously reported results27. Interestingly, in proton irradiated samples with
more point defects, the magnitude of U0 increased over the entire magnetic field region compared to
that in pristine samples. This clearly indicates that the form U0 ~ B-α is due to point defects. For B//ab-
plane, the magnetic field dependence on the zero-temperature activation energy deviated from the form
of U0 ~ B-α, and the magnitude of the activation energy was significantly increased compared to the
B//c-axis. This indicates that the pinning of the vortex lines was not caused by point defects. Our
analysis found that this pinning energy is related to the short coherence length in the c-axis direction.
The coherence length in the c-axis direction increased due to the change of the structural and electronic
structures by proton irradiation, causing the activation energy to decrease.
RESULTS AND DISCUSSION
XRD and SAED analysis
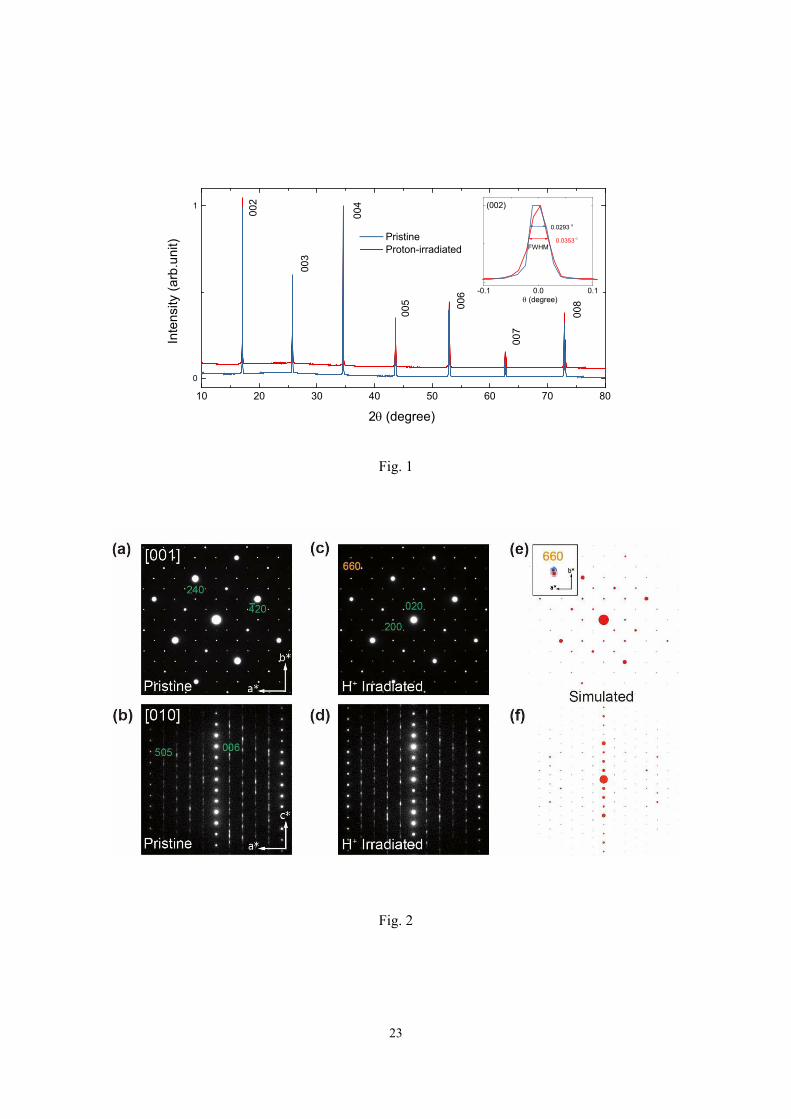
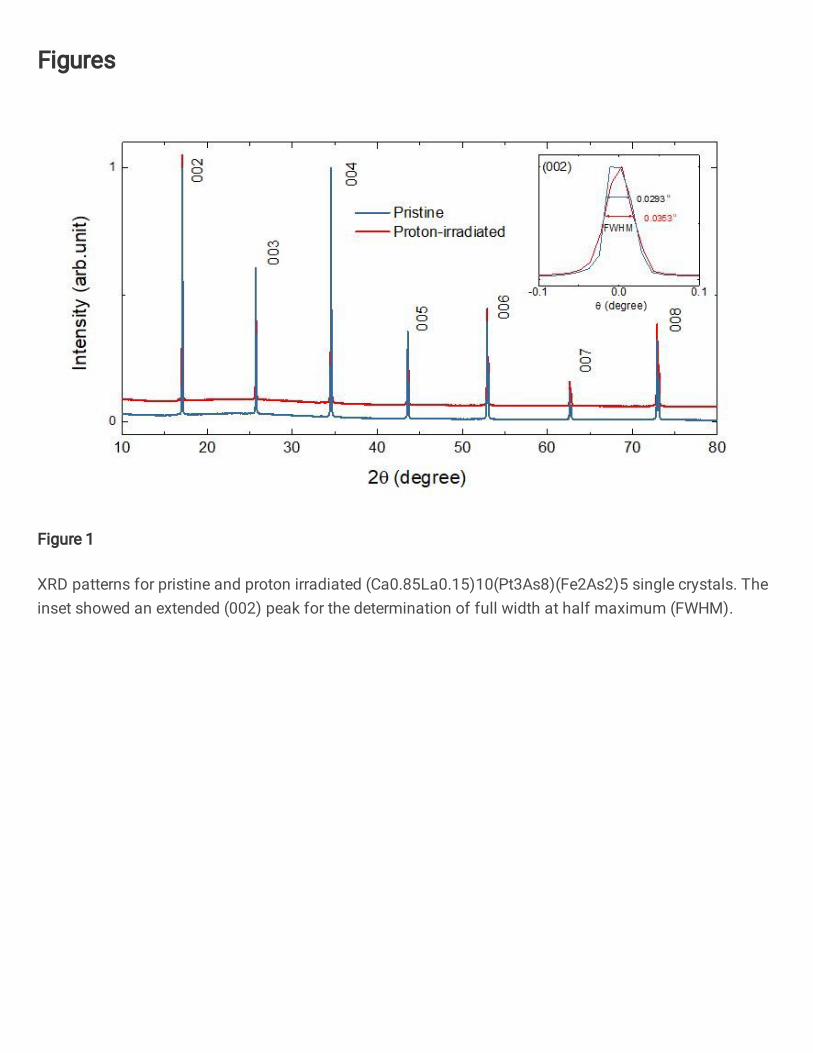
The XRD results for pristine and proton-irradiated (Ca0.85La0.15)10(Pt3As8)(Fe2As2)5 single crystals
are shown in Fig. 1. In both samples, only (00l)-oriented peaks were observed, which indicates that the
direction of the incident X-ray is parallel to the c-axis and that the measured sample is a single phase
without a secondary phase. Each peak position was the same within the error in the two samples,
indicating that the estimated interplanar distance in the two samples was equal to 10.37 Å. This value
is almost consistent with the results reported for pristine samples18. As shown in the inset of Fig. 1, the
FWHM (the full width at half maximum) of the pristine sample and the proton-irradiated sample is
evaluated at a very narrow 0.0293° and 0.0353°, respectively. This indicates that the pristine single
crystal was aligned with almost no structural defects, and that the proton irradiated single crystal had
slightly more structural defects than the pristine sample.
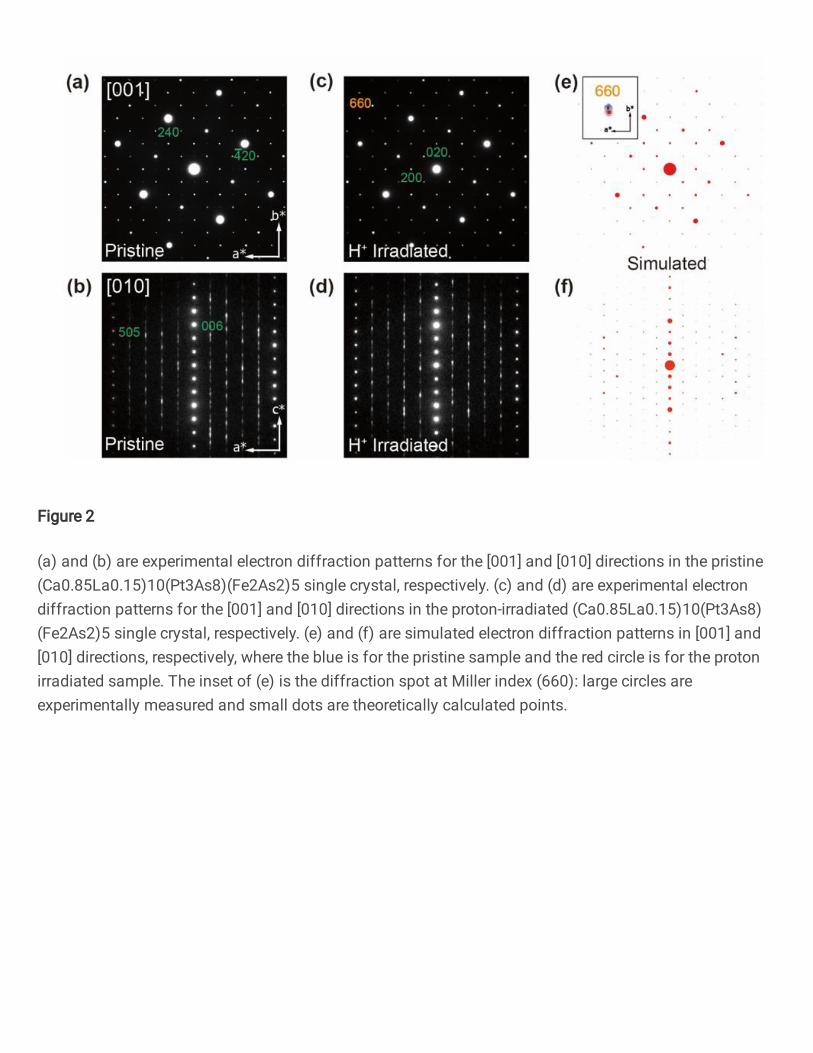
We performed crystal structure analysis by selected area electron diffraction (SAED) method using
transmission electron microscopy (TEM) to find crystallographic changes between pristine and proton
irradiated (Ca0.85La0.15)10(Pt3As8)(Fe2As2)5 single crystals. Figs. 2(a), 2(b) and 2(c), 2(d) show the
4
experimental results of the SAED analysis for the zone axes [001] and [010] in pristine and proton-
irradiated single crystals, respectively. These two patterns for both samples do not show a ring pattern
at the center point, indicating that both samples are almost perfect single crystals with no polycrystalline
components. Interestingly, as will be discussed below, these two results were not explained by the
patterns obtained using the lattice parameters and spatial groups of triclinic structures previously
reported28. Instead, this measured SAED pattern is well described as a monoclinic structure with a
spatial group of P21/n, which is similar to the recently published pattern of γ-104829.
La-doped Ca10(Pt3As8)(Fe2As2)5 cannot have a Pt4As8 layer as confirmed by EDS analysis using
TEM. According to the results of the triclinic structure La-doped Ca10(Pt3As8)(Fe2As2)5, the location of
the La atom in the unit cell is located just above and below the Pt vacancies in the Pt3As8 layer28. Here,
means Pt vacancy. La3+, which has a higher charge than Ca2+, is known to prefer this site by lowering
its lattice energy when it is located directly above and below the Pt vacancy28. In our compound, the La
atom is located almost near the Pt vacancies in the Pt3As8 layer, which is expected to have a similar
structure to the Pt4As8 layer structure, resulting in a change from triclinic to monoclinic crystal structure.
In order to obtain more accurate information on the atomic position of the crystal structure, additional
experiments with single crystal XRD or high-angle annular dark-field scanning transmission electron
microscopy (HAADF-STEM) are required. In the SAED pattern, diffused stripes appear along the zone
axis [010]. These diffused stripes would have been caused by unavoidable sample cross-section damage
due to Focused Ion Beam (FIB) in the TEM pretreatment of (Ca0.85La0.15)10(Pt3As8)(Fe2As2)5 with a
layered structure.
Figs. 2(e) and 2(f) show simulated SAED patterns of pristine and irradiated samples for each zone
axis, respectively. The blue color spot represents the simulated SAED pattern for the pristine sample,
and the red color one represents the proton irradiated sample. As in the figures, the two spots almost
overlap over a large area of the reciprocal lattice, so the two spots are hardly distinguished. However,
in Fig. 2(e), an enlarged view for the spot diffracted from the Miller index (660), there is a clear
difference between the location of the blue spot for the pristine sample and the location of the red spot
for the proton irradiated sample. This small difference arises from the difference in small lattice
constants between the two samples. These theoretical simulations agree well with the experimental
results indicated by large circles, as shown in the inset in Fig. 2(e). The lattice parameters for the pristine
and proton-irradiated samples were obtained by performing simulations on the SAED pattern of each
zone axis. The lattice parameters a and b were obtained from the zone axis [001] of each sample, and
the lattice parameters a and c were obtained from the zone axis [010]. The lattice parameter a obtained
from the zone axis [001] and [010] of each sample was the same. From the results of the simulated
pattern, the lattice parameter of the pristine sample was evaluated as a = 8.727±0.0122, b =
8.776±0.0096, c = 20.800±0.0083 Å, γ = 89.05±0.035º, and the lattice parameter of the proton irradiated
5
sample was evaluated as a = 8.764±0.0087, b = 8.829±0.0088, c = 20.800±0.0042 Å, γ = 89.85±0.026º.
In other words, the lattice parameters a and b for the proton irradiated sample increase by 0.42 and
0.60%, respectively, compared to the pristine sample, but the lattice parameter c does not change. This
is a very interesting result. The difference in the constants for the lattice between the two samples was
very small, but it was certainly larger than the error for each. The interlayer distance obtained by XRD
is obtained by assuming a triclinic structure, but as discussed above, the crystal structure of this
compound is a monoclinic structure as a result of SAED analysis. According to the reported γ-1048
compound, the unit cell of the monoclinic structure is a super cell having twice the size of the lattice
constant of the c-axis in the triclinic structure29. Therefore, the interlayer distance obtained by XRD is
modified to 20.74 Å in a monoclinic structure. This value is similar to the value of the lattice parameter
c of the sample obtained from the result of the simulated pattern.
Electrical resistivity in zero magnetic field
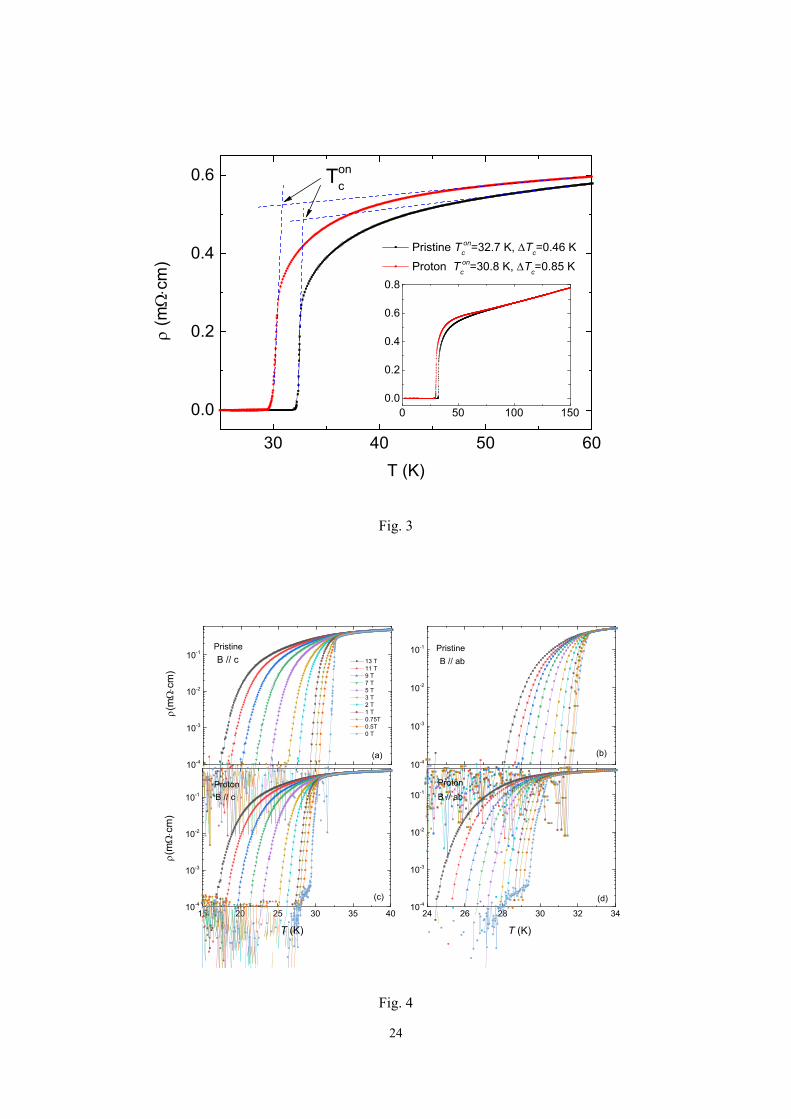
Fig. 3 shows the in-plane electrical resistivity near Tc for pristine and proton irradiated
(Ca0.85La0.15)10(Pt3As8)(Fe2As2)5 single crystals with zero magnetic field. The abrupt increase due to the
superconducting transition was observed in both samples. Compared to the pristine sample, as can be
seen in the inset, the normal-state electrical resistivity of the proton irradiated sample is large just above
Tc, but becomes the same in the higher temperature region. A similar increase in the limited temperature
range just above Tc is observed in La/Pt-underdoped Ca 10-3-8 samples18,22. As the temperature
approaches Tc in the normal state, the electrical resistivity bends down as shown in the figure, so we
evaluate Tcon and ΔTc as follows: Tc
on is defined as the temperature at which the linearly extrapolated
line in the temperature range where the electrical resistivity suddenly increases from zero and the linear
extrapolated line performed in the temperature range where the electrical resistivity changes linearly in
the high temperature normal state intersect. From this definition, the superconducting transition
temperature was evaluated as Tcon = 32.7 K in the pristine sample and Tc
on = 30.8 K in the proton
irradiated sample. The Tcon of the pristine sample is almost similar to the reported results18. Meanwhile,
the temperature width ΔTc of Tc was determined from 2*[0.5∙ρ(Tcon) - 0.1∙ρ(Tc
on)]. As a result, the width
was evaluated as ΔTc = 0.46 K in the pristine sample and ΔTc = 0.79 K in the proton irradiated sample.
ΔTc of the pristine sample is very narrow, indicating that the sample has very few defects such as the
secondary phase. Compared to the pristine sample, the proton-irradiated sample showed slightly larger
ΔTc. This increase was not caused by the appearance of the secondary phase because no small peak due
to the secondary phase was observed in the XRD experiment results. Instead, since the FWHM for the
observed peaks in the XRD pattern slightly increased, this increase in ΔTc is thought to be due to
crystallographic distortion. However, since the electrical resistivity of the proton-irradiated sample is
6
almost the same as that of the pristine sample at high temperature normal state, the crystallographic
distortion that occurs in the proton-irradiated sample is very small.
As described above, the Tc of the proton-irradiated sample was lowered by about 2 K compared to
the pristine sample. It is known that the decrease in Tc occurs due to the spin flip scattering of the
electron pair and the magnetic defect30. Proton irradiation causes distortion of the lattice, but does not
excite nonmagnetic ions as magnetic ions. Since lattice defects do not cause spin flip scattering of the
electron pair, this causes a small decrease in Tc, not the large decrease in Tc observed here. Another
cause of the large decrease in Tc may be the increase in the lattice constants of a and b discussed above.
As discussed in the SAED results above, proton irradiation increased the lattice constants a and b by
0.42 and 0.60%, respectively. The increase in the lattice constants a and b is expected to reduce the
overlap between the bands, resulting in a decrease in the concentration of doped electrons and to further
enhance the localization of the 3d-electron orbit. The former will cause an underdoping effect, resulting
in a decrease in Tc, and the latter will cause an increase in electrical resistivity in the normal state just
above Tc as in the underdoped Ca 10-3-8 samples. Since these two behaviors were observed in the
proton irradiated sample, the large decrease in Tc observed in the proton irradiated sample can be
understood as an increase in lattice parameters a and b.
Electrical resistivity under magnetic field and the higher critical field Bc2(T) curves
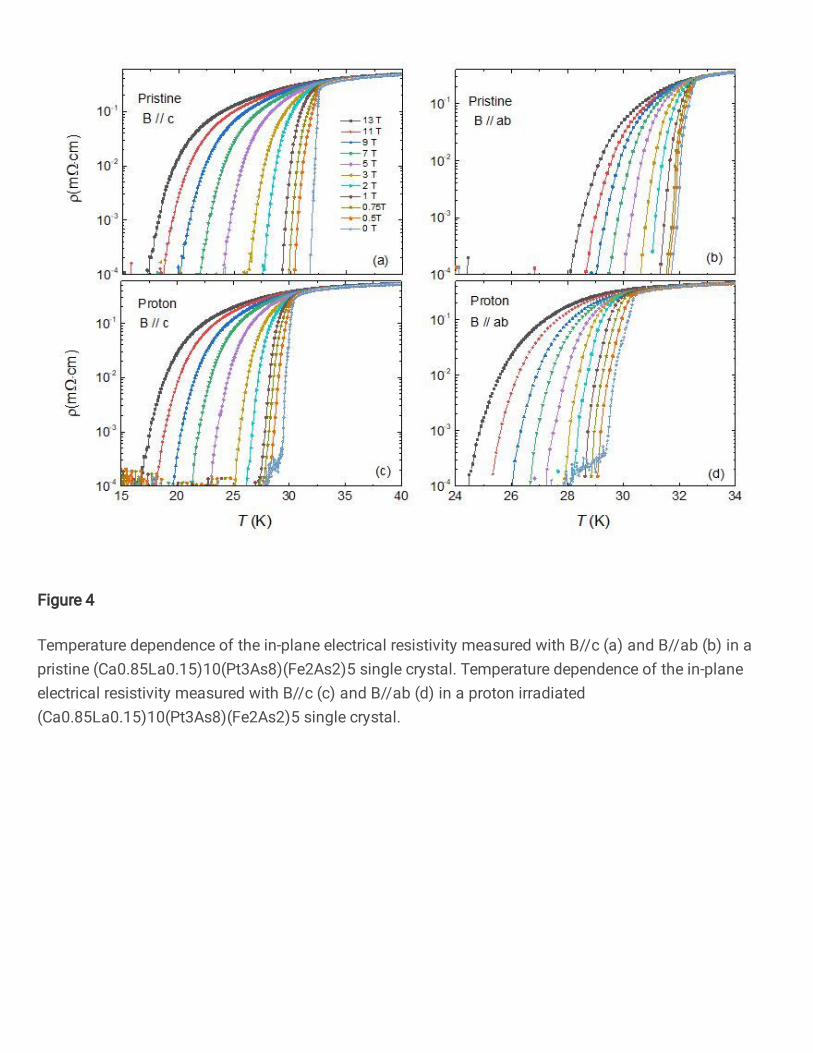
Figs. 4(a)-4(d) show the temperature dependence of the in-plane electrical resistivity measured with
B//c and B//ab for the pristine and proton-irradiated (Ca0.85La0.15)10(Pt3As8)(Fe2As2)5 single crystals,
respectively, on a semi-logarithmic scale. As the magnetic field increases, the electrical resistivity near
Tc for both magnetic fields of both samples exhibits a typical broadening, which is known to be due to
the thermally activated vortex motion occurring in the vortex liquid. This broadening occurs more
strongly in a magnetic field parallel to the c-axis. On the other hand, the first-order phase transition
from the vortex liquid to the vortex lattice was not observed up to low temperatures because abruptly
changes in the temperature dependence of the electrical resistivity under the magnetic field were not
observed up to low temperatures. As shown in the figure, the electrical resistivity fluctuates at a value
less than ρ ~ 4∙10-7 Ω·cm, which is caused because the electrical resistivity of the sample approaches
zero and becomes smaller than the minimum value that can be accurately measured.
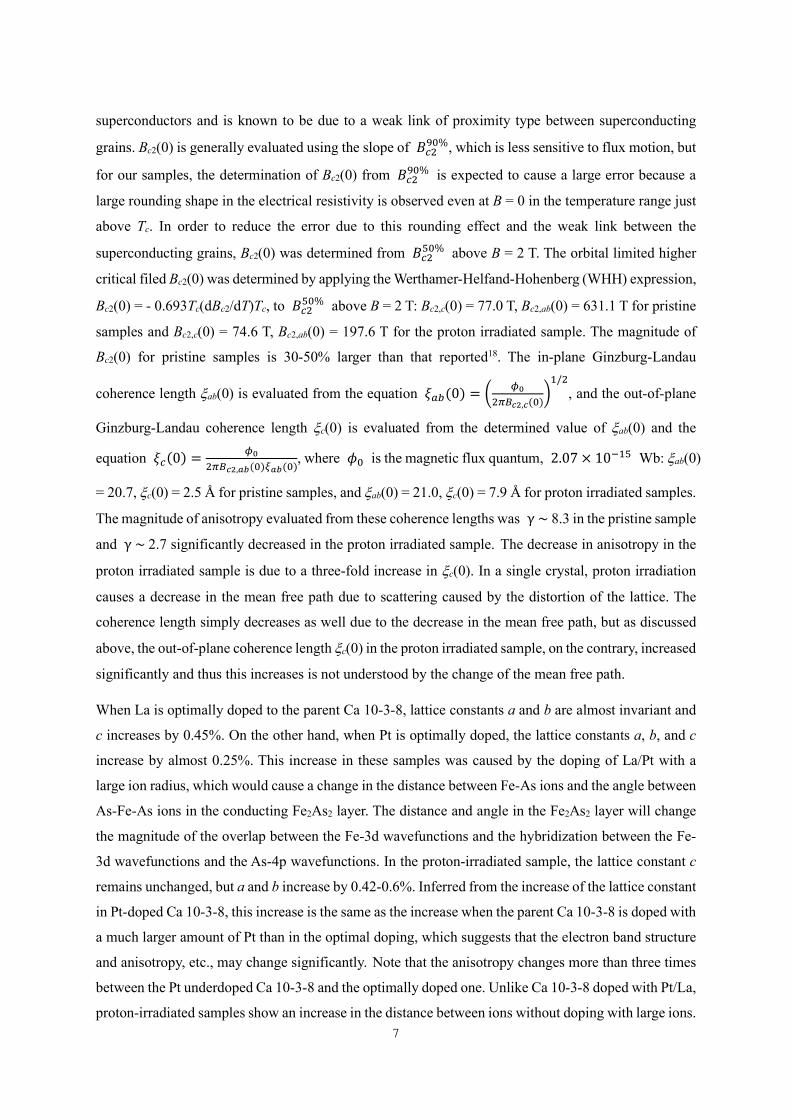
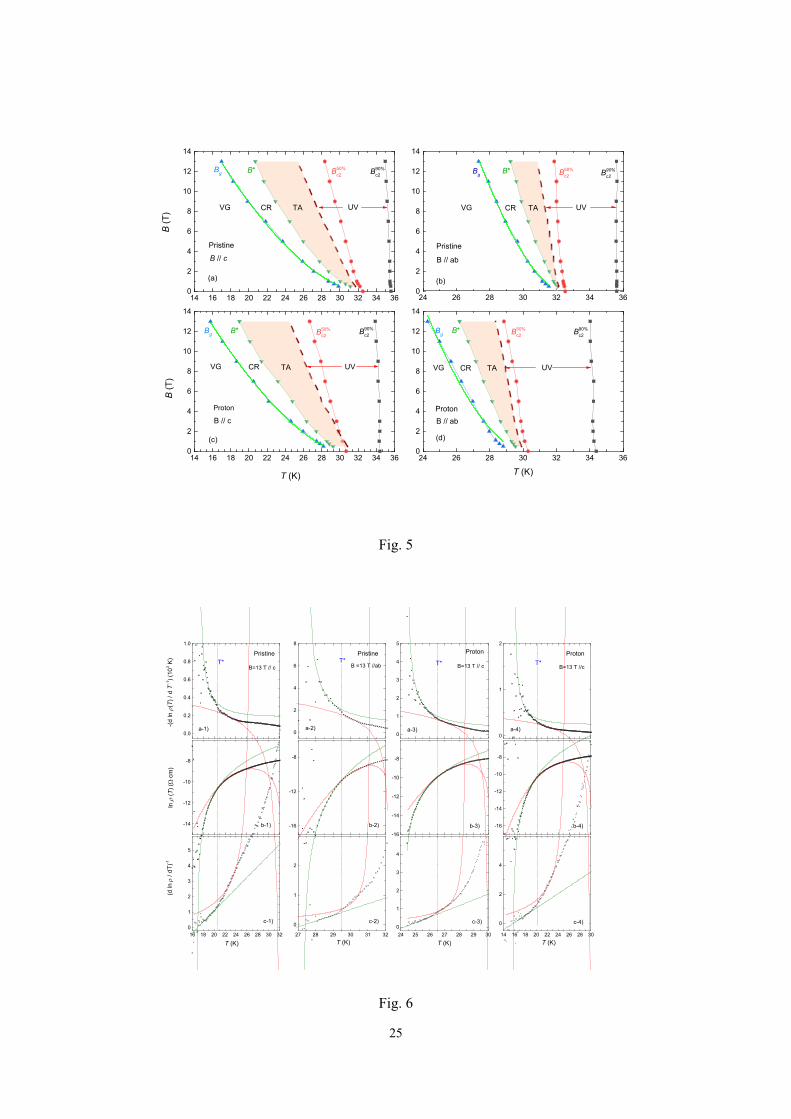
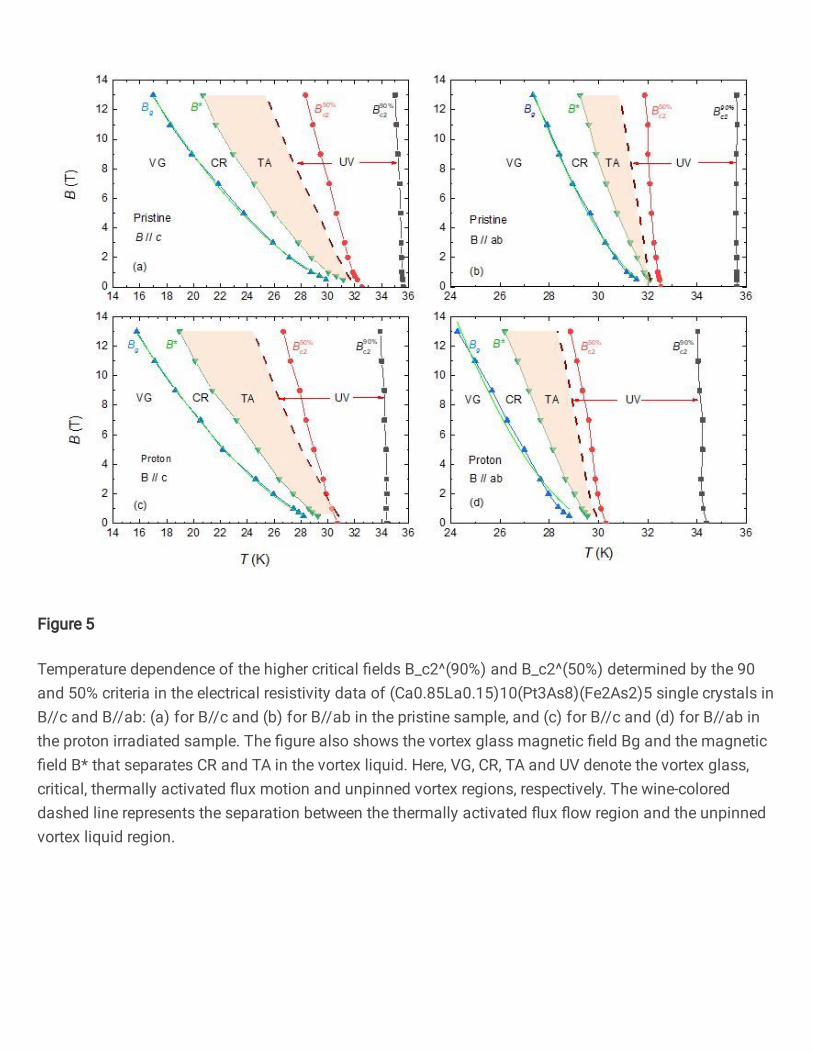
The temperature dependence of the higher critical fields 𝐵𝐵𝑐𝑐290% and 𝐵𝐵𝑐𝑐250% in B//c and B//ab is
determined by the 90 and 50% criteria in the electrical resistivity data of pristine and proton irradiated
(Ca0.85La0.15)10(Pt3As8)(Fe2As2)5 single crystals, and the results are shown in Figs. 5(a)-5(d), respectively.
The 𝐵𝐵𝑐𝑐290% and 𝐵𝐵𝑐𝑐250% curves determined in each magnetic field direction for each sample show weak
upward curvature in the low magnetic field region. This behavior is often observed in high-Tc
7
superconductors and is known to be due to a weak link of proximity type between superconducting
grains. Bc2(0) is generally evaluated using the slope of 𝐵𝐵𝑐𝑐290%, which is less sensitive to flux motion, but
for our samples, the determination of Bc2(0) from 𝐵𝐵𝑐𝑐290% is expected to cause a large error because a
large rounding shape in the electrical resistivity is observed even at B = 0 in the temperature range just
above Tc. In order to reduce the error due to this rounding effect and the weak link between the
superconducting grains, Bc2(0) was determined from 𝐵𝐵𝑐𝑐250% above B = 2 T. The orbital limited higher
critical filed Bc2(0) was determined by applying the Werthamer-Helfand-Hohenberg (WHH) expression,
Bc2(0) = - 0.693Tc(dBc2/dT)Tc, to 𝐵𝐵𝑐𝑐250% above B = 2 T: Bc2,c(0) = 77.0 T, Bc2,ab(0) = 631.1 T for pristine
samples and Bc2,c(0) = 74.6 T, Bc2,ab(0) = 197.6 T for the proton irradiated sample. The magnitude of
Bc2(0) for pristine samples is 30-50% larger than that reported18. The in-plane Ginzburg-Landau
coherence length ξab(0) is evaluated from the equation 𝜉𝜉𝑎𝑎𝑎𝑎(0) = 𝜙𝜙02𝜋𝜋𝐵𝐵𝑐𝑐2,𝑐𝑐(0)1/2
, and the out-of-plane
Ginzburg-Landau coherence length ξc(0) is evaluated from the determined value of ξab(0) and the
equation 𝜉𝜉𝑐𝑐(0) =𝜙𝜙02𝜋𝜋𝐵𝐵𝑐𝑐2,𝑎𝑎𝑎𝑎(0)𝜉𝜉𝑎𝑎𝑎𝑎(0)
, where 𝜙𝜙0 is the magnetic flux quantum, 2.07 × 10⁻¹⁵ Wb: ξab(0)
= 20.7, ξc(0) = 2.5 Å for pristine samples, and ξab(0) = 21.0, ξc(0) = 7.9 Å for proton irradiated samples.
The magnitude of anisotropy evaluated from these coherence lengths was γ ~ 8.3 in the pristine sample
and γ ~ 2.7 significantly decreased in the proton irradiated sample. The decrease in anisotropy in the
proton irradiated sample is due to a three-fold increase in ξc(0). In a single crystal, proton irradiation
causes a decrease in the mean free path due to scattering caused by the distortion of the lattice. The
coherence length simply decreases as well due to the decrease in the mean free path, but as discussed
above, the out-of-plane coherence length ξc(0) in the proton irradiated sample, on the contrary, increased
significantly and thus this increases is not understood by the change of the mean free path.
When La is optimally doped to the parent Ca 10-3-8, lattice constants a and b are almost invariant and
c increases by 0.45%. On the other hand, when Pt is optimally doped, the lattice constants a, b, and c
increase by almost 0.25%. This increase in these samples was caused by the doping of La/Pt with a
large ion radius, which would cause a change in the distance between Fe-As ions and the angle between
As-Fe-As ions in the conducting Fe2As2 layer. The distance and angle in the Fe2As2 layer will change
the magnitude of the overlap between the Fe-3d wavefunctions and the hybridization between the Fe-
3d wavefunctions and the As-4p wavefunctions. In the proton-irradiated sample, the lattice constant c
remains unchanged, but a and b increase by 0.42-0.6%. Inferred from the increase of the lattice constant
in Pt-doped Ca 10-3-8, this increase is the same as the increase when the parent Ca 10-3-8 is doped with
a much larger amount of Pt than in the optimal doping, which suggests that the electron band structure
and anisotropy, etc., may change significantly. Note that the anisotropy changes more than three times
between the Pt underdoped Ca 10-3-8 and the optimally doped one. Unlike Ca 10-3-8 doped with Pt/La,
proton-irradiated samples show an increase in the distance between ions without doping with large ions.
8
This clearly reduces the magnitude of the overlap between the Fe-3d wavefunctions in the Fe2As2 layer.
An increase in low-temperature electrical resistivity caused by the reduced overlap was observed in the
proton-irradiated sample. This can be inferred from the fact that the Pt-underdoped Ca 10-3-8 system,
which shows a strong localization of the Fe-3d wavefunction and an increase in the low-temperature
electrical resistivity, exhibits larger anisotropy than the Pt-optimal doping system, which shows less
localization. However, compared to pristine samples, proton-irradiated samples showed three times less
anisotropy. According to the band theory31, band hybridization induces the three-dimensionality of the
carrier by reducing the localization of the band. Based on this, this small anisotropy in the proton
irradiation sample is due to a large change in the magnitude of hybridization between the Fe-3d
wavefunction and the As-4p wavefunction. In pristine and proton-irradiated samples, the lattice
constant c was constant, but the angle γ in the unit cell was changed by ~ 1° as discussed previously.
This change in angle γ can change the distance between Fe-As and the angle between As-Fe-As,
resulting in a change in the hybridization magnitude between the Fe-3d wave function and the As-4p
wave function. Therefore, the decrease in the anisotropy in the proton-irradiated sample is considered
to be caused by the change in the electronic structure determined by the hybridization between the Fe-
3d wavefunction and the As-4p wavefunction and the overlap between the Fe-3d wavefunction having
the opposite effect. Accurate band calculation is required to make this clear.
Thermally activated flux motion in the vortex liquid state
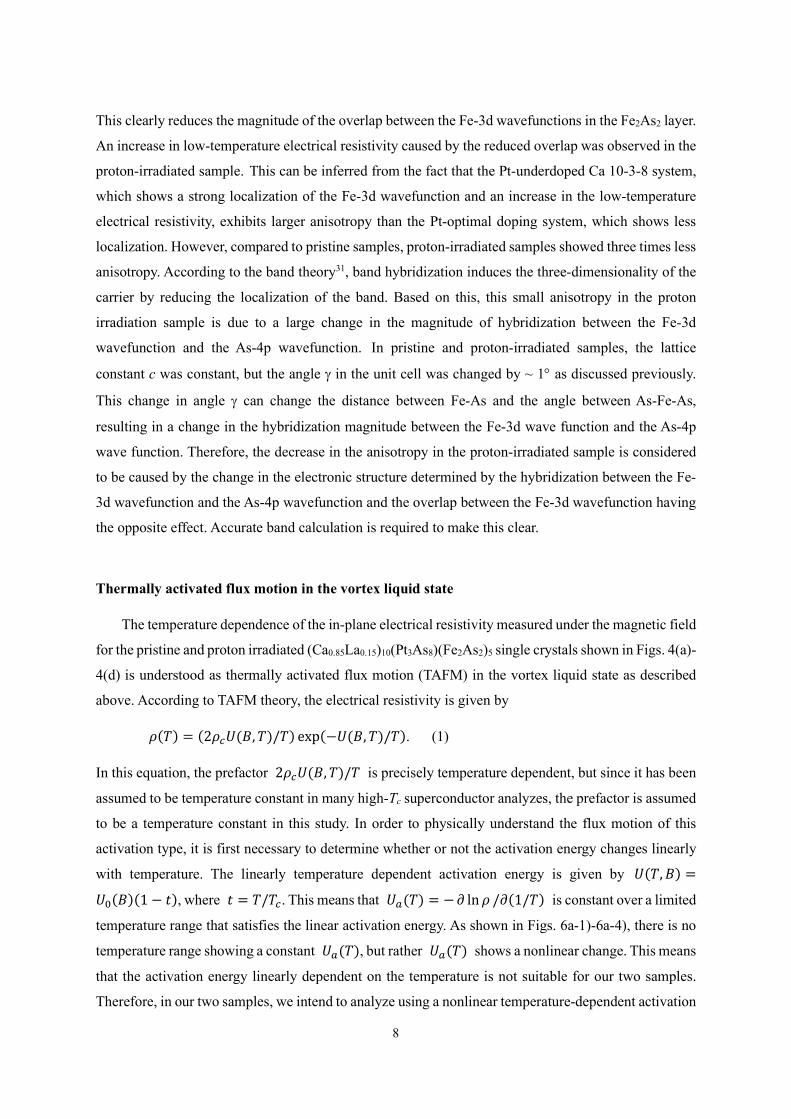
The temperature dependence of the in-plane electrical resistivity measured under the magnetic field
for the pristine and proton irradiated (Ca0.85La0.15)10(Pt3As8)(Fe2As2)5 single crystals shown in Figs. 4(a)-
4(d) is understood as thermally activated flux motion (TAFM) in the vortex liquid state as described
above. According to TAFM theory, the electrical resistivity is given by 𝜌𝜌(𝑇𝑇) = (2𝜌𝜌𝑐𝑐𝑈𝑈(𝐵𝐵,𝑇𝑇)/𝑇𝑇) exp(−𝑈𝑈(𝐵𝐵,𝑇𝑇)/𝑇𝑇). (1)
In this equation, the prefactor 2𝜌𝜌𝑐𝑐𝑈𝑈(𝐵𝐵,𝑇𝑇)/𝑇𝑇 is precisely temperature dependent, but since it has been
assumed to be temperature constant in many high-Tc superconductor analyzes, the prefactor is assumed
to be a temperature constant in this study. In order to physically understand the flux motion of this
activation type, it is first necessary to determine whether or not the activation energy changes linearly
with temperature. The linearly temperature dependent activation energy is given by 𝑈𝑈(𝑇𝑇,𝐵𝐵) =𝑈𝑈0(𝐵𝐵)(1− 𝑡𝑡), where 𝑡𝑡 = 𝑇𝑇/𝑇𝑇𝑐𝑐. This means that 𝑈𝑈𝑎𝑎(𝑇𝑇) = −∂ ln𝜌𝜌 /𝜕𝜕(1/𝑇𝑇) is constant over a limited
temperature range that satisfies the linear activation energy. As shown in Figs. 6a-1)-6a-4), there is no
temperature range showing a constant 𝑈𝑈𝑎𝑎(𝑇𝑇), but rather 𝑈𝑈𝑎𝑎(𝑇𝑇) shows a nonlinear change. This means
that the activation energy linearly dependent on the temperature is not suitable for our two samples.
Therefore, in our two samples, we intend to analyze using a nonlinear temperature-dependent activation
9
energy 𝑈𝑈(𝑇𝑇,𝐵𝐵) = 𝑈𝑈0(𝐵𝐵)(1− 𝑡𝑡)𝑞𝑞, which was previously performed on high-Tc superconductors by
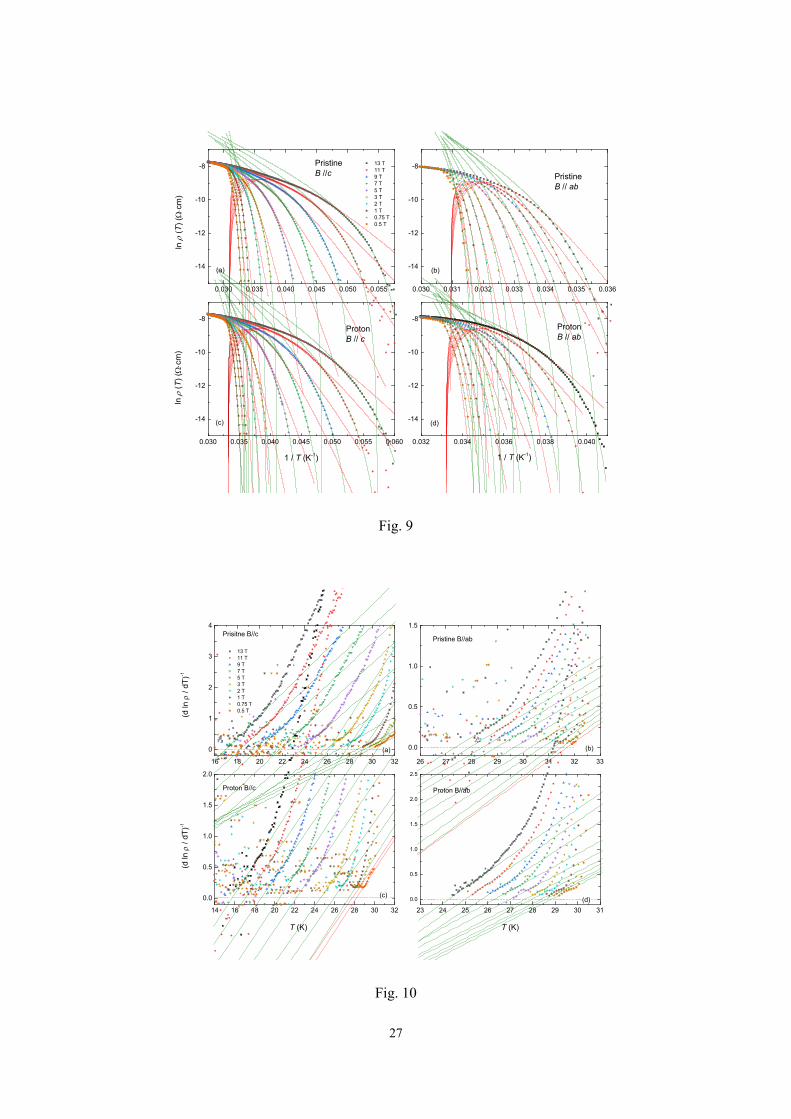
Zhang et al.32,33. Using the nonlinear activation energy, the logarithm of Eq. (1) is given by 𝐷𝐷(𝑇𝑇) = ln𝜌𝜌 (𝑇𝑇) .
For the pristine and proton irradiated samples, 𝑈𝑈𝑎𝑎(𝑇𝑇) calculated from the data in the directions of B//c
and B//ab at B = 13 T agrees well with the red line fitted with Eq. (3) over a limited temperature range
as shown in Figs. 6a-1)-6a-4), respectively. The best fit for different magnetic fields is shown by red
lines in Figs. 7(a)-7(d). From the best fittings in both magnetic field directions, Tc = 32.3 K and q = 1.52
were achieved for the pristine sample, and Tc = 30.1 K and q = 1.52 for the proton irradiated sample.
Also, the zero-temperature activation energy 𝑈𝑈0(B) in each magnetic field evaluated by these fittings
is shown in Fig. 8. The best fitting using Eq. (2) with the values of Tc, q, and 𝑈𝑈0 obtained from the 𝑈𝑈𝑎𝑎(𝑇𝑇) fitting at B = 13 T performed just above is shown as a red line in Figs. 6b-1)-6b-4). ρc was
determined from this fitting. In both fittings, the temperature range consistent with the experimental
results is almost the same. The fitting results using Eq. (2) in different magnetic fields are drawn with
red lines in Figs. 9(a)-9(d). The ρc(B) determined in this fitting is shown in the inset in Fig. 8, and ρc(B)
increases rapidly in the low magnetic field region and then almost saturates above B = 2 T.
As shown in Figs. 6a-1)-6a-4), experimentally calculated 𝑈𝑈𝑎𝑎(𝑇𝑇) in both magnetic field directions
for pristine and irradiated samples deviates from the red line analyzed with TAFM below T* and
fluctuates significantly in the lower temperature region. This fluctuation is due to a measurement error
that occurs because the electrical resistance of the sample is very close to zero and exceeds our
measurement limit. This fluctuation indicates that these two samples possess a second-order phase
transition from the vortex liquid phase to the vortex glass phase. From this point of view, the gradual
deviation of 𝑈𝑈𝑎𝑎(𝑇𝑇) obtained by the experiment to the larger side compared to the TAFM model below
T* is due to the development of vortex glass gradually appearing as the temperature decreases in the
vortex liquid state. In this temperature region, the activation energy increases effectively due to the
development of vortex glass, and this region is called a critical region. According to the vortex glass
theory, which quantitatively explains the temperature dependence of the electrical resistivity in this
critical region, the electrical resistivity satisfies 𝜌𝜌 (𝑇𝑇) ~ 𝑇𝑇 − 𝑇𝑇𝑔𝑔𝜈𝜈(𝑧𝑧+2−𝑑𝑑) and disappears completely
10
at 𝑇𝑇𝑔𝑔, where d is the dimensionality of the sample (d = 3 in both samples), ν is a static index for the
vortex-glass correlation length, and z is a dynamic index for the correlation time. The derivative of the
logarithmic electrical resistivity with temperature in this region shows a linear temperature dependence,
that is,
𝑅𝑅(𝑇𝑇) = 𝑑𝑑 ln𝜌𝜌(𝑇𝑇)𝑑𝑑 𝑇𝑇 −1 = 1𝑠𝑠 𝑇𝑇 − 𝑇𝑇𝑔𝑔, (4)
where s = ν(z+2-d) is the reciprocal of the slope of Eq. (4). For the pristine and proton irradiated samples,
R(T) calculated from the experimental data in the directions of B//c and B//ab at B = 13 T is shown in
Figs. 6c-1)-6c-4), respectively. As shown in the figure, a linear change of R(T) was observed in the
temperature range below T*, indicating that it was well explained by the vortex glass theory. R(T) in
different magnetic fields is shown in Figs. 10(a)-10(d), and linear changes in each magnetic field were
observed in the low temperature range. The best fit obtained using Eq. (4) is also shown as green lines
in Figs. 10(a)-10(d). These fittings agree well with the experimental results up to T*. R(T) calculated
from the TAFM model discussed above is drawn with red lines in Figs. 6c-1)-6c-4). It showed good
agreement with the experiment in the limited temperature range above T*. Therefore, T* becomes the
temperature that divides the TAFM temperature region and the critical temperature region. From the
fitting using Eq. (4) [Figs. 10(a)-10(d)] the vortex glass temperature Tg and critical exponent s were
determined. The magnetic field dependence of Tg, which is termed Bg(T), and s are shown in Figs. 5(a)-
5(d) and 12(a)-12(d), respectively.
According to Liu et al., the thermal activation energy in the critical region is given by 𝑈𝑈eff =
𝑘𝑘𝐵𝐵𝑇𝑇 (𝑇𝑇𝑐𝑐 − 𝑇𝑇) (𝑇𝑇𝑐𝑐 − 𝑇𝑇𝑔𝑔)⁄ , and the temperature dependence of the electrical resistivity by this activation
energy is given by 𝜌𝜌(𝑇𝑇) = 𝜌𝜌𝑛𝑛[exp(𝑈𝑈eff 𝑘𝑘𝐵𝐵𝑇𝑇⁄ )]𝑠𝑠, which is consistent with the Eq. (4) obtained by the
vortex-glass theory34,35. When the electrical resistivity ρ(T) is plotted on the new temperature scale 𝑇𝑇 − 𝑇𝑇𝑔𝑔 𝑇𝑇𝑐𝑐 − 𝑇𝑇𝑔𝑔 in the critical region, according to Eq. (4), ρ(T) is scaled to one in all magnetic
fields if s is constant with respect to the magnetic field change. Figs. 12(a)-12(d) show the electrical
resistivity in each magnetic field direction for each sample on a temperature scale of 𝑇𝑇 − 𝑇𝑇𝑔𝑔 𝑇𝑇𝑐𝑐 − 𝑇𝑇𝑔𝑔 , respectively. Here, for Tc and, values obtained from the fittings discussed above
were used. For the magnetic field direction of B//ab in the pristine sample and the magnetic field
direction of B//c in the proton irradiated sample, ρ(T) scales well to 𝑇𝑇 − 𝑇𝑇𝑔𝑔 𝑇𝑇𝑐𝑐 − 𝑇𝑇𝑔𝑔 , indicating
that s has little dependence on the magnetic field. The s value obtained from the slope of the graph in
the critical region is plotted as a red circle in Figs. 11(a)-11(d). As shown in the figures, it shows good
agreement with the s value determined by the vortex glass model. Ua(T) and D(T) calculated from 𝜌𝜌(𝑇𝑇) = 𝜌𝜌𝑛𝑛[exp(𝑈𝑈eff 𝑘𝑘𝐵𝐵𝑇𝑇⁄ )]𝑠𝑠 along with the values obtained for s, Tc, and Tg in each magnetic field
11
are shown by green lines in Figs. 7(a)-7(d) and Figs. 9(a)-9(d), respectively. These lines agree well with
the experimental results in the temperature range below T*.
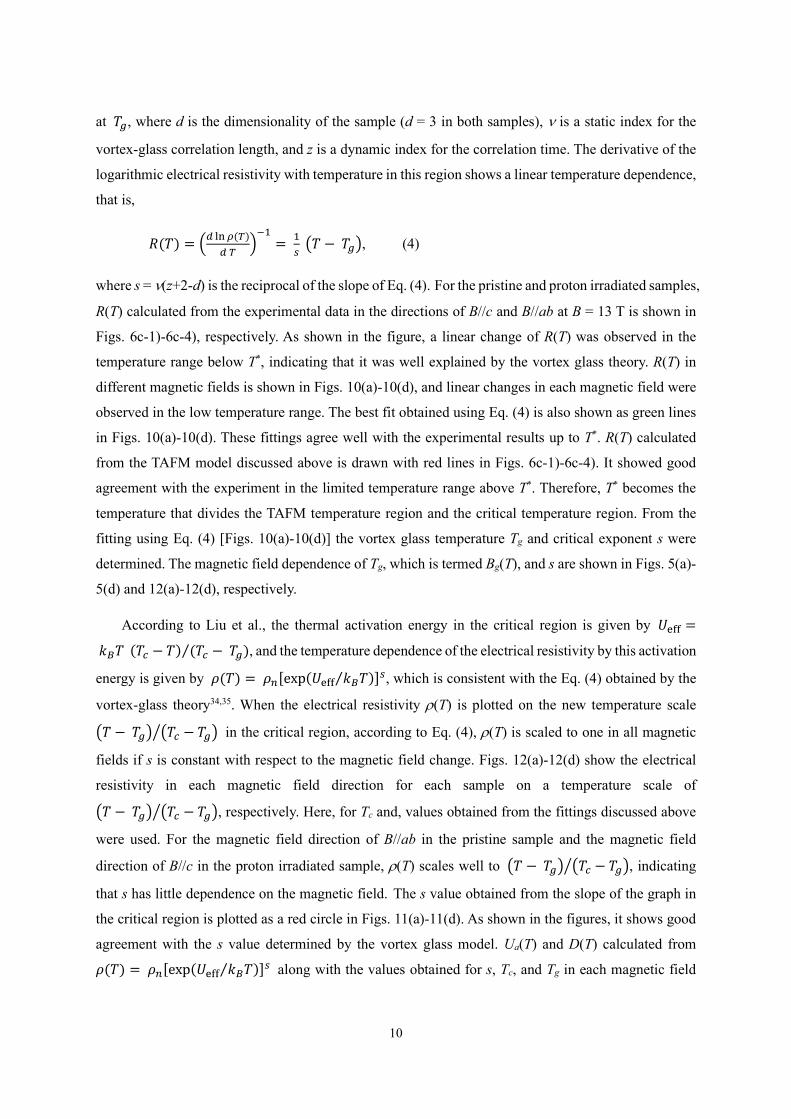
Next, let's discuss the magnetic field dependence of the zero-temperature activation energy U0(B).
As shown in Fig. 8, U0(B) for the pristine and proton-irradiated samples in the magnetic field direction
of B//c decreases linearly with increasing magnetic field on a log-log scale in the entire measured
magnetic field region. That is, it decreases in the form of 𝑈𝑈0(𝐵𝐵) ~ 𝐵𝐵−𝛼𝛼. In both samples, the exponent
is almost the same as α = 1.21 - 1.22. These determined U0(B) and α in B//c are almost similar to those
obtained by TAFM analysis up to B = 6 T in pristine (Ca0.85La0.15)10(Pt3As8)(Fe2As2)5 single crystal.
Compared with iron-based superconductors showing similar Tc, the magnitude of U0(B) in our sample
is significantly larger, which means that strong pinning occurred in our sample27,36–38. Since the
coherence length in the direction perpendicular to the c-axis is about 20 Å, which is about 2.5 times
larger than the lattice constants a and b, as discussed above, the normal component region with zero
Cooper pair does not exist in the ab-plane due to the large coherence length. Therefore, the normal
components that pin the vortex in the pristine sample are atomic point defects such as impurity atoms
and vacancies present in the crystal as already discussed in the XRD result. In the proton-irradiated
sample, the normal components pinning the vortex are new point defects created by proton irradiation
in addition to such atomic defects. The vortex pinning due to random point defects is according to the
plastic creep theory. According to this theory, the vortex lines weakly pinned to point defects in the
vortex liquid becomes entangled, so that the zero activation energy is dependent on 𝑈𝑈0(𝐵𝐵) ~ 𝐵𝐵−𝛼𝛼 with
α = 0.5. Due to the relative motion that occurs between the entangled vortex lines, the vortex lines will
be cut off or recombined and eventually change to a new state of vortex motion. This new motion
changes the magnetic field dependence of 𝑈𝑈0(𝐵𝐵) and the exponent α changes around 0.5. As an
example, untwinned YBCO showed α ~ 0.7 by vortex entanglement in weakly pinned vortex liquid.
Meanwhile, it is known that the magnetic field dependence of 𝑈𝑈0(𝐵𝐵) in strongly pinned vortex liquid
becomes stronger and has a larger exponent α. In B//c, both samples show the dependence of 𝑈𝑈0(𝐵𝐵) ~ 𝐵𝐵−𝛼𝛼, and the exponent α has a larger value than the observed value in YBCO. Therefore, the
magnetic field dependence of the activation energy observed in both samples at B//c was caused by the
movement of vortex lines strongly pinned by point defects. The magnitude of the activation energy in
the proton-irradiated sample increased by about 15% compared to that in the pristine sample. Since the
magnitude of the coherence length in the ab plane is almost the same in both samples, the difference in
activation energy is due to pinning of point defects caused by proton irradiation.
Both pristine sample and proton-irradiated sample in B//ab showed significantly larger zero-
temperature activation energy U0(B) in the entire measured magnetic field region compared to those in
B//c. In particular, the increase in U0(B) for the pristine sample is much larger. The coherence length ξc
in both samples discussed above is significantly smaller than the distance between the superconducting
12
Fe2As2 layers (d = 10.4 Å), and in particular, is smaller in the pristine sample. This short ξc creates a
normal region with zero Cooper pairs along the c-axis in both samples. The normal region forms a long
plate shape parallel to the ab-plane. Therefore, vortex pinning in B//ab is caused by a normal component
region formed by a short coherence length ξc along with impurity atoms, vacancies, and point defects
caused by proton irradiation, as in B//c. According to the theory of normal component pinning caused
by short coherence length39, the pinning of vortex lines by the long normal component is stronger than
that by atomic defects or point defects created by proton irradiation. The vortex pinning of the normal
component created by the short coherence length becomes stronger the shorter the coherence length is.
Since the coherence length ξc in both samples is sufficiently small compared to the distance between
the superconducting Fe2As2 layers, the vortex pinning by this normal component is expected to be
sufficiently large. Therefore, since pinning by point defects can be neglected due to the strong vortex
pinning of the normal component, the linear magnetic field dependence of U0(B) due to entanglement
between vortex lines occurring in point defects will not appear in our both samples. In fact, as shown
in Fig. 8, U0(B) in B//ab is bent downward in the high magnetic field region. According to this pinning
mechanism in B//ab, we can infer that the coherence length increases in the high magnetic field from
the bending of U0(B) in the high magnetic field. A detailed study of this is needed. In both samples,
U0(B) in B//ab increased significantly than U0(B) in B//c axis, but this increase was less significant in
proton irradiated samples compared to pristine samples. This is due to the increased coherence length
ξc in the proton irradiated sample. Note that increasing the coherence length decreases the ratio of the
normal component of the plate shape.
As discussed above, U0(T) in the vortex liquid depends on the temperature power law, i.e. 𝑈𝑈(𝑇𝑇,𝐵𝐵) = 𝑈𝑈0(𝐵𝐵)(1− 𝑡𝑡)𝑞𝑞 . The exponent q was determined to be 1.52 for both magnetic field
directions in the pristine and proton-irradiated samples. Note that q = 1.5 is observed in 3-dimensional
high-Tc superconductor and q = 2 is observed in 2-dimensional high-Tc superconductor. The pristine
sample showed anisotropy γ ~ 8.3 and the proton irradiated sample showed γ ~ 2.7, but both samples
formed 3D vortex without forming 2D-disk type vortex in vortex liquid state.
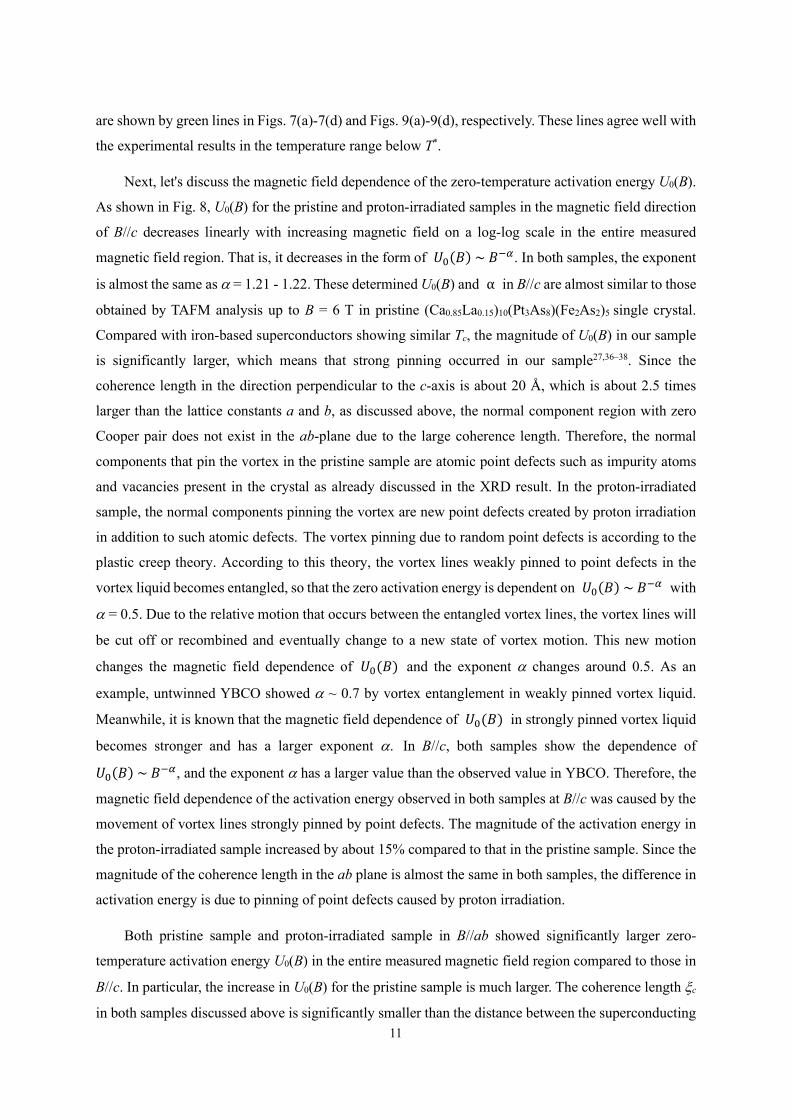
The magnetic field dependence of s representing the vortex glass dimensions determined in the
B//c and B//ab directions for pristine and proton-irradiated samples is shown in Figs. 11(a)-11(d),
respectively. In both magnetic field directions for both samples, s is greater than 2.7 in the entire
measured magnetic field region, indicating that a three-dimensional vortex glass is formed. Each s
shows a value for three-dimensional vortex glass, but s for B//c in pristine samples and B//ab in proton-
irradiated samples shows a distinct magnetic field dependence. On the other hand, s for B//ab in pristine
sample and B//c in proton-irradiated sample have almost constant values for the change of magnetic
field. In particular, s in the B//c direction for the pristine sample decreases as the magnetic field increases,
and approaches 2.7 that appears in 2D glass above B = 4 T. To understand this complex magnetic field
13
dependence, a supplementary study on static index 𝜈𝜈 for vortex-glass correlation length and dynamic
index z for correlation time is needed.
In pristine and proton-irradiated samples, B(T) phase diagrams for B//c and B//ab directions are
shown in Figs. 5(a)-5(d), respectively. Each B(T) phase diagram is largely divided into four different
regions. The vortex glass-to-vortex liquid transition takes place in Bg(T) and is divided into vortex glass
and vortex liquid regions. This vortex glass line is well represented by 𝐵𝐵𝑔𝑔(𝑇𝑇) = 𝐵𝐵0(1− 𝑇𝑇 𝑇𝑇𝑐𝑐⁄ )𝑚𝑚
where 𝐵𝐵0 is the zero-temperature vortex glass field and m is the exponent. The best fitting from this
equation is shown as green lines in Figs. 5(a)-5(d). The parameters determined in the pristine sample
are 𝐵𝐵0 = 45.2, m = 1.7 for B//c and 𝐵𝐵0 = 279.52, m = 1.6 for B//ab. On the other hand, the parameters
determined in the proton-irradiated sample are 𝐵𝐵0 = 40.7, m = 1.6 for B//c, and 𝐵𝐵0 = 234.4, m = 1.7
for B//ab. The evaluated m is similar to the values determined for cuprates and iron-based
superconductors. The vortex liquid region is divided by B*(T) into a critical region in contact with Tg
and a thermally activated flux flow region. The thermally activated flux flow region and the unpinned
vortex liquid region were separated by a wine-colored dashed line. This separation line is obtained from
the higher temperature that deviates between the results using the TAFM model and the experimental
data.
CONCLUSION
We grew optimally doped (Ca0.85La0.15)10(Pt3As8)(Fe2As2)5 single crystals and measured in-plane
electrical resistivity with B//c and B//ab to study the difference between vortex pinning in pristine and
proton-irradiated samples. As a result of analyzing the crystal structure of the two samples by the
selected area electron diffraction (SAED) method using TEM, the diffraction patterns of both samples
were not explained by the known triclinic structure but were explained by the monoclinic crystal
structure. In addition, in the lattice structure, the lattice constants of a and b in the proton-irradiated
sample increased compared to that of the pristine sample, but the lattice constant of c did not change.
The increase in the lattice constant caused a change in their electronic structure due to the change in the
overlap effect between Fe-3d wavefunctions and the hybridization effect of Fe-3d wavefunction and
As-4p. This change showed a significant difference in superconducting transition temperature and
anisotropy between the two samples. The two samples are divided into a vortex glass region showing
zero electrical resistivity and a vortex liquid region showing electrical resistivity values. This vortex
liquid region is divided into a critical region, a pinned vortex liquid region, and an unpinned vortex
liquid region. The critical region has a large activation energy due to the development of vortex glass,
and its activation energy is expressed as 𝑈𝑈eff = 𝑘𝑘𝐵𝐵𝑇𝑇 (𝑇𝑇𝑐𝑐 − 𝑇𝑇) (𝑇𝑇𝑐𝑐 − 𝑇𝑇𝑔𝑔)⁄ . Meanwhile, the pinned
vortex liquid region is described by the thermally activated flux motion (TAFM) with an activation
14
energy 𝑈𝑈(𝑇𝑇,𝐵𝐵) = 𝑈𝑈0(𝐵𝐵)(1− 𝑡𝑡)𝑞𝑞 that is nonlinearly dependent on temperature. In the unpinned
vortex liquid region, there is no restriction on the flux motion due to the activation energy that is small
compared to temperature. The magnetic field dependence of the zero-temperature activation energy in
the B//c direction determined by TAFM motion in the pinned vortex liquid region shows the form of 𝑈𝑈0(𝐵𝐵) ~ 𝐵𝐵−𝛼𝛼 with 𝛼𝛼 = 1.21− 1.22 due to the entanglement of flux lines strongly pinned to point
defects in both pristine and proton-irradiated samples. On the other hand, 𝑈𝑈0(𝐵𝐵) for both samples in
the direction of B//ab increases significantly over the entire measured magnetic field region compared
to that in B//c, and decreases non-linearly with respect to magnetic field changes at high magnetic fields.
This is due to the vortex pinned from the long normal component formed along the c-axis direction by
the short coherent length ξc.
METHODS
Single-crystals growth
(Ca0.85La0.15)10(Pt3As8)(Fe2As2)5 single crystals were grown by a Bridgman method. In order to
accurately make a compound of the desired molar ratio with arsenic having a gaseous phase and Ca, La,
Pt, and Fe having a liquid phase at high temperature, the precursors of CaAs, LaAs and FeAs was
synthesized at 550, 800 and 1050 °C in evacuated quartz ampoules, respectively. The powdered
precursors and Pt element were mixed in a mortar and then placed in a BN crucible. In order to prevent
the evaporation of each element, especially arsenic, into a vapor state at high temperature, the filled BN
crucible was put into a Mo-crucible and covered with a lid, and the contact part between the crucible
and the lid was welded in a high purity Ar-gas atmosphere using an arc welding machine. The welded
Mo-crucible was placed in an electric furnace with a tungsten mesh heater with ±0.1 °C temperature
stability, and a single crystal was grown at 1250 °C.
Experimental conditions of proton irradiation
Proton irradiation along the c-axis of the single crystal was performed at 300 K using an MC-50
cyclotron installed at KIRAM (Korea institute of radiological & medical sciences). The proton energy
is 3 MeV and the total dose of the incident proton is 5×1015 cm-2. To prevent the temperature-rise of the
sample during proton irradiation, we fixed the specimen to a water copper block and used a weak proton
dose rate of ~ 2×1011 cm-2∙s-1.
Electrical transport measurements under magnetic fields
15
Using the grown single crystal, the in-plane electrical resistivity in B//c and B//ab using grown
single crystals were measured by the four-probe method at a current density of about 20 A/cm2 using
the Oxford superconducting system. The gold wires were attached to the sample electrodes using silver
epoxy (EPO-TEK H20E). Gold was deposited in advance on the sample surface for the probes to reduce
the contact resistance below 1 Ω. The electrical resistivity was measured from 2 to 85 K with B = 0.5,
1, 2, 3, 5, 7, 9, 11 and 13 T.
X-ray diffraction
The X-ray diffraction experiments were performed using a PANalytical X-ray powder diffractometer
with Cu Kα radiation (40 kV, 30 mA and λ = 1.5406 Å) at step size of 0.026° (2θ) and scan rate of
0.78°/min.
Measurements and analysis of SAED patterns
Selected area electron diffraction (SAED) patterns were measured at 300 kV accelerating voltage
using a high-resolution transmission electron microscope (HR-TEM, Hitachi HF-3300). As a
pretreatment process for HR-TEM, the thickness of all samples was processed to less than 100 nm using
a dual-beam focused ion beam (dual-beam FIB, Hitachi NB 5000) under an acceleration voltage of 40
kV. To analyze the SAED pattern, the ReciPro program was used. All spots of the pattern were fitted
with the ReciPro program to obtain d-spacing of the sample and the angle between the spots40. From
these fitting results, we found a pattern that closely matches the experimental SAED pattern based on
the crystal structures and space groups of Ca 10-3-828 and Ca 10-4-829, which are known to date. The
lattice constants of all samples were obtained by refinement using UNITCELL software41. The
simulated SAED pattern was obtained using dynamical theory and simulated by adjusting both the
Bloch waves and thickness parameters.
DATA AVAILABILITY
The x-ray diffraction data, selected area electron diffraction (SAED) data and magneroresistivity data
used in this work are available upon request from the corresponding author.
References
1. Huse, D. A., Fisher, M. P. A. & Fisher, D. S. Are superconductors really superconducting?
Nature 358, 553–559 (1992).
16
2. Dai, P. Antiferromagnetic order and spin dynamics in iron-based superconductors. Rev. Mod.
Phys. 87, 855–896 (2015).
3. Kalisky, B. et al. Behavior of vortices near twin boundaries in underdoped Ba(Fe1-xCox)2As2.
Phys. Rev. B 83, 064511 (2011).
4. Hänisch, J. et al. High field superconducting properties of Ba(Fe1-xCox)2As2 thin films. Sci. Rep.
5, 17363 (2015).
5. Iida, K., Hänisch, J. & Yamamoto, A. Grain boundary characteristics of Fe-based
Fig. 10. The temperature dependence of 𝑅𝑅 = (d ln𝜌𝜌(𝑇𝑇)/ d 𝑇𝑇)−1 at different magnetic fields in B//c
and B//ab for (a)-(b) pristine and (c)-(d) proton irradiated (Ca0.85La0.15)10(Pt3As8)(Fe2As2)5 single
crystals. The green line represents the best fitting using Eq. (4).
Fig. 11. (a) to (d) show the magnetic field dependence of determined fitting parameter s for pristine and
proton irradiated (Ca0.85La0.15)10(Pt3As8)(Fe2As2)5 single crystals in B//c and B//ab. The solid square in
black represents s obtained by fitting the experimental data using Eq. (4) for the vortex glass model in
different magnetic fields, and the red solid circle represents s determined from the dependence of the
new temperature scale 𝑇𝑇 − 𝑇𝑇𝑔𝑔 𝑇𝑇𝑐𝑐 − 𝑇𝑇𝑔𝑔 of the electrical resistivity in the critical region.
Fig. 12. (a) to (d) show the dependence of the electrical resistivity on the new temperature scale 𝑇𝑇 − 𝑇𝑇𝑔𝑔 𝑇𝑇𝑐𝑐 − 𝑇𝑇𝑔𝑔 for the pristine and proton irradiated (Ca0.85La0.15)10(Pt3As8)(Fe2As2)5 single
crystals in B//c and B//ab, respectively. The red line represents the linear best fitting in the critical region.
23
10 20 30 40 50 60 70 80
0
1
-0.1 0.0 0.1
008
007
006
005
004
003
Inte
nsity (
arb
.un
it)
2θ (degree)
Pristine
Proton-irradiated002
θ (degree)
(002)
FWHM0.0353
o
0.0293 o
Fig. 1
Fig. 2
24
30 40 50 60
0.0
0.2
0.4
0.6
ρ (m
Ω⋅c
m)
T (K)
Pristine T on
c=32.7 K, ∆T
c=0.46 K
Proton T on
c=30.8 K, ∆T
c=0.85 K
Ton
c
0 50 100 150
0.0
0.2
0.4
0.6
0.8
Fig. 3
10-4
10-3
10-2
10-1
10-4
10-3
10-2
10-1
15 20 25 30 35 4010
-4
10-3
10-2
10-1
24 26 28 30 32 3410
-4
10-3
10-2
10-1
ρ(m
Ω⋅c
m)
13 T
11 T
9 T
7 T
5 T
3 T
2 T
1 T
0.75T
0.5T
0 T
B // c
Pristine
(a) (b)
Pristine
B // ab
(c)
ρ(m
Ω⋅c
m)
T (K)
B // c
Proton
(d)
T (K)
Proton
B // ab
Fig. 4
25
14 16 18 20 22 24 26 28 30 32 34 360
2
4
6
8
10
12
14
24 26 28 30 32 34 360
2
4
6
8
10
12
14
14 16 18 20 22 24 26 28 30 32 34 360
2
4
6
8
10
12
14
24 26 28 30 32 34 360
2
4
6
8
10
12
14
B90%
c2
B (
T)
Pristine
B // c
Bg
B* B50%
c2
(a)
VG CR TA UV
B90%
c2
B // ab
Pristine
Bg
B* B50%
c2
(b)
VG CR TA UV
Proton
B // c
B (
T)
T (K)
Bg
B* B50%
c2B
90%
c2
(c)
VG CR TA UV
T (K)
Proton
B // ab
B90%
c2B
50%
c2B*B
g
(d)
VG CR TA UV
Fig. 5
0.0
0.2
0.4
0.6
0.8
1.0
16 18 20 22 24 26 28 30 32
0
1
2
3
4
5
-14
-12
-10
-8
0
2
4
6
8
27 28 29 30 31 32
0
1
2
-16
-12
-8
0
1
2
3
4
5
24 25 26 27 28 29 30
0
1
2
3
4
-16
-14
-12
-10
-8
0
1
2
14 16 18 20 22 24 26 28 30
0
2
4
-16
-14
-12
-10
-8
-(d ln ρ
(T)
/ d T
-1)
(10
3 K
)
T*
Pristine
B=13 T // c
a-1)
(d ln ρ
/ dT
)-1
c-1)
ln ρ
(T
) (Ω
⋅cm
)
b-1)
a-2)
T*Pristine
B =13 T //ab
c-2)
b-2)
T (K) T (K)T (K)T (K)
a-3)
Proton
B=13 T // cT*
c-3)
b-3)
a-4)
T*
Proton
B=13 T //c
c-4)
b-4)
Fig. 6
26
16 18 20 22 24 26 28 30 32 34
0
500
1000
1500
2000
28 29 30 31 32 33 340
3000
6000
9000
12000
15000
14 16 18 20 22 24 26 28 300
1000
2000
3000
4000
24 25 26 27 28 29 30 310
2000
4000
6000
8000
-(d ln ρ
(T)
/ d T
-1)
(K)
Pristine B//c
(a)
13 T
11 T
9 T
7 T
5 T
3 T
2 T
1 T
0.75 T
0.5 T
Pristine B//ab
(b)
-(d ln ρ
(T)
/ d T
-1)
(K)
T (K)
Proton B//c
(c)
T (K)
Proton B//ab
(d)
Fig. 7
1 10
103
104
105
0 2 4 6 8 10 12 14
0.8
1.2
1.6
2.0
2.4
2.8α~1.22
Pristine B//c
Pristine B//ab
Proton B//c
Proton B//ab
U0 (
K)
B (T)
α~1.21
ρ c (
10
-4 Ω
⋅cm
-1)
B (T)
Fig. 8
27
0.030 0.035 0.040 0.045 0.050 0.055
-14
-12
-10
-8
0.030 0.031 0.032 0.033 0.034 0.035 0.036
-14
-12
-10
-8
0.030 0.035 0.040 0.045 0.050 0.055 0.060
-14
-12
-10
-8
0.032 0.034 0.036 0.038 0.040
-14
-12
-10
-8
13 T
11 T
9 T
7 T
5 T
3 T
2 T
1 T
0.75 T
0.5 T
ln ρ
(T
) (Ω
⋅cm
)
Pristine
B //c
(a) (b)
Pristine
B // ab
(c)
ln ρ
(T
) (Ω
⋅cm
)
1 / T (K-1)
Proton
B // c
(d)
1 / T (K-1)
Proton
B // ab
Fig. 9
16 18 20 22 24 26 28 30 32
0
1
2
3
4
26 27 28 29 30 31 32 33
0.0
0.5
1.0
1.5
14 16 18 20 22 24 26 28 30 32
0.0
0.5
1.0
1.5
2.0
23 24 25 26 27 28 29 30 31
0.0
0.5
1.0
1.5
2.0
2.5
13 T
11 T
9 T
7 T
5 T
3 T
2 T
1 T
0.75 T
0.5 T
(d ln ρ
/ dT
)-1
Prisitne B//c
(a)
Pristine B//ab
(b)
(d ln ρ
/ dT
)-1
T (K)
Proton B//c
(c)
T (K)
Proton B//ab
(d)
Fig. 10
28
2.5
3.0
3.5
4.0
4.5
5.0
5.5
6.0
2.5
3.0
3.5
4.0
4.5
5.0
5.5
6.0
0 2 4 6 8 10 12 142.5
3.0
3.5
4.0
4.5
5.0
5.5
0 2 4 6 8 10 12 142.5
3.0
3.5
4.0
4.5
5.0
5.5
vortex glass
scaling method
sPristine B//c
(a)(b)
Pristine B//ab
(c)
s
B (T)
Proton B//c
(d)
B (T)
Proton B//ab
Fig. 11
0.1 110
-7
10-6
10-5
10-4
10-3
0.1 110
-7
10-6
10-5
10-4
10-3
0.1 110
-7
10-6
10-5
10-4
10-3
0.1 110
-7
10-6
10-5
10-4
13 T
11 T
9 T
7 T
5 T
3 T
2 T
1 T
0.75 T
0.5 T
ρ(T
) (Ω
⋅cm
)
Pristine B//c
(a) (b)
Pristine B//ab
(c)
ρ(T
) (Ω
⋅cm
)
Proton B//c
(d)
(T-Tg) / (T
c-T
g)
Proton B//ab
(T-Tg) / (T
c-T
g)
Fig. 12
Figures
Figure 1
XRD patterns for pristine and proton irradiated (Ca0.85La0.15)10(Pt3As8)(Fe2As2)5 single crystals. Theinset showed an extended (002) peak for the determination of full width at half maximum (FWHM).
Figure 2
(a) and (b) are experimental electron diffraction patterns for the [001] and [010] directions in the pristine(Ca0.85La0.15)10(Pt3As8)(Fe2As2)5 single crystal, respectively. (c) and (d) are experimental electrondiffraction patterns for the [001] and [010] directions in the proton-irradiated (Ca0.85La0.15)10(Pt3As8)(Fe2As2)5 single crystal, respectively. (e) and (f) are simulated electron diffraction patterns in [001] and[010] directions, respectively, where the blue is for the pristine sample and the red circle is for the protonirradiated sample. The inset of (e) is the diffraction spot at Miller index (660): large circles areexperimentally measured and small dots are theoretically calculated points.
Figure 3
Temperature dependence of electrical resistivity around superconducting transition temperature forpristine and proton irradiated (Ca0.85La0.15)10(Pt3As8)(Fe2As2)5 single crystals. The inset representsthe temperature dependence of the electrical resistance for the two samples over a wider temperaturerange. The blue dashed lines represent extrapolated lines to determine Tcon.
Figure 4
Temperature dependence of the in-plane electrical resistivity measured with B//c (a) and B//ab (b) in apristine (Ca0.85La0.15)10(Pt3As8)(Fe2As2)5 single crystal. Temperature dependence of the in-planeelectrical resistivity measured with B//c (c) and B//ab (d) in a proton irradiated(Ca0.85La0.15)10(Pt3As8)(Fe2As2)5 single crystal.
Figure 5
Temperature dependence of the higher critical elds B_c2^(90%) and B_c2^(50%) determined by the 90and 50% criteria in the electrical resistivity data of (Ca0.85La0.15)10(Pt3As8)(Fe2As2)5 single crystals inB//c and B//ab: (a) for B//c and (b) for B//ab in the pristine sample, and (c) for B//c and (d) for B//ab inthe proton irradiated sample. The gure also shows the vortex glass magnetic eld Bg and the magneticeld B* that separates CR and TA in the vortex liquid. Here, VG, CR, TA and UV denote the vortex glass,critical, thermally activated ux motion and unpinned vortex regions, respectively. The wine-coloreddashed line represents the separation between the thermally activated ux ow region and the unpinnedvortex liquid region.
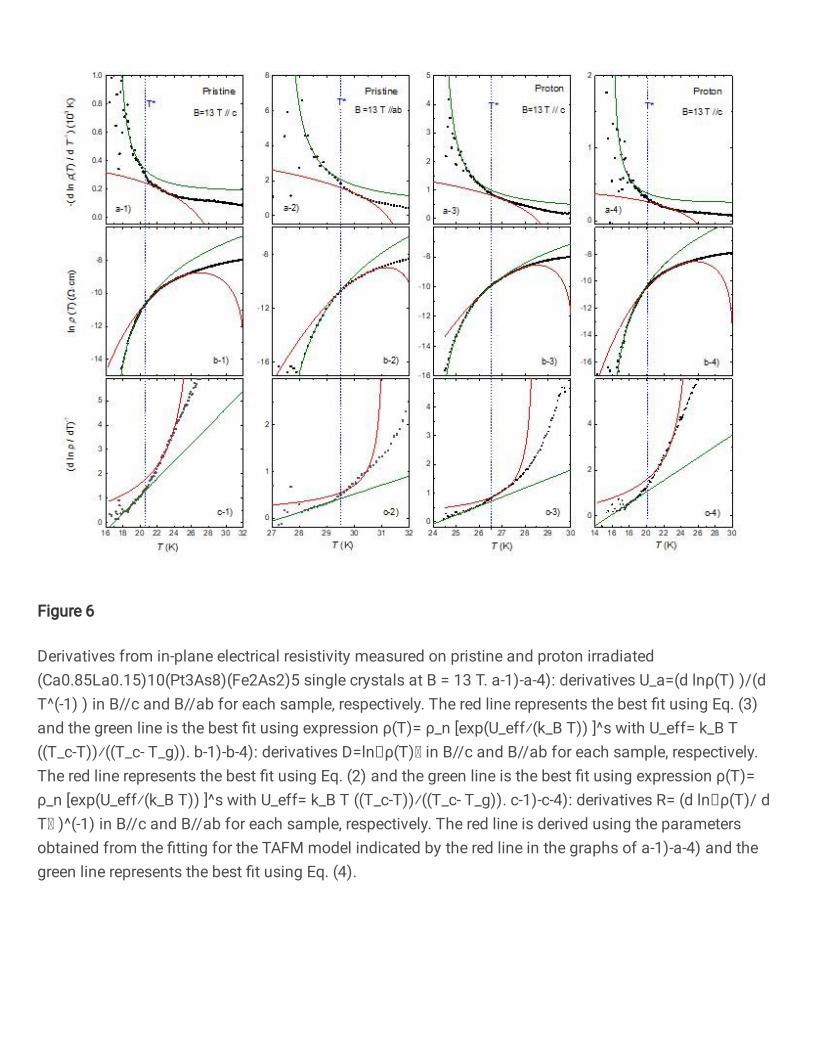
Figure 6
Derivatives from in-plane electrical resistivity measured on pristine and proton irradiated(Ca0.85La0.15)10(Pt3As8)(Fe2As2)5 single crystals at B = 13 T. a-1)-a-4): derivatives U_a=(d ln ρ(T) )/(dT^(-1) ) in B//c and B//ab for each sample, respectively. The red line represents the best t using Eq. (3)and the green line is the best t using expression ρ(T)= ρ_n [exp (U_eff⁄(k_B T)) ]^s with U_eff= k_B T((T_c-T))⁄((T_c- T_g)). b-1)-b-4): derivatives D=ln ρ(T) in B//c and B//ab for each sample, respectively.The red line represents the best t using Eq. (2) and the green line is the best t using expression ρ(T)=ρ_n [exp (U_eff⁄(k_B T)) ]^s with U_eff= k_B T ((T_c-T))⁄((T_c- T_g)). c-1)-c-4): derivatives R= (d ln ρ(T)/ dT )^(-1) in B//c and B//ab for each sample, respectively. The red line is derived using the parametersobtained from the tting for the TAFM model indicated by the red line in the graphs of a-1)-a-4) and thegreen line represents the best t using Eq. (4).
Figure 7
(a) to (d) represent the temperature dependence of U_a=(d ln ρ(T) )/(d T^(-1) ) for various magnetic eldswith B//c and B//ab in pristine and proton irradiated (Ca0.85La0.15)10(Pt3As8)(Fe2As2)5 single crystals,respectively. The red line represents the best t using Eq. (3) and the green line represents the best tusing expression ρ(T)= ρ_n [exp (U_eff⁄(k_B T)) ]^s with U_eff= k_B T ((T_c-T))⁄((T_c- T_g)).
Figure 8
Magnetic eld dependence of thermal activation energy U_0 (B) in magnetic ux motion for B//c andB//ab in pristine and proton irradiated (Ca0.85La0.15)10(Pt3As8)(Fe2As2)5 single crystals. The blackand blue lines represent the linear tting result of U_0 (B) obtained from pristine samples, and the red andgreen lines are visually drawn to see the trend of U_0 (B). The inset shows the magnetic eld dependenceof the parameter ρ_c (B) included in Eq. (2) for the pristine and proton irradiated single crystals in B//cand B//ab.
Figure 9
(a) to (d) represent D=ln ρ (T) vs. 1/T plots for various magnetic elds with B//c and B//ab in pristineand proton irradiated (Ca0.85La0.15)10(Pt3As8)(Fe2As2)5 single crystals, respectively. The red linerepresents the best t using Eq. (2) and the green line is the best t using expression ρ(T)= ρ_n[exp (U_eff⁄(k_B T)) ]^s with U_eff= k_B T ((T_c-T))⁄((T_c- T_g)).
Figure 10
The temperature dependence of R= (d ln ρ(T)/ d T )^(-1) at different magnetic elds in B//c and B//abfor (a)-(b) pristine and (c)-(d) proton irradiated (Ca0.85La0.15)10(Pt3As8)(Fe2As2)5 single crystals. Thegreen line represents the best tting using Eq. (4).
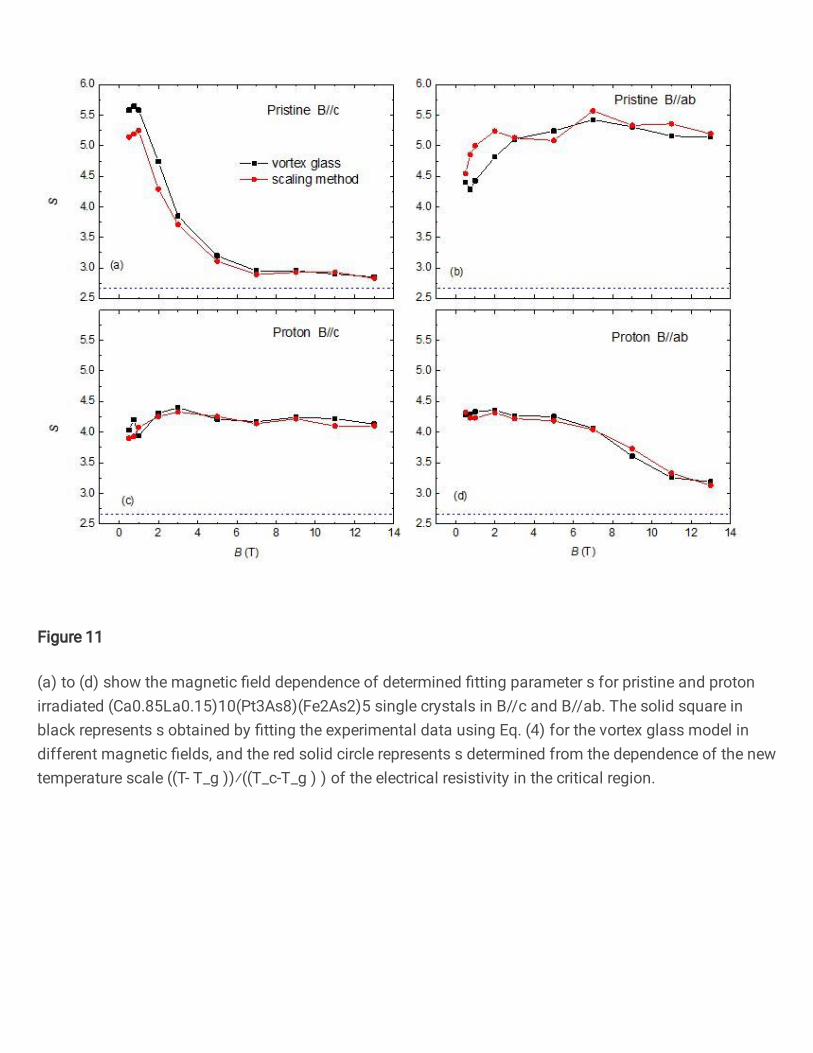
Figure 11
(a) to (d) show the magnetic eld dependence of determined tting parameter s for pristine and protonirradiated (Ca0.85La0.15)10(Pt3As8)(Fe2As2)5 single crystals in B//c and B//ab. The solid square inblack represents s obtained by tting the experimental data using Eq. (4) for the vortex glass model indifferent magnetic elds, and the red solid circle represents s determined from the dependence of the newtemperature scale ((T- T_g ))⁄((T_c-T_g ) ) of the electrical resistivity in the critical region.
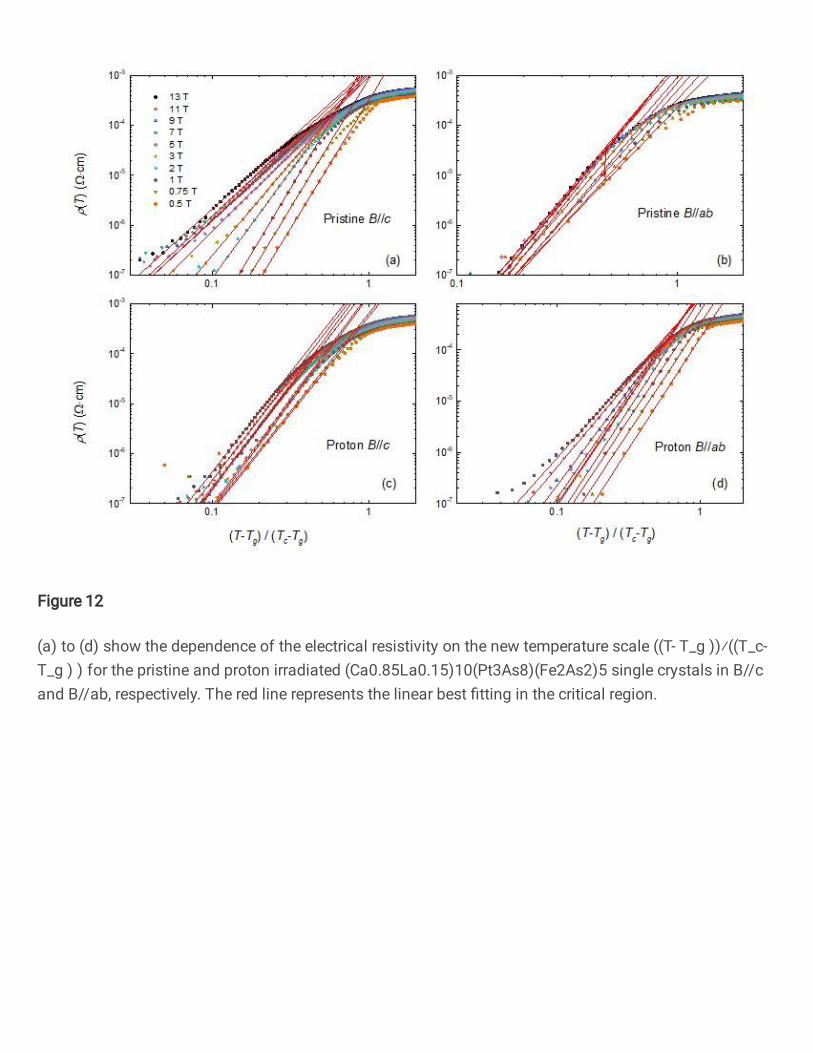
Figure 12
(a) to (d) show the dependence of the electrical resistivity on the new temperature scale ((T- T_g ))⁄((T_c-T_g ) ) for the pristine and proton irradiated (Ca0.85La0.15)10(Pt3As8)(Fe2As2)5 single crystals in B//cand B//ab, respectively. The red line represents the linear best tting in the critical region.