1. INTRODUCTION: SENSITIVITY TO THEPOLARIZED LIGHT ENVIRONMENTThe ability to detect linearly polarized light is called po-larization sensitivity, and this facet of vision has beenwell described in a variety of vertebrates.1–8 Much of theresearch has focused on polarization sensitivity in differ-ent species of teleost fishes, in particular members of thefamily Salmonidae.9–13 In salmonids, there is conclusiveevidence that the ultraviolet-sensitive (UVS), mid-wavelength sensitive (MWS), and long-wavelength sensi-tive (LWS) cones are involved in polarization sensitivity,whereas the rods and short-wavelength sensitive (SWS)photoreceptors are not. Neuronal coding of polarizationinformation is also evident in single-unit recordings of theoptic nerve and in the torus semicircularis of the centralnervous system.9,10 However, the biophysical mecha-nism by which the plane of polarization is analyzed by thecone photoreceptors is still not clearly understood, al-though models do exist.13
In order to understand the basis for how the UVS,MWS, and LWS cones relay polarization information, oneneeds to know specifically how polarized light interactswith individual photoreceptors. It has been assumedthat in general, all teleost photoreceptors are not linearlydichroic to axial propagating polarized light8,14,15 becauseof the rotational diffusion of the chromophores within thephotopigment-containing membranes.16,17 However, dif-fusion measurements have been reported only for non-polarization-sensitive rod photoreceptors and not for theUVS, MWS, and LWS classes of cones known to mediatepolarization sensitivity in salmonids.9,10
In this study, we present a comparative analysis of rod
and cone photoreceptors from the species coho salmon(Oncorhynchus kisutch) that examines transverse absorp-tion of linearly polarized light. Polarization microspec-trophotometry (PMSP) has been shown to be one of themost versatile techniques for the quantitative investiga-tion of how single photoreceptor cells absorb polarizedlight.18–23 It is well known that when a photoreceptor isilluminated from the side, owing to the stacked mem-brane structure of the outer segment, light polarized par-allel to the transverse axis of the photoreceptor outer seg-ment is preferentially absorbed relative to light polarizedperpendicular to the transverse axis.18,19,24–27 Conse-quently, comparison between the absorbance spectra forparallel and perpendicular polarized light provides infor-mation regarding the spatial orientation of the visual pig-ment molecules within outer-segment disk membranes.For example, ratios of absorbance perpendicular and par-allel to the transverse axis of the photoreceptor (definedas the dichroic ratio by Harosi and Malerba28) have beenmeasured in a variety of species.18,19,24,27,29 In this study,we report the magnitude of absorbance with respect to theangle between the E-vector (the principal direction inwhich the electric field vibrates) and the transverse axisof the outer segment. Throughout this paper, this anglewill be referred to as the polarization angle f. We evalu-ate the results for significant differences between the op-tical properties of rods and cones through the polarizationangle that yields the maximum absorbance.
2. MATERIALS AND METHODSA. Samples and Experimental ApparatusSpectral absorbance measurements of photoreceptorswere collected from eighteen O. kisutch obtained from the
2004 Optical Society of America
336 J. Opt. Soc. Am. A/Vol. 21, No. 3 /March 2004 Roberts et al.
Robertson Creek Hatchery (Department of Fisheries andOceans, Government of Canada). All fish were at theparr stage with a mean body mass and size (61 standarddeviation) of 10.2 6 3.2 g and 9.3 6 1.7 cm, respectively.The fish were maintained on a 12:12 h light:dark photo-period and at a temperature of 15 °C. All care and han-dling procedures were in accordance with the Universityof Victoria Animal Care Committee under the auspices ofthe Canadian Council on Animal Care Guidelines.Sample preparations and experimental measurementswere carried out at 17 °C in a dark room with dim, deep-red illumination. All fish were first dark adapted for 1 hbefore being sacrificed by prolonged anesthesia with 100mg l21 Euganol (ICN Biochemicals Inc., Irvine, Calif.) un-til euthanized. Both eyes were then removed from thefish, each eye was hemisected, and retina was removed inMinimal Essential Media (Sigma) under infrared light.The dorsal half of the retina was teased apart onto a 353 50 mm, No. 1 glass microscope coverslip. Throughthe process of teasing apart the retinal pieces, individualphotoreceptors became free from the retina, allowing theabsorbance of single photoreceptors to be measured withno overlap from other spectral classes of receptors, a situ-ation that often occurs when photoreceptors are normallymixed in the retina. A second similar microscope cover-slip was placed on top of the sample, and the edges weresealed with paraffin wax.
Microspectrophotometry (MSP) and PMSP are experi-mental techniques regularly used for the measurement ofspectral absorbance in the outer segments of vertebratephotoreceptors. Most if not all the MSP techniques cur-rently in use are designed to make two measurements ofthe spectral transmittance: one through the outer seg-ment of the photoreceptor and the other (the referencespectrum) through a clear area adjacent to the photore-ceptor under investigation. The absorbance can be sim-ply calculated as the decadic logarithm of the ratio ofthese two measurements. By polarizing the measure-ment beam for PMSP, one can obtain further informationabout the absorbance geometry as described in Section 1.Detailed descriptions of the MSP protocols and samplepreparations used in this work have been publishedelsewhere,23 and what follows gives only a brief descrip-
Fig. 1. Schematic diagram of the CCD microspectrophotometer.BI, back illumination; BS, beam splitter; C, 52x reflective objec-tive as the condenser; CCD, charge-coupled device camera;COMP, custom computer software; FO, fiber optic cable; GTP,Glan-Thompson polarizer; IRF, infra-red filter; LS, Xenon lamplight source; OBJ, objective lens; S, sample; SH, shutter; SIR,infra-red filter mounted on a swing arm; SPEC, spectrograph;VA, X –Y variable aperture; XYS, X –Y stage.
tion. Figure 1 sets out a schematic diagram of the PMSPapparatus. The measurement beam was produced by a150-W Xenon light source (Oriel), which was coupled via acondenser assembly and optical fiber into an inverted mi-croscope body (Zeiss). Within the condenser assembly, aninfrared filter (Schott RG850, Ealing Optics) wasmounted onto an electronically controlled swing arm.Placing this filter in the beam path allowed visible wave-lengths to be filtered out for aligning the measurementbeam onto the photoreceptor outer segment. Further, anelectronic shutter was included to control the exposuretime during measurements, and a feedback light-intensity controller (Oriel) was also present to maintainthe intensity at the same level between the reference andsample measurements.
The measurement beam passed through an x –y adjust-able aperture, where typically the aperture reduced thebeam size to approximately 2 3 2 mm in the focal plane.Background illumination was produced by the 12-V,100-W halogen lamp of the microscope. Again, an infra-red filter (Schott RG850, Ealing Optics) was placed in thelight path to permit viewing of the sample without bleach-ing. The measurement beam and the background illumi-nation were combined by use of an Inconel coated 50%beam splitter and were imaged onto the sample via a re-flecting objective (523, 0.65 N.A., Ealing Optics) con-denser. We employed a reflecting objective to compen-sate for chromatic aberration. The image was alsoviewed in real time via an infrared CCD camera (Cana-dian Photonics Laboratory) mounted on the microscopetrinocular. A modification to the MSP protocol detailedin Ref. 23 was the inclusion of a rotatable Glan–Thompson polarizer immediately preceding the condenserassembly. The axis of the polarizer was calibrated withrespect to the image orientation on the computer, allow-ing digital calculation (61°) of the required polarizationmeasurement angle. Polarizers such as the Glan–Thompson type are limited by the small acceptance anglefor which high degrees of polarization are produced. Inthe apparatus used, the large ratio of path length to beamsize ensured that the maximum angle of incidence ontothe polarizer fell within the acceptance limits. Through-out the experiment, absorbance values were measured atdifferent polarization angles through the rotation of thepolarizer. A 0.5-mm resolution, computer-controlled, mo-torized stage was used for positioning the sample relativeto the measurement beam. The objective lens used was aglycerine immersion Zeiss Ultrafluar (1003, 1.20 N.A., in-finity corrected). The objective imaged the measurementbeam through a spectrograph (Acton Research), wherethe light was dispersed by the grating (300-nm blazing,1200 lines/mm) allowing measurement of the 300–800-nm spectral range onto a back-illuminated cooledCCD detector (PI 1340 3 400 pixel CCD array with four-stage Peltier cooler (250 °C) (Princeton Instruments,Roper Scientific). All measurements were made with a0.5-s exposure time.
B. Experimental Measurement Geometry and AnalysisProtocolsIn this investigation, the transverse polarization absor-bance of all classes of photoreceptors in O. kisutch were
Roberts et al. Vol. 21, No. 3 /March 2004/J. Opt. Soc. Am. A 337
measured as a function of the angle between the E-vectorand the transverse axis of the photoreceptor outer seg-ment. To reiterate, this angle will be referred to as thepolarization angle f. An illustration of this measure-ment geometry is given in Fig. 2, where differentE-vectors, labeled by the polarization angle, are incident(z direction) on a photoreceptor.
The absorbance A was calculated by the formula A5 log10(IR /IM), where IR is the intensity transmitted bythe clear medium in the vicinity of the photoreceptor (ref-erence) and IM is the intensity transmitted by thephotoreceptor.24 In order to relate the measured absor-bance spectra from different polarization angles, we hadto account for any effects of inherent polarization in themeasurement beam and polarization effects of the diffrac-tion grating. This was achieved by normalizing the ref-erence transmission spectrum to the long-wavelengthlimb (750–800 nm) of measured transmission spectrumfor the outer segment. Once the absorbance spectra werecalculated, spectra acceptance criteria were used as docu-mented by Hawryshyn et al.23 Accepted data were firstsmoothed by a 25-point adjacent averaging and then fit-ted by using a nonlinear least-squares routine(Levenberg–Marquardt algorithm), utilizing the weightedA1/A2 averaged Govardovskii template.22 The least-squares routine allowed the calculation of the maximumabsorbance value, the wavelength of maximum absor-bance plus the associated errors with thesemeasurements.30
For each photoreceptor examined, a series of six absor-bance spectra were measured at different polarizationangles, f 5 0°, 20°, 220°, 10°, 210°, and 0°, by the rota-tion of the polarizer. An important feature is that thissequence of measurements was the same for each photo-receptor examined, because an inherent limitation inmultiple measurements of spectral absorbance profiles ofany photoreceptor is photobleaching.31 The set sequenceof measurements thus facilitated the comparison of firstand final spectra measured at 0°. If the final value ofmaximum absorbance was more than two standard devia-tions (typically 5%) below the initial absorbance value,the photoreceptor was considered to be bleached or possi-bly to have moved from its original measurement posi-
Fig. 2. Technique of polarization microspectrophotometry(PMSP). A schematic diagram of the inner and outer segmentsof a vertebrate ciliary photoreceptor illustrating linearly polar-ized light incident on the outer segment in the experimentalmeasurement geometry. Different E-vectors are shown corre-sponding to the different labeled polarization angles f.
tion, and the data set was rejected. Here the standarddeviation on the fitted maximum absorbance was calcu-lated from the curvature matrix of the fitting routine.30
The sequence also proved that greater values of the maxi-mum absorbance at f 5 610° or 620° could not be a re-sult of bleaching. As a further control, a set of absor-bance measurements were made in the stated order fromboth a rod and an MWS-cone photoreceptor after their re-spective outer segments had been bleached. The resultsof this test showed that the bleached baseline absorbancemeasurement remained constant regardless of the polar-ization angle.
The following results are based on the measurementsfrom 32 rods and 48 cones (n 5 4 UVS cones, n 5 3 SWScones, n 5 22 MWS cones, and n 5 19 LWS cones) thatfitted the aforementioned criteria for acceptable absor-bance spectra relative to the polarization angle andbleaching.
3. RESULTSA. Polarization Absorbance in a Single PhotoreceptorTypical experimental absorbance spectra (solid lines)from individual photoreceptors are presented in Fig. 3, to-gether with the fits of the Govardovskii function (dashedcurves).22 To examine the relationship between the ab-sorbance spectra measured at different polarization
Fig. 3. Example PMSP absorbance spectra. Typical examplesof experimental absorbance spectra obtained from (a) a rod, (b) aUVS cone, (c) a SWS cone, (d) a MWS cone, and (e) a LWS cone.In all panels the solid curve represents the experimental dataand the dashed curve represents the fitted function of theweighted A1/A2 Govardovskii template.22
338 J. Opt. Soc. Am. A/Vol. 21, No. 3 /March 2004 Roberts et al.
angles, the six absorbance curves calculated from the fit-ted Govardovskii function were plotted on a single set ofaxes. Figures 4(a) and 4(b) illustrate two typical ex-amples of absorbance data sets at different polarizationangles for a single rod and LWS cone, respectively. Fromthese plots it is apparent that qualitatively, for these twophotoreceptors, the polarization angle that yields thegreatest value of absorbance is different. In Fig. 4(a) the
Fig. 4. Example polarization sets of fitted absorbance spectra.All curves represent the fitted functions of the weighted A1/A2Govardovskii template for (a) a rod and (b) a LWS-cone photore-ceptor. In (a) the maximum angle of absorbance F 5 0°, whichcorresponds to the E-vector parallel to the transverse axis of theouter segment. In (b) F lies at a different angle, between 210°and 220°. In both (a) and (b) the legend indicates the polariza-tion angle f.
Fig. 5. Maximum absorbance values of typical individual pho-toreceptors as a function of polarization angle f. Points corre-spond to experimental data and curves correspond to the fits asdescribed by Eq. (1). (a) In the rod, the angle of maximum ab-sorbance F 5 0°, parallel to the transverse axis of the outer seg-ment. (b) UVS cone, (c) SWS cone, (d) MWS cone, and (e) LWScone; the maxima of the fitted curves do not correspond to 0°, im-plying that F is not parallel to the transverse axis of the outersegment. The errors represent 61 standard deviation calcu-lated from the curvature matrix.31
polarization angle of maximum absorbance is 0° for therod, and in Fig. 4(b) it is between 210° and 220° for theLWS cone.
B. Polarization Angle of Maximum Absorbance in aSingle PhotoreceptorTo quantitatively investigate this difference, we analyzedeach photoreceptor separately with the maximum valuesof absorbance, calculated from each of the six fitted func-tions, plotted against their respective polarization angles.To measure the polarization angle of maximum absor-bance F, we fitted the theoretical absorbance,32
a 5 2log10@cos2~f 2 F!102amax 1 sin2~f 2 F!102amin#,
(1)
to the data again by using a nonlinear least-squares rou-tine. In Eq. (1), a is the measured absorbance, and amaxand amin are the maximum and the minimum absorbance,respectively. Figure 5 presents maximum absorbancevalue data for typical individual photoreceptors, completewith the fitted function of Eq. (1). The values of F de-duced from the fitting of Eq. (1) in Fig. 5 are presented inTable 1, and errors are quoted as the standard deviationcalculated from the curvature matrix.30 From the valuespresented in Table 1, it can be seen that there is a quan-titative difference in the value of F between the rod andcones (rod F ' 0° and for the cones F Þ 0°).
C. Differences in F between Rods and ConesFigure 6 illustrates the distributions in F for all the mea-sured rods and cones. A standard parametric (ANOVA)test was used to determine whether the mean value of thedistribution of F for the rods, mrod , was significantly dif-ferent from the mean value of F for the cones, mcone . Theresults of the test reveal a statistically significant differ-ence between mrod and mcone (F1,78 5 76.802, P , 0.001).A Tukey high-speed-data multiple comparison was alsoused to investigate for significant differences in the meanvalues of F between spectral classes of photoreceptors.The results of this test are presented in Table 2 and re-veal that mrod is significantly lower than mUVS cone ,mMWS cone , and mLWS cone (in all cases P , 0.001). Thereis no significant difference among the mean values of Fbetween different spectral classes of cones (P > 0.601)and between mrod and mSWS cone (P > 0.289). However, itshould be noted that the sample sizes for the UVS andSWS cone measurements were n 5 4 and n 5 3, respec-tively. Consequently, the powers of the tests for the com-
Table 1. Polarization Angles of MaximumAbsorbance, F, from Single Photoreceptors
a The values of F were obtained from the fitting routine and are 61standard deviation as calculated from the matrix of curvature.31
Roberts et al. Vol. 21, No. 3 /March 2004/J. Opt. Soc. Am. A 339
parisons between the UVS and SWS cones and other pho-toreceptors are ,0.2. This makes it difficult to assess thereal significance of these statistical data for the UVS andSWS cones, as there is a .80% chance of Type II error.However, the measurements of the UVS and SWS conesdid reveal that F was tilted to a greater angle in thesecones than for any of the more numerous rod measure-ments. This implies that the UVS and SWS classes haveoptical properties similar to those of the MWS and LWScones measured.
4. DISCUSSIONA. Distribution in the Polarization Angle of MaximumAbsorbanceThe results of this study illustrate that under transverseillumination the rods and cones of O. kisutch absorb po-larized light differently. The optical geometry appearssuch that the absorbance ellipsoid in the cones (and notthe rods) is tilted with respect to the transverse axis ofthe outer segment. However, for the following two rea-sons it is perhaps not immediately apparent what the ab-solute tilt angle of the cones is.
The first reason is that the sample preparation allowedthe photoreceptors to have rotational freedom about theirlong axes. Figure 7(a) is a schematic diagram of theouter segment of the rods (panels 1 and 2) and the cones
Fig. 6. Measured distribution in angle of maximum absorbanceF of all rods and cones analyzed. The normal distribution in Ffor all photoreceptors measured illustrates a significant differ-ence (ANOVA, F1,78 5 76.802, P , 0.001) between the mean val-ues of F for rods and cones. The result strongly suggests thatthe position of maximum absorbance in cones is tilted with re-spect to the cones’ primary axis.
Table 2. Probability Values from a Comparison(Tukey Test)a of Mean Values of F between All
a The statistical test was performed with SYSTAT 9.0.
(panels 3 and 4). For the nontilted case of the rods, theprojection of the absorbance ellipsoid into the plane of thewave front shows that the angle of F is invariant under a90° rotation (panels 1 and 2) of the outer segment aboutthe long axis. This agrees with the experimental data inFig. 6, where a narrow experimental distribution of F forthe rods is shown. However, for the cones the projectionof the absorbance varies under the 90° rotation about thelong axis, from F 5 the absolute tilt angle (panel 3) to F5 0° (panel 4 of Fig. 7). Again, this is directly reflectedin the experimental distribution of the data shown in Fig.6, where the value of F for the cones varied from 2 6 1°to 25 6 3°. Therefore the orientational freedom of thephotoreceptor greatly influences the measurement of Fduring the experiment, and the absolute value of F for thecones must be toward the upper limit of the measured dis-tribution.
Fig. 7. Schematic diagrams of the absorbance ellipsoid in theouter segments of rods and cones. (a) Three-dimensional repre-sentation of the photoreceptor outer segments illustrating thechange in the projection of the absorbance into the plane of theincident wave front and F as a function of the outer segment’srotational degree of freedom. For the case of the rods, panel 1and 2 show the value of F to be invariant under the rotation ofthe outer segment. However, the value of F can be seen to varyfrom the actual tilt angle (panel 3) to F 5 0 (panel 4) for thecones. (b) In a plan view of (a), the ratio of magnitudes of theabsorbance vectors (arrows) parallel and perpendicular to thetransverse axis of the outer segment corresponds to the dichroicratio. As a direct result of the tilt, it can be seen that the di-chroic ratio will be smaller in cones (panels 3 and 4) than in rods(panels 1 and 2).
340 J. Opt. Soc. Am. A/Vol. 21, No. 3 /March 2004 Roberts et al.
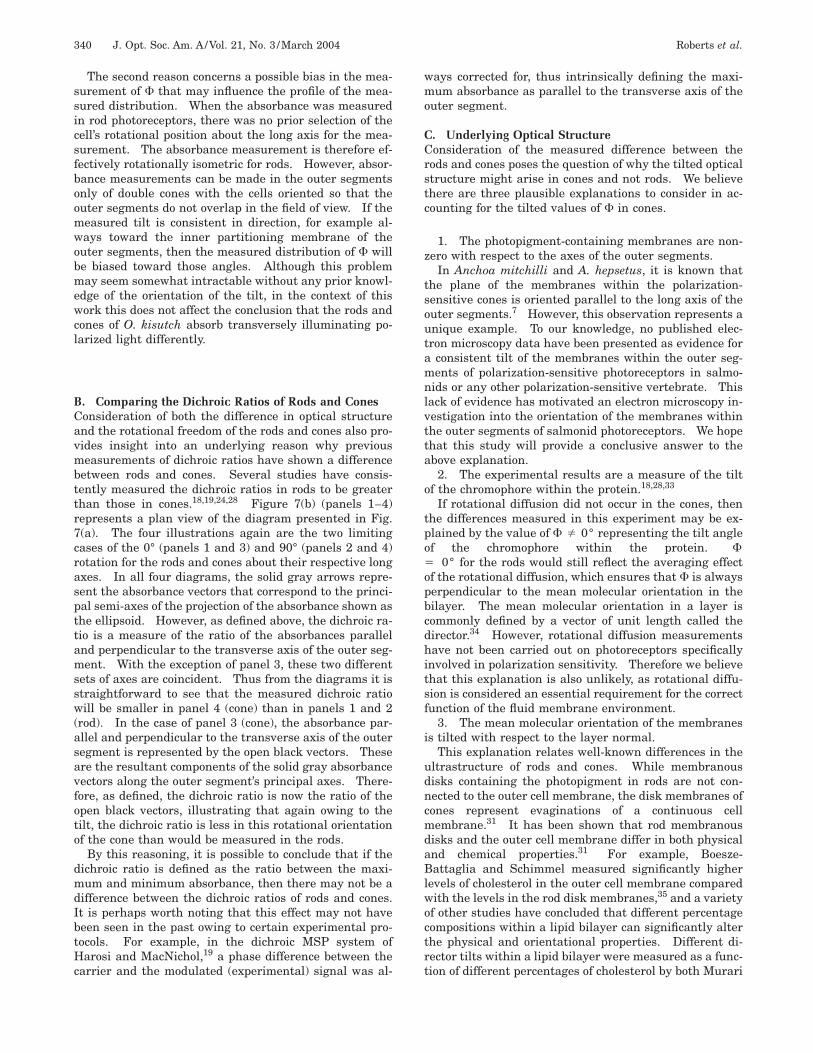
The second reason concerns a possible bias in the mea-surement of F that may influence the profile of the mea-sured distribution. When the absorbance was measuredin rod photoreceptors, there was no prior selection of thecell’s rotational position about the long axis for the mea-surement. The absorbance measurement is therefore ef-fectively rotationally isometric for rods. However, absor-bance measurements can be made in the outer segmentsonly of double cones with the cells oriented so that theouter segments do not overlap in the field of view. If themeasured tilt is consistent in direction, for example al-ways toward the inner partitioning membrane of theouter segments, then the measured distribution of F willbe biased toward those angles. Although this problemmay seem somewhat intractable without any prior knowl-edge of the orientation of the tilt, in the context of thiswork this does not affect the conclusion that the rods andcones of O. kisutch absorb transversely illuminating po-larized light differently.
B. Comparing the Dichroic Ratios of Rods and ConesConsideration of both the difference in optical structureand the rotational freedom of the rods and cones also pro-vides insight into an underlying reason why previousmeasurements of dichroic ratios have shown a differencebetween rods and cones. Several studies have consis-tently measured the dichroic ratios in rods to be greaterthan those in cones.18,19,24,28 Figure 7(b) (panels 1–4)represents a plan view of the diagram presented in Fig.7(a). The four illustrations again are the two limitingcases of the 0° (panels 1 and 3) and 90° (panels 2 and 4)rotation for the rods and cones about their respective longaxes. In all four diagrams, the solid gray arrows repre-sent the absorbance vectors that correspond to the princi-pal semi-axes of the projection of the absorbance shown asthe ellipsoid. However, as defined above, the dichroic ra-tio is a measure of the ratio of the absorbances paralleland perpendicular to the transverse axis of the outer seg-ment. With the exception of panel 3, these two differentsets of axes are coincident. Thus from the diagrams it isstraightforward to see that the measured dichroic ratiowill be smaller in panel 4 (cone) than in panels 1 and 2(rod). In the case of panel 3 (cone), the absorbance par-allel and perpendicular to the transverse axis of the outersegment is represented by the open black vectors. Theseare the resultant components of the solid gray absorbancevectors along the outer segment’s principal axes. There-fore, as defined, the dichroic ratio is now the ratio of theopen black vectors, illustrating that again owing to thetilt, the dichroic ratio is less in this rotational orientationof the cone than would be measured in the rods.
By this reasoning, it is possible to conclude that if thedichroic ratio is defined as the ratio between the maxi-mum and minimum absorbance, then there may not be adifference between the dichroic ratios of rods and cones.It is perhaps worth noting that this effect may not havebeen seen in the past owing to certain experimental pro-tocols. For example, in the dichroic MSP system ofHarosi and MacNichol,19 a phase difference between thecarrier and the modulated (experimental) signal was al-
ways corrected for, thus intrinsically defining the maxi-mum absorbance as parallel to the transverse axis of theouter segment.
C. Underlying Optical StructureConsideration of the measured difference between therods and cones poses the question of why the tilted opticalstructure might arise in cones and not rods. We believethere are three plausible explanations to consider in ac-counting for the tilted values of F in cones.
1. The photopigment-containing membranes are non-zero with respect to the axes of the outer segments.
In Anchoa mitchilli and A. hepsetus, it is known thatthe plane of the membranes within the polarization-sensitive cones is oriented parallel to the long axis of theouter segments.7 However, this observation represents aunique example. To our knowledge, no published elec-tron microscopy data have been presented as evidence fora consistent tilt of the membranes within the outer seg-ments of polarization-sensitive photoreceptors in salmo-nids or any other polarization-sensitive vertebrate. Thislack of evidence has motivated an electron microscopy in-vestigation into the orientation of the membranes withinthe outer segments of salmonid photoreceptors. We hopethat this study will provide a conclusive answer to theabove explanation.
2. The experimental results are a measure of the tiltof the chromophore within the protein.18,28,33
If rotational diffusion did not occur in the cones, thenthe differences measured in this experiment may be ex-plained by the value of F Þ 0° representing the tilt angleof the chromophore within the protein. F5 0° for the rods would still reflect the averaging effectof the rotational diffusion, which ensures that F is alwaysperpendicular to the mean molecular orientation in thebilayer. The mean molecular orientation in a layer iscommonly defined by a vector of unit length called thedirector.34 However, rotational diffusion measurementshave not been carried out on photoreceptors specificallyinvolved in polarization sensitivity. Therefore we believethat this explanation is also unlikely, as rotational diffu-sion is considered an essential requirement for the correctfunction of the fluid membrane environment.
3. The mean molecular orientation of the membranesis tilted with respect to the layer normal.
This explanation relates well-known differences in theultrastructure of rods and cones. While membranousdisks containing the photopigment in rods are not con-nected to the outer cell membrane, the disk membranes ofcones represent evaginations of a continuous cellmembrane.31 It has been shown that rod membranousdisks and the outer cell membrane differ in both physicaland chemical properties.31 For example, Boesze-Battaglia and Schimmel measured significantly higherlevels of cholesterol in the outer cell membrane comparedwith the levels in the rod disk membranes,35 and a varietyof other studies have concluded that different percentagecompositions within a lipid bilayer can significantly alterthe physical and orientational properties. Different di-rector tilts within a lipid bilayer were measured as a func-tion of different percentages of cholesterol by both Murari
Roberts et al. Vol. 21, No. 3 /March 2004/J. Opt. Soc. Am. A 341
et al.36 and Macintosh.37 Also, the tilt angle of choles-terol was shown by Brzustowicz et al.38 to be a function ofthe bilayer composition. Therefore it is possible that dif-ferent molecular compositions of the rod and cone outersegment membranes may define the different orienta-tional and thus optical properties that have been mea-sured in this study.
D. Optical ModelingA clear limitation in this investigation of photoreceptorpolarization sensitivity is that under natural conditions,photoreceptor illumination is axial and not transverse asin the experimental geometry used here. To investigatethe effect the different optical geometries may have on theway the rods and cones absorb under axial illumination,we derived analytic solutions to Maxwell’s equations forthe tilted and nontilted outer segment structures. Ouranalysis is based on a 4 3 4 matrix approach, wellproven and commonly used in liquid-crystal physics formodeling the optics of complex anisotropic systems.39
Appendix A sets out the structure and derivation of thedielectric tensor used to represent the optical geometry ofthe outer segment under axial illumination.40 As is de-tailed in Appendix A, the formulation of a complex dielec-tric tensor for the system accounts for all aspects of thecomplex refractive indices,25,41–44 chromophore tilt,18,28,33
rotational diffusion,16,17 rotational degree of freedom ofthe photoreceptor as a whole, and the tilt of the plane ofabsorbance within the outer segments of the cones mea-sured in this study. For many years, there has beenmuch debate over the value of the refractive indices ofvertebrate outer segments, and Harosi24 and Liebman25
have both presented detailed reviews on the subject.While the value of the linear birefringence is generally ac-cepted as approximately 0.002, Liebman25 points out thatthis value is for the whole cell and does not take into ac-count the individual refractive indices of the membranesand surrounding isotropic cytoplasm. Thus, taking thisinto account, Liebmann25 calculated the membrane bire-fringence to be approximately 0.02. In the calculationspresented below, n i and n' are defined as the anisotropicrefractive indices parallel and perpendicular to the direc-tor of the internal membranes and nexternal as the refrac-tive index of the cytoplasmic space. The refractive indi-
ces used were40,41 n i 5 1.486, n' 5 1.464, and nexternal5 1.365. There is less evidence in the literature for thewavelength dependence of the complex part of the refrac-tive index. In these calculations, the form of this com-plex parameter was described as a function of wave-length, in line with the results of Stavenga and Bethold43
and Chance et al.44 The chromophore tilt angle was cho-sen to be 16°, as detailed by several authors,18,28,33 andthe tilt angle of the absorbance ellipsoid 5 15° for thecase of the cone. The estimate of this angle was consid-ered to represent a conservative value based on the ex-perimental distribution of F.
Calculations of the absorbance spectra of two axial or-thogonal polarized beams incident on a rod and MWScone outer segment are presented in Figs. 8(a) and 8(b),respectively. The directions of the E-vectors are modeledsuch that for the two cases, they are respectively paralleland perpendicular to the plane of incidence containingthe director. It can be seen that while the two polariza-tion directions result in the same absorbance for the rod,the tilt of the plane of absorbance causes the cone to beintrinsically linearly dichroic. Figure 8(c) illustrates thiseffect more clearly. The absorbance of the MWS cone isplotted at lmax as a function of the rotational angle of lin-ear incident polarization. Here 0° corresponds to theE-vector parallel to the plane of incidence containing thedirector. The results in Fig. 8(c) show that there is ap-proximate 10% difference between the absorbance of or-thogonal axially propagating linear polarized light.
On its own, intrinsic axial dichroism of individual pho-toreceptors does not constitute a mechanism for polariza-tion vision. Both Wehner45 and Coughlin andHawryshyn46 set out three stages of processing consid-ered necessary for a polarization vision system: (1) a bio-physical mechanism of differential polarization absorp-tion at the level of the photoreceptor, (2) opponent inputat the internuronal level to discriminate different polar-izations, and (3) a higher level of processing allowing ananimal to integrate this information with other sensoryinputs for complex visual tasks. The idea of intrinsicaxial dichroism reported here relates to the first stage ofthis hierarchy. If the membrane tilt within each indi-vidual outer segment were orientated in the same direc-tion within each outer segment, then the square cone mo-saic in the salmonid retina would provide several
Fig. 8. Calculated absorbances from the solutions to Maxwell’s equations for an axially illuminated (a) rod and (b) and (c) cone photo-receptor. (a) The absorbance spectra of the modeled rod showing the absorbance of two orthogonal polarizations corresponding to theE-vector parallel (dashed curve) and perpendicular (solid curve) to the plane of incidence which contains the director. Clearly, the twoabsorbance curves overlap, indicating no dichroic absorbance. (b) In the case of a MWS cone the absorbance now differs as a functionof the incident polarization. Symbols are as in (a). The modulation in the absorbance at lmax is shown in (c). An approximate 10%difference in the absorbance as a function of E-vector orientation shows the intrinsic axial polarization sensitivity of the cone outer seg-ment.
342 J. Opt. Soc. Am. A/Vol. 21, No. 3 /March 2004 Roberts et al.
overlapping spectral channels of differential polarizationinput, fulfilling the requirement for the unambiguous de-termination of E-vector orientation. Further work is cur-rently underway with the aim of investigating thismechanism by measuring axial absorbance of individualphotoreceptors under full control of the measurement ge-ometry with an optical trapping system. Further work isalso focusing on understanding the various aspects in theneural processing of both spectral and polarization infor-mation in salmonids at the level of the horizontal and bi-polar cells in the outer plexiform layer. This level of pro-cessing is the link between the stages 1 and 2 of apolarization vision system outlined above. It could alsobe suggested that the biophysical mechanism of differen-tial absorption proposed here could be applicable to awide range of vertebrates, providing a similar unifyingmechanism of polarization sensitivity as exists for inver-tebrates. However, it should also be noted that the re-quired square cone mosaics in the retina, while commonin many species of teleost, are not a typical feature in rep-tilian or avian retinas, groups known to containpolarization-sensitive members.
E. Context of These Results with Respect to PreviousElectrophysiological RecordingsAlthough all double cones were free to rotate about theirrespective long axes within the sample preparation, thestructure of the cell dictates that absorbance measure-ments can be made only when the outer segment underinvestigation is not overlapping or being overlapped bythe neighboring outer segment. Each outer segment isalso not allowed to rotate independently with respect toits neighbor. The Tukey test (Table 2) illustrated thatthere was no significant difference (P 5 1.00) betweenthe values of F for the MWS and LWS outer segments.In a square ordered mosaic, these results would implythat the MWS and LWS outer segments of a single doublecone would exhibit the same sensitivity to polarized light.With similar neural wiring of both spectral channels, thismay be in agreement with previous studies of the MWSand LWS OFF responses from multiunit recordings in theoptic nerve.46 In this work it was found that the MWSand LWS spectral channels share the same function of po-larization sensitivity, both exhibiting a maximum re-sponse to horizontally polarized light.
It is also known from several electrophysiological stud-ies that while the UVS, MWS, and LWS channels exhibitpolarization sensitivity, the SWS channel does not.9,10
Solely on the basis of the measurements and the calcula-tions in the current study, the measured tilt in SWS conesdoes imply that the SWS class could also exhibit a differ-ential response to axial illuminating polarized light.However, this fact is not necessarily in contradiction withthe electrophysiological recordings. Although the mea-surements in single units of the optic nerve reveal thatthe SWS cones do not mediate polarization sensitivity,these measurements are made at a considerably laterstage of neural processing than the MSP measurements.It is possible that any differential response of the cones isnegated in some way by the neural processing.
5. CONCLUSIONSTo our knowledge, this is the first report of significant dif-ferences between the way rod and cone photoreceptors ab-sorb linearly polarized light. The results strongly sug-gest that the position of maximum absorbance in cones istilted with respect to the primary axes of the cell. Aplausible hypothesis was presented for the basis of thistilt, based on structural and compositional differences re-sulting in the different optical properties. Finally, ana-lytic solutions to Maxwell’s equations were deduced to in-vestigate the effect of the tilt on the absorbance underaxial illumination of the outer segment. The results ofthis part of the study suggest the possibility of axial di-chroism within the cone photoreceptors that specificallymediate polarization vision in salmonid fishes. However,further experimental work is required both to directlymeasure differential axial polarization absorbance and tostudy the implications of the interaction with other pos-sible mechanisms of polarization sensitivity.13 In gen-eral, it is possible that with the correct orientation of thistilt and spatial arrangement of the photoreceptors in theretina, axial dichroism of vertebrate photoreceptors mayprovide a similar unifying mechanism of polarization sen-sitivity that exists among many species of invertebrate.
APPENDIX A: VERTEBRATEPHOTORECEPTOR DIELECTRIC TENSORSAND SOLUTIONS TO MAXWELL’SEQUATIONSFor calculation of the absorbance of an anisotropic lay-ered structure, the complex dielectric tensor must first bederived for the system. The derivation that follows ex-amines the dielectric tensor of the vertebrate outer seg-ment under axial illumination. A similar derivation canbe made for a photoreceptor under transverse illumina-tion, with the corresponding change in the coordinate sys-tem and the dielectric tensor. The full description of theelectromagnetic theory presented here will be the subjectof a forthcoming paper.40 The following angles used todescribe the coordinate transformations are detailed inFig. 9.
Assuming that the absorption along the long axis of thechromophore is very much greater than along the othertwo orthogonal axes,47 the absorption tensor of the chro-mophore is given by
eaxial 5 F a 0 0
0 0 0
0 0 0G , (A1)
where a represents the imaginary part of the dielectricconstant. The chromophore resides at an angle u to theprincipal axis of the opsin protein, where u is known to beapproximately 16° in vertebrate photoreceptors.18,28,33
Therefore rotating the chromophore frame of referenceinto that of the protein gives
eaxial~u! 5 Raxial~u!eaxialRaxial21 , (A2)
Roberts et al. Vol. 21, No. 3 /March 2004/J. Opt. Soc. Am. A 343
where
Raxial~u! 5 F cos u 0 2sin u
0 1 0
sin u 0 cos uG . (A3)
Multiplying out Eq. (A2) and including the real dielectricconstants of the protein frame of reference produces theresult that the full dielectric tensor becomes
eaxial~u! 5 F e1 1 a cos2 u 0 a sin u cos u
0 e2 0
a sin u cos u 0 e3 1 a sin2 uG ,
(A4)
where e i and i 5 1, 2, 3, represent the three real dielec-tric constants and in a uniaxial system, as is being con-sidered here, e1 5 e2 . Several rotational degrees of free-dom can now also be accounted for with similar rotationaltransformations. With reference to the angles defined inFig. 9, the rotational diffusion of the system j, the bilayertilt g, and the rotational degree of freedom for the wholeouter segment around the system’s long axis t (in Fig. 9this is the rotation from the x8, y8, z axis system to the x,y, z system) can be included in the dielectric tensor bytransformations similar to those in Eq. (A3) to give
eaxial~t, g, j, u! 5 F AA BB DD
BB CC EE
DD EE FFG , (A5)
where the substitutions used are
a 5 ~e1 1 a cos2 u!cos2 j 1 e2 sin2 j,
b 5 ~e1 2 e2 1 a cos2 u!cos j sin j,
c 5 ~e1 1 a cos2 u!sin2 j 1 e2 cos2 j,
d 5 a sin u cos u cos j,
e 5 a sin u cos u sin j,
f 5 e3 1 a sin2 u,
A 5 a cos2 g 2 2d cos g sin g 1 f sin2 g,
B 5 b cos g 2 e sin g,
Fig. 9. Coordinate system used in the construct of the dielectrictensor. Principal axes of the dielectric ellipsoid represent thesemi-axes of the uniaxial optical structure. Labeled anglesshow the parameters used for the transformation from the mo-lecular to the laboratory frame of reference.
C 5 c,
D 5 d cos2 g 2 d sin2 g 1 ~a 2 f !cos g sin g,
E 5 b sin g 1 e cos g,
F 5 a sin2 g 1 2d cos g sin g 1 f cos2 g,
AA 5 A cos2 t 2 2B cos t sin t 1 C sin2 t,
BB 5 B cos2 t 2 B sin2 t 1 ~A 2 C !cos t sin t,
CC 5 A sin2 t 1 2B cos t sin t 1 C cos2 t,
DD 5 D cos t 2 E cos t,
EE 5 D sin t 1 E cos t,
FF 5 F. (A6)
From the construction of the complex dielectric tensor,Maxwell’s equations can be solved by using a standard 43 4 matrix approach. The individual steps of this tech-nique can be found in several texts (for example, for aderivation in S.I. units see Ref. 48) and therefore will notbe set out in full in this appendix. An analytic solutionfor the optical tensor of a single-layer system under axialillumination can be found as
D 5 30 1 0 0
AA 2DD2
FF0 BB 2
DD 3 EE
FF0
0 0 0 1
BB 2DD 3 EE
FF0 CC 2
EE2
FF04 .
(A7)
For correct modeling of the outer segment of the photore-ceptor, the multiple layer structure must be accounted for.The way this is incorporated into the model differs de-pending on whether the photoreceptor is illuminatedtransversely or axially. Under axial illumination, a lay-ered structure can easily be modeled through a successivemultiplication of the optical tensor with an isotropic di-electric tensor defining each surrounding intracellularspace to calculate the overall optic tensor. This also al-lows for the rotational diffusion to be included in themodel, the value of j being set simply with a random-number generator (between the limits of 0 and 360°) fromone anisotropic layer to the next. By consideration of theboundary conditions, three generalized field vectors of theexternal incident, transmitted, and reflected waves can berelated to the internal electric-field components. This al-lows the calculation of the 2 3 2 complex amplitudetransmission and reflection matrices, the determinationof which completes the problem.
ACKNOWLEDGMENTSThe authors thank Robertson Creek Hatchery (Depart-ment of Fisheries and Oceans, Canada) for supplying theexperimental animals and J. Lydon for very helpful dis-
344 J. Opt. Soc. Am. A/Vol. 21, No. 3 /March 2004 Roberts et al.
cussions at the outset of this study. This research wassupported by a travel fellowship to N. W. Roberts from theJournal of Experimental Biology, operating and equip-ment grants to H. F. Gleeson from the Engineering andPhysical Sciences Research Council of Canada, and to C.W. Hawryshyn from the Natural Sciences and Engineer-ing Research Council of Canada.
REFERENCES1. M. J. Freake, ‘‘Evidence for orientation using the e-vector
direction of polarised light in the sleepy lizard Tiliqua rug-osa,’’ J. Exp. Biol. 202, 1159–1166 (1999).
2. K. Adler and J. B. Phillips, ‘‘Orientation in a desertlizard (Uma notata): time-compensated compass move-ment and polarotaxis,’’ J. Comp. Physiol. A 156, 547–552(1985).
3. D. H. Taylor and K. Alder, ‘‘Spatial orientation by sala-manders using plane polarised light,’’ Science 181, 285–287(1973).
4. K. P. Able, ‘‘Skylight polarization patterns at dusk influencemigratory orientations in birds,’’ Nature 299, 550–551(1982).
5. J. B. Phillips and F. R. Moore, ‘‘Calibration of the sun com-pass by sunset polarized patterns in a migratory bird,’’ Be-hav. Ecol. Sociobiol. 31, 189–193 (1992).
6. C. W. Hawryshyn and W. N. McFarland, ‘‘Cone photorecep-tor mechanisms and the detection of polarized light in fish,’’J. Comp. Physiol. 160, 459–465 (1987).
7. B. A. Fineran and J. A. C. Nicol, ‘‘Studies on the photore-ceptors of Anchoa mitichilli and A. hepsetus (Engranlidae)with particular reference to the cones,’’ Philos. Trans. R.Soc. London Ser. B 283, 25–60 (1978).
8. T. H. Waterman, ‘‘Natural polarised light and e-vector dis-crimination by vertebrates,’’ in Light as an Ecological Fac-tor II (Blackwell, Oxford, UK, 1975), pp. 305–335.
9. D. C. Parkyn and C. W. Hawryshyn, ‘‘Spectral andultraviolet-polarization sensitivity in juvenile salmonids:a comparative analysis using electrophysiology,’’ J. Exp.Biol. 203, 1173–1191 (2000).
10. D. J. Coughlin and C. W. Hawryshyn, ‘‘A cellular basis forpolarized-light vision in rainbow trout,’’ J. Comp. Physiol. A176, 261–272 (1995).
11. C. W. Hawryshyn, M. G. Arnold, E. Bowering, and R. L.Cole, ‘‘Spatial orientation of rainbow trout to plane-polarised light: the ontogeny of e-vector discriminationand spectral sensitivity characteristics,’’ J. Comp. Physiol. A166, 566–574 (1990).
12. I. N. Flamarique and H. I. Browman, ‘‘Foraging and prey-search behaviour of small juvenile rainbow trout (Onco-rhynchus mykiss) under polarized light,’’ J. Exp. Biol. 204,2415–2422 (2001).
13. I. N. Flamarique, C. W. Hawryshyn, and F. I. Harosi,‘‘Double cone internal reflection as a basis for polariza-tion detection in fish,’’ J. Opt. Soc. Am. A 15, 349–358(1998).
14. A. W. Snyder, ‘‘Physics of vision in compound eyes,’’ inHandbook of Sensory Physiology VII/6A, H. Autrum, ed.(Springer-Verlag, Berlin, 1979), pp. 284–285.
15. M. F. Land and D. E. Nilsson, ‘‘Light and Vision,’’ in AnimalEyes (Oxford U. Press, Oxford, UK, 2002), pp. 29–31.
16. P. K. Brown, ‘‘Rhodopsin rotates in the visual receptormembrane,’’ Nature New Biol. 236, 35–38 (1972).
17. R. A. Cone, ‘‘Rotational diffusion of rhodopsin on thevisual receptor membrane,’’ Nature New Biol. 236, 39–43(1972).
18. P. A. Liebman, ‘‘In situ microspectrophotometric studies onthe pigments of single retinal rods,’’ Biophys. J. 2, 161–178(1962).
19. F. I. Harosi and E. F. MacNichol, Jr., ‘‘Dichroic microspec-trophotometer: a computer assisted, rapid, wavelengthscanning photometer for measuring the linear dichroism ofsingle cells,’’ J. Opt. Soc. Am. 64, 903–918 (1974).
20. E. R. Loew and H. J. A. Dartnall, ‘‘Vitamin A1 /A2-based vi-sual pigment mixtures in cones of the rudd,’’ Vision Res. 16,891–896 (1976).
21. J. M. Bowmaker, ‘‘Microspectrophotometry of vertebratephotoreceptors,’’ Vision Res. 24, 1641–1650 (1984).
22. V. I. Govardovskii, F. Fyhrquist, T. Reuter, D. G. Kuzmin,and K. Donner, ‘‘In search of the visual pigment template,’’Visual Neurosci. 17, 509–528 (2000).
23. C. W. Hawryshyn, T. J. Haimberger, and M. E. Deut-schlander, ‘‘Microspectrophotometric measurements of ver-tebrate photoreceptors using CCD-based detection technol-ogy,’’ J. Exp. Biol. 204, 2431–2438 (2001).
24. F. I. Harosi, ‘‘Microspectrophotometry and optical phenom-ena: birefringence, dichroism, and anomalous dispersion,’’in Vertebrate photoreceptor optics, J. M. Enoch and F. L.Tobey, Jr., eds. (Springer-Verlag, Berlin, 1981), pp. 337–397.
25. P. A. Liebman, ‘‘Birefringence, dichroism and rod outer seg-ment structure,’’ in Photoreceptor Optics, A. W. Snyder andR. Menzel, eds. (Springer-Verlag, Berlin, 1975), pp. 119–214.
26. A. G. Palacios, R. Strivastava, and T. H. Goldsmith, ‘‘Spec-tral and polarization sensitivity of photocurrents of am-phibian rods in the visible and ultraviolet,’’ Visual Neurosci.15, 319–331 (1998).
27. R. A. Weale, ‘‘On the linear dichroism of frog rods,’’ VisionRes. 11, 1373–1385 (1971).
28. F. I. Harosi and F. E. Malerba, ‘‘Plane polarized light in mi-crospectrophotometry,’’ Vision Res. 15, 379–388 (1975).
29. F. I. Harosi, ‘‘Linear dichroism of rods and cones,’’ in NATOAdvanced Study Institute Series, Series A: Life Sciences(Plenum, New York, 1975), pp. 55–65.
30. P. R. Bevington, Data Reduction and Error Analysis for thePhysical Sciences (McGraw Hill, New York, 1994), pp. 242–246.
31. A. I. Cohen, ‘‘Rods and cones,’’ in Handbook of SensoryPhysiology VII/2, M. G. F. Fuortes, ed. (Springer-Verlag,Berlin, 1972), pp. 63–110.
32. M. Born and E. Wolf, Principles of Optics, 7th expandeded. (Cambridge U. Press, Cambridge, UK, 1999), pp. 218–219.
33. G. Grobner, C. G. Burnett, A. Choi, J. Mason, and A. Watts,‘‘Observations of light-induced structural changes of retinalwithin rhodopsin,’’ Nature 405, 810–813 (2000).
34. P. Collings and M. Hird, Introduction to Liquid Crystals(Taylor & Frances, London, 1997), pp. 1–5.
35. K. Boesze-Battaglia and R. J. Schimmel, ‘‘Cell membranelipid composition and distribution: Implications for cellfunction and lessons learned from photoreceptors andplatelets,’’ J. Exp. Biol. 200, 2927–2936 (1997).
36. R. Murari, M. P. Murari, and W. J. Baumann, ‘‘Sterol orien-tations in phosphatidycholine liposomes as determined bydeuterium NMR,’’ Biochemistry 25, 1062–1067 (1986).
37. T. J. McIntosh, ‘‘The effect of cholesterol on the structure ofphosphatidycholine bilayers,’’ Biochim. Biophys. Acta 513,43–58 (1973).
38. M. R. Brzustowicz, W. Stillwell, and S. R. Wassall, ‘‘Molecu-lar organization in polyunsaturated phospholipid mem-branes: a solid state 2H NMR investigation,’’ FEBS Lett.451, 197–202 (1999).
39. D. Berreman, ‘‘Optics in stratified and anisotropic media:4 3 4-matrix formulation,’’ J. Opt. Soc. Am. 62, 502–510(1972).
40. N. W. Roberts and H. F. Gleeson, Department of Physics,University of Manchester, Manchester, M13 9PL, UK, arepreparing a manuscript to be called ‘‘The absorbance of po-larized light by vertebrate photoreceptors.’’
41. P. A. Liebman, W. S. Jagger, M. W. Kaplan, and F. G. Bar-goot, ‘‘Membrane structure changes in rod outer segmentsassociated with rhodopsin bleaching,’’ Nature 251, 31–36(1974).
Roberts et al. Vol. 21, No. 3 /March 2004/J. Opt. Soc. Am. A 345
42. J. N. Israelchvili, R. A. Sammut, and A. W. Snyder, ‘‘Bire-fringence and dichroism of photoreceptors,’’ Vision Res. 16,47–52 (1976).
43. D. G. Stavenga and H. H. van Barneveld, ‘‘On dispersionin visual photoreceptors,’’ Vision Res. 15, 1091–1095(1974).
44. B. Chance, R. Perry, L. Akerman, and B. Thorell, ‘‘Highlysensitive recording microspectrophotometer,’’ Rev. Sci. In-strum. 30, 735–741 (1959).
45. R. Wehner, ‘‘The hymenopteran skylight compass:
matched filtering and parallel coding,’’ J. Exp. Biol. 146,63–85 (1989).
46. D. J. Coughlin and C. W. Hawryshyn, ‘‘A cellular basis forpolarized-light vision in rainbow trout,’’ J. Comp. Physiol. A176, 261–272 (1995).
47. R. Mathies and L. Stryer, ‘‘Retinal has a dipolar verticallyexcited singlet state: implications for vision,’’ Proc. Natl.Acad. Sci. U.S.A. 73, 2169–2173 (1976).
48. R. M. A. Azzam and N. M. Bashara, Ellipsometry and Po-larised Light (Elsevier, Amsterdam, 1987), pp. 340–352.