DIFFERENT CONCEPTUAL FRAMEWORKS IN THE ASSESSMENT OF THE DEGREE OF INTERNATIONALISATION: EMPIRICAL ANALYSIS OF VARIOUS INDICES FOR THE TOP 100 TNCs Grazia Ietto-Gillies * This article analyses two different conceptual frameworks behind indices of the degree of internationalisation: one based on the home versus foreign dichotomy in the location of activities and the other based on the extent to which such activities are geographically spread among many countries. It introduces indices in the two frameworks as well as an attempt at combining the two. Estimates on the three sets of indices are given for the top 100 TNCs world wide, following the estimates of the UNCTAD WIRs on which the first framework is based. The results are analysed and some policy conclusions drawn. JEL F21-F23; Key words: Indices of internationalization; Transnational activities. * Professor of Applied Economics, South Bank University, London. I am grateful to K. Sauvant and to an anonymous referee of this journal for useful comments on an earlier version. Their comments have led to substantial rethinking and development of the paper. I have received useful comments also from H. Cox and M. Meschi. I would also like to thank P. Antonioni for assistance with the empirical work. A version of this paper was presented at the annual conference of the Academy of International Business (UK Chapter), City University Business School, London, 3-4 April, 1998.
Transcript
DIFFERENT CONCEPTUAL FRAMEWORKS IN THE ASSESSMENT OF THE
DEGREE OF INTERNATIONALISATION: EMPIRICAL ANALYSIS OF VARIOUS
INDICES FOR THE TOP 100 TNCs
Grazia Ietto-Gillies*
This article analyses two different conceptual frameworks behind indices of the degree
of internationalisation: one based on the home versus foreign dichotomy in the location
of activities and the other based on the extent to which such activities are geographically
spread among many countries. It introduces indices in the two frameworks as well as an
attempt at combining the two. Estimates on the three sets of indices are given for the top
100 TNCs world wide, following the estimates of the UNCTAD WIRs on which the first
framework is based. The results are analysed and some policy conclusions drawn.
JEL F21-F23; Key words: Indices of internationalization; Transnational activities.
* Professor of Applied Economics, South Bank University, London. I am grateful to K. Sauvant and to an
anonymous referee of this journal for useful comments on an earlier version. Their comments have led to
substantial rethinking and development of the paper. I have received useful comments also from H. Cox and M.
Meschi. I would also like to thank P. Antonioni for assistance with the empirical work. A version of this paper
was presented at the annual conference of the Academy of International Business (UK Chapter), City University
Business School, London, 3-4 April, 1998.
2
Introduction
The growing internationalisation of economic systems is a topic of considerable
interest in the economics and business literature. The transnational companies (TNCs) are
generally considered to be the agents most responsible for the internationalization process
and for cross-countries business integration in modern economies. There is no single way of
assessing the degree to which companies, industries or countries are internationalised: it all
depends on what patterns and aspects of internationalisation we choose to emphasise and
what variables we consider relevant for expressing those patterns and aspects.
Many authors have developed indices of internationalisation as simple, synthetic
measures of companies’ activities across countries. Sometimes indices are considered as
proxies for structural features of companies, sometimes they are used as explanatory
variables for their performance. In order to arrive at indices, some authors focus on a single
variable - such as sales or assets or employment or profits or R&D - others develop
multidimensional, composite indices. Dunning and Pearce, 1981 develop a widely-used
unidimensional index based on companies’ sales; Dunning, 1996 uses three unidimensional
indices based on assets, employment and R&D. Sullivan, 1994 constructs a composite five-
dimensional index based on “sales”, “profits”, “assets”, “Top Managers’ International
Experience” and “Psychic Dispersion of International operations.”1 UNCTAD, DTI, 1995,
1996 and 1997 publish both a composite tridimensional index and the data related to its
components (assets, sales and employment).
The various indices mentioned above differ: in (a) the type of variable(s) used to
represent TNCs’ activities and (b) the dimensionality of the index in terms of the number of
variables it incorporates; in other words, whether the index is constructed with one
dimension/variable only or with more than one.
Nonetheless all these indices have some basic, fundamental features in common. They
are all based on a micro/company focus though it is possible, in many cases to arrive at
aggregate industry and or country indicators from the micro data2. Moreover, all these
indicators have in common one basic element: the underlying conceptual framework behind
internationalisation. The concept of internationalisation which underpins them all is based on
the dichotomy foreign versus home production. Thus the indices are constructed as share of
activity(ies) that the company has abroad in relation to its total activity(ies). The activities are
represented by sales or assets or employment or R&D or profits or other. In some cases one
only of these variables is represented, in others a composite basket, usually aggregated
together as linear average with the same weights (Sullivan, 1994 and UNCTAD, DTCI, 1995-
1998)
This conceptual framework based on the dichotomy foreign versus home activities is
only one of the many possible frameworks for the measurement and assessment of the degree
of internationalisation. There are other possible frameworks within which internationalisation
can be conceptualised and operationalised. Among these are: the degree to which a
company’s activities are dispersed among the many countries of the world; the degree to
which they are concentrated in specific regions (such as one or more legs of the Triad or
developing versus developed countries). Each of these frameworks may be relevant for
explaining characteristics of companies/industries; it may also be useful for making
1 Sullivan’s work has given origin to a lively debate on the theoretical and statistical foundations of his
composite index (Ramaswamy, Kroeck and Renforth, 1996 and Sullivan, 1996) 2 Other indicators based on entirely macro elements are also used in the literature. For example, ratios of FDI
to Gross Domestic Capital Formation or to GDP as in many UNCTC/ UNCTAD publications; or ratio of the
sum of inward and outward FDI to GDCF as an indicator of multinational domination of national economies
(Ietto-Gillies, 1989).
3
predictions about the performance of TNCs or the effects of their activities on the industrial
and macroenvironment.
This paper focuses on a comparison of two different conceptual frameworks for
internationalisation: the framework based on the foreign/home dichotomy and the framework
based on the spread of activities among different countries of the world. It will stress how
behind the two frameworks are relevant conceptual elements regarding behaviour of
companies, their relationship with other economic players and the possible impact of their
activities on the macro economy. The analysis is conducted with reference to two specific
indices belonging to the two different frameworks: the UNCTAD Transnationality index
and the Network Spread index. An attempt is made at reconciling the two frameworks by
presenting a synthesis of the two in an index which I call Transnational Activities Spread
index.
The rest of the paper begins by introducing the two sets of indices related to the two
frameworks in sections two and three. Section four develops a combined framework and
presents related indices. Section five analyses results for the various indices for the world’s
100 largest TNCs. Section six considers the same results from the perspectives of the
industries and the countries of origin of the TNCs. The last section summarizes and draws
policy implications.
Foreign versus home framework: the UNCTAD index of transnationality and its
components
The 1995 issue of the World Investment Report by UNCTAD, DTCI, chapter I
introduced for the first time a composite index of transnationality, which assesses the degree
to which transnational corporations are engaged in foreign activities compared to their total
activities. It is designed to give a summary view of the position of different companies/
countries/ industries in the internationalisation process. At the basis of this index - which will
here be referred to as the Transnationality index - is the relationship between home and
foreign activities for any particular company. Thus a company is considered to be very
internationalised if the ratio of its foreign to total activities is very high, independently of
whether those foreign activities take place in one single foreign country/region or in many of
them.
The index is multi-dimensional and is calculated as the average of three ratios: the
shares of foreign sales in total sales, foreign assets in total assets and foreign employment in
total employment. Each of these elements gives scope for a uni-dimensional index of its own.
More specifically we have the following.
Let:
A = Company’s Total Assets and Af = Company’s Foreign Assets
S = Company’s Total Sales and Sf = Company’s Foreign Sales
E = Company’s Total Employment and Ef = Company’s Foreign Employment
We get the following three uni-dimensional indices:
Ai = Foreign Assets index = Af/A
Si = Foreign Sales index = Sf/S
4
Ei = Foreign Employment index = Ef/E
The UNCTAD index is an average of the three as follows:
TNi = Transnationality index = [Ai + Si + Ei ] : 3
The UNCTAD Transnationality index concentrates on both demand and supply side
of internationalisation: the variable related to sales captures demand and markets, the variable
related to assets and employment capture the production/supply side and its location. Its
composite nature gives a good feel for the overall interest of companies in foreign countries.
However, from the point of view of the home country - or indeed the foreign countries - it
does not allow us to distinguish between locations where markets are and those where
production takes place. The distinction can, of course, be captured by decomposing the index
into its three separate elements.
As already noted, this composite index is only one of the many possible indices
within the same framework: it is possible to include other elements relevant to international
activities such as the research and development location between home and foreign countries
- as in Sullivan, 1994 - or profits in foreign countries versus total profits.
The UNCTAD index is part of the conceptual framework based on the dichotomy in
the location of business activities between home and foreign countries. Thus it assesses the
percentage of activities which are not in the home country of the TNC. At the micro level the
index tells us something about the extent to which the TNCs’ business and interests are
outside the home country. The reasons for a higher foreign projection can be numerous and
can relate to supply and/or demand conditions. Another important element in the
home/foreign dichotomy is the fact that some countries are chosen as convenient locations for
holdings due to their regulatory and fiscal framework in relation to companies. Given its
conceptual framework, the index cannot demarcate between those companies whose foreign
activities are concentrated in one or few countries and those whose activities are spread in
many foreign countries.
What is the significance of such an indicator for the home country of the TNCs? In
any interpretation and conclusion we must bear in mind that the results from the UNCTAD
study refer to the largest only companies; their size and growth is bound to be linked to their
foreign operations. The more so if the companies originate from small countries where the
scope for growth via domestic-only markets may be limited. In theory high foreign sales are
compatible with low foreign production if the company produces at home and exports.
However, in practice, new markets are secured partly through a production presence where
the market is. Moreover, new locations may also facilitate exports to third countries which
might have been more inaccessible - geographically or politically - from the home-country
base. An example of this is the location of many Japanese companies in the UK which allows
them to jump barriers to the markets of other EU economies.
At the macro level, a high average index of transnationality is an indication of a high
propensity for home-based TNCs to invest abroad. Whether this is an indication of general
locational disadvantages or the outcome of factors which are industry-specific, regulation-
specific, or specific to country size, is something that can be analysed on a country-by-
country and/or industry-by-industry basis. However, in all cases, a very high propensity to do
business away from the home country has a significant impact on some structural features of
the macro economy, and on the possible effectiveness of policies. Among the structural
features of the domestic economy which may be affected are the following. First is the level
as well as the industrial and geographical structure of trade (Cantwell, 1994). Transnational
5
companies as a whole are known to have a high propensity to trade in general, and to engage
in considerable amount of intra-firm trade. The existence of a large number of companies
whose production facilities are largely abroad may influence the direction, structure and
pattern of trade. This, and the related issues of transfer pricing to which it gives scope, may
influence the structure of the balance of payments. Another structural element with very
significant implications for the balance of payments is the by-product of large outward
foreign investment in relation to the size of the country: the amount of inward foreign
earnings from investment. These can be particularly significant for countries with a very long
tradition of foreign direct investment. Thus and ceteris paribus, a high index of transnationality is an indication of
considerable structural impact by TNCs on the home country which can also have policy
implications. Some of these may be linked to the possible effects on the balance of payments
just mentioned, some to the structure of trade and some to the effectiveness of industrial
policy.
Assessing the geographical spread of TNCs’ activities: a Network Spread index
In the introduction mention was made of an alternative framework to the one based on
the foreign versus home dichotomy; the framework proposed is based on the spread of
countries in which the company operates.
An approach based on such a framework is relevant because many issues and effects -
at both micro and macro levels - relate to the geographical spread of activities. At the micro
level, the spread of activities into many countries may involve the company in high costs on
internal transactions including high managerial costs, but it may also bring extra advantages
to it. Among the latter ones are the following: the spread of risks among many countries; the
extra opportunities that knowledge of different location gives including the speed with which
to react to any such opportunities. Such advantages can be translated into a stronger
competitive position towards rivals. Moreover, a wide spread of activities can also result in
increased power vis-à-vis governments and labour. Companies who already have a foot into
many countries may be in a stronger position to bargain with national governments to get
favourable conditions for the location of additional investment. As regards labour, the spread
of production over many countries leads to a more fragmented labour employed by the same
company, compared to a situation in which the same output were to be achieved in one or few
countries (Ietto-Gillies, 1992, Ch. 14 and 1996). This fragmentation weakens - ceteris
paribus - labour’s organization and bargaining power. It thus gives advantages to companies
which can be translated into competitive advantages towards rivals.
The advantages of multiple locations are also highlighted by the findings in Dunning,
1996 based on perceptions of the executives of 144 large world TNCs. One of the
conclusions of this study is that: “...the evidence suggests strongly that, for each of the
advantages identified, a multiple (or at least a dual) location of value-added activities was
perceived to yield positive gains”, p. 10).
Vernon (1979) argues that the increased spread of activities which he noticed among
the US and European largest TNCs shows an increased potential for “global scanning” on the
part of TNCs, and that this affects their strategies vis-à-vis location at home versus abroad.
He uses the results to argue that the changed economic environment of the 1970s may have
affected the operations and sequence of the international product life cycle. Dunning (1977
and 1980) in his analysis of ownership advantages includes multinationality as one of the
elements that gives an advantage to companies. In response to Porter’s home-based
competitive advantages (Porter, 1990), Dunning, 1993 and other authors argue that
international operations enhance the firm-specific advantages and thus their competitive
6
position. Cowling and Sugden (1987) argue that a high degree of internationalisation gives
TNCs “detection power” which they can use in dealing with rivals and labour.
The advantages that companies derive from transnationalism are usually based on
knowledge of markets and production conditions in foreign locations. If this is the case, the
wider the geographical network over which this knowledge extends the higher the advantages
over competitors or labour or governments. The effects of a large spread of transnational
activities on labour are considered in Ietto-Gillies (1992: Ch. 14) where it is argued that a
wide spread of activities by TNCs leads to the fragmentation of labour employed by the
single company, with effects on labour’s ability to organise and on its strength. This is due to
the fact that while companies are able to plan and organise themselves internationally, labour
has - so far - been unable to organise beyond the confines of the single nation state.
There have been some attempts at assessing the extent to which companies’ network
of activities extend to different countries/nation states of the world and to arrive at
international and inter-temporal comparisons.
So far, simple indicators of the geographical spread of activities have been
constructed by taking the number of direct “linkages” - subsidiaries, associates or both - of
each company within a set band in terms of number of countries in which the company
operates. In the studies reported here it is given as number of “linkages” in <6 countries, in 6-
20 countries and in 21+ countries.
The Commission of the European Communities (1976, table B) conducted a wide-
ranging study of all TNCs, large and small in the year 1975 for all OECD countries. A
suitable adaptation of the results (Ietto-Gillies with Seccombe-Hett, 1997), shows that 79.3
per cent of their TNCs had affiliates in less than 6 countries, and only 20.7 per cent in 6+
countries. The countries with a geographical network well above the average are: Sweden,
the USA, the UK and France. They have, respectively, 28.6, 25.6, 24.6 and 24.6 per cent of
the affiliates in 6+ countries.
Vernon, 1979 uses data from the Harvard Multinational Project to analyse trends in
the globalisation power of US and European TNCs in the 1950s and 1970s. An adaptation of
his results (John, et al., 1997, table 2.3, p. 52) shows that the majority of the largest TNCs
increased their geographical network of operations considerably between the 1950s and
1970s. Specifically, 76 percent of US companies and 86 percent of European ones had a
network in less than 6 countries in 1950. The network widened through time, and in the
1970s it shows 95 and 77 per cent of US and European companies, respectively, having
subsidiaries in 6 or more countries.
A more recent study (Ietto-Gillies, 1996) follows the trend in the network spread of
affiliates of the largest UK TNCs over the last 30 years. The results are reported in table 1.
They reveal that in 1963, 23 percent had affiliates in less than 6 countries and only 20 percent
in more than 21 countries. By 1990 the corresponding percentages are 3 and 72 respectively,
showing a clear increase in the spread of affiliates.
Table 1 here
An analysis of these three studies leads to the following conclusion. (a) The
internationalisation of the largest companies - measured by the geographical spread of their
activities - has been increasing considerably through time. Both results are consistent with
expectations. (b) There seems to be a small amount of evidence that, at each point in time,
the largest TNCs may have a wider spread of activities compared to smaller ones.
These various attempts at giving an indication of how the network of companies
world wide compares through time and countries, have not resulted in any simple,
continuous, easily comparable index similar to the UNCTAD one.
7
It is here proposed to arrive at such an index in the following way. Let:
n = the number of foreign countries in which the company has affiliates
n* = the number of foreign countries in which, potentially, the company could have located
affiliates.
In theory, n* could be taken to be all the countries of the world; in practice it is likely
to be confined to all the countries which have accepted (and have been in receipt of) inward
investment. I therefore take n* to be the total number of countries in which there is inward
stock of FDI minus 1, to allow for the fact that the home country should not be included into
the potential number of “foreign” countries. From the information in UNCTAD, 1997,
DTCI, 1997, Annex table B.3, n* is equal to 178. Some readers may feel that there is a
degree of arbitrariness in the choice of this number; however, such a choice should not cause
worries as the exact value of the denominator in the index is not very relevant. What we need
is a datum which expresses potential number of countries and which can be kept constant for
all companies, at any given period of time.
From the above, the Network Spread index (NSi) can thus be derived:
NSi = Network Spread index = n/n* = n/178
This index can give us, for each company, the percentage of foreign countries in
which it has affiliates in relation to the total number of foreign countries in which,
potentially, it would have had opportunities to locate them.
The Network Spread index considers the overall spread of countries rather than the
home/foreign configuration. The index relates to the location of linkages in general not to the
value or “quantum” of those activities. Similarly to the Transnationality index it does not
distinguish between the propensity to spread direct sales across countries and the propensity
to spread production facilities. Some of the linkages are sales points, some are production
plants; some are large in terms of value added and/or employment, some are very small.
Transnational activities spread indices
The major problem with the Transnationality index and its uni-dimensional
components (as in section two) is that they measure the percentage of foreign activities. No
allowance is made for the fact that for one company “foreign” comprises say three countries
while for another it may comprise 80 countries.
The Network Spread index addresses the problem of spread into a different number
of countries. However, it has drawbacks of its own. The main one is the fact that it does not
take account of the “quantum” of activities in the foreign countries. The foreign country is
counted independently of whether the amount of assets, sales or employment located in them
is large or small. This drawback is due to lack of information on the countries’ breakdown in
the “quantum” of their foreign activities, rather than to conceptual issues.
Can we combine the two frameworks and overcome the major problems of the two? I
believe we can and in order to do so I propose the use of the Network Spread index as a
weight for the uni- and multi-dimensional Transnationality index as follow:
ASi = Assets Spread index = Af/A x (n/178) = Ai x NSi
SSi = Sales Spread index = Sf/S x (n/178) = Si x NSi
8
ESi = Employment Spread index = Ef/E x (n/178) = Ei x NSi
TASi = Transnational Activities Spread index = TNi x (n/178)
Before we give an interpretation of the combined index let us consider a couple of
examples. First take two companies X and Y both with the same Ai (i.e. the same percentage
of total assets abroad), an let this Ai be equal to 60 per cent. Company X has its foreign assets
spread in 50 foreign countries (thus it has a NSi = 0.28), while company Y has its foreign
assets spread in 10 foreign countries thus its NSi is equal to approximately 6 per cent). In
percentage terms we have the following values for the ASi index of the two companies:
ASi for company X is: (0.6 x 0.28)100 = 16.8 per cent
ASi for company Y is: (0.6 x 0.06)100 = 3.6 per cent
Thus the company with the wider network spread (X) will have a much higher value
for the Transnational Assets Spread Index compared to the second one. The gap between the
two reflects the gap in their Network Spread indices.
Conversely in a second alternative example let us take two other companies, Z and W
with the same NSi = 0.5; this means that both companies operate in 89 foreign countries. The
two companies have different Ai: company Z has 70 per cent of its assets abroad while
company W has 10 per cent of its assets abroad. We can derive the following values for the
ASi index in percentage terms:
ASi for company Z is: (0.7 x 0.5)100 = 35 per cent
ASi for company W is: (0.1 x 0.5) 100 = 5 per cent
Thus the company with higher share of assets abroad will have a higher value for the
Transnational Assets Spread Index (TASi). The gap between the two TASi reflects the gap in
the corresponding Foreign Assets indices.
The combined index here proposed (TASi) is a synthesis of two indicators of
internationalization: the share of activity (assets, sales, employment or a combination of the
three, or indeed of other variables expressing activities) and the percentage of foreign
countries in which the company operates in relation to the total foreign countries in which it
could, potentially, operate. The combined index indicates that the overall degree of
internationalisation of a company is higher, the higher the percentage of activities abroad and
the higher the spread of such activities in foreign countries.
It is also possible to give the indices a probabilistic interpretation as follows. Take any
country at random from the 178 (= n*); the NSi (= n/n*) can be considered as the probability
that a given company (C) has located activities in it. Similarly with the interpretation of Ai,
which can be taken to be the probability that any random unit of the company’s total assets
(A) be located abroad. The combined index ASi will give the probability that, for any given
random country from the n* list, any random unit of total company’s assets will be located in
it.
Empirical results for the various indices
We have thus arrived at three groups of indices. The first group (section two) relates
to uni- and multi- dimensional indices based on the general framework foreign versus home
9
activities. The second group (section three) relates to the framework based on the
geographical spread of activities (by nation states): in how many countries does a TNC
operate directly, through its affiliates? Two measures can be used in this context: the number
of foreign countries (n) and the Network Spread index (n/n*). The second one can be
expressed in percentage and is therefore comparable with other indices.
The third group (section four) emerges as a synthesis of the two previous frameworks;
the indices in this third combined framework are affected by both the degree of involvement
outside the home country and by the spread of activities in various host countries.
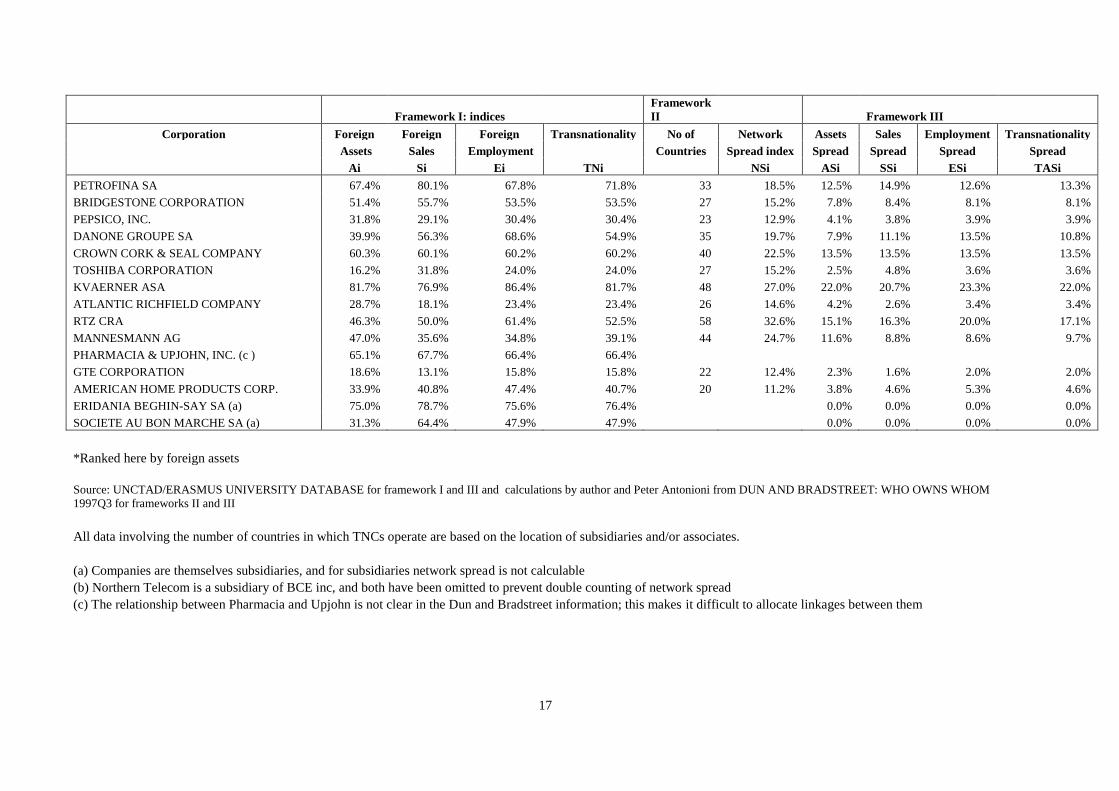
The three groups of indices have been calculated for the 100 largest TNCs world-wide
as in UNCTAD WIR 1998. The results are presented in table 2 where companies are listed
according to foreign assets ranking as in the WIR 1997; indices are expressed as percentages.
Table 2 here
The results in table 2 are difficult to interpret or indeed to take in, due to the large
amount of information contained in the table. In order to give the reader a feel for the ranking
relationship between the various variables and the indices in frameworks I and II, rank
correlation coefficients between them have been calculated and are presented in table 3.
Table 3 here
The following picture emerges from table 3. The rankings of the two main variables
representing size of the corporation - Total Assets and Total Sales - are highly correlated with
each other as one would expect (0.89). However, both of them have considerably lower
correlation with Total Employment (0.39 and 0.35 respectively). This could be explained by
the fact that the corporations in the sample belong to a variety of industries3 some in the
manufacturing and mining sector, some in services; they are therefore likely to operate at
different degrees of labour intensity, ceteris paribus in terms of size.
The rankings for the variables expressing Total Assets, Sales and Employment are
positively and highly correlated with the rankings for the corresponding foreign variables
(Foreign Assets, Sales, Employment) giving values of 0.67, 0.80 and 0.83 respectively.
The two main size variables (Total Assets and Total Sales) have negative rank
correlation with the Transnationality index (-0.54 and -0.49 respectively). This is a reflection
of the way the index is constructed; this index is, in fact an average of three indices each of
which has Total Assets or Sales or Employment on the denominator. The correlation between
these two main size variables and the Network Spread index is positive though extremely low
(0.06 and 0.08). This last result may seem surprising at first. We should, however, remember
that all TNCs considered here are very large and they belong to many industries and home
countries. A proper analysis of the relationship between size and spread of activities may
require a much larger sample with better representation of companies by size and industries.
The rankings of the variables representing foreign activities (Foreign Assets, Sales,
Employment) are also positively correlated to the Transnationality index; the coefficients are
very low (0.15, 0.04 and 0.33 respectively), though slightly higher for the Foreign
Employment variable than for the other two. The coefficients between these three variables
and the Network Spread index are also positive (0.38, 0.35 and 0.36) and consistently higher
than the ones for the Transnationality index.
Of all the three dimensions of activities - Assets, Sales and Employment - the latter is
the one that shows the most internationally-specific characteristics which appears consistently
throughout all the indices. The coefficients seem to show that the TNCs with high 3 Details in the original list in UNCTAD, WIR, 1998.
10
employment, are also likely to be the ones with high share of foreign employment
(coefficient of 0.83, somewhat higher than for the corresponding on Assets and Sales which
are 0.67 and 0.80 respectively). Moreover, the highest correlation coefficient for the Network
spread index (0.44) is with the Employment index (Ei).
The overall emerging profile seems to be one in which those TNCs that are large
employers are also responsible for large percentages of foreign employment; they also have a
relatively high chance of having their foreign employment spread among many foreign
countries. There appears, therefore, to be some evidence that their employment is more
internationalized (foreign-based) as well as more fragmented in foreign countries than their
assets and sales.
Industries and countries analysis
In order to analyse whether the results for the various indices are specific to the
industries and/or the countries of origin to which the TNCs belong, some aggregation work
has been done. Tables 4 and 5 present the average indices of transnationality, network spread
and transnational activities spread, by industry and country of origin of the corporation, for
the top 100 TNCs. The results must be interpreted with care because some
industries/countries are represented by very few TNCs. This makes their profile more
corporation-specific than industry- or country-specific. Nonetheless, the following picture
emerges.
As regards the industry breakdown (table 4), the Chemical/Pharmaceutical, Electric
and Electronic Engineering, Automotive/Transport Engineering, Oil, Gas, Coal extraction
and refining and Food, Drink and Tobacco are the industries with the largest share of the top
100 TNCs. All of them together cover some 75 per cent of the total TNCs.
The average transnationality index for the industries ranges from 80.7 per cent for
Construction/Construction materials to 35.0 per cent for Services and Trading. The average
number of countries in which TNCs in a particular industry operate ranges from 54 (Food,
Drink and tobacco) to 31 (Services/ Trading and Construction). The corresponding values for
the network spread index for the latter industries are, respectively, 30.3 and 17.1 per cent4.
In many industries the ranking of the transnationality and the network spread indices
are very similar. This is the case of the Automotive/Transport Engineering, Electric and
Electronic Engineering, Food, Drink and Tobacco, Services/Trading and
Telecommunications. However, for some industries the two indices give very different results
and rankings as shown by Construction/Construction materials and Oil, Gas, Coal. It should,
however, be noted that the results for Construction/Construction materials are based on two
companies only. As a further consequence of this fact, this industry exhibits very different
ranking for the three indices, contrary to most other industries where the ranking for TASi is
very similar to the one for NSi. The high spread in some industries can be explained by the
need to be near the customers (Food, Drink and Tobacco) and near the sources of raw
materials (Oil, Gas, Coal extraction and refining).
Table 4 here
The results by countries are shown in table 5. The concentration by countries is also
very high with some 76 per cent of companies located in only five countries (USA, Japan,
France UK and Germany). The two largest countries, USA and japan, have, respectively, 28
4 Given the way the network spread index is constructed, its ranking is the same as the one for
the number of countries.
11
and 18 per cent of the top 100 TNCs located in them. However, table 5 gives low ranks for
these countries on both the transnationality and the network spread indices and, in
consequence, also on the transnational activity spread index. The large size of home
economies has allowed companies from these countries to realize their growth potential at
home, to a larger extent than large companies from smaller countries.
Consistently with these results, The Netherlands, a small country which is home to
three large TNCs, ranks very high on all three indices. Its large and widespread foreign
projection may be linked to both a push and a pull factor. The push factor may be due to the
size of the home country which does not allow large companies to realize their growth
potential at home. The pull factor is due to the existence of wide historical links abroad.
In interpreting the results in table 5, allowance should, therefore, be made for the size
of the home country. One would expect that large TNCs located in small countries would
have a higher propensity to seek opportunities in other locations. This may partly explain the
ranking results for the UK, Switzerland, Belgium as well as The Netherlands compared to the
those for the US and Japan. The Netherlands and the UK with a long tradition of foreign
involvement and with wide international links - partly deriving from their history as colonial
powers - show very high percentages of activities abroad as well as very high spread for the
activities of their TNCs. Other factors affecting the results may be linked to the fact that,
sometimes, the home country may be chosen as a convenience location for
financial/regulatory reasons.
Table 5 here
Summary and policy implications
Following an introduction to some literature on indices of internationalization, this
paper discusses two different theoretical frameworks behind indicators of
internationalization. The first framework is based on the dichotomy foreign versus domestic
activities; the second one focuses on the spread of activities among many host countries. This
is followed by proposals for operational indices based on these two frameworks; for the first
one the UNCTAD, WIR index is used. A combined framework with specific proposals for
indices is also presented.
Estimates of the various indices for the world’s top 100 TNCs are given in table 2
with comments on the ranking of various variables and indices. The resulting picture seems
to point to the following. Employment and in particular the share of foreign employment
seems to be more highly correlated with internationalization - whether expressed in terms of
foreign share or in terms of number of countries in which TNCs operate - than Assets or
Sales. It would then appear that of the three dimensions, Assets, Sales and Employment, the
latter one is the most internationalized and the most fragmented among foreign countries.
The aggregate results show that, on the whole, several industries have similar ranking
for the indices of transnationality, network spread and transnational activities spread. A
similar pattern emerges from the aggregation of companies by country of origin. Some of the
results shown in the countries analysis, point towards the existence of effects due to the size
of the home country as well its history of foreign involvement.
What is the relevance of the two frameworks presented here? The indices based on the
home/foreign dichotomy give us a feel for the extent to which TNCs’ activities and interests
are away from the home country. At the company’s level, a high degree of
internationalization is an indication of high ownership advantages. At the macro level, it may
be an indication of low or declining locational advantages at home specially if the level of
inward investment is also low. High values for the indices denotes a structure which may
12
have effects on trade levels and patterns. However, we cannot say anything on whether the
activities giving rise to high indices are trade enhancing or substituting. Much depends on the
companies’ strategies regarding market sourcing and/ or vertical integration across countries.
Any effect on trade is likely to add to the effects on the balance of payments due to the
investment activities as well as the earnings from those investments. A high degree of foreign
involvement by domestic companies may also have implications for the effectiveness of
industrial policies; however, a full analysis of such effects must take account of both inward
and outward investment.
Similar implications can also be drawn from the network spread indices. Moreover, at
the company’s level, a high degree of spread can be taken as an indication of possible effects
on managerial costs/ effectiveness on one hand, and of increasing market shares and power
on the other. Companies with large spread may face extra costs but they may also be at an
advantage vis-à-vis labour and rivals; they may also have increased bargaining power towards
governments in actual and potential host countries. More research is needed to assess the net
benefits of high spread for companies.
At the macro level the points about trade and industrial policy made above are still
valid. Moreover, governments in home countries may feel that companies with high spread of
activities are less embedded in the home country and potentially more footloose in an ex-ante
sense (in terms of new planned investment) if not in an ex-post sense (in terms of existing
productive capacity). These aspects may be particularly relevant in view of the fact that
employment appears to be more foreign-specific and spread compared to the other two
dimensions of activities, assets and sales.
In general it seems that both frameworks are useful and can be used in conjunction
with each other, either separately or as combined indices. We need more detailed research to
ascertain the usefulness of the various frameworks and the related indices in the assessment
of the effects of TNCs’ activities and/or as guidance on policies.
13
Table 1 UK largest TNCs in manufacturing and mining. Network of affiliates
abroad by number of countries, 1963-1990.
(Total and percentages)
Companies with a network in
< 6 countries 6-20 countries 21+ countries
total % total % total %
1963 10 23 25 57 9 20
1970 0 0 14 30 32 70
1980 1 2 20 36 35 63
1990 2 3 16 25 45 72
Source: Ietto-Gillies, 1996, table 1: p.200.
Table 2 . The World's top 100 TNCs*: Various indices of internationalisation
Framework I: indices Framework II Framework III
Corporation Foreign Foreign Foreign Transnationality No of Network Assets Sales Employment Transnationality
Assets Sales Employment Countries Spread index Spread Spread Spread Spread
Ai Si Ei TNi NSi ASi SSi ESi TASi
GENERAL ELECTRIC COMPANY 30.4% 26.6% 35.1% 30.7% 34 19.1% 5.8% 5.1% 6.7% 5.9%
AMERICAN HOME PRODUCTS CORP. 33.9% 40.8% 47.4% 40.7% 20 11.2% 3.8% 4.6% 5.3% 4.6%
ERIDANIA BEGHIN-SAY SA (a) 75.0% 78.7% 75.6% 76.4%
0.0% 0.0% 0.0% 0.0%
SOCIETE AU BON MARCHE SA (a) 31.3% 64.4% 47.9% 47.9% 0.0% 0.0% 0.0% 0.0%
*Ranked here by foreign assets
Source: UNCTAD/ERASMUS UNIVERSITY DATABASE for framework I and III and calculations by author and Peter Antonioni from DUN AND BRADSTREET: WHO OWNS WHOM
1997Q3 for frameworks II and III
All data involving the number of countries in which TNCs operate are based on the location of subsidiaries and/or associates.
(a) Companies are themselves subsidiaries, and for subsidiaries network spread is not calculable
(b) Northern Telecom is a subsidiary of BCE inc, and both have been omitted to prevent double counting of network spread
(c) The relationship between Pharmacia and Upjohn is not clear in the Dun and Bradstreet information; this makes it difficult to allocate linkages between them
References
Cantwell, J., 1994, “The relationship between international trade and international
production,” in Greenway, D. and Winters, L.A., (eds.), Surveys in International
Trade, Oxford, Blackwell, Ch. 11: pp. 303-328.
Commission of the European Communities (1976). Survey of Multinational Enterprises,
Vol. 1. (Brussels: Commission of the European Communities).
Cowling, K. and Sugden, R. (1987). “Market Exchange and the Concept of a Transnational
Corporation: Analysing the Nature of the Firm”, British Review of Economic Issues,
9 (20), pp. 57-68.
Dun and Bradstreet (various years), Who Owns Whom,( High Wycombe).
Dunning, J.H. (1977). 'Trade, Location of Economic Activity and the MNE: A Search for
an Eclectic Approach”, in Ohlin, B., Hesselborn, P.O. and Wijkman, P.M., eds. The
International Allocation of Economic Activity. ( London: Macmillan), pp. 395-431.
Dunning, J.H., 1980, “Explaining Changing Patterns of International Production: in
defence of the eclectic theory,” Oxford Bulletin of Economics and Statistics,
41(4), pp. 269-95.
Dunning, J.H. (1993). “Internationalizing Porter’s diamond”, Management International
Review. 33 (2), pp 7-15
Dunning, J.H. (1996). “The geographical sources of the competitiveness of firms: some
results of a new survey”, Transnational Corporations, 5 (3), pp. 1-29.
Dunning, J.H. and Pearce, R.D. (1981). The world’s Largest Industrial Enterprises,
(Farnborough: Gower).
Ietto-Gillies, G. (1989). “Some indicators of multinational domination of national economies:
analysis for the UK and other developed countries”, International Review of Applied
Economics, 3 (1), pp. 25-45.
Ietto-Gillies, G. (1992). International Production Trends, Theories, Effects. Cambridge:
Polity Press.
Ietto-Gillies, G. (1996). “Widening Geographical Trends in UK International Production:
Theoretical Analysis and Empirical Evidence”, International Review of Applied
Economics, 10 (2), pp. 195-208.
Ietto-Gillies, G. and Seccombe-Hett, T. (1997). “What do internationalization indices
measure?” Research Papers in International Business, (Centre for International
Business Studies, London: South Bank University).
John, R. Ietto-Gillies, G., Cox, H., and Grimwade, N. (1997). Global Business Strategy,
(London: International Thomson Business Press).
Porter, M.E. (1990). The Competitive Advantage of Nations. (London: MacMillan)
19
Ramaswamy, K. Kroeck, K.G. and Renforth W. (1996) “Measuring the degree of
internationalization of a Firm: A Comment”, Journal of International Business
Studies, 27 ( 1), pp. 167-177.
Sullivan, D. (1994). “Measuring the Degree of Internationalization of a Firm”, Journal of
International Business Studies, 25 (2), pp. 325-42.
Sullivan, D. (1996). “Measuring the Degree of Internationalization of a Firm: A Reply”
Journal of International Business Studies, 27 (1), pp. 179-192.
UNCTAD-DTCI (1995). World Investment Report 1995. Transnational Corporations and
Competitiveness. (Geneva: United Nations).
UNCTAD-DTCI (1996) World Investment Report 1996. Investment, Trade and
International Policy Arrangements. (Geneva: United Nations)
UNCTAD-DTCI (1997). World Investment Report, 1997. Transnational Corporations,
Market Structure and Competition Policy. (Geneva: United Nations).
Vernon, R. (1979). “The Product Cycle Hypothesis in a New International Environment”,
Oxford Bulletin of Economics and Statistics, 41 pp. 255-67.