UNC-School of Social Work Clinical Lecture Series Differential Diagnosis for Depressive Disorders: A Step-by-Step Assessment of a Complex Case Feb 2, 2015 Eric Youngstrom, Ph.D. UNC Chapel Hill USA
Transcript
UNC-School of Social Work Clinical Lecture Series
Differential Diagnosis for Depressive Disorders: A Step-by-Step Assessment of a Complex Case
Feb 2, 2015
Eric Youngstrom, Ph.D. UNC Chapel Hill USA
Disclosures
NIH R01 MH066647 (PI: E. Youngstrom)
NIH R01 MH073967 (PI: R.L. Findling)
OMDH Grant for CBT (PI: J.K. Youngstrom)
NC TraCS Grant (PI: Melissa Jenkins)
E. Youngstrom consults with Lundbeck and Otsuka about neurocognitive and mood assessment
No speakers bureaus, pharma supported talks, stock ownership, test sales….
Objectives
Learn base rates in different settings, such as public schools, outpatient services, forensic settings, and inpatient units; and how to use these benchmarks to evaluate efficiently
Use assessment procedures to aid in differential diagnosis and measuring response to treatment
Apply new methods for interpreting test results, including methods taking into account clinical settings where we work
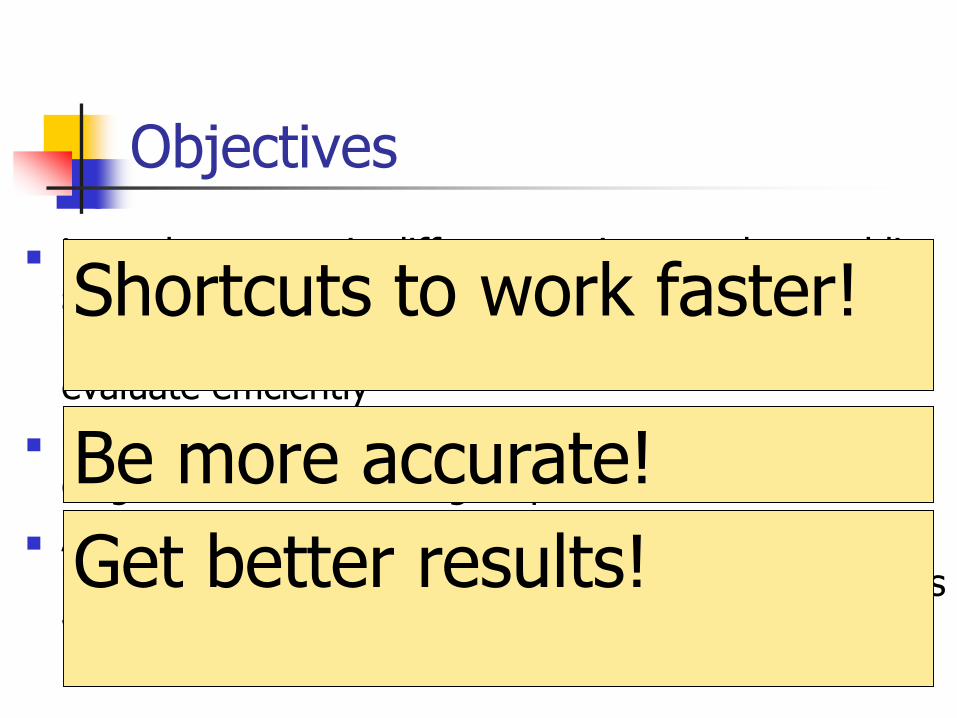
Shortcuts to work faster!
Be more accurate!
Get better results!
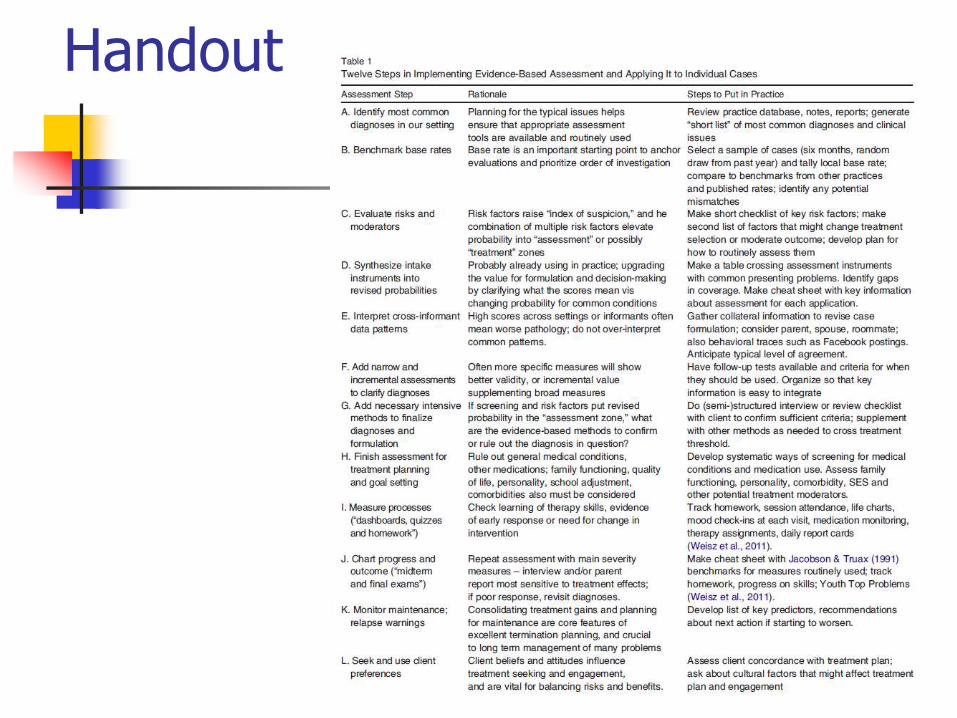
Handout
Handout
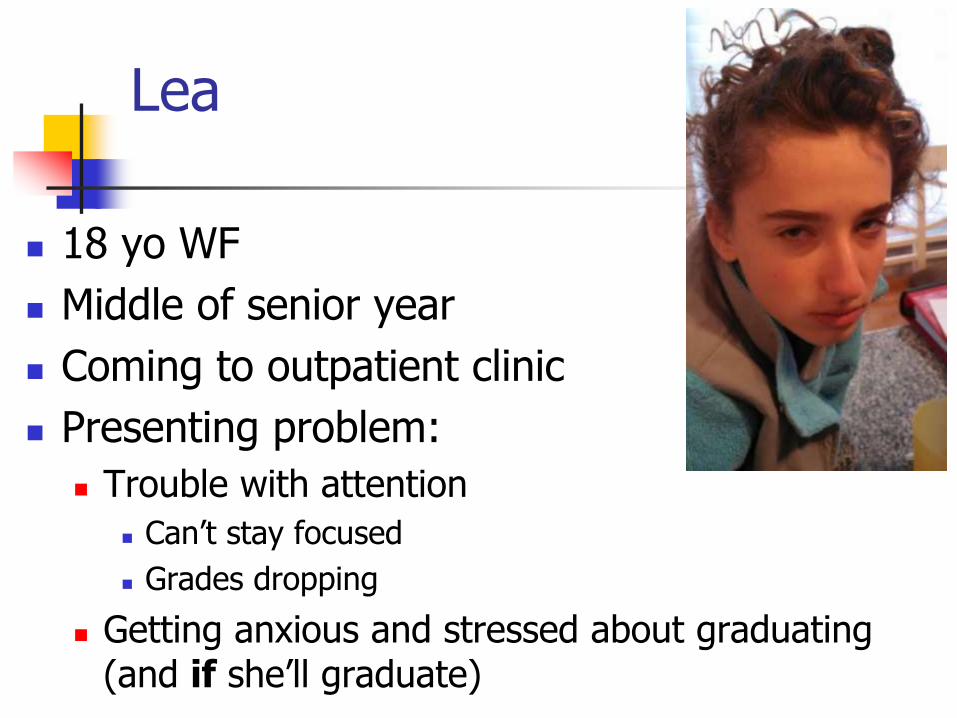
Lea
18 yo WF
Middle of senior year
Coming to outpatient clinic
Presenting problem:
Trouble with attention
Can’t stay focused
Grades dropping
Getting anxious and stressed about graduating (and if she’ll graduate)
What do you think is going on?
Diagnosis?
What’s your assessment plan?
Treatment options?
Detective Work: Evidence-Based Assessment
EBA
DSM-5
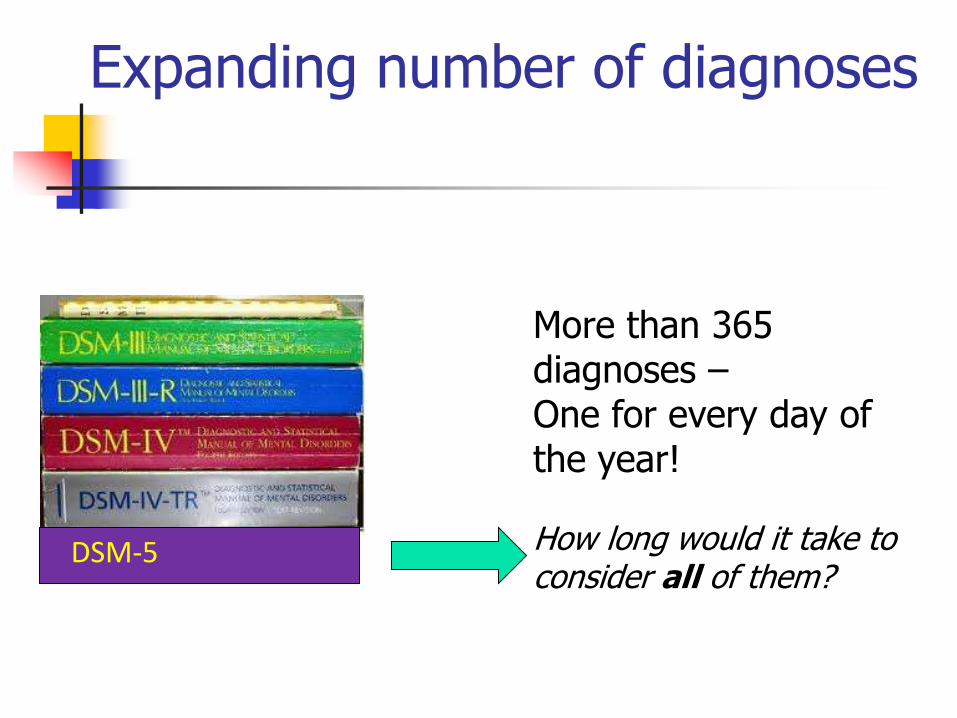
Expanding number of diagnoses
More than 365 diagnoses –One for every day of the year!
How long would it take to consider all of them?
Pareto’s 80:20 Law“Law of the vital few”
20% of diagnoses will cover more than 80% of the cases we see
Concentrate on the common problems
Have a good plan for assessing, treating them
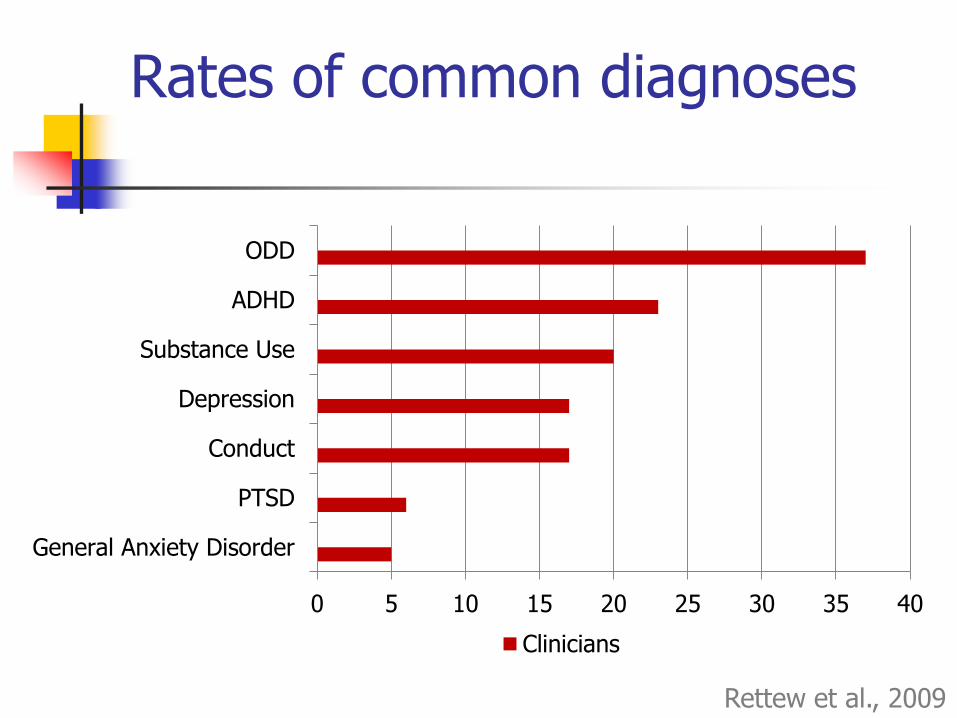
Rates of common diagnoses
0 5 10 15 20 25 30 35 40
General Anxiety Disorder
PTSD
Conduct
Depression
Substance Use
ADHD
ODD
Structured Clinicians
Rettew et al., 2009
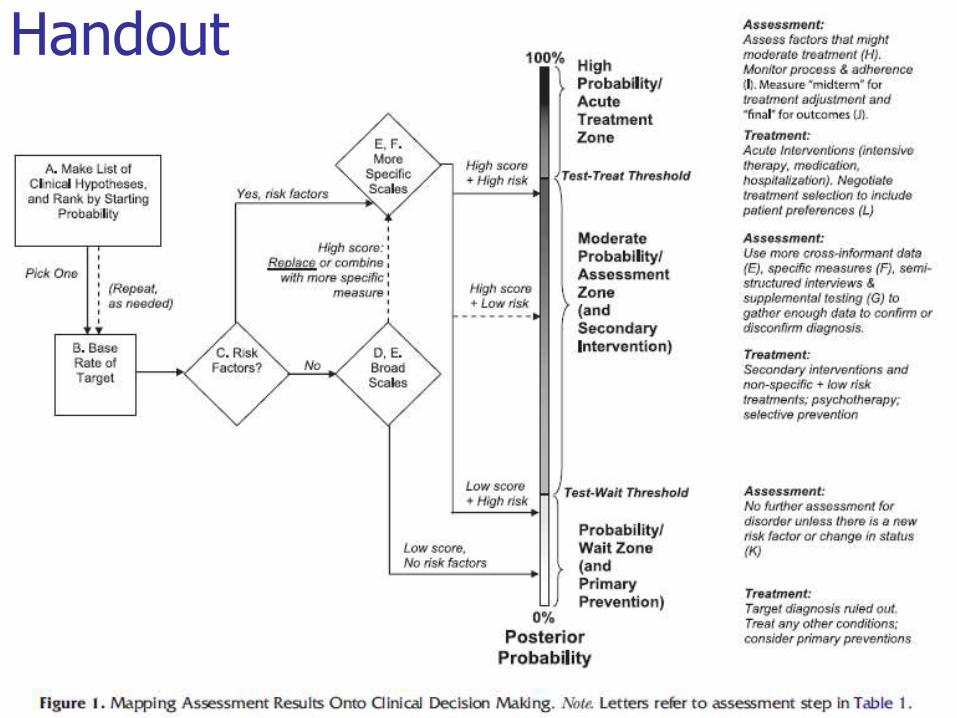
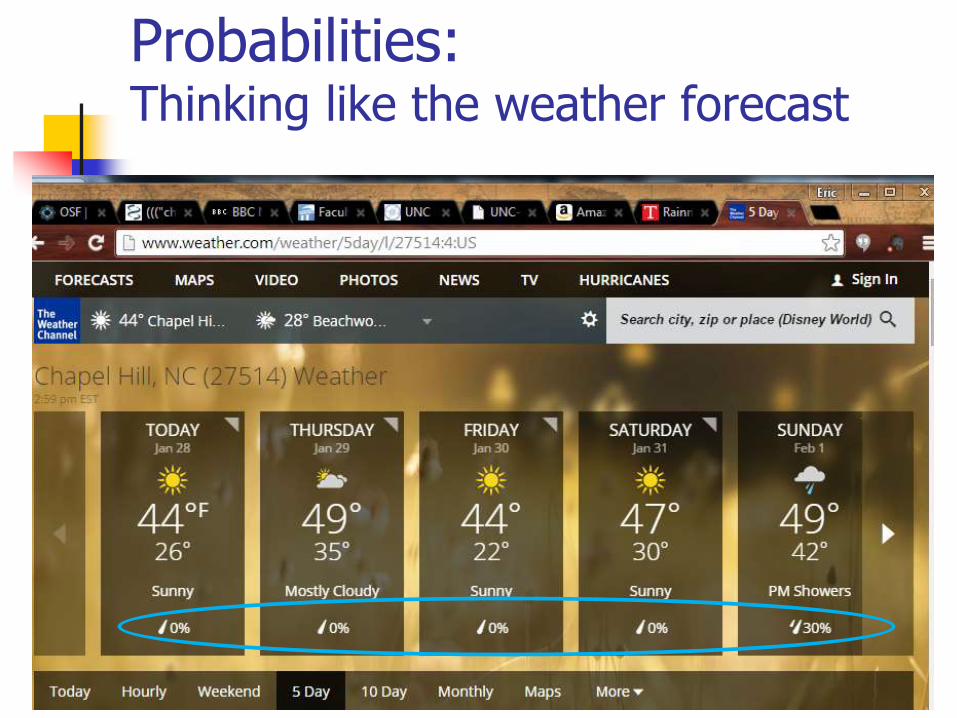
Probabilities: Thinking like the weather forecast
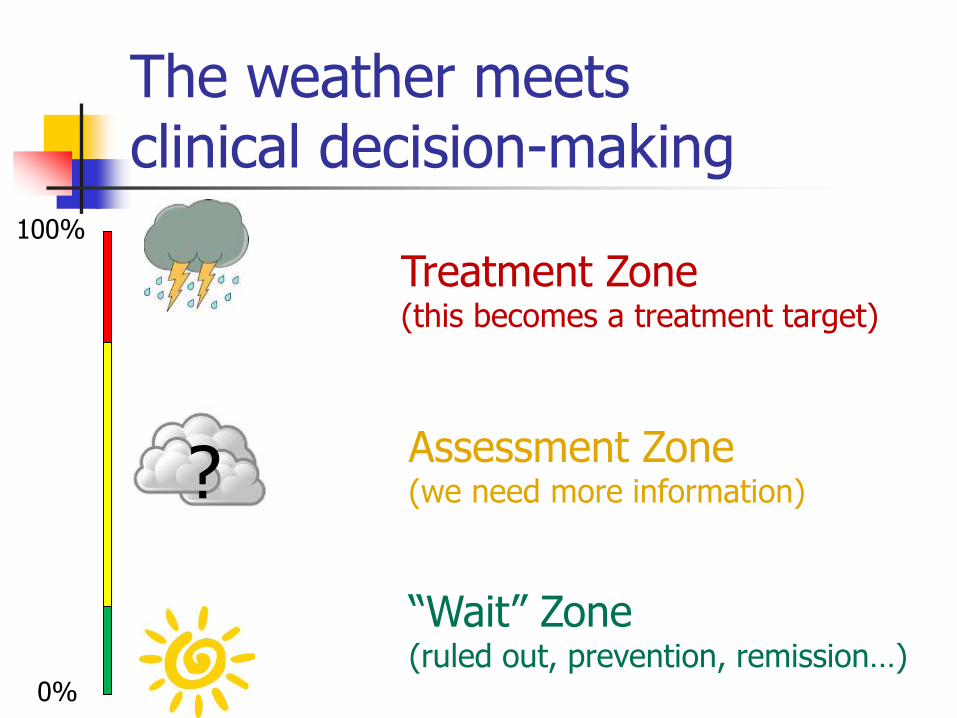
The weather meets clinical decision-making
0%
100%
?
Treatment Zone(this becomes a treatment target)
Assessment Zone(we need more information)
“Wait” Zone (ruled out, prevention, remission…)
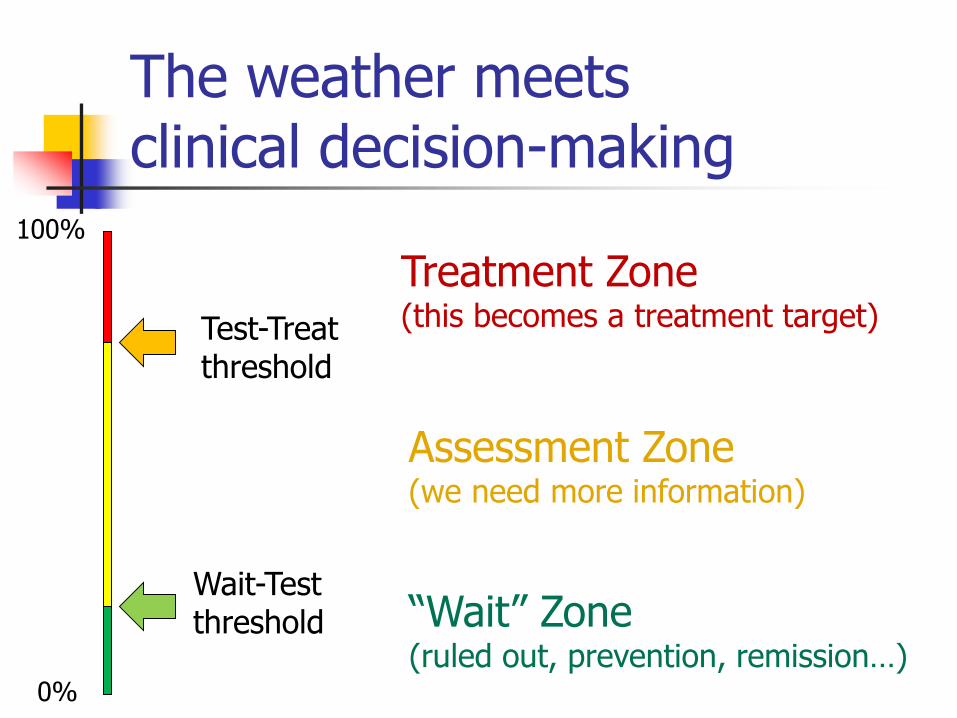
The weather meets clinical decision-making
0%
100%
Treatment Zone(this becomes a treatment target)
Assessment Zone(we need more information)
“Wait” Zone (ruled out, prevention, remission…)
Test-Treatthreshold
Wait-Testthreshold
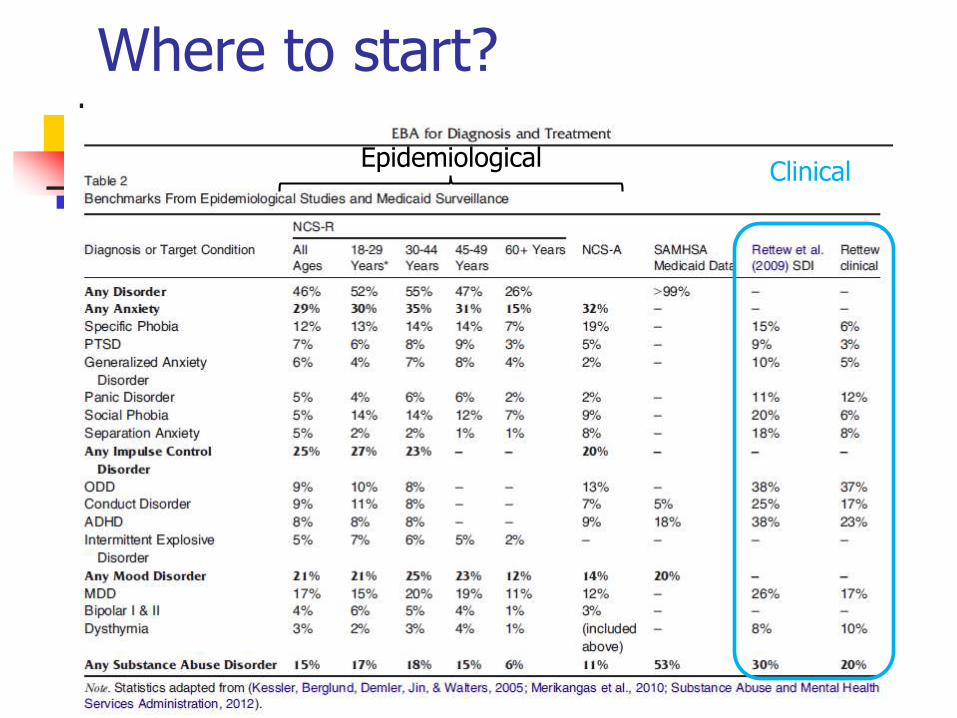
Where to start?
EpidemiologicalClinical
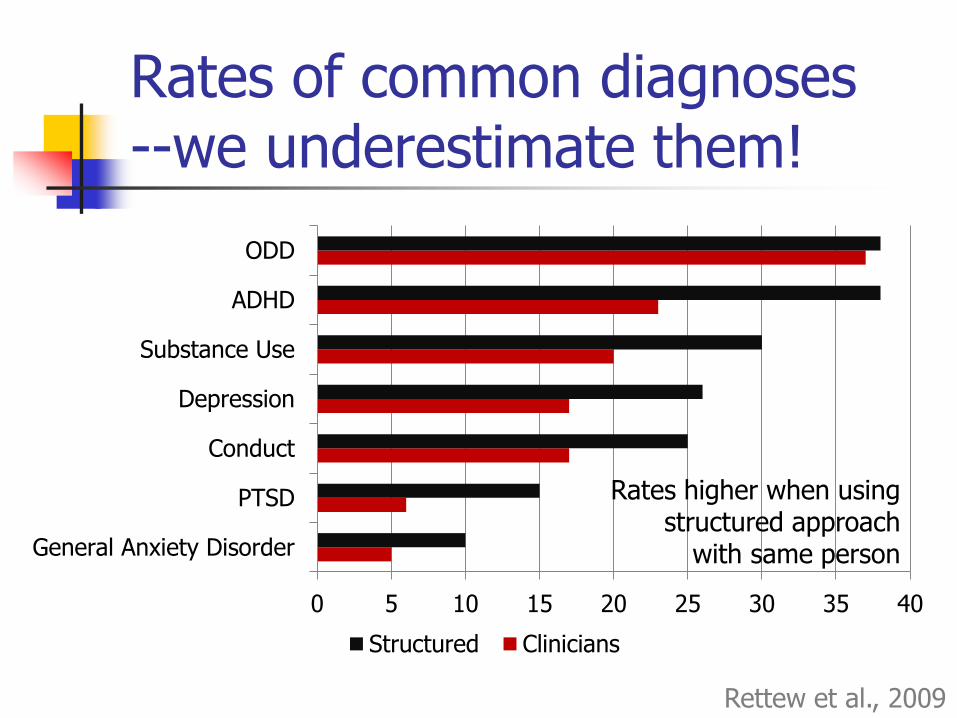
Rates of common diagnoses--we underestimate them!
0 5 10 15 20 25 30 35 40
General Anxiety Disorder
PTSD
Conduct
Depression
Substance Use
ADHD
ODD
Structured Clinicians
Rettew et al., 2009
Rates higher when usingstructured approach
with same person
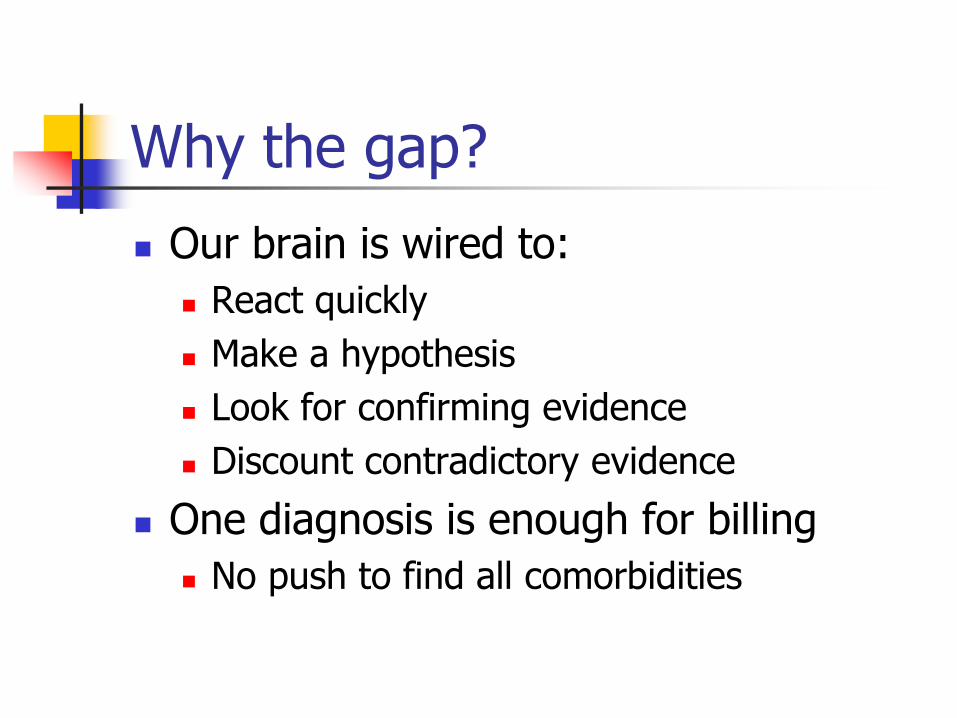
Why the gap?
Our brain is wired to:
React quickly
Make a hypothesis
Look for confirming evidence
Discount contradictory evidence
One diagnosis is enough for billing
No push to find all comorbidities
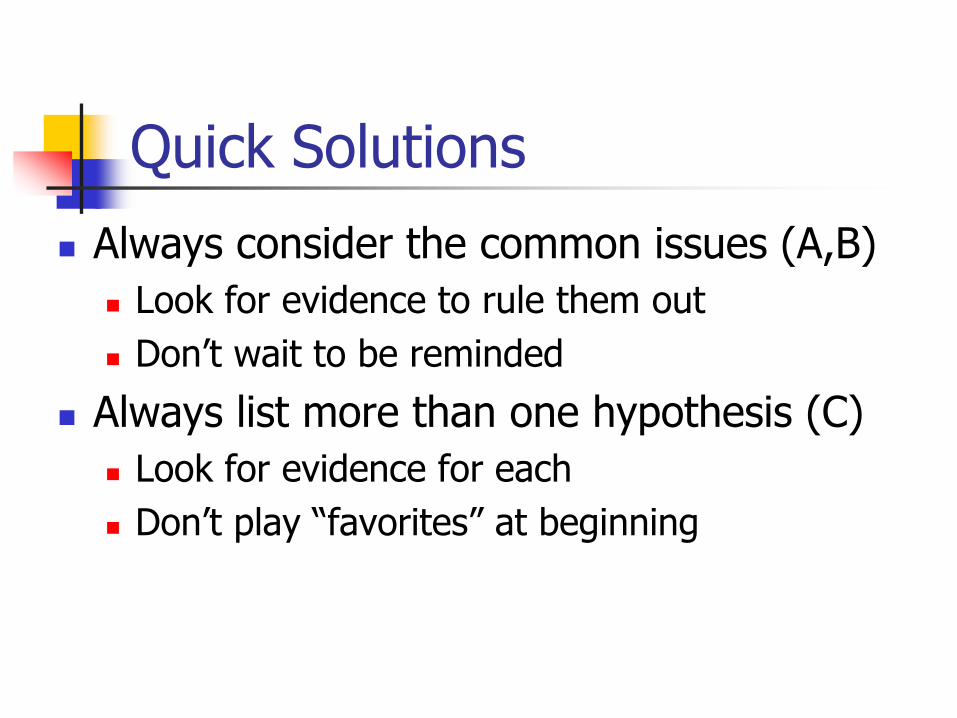
Quick Solutions
Always consider the common issues (A,B)
Look for evidence to rule them out
Don’t wait to be reminded
Always list more than one hypothesis (C)
Look for evidence for each
Don’t play “favorites” at beginning
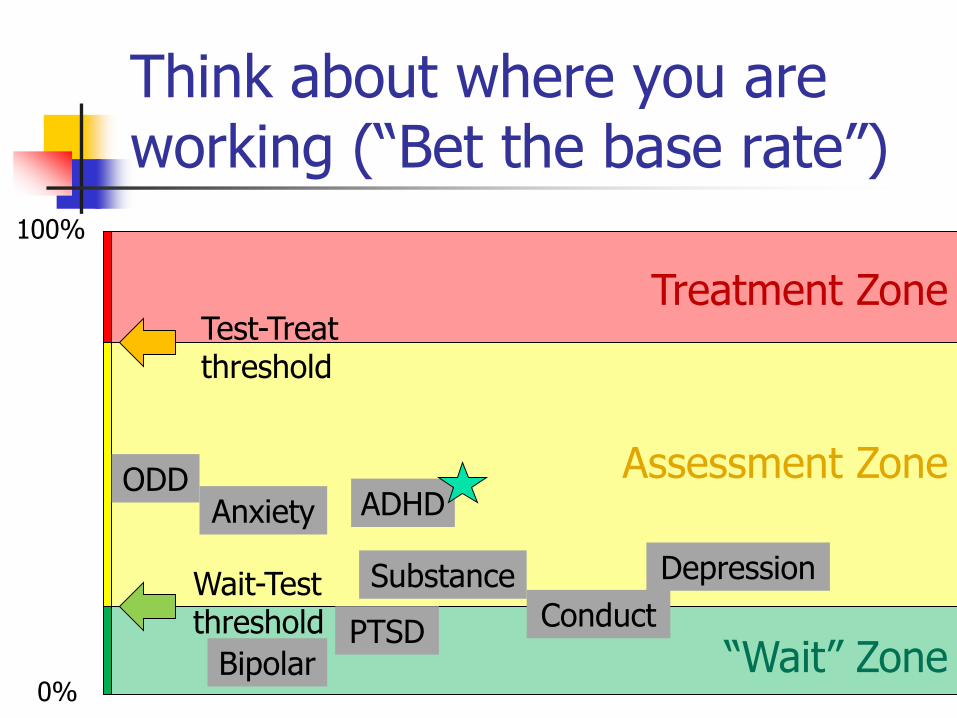
Think about where you are working (“Bet the base rate”)
0%
100%
Treatment Zone
Assessment Zone
“Wait” Zone
Test-Treatthreshold
Wait-Testthreshold
ADHD
Depression
Anxiety
Substance
Bipolar
ConductPTSD
ODD
Learn good thinking habits
Debiasing strategies:
Competing hypotheses
Look for disconfirming evidence
Don’t call off search when find one plausible suspect
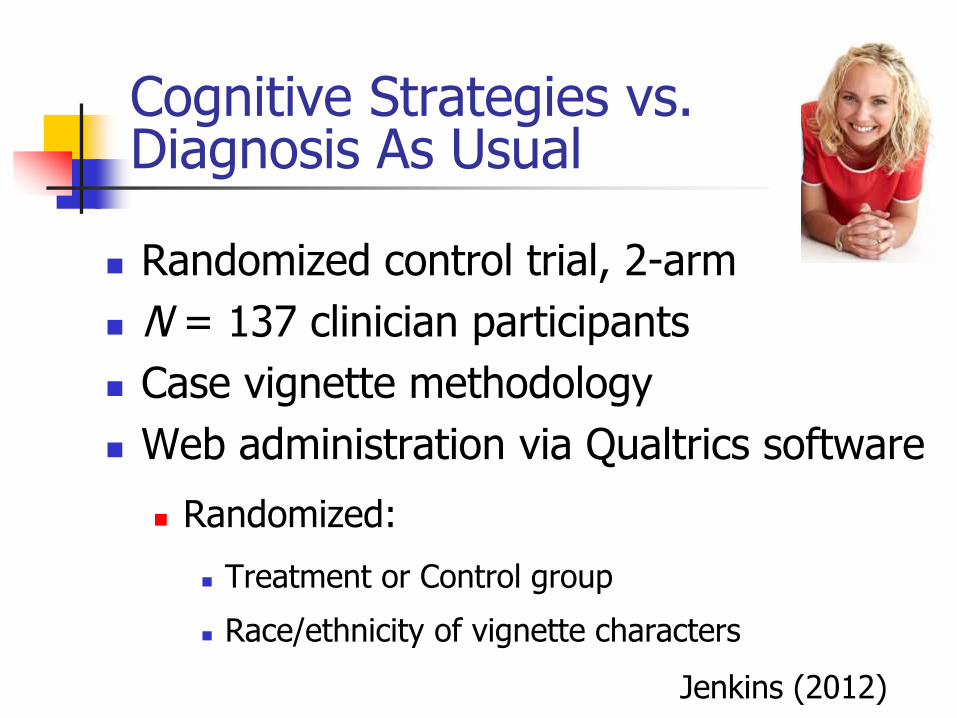
Randomized control trial, 2-arm
N = 137 clinician participants
Case vignette methodology
Web administration via Qualtrics software
Randomized:
Treatment or Control group
Race/ethnicity of vignette characters
Jenkins (2012)
Cognitive Strategies vs.Diagnosis As Usual
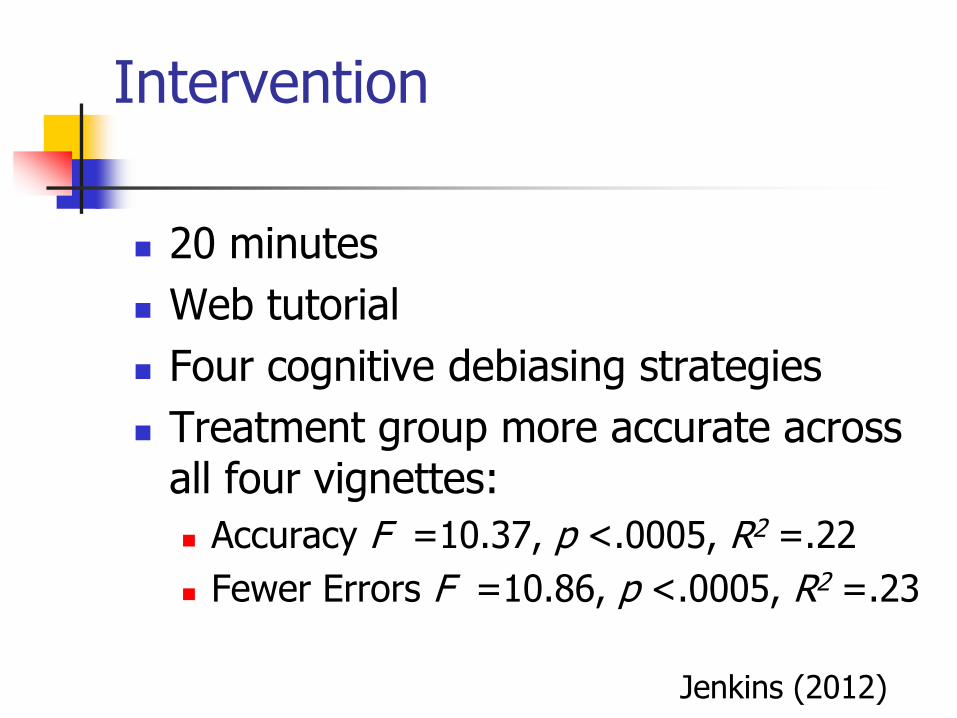
20 minutes
Web tutorial
Four cognitive debiasing strategies
Treatment group more accurate across all four vignettes:
Accuracy F =10.37, p <.0005, R2 =.22
Fewer Errors F =10.86, p <.0005, R2 =.23
Intervention
Jenkins (2012)
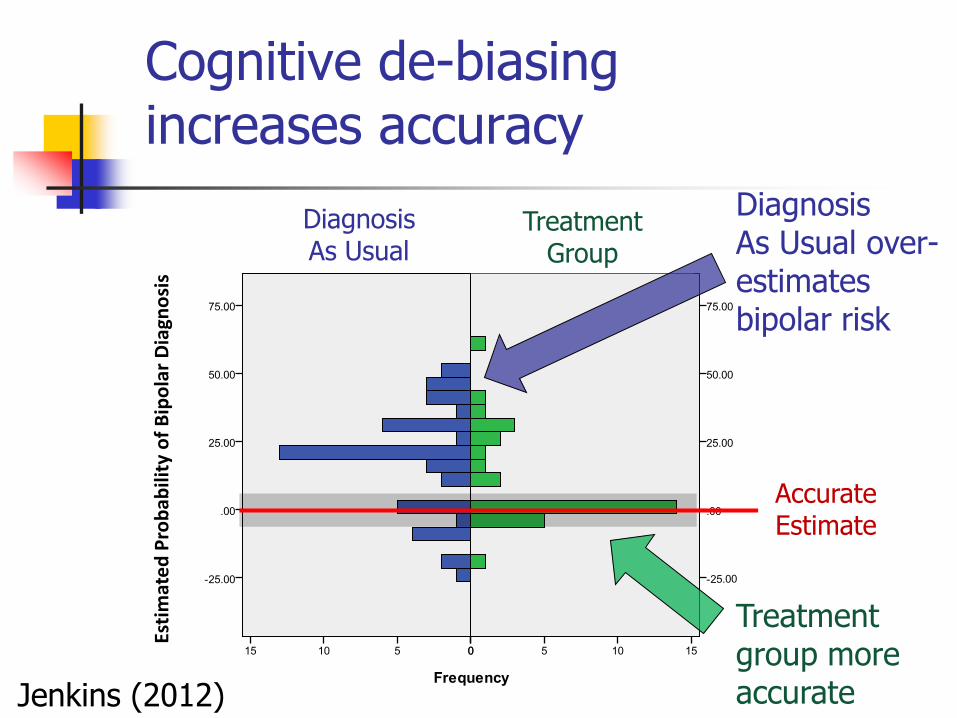
Cognitive de-biasing increases accuracy
Esti
mat
ed
Pro
bab
ility
of
Bip
ola
r D
iagn
osi
s
Diagnosis As Usual
Treatment Group
Accurate Estimate
Treatment group more accurate
Diagnosis As Usual over-estimates bipolar risk
Jenkins (2012)
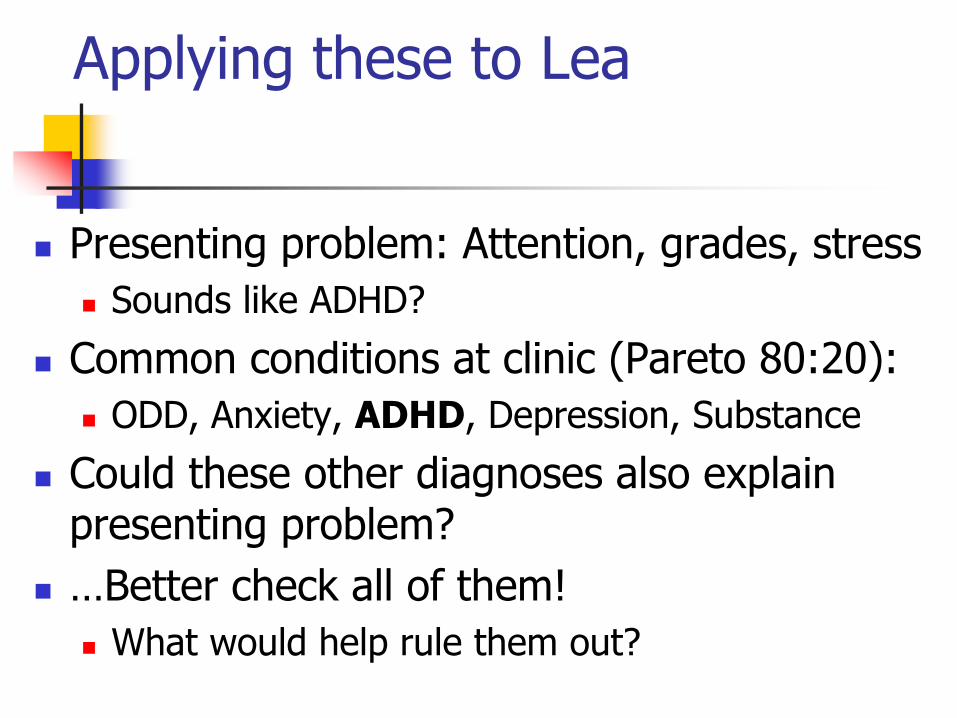
Presenting problem: Attention, grades, stress
Sounds like ADHD?
Common conditions at clinic (Pareto 80:20):
ODD, Anxiety, ADHD, Depression, Substance
Could these other diagnoses also explain presenting problem?
…Better check all of them!
What would help rule them out?
Applying these to Lea
Another Solution: Checklists
Checklists as a simple way of eliminating human error
Used in medicine, engineering, arena rock, other complex endeavors
Atul Gawande –The Checklist Manifesto
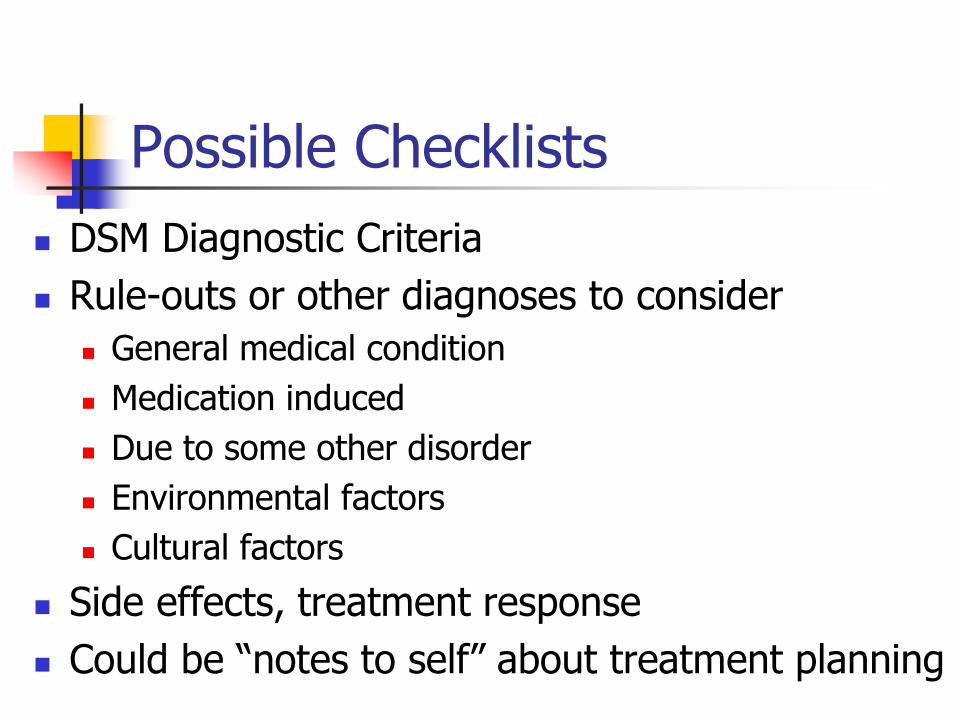
Possible Checklists
DSM Diagnostic Criteria
Rule-outs or other diagnoses to consider
General medical condition
Medication induced
Due to some other disorder
Environmental factors
Cultural factors
Side effects, treatment response
Could be “notes to self” about treatment planning
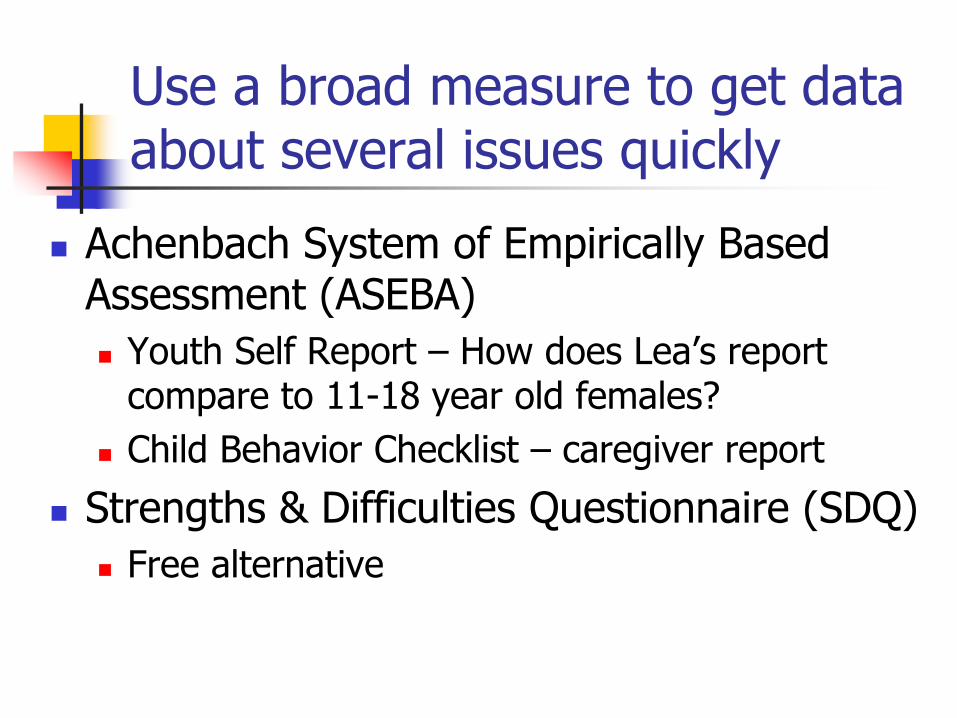
Use a broad measure to get data about several issues quickly
Achenbach System of Empirically Based Assessment (ASEBA)
Youth Self Report – How does Lea’s report compare to 11-18 year old females?
Child Behavior Checklist – caregiver report
Strengths & Difficulties Questionnaire (SDQ)
Free alternative
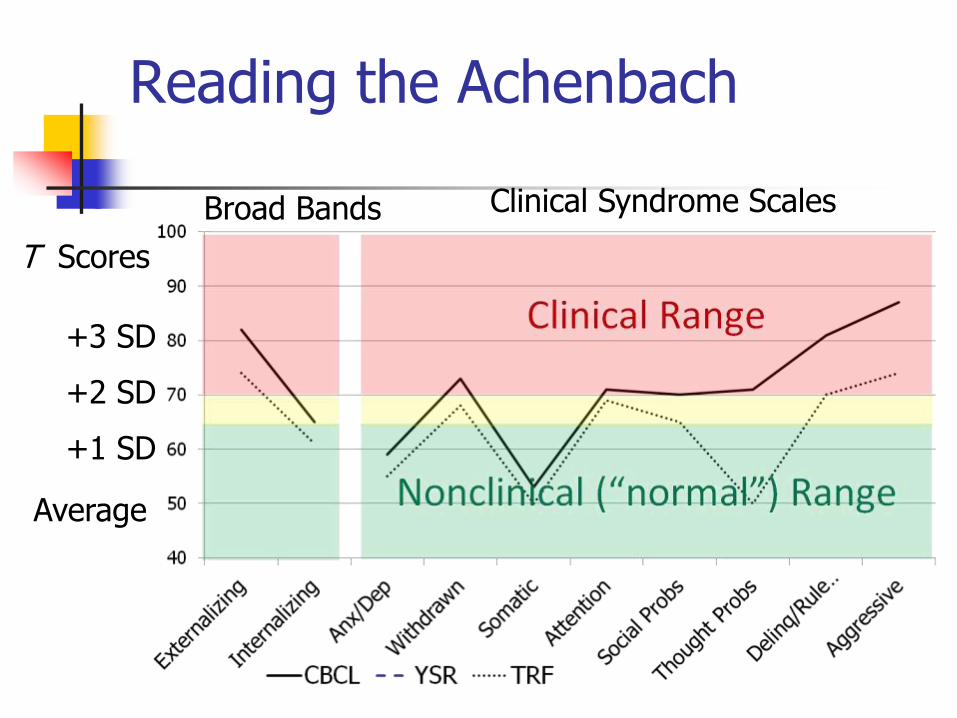
Reading the Achenbach
T Scores
Average
+1 SD
+2 SD
+3 SD
Broad Bands Clinical Syndrome Scales
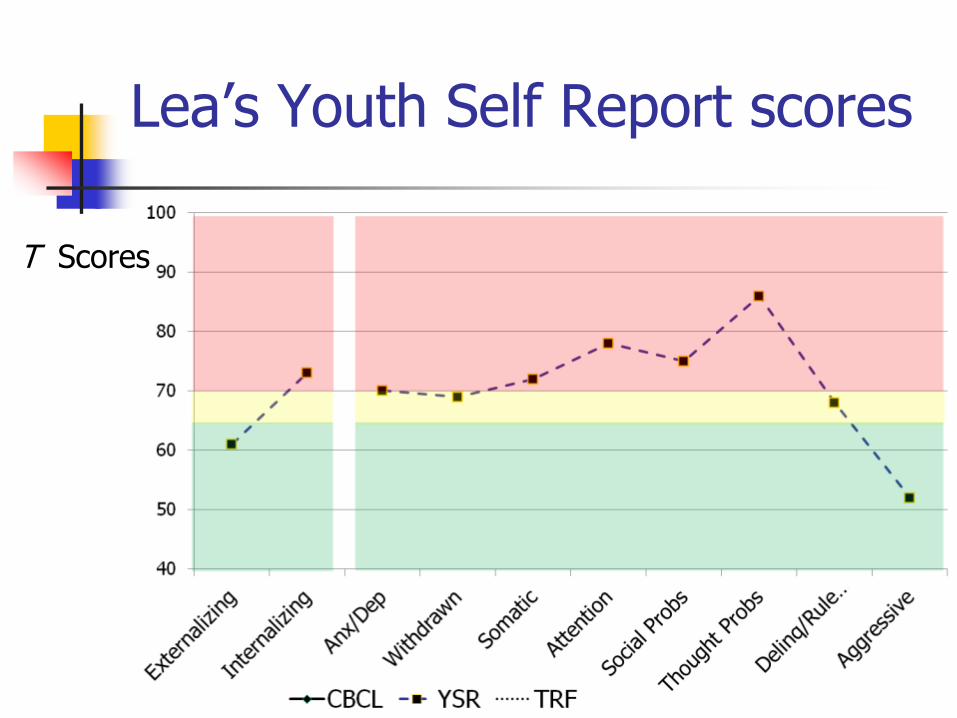
Lea’s Youth Self Report scores
T Scores
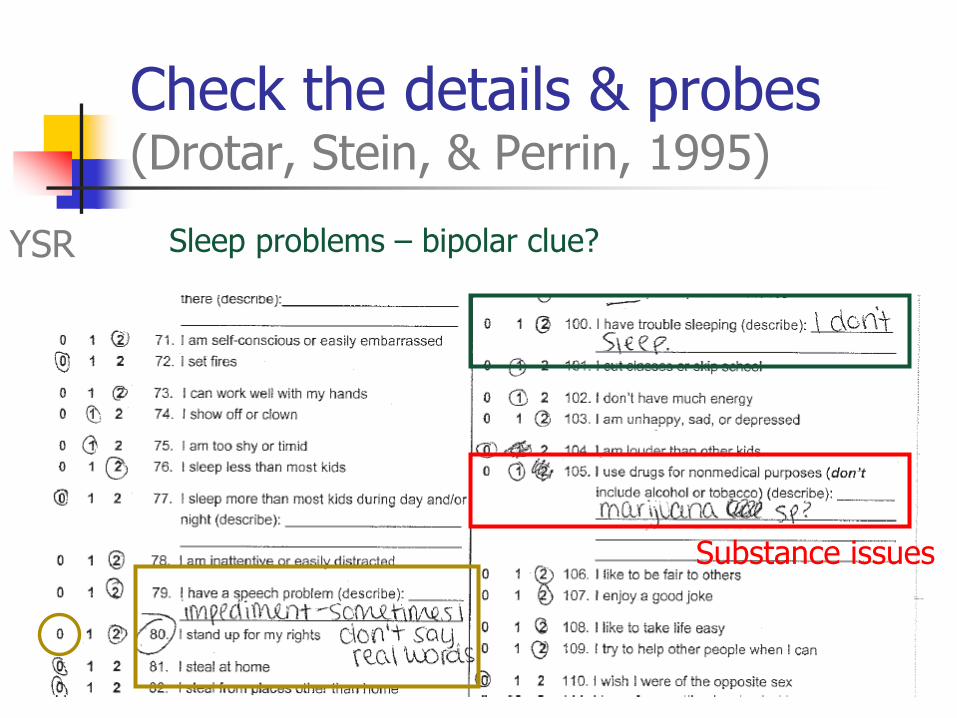
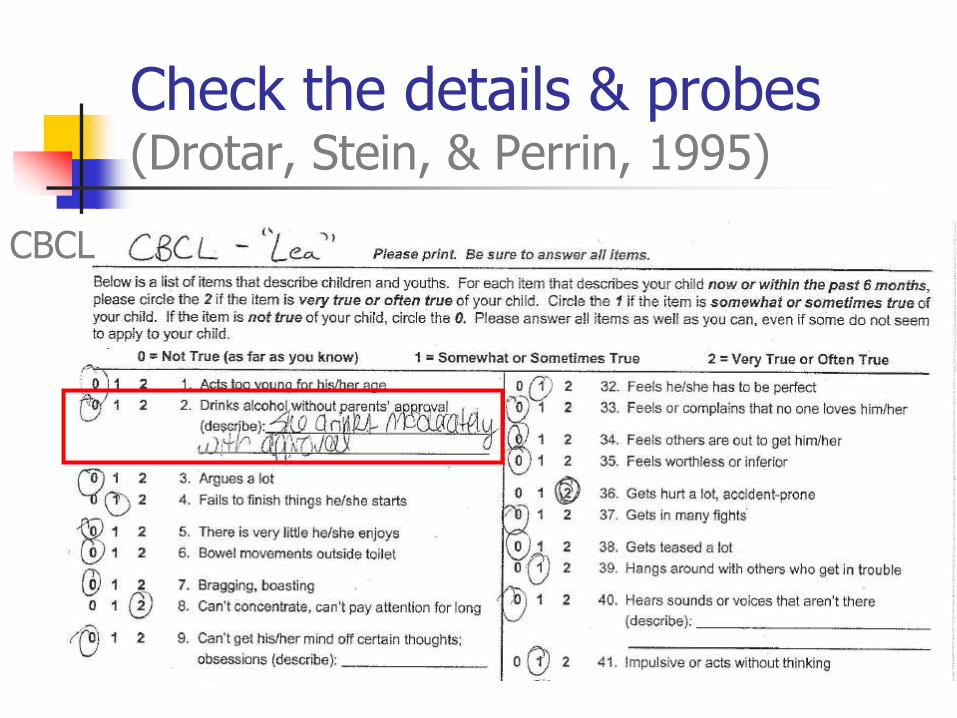
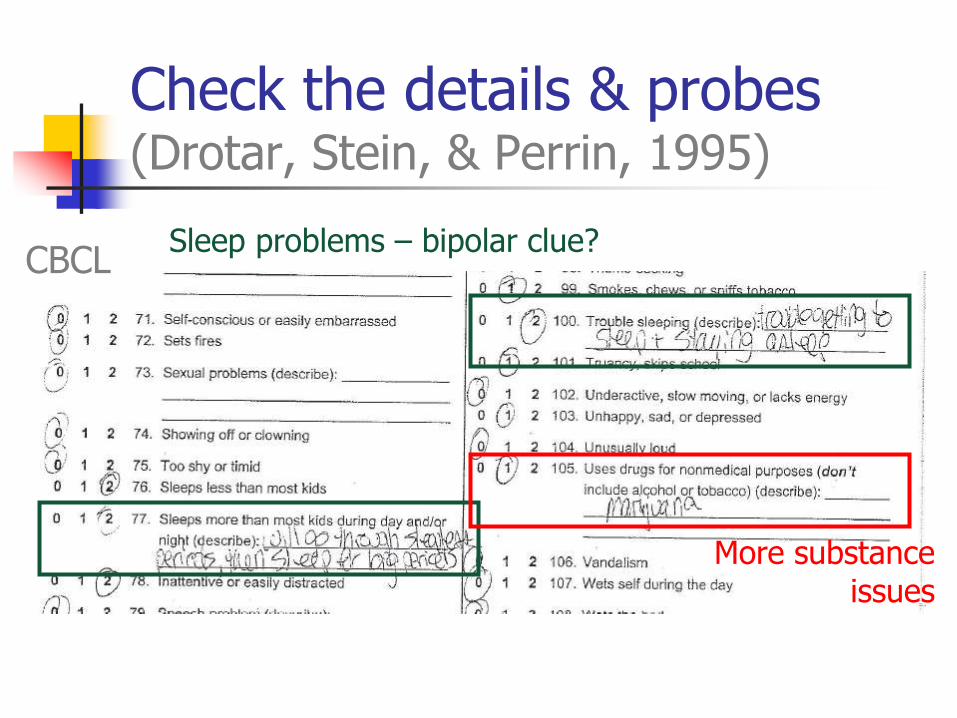
Check the details & probes (Drotar, Stein, & Perrin, 1995)
Substance issues
Sleep problems – bipolar clue? YSR
The tool is only as good as the way we use it
Illustrate with a second case
We can look at our audience participation compared to 610 clinicians in USA and Canada
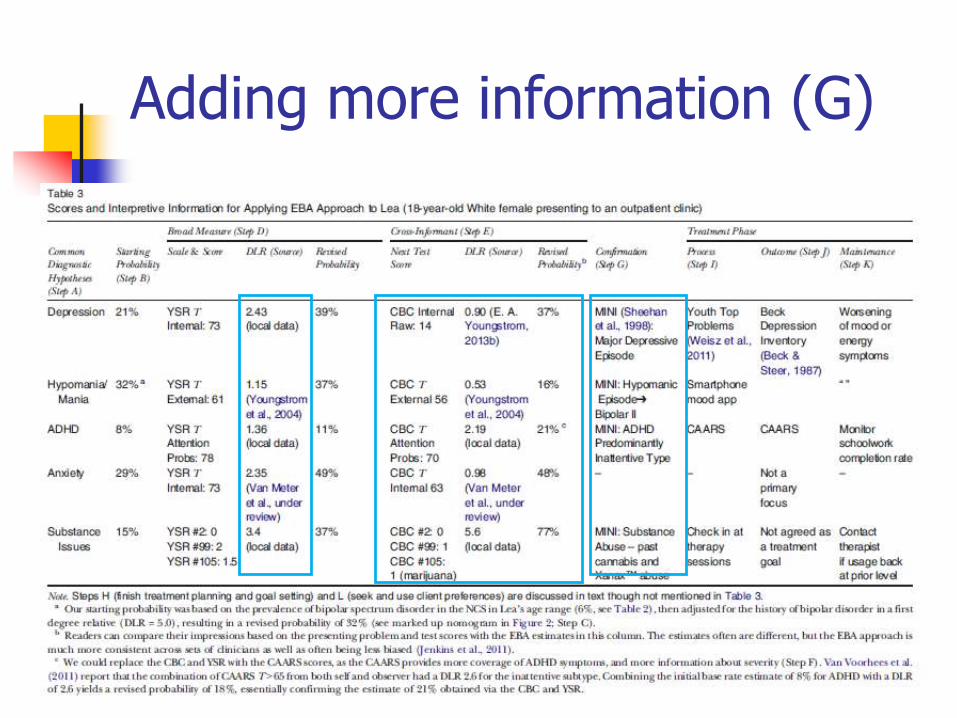
Handout step (d) –synthesize info to revise probabilities
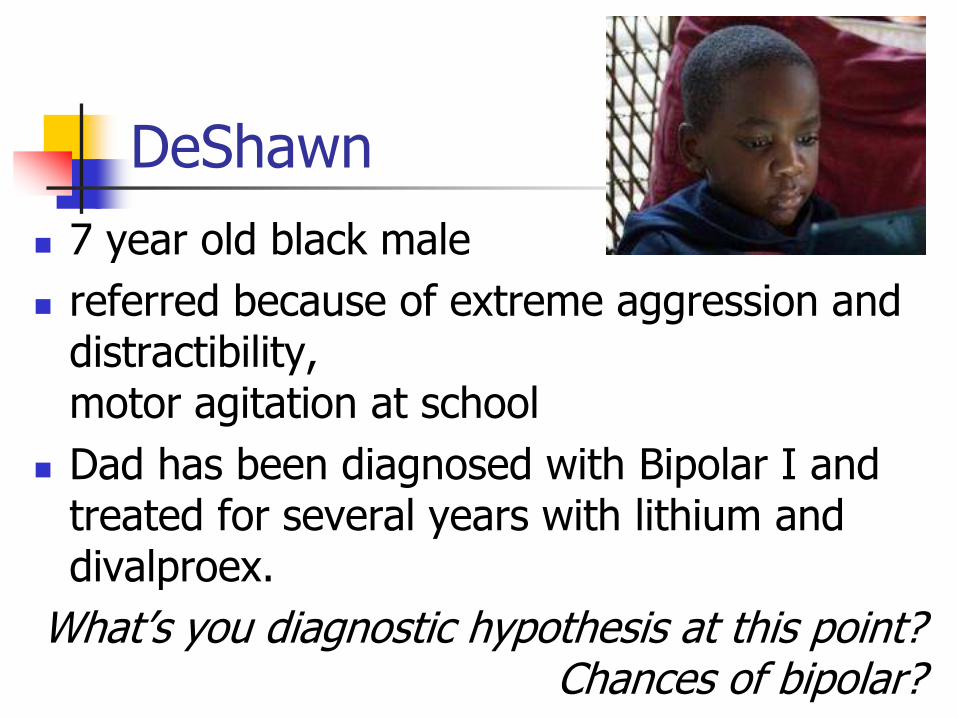
DeShawn
7 year old black male
referred because of extreme aggression and distractibility, motor agitation at school
Dad has been diagnosed with Bipolar I and treated for several years with lithium and divalproex.
What’s you diagnostic hypothesis at this point? Chances of bipolar?
Add a Test
Mom completes CBCL, and he earns an Externalizing T = 84
What do you think likelihood is of bipolar now?
Esti
mate
d P
rob
ab
ilit
y o
f B
ipo
lar
Dia
gn
osis
100
80
60
40
20
0
Frequency
120 100 80 60 40 20 0
100
80
60
40
20
0
120100806040200
NomogramClinical Judgment
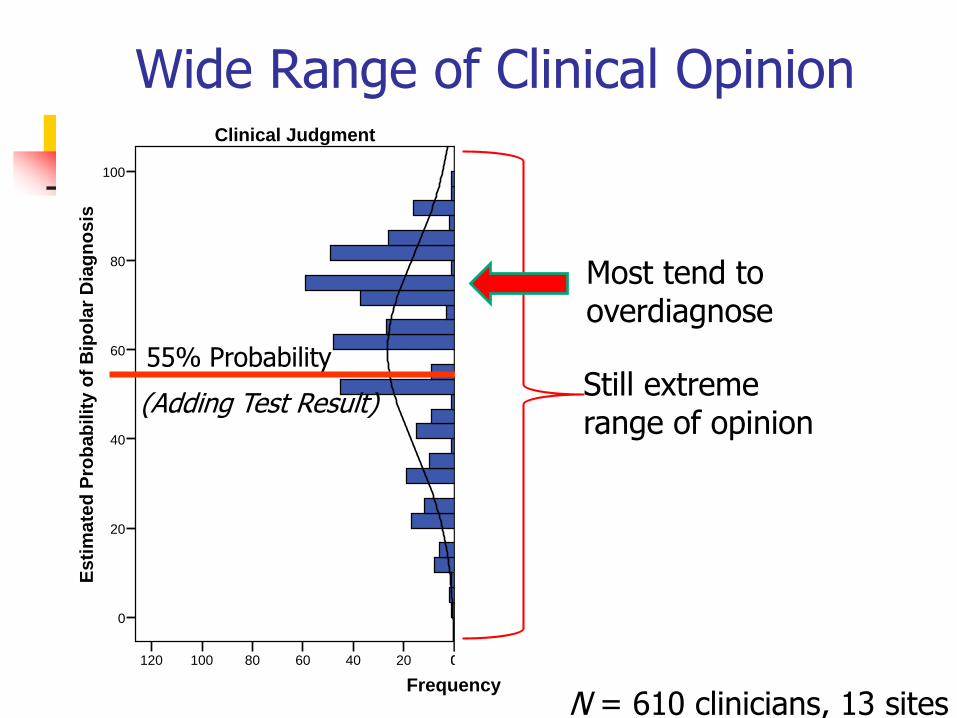
Wide Range of Clinical Opinion
55% Probability
(Adding Test Result)
N = 610 clinicians, 13 sites
Still extreme range of opinion
Most tend to overdiagnose
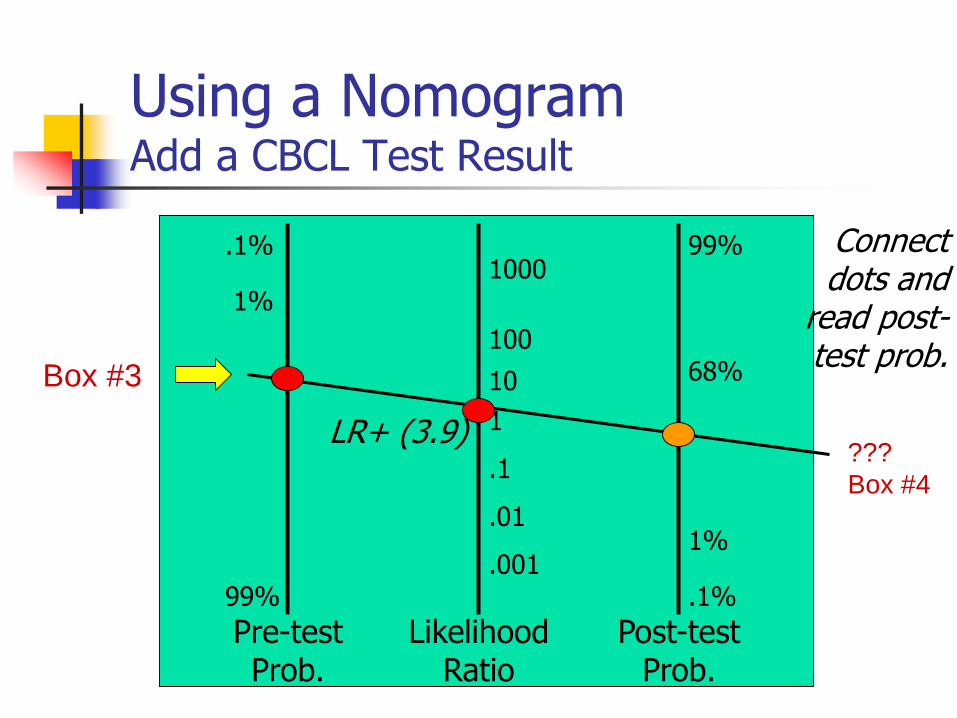
Using a NomogramAdd a CBCL Test Result
Pre-testProb.
LikelihoodRatio
Post-testProb.
.1%
1%
99%
99%
1%
.1%
1000
100
10
1
.1
.01
.001
68%
LR+ (3.9)
Connect dots and
read post-test prob.
Box #3
???
Box #4
Esti
mate
d P
rob
ab
ilit
y o
f B
ipo
lar
Dia
gn
osis
100
80
60
40
20
0
Frequency
120 100 80 60 40 20 0
100
80
60
40
20
0
120100806040200
NomogramClinical Judgment
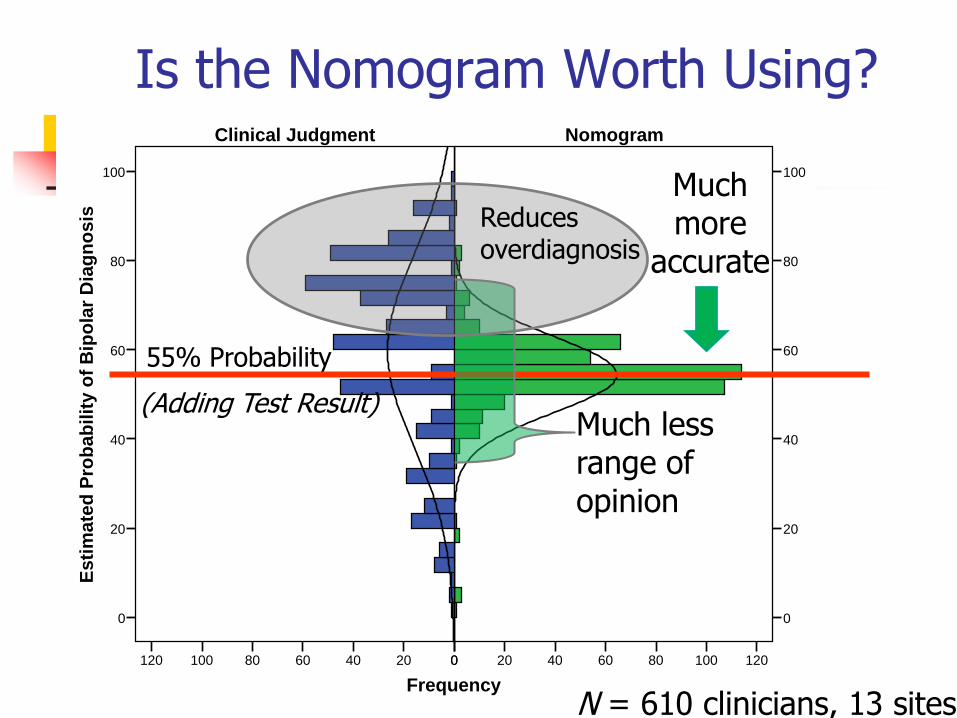
Is the Nomogram Worth Using?
55% Probability
(Adding Test Result)
N = 610 clinicians, 13 sites
Still extreme range of opinion
Most tend to overdiagnose
Esti
mate
d P
rob
ab
ilit
y o
f B
ipo
lar
Dia
gn
osis
100
80
60
40
20
0
Frequency
120 100 80 60 40 20 0
100
80
60
40
20
0
120100806040200
NomogramClinical Judgment
Is the Nomogram Worth Using?
55% Probability
(Adding Test Result)
N = 610 clinicians, 13 sites
Much more
accurate
Much less range of opinion
Reduces overdiagnosis
Esti
mate
d P
rob
ab
ilit
y o
f B
ipo
lar
Dia
gn
osis
100
80
60
40
20
0
Frequency
120 100 80 60 40 20 0
100
80
60
40
20
0
120100806040200
NomogramClinical Judgment
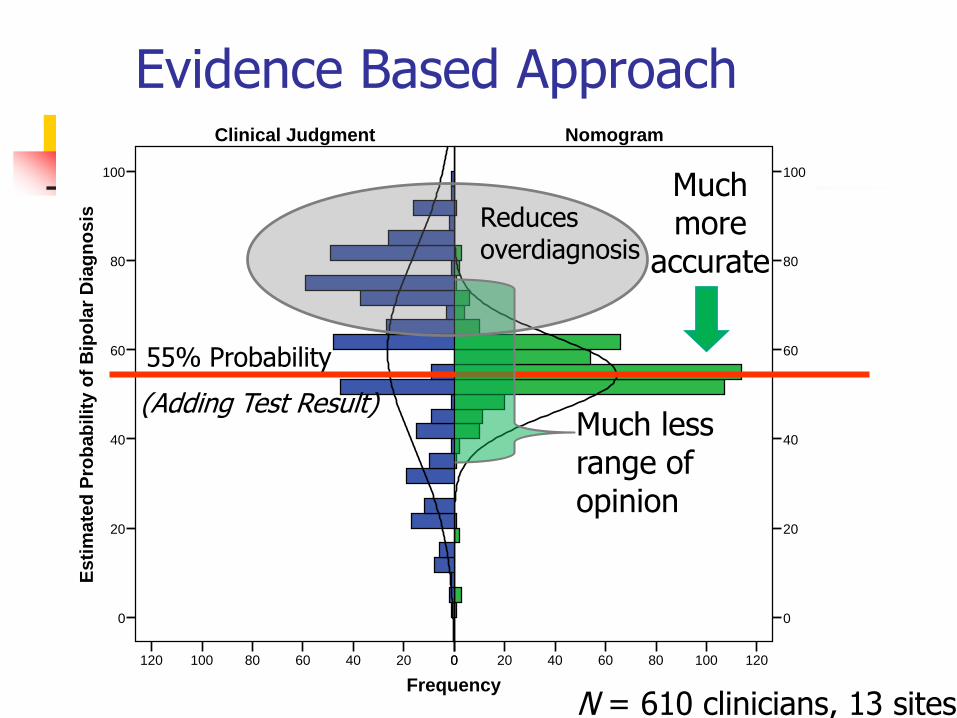
Evidence Based Approach
55% Probability
(Adding Test Result)
N = 610 clinicians, 13 sites
Much more
accurate
Much less range of opinion
Reduces overdiagnosis
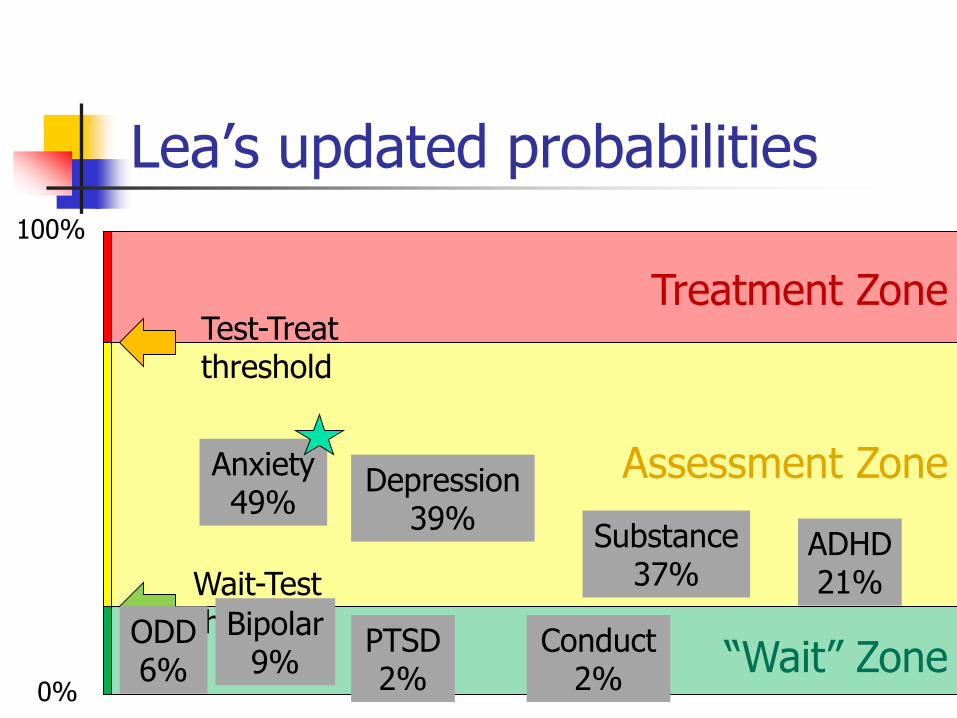
Lea’s updated probabilities
0%
100%
Treatment Zone
Assessment Zone
“Wait” Zone
Test-Treatthreshold
Wait-Testthreshold
ADHD21%
Depression39%
Anxiety49%
Substance37%
Bipolar9%
Conduct2%
PTSD2%
ODD6%
Next step: Get another perspective (E)
Routine with children and adolescents to get caregiver; often teacher ratings
Lea “on the bubble”
18 years old
Has left home
Now living with older sister
Choice point: Older sister or bio mom’s perspective?
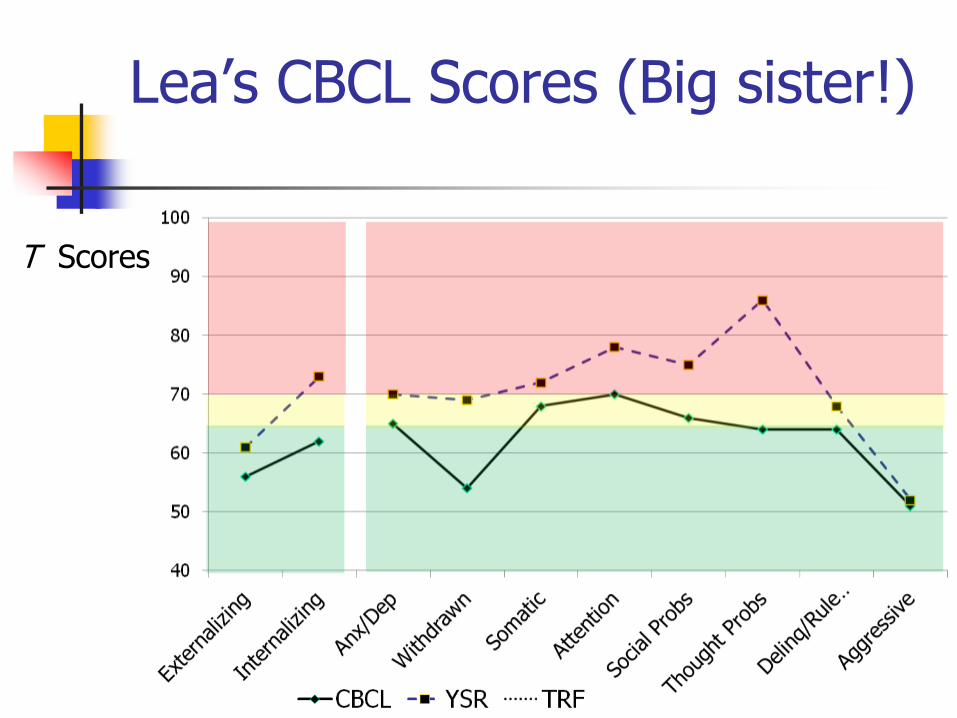
Lea’s CBCL Scores (Big sister!)
T Scores
Check the details & probes (Drotar, Stein, & Perrin, 1995)
CBCL
Check the details & probes (Drotar, Stein, & Perrin, 1995)
More substance issues
Sleep problems – bipolar clue? CBCL
Another Step: Ask about risk factors (c)
Why did Lea move in with sister?
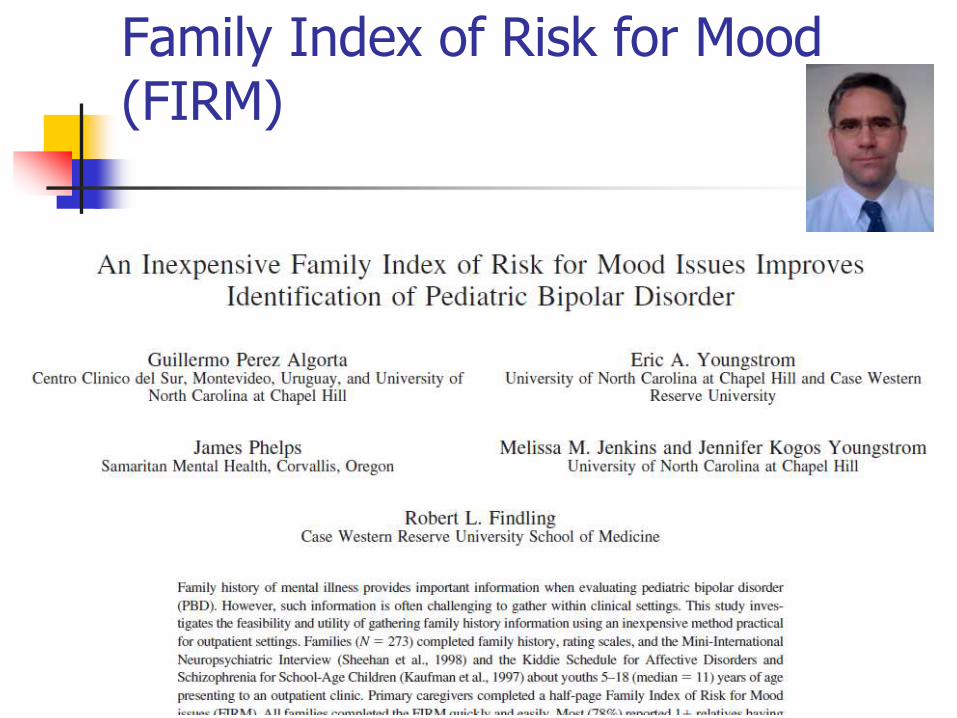
Family Index of Risk for Mood (FIRM)
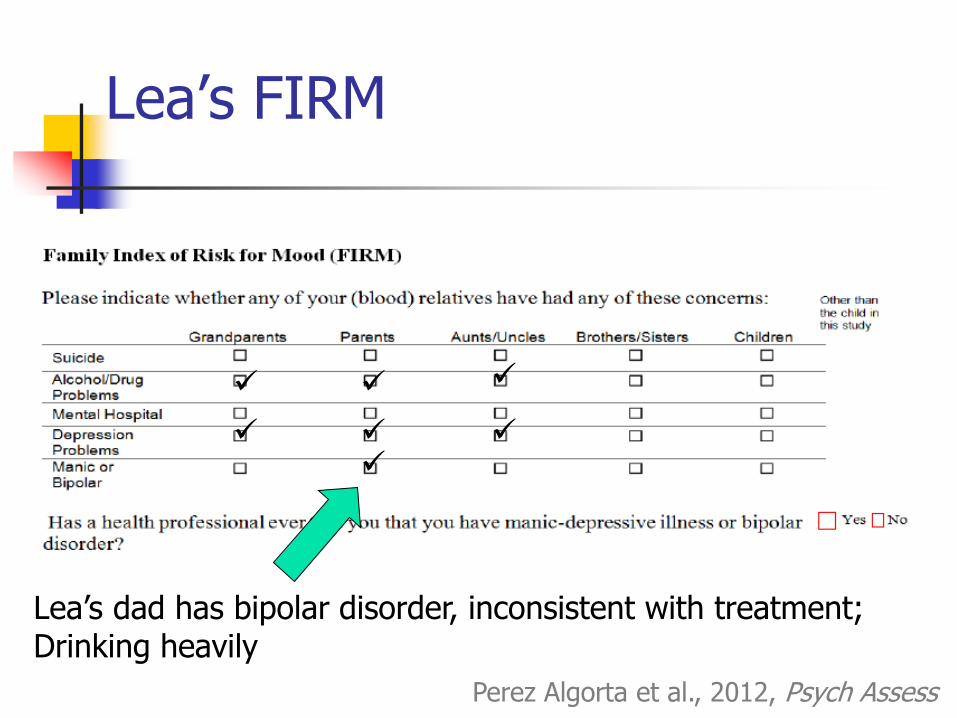
Lea’s FIRM
Perez Algorta et al., 2012, Psych Assess
Lea’s dad has bipolar disorder, inconsistent with treatment; Drinking heavily
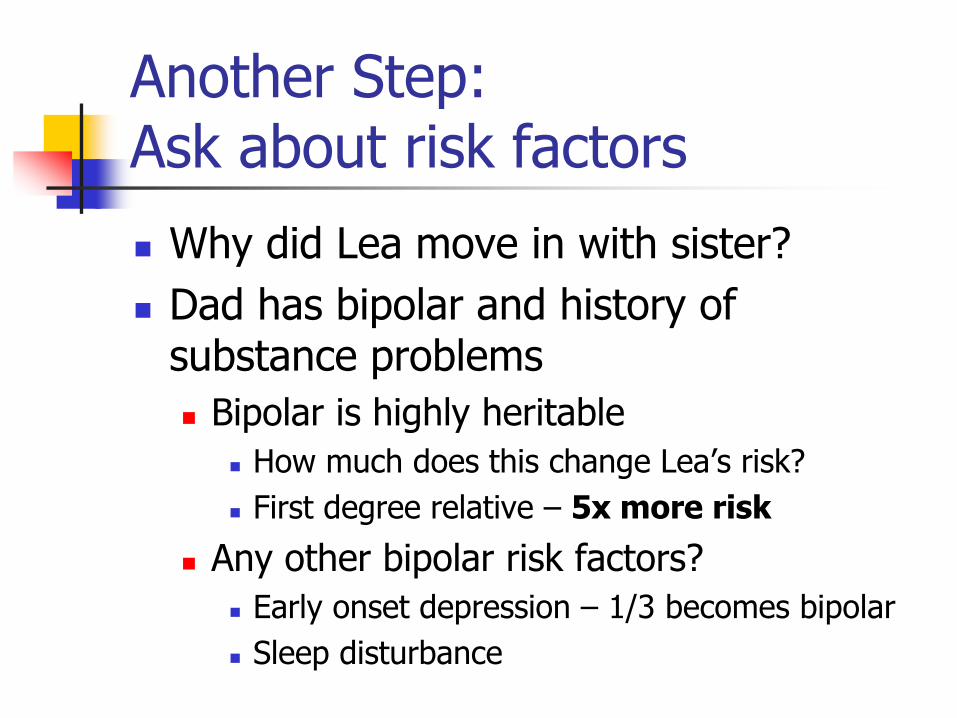
Another Step: Ask about risk factors
Why did Lea move in with sister?
Dad has bipolar and history of substance problems
Bipolar is highly heritable
How much does this change Lea’s risk?
First degree relative – 5x more risk
Any other bipolar risk factors?
Early onset depression – 1/3 becomes bipolar
Sleep disturbance
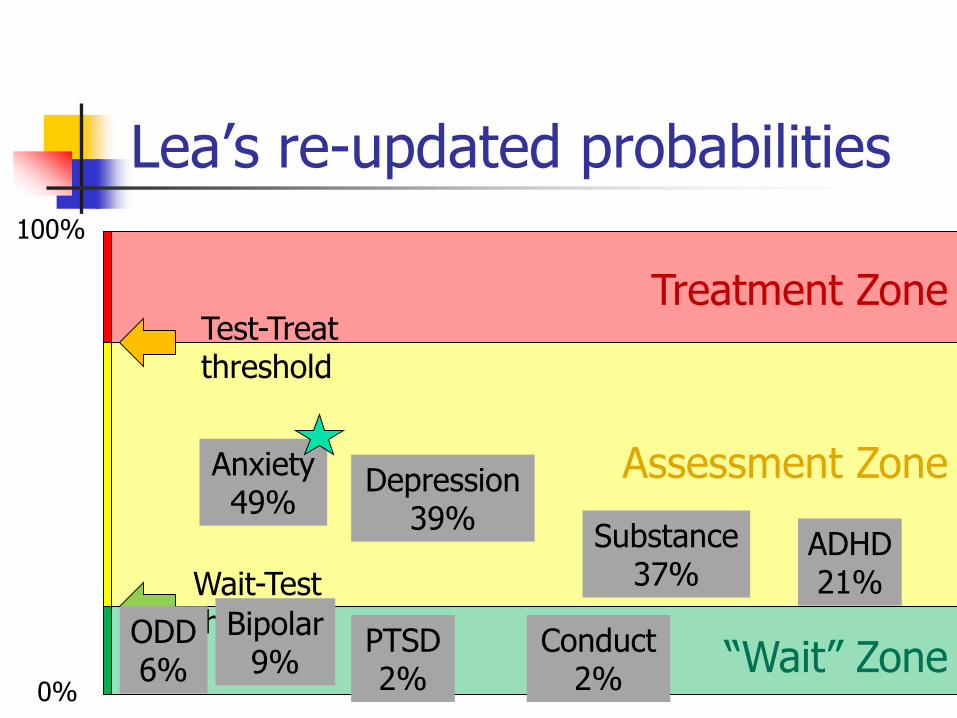
Lea’s re-updated probabilities
0%
100%
Treatment Zone
Assessment Zone
“Wait” Zone
Test-Treatthreshold
Wait-Testthreshold
ADHD21%
Depression39%
Anxiety49%
Substance37%
Bipolar9%
Conduct2%
PTSD2%
ODD6%
Adding more information (G)
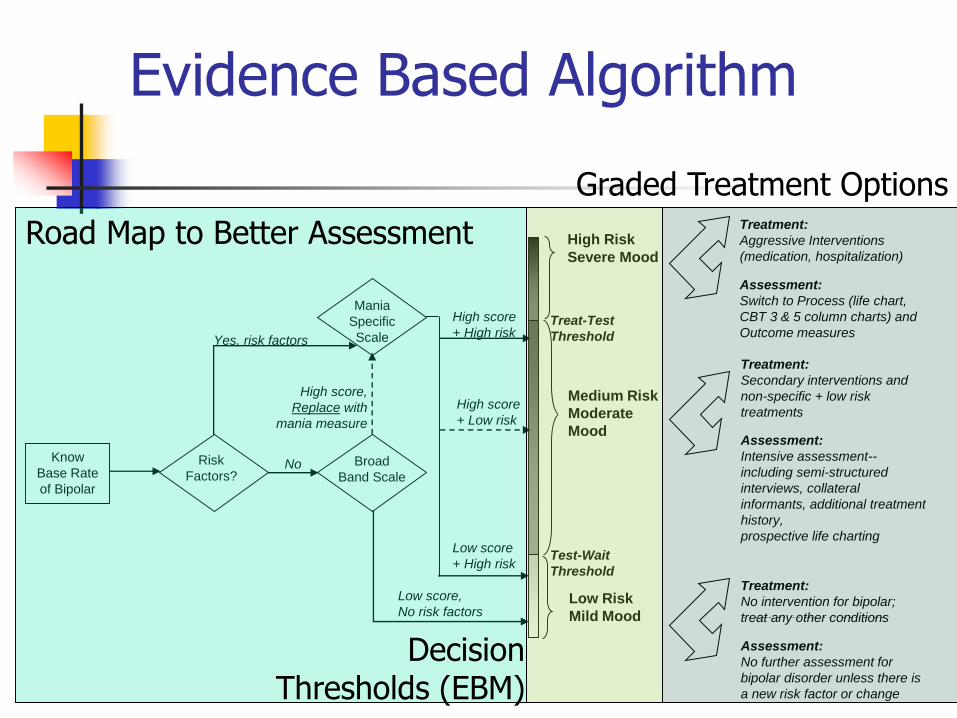
Evidence Based Algorithm
High score
+ Low risk
Low score
+ High risk
High score
+ High risk
High score,
Replace with
mania measure
Low score,
No risk factors
Yes, risk factors
NoRisk
Factors?
Know
Base Rate
of Bipolar
Broad
Band Scale
Mania
Specific
Scale
Test-Wait
Threshold
Treat-Test
Threshold
High Risk
Severe Mood
Medium Risk
Moderate
Mood
Low Risk
Mild Mood
Treatment:
Aggressive Interventions
(medication, hospitalization)
Assessment:
Switch to Process (life chart,
CBT 3 & 5 column charts) and
Outcome measures
Treatment:
Secondary interventions and
non-specific + low risk
treatments
Assessment:
Intensive assessment--
including semi-structured
interviews, collateral
informants, additional treatment
history,
prospective life charting
Continue assessment until
probability crosses the
Treat or Wait Thresholds
Treatment:
No intervention for bipolar;
treat any other conditions
Assessment:
No further assessment for
bipolar disorder unless there is
a new risk factor or change
Road Map to Better Assessment
Decision Thresholds (EBM)
Graded Treatment Options
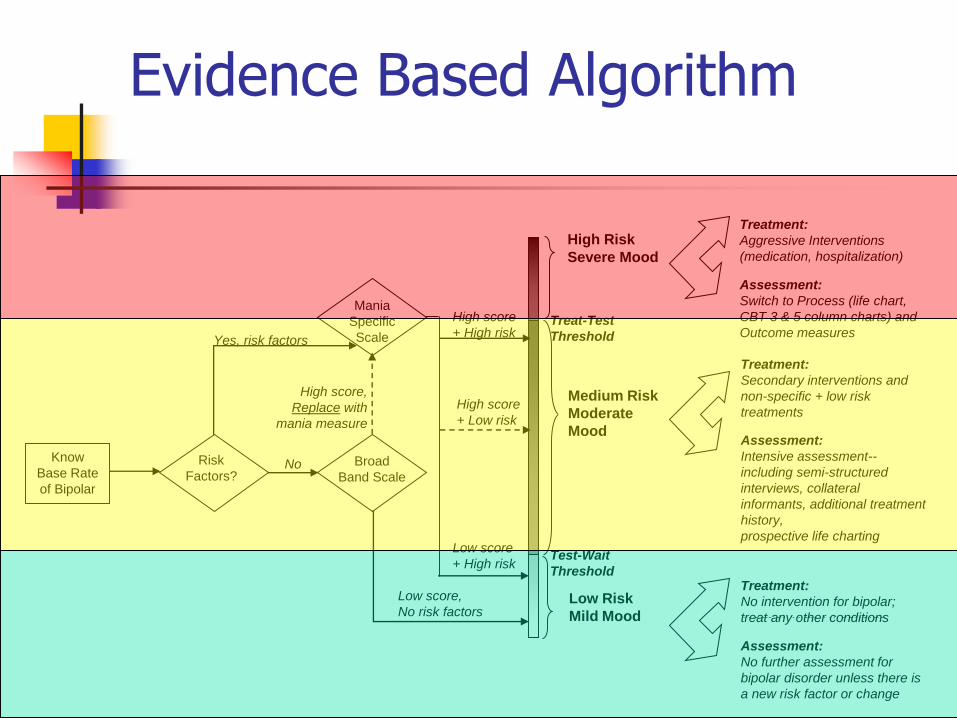
Evidence Based Algorithm
High score
+ Low risk
Low score
+ High risk
High score
+ High risk
High score,
Replace with
mania measure
Low score,
No risk factors
Yes, risk factors
NoRisk
Factors?
Know
Base Rate
of Bipolar
Broad
Band Scale
Mania
Specific
Scale
Test-Wait
Threshold
Treat-Test
Threshold
High Risk
Severe Mood
Medium Risk
Moderate
Mood
Low Risk
Mild Mood
Treatment:
Aggressive Interventions
(medication, hospitalization)
Assessment:
Switch to Process (life chart,
CBT 3 & 5 column charts) and
Outcome measures
Treatment:
Secondary interventions and
non-specific + low risk
treatments
Assessment:
Intensive assessment--
including semi-structured
interviews, collateral
informants, additional treatment
history,
prospective life charting
Continue assessment until
probability crosses the
Treat or Wait Thresholds
Treatment:
No intervention for bipolar;
treat any other conditions
Assessment:
No further assessment for
bipolar disorder unless there is
a new risk factor or change
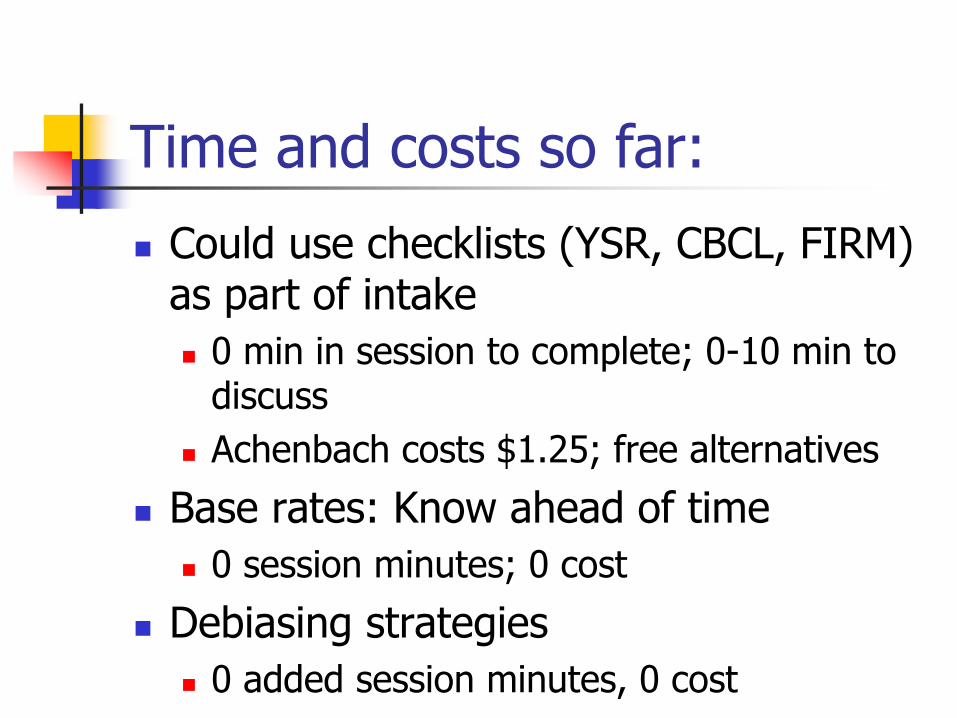
Time and costs so far:
Could use checklists (YSR, CBCL, FIRM) as part of intake
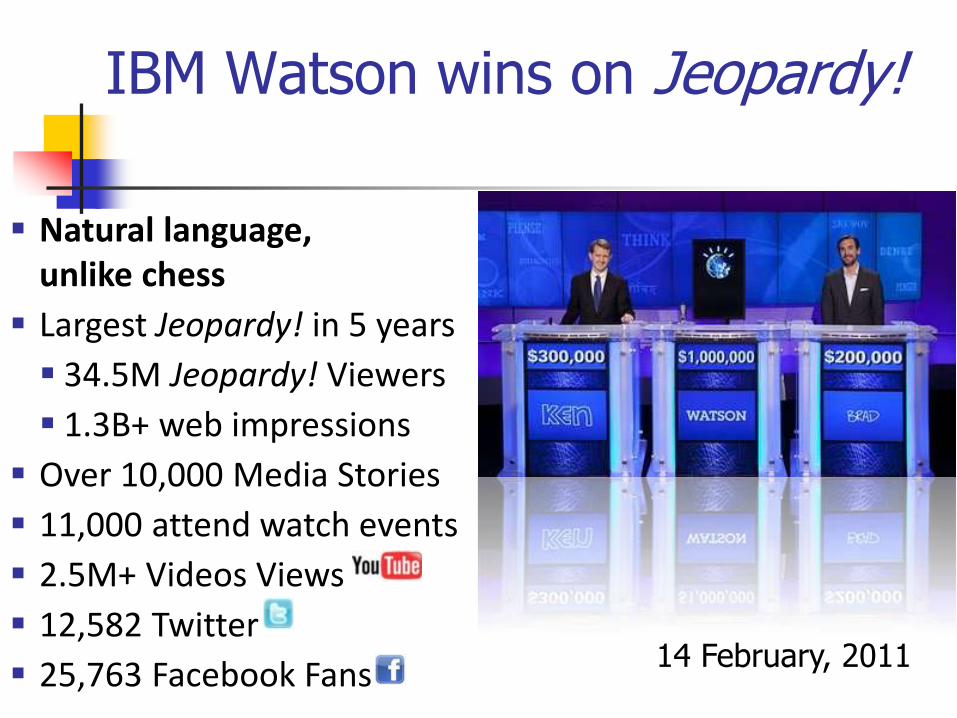
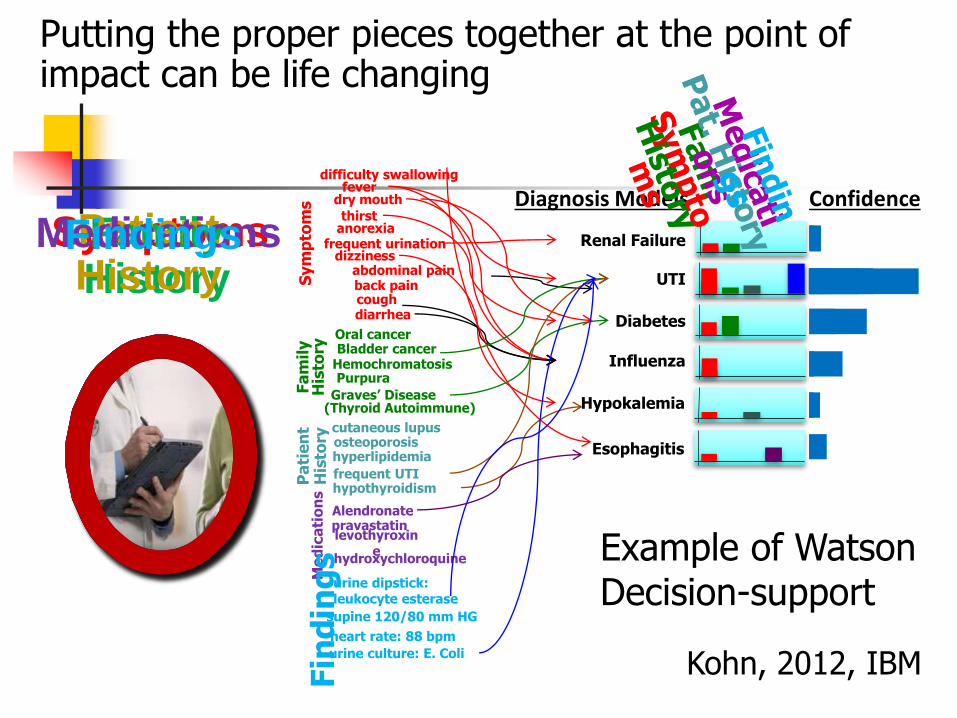
Putting the proper pieces together at the point of impact can be life changing
Kohn, 2012, IBM
Example of Watson Decision-support
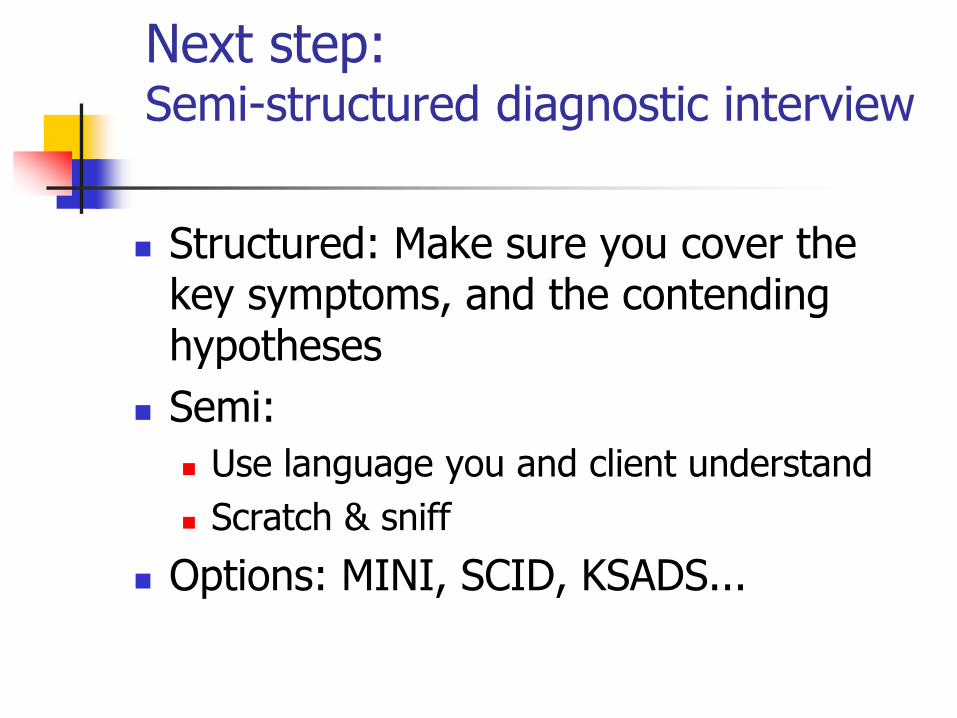
Next step: Semi-structured diagnostic interview
Structured: Make sure you cover the key symptoms, and the contending hypotheses
Semi:
Use language you and client understand
Scratch & sniff
Options: MINI, SCID, KSADS...
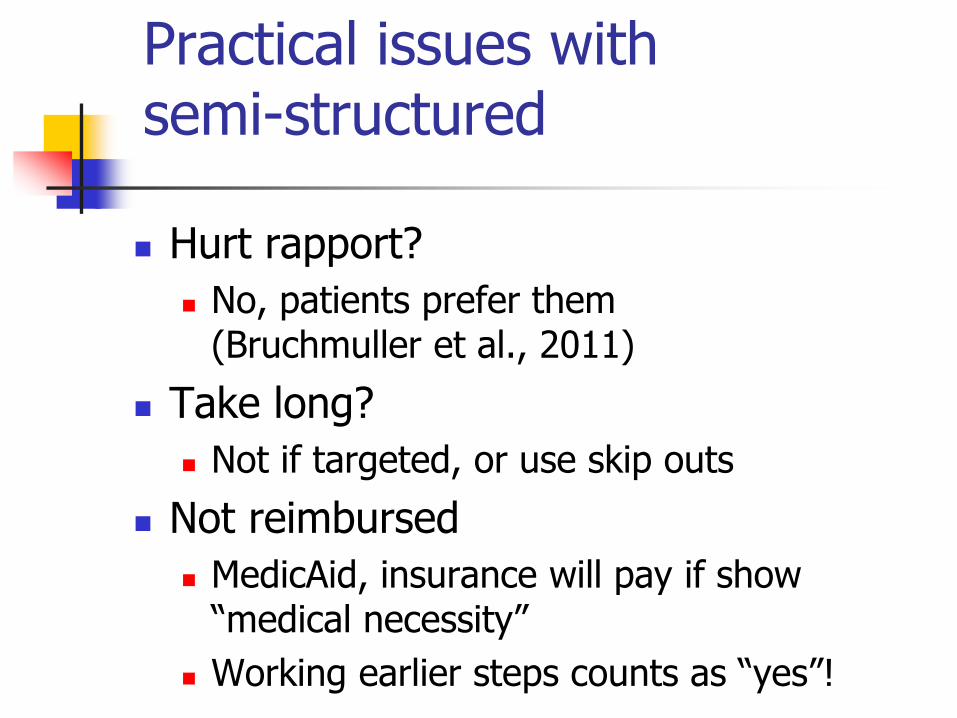
Practical issues with semi-structured
Hurt rapport?
No, patients prefer them (Bruchmuller et al., 2011)
Take long?
Not if targeted, or use skip outs
Not reimbursed
MedicAid, insurance will pay if show “medical necessity”
Working earlier steps counts as “yes”!
Lea after MINI
Bipolar II (depression + hypomania)
Substance abuse
ADHD Predominantly inattentive
What is bipolar II?
Major depression + hypomania
Could be mixed depression, mixed hypomania
How different from ordinary depression?
Poor response to antidepressants
Higher risk of suicide and NSSI
Higher risk of substance misuse
Often more atypical features
Hypersomnia, increased appetite
Changes prognosis, and treatment
“Moodquakes”
Pick treatment goals
Lea not on board with substance as focus of treatment
Would fight “diagnosis” (Step L!)
Lea agreed with depression as focus of treatment
Bipolar II as a way of describing type of depression
Focusing on stability versus activation
Agreed to be honest about substance use, see if it changed as depression went down
Setting Goals (H)
Severity measures can help define goals
Some have norms
Benchmarks for comparison
Get client input (L)
Goals should be motivating
Measurable
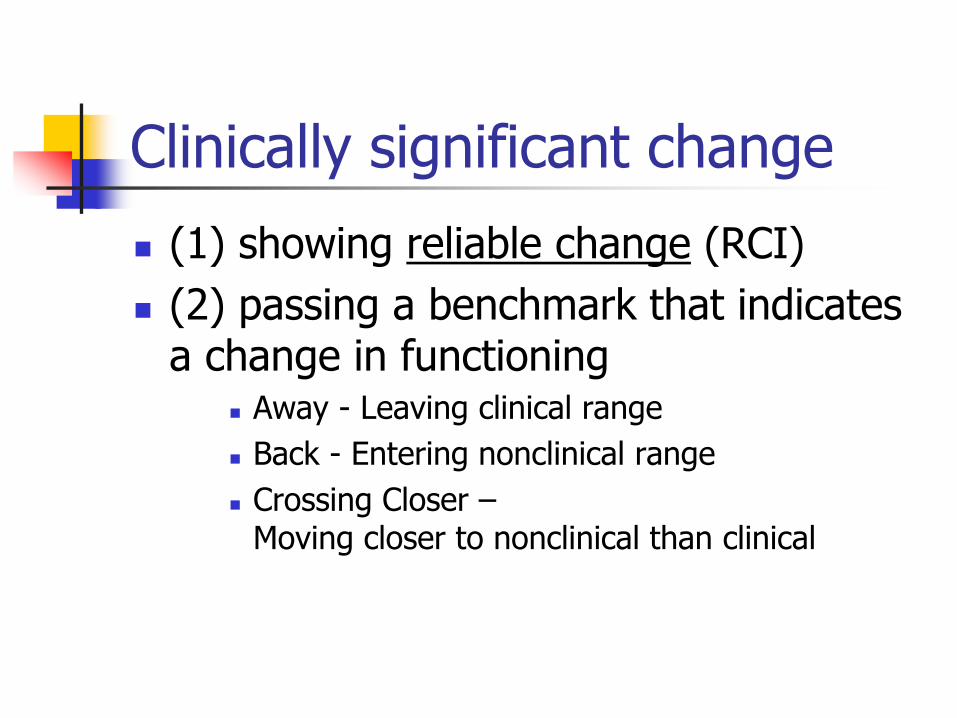
Clinically significant change
(1) showing reliable change (RCI)
(2) passing a benchmark that indicates a change in functioning
Away - Leaving clinical range
Back - Entering nonclinical range
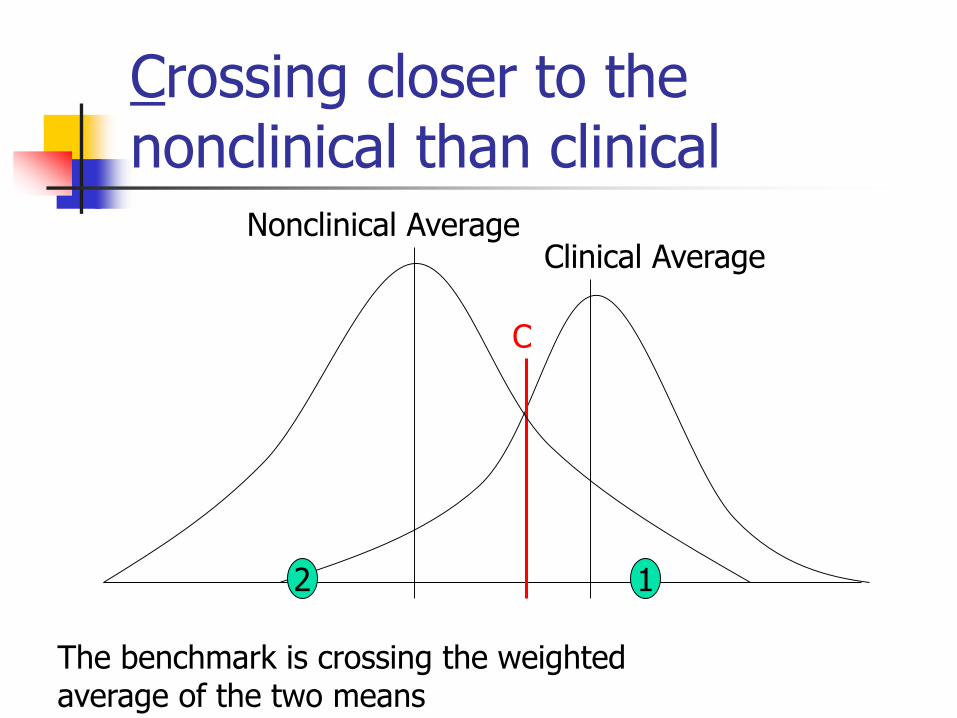
Crossing Closer –Moving closer to nonclinical than clinical
Three Benchmarks: The ABCs of Change
Away from the Clinical distribution of scores
Back into the nonclinical range of scores
Crossing closer to the nonclinical than the clinical range of scores
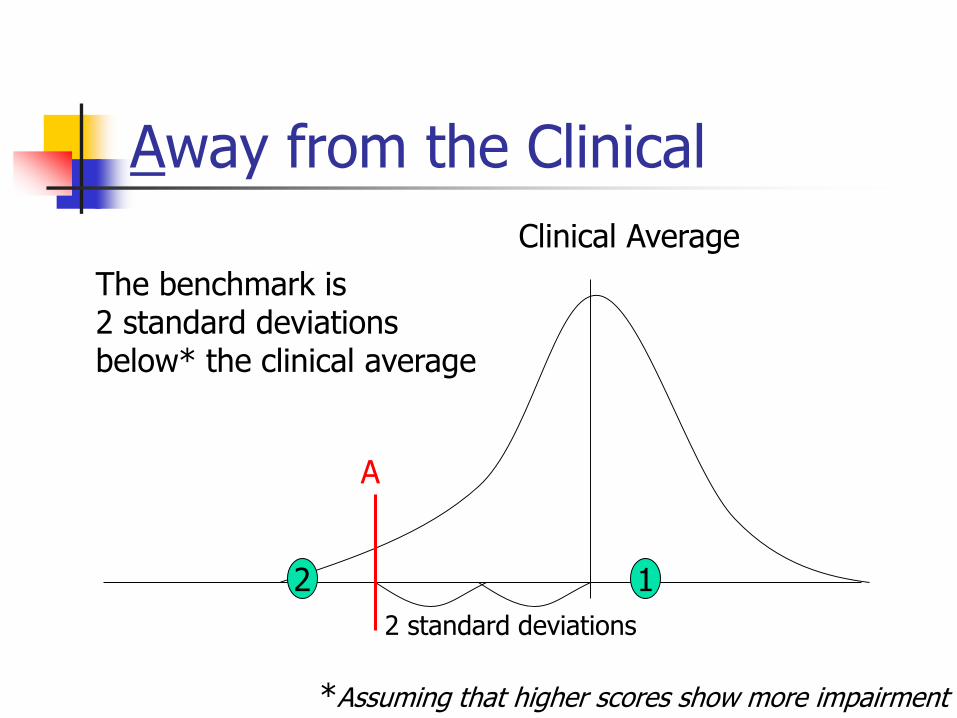
Away from the Clinical
Clinical Average
2 standard deviations
A
12
The benchmark is2 standard deviations below* the clinical average
*Assuming that higher scores show more impairment
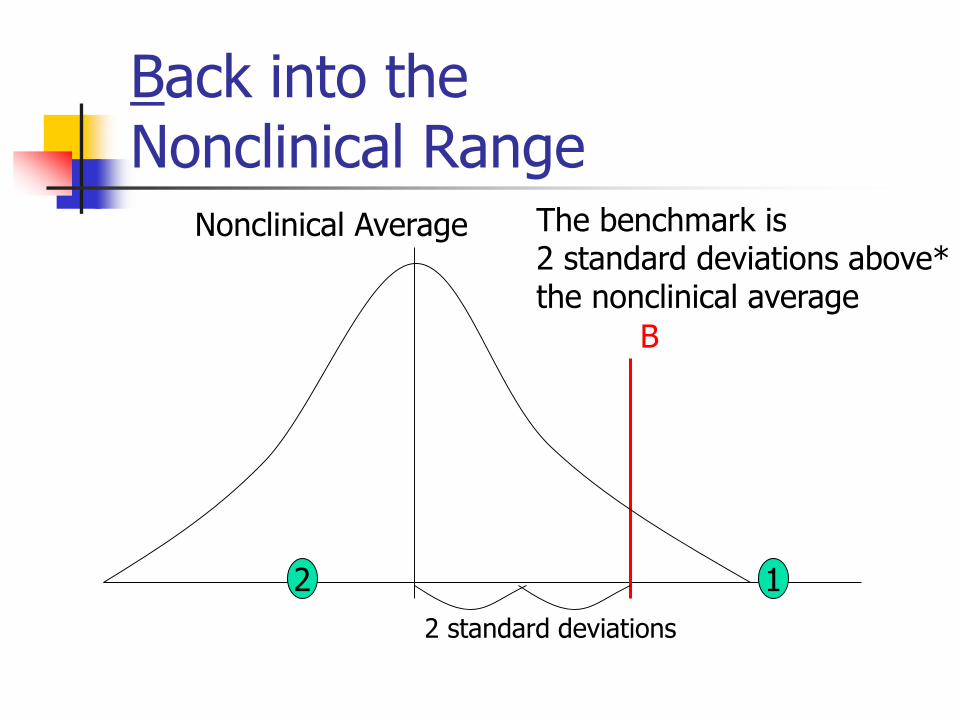
Back into the Nonclinical Range
B
12
Nonclinical Average
2 standard deviations
The benchmark is 2 standard deviations above* the nonclinical average
Crossing closer to the nonclinical than clinical
Clinical Average
C
12
The benchmark is crossing the weighted average of the two means
Nonclinical Average
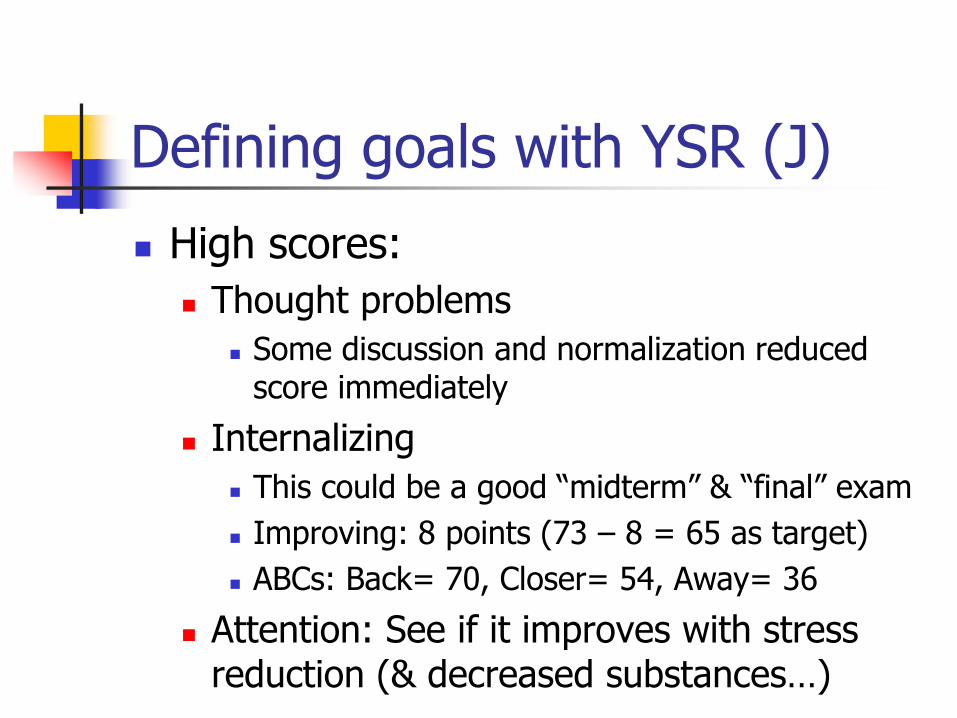
Defining goals with YSR (J)
High scores:
Thought problems
Some discussion and normalization reduced score immediately
Internalizing
This could be a good “midterm” & “final” exam
Improving: 8 points (73 – 8 = 65 as target)
ABCs: Back= 70, Closer= 54, Away= 36
Attention: See if it improves with stress reduction (& decreased substances…)
Progress measures (I,J)
Need to be short (asking client to repeat them)
Focus on goals
Can check progress quickly
Like bathroom scale for diet
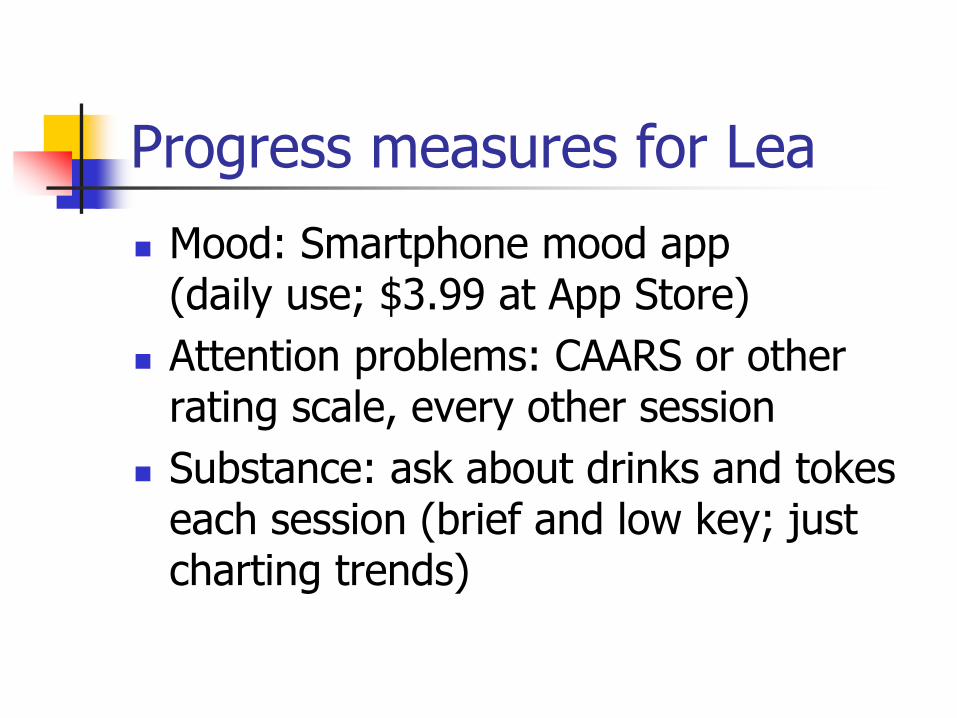
Progress measures for Lea
Mood: Smartphone mood app (daily use; $3.99 at App Store)
Attention problems: CAARS or other rating scale, every other session
Substance: ask about drinks and tokes each session (brief and low key; just charting trends)
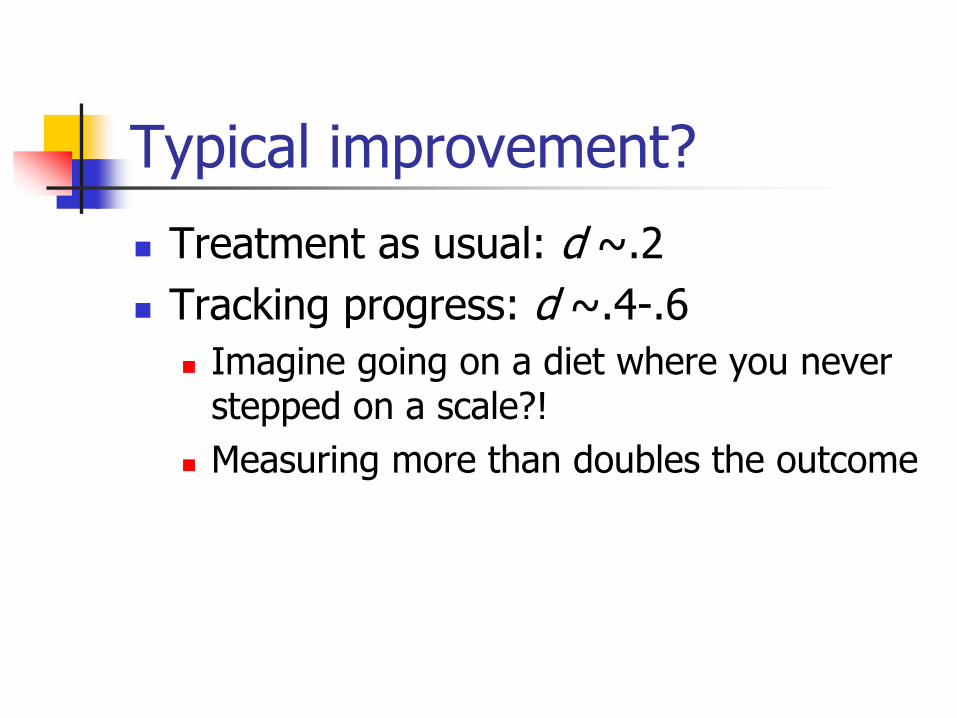
Typical improvement?
Treatment as usual: d ~.2
Tracking progress: d ~.4-.6
Imagine going on a diet where you never stepped on a scale?!
Measuring more than doubles the outcome
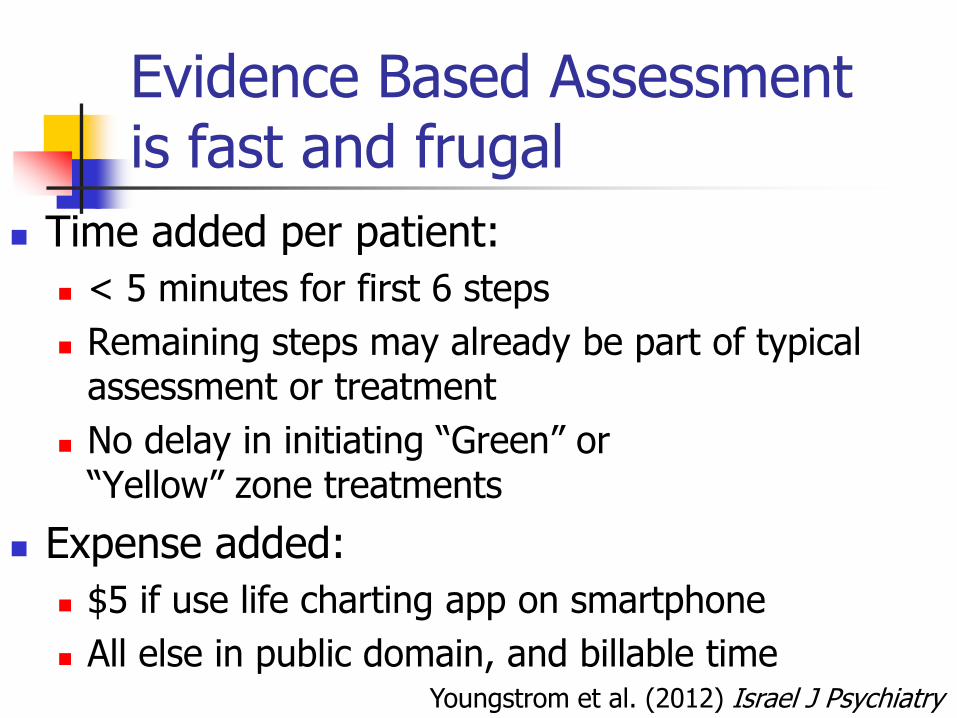
Evidence Based Assessmentis fast and frugal
Time added per patient:
< 5 minutes for first 6 steps
Remaining steps may already be part of typical assessment or treatment
No delay in initiating “Green” or “Yellow” zone treatments
Expense added:
$5 if use life charting app on smartphone
All else in public domain, and billable timeYoungstrom et al. (2012) Israel J Psychiatry
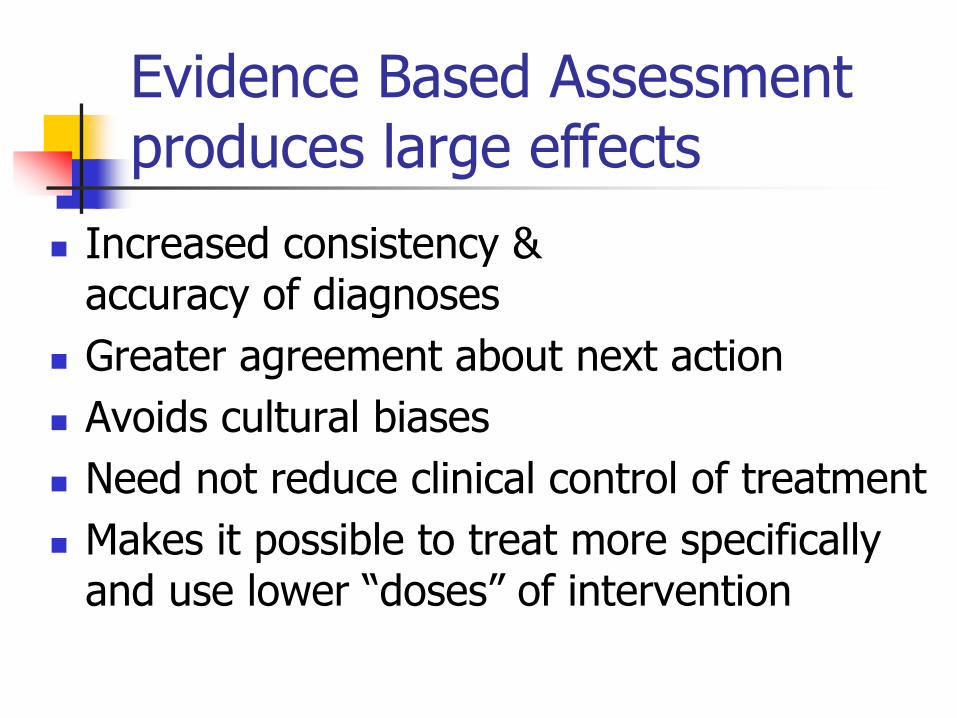
Evidence Based Assessment produces large effects
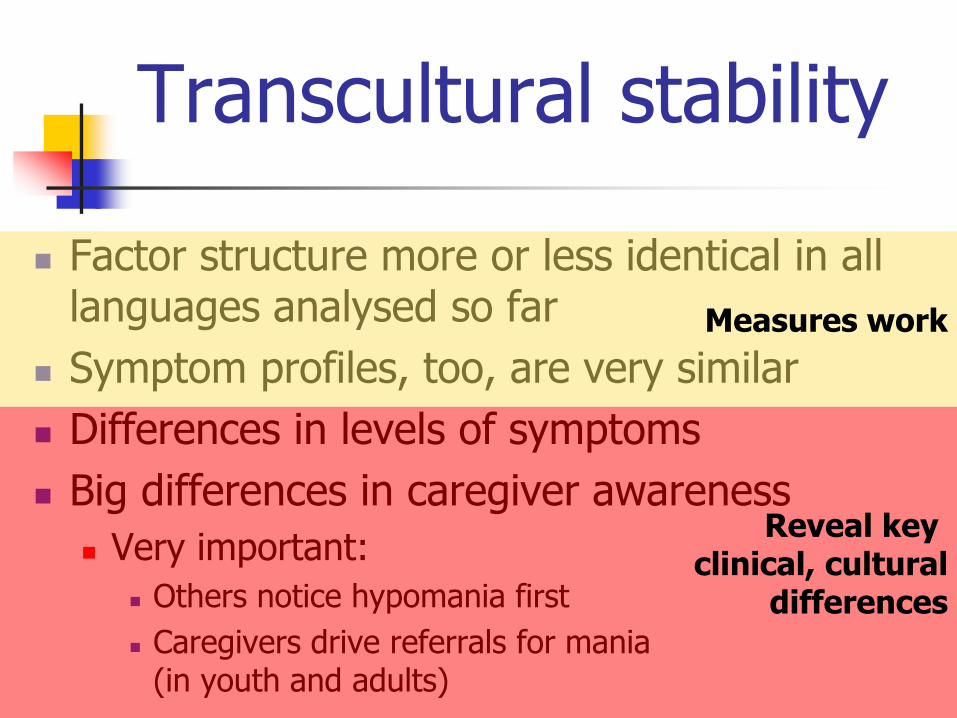
Increased consistency & accuracy of diagnoses
Greater agreement about next action
Avoids cultural biases
Need not reduce clinical control of treatment
Makes it possible to treat more specifically and use lower “doses” of intervention
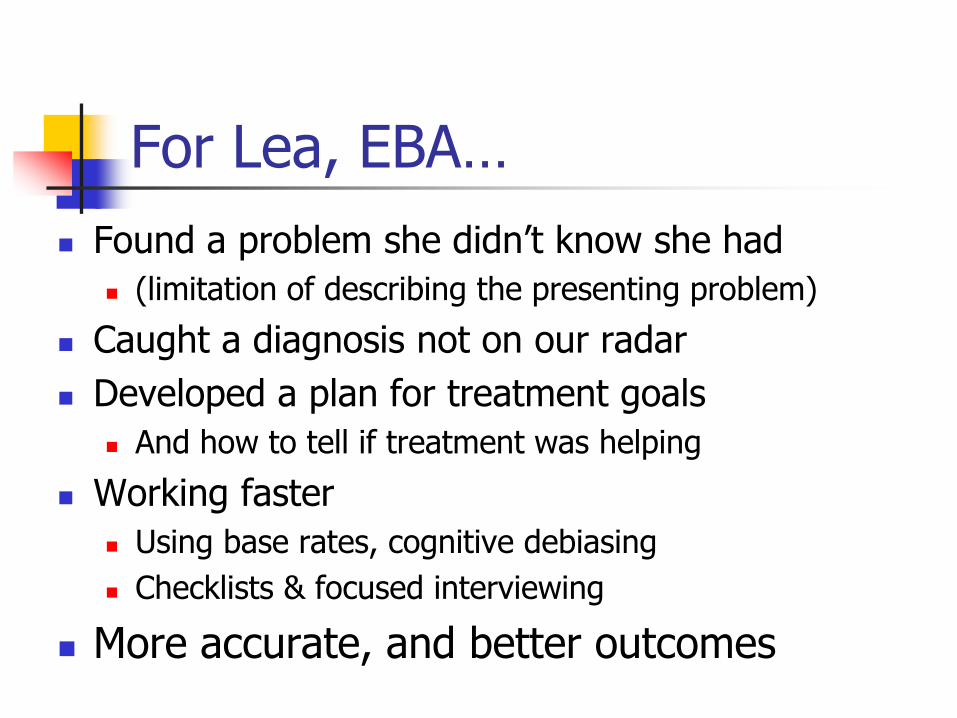
For Lea, EBA…
Found a problem she didn’t know she had
(limitation of describing the presenting problem)
Caught a diagnosis not on our radar
Developed a plan for treatment goals
And how to tell if treatment was helping
Working faster
Using base rates, cognitive debiasing
Checklists & focused interviewing
More accurate, and better outcomes
Your next client
Circle the steps you are confident you’ll be able to use – twice
Circle the “stretch goals” once
Ask supervisor for support
What are common diagnoses?
What tools are available to assess?
Commit to try one step this week…
Share with your team! (many hands…)s
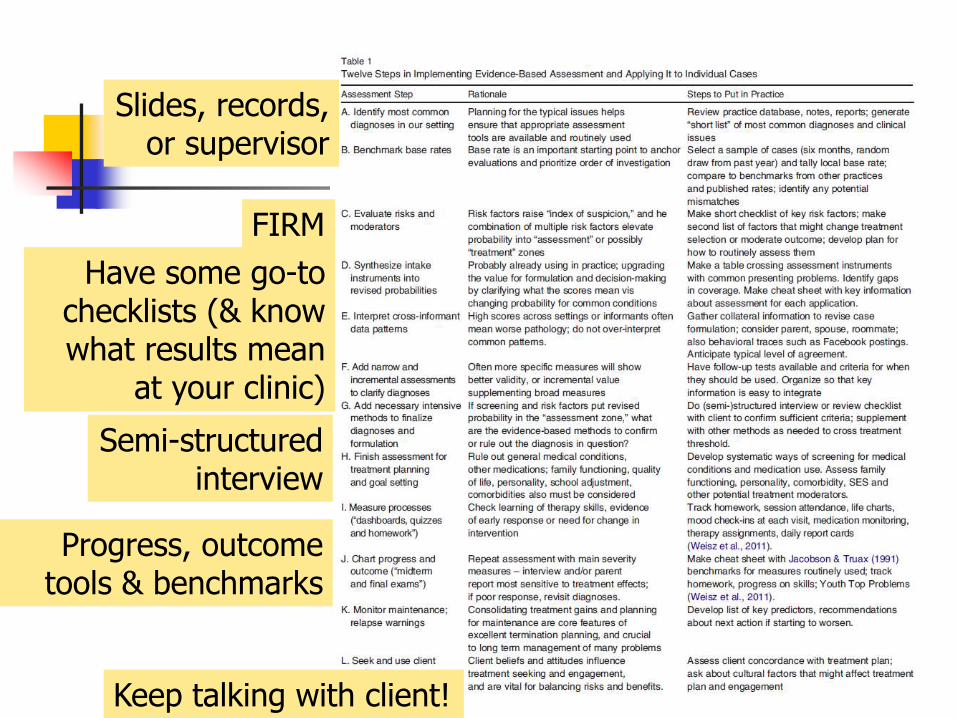
FIRM
Slides, records,or supervisor
Have some go-to checklists (& know what results mean
at your clinic)
Semi-structuredinterview
Progress, outcome tools & benchmarks
Keep talking with client!
Thank You!
Questions, Suggestions, and Comments
Please send to: Eric Youngstrom, Ph.D.Department of Psychology University of North Carolina at Chapel Hill, Psychology, Davie Hall, CB3270Chapel Hill, NC 27599-3270