DIFFERENTIAL EXPRESSION AND REDOX PROTEOMICS ANALYSESOF AN ALZHEIMER DISEASE TRANSGENIC MOUSE MODEL:EFFECTS OF THE AMYLOID-� PEPTIDE OF AMYLOID PRECURSOR
ROTEIN�
A
se
wAwaAKKbs
cA
R. A. S. ROBINSON,a1 M. B. LANGE,a R. SULTANA,a
V. GALVAN,b2 J. FOMBONNE,b O. GOROSTIZA,b
J. ZHANG,b G. WARRIER,a J. CAI,c W. M. PIERCE,c
D. E. BREDESENb,d AND D. A. BUTTERFIELDa*aDepartment of Chemistry, Center of Membrane Sciences, and Sand-rs-Brown Center on Aging, University of Kentucky, Lexington, KY0506, USA
bBuck Institute for Age Research, Novato, CA 94945, USAcDepartment of Pharmacology, University of Louisville, Louisville, KY0292, USA
dDepartment of Neurology, University of California, San Francisco, CA4143, USA
Abstract—Among the pathological factors known to be asso-ciated with Alzheimer disease (AD), oxidative stress inducedby the amyloid-� peptide (A�) has been demonstrated to play
key role in human brain and animal models of AD. Recently,e reported elevated levels of oxidative damage in the brainf a transgenic (Tg) AD mouse model with Swedish and
ndiana familial AD mutations in human amyloid precursorrotein (APP) [PDAPP mice, line J20], as evidenced by in-reased levels of protein carbonyls, 3-nitrotyrosine, and pro-ein-bound 4-hydroxy-2-nonenal. This oxidative damage wasependent on the methionine 35 residue within the A� pep-
ide. Further insight into the molecular pathways affected inhis Tg model of AD may be gained with discovery-basedroteomics studies; therefore, two-dimensional gel-basedxpression proteomics was performed to compare differ-nces in brain protein levels of J20 Tg mice with non-trans-enic (NTg) littermate controls. Based on our studies, we
dentified six proteins that had significantly increased levelsn J20 Tg relative to NTg mice: calcineurin subunit B type 1,
� GDP-dissociation inhibitor 1, T-complex protein 1 subunit �A, �-enolase, peptidyl-prolyl cis-trans isomerase (Pin-1), and
1 Present address: Department of Chemistry, University of Pittsburgh,ittsburgh, PA 15260, USA.
2 Present address: Department of Physiology and The Barshop Insti-ute, University of Texas Health Science Center at San Antonio, Sanntonio, TX, USA.This manuscript is dedicated to the life and career of William R.arkesbery, MD, a pioneer and extraordinary presence in the field ofD research, and a deep personal friend. Dr. Markesbery died onanuary 30, 2010, leaving an exemplary record of achievement and aife well-lived.Corresponding author. Tel: �1-859-257-3184; fax: �1-859-257-5876.-mail address: [email protected] (D. A. Butterfield).bbreviations: AD, Alzheimer disease; APP, amyloid precursor pro-
Key words: Alzheimer disease, amyloid �-peptide, expres-ion proteomics, transgenic mouse model of Alzheimer dis-ase, redox proteomics.
Alzheimer disease (AD) is an age-related neurodegenera-tive disorder that is clinically manifested by progressivesigns of cognitive decline and memory impairment (Priceet al., 1998). Familial cases of AD have been linked pri-marily to mutations in genes such as amyloid precursorprotein (APP) (Goate et al., 1991), presenilin-1 (PS-1), andpresenilin-2 (PS-2) (Cruts et al., 1998); however, othergenes such as apolipoprotein E, allele 4 (Levy-Lahad etal., 1995; Slooter et al., 1998), endothelial nitric oxidesynthase-3 (Dahiyat et al., 1999), and �2-macroglobulin(Blacker et al., 1998) have been found in other AD cases.Histopathological hallmarks of AD include senile plaques(SP), neurofibrillary tangles (NFT), and synapse loss. Ad-ditionally, oxidative stress has been implicated in thepathogenesis of AD (Smith et al., 1994, 1997; Good et al.,1996; Markesbery, 1997; Butterfield and Lauderback,2002; Butterfield et al., 2006b).
SPs are largely composed of amyloid-� (A�) peptides,hich are generated by �- and �-secretase cleavage of thePP protein. The most common forms of A� associatedith human AD are A�(1-40) and A�(1-42) (Selkoe, 1996),nd the latter has been shown to be more toxic than�(1-40) in model systems of AD (Butterfield and Boyd-imball, 2004; Mohmmad Abdul et al., 2004, 2006; Boyd-imball et al., 2005a,b,c). Overproduction of APP (causedy duplication of chromosome 21 genetic mutations) sub-equently leads to increased levels of A� (Selkoe, 2001).
In familial AD, mutations close to the �- and �-secretaseleavage sites are thought to lead to increased levels of�. While A� peptides can exist as monomers, oligomers,
fibrils, or aggregates, the soluble A�(1-42) oligomers arets reserved.
R. A. S. Robinson et al. / Neuroscience 177 (2011) 207–222208
believed to be the most toxic species in AD brain (Drake etal., 2003; Demuro et al., 2005; Selkoe, 2008; Viola et al.,2008). The major consequences of this toxicity are theobserved cognitive losses in learning and memory (Walshet al., 2002; Selkoe, 2008). Our laboratory and others haveprovided considerable evidence that A�(1-42) induces ox-idative stress in AD and various AD model systems (Pap-polla et al., 1999; Drake et al., 2003; Boyd-Kimball et al.,2004, 2005c; Sultana et al., 2005; Ansari et al., 2006,Mohmmad Abdul et al., 2006; Abdul et al., 2008; Resendeet al., 2008; Zhu et al., 2008).
Recently, we published reports of increased levels ofoxidative stress in a PDAPP transgenic mouse model ofAD as measured by protein oxidation [i.e. protein carbon-yls and 3-nitrotyrosine (3-NT)] and lipid peroxidation [i.e.4-hydroxy-2-nonenal (HNE)] (Butterfield et al., 2010). ThisPDAPP model (hereafter, referred to as J20 Tg) has mu-tations in human APP corresponding to the Swedish (670/671KM¡ML) and Indiana (717V¡F) familial forms of AD(Mucke et al., 2000; Galvan et al., 2006). J20 Tg mice haveaspects of AD pathology, such as A� accumulation, neu-ritic plaque formation, and memory deficits (Mucke et al.,2000; Galvan et al., 2006). Oxidative stress in J20 Tg micecan be directly correlated with these pathological hall-marks (Butterfield et al., 2010).
In this study, we sought to gain insight into the specificproteins that are altered in this AD model using expressionand redox proteomics techniques in a discovery-basedapproach. Alterations of brain proteins from J20 Tg mice incomparison to non-transgenic (NTg) littermate controlswere identified following two-dimensional polyacrylamidegel electrophoresis (2D-PAGE) separation employingmass spectrometry (MS) and database searching tech-niques. Redox proteomic experiments also were per-formed to identify brain proteins with significant differencesin oxidative modification in J20 Tg mice as measured by3-NT. PD-Quest results were validated using Western blot-ting and immunoprecipitation analyses of peptidyl-prolylcis-trans isomerase (Pin-1). Overall, findings from theseproteomics studies enhance the understanding of alteredpathways in AD and provide potential targets for AD pre-vention and treatment that warrant further investigation.
EXPERIMENTAL PROCEDURES
All chemicals, proteases, and antibodies used in these studieswere purchased from Sigma-Aldrich (St. Louis, MO, USA) withexceptions noted. Criterion precast polyacrylamide gels, TGS andXT MES electrophoresis running buffers, ReadyStrip™ IPG strips,
ineral oil, Precision Plus Protein™ All Blue Standards, SyproRuby® Protein Stain, nitrocellulose membranes, dithiothreitolDTT), iodoacetamide (IA), Biolytes, and urea were purchasedrom Bio-RAD (Hercules, CA, USA). 2,4-DinitrophenylhydrazineDNPH) and the primary antibody used for the protein-bound,4-dinitrophenylhydrazone (DNP) products were purchased fromhemicon International (Temecula, CA, USA). Rabbit polyclonalnti-Pin-1 [H-123] primary antibody was purchased from Santaruz Biotechnologies, Inc. (Santa Cruz, CA, USA). AmershamCL rabbit IgG horseradish peroxidase (HRP)-linked secondaryntibody and ECL-Plus Western blotting detection reagents were
urchased from GE Healthcare (Pittsburgh, PA, USA).
Animals
The IACUC of the Buck Institute for Age Research approved allanimal studies, which were carried out at the Buck Institute’sAAALAC-accredited vivarium. The generation of platelet-derivedgrowth factor (PDGF) �-chain promoter-driven human APP mini-ene (hAPP) carrying the Swedish (670/671KM¡ML) and Indiana717V¡F) mutations (hAPPSw,In) has been described previously
(Hsia et al., 1999; Mucke et al., 2000). All male PDAPP (J20 line)Tg mice were kept in their original C57BL/J6 background andwere originally provided by Professor Lennart Mucke (GladstoneInstitute and UC-San Francisco). J20 Tg expresser lines weremaintained by heterozygous crosses with C57BL/J6 breeders(The Jackson Laboratory, Bar Harbor, ME, USA), and all Tganimals were heterozygous with respect to the transgene. Malenon-transgenic (NTg) littermates were used as controls in allstudies. Experimental groups of animals were: NTg, n�5; J20 Tg,n�10.
Sample preparation
A one-half portion of brain was homogenized using a Wheatonglass homogenizer (�100 passes) in Media I buffer [0.32 Msucrose, 0.10 mM Tris–HCl (pH 8.0), 0.10 mM MgCl2, 0.08 mMEDTA, 10 �g/ml leupeptin, 0.5 �g/ml pepstatin, 11.5 �g/ml apro-tinin; pH 8.0]. Homogenates were vortexed and sonicated for 10 sat 20% power with a Fisher 550 Sonic Dismembrator (Pittsburgh,PA, USA). Protein concentrations were determined according tothe Pierce BCA method (Rockford, IL, USA).
Isoelectric focusing (IEF)
Proteins from brain homogenates (200 �g) were precipitated byddition of ice-cold 100% trichloroacetic acid (TCA) to obtain anal concentration of 15% (v/v) TCA in solution and incubated once for 10 min. For protein carbonyl analysis, samples were firsterivatized in 4� the sample volume of 10 mM DNPH in 2 N HClor 30 min at room temperature (RT), followed by protein precip-tation with TCA as described above. For 3-NT analysis, samplesere acetone precipitated according to the manufacturer’s instruc-
ions (Pierce, Rockford, IL, USA), except 100% acetone washilled to �20 °C and added at 4� the sample volume andncubated for 60 min at �80 °C.
Samples were centrifuged at 14,000 rpm (23,700�g) for 5in at 4 °C. Pellets were resuspended and rinsed in a Wash buffer
1:1 (v/v) ethanol:ethyl acetate] a total of four times to removexcess salts. Following the final wash, pellets were dried at RT for10 min and rehydrated for 2 h at RT in 200 �l of a Rehydration
buffer [8 M urea, 2 M thiourea, 50 mM DTT, 2.0% (w/v) CHAPS,0.2% Biolytes, Bromophenol Blue], and then sonicated for 10 s at20% power. Samples (200 �l) were applied to 11 cm pH 3-10
eadyStrip™ IPG strips and after 1 h, 2 ml of mineral oil wasadded to prevent sample evaporation. Strips were actively rehy-drated at 20 °C for 18 h at 50 V, focused at a constant temperatureof 20 °C beginning at 300 V for 2 h, 500 V for 2 h, 1000 V for 2 h,8000 V for 8 h, and finishing at 8000 V for 10 h rapidly. IPG stripswere stored at �80 °C until the second dimension of analysis wasperformed.
Two-dimensional polyacrylamide gel electrophoresis(2D-PAGE)
2D-PAGE was performed to separate proteins on IEF strips basedon molecular migration rate. IEF strips were thawed and equili-brated for 10 min in equilibration buffer A [50 mM Tris–HCl, pH6.8, 6 M urea, 1% (w/v) SDS, 30% v/v glycerol, 0.5% DTT] andthen re-equilibrated for 10 min in equilibration buffer B [50 mMTris–HCl, pH 6.8, 6 M urea, 1% (w/v) SDS, 30% v/v glycerol, 4.5%
IA]. All strips were rinsed in a 1� dilution of TGS running buffer
ttGD
qIodtae
wsstmstMf
adi
wso
tg
sl[Sot6fMdfItieR2Cnbimwi
9airtftt
nfsa(
R. A. S. Robinson et al. / Neuroscience 177 (2011) 207–222 209
before being placed into Criterion precast linear gradient (8–16%)Tris–HCl polyacrylamide gels. Precision Plus Protein™ All BlueStandards and samples were run at a constant voltage of 200 Vfor 65 min.
SYPRO Ruby® staining
Following 2D-PAGE, gels were incubated in a Fixing solution [7%(v/v) acetic acid, 10% (v/v) methanol] for 20 min at RT. SyproRuby® Protein Gel Stain (�50 ml) was added to gels and allowedo stain overnight at RT on a gently rocking platform. Gels wereransferred to �50 ml of deionized water at RT until scanning.els were scanned into Adobe Photoshop 6.0 with a Molecularynamics STORM phosphoimager (�ex/�em: 470/618 nm) and
stored in deionized water at 4 °C until further use.
2D-Western blotting
Following 2D-PAGE, in-gel proteins were transferred to a nitrocel-lulose membrane (0.45 �m) for immunochemical detection ofprotein-resident 3-NT. Gels were transferred using a Trans-BlotSemi-Dry Transfer Cell system at 20 V for 2 h (BioRAD, Hercules,CA, USA). Post-transfer, membranes were incubated in a blockingsolution of 3% bovine serum albumin (BSA) in Wash Blot [phos-phate-buffered saline (PBS) solution containing 0.04% (v/v)Tween 20 and 0.10 M NaCl] at RT for 2 h. Nitrated proteins weredetected by incubation with rabbit polyclonal anti-Nitrotyrosine(1:2000) primary antibody in blocking solution at RT on a rockingplatform for 2–3 h. Blots were rinsed three times for 5 min each inWash Blot, followed by a 1 h incubation with rabbit IgG alkalinephosphatase (1:3000) secondary antibody at RT. Blots wererinsed five times for 5, 15, 15, 15, and 5 min each in Wash Blot anddeveloped colorimetrically with a solution of 5-Bromo-4-chloro-3-indolyl phosphate dipotassium combined with NitrotetrazoliumBlue Chloride (BCIP/NBT) in ALP buffer [0.1 M Tris, 0.1 M NaCl,5 mM MgCl2 · 6 H2O (pH 9.5)]. Blots were allowed to dry overnightat RT prior to scanning into Adobe Photoshop 6.0 with a CanonCanoScan 8800F scanner.
Image analysis
Differential expression. Spot intensities from SYPRORuby®-stained 2D-gel images of J20 Tg and NTg samples wereuantified densitometrically according to the total spot density.ntensities were normalized to total gel densities and/or densitiesf all valid spots on the gels. Only spots with a 1.5-fold increase orecrease in normalized spot density in J20 Tg samples comparedo NTg samples and a statistically significant difference based on
Student’s t-test at 95% confidence (i.e. P�0.05) were consid-red for MS analysis.
Oxidative modification. Western blot PD-Quest analysisas performed with densitometric quantitation of J20 Tg and NTgpots. Spots on blots were aligned and matched with the corre-ponding protein spots among differential gels. Blot immunoreac-ivity (nitration) was normalized to the total protein content aseasured by the intensity of SYPRO Ruby®-stained gels. Only
pots with statistically significant increases or decreases in pro-ein-resident 3-NT levels, as calculated by a Student’s t-test andann–Whitney U Statistical test at 95% confidence were selected
or in-gel trypsin digestion and subsequent MS analysis.
In-gel trypsin digestion
In-gel trypsin digestion of selected gel spots was performed aspreviously described (Thongboonkerd et al., 2002). Briefly, proteinspots identified as significantly altered in J20 Tg mice relative toNTg controls were excised from 2D-gels with a clean, sterilizedblade and transferred to Eppendorf microcentrifuge tubes. Gel
plugs were then washed with 0.1 M ammonium bicarbonate m
(NH4HCO3) at RT for 15 min, followed by incubation with 100%cetonitrile at RT for 15 min. After solvent removal, gel plugs wereried in their respective tubes under a flow hood at RT. Plugs were
ncubated for 45 min in 20 �l of 20 mM DTT in 0.1 M NH4HCO3 at56 °C. The DTT/NH4HCO3 solution was then removed and re-placed with 20 �l of 55 mM IA in 0.1 M NH4HCO3 and incubated
ith gentle agitation at RT in the dark for 30 min. Excess IAolution was removed and plugs incubated for 15 min with 200 �lf 50 mM NH4HCO3 at RT. A volume of 200 �l of 100% acetoni-
trile was added to this solution and incubated for 15 min at RT.Solvent was removed and gel plugs were allowed to dry for 30 minat RT under a flow hood. Plugs were rehydrated with 20 ng/�l ofmodified trypsin (Promega, Madison, WI, USA) in 50 mMNH4HCO3 in a shaking incubator overnight at 37 °C. Enoughrypsin solution was added in order to completely submerge theel plugs.
Mass spectrometry (MS)
Salts and contaminants were removed from tryptic peptide solu-tions using C18 ZipTips (Sigma-Aldrich, St. Louis, MO, USA),reconstituted to a volume of �15 �l in a 50:50 water:acetonitrileolution containing 0.1% formic acid. Tryptic peptides were ana-yzed with an automated Nanomate electrospray ionization (ESI)Advion Biosciences, Ithaca, NY, USA] Orbitrap XL MS (Thermo-cientific, Waltham, MA, USA) platform. The Orbitrap MS wasperated in a data-dependent mode whereby the eight most in-ense parent ions measured in the Fourier Transform (FT) at0,000 resolution were selected for ion trap fragmentation with theollowing conditions: injection time 50 ms, 35% collision energy,S/MS spectra were measured in the FT at 7500 resolution, andynamic exclusion was set for 120 s. Each sample was acquiredor a total of �2.5 min. MS/MS spectra were searched against thenternational Protein Index (IPI) database using SEQUEST andhe following parameters: two trypsin miscleavages, fixed carbam-domethyl modification, variable Methionine oxidation, parent tol-rance 10 ppm, and fragment tolerance of 25 mmu or 0.01 Da.esults were filtered with the following criteria: Xcorr�1.5, 2.0,.5, 3.0 for �1, �2, �3, and �4 charge states, respectively, DeltaN�0.1, and P-value (protein and peptide) �0.01. IPI accessionumbers were cross-correlated with SwissProt accession num-ers for final protein identification. It should be noted that proteins
dentified with a single peptide were kept for further analyses ifultiple spectral counts (SC, number of observed MS/MS spectra)ere observed in a single analysis or if the peptide was identified
n a separate analysis and workup of the same protein spot.
Western blotting validation
One-dimensional polyacrylamide gel electrophoresis (1D-PAGE). Brain homogenates (75 �g) were suspended in sam-ple loading buffer [0.5 M Tris, pH 6.8, 40% glycerol, 8% SDS,20% �-mercaptoethanol, 0.01% Bromophenol Blue], heated at
5 °C for 5 min, and cooled on ice prior to gel loading. Samplesnd Precision Plus Protein™ All Blue Standards were loaded
nto a Criterion precast (12%) Bis-Tris polyacrylamide gel andan at RT in a Criterion Cell™ vertical electrophoresis bufferank filled with a 1� dilution of XT MES running buffer at 80 Vor �10 min to ensure proper protein stacking. The voltage washen increased to 140 V for �110 min at RT for the duration ofhe electrophoretic run.
1D-Western blotting. 1D-gels were directly transferred toitrocellulose membranes for Western blot analysis as describedor 2D-PAGE above, using rabbit anti-Pin-1 (H-123) or anti-ATPynthase [1:2000] primary antibody, with a rabbit polyclonal anti-ctin (1:8000) primary antibody used as the loading control. Pin-1or ATP-synthase) and actin primary antibodies were added si-
ultaneously, as each antibody is specific for particular proteins
[4cPfcfotPtawa28c
a
ds
R. A. S. Robinson et al. / Neuroscience 177 (2011) 207–222210
whose MWs do not overlap. Secondary antibody incubation wascompleted as described above for 2D-PAGE blotting, with excep-tions. Pin-1 blots were incubated with an Amersham ECL rabbitIgG HRP-linked (1:8000) secondary antibody, and developedchemifluorescently with a 40:1 dilution of ECL-Plus Western blot-ting detection reagents A and B, respectively. After developing for5 min at RT while covered, blots were scanned on a phosphoim-ager (�ex/�em: 470/618 nm) and quantified using the 1D-compo-nent of ImageQuant TL software (GE Healthcare, Pittsburgh, PA,USA).
Immunoprecipitation
Protein samples (250 �g) were first incubated with a Lysing buffer5 N NaCl, 1 M Tris–HCl, (pH 7.6), 0.5% NP-40, 4 �g/ml leupeptin,
�g/ml pepstatin, 5 �g/ml aprotinin] for 30 min at 4 °C withontinuous agitation. Samples were precleared with Protein GLUS/Protein A agarose beads (CalBiochem, La Jolla, CA, USA)
or 1 h at 4 °C with continuous agitation. Following a 5 minentrifugation at 3000 rpm for 5 min, supernatants were trans-erred to new Eppendorf microcentrifuge tubes, and incubatedvernight in rabbit anti-Pin-1 (H-123) antibody (1:2000) with con-inuous agitation. Samples were incubated with Protein G PLUS/rotein A agarose beads for 1 h at 4 °C and beads washed five
imes in RIA buffer [5 N NaCl, 1 M Tris–HCl (pH 7.6), 1% NP-40]t 3000 rpm for 5 min at 4 °C. Following the final wash, beadsere prepared for 1D-PAGE separation and 1D-Western blotting,s described above, using rabbit polyclonal anti-Nitrotyrosine (1:000) primary and Amersham ECL rabbit IgG HRP-linked (1:000) secondary antibodies. Blots were developed chemifluores-ently (�ex/�em: 470/618 nm) and quantified using ImageQuant TL
software.
Statistical analysis
All data are presented as meanSD or meanSEM, as noted,and statistical analyses were performed using a two-tailed Stu-dent’s t-test, wherein P�0.05 was considered significant forWestern and Immunoprecipitation analyses. A Mann–WhitneyU statistical analysis was performed to determine the signifi-cance of differential expression fold-change values and oxida-tive modification levels, wherein a P�0.05 was consideredsignificant. Significance was also confirmed using a Student’st-test. Protein and peptide identifications obtained with theSEQUEST search algorithm with a P-value less than 0.01 wereconsidered as statistically significant. To further validate PD-Quest and SEQUEST identification of significantly differentspots, the location of protein spots on the 2D-gels were man-ually checked to ensure they were near the expected molecularweight (MW) and isoelectric point (pI) values based on Swis-sProt database information.
RESULTS
Proteomics
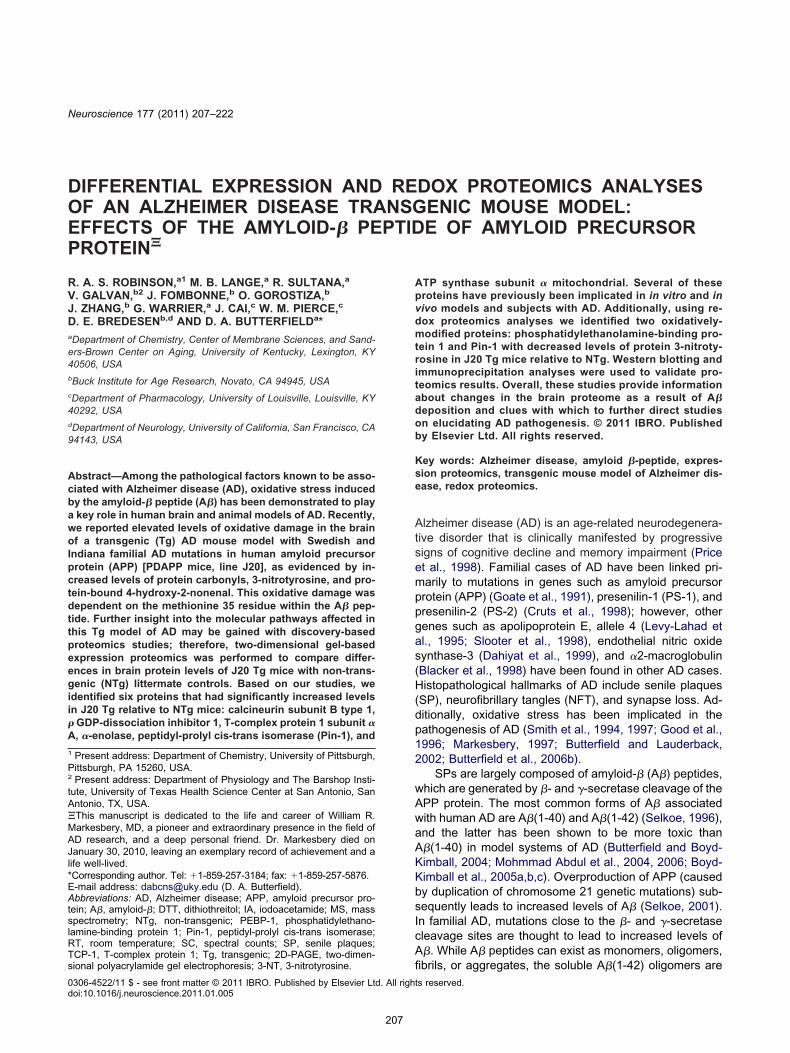
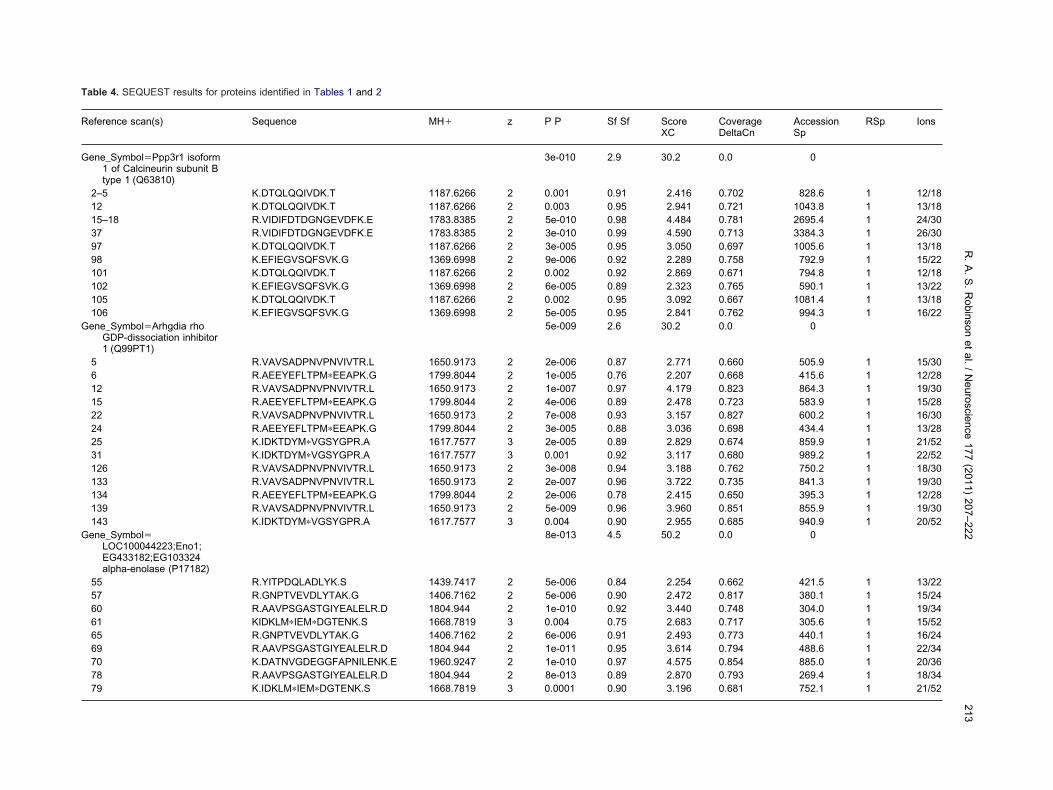
We performed proteomics analysis on proteins isolatedfrom the brains of J20 Tg and NTg mice using a 2D-PAGEapproach. Fig. 1 shows examples of 2D-gel images fromthese analyses. A total of six protein spots were identifiedas having significant changes in intensity between J20 Tgand NTg mice. Interestingly, all six of these proteins weresignificantly up-regulated in the brains of J20 Tg mice.Tryptic digestion and MS analysis was carried out on ex-cised protein spots, and Table 1 provides a list of theprotein identifications corresponding to these spots. Also
given in Table 1 are the number of peptide sequences and (
SC identified for each protein, MW, pI, fold-change levels,and P-values associated with the identification. Additionalinformation with average spot values and standard devia-tions for proteins on 2D gels and blots, and peptide iden-tifications corresponding to proteins identified in Tables 1and 2, are provided in Tables 3 and 4, respectively. Asshown in Table 1, half of the proteins were identified withmore than a single peptide and several SC (i.e. number ofMS/MS events observed that meet SEQUEST filter crite-ria). For proteins identified with only a single peptide, morethan one SC was observed and/or the MS/MS spectra forthat protein was manually inspected (see Figs. 2–4). Weare confident in the identification of these proteins basedon the low P-values associated with the SEQUEST iden-tifications (i.e. P�2.00e�04). In addition, the location ofprotein spots align with their anticipated MW and pI valueson the 2D-gels.
Two of the brain proteins detected as significantly up-regulated in J20 Tg mice had fold-change levels greater than10-fold compared to NTg mice. These proteins are T-com-plex protein 1 subunit � A (TCP-1; 148-fold, P�0.00069),nd ATP synthase subunit �, mitochondrial (112.2-fold,
P�5.09e�06). The other significantly up-regulated proteins inJ20 Tg mice are Pin-1 (13.09-fold, P�0.0047), � GDP-issociation inhibitor 1 (12.62-fold, P�0.032), calcineurinubunit B type 1 (12.47-fold, P�0.013), and �-enolase
Fig. 1. Representative 2D-gel images of proteins isolated from brainin (a) J20 Tg and (b) NTg mice. Significantly up-regulated spots in J20Tg mice are labeled with protein identifications obtained from nanos-pray ESI-MS/MS analyses. For interpretation of the references to colorin this figure legend, the reader is referred to the Web version of thisarticle.
11.88-fold, P�0.038).
PmTbae
A
P
C
i
n–Whitne
P
i
R. A. S. Robinson et al. / Neuroscience 177 (2011) 207–222 211
Western validation experiments
Fig. 5a shows Western blot lanes corresponding to Pin-1(18 kDa) and the loading control actin (42 kDa) levels.The figure shows that the location of Pin-1 agrees withits expected position based on MW. The histogram plotin Fig. 5b shows a �15% significant increase (P�0.04)in the brain level of Pin-1 of J20 Tg relative to NTg mice.These results are consistent with the proteomics analy-ses described above, wherein Pin-1 had a 13.09 fold-increase in J20 Tg mouse brain relative to NTg mice. Wenote that quantitative differences in the % increase inPin-1 levels from Western and 2D-PAGE experimentsmay be attributed to Pin-1 existing in multiple forms. Forexample, post-translational modifications of Pin-1 (e.g.phosphorylation) would exist as different spots on the2D-gel in which case certain spots may not change inexpression. The analysis carried out in these studiesfocused on individual protein spots which exhibited sig-nificant changes in expression. The contribution of otherpotential post-translationally modified forms of Pin-1 inthe 1D Western band, would cause differences in thequantitative levels detected in J20 Tg and NTg mice.Herein, both the 2D-PAGE and 1D Western results de-tect a significant increase in Pin-1 brain levels in J20 Tgmice.
Fig. 5c shows Western blot lanes corresponding toATP-synthase (55 kDa) and the loading control actin (42
Table 1. List of proteins with differential levels in J20 Tg mice relative
a The number of peptide sequences identified by nanospray ESI-MSndicated in ( ).
b The probability of an incorrect identification associated with each prc The fold-change in spot density from J20 Tg mice compared to NTgd The P-value associated with fold-changec calculated using the Man
Table 2. List of 3NT-modified proteins in J20 Tg mice relative to NTg
a The number of peptide sequences identified by nanospray ESI-MSndicated in ( ).
b The probability of an incorrect identification associated with each prc Percent oxidation in J20 Tg mice compared to NTg controls (oxidati
d The P-value associated with % Control (NTg)c calculated using the Mann–W
kDa) levels. The histogram plot in Fig. 5d shows that thelevel of ATP-synthase is a factor of 2� greater in J20 Tgmouse brain relative to NTg (P�0.03). Again, the directionof change in the Western is similar to that measured in the2D gel, however the quantitative levels differ. In both casesshown here, it appears that the Western levels are lowerthan those obtained in the 2D gel indicating that the dy-namic range and sensitivity of the detection schemes in thetwo techniques (i.e. colorimetric and fluorescence detec-tion, respectively) varies substantially, thus causing differ-ences in the final expression levels between J20 Tg andNTg mice.
Redox proteomics
Utilizing previously established redox proteomics approachesfor the detection of protein carbonyls and 3-NT (Sultana et al.,2006b; Butterfield and Sultana, 2008), we identified two oxi-datively-modified proteins, listed in Table 2, that were signif-icantly different in J20 Tg mice relative to NTg. Phosphati-dylethanolamine-binding protein 1 (PEBP-1; P�0.022), and
in-1 (P�0.049) were detected with lower levels of 3-NTodification in J20 Tg relative to NTg mice (see Fig. 6).hese results and the above described proteomic results wille discussed in detail below with respect to protein functionsnd how the detected changes may be implicated in thetiology of AD.
ryptic peptides. The total number of MS/MS spectral counts (SC) is
tification using the SEQUEST search alogorithm.. The arrow indicates the direction of change.y U statistical test. n�10 for J20 Tg, n�5 for NTg.
Peptides (SC)a Pb % control (NTg)c P-valued
7 2 (4) 3.00e�07 27.42 0.007
7 1 (6) 3.00e�04 19.12 0.003
ryptic peptides. The total number of MS/MS spectral counts (SC) is
tification using the SEQUEST search alogorithm.rbitrarily set to 100%).
to NTg
pI
5.70
9.53
7.97
4.964.496.38
/MS of t
otein idencontrols
controls
a) pI
5.0
7.9
/MS of t
otein idenve level a
hitney U statistical test. n�10 for J20 Tg; n�5 for NTg.
asnsPr
u
(seotcpcnlor
E
EkpCo
p2s
ttcC
PQ
onfidenceenced by
R. A. S. Robinson et al. / Neuroscience 177 (2011) 207–222212
Pin-1 immunoprecipitation
In order to confirm our findings of oxidatively modifiedproteins with redox proteomics analysis, we performedimmunoprecipitation of Pin-1. The Western blot imageshown in Fig. 7a represents nitrated Pin-1 in J20 Tg micend NTg controls. Fig. 7b is a histogram representationhowing a significant decrease (P�0.02) in the level ofitrated Pin-1 in J20 Tg mice compared to NTg. This resultupports our finding with 2D-redox proteomics, in whichin-1 nitration is significantly decreased in J20 Tg mice
elative to NTg (i.e. 19.1%, see Table 2).
DISCUSSION
The J20 line used in these studies was 9 months of age andhas pathological and behavioral characteristics that mimicthose encountered in subjects with AD. For example, J20 Tgmice have age-related progressive accumulation of A� pep-tide, SP formation, and cognitive decline that is associatedwith disease progression (Mucke et al., 2000; Galvan et al.,2006). In the current research, we measured changes in thebrain proteomes of J20 Tg mice in comparison to littermateNTg controls using 2D-PAGE and MS/MS. The goal of thesestudies was to carry-out a discovery-based series of experi-ments in order to identify specific proteins that vary in expres-sion and oxidative modification in J20 Tg mice as a result ofAD-associated pathology. We note that the results we ob-tained only provide information about expression levels ofproteins in the J20 Tg mouse model and that other studiesare needed in order to assess how the function or dysfunctionof the identified differentially-expressed proteins may influ-ence pathology in this AD mouse model. We identified sixproteins with significantly increased levels in J20 Tg mousebrain relative to NTg controls. These proteins are calcineurinsubunit B type 1, � GDP-dissociation inhibitor 1, TCP-1 sub-nit � A, �-enolase, Pin-1, and ATP synthase subunit �
mitochondrial. Recent studies from our laboratory indicateincreased oxidative stress in the brains of J20 Tg mice as
Table 3. Gel and blot data for proteins listed in Tables 1 and 2*
* n�10 J20 Tg, n�5 NTg.a P-value associated with a Mann–Whitney U statistical test at 95% c
Abbreviations: Avg, average value; SSP, protein spot number refer
measured by the levels of protein carbonyls and 3NT (But-
terfield et al., 2010). This oxidative stress is directly correlatedwith levels of A� deposition in the brains of these miceButterfield et al., 2010), and with cognitive decline as mea-ured by Morris water-maze (Mucke et al., 2000; Butterfieldt al., 2010). To gain further insight into oxidative modificationf proteins in J20 Tg mice, we also performed a redox pro-
eomics analysis of brain proteins from J20 Tg mice and NTgontrols. The biochemical processes associated with alteredroteins include energy dysfunction, metabolism alterations,alcium signaling, antioxidant defense, neuritic/structural ab-ormalities, cell-cycle/signaling, lipid abnormalities, and cho-
inergic dysfunction. The relevance of increased expressionf these proteins in J20 Tg mice is discussed below withegards to biochemical pathways and their significance in AD.
nergy dysfunction and metabolism alterations
nergy metabolism, particularly cerebral glucose uptake, isnown to be altered in the brains of AD patients based onositron emission tomography (PET) scanning (Watson andraft, 2004). We observed a significant increase in the levelsf �-enolase and ATP synthase subunit � mitochondrial pro-
teins in J20 Tg mice. �-enolase is involved in the glycolyticathway, as an enzyme responsible for the catalysis of-phosphoglycerate to 2-phosphoenolpyruvate in the lasttep of the glycolytic cycle. Increased levels of �-enolase in
the brains of J20 Tg mice suggest that there may be anincreased need for ATP production in which one response ofthe glycolysis pathway is to complete the conversion of glu-cose to pyruvate, which is only possible with �-enolase ca-alysis. Thus, the brain in J20 Tg mice may recognize earlyhe need for maintaining levels of ATP that eventually be-ome lowered under conditions of AD pathology (Watson andraft, 2004). Increased levels of �-enolase have also been
reported in proteomic studies of brain from subjects with ADand mild cognitive impairment (MCI), arguably the earliestform of AD (Castegna et al., 2002b; Sultana et al., 2007).Also, increased oxidative modification of �-enolase, as in-dexed by protein carbonyls, 3-NT, and HNE, has been re-
Database . . . ipi.MOUSE_090305.fasta; searched against SEQUEST using BioworksBrowser rev. 3.3.1 SP1.Search Criteria: parent 10 ppm, fragment 25 mmu, trypsin 2 MC.Filter(s) . . . deltacn�0.100; xc (1,2,3,4)�1.50,2.00,2.50,3.00; peptide probability�5e-002; # distinct peptides�2.Mods: (M��5.99492) C�160.03068.Abbreviations: MH�, protonated ion of mass M; P, probability of random protein (or peptide) is identified by random chance; RSp, refers to the ranking of a particular peptide match; Sf, represents
a combined score value from SEQUEST that indicates the correlation of experimental data to theoretical data for the total protein (or individual peptide).
R.
A.
S.
Robinson
etal.
/N
euroscience177
(2011)207–222
214
rtgaa
a
plex pror in this fi
R. A. S. Robinson et al. / Neuroscience 177 (2011) 207–222 215
systems (Castegna et al., 2002a,b, 2003). Oxidative modifi-cation of proteins leads to a loss of enzyme function (Butter-field and Stadtman, 1997), which applied to �-enolase, mayesult in impaired ATP production. These results are consis-ent with the PET studies in AD brains that show alteredlucose metabolism (Watson and Craft, 2004). As noted, thege of J20 Tg mice used in these studies was 9 months, ange at which significant A� deposition is present in the brains
(Mucke et al., 2000; Galvan et al., 2006; Shankar et al.,2009). Thus, increased levels of �-enolase may represent anearly attempt to prevent lowered levels of ATP productionthat will inevitably occur with increased A� deposition and SPformation, signatures of advanced stages of AD. In addition,�-enolase has been reported to have many functions androles in AD as well as other neurodegenerative disorders
Fig. 2. MS/MS results from Bioworks Browser. (a) Mass error for b- an(b) Example MS/MS spectra for the peptide FATEAAITILR of the T-comwas observed. Here n � 2. For interpretation of the references to colo
(Butterfield and Lange, 2009). 2
ATP synthase subunit � is a part of the ATP synthasemitochondrial enzyme involved in the production of ATP. Mito-chondrial dysfunction has been linked to AD pathogenesis(Blass et al., 2002; Bubber et al., 2005). In advanced stages ofAD, ATP synthase activity is reportedly decreased in AD brain(Schagger and Ohm, 1995) and the protein also is oxidativelymodified (Sultana et al., 2006c). J20 Tg mice used in thesestudies show increased levels of ATP synthase subunit �, whichcould be related to early cellular stress responses by the brain tomaintain sufficient levels of energy production.
Calcium signaling
Dysregulation of Ca2� homeostasis has been linked to brainging (Foster et al., 2001) and to AD (Mattson and Chan,
fragment ions detected for the doubly-charged peptide FATEAAITILR.tein. Listed in Table 4 are the number of times each peptide spectrumgure legend, the reader is referred to the Web version of this article.
d y-type
001). Calcineurin is a Ca2�/calmodulin-dependent serine/
Csa
c2u2
M in Tabled, the re
R. A. S. Robinson et al. / Neuroscience 177 (2011) 207–222216
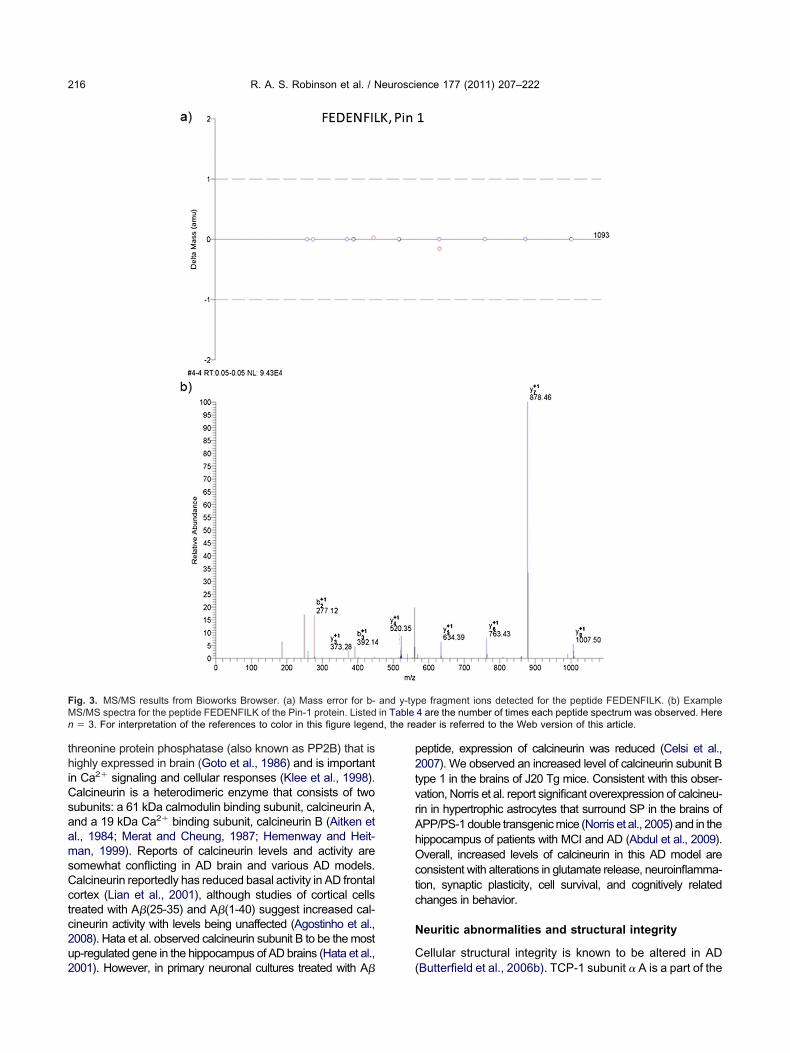
threonine protein phosphatase (also known as PP2B) that ishighly expressed in brain (Goto et al., 1986) and is importantin Ca2� signaling and cellular responses (Klee et al., 1998).
alcineurin is a heterodimeric enzyme that consists of twoubunits: a 61 kDa calmodulin binding subunit, calcineurin A,nd a 19 kDa Ca2� binding subunit, calcineurin B (Aitken et
al., 1984; Merat and Cheung, 1987; Hemenway and Heit-man, 1999). Reports of calcineurin levels and activity aresomewhat conflicting in AD brain and various AD models.Calcineurin reportedly has reduced basal activity in AD frontalcortex (Lian et al., 2001), although studies of cortical cellstreated with A�(25-35) and A�(1-40) suggest increased cal-ineurin activity with levels being unaffected (Agostinho et al.,008). Hata et al. observed calcineurin subunit B to be the mostp-regulated gene in the hippocampus of AD brains (Hata et al.,
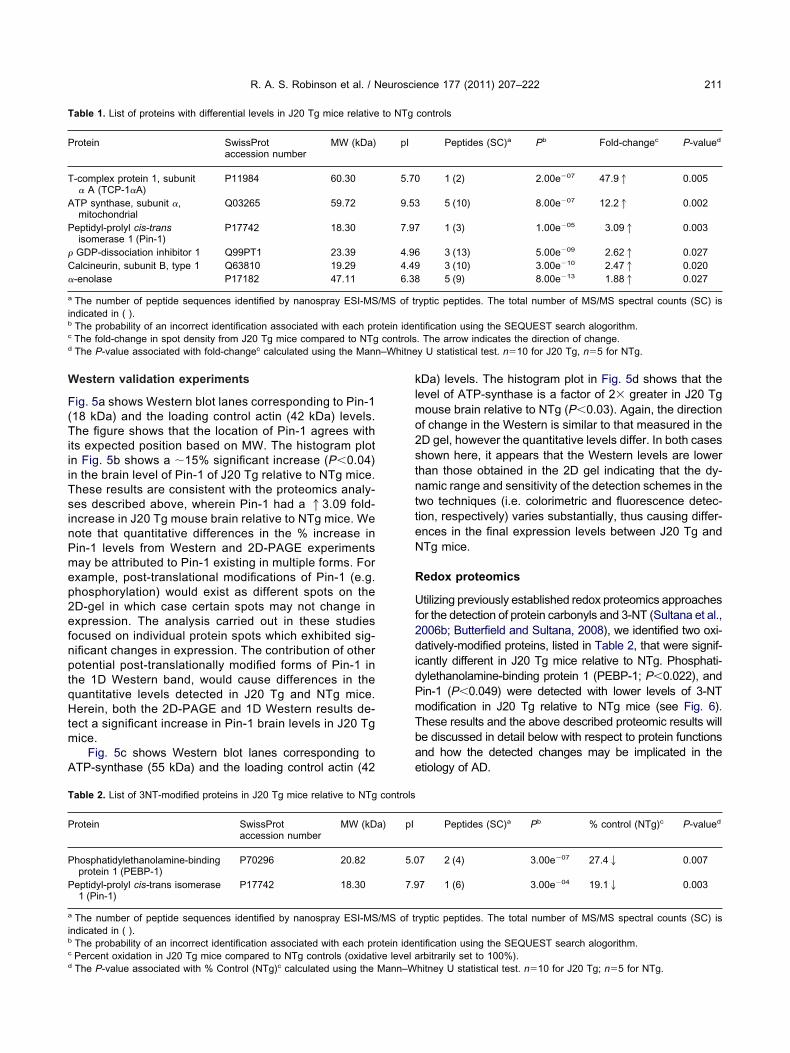
Fig. 3. MS/MS results from Bioworks Browser. (a) Mass error for b-S/MS spectra for the peptide FEDENFILK of the Pin-1 protein. Listed
n � 3. For interpretation of the references to color in this figure legen
001). However, in primary neuronal cultures treated with A�
peptide, expression of calcineurin was reduced (Celsi et al.,2007). We observed an increased level of calcineurin subunit Btype 1 in the brains of J20 Tg mice. Consistent with this obser-vation, Norris et al. report significant overexpression of calcineu-rin in hypertrophic astrocytes that surround SP in the brains ofAPP/PS-1 double transgenic mice (Norris et al., 2005) and in thehippocampus of patients with MCI and AD (Abdul et al., 2009).Overall, increased levels of calcineurin in this AD model areconsistent with alterations in glutamate release, neuroinflamma-tion, synaptic plasticity, cell survival, and cognitively relatedchanges in behavior.
Neuritic abnormalities and structural integrity
Cellular structural integrity is known to be altered in AD
pe fragment ions detected for the peptide FEDENFILK. (b) Example4 are the number of times each peptide spectrum was observed. Hereader is referred to the Web version of this article.
and y-ty
(Butterfield et al., 2006b). TCP-1 subunit � A is a part of the
Mi trum wast ticle.
R. A. S. Robinson et al. / Neuroscience 177 (2011) 207–222 217
TCP-1 family, which has significant structure and se-quence homology to heat shock protein 60 (Gupta, 1995).While TCP-1 is involved in molecular chaperoning, it isalso necessary for maintaining normal actin and tubulinfunction (Chen et al., 1994; Ursic et al., 1994) and is aninitiator in microtubule growth (Brown et al., 1996). Be-cause actin and tubulin are major substrates of TCP-1, weintuit that an increase in TCP-1 would require an increasein actin and actin-related proteins such as F-actin-cappingprotein. TCP-1 unit was reported as having decreasedlevels in the parietal cortex (Yoo et al., 2001) and brains ofsubjects with AD (Schuller et al., 2001). Our results of asubstantial increase in TCP-1 subunit � A levels in J20 Tgmice further supports the notion that in the presence of A�
Fig. 4. MS/MS results from Bioworks Browser. (a) Mass error for b-S/MS spectra for the peptide FEDENFILK of the Pin-1 protein. The
n Fig. 3. Listed in Table 4 are the number of times each peptide spechis figure legend, the reader is referred to the Web version of this ar
deposits and oxidative stress at 9 months of age, cytoskel-
etal structural integrity is not yet compromised in thesetransgenic mice.
Lipid abnormalities and cholinergic dysfunction
PEBP-1 is a precursor of the hippocampal cholinergicneurostimulating peptide (HCNP), a signaling transductionpeptide that helps to regulate choline acetyltransferase(ChAT). Alterations to ChAT lead to reduced levels ofacetyl choline, a neurotransmitter that is necessary forregulating normal neurotransmission (Ojika, 1998). We ob-served decreased nitration of PEBP-1 in brains of J20 Tgmice relative to NTg controls. This result is somewhatstriking as PEBP-1, also known as neuropolypeptide h3
pe fragment ions detected for the peptide FEDENFILK. (b) Examplea were generated from a separate experiment other than that shownobserved. Here n � 5. For interpretation of the references to color in
and y-tyse spectr
and Raf-kinase inhibitor protein, has been reported as
R. A. S. Robinson et al. / Neuroscience 177 (2011) 207–222218
having increased nitration (Castegna et al., 2003) anddecreased mRNA expression (Maki et al., 2002) in ADbrain. In addition, PEBP-1 had 20% greater expression inthe hippocampus of subjects with AD (Chen et al., 2006)
Fig. 5. Pin-1 levels in the brains of J20 and NTg mice. (a) Western blotimage showing lanes corresponding to Pin-1 and actin (loading con-trol) in J20 Tg and NTg mice. (b) Histogram representation of datashown in (a). n�5 for J20 Tg, n�5 for NTg; * P�0.04. (c) Western blotimage showing lanes corresponding to ATP-synthase and actin (load-ing control) in J20 Tg and NTg mice. (d) Histogram representation ofdata shown in (a). n�3 for J20 Tg, n�3 for NTg; * P�0.03. Valuesshown represent normalized (Pin-1/actin or ATP-synthase/actin) per-
centages relative to NTg and are plotted as meanSEM. m
and is believed to be a potential calpain substrate leadingto proteasome dysfunction. Moreover, PEBP-1, is knownas phosphatidylethanolamine binding protein-1. Hence, re-sults of increased nitration in AD brain could contribute to
Fig. 6. Representative 2D-Western blot images of nitrated PEBP-1and Pin-1 proteins (images have been zoomed in to focus on thesespots) in (a) J20 Tg and (b) NTg mice. Proteins were probed withanti-3NT antibody. For interpretation of the references to color in thisfigure legend, the reader is referred to the Web version of this article.
Fig. 7. Levels of Pin-1 nitration in the brains of J20 Tg and NTg mice.(a) Western blot image showing lanes corresponding to nitrated Pin-1in J20 Tg and NTg mice. (b) Histogram representation of data shownin (a). n�3 for J20 Tg, n�3 for NTg; * P�0.02. Values are plotted as
eanSEM.
PiatotwcfiAy
(yceltpntio
fGan
ca1rit
aim
stairtpWATsarM
R. A. S. Robinson et al. / Neuroscience 177 (2011) 207–222 219
the known disruption to lipid asymmetry in AD, which leadsto apoptosis and poor neurotransmission due to reducedlevels of acetyl choline. On the other hand, our observationof lower levels of nitrated PEBP-1 in J20 Tg mice could bean indication that acetyl choline levels and lipid asymmetryare not yet disturbed at this stage of AD pathology in theseanimals. Thus, under this scenario, altered acetyl cholinelevels and lipid abnormalities could be a result of moreadvanced plaque formation that occurs in later stages ofAD. Finally, our current results suggest that J20 Tg micehave not yet experienced proteasome dysfunction. Takentogether, it appears that specific biochemical changes thatare observed in AD may occur later in disease progressionin J20 Tg mice despite the presence of significant A�(1-42)deposition and oxidative stress.
Cell signaling, cell cycle, tau phosphorylation, andA� production
in-1 belongs to the family of PPIases and is unique in thatt acts as a regulatory protein by binding to and isomerizing
proline on the C-terminal side of a pSer/pThr moiety tohe cis-trans conformation, thereby regulating the activityf the target protein (Butterfield et al., 2006a). The func-ions of Pin-1 are diverse and include regulation of path-ays such as the cell-cycle, transcription, acting as aytokine, apoptosis, and DNA damage response (Butter-eld et al., 2006a). Pin-1 has been heavily implicated inD, through its regulation of phosphorylation/dephosphor-lation of tau and production of A� (Butterfield et al.,
2006a). Pin-1 is oxidatively modified and has lowered ex-pression and activity in the hippocampus of AD and MCIbrain (Sultana et al., 2006a). In the current study, Pin-1expression was increased and nitration was decreased inthe brains of J20 Tg mice compared to NTg controls. Itshould be noted that in this study, one-half of the brain washomogenized and thus regional comparison to AD was notpossible. As noted above, AD-specific roles of Pin-1 in-clude regulation of A� production through APP bindingPastorino et al., 2006) and phosphorylation/dephosphor-lation of tau (Lee and Tsai, 2003; Lu et al., 2003). In-reased Pin-1 expression levels could possibly indicatearly response strategies of the brain to maintain low
evels of A� peptides and subsequent SP formation. Fur-hermore, the current increase in Pin-1 levels may keepost-mitotic neurons from entering the cell-cycle, maintainormal transcriptional regulation of key proteins, and allowhe brain to respond to DNA damage that may be occurringn J20 Tg mouse brain as a result of A� deposition andxidative stress.
Additionally, we observed the cell signaling protein, �GDP-dissociation inhibitor 1, to be increased in expressionin J20 Tg mice. This inhibitor belongs to the � GTPaseamily that regulates membrane trafficking and recycling ofTPases (Wu et al., 1996) and APP processing (Maillet etl., 2003). In the brain, � GDP proteins are involved ineurotransmitter release (Maillet et al., 2003). A�(1-42)
exposure to the SN56 cell line leads to reduced phosphor-
ylation levels of � GDP-dissociation inhibitor (Joerchel et
al., 2008). In studies of concanavalin A-associated pro-teins, � GDP-dissociation inhibitor is reported as de-reased in the hippocampus of subjects with AD (Owen etl., 2009). Increased levels of � GDP-dissociation inhibitorand Pin-1 in J20 Tg mice suggests that normal neu-
otransmission may still be occurring at this disease stagen this AD model, despite significant levels of A� deposi-ion.
CONCLUSIONS
The changes observed in this differential expression andredox proteomics-based investigation of the J20 Tg mousebrain proteome support the notion that biochemical path-ways are altered in AD. Alterations in brain proteins in thisAD mouse model, consistent with previous reports of AD,involve altered proteins associated with calcium signalingand neuritic abnormalities. Interestingly, some of thechanges associated with advanced stages of AD, in whichsignificant A� deposition, SP, and NFT are present, do notppear to occur at 9 months of age in J20 Tg mice. In fact,
t appears that the central nervous system of J20 Tg miceay be responding to increased A� deposition to try to
maintain normal levels of ATP, cytoskeletal structural in-tegrity, and cellular signaling. In the presence of oxidativestress, there is also an antioxidant defense responseagainst ROS and RNS. While these analyses focused onentire brain homogenate, proteomic studies of specificbrain regions may provide more information regarding lo-calization of altered proteins in relation to their proximity ofA� deposits (e.g. hippocampus, cortex). The results pre-ented also suggest that further insight can be gainedhrough biochemical analyses that explore specific activitynd functional consequences of altered proteins identified
n these studies. In addition, it appears that some biologicalesponses to A� deposition and A�(1-42)-induced oxida-ive stress may appear at later ages in J20 Tg mice, whereathologically the animals mimic advanced stages of AD.e are continuing to investigate the downstream effects of
�(1-42)-induced oxidative stress and deposition in J20g mice, and future studies will involve gaining more in-ight through functional investigations of altered proteinsnd examination of changes localized to specific brainegions or age-related changes in protein expression.ore interesting are studies that probe A�(1-42)-associ-
ated mechanisms of methionine 35-mediated oxidation viagenetic modification of the PDAPP J20 Tg in vivo model ofAD.
Acknowledgments—This research was supported in part by NIHgrants to D.A.B. [AG-05119] and to D.E.B. [NS-45093, NS-33376,and AG-12282], as well as support from the Keck Foundation (toD.E.B.), the Joseph Drown Foundation (to D.E.B.), the Stephen D.Bechtel Foundation (to V.G.), the Alzheimer’s Association (toD.E.B. and V.G.), and the UNCF/Merck Science Initiative Post-doctoral Fellowship (to R.A.S.R.). We thank Prof. Lennart Muckefor the J20 line of PDAPP mice and for the PDGF �-chain pro-
moter-driven APPSw,In minigene.
A
A
B
B
B
B
B
B
B
C
C
C
C
C
D
D
D
G
G
G
G
R. A. S. Robinson et al. / Neuroscience 177 (2011) 207–222220
REFERENCES
Abdul HM, Sama MA, Furman JL, Mathis DM, Beckett TL, WeidnerAM, Patel ES, Baig I, Murphy MP, LeVine H 3rd, Kraner SD, NorrisCM (2009) Cognitive decline in Alzheimer’s disease is associatedwith selective changes in calcineurin/NFAT signaling. J Neurosci29:12957–12969.
Abdul HM, Sultana R, St Clair DK, Markesbery WR, Butterfield DA(2008) Oxidative damage in brain from human mutant APP/PS-1double knock-in mice as a function of age. Free Radic Biol Med45:1420–1425.
Agostinho P, Lopes JP, Velez Z, Oliveira CR (2008) Overactivation ofcalcineurin induced by amyloid-� and prion proteins. NeurochemInt 52:1226–1233.
itken A, Klee CB, Cohen P (1984) The structure of the B subunit ofcalcineurin. Eur J Biochem 139:663–671.
nsari MA, Joshi G, Huang Q, Opii WO, Abdul HM, Sultana R, But-terfield DA (2006) In vivo administration of D609 leads to protectionof subsequently isolated gerbil brain mitochondria subjected to invitro oxidative stress induced by amyloid �-peptide and other oxi-dative stressors: relevance to Alzheimer’s disease and other oxi-dative stress-related neurodegenerative disorders. Free Radic BiolMed 41:1694–1703.
Blacker D, Wilcox MA, Laird NM, Rodes L, Horvath SM, Go RC, PerryR, Watson B Jr, Bassett SS, McInnis MG, Albert MS, Hyman BT,Tanzi RE (1998) �2-macroglobulin is genetically associated withAlzheimer disease. Nat Genet 19:357–360.
lass JP, Gibson GE, Hoyer S (2002) The role of the metabolic lesionin Alzheimer’s disease. J Alzheimers Dis 4:225–232.
oyd-Kimball D, Castegna A, Sultana R, Poon HF, Petroze R, LynnBC, Klein JB, Butterfield DA (2005a) Proteomic identification ofproteins oxidized by A�(1-42) in synaptosomes: implications forAlzheimer’s disease. Brain Res 1044:206–215.
Boyd-Kimball D, Mohmmad Abdul H, Reed T, Sultana R, ButterfieldDA (2004) Role of phenylalanine 20 in Alzheimer’s amyloid �-pep-tide (1-42)-induced oxidative stress and neurotoxicity. Chem ResToxicol 17:1743–1749.
Boyd-Kimball D, Sultana R, Mohmmad-Abdul H, Butterfield DA(2005b) Neurotoxicity and oxidative stress in D1M-substituted Alz-heimer’s A�(1-42): relevance to N-terminal methionine chemistryin small model peptides. Peptides 26:665–673.
oyd-Kimball D, Sultana R, Poon HF, Lynn BC, Casamenti F, PepeuG, Klein JB, Butterfield DA (2005c) Proteomic identification ofproteins specifically oxidized by intracerebral injection of amyloid�-peptide (1-42) into rat brain: implications for Alzheimer’s disease.Neuroscience 132:313–324.
Brown CR, Doxsey SJ, Hong-Brown LQ, Martin RL, Welch WJ (1996)Molecular chaperones and the centrosome. A role for TCP-1 inmicrotubule nucleation. J Biol Chem 271:824–832.
Bubber P, Haroutunian V, Fisch G, Blass JP, Gibson GE (2005)Mitochondrial abnormalities in Alzheimer brain: mechanistic impli-cations. Ann Neurol 57:695–703.
Butterfield DA, Abdul HM, Opii W, Newman SF, Joshi G, Ansari MA,Sultana R (2006a) Pin-1 in Alzheimer’s disease. J Neurochem98:1697–1706.
Butterfield DA, Boyd-Kimball D (2004) Amyloid �-peptide(1-42) con-tributes to the oxidative stress and neurodegeneration found inAlzheimer disease brain. Brain Pathol 14:426–432.
utterfield DA, Galvan V, Lange MB, Tang H, Sowell RA, Spilman P,Fombonne J, Gorostiza O, Zhang J, Sultana R, Bredesen DE(2010) In vivo oxidative stress in brain of Alzheimer disease trans-genic mice: requirement for methionine 35 in amyloid �-peptide ofAPP. Free Radic Biol Med 48:136–144.
Butterfield DA, Lange ML (2009) Multifunctional roles of enolase inAlzheimer’s disease brain: beyond altered glucose metabolism.J Neurochem 111:915–933.
Butterfield DA, Lauderback CM (2002) Lipid peroxidation and protein
oxidation in Alzheimer’s disease brain: potential causes and con-
utterfield DA, Perluigi M, Sultana R (2006b) Oxidative stress inAlzheimer’s disease brain: new insights from redox proteomics.Eur J Pharmacol 545:39–50.
utterfield DA, Stadtman ER (1997) Protein oxidation processes inaging brain. Adv Cell Aging Gerontol 2:161–191.
utterfield DA, Sultana R (2008) Identification of 3-nitrotyrosine-mod-ified brain proteins by redox proteomics. Methods Enzymol440:295–308.
astegna A, Aksenov M, Aksenova M, Thongboonkerd V, Klein JB,Pierce WM, Booze R, Markesbery WR, Butterfield DA (2002a)Proteomic identification of oxidatively modified proteins in Alzhei-mer’s disease brain. Part I: creatine kinase BB, glutamine syn-thase, and ubiquitin carboxy-terminal hydrolase L-1. Free RadicBiol Med 33:562–571.
astegna A, Aksenov M, Thongboonkerd V, Klein JB, Pierce WM,Booze R, Markesbery WR, Butterfield DA (2002b) Proteomic iden-tification of oxidatively modified proteins in Alzheimer’s diseasebrain. Part II: dihydropyrimidinase-related protein 2, �-enolase,and heat shock cognate 71. J Neurochem 82:1524–1532.
Castegna A, Thongboonkerd V, Klein JB, Lynn B, Markesbery WR,Butterfield DA (2003) Proteomic identification of nitrated proteins inAlzheimer’s disease brain. J Neurochem 85:1394–1401.
Celsi F, Svedberg M, Unger C, Cotman CW, Carri MT, Ottersen OP,Nordberg A, Torp R (2007) �-amyloid causes downregulation ofcalcineurin in neurons through induction of oxidative stress. Neu-robiol Dis 26:342–352.
hen Q, Wang S, Thompson SN, Hall ED, Guttmann RP (2006)Identification and characterization of PEBP as a calpain substrate.J Neurochem 99:1133–1141.
hen X, Sullivan DS, Huffaker TC (1994) Two yeast genes withsimilarity to TCP-1 are required for microtubule and actin functionin vivo. Proc Natl Acad Sci U S A 91:9111–9115.
ruts M, van Duijn CM, Backhovens H, Van den Broeck M, Wehnert A,Serneels S, Sherrington R, Hutton M, Hardy J, St George-HyslopPH, Hofman A, Van Broeckhoven C (1998) Estimation of thegenetic contribution of presenilin-1 and -2 mutations in a popula-tion-based study of presenile Alzheimer disease. Hum Mol Genet7:43–51.
ahiyat M, Cumming A, Harrington C, Wischik C, Xuereb J, CorriganF, Breen G, Shaw D, St Clair D (1999) Association betweenAlzheimer’s disease and the NOS3 gene. Ann Neurol 46:664–667.
emuro A, Mina E, Kayed R, Milton SC, Parker I, Glabe CG (2005)Calcium dysregulation and membrane disruption as a ubiquitousneurotoxic mechanism of soluble amyloid oligomers. J Biol Chem280:17294–17300.
rake J, Link CD, Butterfield DA (2003) Oxidative stress precedesfibrillar deposition of Alzheimer’s disease amyloid �-peptide (1-42)in a transgenic Caenorhabditis elegans model. Neurobiol Aging24:415–420.
Foster TC, Sharrow KM, Masse JR, Norris CM, Kumar A (2001)Calcineurin links Ca2� dysregulation with brain aging. J Neurosci21:4066–4073.
alvan V, Gorostiza OF, Banwait S, Ataie M, Logvinova AV, Sitara-man S, Carlson E, Sagi SA, Chevallier N, Jin K, Greenberg DA,Bredesen DE (2006) Reversal of Alzheimer’s-like pathology andbehavior in human APP transgenic mice by mutation of Asp664.Proc Natl Acad Sci U S A 103:7130–7135.
oate A, Chartier-Harlin MC, Mullan M, Brown J, Crawford F, Fidani L,Giuffra L, Haynes A, Irving N, James L, et al (1991) Segregation ofa missense mutation in the amyloid precursor protein gene withfamilial Alzheimer’s disease. Nature 349:704–706.
ood PF, Werner P, Hsu A, Olanow CW, Perl DP (1996) Evidence ofneuronal oxidative damage in Alzheimer’s disease. Am J Pathol149:21–28.
oto S, Matsukado Y, Mihara Y, Inoue N, Miyamoto E (1986) Cal-
cineurin in human brain and its relation to extrapyramidal system.
H
H
J
M
M
N
O
O
P
P
P
R
S
S
S
S
S
S
S
S
S
R. A. S. Robinson et al. / Neuroscience 177 (2011) 207–222 221
Immunohistochemical study on postmortem human brains. ActaNeuropathol 72:150–156.
Gupta RS (1995) Evolution of the chaperonin families (Hsp60, Hsp10and Tcp-1) of proteins and the origin of eukaryotic cells. MolMicrobiol 15:1–11.
Hata R, Masumura M, Akatsu H, Li F, Fujita H, Nagai Y, Yamamoto T,Okada H, Kosaka K, Sakanaka M, Sawada T (2001) Up-regulationof calcineurin A� mRNA in the Alzheimer’s disease brain: assess-ment by cDNA microarray. Biochem Biophys Res Commun284:310–316.
sia AY, Masliah E, McConlogue L, Yu GQ, Tatsuno G, Hu K,Kholodenko D, Malenka RC, Nicoll RA, Mucke L (1999) Plaque-independent disruption of neural circuits in Alzheimer’s diseasemouse models. Proc Natl Acad Sci U S A 96:3228–3233.
oerchel S, Raap M, Bigl M, Eschrich K, Schliebs R (2008) Oligomeric�-amyloid(1-42) induces the expression of Alzheimer disease-rel-evant proteins in cholinergic SN56.B5.G4 cells as revealed byproteomic analysis. Int J Dev Neurosci 26:301–308.
Klee CB, Ren H, Wang X (1998) Regulation of the calmodulin-stimulatedprotein phosphatase, calcineurin. J Biol Chem 273:13367–13370.
Lee MS, Tsai LH (2003) Cdk5: one of the links between senile plaquesand neurofibrillary tangles? J Alzheimers Dis 5:127–137.
Levy-Lahad E, Lahad A, Wijsman EM, Bird TD, Schellenberg GD(1995) Apolipoprotein E genotypes and age of onset in early-onsetfamilial Alzheimer’s disease. Ann Neurol 38:678–680.
Lian Q, Ladner CJ, Magnuson D, Lee JM (2001) Selective changes ofcalcineurin (protein phosphatase 2B) activity in Alzheimer’s dis-ease cerebral cortex. Exp Neurol 167:158–165.
Lu KP, Liou YC, Vincent I (2003) Proline-directed phosphorylation andisomerization in mitotic regulation and in Alzheimer’s disease.Bioessays 25:174–181.
Maillet M, Robert SJ, Cacquevel M, Gastineau M, Vivien D, BertoglioJ, Zugaza JL, Fischmeister R, Lezoualc’h F (2003) Crosstalk be-tween Rap1 and Rac regulates secretion of sAPP�. Nat Cell Biol5:633–639.
Maki M, Matsukawa N, Yuasa H, Otsuka Y, Yamamoto T, Akatsu H,Okamoto T, Ueda R, Ojika K (2002) Decreased expression ofhippocampal cholinergic neurostimulating peptide precursor pro-tein mRNA in the hippocampus in Alzheimer disease. J Neuro-pathol Exp Neurol 61:176–185.
Markesbery WR (1997) Oxidative stress hypothesis in Alzheimer’sdisease. Free Radic Biol Med 23:134–147.
Mattson MP, Chan SL (2001) Dysregulation of cellular calcium homeo-stasis in Alzheimer’s disease: bad genes and bad habits. J MolNeurosci 17:205–224.
Merat DL, Cheung WY (1987) Calmodulin-dependent protein phos-phatase: isolation of subunits and reconstitution to holoenzyme.Methods Enzymol 139:79–87.
Mohmmad Abdul H, Sultana R, Keller JN, St Clair DK, MarkesberyWR, Butterfield DA (2006) Mutations in amyloid precursor proteinand presenilin-1 genes increase the basal oxidative stress in mu-rine neuronal cells and lead to increased sensitivity to oxidativestress mediated by amyloid �-peptide (1-42), H2O2 and kainic acid:implications for Alzheimer’s disease. J Neurochem 96:1322–1335.
ohmmad Abdul H, Wenk GL, Gramling M, Hauss-Wegrzyniak B,Butterfield DA (2004) APP and PS-1 mutations induce brain oxi-dative stress independent of dietary cholesterol: implications forAlzheimer’s disease. Neurosci Lett 368:148–150.
ucke L, Masliah E, Yu GQ, Mallory M, Rockenstein EM, Tatsuno G,Hu K, Kholodenko D, Johnson-Wood K, McConlogue L (2000)High-level neuronal expression of A� 1-42 in wild-type humanamyloid protein precursor transgenic mice: synaptotoxicity withoutplaque formation. J Neurosci 20:4050–4058.
orris CM, Kadish I, Blalock EM, Chen KC, Thibault V, Porter NM,
inflammatory processes in astrocytes and is up-regulated in agingand Alzheimer’s models. J Neurosci 25:4649–4658.
jika K (1998) [Hippocampal cholinergic neurostimulating peptide].Seikagaku 70:1175–1180.
wen JB, Di Domenico F, Sultana R, Perluigi M, Cini C, Pierce WM,Butterfield DA (2009) Proteomics-determined differences in theconcanavalin-A-fractionated proteome of hippocampus and infe-rior parietal lobule in subjects with Alzheimer’s disease and mildcognitive impairment: implications for progression of AD. J Pro-teome Res 8:471–482.
astorino L, Sun A, Lu PJ, Zhou XZ, Balastik M, Finn G, Wulf G, LimJ, Li SH, Li X, Xia W, Nicholson LK, Lu KP (2006) The prolylisomerase Pin-1 regulates amyloid precursor protein processingand amyloid-� production. Nature 440:528–534.
rice DL, Tanzi RE, Borchelt DR, Sisodia SS (1998) Alzheimer’sdisease: genetic studies and transgenic models. Annu Rev Genet32:461–493.
esende R, Moreira PI, Proenca T, Deshpande A, Busciglio J, PereiraC, Oliveira CR (2008) Brain oxidative stress in a triple-transgenicmouse model of Alzheimer disease. Free Radic Biol Med 44:2051–2057.
chagger H, Ohm TG (1995) Human diseases with defects in oxida-tive phosphorylation. 2. F1F0 ATP-synthase defects in Alzheimerdisease revealed by blue native polyacrylamide gel electrophore-sis. Eur J Biochem 227:916–921.
chuller E, Gulesserian T, Seidl R, Cairns N, Lube G (2001) BrainT-complex polypeptide 1 (TCP- 1) related to its natural substrate�1 tubulin is decreased in Alzheimer’s disease. Life Sci 69:263–270.
Selkoe DJ (1996) Amyloid �-protein and the genetics of Alzheimer’sdisease. J Biol Chem 271:18295–18298.
Selkoe DJ (2001) Alzheimer’s disease: genes, proteins, and therapy.Physiol Rev 81:741–766.
Selkoe DJ (2008) Soluble oligomers of the amyloid �-protein impairsynaptic plasticity and behavior. Behav Brain Res 192:106–113.
hankar GM, Leissring MA, Adame A, Sun X, Spooner E, Masliah E,Selkoe DJ, Lemere CA, Walsh DM (2009) Biochemical and immu-nohistochemical analysis of an Alzheimer’s disease mouse modelreveals the presence of multiple cerebral Abeta assembly formsthroughout life. Neurobiol Dis 36:293–302.
looter AJ, Cruts M, Kalmijn S, Hofman A, Breteler MM, Van Broeck-hoven C, van Duijn CM (1998) Risk estimates of dementia byapolipoprotein E genotypes from a population-based incidencestudy: the Rotterdam Study. Arch Neurol 55:964–968.
mith MA, Richey Harris PL, Sayre LM, Beckman JS, Perry G (1997)Widespread peroxynitrite-mediated damage in Alzheimer’s dis-ease. J Neurosci 17:2653–2657.
mith MA, Richey PL, Taneda S, Kutty RK, Sayre LM, Monnier VM,Perry G (1994) Advanced Maillard reaction end products, freeradicals, and protein oxidation in Alzheimer’s disease. Ann N YAcad Sci 738:447–454.
ultana R, Boyd-Kimball D, Cai J, Pierce WM, Klein JB, Merchant M,Butterfield DA (2007) Proteomics analysis of the Alzheimer’s dis-ease hippocampal proteome. J Alzheimers Dis 11:153–164.
ultana R, Boyd-Kimball D, Poon HF, Cai J, Pierce WM, Klein JB,Markesbery WR, Zhou XZ, Lu KP, Butterfield DA (2006a) Oxidativemodification and down-regulation of Pin-1 in Alzheimer’s diseasehippocampus: a redox proteomics analysis. Neurobiol Aging27:918–925.
ultana R, Boyd-Kimball D, Poon HF, Cai J, Pierce WM, Klein JB,Merchant M, Markesbery WR, Butterfield DA (2006b) Redox pro-teomics identification of oxidized proteins in Alzheimer’s disease
hippocampus and cerebellum: an approach to understand patho-
T
U
V
W
R. A. S. Robinson et al. / Neuroscience 177 (2011) 207–222222
logical and biochemical alterations in AD. Neurobiol Aging 27:1564–1576.
Sultana R, Poon HF, Cai J, Pierce WM, Merchant M, Klein JB, Markes-bery WR, Butterfield DA (2006c) Identification of nitrated proteinsin Alzheimer’s disease brain using a redox proteomics approach.Neurobiol Dis 22:76–87.
Sultana R, Ravagna A, Mohmmad-Abdul H, Calabrese V, ButterfieldDA (2005) Ferulic acid ethyl ester protects neurons against amy-loid �-peptide(1-42)-induced oxidative stress and neurotoxicity:relationship to antioxidant activity. J Neurochem 92:749–758.
hongboonkerd V, Luengpailin J, Cao J, Pierce WM, Cai J, Klein JB, DoyleRJ (2002) Fluoride exposure attenuates expression of Streptococcuspyogenes virulence factors. J Biol Chem 277:16599–16605.
rsic D, Sedbrook JC, Himmel KL, Culbertson MR (1994) The essen-tial yeast Tcp1 protein affects actin and microtubules. Mol Biol Cell5:1065–1080.
iola KL, Velasco PT, Klein WL (2008) Why Alzheimer’s is a disease� oligomers (ADDLs). J
of memory: the attack on synapses by A
Nutr Health Aging 12:51S–57S.
alsh DM, Klyubin I, Fadeeva JV, Cullen WK, Anwyl R, Wolfe MS,Rowan MJ, Selkoe DJ (2002) Naturally secreted oligomers ofamyloid � protein potently inhibit hippocampal long-term potentia-tion in vivo. Nature 416:535–539.
Watson GS, Craft S (2004) Modulation of memory by insulin andglucose: neuropsychological observations in Alzheimer’s disease.Eur J Pharmacol 490:97–113.
Wu SK, Zeng K, Wilson IA, Balch WE (1996) Structural insights intothe function of the Rab GDI superfamily. Trends Biochem Sci21:472–476.
Yoo BC, Kim SH, Cairns N, Fountoulakis M, Lubec G (2001) Derangedexpression of molecular chaperones in brains of patients withAlzheimer’s disease. Biochem Biophys Res Commun 280:249–258.
Zhu M, Gu F, Shi J, Hu J, Hu Y, Zhao Z (2008) Increased oxidativestress and astrogliosis responses in conditional double-knockoutmice of Alzheimer-like presenilin-1 and presenilin-2. Free Radic
Biol Med 45:1493–1499.
(Accepted 3 January 2011)(Available online 9 January 2011)