20
Differential Scanning Calorimetry – DSC 3500 Sirius® Method, Technique and Applications
Differential Scanning Calorimetry – DSC 3500 Sirius®Method, Technique and Applications
2
Differential Scanning Calorimetry
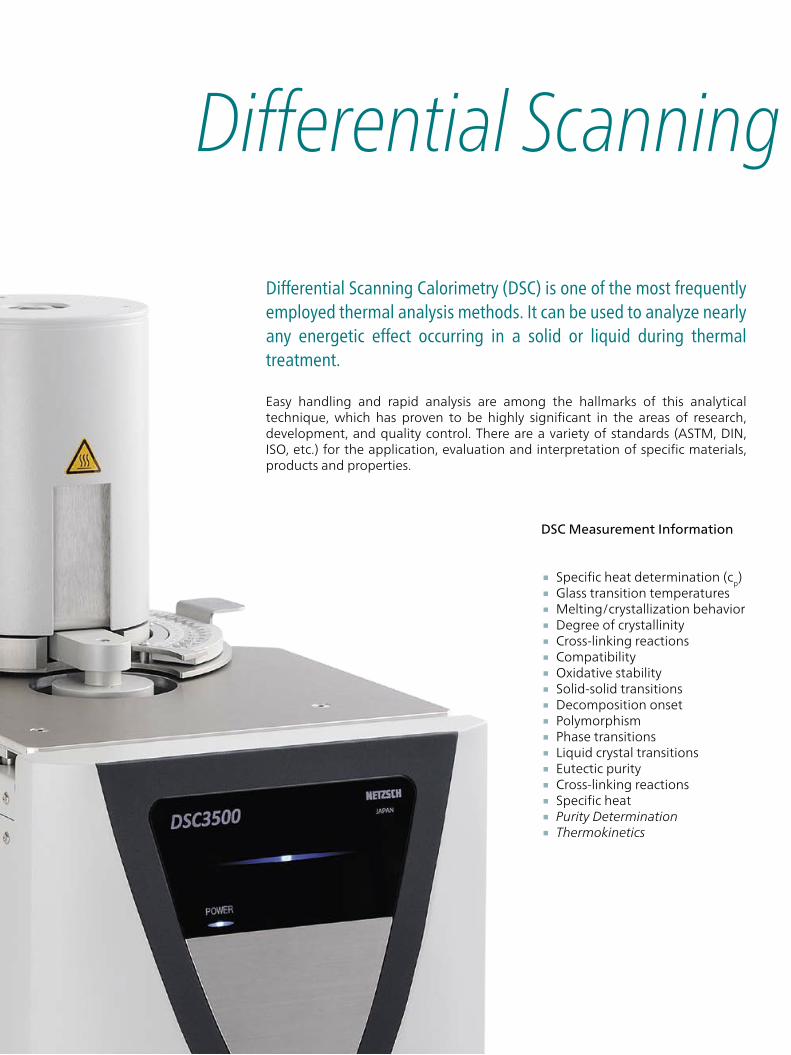
Differential Scanning Calorimetry (DSC) is one of the most frequently employed thermal analysis methods. It can be used to analyze nearly any energetic effect occurring in a solid or liquid during thermal treatment.
DSC Measurement Information
Easy handling and rapid analysis are among the hallmarks of this analytical technique, which has proven to be highly significant in the areas of research, development, and quality control. There are a variety of standards (ASTM, DIN, ISO, etc.) for the application, evaluation and interpretation of specific materials, products and properties.
∙ Specific heat determination (cp) ∙ Glass transition temperatures ∙ Melting/crystallization behavior ∙ Degree of crystallinity ∙ Cross-linking reactions ∙ Compatibility ∙ Oxidative stability ∙ Solid-solid transitions ∙ Decomposition onset ∙ Polymorphism ∙ Phase transitions ∙ Liquid crystal transitions ∙ Eutectic purity ∙ Cross-linking reactions ∙ Specific heat ∙ Purity Determination ∙ Thermokinetics
3
Differential Scanning Calorimetry
THE DSC METHOD
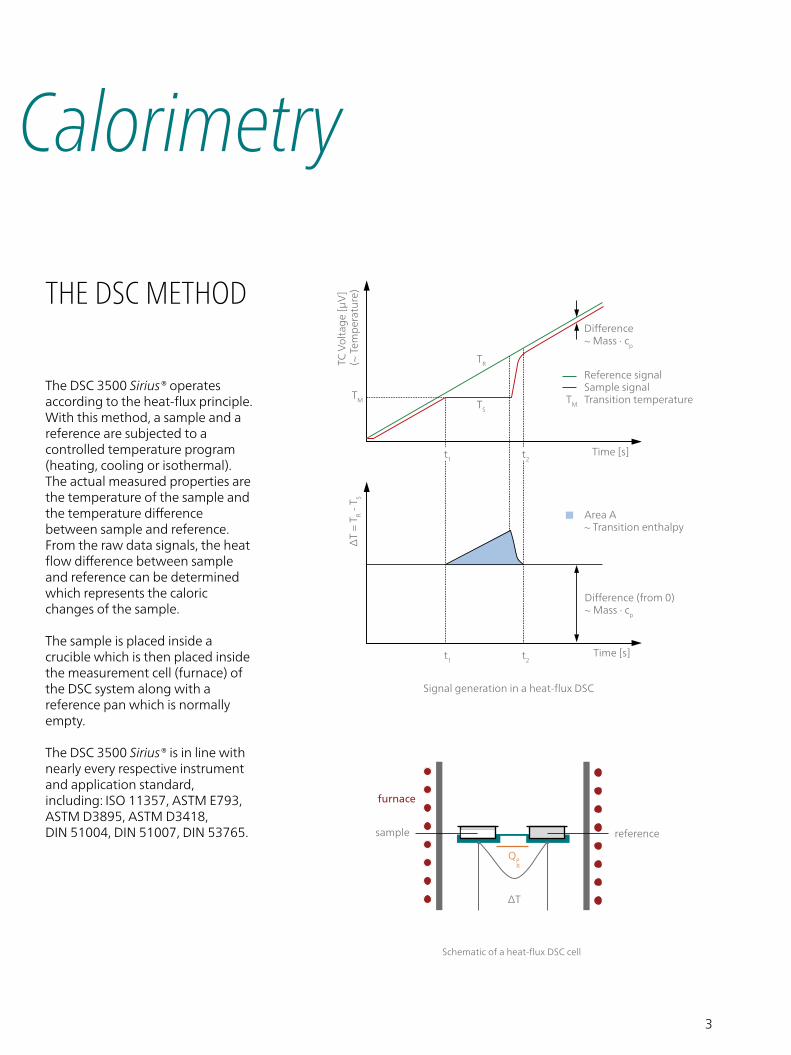
The DSC 3500 Sirius® operates according to the heat-flux principle. With this method, a sample and a reference are subjected to a controlled temperature program (heating, cooling or isothermal). The actual measured properties are the temperature of the sample and the temperature difference between sample and reference. From the raw data signals, the heat flow difference between sample and reference can be determined which represents the caloric changes of the sample.
The sample is placed inside a crucible which is then placed inside the measurement cell (furnace) of the DSC system along with a reference pan which is normally empty.
The DSC 3500 Sirius® is in line with nearly every respective instrument and application standard, including: ISO 11357, ASTM E793, ASTM D3895, ASTM D3418, DIN 51004, DIN 51007, DIN 53765.
Time [s]
Time [s]
ΔT
= T R -
T S
Difference (from 0)~ Mass · cp
Difference ~ Mass · cp
TC V
olta
ge [μ
V]
(~ T
emp
erat
ure)
Reference signalSample signalTransition temperature
Area A~ Transition enthalpy
t1
t1
t2
t2
TR
TSTM
TM
Signal generation in a heat-flux DSC
Schematic of a heat-flux DSC cell
furnace
ΔT
QP R
sample reference

4
DSC 3500 Sirius®
TRUSTWORTHY AND STURDY
The gas-tight DSC 3500 Sirius® combines the advantages of modern technology, high sensitivity and a robust, easy-to-operate workhorse. Tests can be carried out in the temperature range between -170°C and 600°C.
Key components of the DSC 3500 Sirius® are the DSC heat-flux sensor, the furnace and clever connection fittings which are designed for the quick and easy attachment of various cooling systems.
The sensor of the DSC 3500 Sirius® combines high stability and optimized resolution of thermal effects. Laser-guided welding processes for the sensor disks and thermocouple wires yield true sensitivity and robustness.

5
ADVANTAGES TO YOUR BENEFIT
Furnace and SensorOptimized design of the furnace and the sensor results in a highly stable baseline and excellent signal-to-noise ratio.
Gases and Cooling OptionsProtective and purge gas inlets are, of course, standard features of the unit. For improved cooling times and subambient temperature tests, various cooling options can be connected. Of course, a versatile gas switching and flow control system are also available.
Automatic Sample ChangerFor applications with a high sample throughput, we offer an automatic sample changer (ASC) for up to 20 samples and references which accommodates different crucible types. Flexibility and high sample throughput allow for efficient time management.
Smart InstrumentationEase of handling is provided during measurement setup and evaluation by the SmartMode. This incorpo-rates predefined measurement methods and wizards, Auto-Evaluation and Identify.
Reliable
Variable
Efficient
All-Encompassing

6
RELIABLE INSTRUMENTATION From Measurement Setup to AutoEvaluation to Identify
SmartMode – There's no need to be an expert in thermal analysis to start a measurement! Just a few clicks
to start a
measurement
SmartMode – No Need to be Well Versed
The SmartMode boasts a clear structure, a consistent navigation concept and easy-to-access buttons. Using Wizards measurement templates), it is possible to start a measurement with just a few inputs. Alterna-tively, customized methods or predefined methods can be selected to set up an experiment. The predefined methods already contain all required parameters for those materials which are listed in the NETZSCH poster ”Thermal Properties of Polymers”.
Even customers unfamiliar with the software immediately know how to proceed.
ExpertMode – Not Just for Professional Users For those who wish to dive deeperinto the software for enhanced option setting or for method definition, switching from SmartMode over to ExpertMode is the answer. Here, the user has access to the established Proteus® software functionality, includingdozens of features and all adjustment settings.
AutoCalibration Allows forFull Concentration on theMeasurement Tasks Calibration procedures should be simple, fast and − ideally − done along the way. AutoCalibration provides automatic creation routines for all relevant calibration curves, automatically loading the current calibrations while taking the selected measurement condi-tions into account and checking their validity periods.
7
RELIABLE INSTRUMENTATION From Measurement Setup to AutoEvaluation to Identify
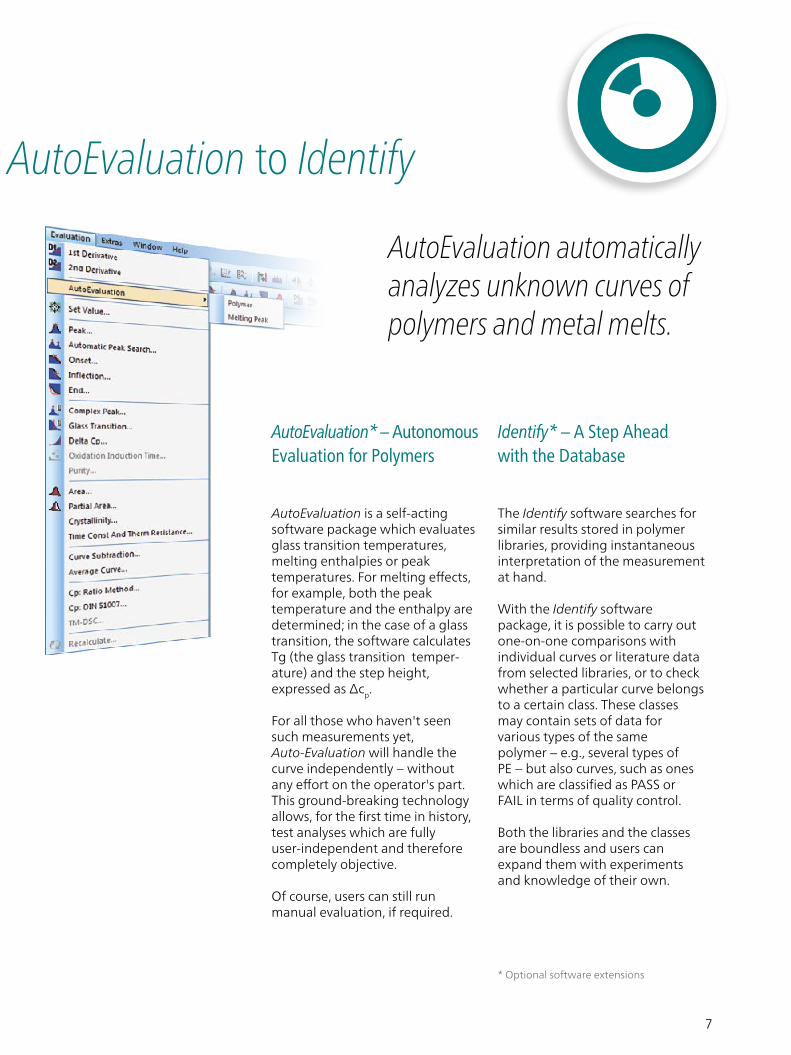
AutoEvaluation automatically analyzes unknown curves of polymers and metal melts.
AutoEvaluation* – AutonomousEvaluation for Polymers
AutoEvaluation is a self-acting software package which evaluates glass transition temperatures, melting enthalpies or peak temperatures. For melting effects,for example, both the peak temperature and the enthalpy are determined; in the case of a glass transition, the software calculates Tg (the glass transition temper-ature) and the step height, expressed as Δcp.
For all those who haven't seen such measurements yet, Auto-Evaluation will handle the curve independently − without any effort on the operator's part.This ground-breaking technology allows, for the first time in history, test analyses which are fully user-independent and therefore completely objective.
Of course, users can still run manual evaluation, if required.
Identify* – A Step Ahead with the Database The Identify software searches for similar results stored in polymer libraries, providing instantaneous interpretation of the measurement at hand.
With the Identify software package, it is possible to carry out one-on-one comparisons with individual curves or literature data from selected libraries, or to check whether a particular curve belongs to a certain class. These classesmay contain sets of data for various types of the same polymer − e.g., several types of PE − but also curves, such as ones which are classified as PASS or FAIL in terms of quality control.
Both the libraries and the classes are boundless and users can expand them with experiments and knowledge of their own.
* Optional software extensions
8
Value: -51.60 °C, -0.008 mW
-50-100 0 50 100 150 200
0 50 100 150 200
250 300Temperature/°C
-0.20
-0.15
-0.8
-0.6
-0.4
0.4
-0.2
0.2
-0.0
-0.10
-0.05
0.00
0.05
0.10
0.15
0.20
Value: 282.60 °C, 0.008 mW
↓ exo
-100 -50 0 50 100 150 200 250 300
Temperature/°C
50 100 150 200 250 300 350 400 450 500
Temperature/°C
-1.5
-1.0
-0.5
0.0
0.1
0.2
0.3
0.4
0.5
0.0
0.5
1.0
1.5
1st heating2nd heating
3rd heating
Value: 300.0 °C, -0.012 mWValue: -100.0 °C, 0.004 mWValue: 300.0 °C, -0.005 mWValue: -100.0 °C, 0.009 mW
44.14 °C
Value: 300.0 °C, 0.012 mWValue: -100.0 °C, 0.010 mW
43.01 °C
↓ exo
70 80 90 100 110 120 130Time/min
-0.5
-0.4
-0.3
-0.2
-0.1
0.0
0.1
DSC/(mW/mg)
-20
0
20
40
60
80
100
120
Temperature/°C
0 10 20 30 40 50 60 70 80 90Temperature/°C
-0.15
-0.10
-0.05
0.00
0.05
0.10
DSC/(mW/mg)
N=1N=2Table Value
Cp/(J/(g∙K))
0.0 0.5 1.0 1.5 2.0Time/min
0
5
10
15
20
DSC/(mW/mg)
25
30
35
40
Temp. /°C
0
50
100
150
200
250
Integral /(J/g)
integral curves 60 s
30 s
1 s
10 s
10 s
30 s60 s
1 s
↑ exo
Temperature/°C
DSC/mW
DSC/mW
↓ exoDSC/(μV/mg)
Glass Transition: Mid:73.5 °CDelta Cp*:0.321 J/(g*K)Area: -10.16 J/g
Glass Transition*: Mid: 72.6 °CDelta Cp*: 0.333 J/(g*K):
Area: -11.4 J/g
Complex Peak: Area:-1.219 J/gPeak*:73.8 °C
↑ exo
↑ exo
-80 -60 -40 -20 0Temperature/°C
-1.0
-0.5
0.0
0.5
1.0
1.5
DSC/(mW/mg)
-44.8 °C-64.3 °C-69.4 °C
-18.1 °C
-27.1 °C
Area: -0.2 J/gPeak -3.5 °C*:
Area: 46.9 J/g
Area: -41.7 J/g
Area: -3.7 J/gPeak: 52.8 °C
-11.7 °C
-18.3 °C
↓ exo
heating
cooling
20 40 60 80 100Time/min
-0.6
-0.4
-0.2
0.0
0.2
0.4
0.6
0.8
DSC(mW/mg)
20
40
60
80
100
120
140
160
180
Temp./°C
OIT: 4.2 minOIT: 13.1 min OIT: 63.3 min
↓ exo
Dashed: DSC signal under nitrogen Continuous: DSC signal under air Dotted: Temperature signal
100 150 200 250Temperature/ °C
Temperature/ °C
1.0
1.5
2.0
2.5
3.0
DSC /(mW/mg)
DSC /(mW/mg)
DSC /(mW/mg)
DSC/(mW/mg)
121.0 °C252.6 °C
107.3 °C
117.2 °C
136.9 °C
Film B
Film C
246.5 °C127.0 °C
159.1 °C
126.4 °C139.5 °C
↓ exo
Film A
0.9
Measured
Curve 1Curve 2Curve 3
0.8
0.7
0.6
0.5
0.4
0.3
0.2
0.1
0
-0.170 80 90 100 110 120 130
Sum of calculated curves
190 200 210 220 230 240
Temperature/°C
0
1
2
3
4
5Onset*: 216.8 °C
Area: 55.36 J/gPeak: 222.1 °C
Area: 55.98 J/gPeak: 220.0 °C Onset: 216.7 °C
Onset*: 216.8 °C
Area: 55.23 J/gPeak: 221.5 °C
Area:55.96 J/gPeak: 219.9 °COnset: 216.7 °C
↓ exo
Lot 1
Lot 2
170 180 190 200 210 220Temperature/°C
-7
-6
-5
-4
-3
-2
-1
0
Area: -55.34 J/gPeak: 186.8 °C End: 187.1 °C
Area: -55.16 J/gPeak: 188.7 °CEnd: 189.0 °C
↓ exo
Dashed: 2nd heating
Solid Line: 1st heating
Lot 1
Lot 2
123.5 124.0 124.5 125.0 125.5126.0 126.5Time/min
818283848586878889
Temp./°C
-10 -8 -6 -4 -2 0 2 4 6Temperature /°C
-0,40
-0,35
-0,30
-0,25
DSC/mW/mg
Area: -0,2 J/gPeak*: -3,5 °C
↓ exo
Value: -51.60 °C, -0.008 mW
-50-100 0 50 100 150 200
0 50 100 150 200
250 300Temperature/°C
-0.20
-0.15
-0.8
-0.6
-0.4
0.4
-0.2
0.2
-0.0
-0.10
-0.05
0.00
0.05
0.10
0.15
0.20
Value: 282.60 °C, 0.008 mW
↓ exo
-100 -50 0 50 100 150 200 250 300
Temperature/°C
50 100 150 200 250 300 350 400 450 500
Temperature/°C
-1.5
-1.0
-0.5
0.0
0.1
0.2
0.3
0.4
0.5
0.0
0.5
1.0
1.5
1st heating2nd heating
3rd heating
Value: 300.0 °C, -0.012 mWValue: -100.0 °C, 0.004 mWValue: 300.0 °C, -0.005 mWValue: -100.0 °C, 0.009 mW
44.14 °C
Value: 300.0 °C, 0.012 mWValue: -100.0 °C, 0.010 mW
43.01 °C
↓ exo
70 80 90 100 110 120 130Time/min
-0.5
-0.4
-0.3
-0.2
-0.1
0.0
0.1
DSC/(mW/mg)
-20
0
20
40
60
80
100
120
Temperature/°C
0 10 20 30 40 50 60 70 80 90Temperature/°C
-0.15
-0.10
-0.05
0.00
0.05
0.10
DSC/(mW/mg)
N=1N=2Table Value
Cp/(J/(g∙K))
0.0 0.5 1.0 1.5 2.0Time/min
0
5
10
15
20
DSC/(mW/mg)
25
30
35
40
Temp. /°C
0
50
100
150
200
250
Integral /(J/g)
integral curves 60 s
30 s
1 s
10 s
10 s
30 s60 s
1 s
↑ exo
Temperature/°C
DSC/mW
DSC/mW
↓ exoDSC/(μV/mg)
Glass Transition: Mid:73.5 °CDelta Cp*:0.321 J/(g*K)Area: -10.16 J/g
Glass Transition*: Mid: 72.6 °CDelta Cp*: 0.333 J/(g*K):
Area: -11.4 J/g
Complex Peak: Area:-1.219 J/gPeak*:73.8 °C
↑ exo
↑ exo
-80 -60 -40 -20 0Temperature/°C
-1.0
-0.5
0.0
0.5
1.0
1.5
DSC/(mW/mg)
-44.8 °C-64.3 °C-69.4 °C
-18.1 °C
-27.1 °C
Area: -0.2 J/gPeak -3.5 °C*:
Area: 46.9 J/g
Area: -41.7 J/g
Area: -3.7 J/gPeak: 52.8 °C
-11.7 °C
-18.3 °C
↓ exo
heating
cooling
20 40 60 80 100Time/min
-0.6
-0.4
-0.2
0.0
0.2
0.4
0.6
0.8
DSC(mW/mg)
20
40
60
80
100
120
140
160
180
Temp./°C
OIT: 4.2 minOIT: 13.1 min OIT: 63.3 min
↓ exo
Dashed: DSC signal under nitrogen Continuous: DSC signal under air Dotted: Temperature signal
100 150 200 250Temperature/°C
Temperature/°C
1.0
1.5
2.0
2.5
3.0
DSC/(mW/mg)
DSC/(mW/mg)
DSC/(mW/mg)
DS C/(mW/mg)
121.0 °C252.6 °C
107.3 °C
117.2 °C
136.9 °C
Film B
Film C
246.5 °C127.0 °C
159.1 °C
126.4 °C139.5 °C
↓ exo
Film A
0.9
Measured
Curve 1Curve 2Curve 3
0.8
0.7
0.6
0.5
0.4
0.3
0.2
0.1
0
-0.170 80 90 100 110 120 130
Sum of calculated curves
190 200 210 220 230 240
Temperature/°C
0
1
2
3
4
5Onset*: 216.8 °C
Area: 55.36 J/gPeak: 222.1 °C
Area: 55.98 J/gPeak: 220.0 °C Onset: 216.7 °C
Onset*: 216.8 °C
Area: 55.23 J/gPeak: 221.5 °C
Area:55.96 J/gPeak: 219.9 °COnset: 216.7 °C
↓ exo
Lot 1
Lot 2
170 180 190 200 210 220Temperature/°C
-7
-6
-5
-4
-3
-2
-1
0
Area: -55.34 J/gPeak: 186.8 °C End: 187.1 °C
Area: -55.16 J/gPeak: 188.7 °CEnd: 189.0 °C
↓ exo
Dashed: 2nd heating
Solid Line: 1st heating
Lot 1
Lot 2
123.5 124.0 124.5 125.0 125.5126.0 126.5Time/min
818283848586878889
Temp./°C
-10 -8 -6 -4 -2 0 2 4 6Temperature /°C
-0,40
-0,35
-0,30
-0,25
DSC/mW/mg
Area: -0,2 J/gPeak*: -3,5 °C
↓ exo
Stable Baselines & High Repeatability
RELIABLE RESULTS – THE BASIS FOR EFFECTIVE WORK
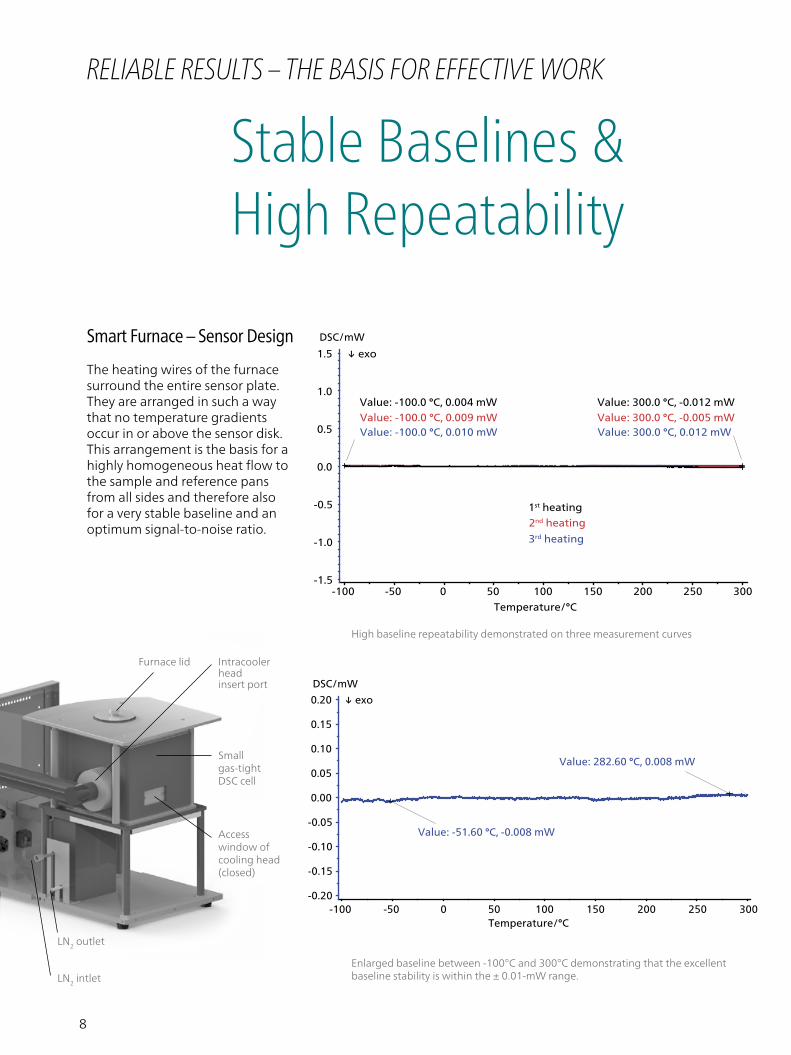
High baseline repeatability demonstrated on three measurement curves
Enlarged baseline between -100°C and 300°C demonstrating that the excellentbaseline stability is within the ± 0.01-mW range.
Smart Furnace – Sensor Design
The heating wires of the furnace surround the entire sensor plate. They are arranged in such a way that no temperature gradients occur in or above the sensor disk. This arrangement is the basis for a highly homogeneous heat flow to the sample and reference pans from all sides and therefore also for a very stable baseline and an optimum signal-to-noise ratio.
Intracooler headinsert port
Furnace lid
Access window of cooling head (closed)
Small gas-tightDSC cell
LN2 outlet
LN2 intlet
9
Small but Powerful
Compact Design – Fits into Any Corner of Your Lab
Gas-Tight – A Prerequisite for OIT Tests
Economic Cooling – User-Interchangeable Devices
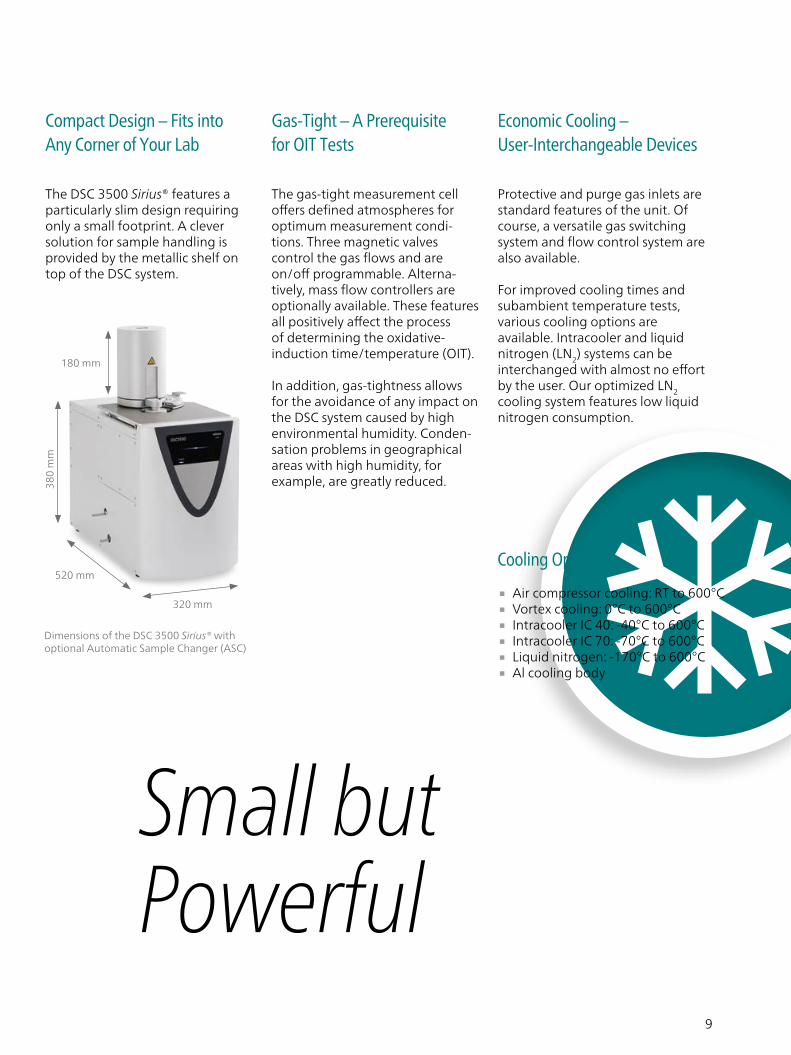
The DSC 3500 Sirius® features a particularly slim design requiring only a small footprint. A clever solution for sample handling is provided by the metallic shelf on top of the DSC system.
The gas-tight measurement cell offers defined atmospheres for optimum measurement condi-tions. Three magnetic valves control the gas flows and are on/off programmable. Alterna-tively, mass flow controllers are optionally available. These features all positively affect the process of determining the oxidative-induction time/temperature (OIT).
In addition, gas-tightness allows for the avoidance of any impact on the DSC system caused by high environmental humidity. Conden-sation problems in geographical areas with high humidity, for example, are greatly reduced.
Protective and purge gas inlets are standard features of the unit. Of course, a versatile gas switching system and flow control system are also available.
For improved cooling times and subambient temperature tests, various cooling options are available. Intracooler and liquid nitrogen (LN2) systems can be interchanged with almost no effort by the user. Our optimized LN2 cooling system features low liquid nitrogen consumption.
Cooling Options
∙ Air compressor cooling: RT to 600°C ∙ Vortex cooling: 0°C to 600°C ∙ Intracooler IC 40: -40°C to 600°C ∙ Intracooler IC 70: -70°C to 600°C ∙ Liquid nitrogen: -170°C to 600°C ∙ Al cooling body
Dimensions of the DSC 3500 Sirius® with optional Automatic Sample Changer (ASC)
180 mm
380
mm
520 mm
320 mm

10
Automatic Sample Changer
For applications with high sample throughput, an automatic sample changer (ASC) for up to 20 samples and references is available. Besides standard aluminum pans, the ASC can accommodate pressure-tight crucibles (autoclaves), ceramic and metallic sample pans.
Transport safety is provided by the four arms of the gripper. This mechanism safely removes the crucible from the magazine and places it carefully – without jiggling – into its position on the sensor. The reference crucible can also be changed out as often as the application requires.
The ASC can be easily programmed via the SmartMode of the Proteus® software. A specific measurement program (method) can be assigned to each sample on the tray. This can include evaluation routines as well. In other words, the ASC not only handles the samples, but also carries out measurement and evaluation without the need for supervision.
SUPERVISION RELINQUISHED
11
Light-Curing via UV Add-On
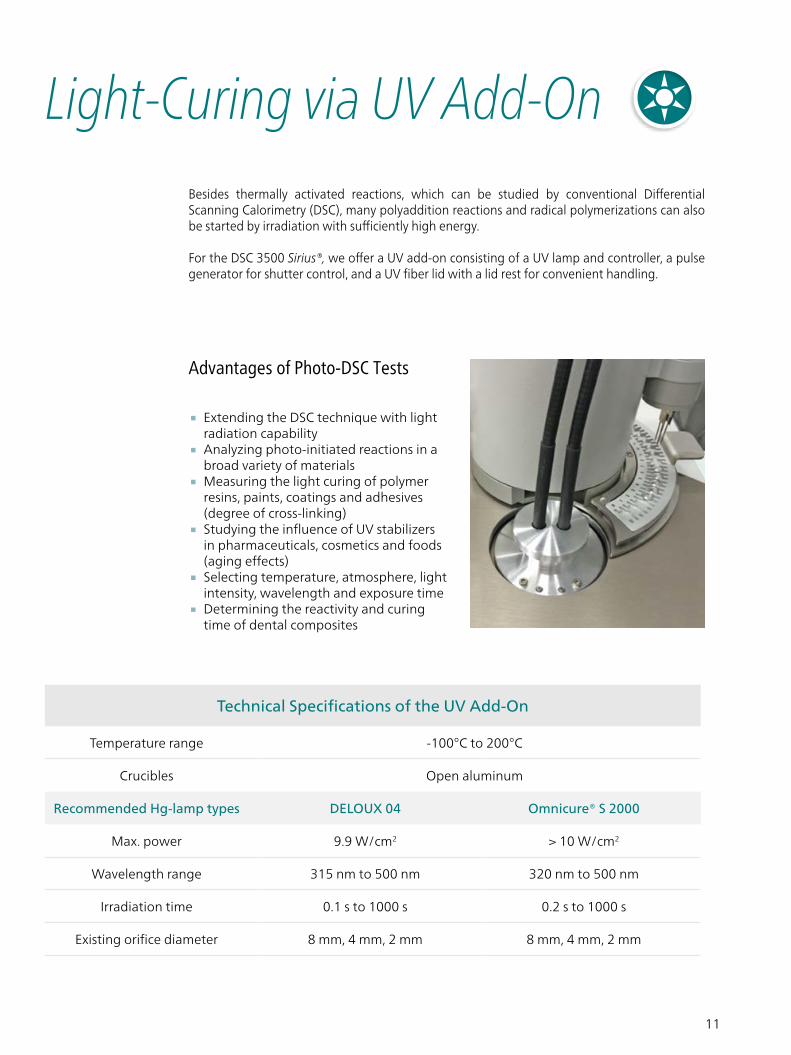
Advantages of Photo-DSC Tests
∙ Extending the DSC technique with light radiation capability ∙ Analyzing photo-initiated reactions in a broad variety of materials ∙ Measuring the light curing of polymer resins, paints, coatings and adhesives (degree of cross-linking) ∙ Studying the influence of UV stabilizers in pharmaceuticals, cosmetics and foods (aging effects) ∙ Selecting temperature, atmosphere, light intensity, wavelength and exposure time ∙ Determining the reactivity and curing time of dental composites
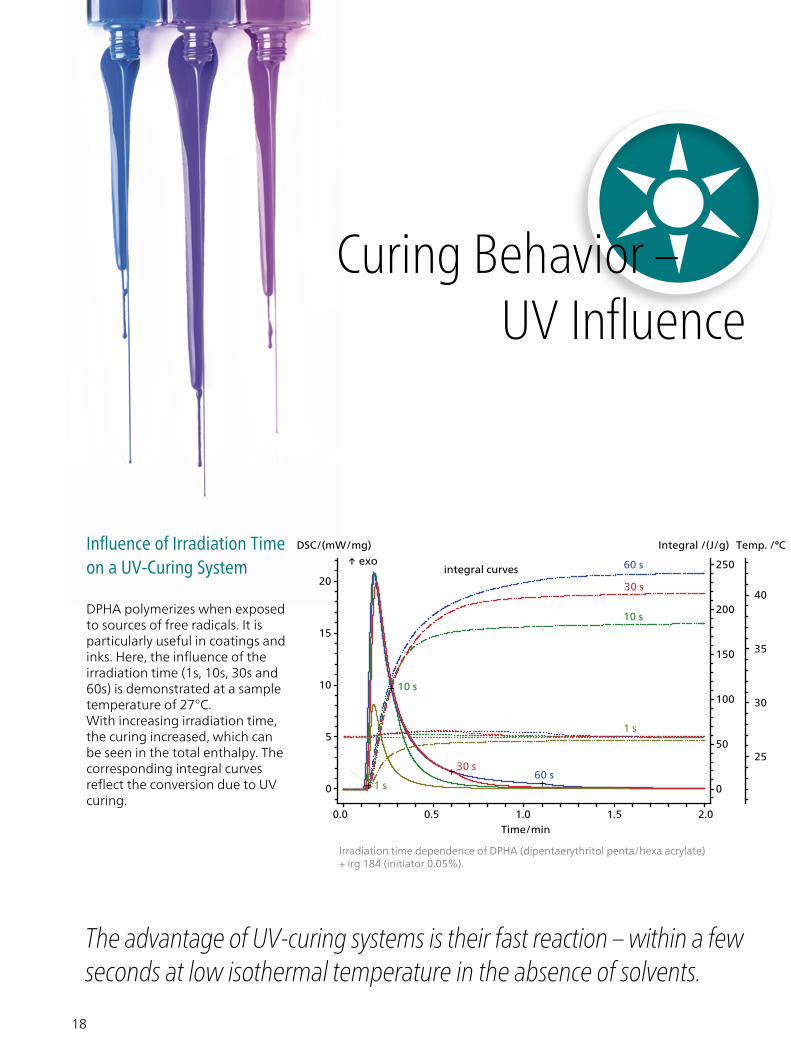
Besides thermally activated reactions, which can be studied by conventional Differential Scanning Calorimetry (DSC), many polyaddition reactions and radical polymerizations can also be started by irradiation with sufficiently high energy.
For the DSC 3500 Sirius®, we offer a UV add-on consisting of a UV lamp and controller, a pulse generator for shutter control, and a UV fiber lid with a lid rest for convenient handling.
Technical Specifications of the UV Add-On
Temperature range -100°C to 200°C
Crucibles Open aluminum
Recommended Hg-lamp types DELOUX 04 Omnicure® S 2000
Max. power 9.9 W/cm2 > 10 W/cm2
Wavelength range 315 nm to 500 nm 320 nm to 500 nm
Irradiation time 0.1 s to 1000 s 0.2 s to 1000 s
Existing orifice diameter 8 mm, 4 mm, 2 mm 8 mm, 4 mm, 2 mm
12
Value: -51.60 °C, -0.008 mW
-50-100 0 50 100 150 200
0 50 100 150 200
250 300Temperature/°C
-0.20
-0.15
-0.8
-0.6
-0.4
0.4
-0.2
0.2
-0.0
-0.10
-0.05
0.00
0.05
0.10
0.15
0.20
Value: 282.60 °C, 0.008 mW
↓ exo
-100 -50 0 50 100 150 200 250 300
Temperature/°C
50 100 150 200 250 300 350 400 450 500
Temperature/°C
-1.5
-1.0
-0.5
0.0
0.1
0.2
0.3
0.4
0.5
0.0
0.5
1.0
1.5
1st heating2nd heating
3rd heating
Value: 300.0 °C, -0.012 mWValue: -100.0 °C, 0.004 mWValue: 300.0 °C, -0.005 mWValue: -100.0 °C, 0.009 mW
44.14 °C
Value: 300.0 °C, 0.012 mWValue: -100.0 °C, 0.010 mW
43.01 °C
↓ exo
70 80 90 100 110 120 130Time/min
-0.5
-0.4
-0.3
-0.2
-0.1
0.0
0.1
DSC/(mW/mg)
-20
0
20
40
60
80
100
120
Temperature/°C
0 10 20 30 40 50 60 70 80 90Temperature/°C
-0.15
-0.10
-0.05
0.00
0.05
0.10
DSC/(mW/mg)
N=1N=2Table Value
Cp/(J/(g∙K))
0.0 0.5 1.0 1.5 2.0Time/min
0
5
10
15
20
DSC/(mW/mg)
25
30
35
40
Temp. /°C
0
50
100
150
200
250
Integral /(J/g)
integral curves 60 s
30 s
1 s
10 s
10 s
30 s60 s
1 s
↑ exo
Temperature/°C
DSC/mW
DSC/mW
↓ exoDSC/(μV/mg)
Glass Transition: Mid:73.5 °CDelta Cp*:0.321 J/(g*K)Area: -10.16 J/g
Glass Transition*: Mid: 72.6 °CDelta Cp*: 0.333 J/(g*K):
Area: -11.4 J/g
Complex Peak: Area:-1.219 J/gPeak*:73.8 °C
↑ exo
↑ exo
-80 -60 -40 -20 0Temperature/°C
-1.0
-0.5
0.0
0.5
1.0
1.5
DSC/(mW/mg)
-44.8 °C-64.3 °C-69.4 °C
-18.1 °C
-27.1 °C
Area: -0.2 J/gPeak -3.5 °C*:
Area: 46.9 J/g
Area: -41.7 J/g
Area: -3.7 J/gPeak: 52.8 °C
-11.7 °C
-18.3 °C
↓ exo
heating
cooling
20 40 60 80 100Time/min
-0.6
-0.4
-0.2
0.0
0.2
0.4
0.6
0.8
DSC(mW/mg)
20
40
60
80
100
120
140
160
180
Temp./°C
OIT: 4.2 minOIT: 13.1 min OIT: 63.3 min
↓ exo
Dashed: DSC signal under nitrogen Continuous: DSC signal under air Dotted: Temperature signal
100 150 200 250Temperature/°C
Temperature/°C
1.0
1.5
2.0
2.5
3.0
DSC/(mW/mg)
DSC/(mW/mg)
DSC/(mW/mg)
DS C/(mW/mg)
121.0 °C252.6 °C
107.3 °C
117.2 °C
136.9 °C
Film B
Film C
246.5 °C127.0 °C
159.1 °C
126.4 °C139.5 °C
↓ exo
Film A
0.9
Measured
Curve 1Curve 2Curve 3
0.8
0.7
0.6
0.5
0.4
0.3
0.2
0.1
0
-0.170 80 90 100 110 120 130
Sum of calculated curves
190 200 210 220 230 240
Temperature/°C
0
1
2
3
4
5Onset*: 216.8 °C
Area: 55.36 J/gPeak: 222.1 °C
Area: 55.98 J/gPeak: 220.0 °C Onset: 216.7 °C
Onset*: 216.8 °C
Area: 55.23 J/gPeak: 221.5 °C
Area:55.96 J/gPeak: 219.9 °COnset: 216.7 °C
↓ exo
Lot 1
Lot 2
170 180 190 200 210 220Temperature/°C
-7
-6
-5
-4
-3
-2
-1
0
Area: -55.34 J/gPeak: 186.8 °C End: 187.1 °C
Area: -55.16 J/gPeak: 188.7 °CEnd: 189.0 °C
↓ exo
Dashed: 2nd heating
Solid Line: 1st heating
Lot 1
Lot 2
123.5 124.0 124.5 125.0 125.5126.0 126.5Time/min
818283848586878889
Temp./°C
-10 -8 -6 -4 -2 0 2 4 6Temperature /°C
-0,40
-0,35
-0,30
-0,25
DSC/mW/mg
Area: -0,2 J/gPeak*: -3,5 °C
↓ exo
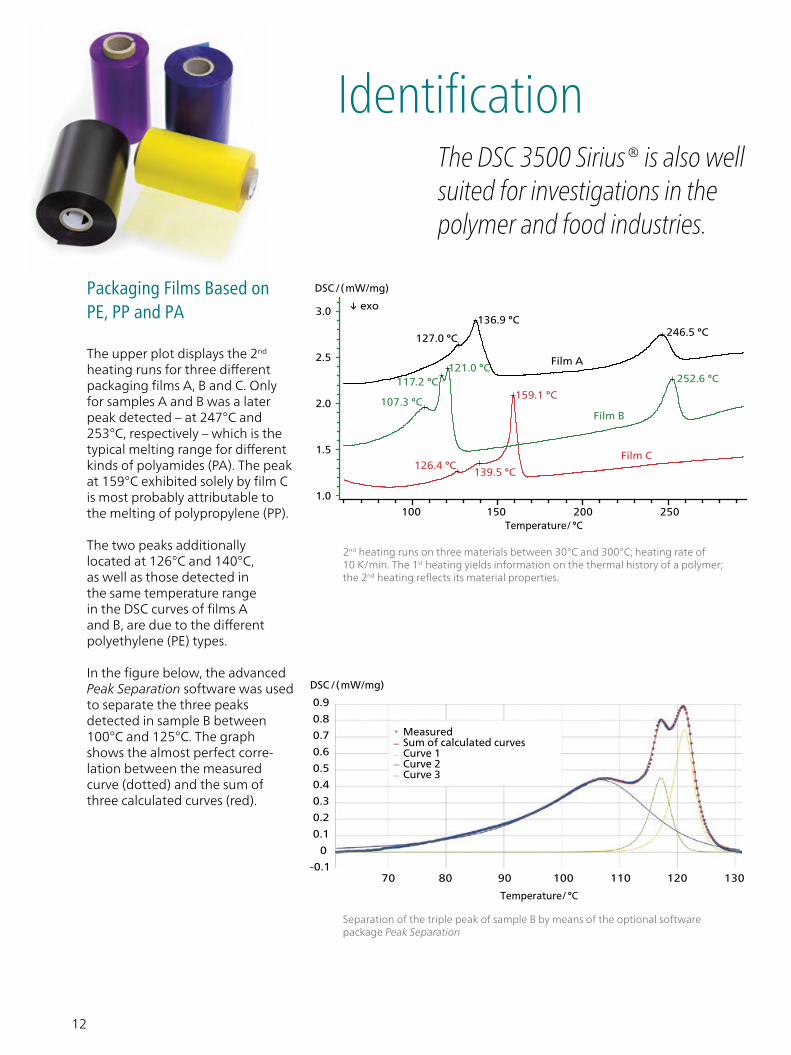
Packaging Films Based on PE, PP and PA
The upper plot displays the 2nd heating runs for three different packaging films A, B and C. Only for samples A and B was a later peak detected – at 247°C and 253°C, respectively – which is the typical melting range for different kinds of polyamides (PA). The peak at 159°C exhibited solely by film C is most probably attributable to the melting of polypropylene (PP).
The two peaks additionally located at 126°C and 140°C, as well as those detected in the same temperature range in the DSC curves of films A and B, are due to the different polyethylene (PE) types.
In the figure below, the advanced Peak Separation software was used to separate the three peaks detected in sample B between 100°C and 125°C. The graph shows the almost perfect corre-lation between the measured curve (dotted) and the sum of three calculated curves (red).
2nd heating runs on three materials between 30°C and 300°C; heating rate of 10 K/min. The 1st heating yields information on the thermal history of a polymer; the 2nd heating reflects its material properties.
Separation of the triple peak of sample B by means of the optional software package Peak Separation
The DSC 3500 Sirius® is also well suited for investigations in the polymer and food industries.
Identification
13
Value: -51.60 °C, -0.008 mW
-50-100 0 50 100 150 200
0 50 100 150 200
250 300Temperature/°C
-0.20
-0.15
-0.8
-0.6
-0.4
0.4
-0.2
0.2
-0.0
-0.10
-0.05
0.00
0.05
0.10
0.15
0.20
Value: 282.60 °C, 0.008 mW
↓ exo
-100 -50 0 50 100 150 200 250 300
Temperature/°C
50 100 150 200 250 300 350 400 450 500
Temperature/°C
-1.5
-1.0
-0.5
0.0
0.1
0.2
0.3
0.4
0.5
0.0
0.5
1.0
1.5
1st heating2nd heating
3rd heating
Value: 300.0 °C, -0.012 mWValue: -100.0 °C, 0.004 mWValue: 300.0 °C, -0.005 mWValue: -100.0 °C, 0.009 mW
44.14 °C
Value: 300.0 °C, 0.012 mWValue: -100.0 °C, 0.010 mW
43.01 °C
↓ exo
70 80 90 100 110 120 130Time/min
-0.5
-0.4
-0.3
-0.2
-0.1
0.0
0.1
DSC/(mW/mg)
-20
0
20
40
60
80
100
120
Temperature/°C
0 10 20 30 40 50 60 70 80 90Temperature/°C
-0.15
-0.10
-0.05
0.00
0.05
0.10
DSC/(mW/mg)
N=1N=2Table Value
Cp/(J/(g∙K))
0.0 0.5 1.0 1.5 2.0Time/min
0
5
10
15
20
DSC/(mW/mg)
25
30
35
40
Temp. /°C
0
50
100
150
200
250
Integral /(J/g)
integral curves 60 s
30 s
1 s
10 s
10 s
30 s60 s
1 s
↑ exo
Temperature/°C
DSC/mW
DSC/mW
↓ exoDSC/(μV/mg)
Glass Transition: Mid:73.5 °CDelta Cp*:0.321 J/(g*K)Area: -10.16 J/g
Glass Transition*: Mid: 72.6 °CDelta Cp*: 0.333 J/(g*K):
Area: -11.4 J/g
Complex Peak: Area:-1.219 J/gPeak*:73.8 °C
↑ exo
↑ exo
-80 -60 -40 -20 0Temperature/°C
-1.0
-0.5
0.0
0.5
1.0
1.5
DSC/(mW/mg)
-44.8 °C-64.3 °C-69.4 °C
-18.1 °C
-27.1 °C
Area: -0.2 J/gPeak -3.5 °C*:
Area: 46.9 J/g
Area: -41.7 J/g
Area: -3.7 J/gPeak: 52.8 °C
-11.7 °C
-18.3 °C
↓ exo
heating
cooling
20 40 60 80 100Time/min
-0.6
-0.4
-0.2
0.0
0.2
0.4
0.6
0.8
DSC(mW/mg)
20
40
60
80
100
120
140
160
180
Temp./°C
OIT: 4.2 minOIT: 13.1 min OIT: 63.3 min
↓ exo
Dashed: DSC signal under nitrogen Continuous: DSC signal under air Dotted: Temperature signal
100 150 200 250Temperature/°C
Temperature/°C
1.0
1.5
2.0
2.5
3.0
DSC/( mW/mg)
DSC/( mW/mg)
DSC/( mW/mg)
DSC/( mW/mg)
121.0 °C252.6 °C
107.3 °C
117.2 °C
136.9 °C
Film B
Film C
246.5 °C127.0 °C
159.1 °C
126.4 °C139.5 °C
↓ exo
Film A
0.9
Measured
Curve 1Curve 2Curve 3
0.8
0.7
0.6
0.5
0.4
0.3
0.2
0.1
0
-0.170 80 90 100 110 120 130
Sum of calculated curves
190 200 210 220 230 240
Temperature/°C
0
1
2
3
4
5Onset*: 216.8 °C
Area: 55.36 J/gPeak: 222.1 °C
Area: 55.98 J/gPeak: 220.0 °C Onset: 216.7 °C
Onset*: 216.8 °C
Area: 55.23 J/gPeak: 221.5 °C
Area:55.96 J/gPeak: 219.9 °COnset: 216.7 °C
↓ exo
Lot 1
Lot 2
170 180 190 200 210 220Temperature/°C
-7
-6
-5
-4
-3
-2
-1
0
Area: -55.34 J/gPeak: 186.8 °C End: 187.1 °C
Area: -55.16 J/gPeak: 188.7 °CEnd: 189.0 °C
↓ exo
Dashed: 2nd heating
Solid Line: 1st heating
Lot 1
Lot 2
123.5 124.0 124.5 125.0 125.5126.0 126.5Time/min
818283848586878889
Temp./°C
-10 -8 -6 -4 -2 0 2 4 6Temperature /°C
-0,40
-0,35
-0,30
-0,25
DSC/mW/mg
Area: -0,2 J/gPeak*: -3,5 °C
↓ exo
Value: -51.60 °C, -0.008 mW
-50-100 0 50 100 150 200
0 50 100 150 200
250 300Temperature/°C
-0.20
-0.15
-0.8
-0.6
-0.4
0.4
-0.2
0.2
-0.0
-0.10
-0.05
0.00
0.05
0.10
0.15
0.20
Value: 282.60 °C, 0.008 mW
↓ exo
-100 -50 0 50 100 150 200 250 300
Temperature/°C
50 100 150 200 250 300 350 400 450 500
Temperature/°C
-1.5
-1.0
-0.5
0.0
0.1
0.2
0.3
0.4
0.5
0.0
0.5
1.0
1.5
1st heating2nd heating
3rd heating
Value: 300.0 °C, -0.012 mWValue: -100.0 °C, 0.004 mWValue: 300.0 °C, -0.005 mWValue: -100.0 °C, 0.009 mW
44.14 °C
Value: 300.0 °C, 0.012 mWValue: -100.0 °C, 0.010 mW
43.01 °C
↓ exo
70 80 90 100 110 120 130Time/min
-0.5
-0.4
-0.3
-0.2
-0.1
0.0
0.1
DSC/(mW/mg)
-20
0
20
40
60
80
100
120
Temperature/°C
0 10 20 30 40 50 60 70 80 90Temperature/°C
-0.15
-0.10
-0.05
0.00
0.05
0.10
DSC/(mW/mg)
N=1N=2Table Value
Cp/(J/(g∙K))
0.0 0.5 1.0 1.5 2.0Time/min
0
5
10
15
20
DSC/(mW/mg)
25
30
35
40
Temp. /°C
0
50
100
150
200
250
Integral /(J/g)
integral curves 60 s
30 s
1 s
10 s
10 s
30 s60 s
1 s
↑ exo
Temperature/°C
DSC/mW
DSC/mW
↓ exoDSC/(μV/mg)
Glass Transition: Mid:73.5 °CDelta Cp*:0.321 J/(g*K)Area: -10.16 J/g
Glass Transition*: Mid: 72.6 °CDelta Cp*: 0.333 J/(g*K):
Area: -11.4 J/g
Complex Peak: Area:-1.219 J/gPeak*:73.8 °C
↑ exo
↑ exo
-80 -60 -40 -20 0Temperature/°C
-1.0
-0.5
0.0
0.5
1.0
1.5
DSC/(mW/mg)
-44.8 °C-64.3 °C-69.4 °C
-18.1 °C
-27.1 °C
Area: -0.2 J/gPeak -3.5 °C*:
Area: 46.9 J/g
Area: -41.7 J/g
Area: -3.7 J/gPeak: 52.8 °C
-11.7 °C
-18.3 °C
↓ exo
heating
cooling
20 40 60 80 100Time/min
-0.6
-0.4
-0.2
0.0
0.2
0.4
0.6
0.8
DSC(mW/mg)
20
40
60
80
100
120
140
160
180
Temp./°C
OIT: 4.2 minOIT: 13.1 min OIT: 63.3 min
↓ exo
Dashed: DSC signal under nitrogen Continuous: DSC signal under air Dotted: Temperature signal
100 150 200 250Temperature/°C
Temperature/°C
1.0
1.5
2.0
2.5
3.0
DSC /(mW/mg)
DSC/(mW/mg)
DSC/(mW/mg)
DS C/(mW/mg)
121.0 °C252.6 °C
107.3 °C
117.2 °C
136.9 °C
Film B
Film C
246.5 °C127.0 °C
159.1 °C
126.4 °C139.5 °C
↓ exo
Film A
0.9
Measured
Curve 1Curve 2Curve 3
0.8
0.7
0.6
0.5
0.4
0.3
0.2
0.1
0
-0.170 80 90 100 110 120 130
Sum of calculated curves
190 200 210 220 230 240
Temperature/°C
0
1
2
3
4
5Onset*: 216.8 °C
Area: 55.36 J/gPeak: 222.1 °C
Area: 55.98 J/gPeak: 220.0 °C Onset: 216.7 °C
Onset*: 216.8 °C
Area: 55.23 J/gPeak: 221.5 °C
Area:55.96 J/gPeak: 219.9 °COnset: 216.7 °C
↓ exo
Lot 1
Lot 2
170 180 190 200 210 220Temperature/°C
-7
-6
-5
-4
-3
-2
-1
0
Area: -55.34 J/gPeak: 186.8 °C End: 187.1 °C
Area: -55.16 J/gPeak: 188.7 °CEnd: 189.0 °C
↓ exo
Dashed: 2nd heating
Solid Line: 1st heating
Lot 1
Lot 2
123.5 124.0 124.5 125.0 125.5126.0 126.5Time/min
818283848586878889
Temp./°C
-10 -8 -6 -4 -2 0 2 4 6Temperature /°C
-0,40
-0,35
-0,30
-0,25
DSC/mW/mg
Area: -0,2 J/gPeak*: -3,5 °C
↓ exo
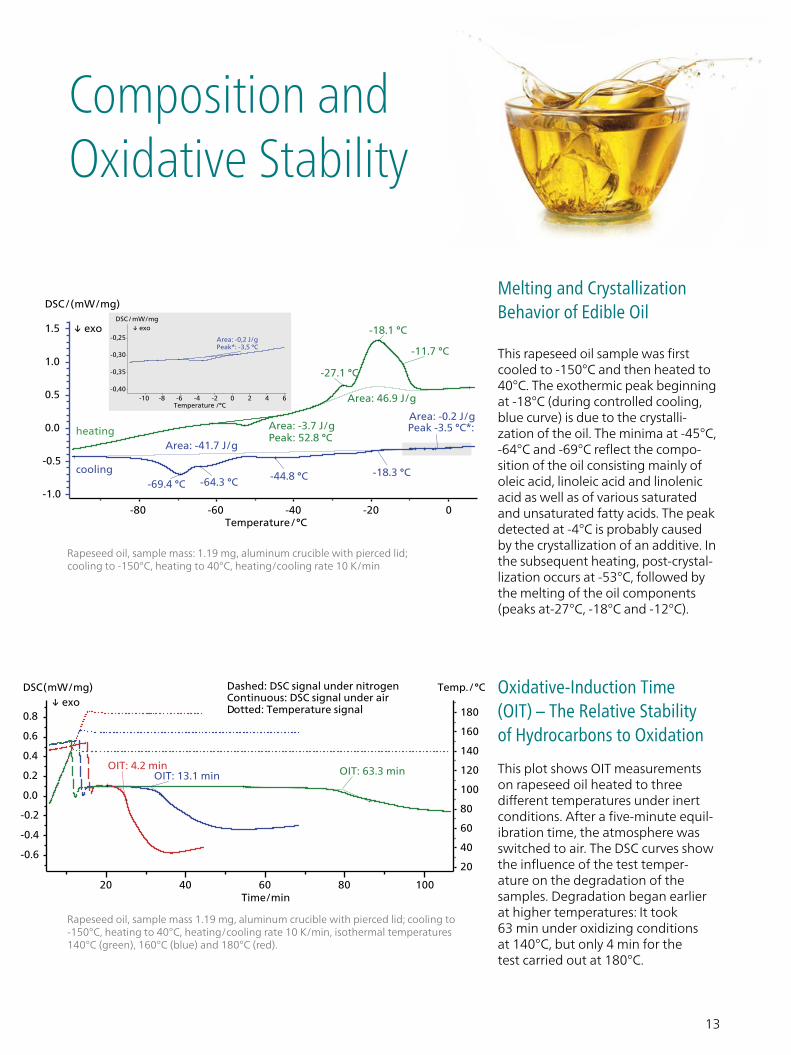
Composition and Oxidative Stability
Melting and Crystallization Behavior of Edible Oil This rapeseed oil sample was first cooled to -150°C and then heated to 40°C. The exothermic peak beginning at -18°C (during controlled cooling, blue curve) is due to the crystalli-zation of the oil. The minima at -45°C, -64°C and -69°C reflect the compo-sition of the oil consisting mainly of oleic acid, linoleic acid and linolenic acid as well as of various saturated and unsaturated fatty acids. The peak detected at -4°C is probably caused by the crystallization of an additive. In the subsequent heating, post-crystal-lization occurs at -53°C, followed by the melting of the oil components (peaks at-27°C, -18°C and -12°C).
Oxidative-Induction Time (OIT) – The Relative Stability of Hydrocarbons to Oxidation This plot shows OIT measurements on rapeseed oil heated to three different temperatures under inert conditions. After a five-minute equil-ibration time, the atmosphere was switched to air. The DSC curves show the influence of the test temper-ature on the degradation of the samples. Degradation began earlier at higher temperatures: It took 63 min under oxidizing conditions at 140°C, but only 4 min for thetest carried out at 180°C.
Rapeseed oil, sample mass 1.19 mg, aluminum crucible with pierced lid; cooling to -150°C, heating to 40°C, heating/cooling rate 10 K/min, isothermal temperatures 140°C (green), 160°C (blue) and 180°C (red).
Rapeseed oil, sample mass: 1.19 mg, aluminum crucible with pierced lid; cooling to -150°C, heating to 40°C, heating/cooling rate 10 K/min
14
Value: -51.60 °C, -0.008 mW
-50-100 0 50 100 150 200
0 50 100 150 200
250 300Temperature/°C
-0.20
-0.15
-0.8
-0.6
-0.4
0.4
-0.2
0.2
-0.0
-0.10
-0.05
0.00
0.05
0.10
0.15
0.20
Value: 282.60 °C, 0.008 mW
↓ exo
-100 -50 0 50 100 150 200 250 300
Temperature/°C
50 100 150 200 250 300 350 400 450 500
Temperature/°C
-1.5
-1.0
-0.5
0.0
0.1
0.2
0.3
0.4
0.5
0.0
0.5
1.0
1.5
1st heating2nd heating
3rd heating
Value: 300.0 °C, -0.012 mWValue: -100.0 °C, 0.004 mWValue: 300.0 °C, -0.005 mWValue: -100.0 °C, 0.009 mW
44.14 °C
Value: 300.0 °C, 0.012 mWValue: -100.0 °C, 0.010 mW
43.01 °C
↓ exo
70 80 90 100 110 120 130Time/min
-0.5
-0.4
-0.3
-0.2
-0.1
0.0
0.1
DSC/(mW/mg)
-20
0
20
40
60
80
100
120
Temperature/°C
0 10 20 30 40 50 60 70 80 90Temperature/°C
-0.15
-0.10
-0.05
0.00
0.05
0.10
DSC/(mW/mg)
N=1N=2Table Value
Cp/(J/(g∙K))
0.0 0.5 1.0 1.5 2.0Time/min
0
5
10
15
20
DSC/(mW/mg)
25
30
35
40
Temp. /°C
0
50
100
150
200
250
Integral /(J/g)
integral curves 60 s
30 s
1 s
10 s
10 s
30 s60 s
1 s
↑ exo
Temperature/°C
DSC/mW
DSC/mW
↓ exoDSC/(μV/mg)
Glass Transition: Mid:73.5 °CDelta Cp*:0.321 J/(g*K)Area: -10.16 J/g
Glass Transition*: Mid: 72.6 °CDelta Cp*: 0.333 J/(g*K):
Area: -11.4 J/g
Complex Peak: Area:-1.219 J/gPeak*:73.8 °C
↑ exo
↑ exo
-80 -60 -40 -20 0Temperature/°C
-1.0
-0.5
0.0
0.5
1.0
1.5
DSC/(mW/mg)
-44.8 °C-64.3 °C-69.4 °C
-18.1 °C
-27.1 °C
Area: -0.2 J/gPeak -3.5 °C*:
Area: 46.9 J/g
Area: -41.7 J/g
Area: -3.7 J/gPeak: 52.8 °C
-11.7 °C
-18.3 °C
↓ exo
heating
cooling
20 40 60 80 100Time/min
-0.6
-0.4
-0.2
0.0
0.2
0.4
0.6
0.8
DSC(mW/mg)
20
40
60
80
100
120
140
160
180
Temp./°C
OIT: 4.2 minOIT: 13.1 min OIT: 63.3 min
↓ exo
Dashed: DSC signal under nitrogen Continuous: DSC signal under air Dotted: Temperature signal
100 150 200 250Temperature/°C
Temperature/°C
1.0
1.5
2.0
2.5
3.0
DSC/(mW/mg)
DSC/(mW/mg)
DSC/(mW/mg)
DS C/(mW/mg)
121.0 °C252.6 °C
107.3 °C
117.2 °C
136.9 °C
Film B
Film C
246.5 °C127.0 °C
159.1 °C
126.4 °C139.5 °C
↓ exo
Film A
0.9
Measured
Curve 1Curve 2Curve 3
0.8
0.7
0.6
0.5
0.4
0.3
0.2
0.1
0
-0.170 80 90 100 110 120 130
Sum of calculated curves
190 200 210 220 230 240
Temperature/°C
0
1
2
3
4
5Onset*: 216.8 °C
Area: 55.36 J/gPeak: 222.1 °C
Area: 55.98 J/gPeak: 220.0 °C Onset: 216.7 °C
Onset*: 216.8 °C
Area: 55.23 J/gPeak: 221.5 °C
Area:55.96 J/gPeak: 219.9 °COnset: 216.7 °C
↓ exo
Lot 1
Lot 2
170 180 190 200 210 220Temperature/°C
-7
-6
-5
-4
-3
-2
-1
0
Area: -55.34 J/gPeak: 186.8 °C End: 187.1 °C
Area: -55.16 J/gPeak: 188.7 °CEnd: 189.0 °C
↓ exo
Dashed: 2nd heating
Solid Line: 1st heating
Lot 1
Lot 2
123.5 124.0 124.5 125.0 125.5126.0 126.5Time/min
818283848586878889
Temp./°C
-10 -8 -6 -4 -2 0 2 4 6Temperature /°C
-0,40
-0,35
-0,30
-0,25
DSC/mW/mg
Area: -0,2 J/gPeak*: -3,5 °C
↓ exo
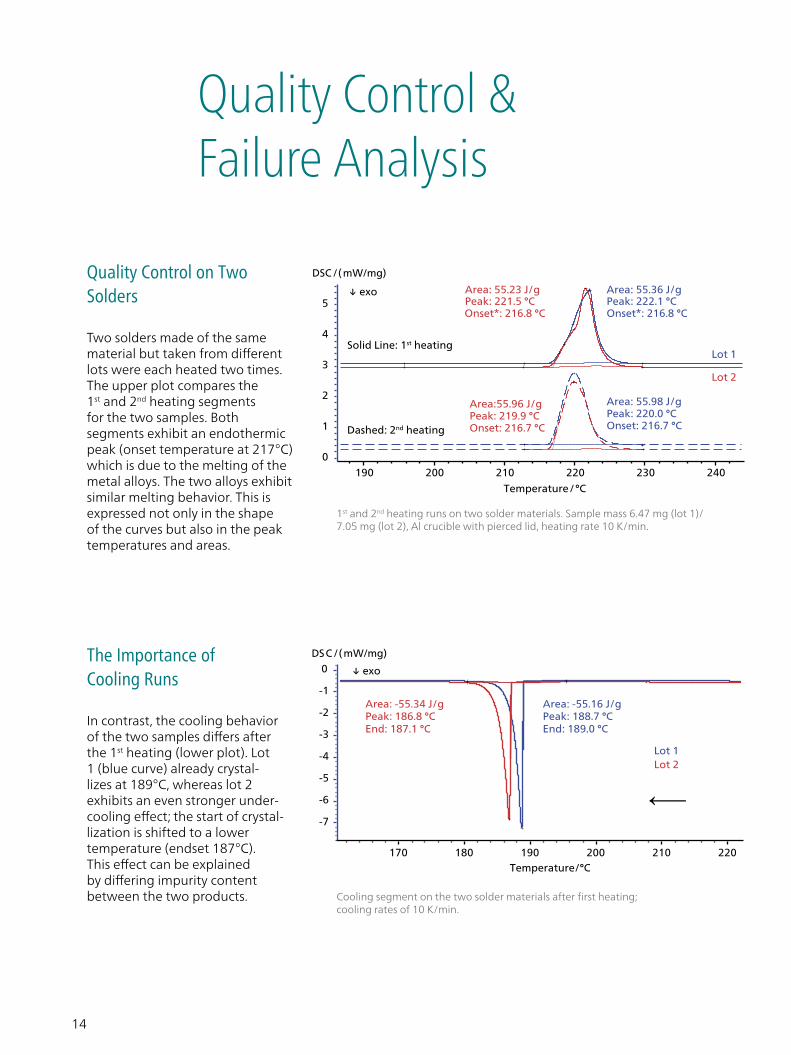
Quality Control & Failure Analysis
Quality Control on Two Solders
Two solders made of the same material but taken from different lots were each heated two times. The upper plot compares the 1st and 2nd heating segmentsfor the two samples. Both segments exhibit an endothermic peak (onset temperature at 217°C) which is due to the melting of the metal alloys. The two alloys exhibit similar melting behavior. This is expressed not only in the shape of the curves but also in the peaktemperatures and areas.
The Importance of Cooling Runs
In contrast, the cooling behavior of the two samples differs after the 1st heating (lower plot). Lot 1 (blue curve) already crystal-lizes at 189°C, whereas lot 2 exhibits an even stronger under-cooling effect; the start of crystal-lization is shifted to a lower temperature (endset 187°C). This effect can be explained by differing impurity content between the two products.
1st and 2nd heating runs on two solder materials. Sample mass 6.47 mg (lot 1)/ 7.05 mg (lot 2), Al crucible with pierced lid, heating rate 10 K/min.
Cooling segment on the two solder materials after first heating; cooling rates of 10 K/min.
15
Value: -51.60 °C, -0.008 mW
-50-100 0 50 100 150 200
0 50 100 150 200
250 300Temperature/°C
-0.20
-0.15
-0.8
-0.6
-0.4
0.4
-0.2
0.2
-0.0
-0.10
-0.05
0.00
0.05
0.10
0.15
0.20
Value: 282.60 °C, 0.008 mW
↓ exo
-100 -50 0 50 100 150 200 250 300
Temperature/°C
50 100 150 200 250 300 350 400 450 500
Temperature/°C
-1.5
-1.0
-0.5
0.0
0.1
0.2
0.3
0.4
0.5
0.0
0.5
1.0
1.5
1st heating2nd heating
3rd heating
Value: 300.0 °C, -0.012 mWValue: -100.0 °C, 0.004 mWValue: 300.0 °C, -0.005 mWValue: -100.0 °C, 0.009 mW
44.14 °C
Value: 300.0 °C, 0.012 mWValue: -100.0 °C, 0.010 mW
43.01 °C
↓ exo
70 80 90 100 110 120 130Time/min
-0.5
-0.4
-0.3
-0.2
-0.1
0.0
0.1
DSC/(mW/mg)
-20
0
20
40
60
80
100
120
Temperature/°C
0 10 20 30 40 50 60 70 80 90Temperature/°C
-0.15
-0.10
-0.05
0.00
0.05
0.10
DSC/(mW/mg)
N=1N=2Table Value
Cp/(J/(g∙K))
0.0 0.5 1.0 1.5 2.0Time/min
0
5
10
15
20
DSC/(mW/mg)
25
30
35
40
Temp. /°C
0
50
100
150
200
250
Integral /(J/g)
integral curves 60 s
30 s
1 s
10 s
10 s
30 s60 s
1 s
↑ exo
Temperature/°C
DSC/mW
DSC/mW
↓ exoDSC/(μV/mg)
Glass Transition: Mid:73.5 °CDelta Cp*:0.321 J/(g*K)Area: -10.16 J/g
Glass Transition*: Mid: 72.6 °CDelta Cp*: 0.333 J/(g*K):
Area: -11.4 J/g
Complex Peak: Area:-1.219 J/gPeak*:73.8 °C
↑ exo
↑ exo
-80 -60 -40 -20 0Temperature/°C
-1.0
-0.5
0.0
0.5
1.0
1.5
DSC/(mW/mg)
-44.8 °C-64.3 °C-69.4 °C
-18.1 °C
-27.1 °C
Area: -0.2 J/gPeak -3.5 °C*:
Area: 46.9 J/g
Area: -41.7 J/g
Area: -3.7 J/gPeak: 52.8 °C
-11.7 °C
-18.3 °C
↓ exo
heating
cooling
20 40 60 80 100Time/min
-0.6
-0.4
-0.2
0.0
0.2
0.4
0.6
0.8
DSC(mW/mg)
20
40
60
80
100
120
140
160
180
Temp./°C
OIT: 4.2 minOIT: 13.1 min OIT: 63.3 min
↓ exo
Dashed: DSC signal under nitrogen Continuous: DSC signal under air Dotted: Temperature signal
100 150 200 250Temperature/ °C
Temperature/ °C
1.0
1.5
2.0
2.5
3.0
DSC/(mW/mg)
DSC/(mW/mg)
DSC/(mW/mg)
DS C/(mW/mg)
121.0 °C252.6 °C
107.3 °C
117.2 °C
136.9 °C
Film B
Film C
246.5 °C127.0 °C
159.1 °C
126.4 °C139.5 °C
↓ exo
Film A
0.9
Measured
Curve 1Curve 2Curve 3
0.8
0.7
0.6
0.5
0.4
0.3
0.2
0.1
0
-0.170 80 90 100 110 120 130
Sum of calculated curves
190 200 210 220 230 240
Temperature/°C
0
1
2
3
4
5Onset*: 216.8 °C
Area: 55.36 J/gPeak: 222.1 °C
Area: 55.98 J/gPeak: 220.0 °C Onset: 216.7 °C
Onset*: 216.8 °C
Area: 55.23 J/gPeak: 221.5 °C
Area:55.96 J/gPeak: 219.9 °COnset: 216.7 °C
↓ exo
Lot 1
Lot 2
170 180 190 200 210 220Temperature/°C
-7
-6
-5
-4
-3
-2
-1
0
Area: -55.34 J/gPeak: 186.8 °C End: 187.1 °C
Area: -55.16 J/gPeak: 188.7 °CEnd: 189.0 °C
↓ exo
Dashed: 2nd heating
Solid Line: 1st heating
Lot 1
Lot 2
123.5 124.0 124.5 125.0 125.5126.0 126.5Time/min
818283848586878889
Temp./°C
-10 -8 -6 -4 -2 0 2 4 6Temperature /°C
-0,40
-0,35
-0,30
-0,25
DSC/mW/mg
Area: -0,2 J/gPeak*: -3,5 °C
↓ exo
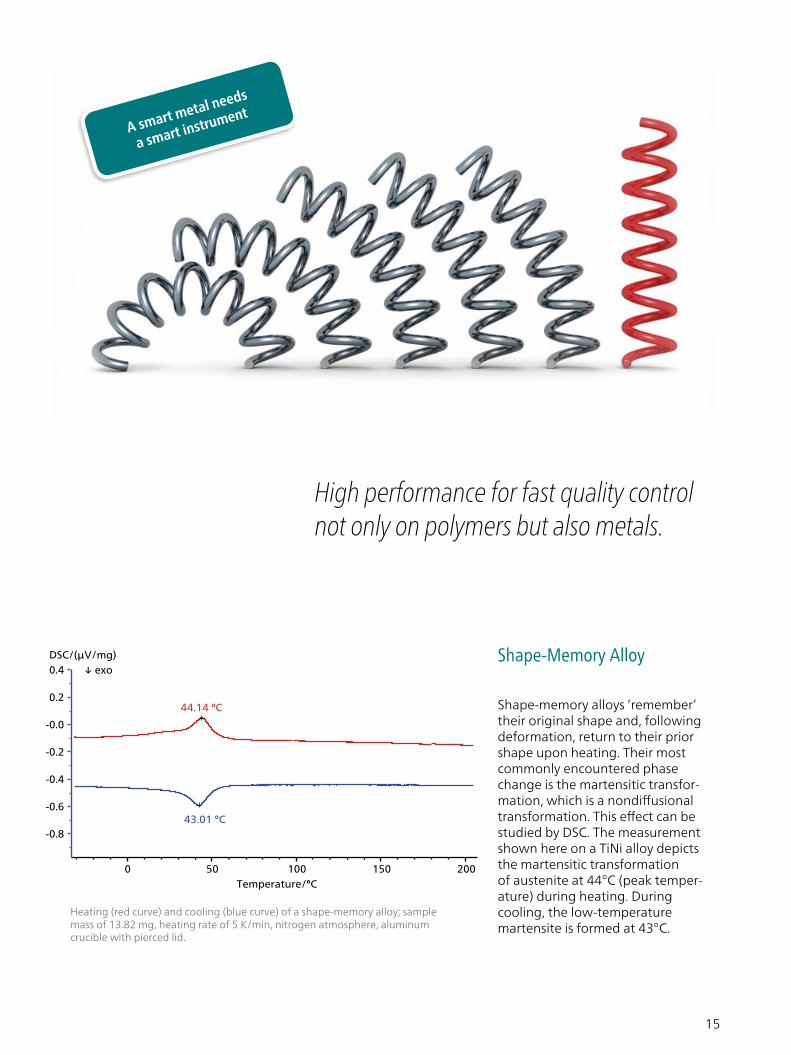
Shape-Memory Alloy
Shape-memory alloys ‘remember’ their original shape and, following deformation, return to their prior shape upon heating. Their most commonly encountered phase change is the martensitic transfor-mation, which is a nondiffusionaltransformation. This effect can be studied by DSC. The measurement shown here on a TiNi alloy depicts the martensitic transformationof austenite at 44°C (peak temper-ature) during heating. During cooling, the low-temperature martensite is formed at 43°C.
Heating (red curve) and cooling (blue curve) of a shape-memory alloy; sample mass of 13.82 mg, heating rate of 5 K/min, nitrogen atmosphere, aluminum crucible with pierced lid.
High performance for fast quality control not only on polymers but also metals.
A smart metal needs
a smart instrument
16
Value: -51.60 °C, -0.008 mW
-50-100 0 50 100 150 200
0 50 100 150 200
250 300Temperature/°C
-0.20
-0.15
-0.8
-0.6
-0.4
0.4
-0.2
0.2
-0.0
-0.10
-0.05
0.00
0.05
0.10
0.15
0.20
Value: 282.60 °C, 0.008 mW
↓ exo
-100 -50 0 50 100 150 200 250 300
Temperature/°C
50 100 150 200 250 300 350 400 450 500
Temperature/°C
-1.5
-1.0
-0.5
0.0
0.1
0.2
0.3
0.4
0.5
0.0
0.5
1.0
1.5
1st heating2nd heating
3rd heating
Value: 300.0 °C, -0.012 mWValue: -100.0 °C, 0.004 mWValue: 300.0 °C, -0.005 mWValue: -100.0 °C, 0.009 mW
44.14 °C
Value: 300.0 °C, 0.012 mWValue: -100.0 °C, 0.010 mW
43.01 °C
↓ exo
70 80 90 100 110 120 130Time/min
-0.5
-0.4
-0.3
-0.2
-0.1
0.0
0.1
DSC/(mW/mg)
-20
0
20
40
60
80
100
120
Temperature/°C
0 10 20 30 40 50 60 70 80 90Temperature/°C
-0.15
-0.10
-0.05
0.00
0.05
0.10
DSC/(mW/mg)
N=1N=2Table Value
Cp/(J/(g∙K))
0.0 0.5 1.0 1.5 2.0Time/min
0
5
10
15
20
DSC/(mW/mg)
25
30
35
40
Temp. /°C
0
50
100
150
200
250
Integral /(J/g)
integral curves 60 s
30 s
1 s
10 s
10 s
30 s60 s
1 s
↑ exo
Temperature/°C
DSC/mW
DSC/mW
↓ exoDSC/(μV/mg)
Glass Transition: Mid:73.5 °CDelta Cp*:0.321 J/(g*K)Area: -10.16 J/g
Glass Transition*: Mid: 72.6 °CDelta Cp*: 0.333 J/(g*K):
Area: -11.4 J/g
Complex Peak: Area:-1.219 J/gPeak*:73.8 °C
↑ exo
↑ exo
-80 -60 -40 -20 0Temperature/°C
-1.0
-0.5
0.0
0.5
1.0
1.5
DSC/(mW/mg)
-44.8 °C-64.3 °C-69.4 °C
-18.1 °C
-27.1 °C
Area: -0.2 J/gPeak -3.5 °C*:
Area: 46.9 J/g
Area: -41.7 J/g
Area: -3.7 J/gPeak: 52.8 °C
-11.7 °C
-18.3 °C
↓ exo
heating
cooling
20 40 60 80 100Time/min
-0.6
-0.4
-0.2
0.0
0.2
0.4
0.6
0.8
DSC(mW/mg)
20
40
60
80
100
120
140
160
180
Temp./°C
OIT: 4.2 minOIT: 13.1 min OIT: 63.3 min
↓ exo
Dashed: DSC signal under nitrogen Continuous: DSC signal under air Dotted: Temperature signal
100 150 200 250Temperature/ °C
Temperature/ °C
1.0
1.5
2.0
2.5
3.0
DSC /(mW/mg)
DSC /(mW/mg)
DSC /(mW/mg)
DSC/(mW/mg)
121.0 °C252.6 °C
107.3 °C
117.2 °C
136.9 °C
Film B
Film C
246.5 °C127.0 °C
159.1 °C
126.4 °C139.5 °C
↓ exo
Film A
0.9
Measured
Curve 1Curve 2Curve 3
0.8
0.7
0.6
0.5
0.4
0.3
0.2
0.1
0
-0.170 80 90 100 110 120 130
Sum of calculated curves
190 200 210 220 230 240
Temperature/°C
0
1
2
3
4
5Onset*: 216.8 °C
Area: 55.36 J/gPeak: 222.1 °C
Area: 55.98 J/gPeak: 220.0 °C Onset: 216.7 °C
Onset*: 216.8 °C
Area: 55.23 J/gPeak: 221.5 °C
Area:55.96 J/gPeak: 219.9 °COnset: 216.7 °C
↓ exo
Lot 1
Lot 2
170 180 190 200 210 220Temperature/°C
-7
-6
-5
-4
-3
-2
-1
0
Area: -55.34 J/gPeak: 186.8 °C End: 187.1 °C
Area: -55.16 J/gPeak: 188.7 °CEnd: 189.0 °C
↓ exo
Dashed: 2nd heating
Solid Line: 1st heating
Lot 1
Lot 2
123.5 124.0 124.5 125.0 125.5126.0 126.5Time/min
818283848586878889
Temp./°C
-10 -8 -6 -4 -2 0 2 4 6Temperature /°C
-0,40
-0,35
-0,30
-0,25
DSC/mW/mg
Area: -0,2 J/gPeak*: -3,5 °C
↓ exo
Value: -51.60 °C, -0.008 mW
-50-100 0 50 100 150 200
0 50 100 150 200
250 300Temperature/°C
-0.20
-0.15
-0.8
-0.6
-0.4
0.4
-0.2
0.2
-0.0
-0.10
-0.05
0.00
0.05
0.10
0.15
0.20
Value: 282.60 °C, 0.008 mW
↓ exo
-100 -50 0 50 100 150 200 250 300
Temperature/°C
50 100 150 200 250 300 350 400 450 500
Temperature/°C
-1.5
-1.0
-0.5
0.0
0.1
0.2
0.3
0.4
0.5
0.0
0.5
1.0
1.5
1st heating2nd heating
3rd heating
Value: 300.0 °C, -0.012 mWValue: -100.0 °C, 0.004 mWValue: 300.0 °C, -0.005 mWValue: -100.0 °C, 0.009 mW
44.14 °C
Value: 300.0 °C, 0.012 mWValue: -100.0 °C, 0.010 mW
43.01 °C
↓ exo
70 80 90 100 110 120 130Time/min
-0.5
-0.4
-0.3
-0.2
-0.1
0.0
0.1
DSC/(mW/mg)
-20
0
20
40
60
80
100
120
Temperature/°C
0 10 20 30 40 50 60 70 80 90Temperature/°C
-0.15
-0.10
-0.05
0.00
0.05
0.10
DSC/(mW/mg)
N=1N=2Table Value
Cp/(J/(g∙K))
0.0 0.5 1.0 1.5 2.0Time/min
0
5
10
15
20
DSC/(mW/mg)
25
30
35
40
Temp. /°C
0
50
100
150
200
250
Integral /(J/g)
integral curves 60 s
30 s
1 s
10 s
10 s
30 s60 s
1 s
↑ exo
Temperature/°C
DSC/mW
DSC/mW
↓ exoDSC/(μV/mg)
Glass Transition: Mid:73.5 °CDelta Cp*:0.321 J/(g*K)Area: -10.16 J/g
Glass Transition*: Mid: 72.6 °CDelta Cp*: 0.333 J/(g*K):
Area: -11.4 J/g
Complex Peak: Area:-1.219 J/gPeak*:73.8 °C
↑ exo
↑ exo
-80 -60 -40 -20 0Temperature/°C
-1.0
-0.5
0.0
0.5
1.0
1.5
DSC/(mW/mg)
-44.8 °C-64.3 °C-69.4 °C
-18.1 °C
-27.1 °C
Area: -0.2 J/gPeak -3.5 °C*:
Area: 46.9 J/g
Area: -41.7 J/g
Area: -3.7 J/gPeak: 52.8 °C
-11.7 °C
-18.3 °C
↓ exo
heating
cooling
20 40 60 80 100Time/min
-0.6
-0.4
-0.2
0.0
0.2
0.4
0.6
0.8
DSC(mW/mg)
20
40
60
80
100
120
140
160
180
Temp./°C
OIT: 4.2 minOIT: 13.1 min OIT: 63.3 min
↓ exo
Dashed: DSC signal under nitrogen Continuous: DSC signal under air Dotted: Temperature signal
100 150 200 250Temperature/°C
Temperature/°C
1.0
1.5
2.0
2.5
3.0
DSC/(mW/mg)
DSC/(mW/mg)
DSC/(mW/mg)
DS C/(mW/mg)
121.0 °C252.6 °C
107.3 °C
117.2 °C
136.9 °C
Film B
Film C
246.5 °C127.0 °C
159.1 °C
126.4 °C139.5 °C
↓ exo
Film A
0.9
Measured
Curve 1Curve 2Curve 3
0.8
0.7
0.6
0.5
0.4
0.3
0.2
0.1
0
-0.170 80 90 100 110 120 130
Sum of calculated curves
190 200 210 220 230 240
Temperature/°C
0
1
2
3
4
5Onset*: 216.8 °C
Area: 55.36 J/gPeak: 222.1 °C
Area: 55.98 J/gPeak: 220.0 °C Onset: 216.7 °C
Onset*: 216.8 °C
Area: 55.23 J/gPeak: 221.5 °C
Area:55.96 J/gPeak: 219.9 °COnset: 216.7 °C
↓ exo
Lot 1
Lot 2
170 180 190 200 210 220Temperature/°C
-7
-6
-5
-4
-3
-2
-1
0
Area: -55.34 J/gPeak: 186.8 °C End: 187.1 °C
Area: -55.16 J/gPeak: 188.7 °CEnd: 189.0 °C
↓ exo
Dashed: 2nd heating
Solid Line: 1st heating
Lot 1
Lot 2
123.5 124.0 124.5 125.0 125.5126.0 126.5Time/min
818283848586878889
Temp./°C
-10 -8 -6 -4 -2 0 2 4 6Temperature /°C
-0,40
-0,35
-0,30
-0,25
DSC/mW/mg
Area: -0,2 J/gPeak*: -3,5 °C
↓ exo
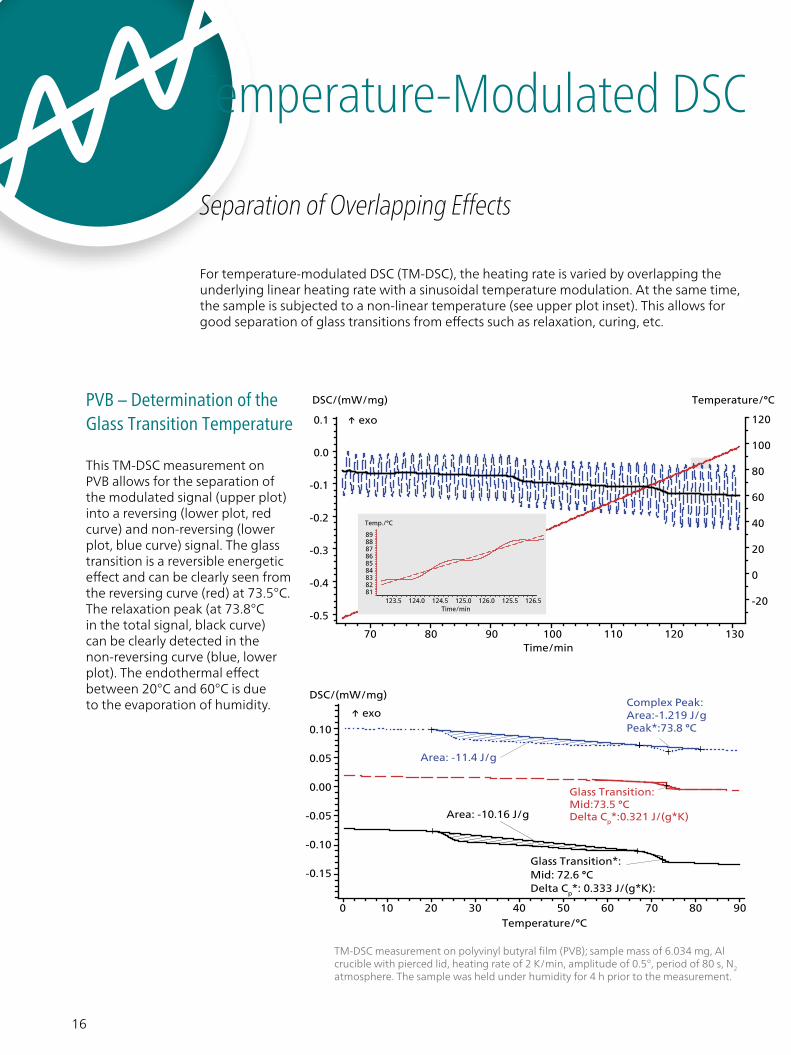
Temperature-Modulated DSC
Separation of Overlapping Effects
PVB – Determination of the Glass Transition Temperature
This TM-DSC measurement on PVB allows for the separation of the modulated signal (upper plot) into a reversing (lower plot, red curve) and non‐reversing (lower plot, blue curve) signal. The glass transition is a reversible energetic effect and can be clearly seen from the reversing curve (red) at 73.5°C. The relaxation peak (at 73.8°C in the total signal, black curve) can be clearly detected in the non-reversing curve (blue, lower plot). The endothermal effect between 20°C and 60°C is due to the evaporation of humidity.
For temperature-modulated DSC (TM‐DSC), the heating rate is varied by overlapping the underlying linear heating rate with a sinusoidal temperature modulation. At the same time, the sample is subjected to a non‐linear temperature (see upper plot inset). This allows for good separation of glass transitions from effects such as relaxation, curing, etc.
TM-DSC measurement on polyvinyl butyral film (PVB); sample mass of 6.034 mg, Al crucible with pierced lid, heating rate of 2 K/min, amplitude of 0.5°, period of 80 s, N2 atmosphere. The sample was held under humidity for 4 h prior to the measurement.
17
Value: -51.60 °C, -0.008 mW
-50-100 0 50 100 150 200
0 50 100 150 200
250 300Temperature/°C
-0.20
-0.15
-0.8
-0.6
-0.4
0.4
-0.2
0.2
-0.0
-0.10
-0.05
0.00
0.05
0.10
0.15
0.20
Value: 282.60 °C, 0.008 mW
↓ exo
-100 -50 0 50 100 150 200 250 300
Temperature/°C
50 100 150 200 250 300 350 400 450 500
Temperature/°C
-1.5
-1.0
-0.5
0.0
0.1
0.2
0.3
0.4
0.5
0.0
0.5
1.0
1.5
1st heating2nd heating
3rd heating
Value: 300.0 °C, -0.012 mWValue: -100.0 °C, 0.004 mWValue: 300.0 °C, -0.005 mWValue: -100.0 °C, 0.009 mW
44.14 °C
Value: 300.0 °C, 0.012 mWValue: -100.0 °C, 0.010 mW
43.01 °C
↓ exo
70 80 90 100 110 120 130Time/min
-0.5
-0.4
-0.3
-0.2
-0.1
0.0
0.1
DSC/(mW/mg)
-20
0
20
40
60
80
100
120
Temperature/°C
0 10 20 30 40 50 60 70 80 90Temperature/°C
-0.15
-0.10
-0.05
0.00
0.05
0.10
DSC/(mW/mg)
N=1N=2Table Value
Cp/(J/(g∙K))
0.0 0.5 1.0 1.5 2.0Time/min
0
5
10
15
20
DSC/(mW/mg)
25
30
35
40
Temp. /°C
0
50
100
150
200
250
Integral /(J/g)
integral curves 60 s
30 s
1 s
10 s
10 s
30 s60 s
1 s
↑ exo
Temperature/°C
DSC/mW
DSC/mW
↓ exoDSC/(μV/mg)
Glass Transition: Mid:73.5 °CDelta Cp*:0.321 J/(g*K)Area: -10.16 J/g
Glass Transition*: Mid: 72.6 °CDelta Cp*: 0.333 J/(g*K):
Area: -11.4 J/g
Complex Peak: Area:-1.219 J/gPeak*:73.8 °C
↑ exo
↑ exo
-80 -60 -40 -20 0Temperature/°C
-1.0
-0.5
0.0
0.5
1.0
1.5
DSC/(mW/mg)
-44.8 °C-64.3 °C-69.4 °C
-18.1 °C
-27.1 °C
Area: -0.2 J/gPeak -3.5 °C*:
Area: 46.9 J/g
Area: -41.7 J/g
Area: -3.7 J/gPeak: 52.8 °C
-11.7 °C
-18.3 °C
↓ exo
heating
cooling
20 40 60 80 100Time/min
-0.6
-0.4
-0.2
0.0
0.2
0.4
0.6
0.8
DSC(mW/mg)
20
40
60
80
100
120
140
160
180
Temp./°C
OIT: 4.2 minOIT: 13.1 min OIT: 63.3 min
↓ exo
Dashed: DSC signal under nitrogen Continuous: DSC signal under air Dotted: Temperature signal
100 150 200 250Temperature/°C
Temperature/°C
1.0
1.5
2.0
2.5
3.0
DSC/(mW/mg)
DSC/(mW/mg)
DSC/(mW/mg)
DS C/(mW/mg)
121.0 °C252.6 °C
107.3 °C
117.2 °C
136.9 °C
Film B
Film C
246.5 °C127.0 °C
159.1 °C
126.4 °C139.5 °C
↓ exo
Film A
0.9
Measured
Curve 1Curve 2Curve 3
0.8
0.7
0.6
0.5
0.4
0.3
0.2
0.1
0
-0.170 80 90 100 110 120 130
Sum of calculated curves
190 200 210 220 230 240
Temperature/°C
0
1
2
3
4
5Onset*: 216.8 °C
Area: 55.36 J/gPeak: 222.1 °C
Area: 55.98 J/gPeak: 220.0 °C Onset: 216.7 °C
Onset*: 216.8 °C
Area: 55.23 J/gPeak: 221.5 °C
Area:55.96 J/gPeak: 219.9 °COnset: 216.7 °C
↓ exo
Lot 1
Lot 2
170 180 190 200 210 220Temperature/°C
-7
-6
-5
-4
-3
-2
-1
0
Area: -55.34 J/gPeak: 186.8 °C End: 187.1 °C
Area: -55.16 J/gPeak: 188.7 °CEnd: 189.0 °C
↓ exo
Dashed: 2nd heating
Solid Line: 1st heating
Lot 1
Lot 2
123.5 124.0 124.5 125.0 125.5126.0 126.5Time/min
818283848586878889
Temp./°C
-10 -8 -6 -4 -2 0 2 4 6Temperature /°C
-0,40
-0,35
-0,30
-0,25
DSC/mW/mg
Area: -0,2 J/gPeak*: -3,5 °C
↓ exo
Specific Heat Capacity
Molybdenum SRM 781
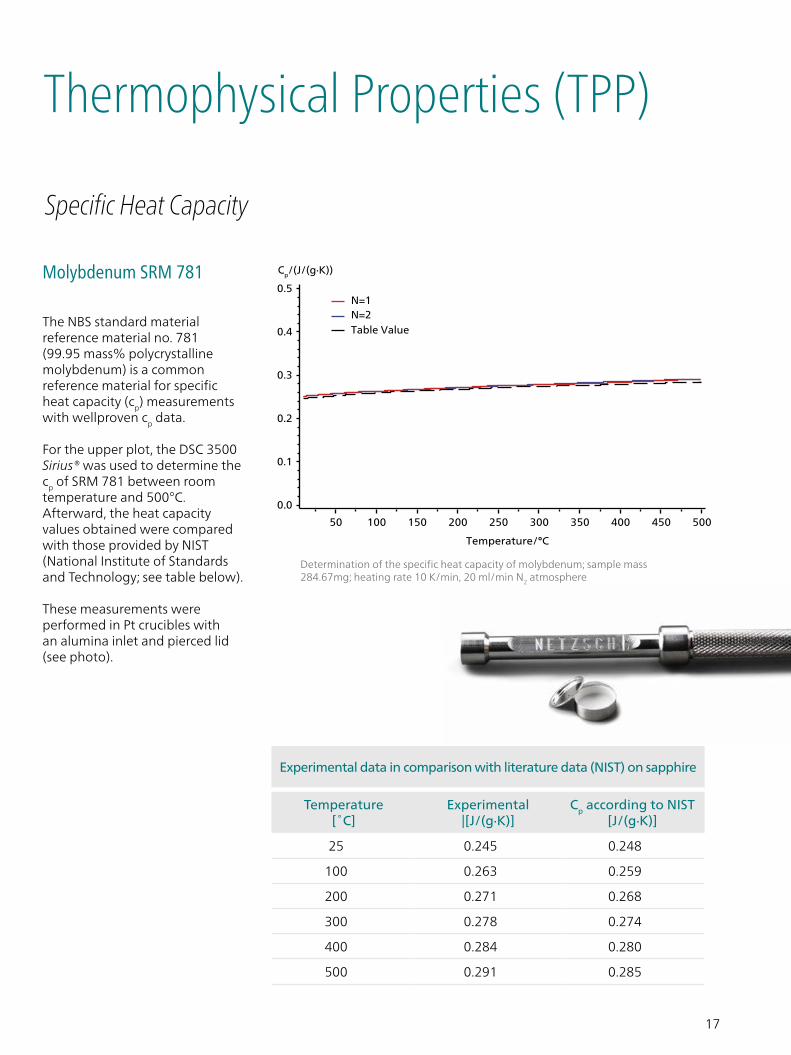
The NBS standard material reference material no. 781 (99.95 mass% polycrystalline molybdenum) is a common reference material for specific heat capacity (cp) measurements with wellproven cp data.
For the upper plot, the DSC 3500 Sirius® was used to determine the cp of SRM 781 between room temperature and 500°C. Afterward, the heat capacityvalues obtained were comparedwith those provided by NIST(National Institute of Standards and Technology; see table below).
These measurements were performed in Pt crucibles with an alumina inlet and pierced lid (see photo).
Determination of the specific heat capacity of molybdenum; sample mass 284.67mg; heating rate 10 K/min, 20 ml/min N2 atmosphere
Experimental data in comparison with literature data (NIST) on sapphire
Temperature[˚C]
Experimental|[J/(g·K)]
Cp according to NIST[J/(g·K)]
25 0.245 0.248
100 0.263 0.259
200 0.271 0.268
300 0.278 0.274
400 0.284 0.280
500 0.291 0.285
Thermophysical Properties (TPP)
18
Value: -51.60 °C, -0.008 mW
-50-100 0 50 100 150 200
0 50 100 150 200
250 300Temperature/°C
-0.20
-0.15
-0.8
-0.6
-0.4
0.4
-0.2
0.2
-0.0
-0.10
-0.05
0.00
0.05
0.10
0.15
0.20
Value: 282.60 °C, 0.008 mW
↓ exo
-100 -50 0 50 100 150 200 250 300
Temperature/°C
50 100 150 200 250 300 350 400 450 500
Temperature/°C
-1.5
-1.0
-0.5
0.0
0.1
0.2
0.3
0.4
0.5
0.0
0.5
1.0
1.5
1st heating2nd heating
3rd heating
Value: 300.0 °C, -0.012 mWValue: -100.0 °C, 0.004 mWValue: 300.0 °C, -0.005 mWValue: -100.0 °C, 0.009 mW
44.14 °C
Value: 300.0 °C, 0.012 mWValue: -100.0 °C, 0.010 mW
43.01 °C
↓ exo
70 80 90 100 110 120 130Time/min
-0.5
-0.4
-0.3
-0.2
-0.1
0.0
0.1
DSC/(mW/mg)
-20
0
20
40
60
80
100
120
Temperature/°C
0 10 20 30 40 50 60 70 80 90Temperature/°C
-0.15
-0.10
-0.05
0.00
0.05
0.10
DSC/(mW/mg)
N=1N=2Table Value
Cp/(J/(g∙K))
0.0 0.5 1.0 1.5 2.0Time/min
0
5
10
15
20
DSC/(mW/mg)
25
30
35
40
Temp. /°C
0
50
100
150
200
250
Integral /(J/g)
integral curves 60 s
30 s
1 s
10 s
10 s
30 s60 s
1 s
↑ exo
Temperature/°C
DSC/mW
DSC/mW
↓ exoDSC/(μV/mg)
Glass Transition: Mid:73.5 °CDelta Cp*:0.321 J/(g*K)Area: -10.16 J/g
Glass Transition*: Mid: 72.6 °CDelta Cp*: 0.333 J/(g*K):
Area: -11.4 J/g
Complex Peak: Area:-1.219 J/gPeak*:73.8 °C
↑ exo
↑ exo
-80 -60 -40 -20 0Temperature/°C
-1.0
-0.5
0.0
0.5
1.0
1.5
DSC/(mW/mg)
-44.8 °C-64.3 °C-69.4 °C
-18.1 °C
-27.1 °C
Area: -0.2 J/gPeak -3.5 °C*:
Area: 46.9 J/g
Area: -41.7 J/g
Area: -3.7 J/gPeak: 52.8 °C
-11.7 °C
-18.3 °C
↓ exo
heating
cooling
20 40 60 80 100Time/min
-0.6
-0.4
-0.2
0.0
0.2
0.4
0.6
0.8
DSC(mW/mg)
20
40
60
80
100
120
140
160
180
Temp./°C
OIT: 4.2 minOIT: 13.1 min OIT: 63.3 min
↓ exo
Dashed: DSC signal under nitrogen Continuous: DSC signal under air Dotted: Temperature signal
100 150 200 250Temperature/ °C
Temperature/ °C
1.0
1.5
2.0
2.5
3.0
DSC /(mW/mg)
DSC /(mW/mg)
DSC /(mW/mg)
DSC/(mW/mg)
121.0 °C252.6 °C
107.3 °C
117.2 °C
136.9 °C
Film B
Film C
246.5 °C127.0 °C
159.1 °C
126.4 °C139.5 °C
↓ exo
Film A
0.9
Measured
Curve 1Curve 2Curve 3
0.8
0.7
0.6
0.5
0.4
0.3
0.2
0.1
0
-0.170 80 90 100 110 120 130
Sum of calculated curves
190 200 210 220 230 240
Temperature/°C
0
1
2
3
4
5Onset*: 216.8 °C
Area: 55.36 J/gPeak: 222.1 °C
Area: 55.98 J/gPeak: 220.0 °C Onset: 216.7 °C
Onset*: 216.8 °C
Area: 55.23 J/gPeak: 221.5 °C
Area:55.96 J/gPeak: 219.9 °COnset: 216.7 °C
↓ exo
Lot 1
Lot 2
170 180 190 200 210 220Temperature/°C
-7
-6
-5
-4
-3
-2
-1
0
Area: -55.34 J/gPeak: 186.8 °C End: 187.1 °C
Area: -55.16 J/gPeak: 188.7 °CEnd: 189.0 °C
↓ exo
Dashed: 2nd heating
Solid Line: 1st heating
Lot 1
Lot 2
123.5 124.0 124.5 125.0 125.5126.0 126.5Time/min
818283848586878889
Temp./°C
-10 -8 -6 -4 -2 0 2 4 6Temperature /°C
-0,40
-0,35
-0,30
-0,25
DSC/mW/mg
Area: -0,2 J/gPeak*: -3,5 °C
↓ exo
Curing Behavior – UV Influence
Influence of Irradiation Time on a UV-Curing System
DPHA polymerizes when exposed to sources of free radicals. It is particularly useful in coatings and inks. Here, the influence of the irradiation time (1s, 10s, 30s and 60s) is demonstrated at a sample temperature of 27°C. With increasing irradiation time, the curing increased, which can be seen in the total enthalpy. The corresponding integral curves reflect the conversion due to UV curing.
The advantage of UV-curing systems is their fast reaction – within a few seconds at low isothermal temperature in the absence of solvents.
Irradiation time dependence of DPHA (dipentaerythritol penta/hexa acrylate) + irg 184 (initiator 0.05%).
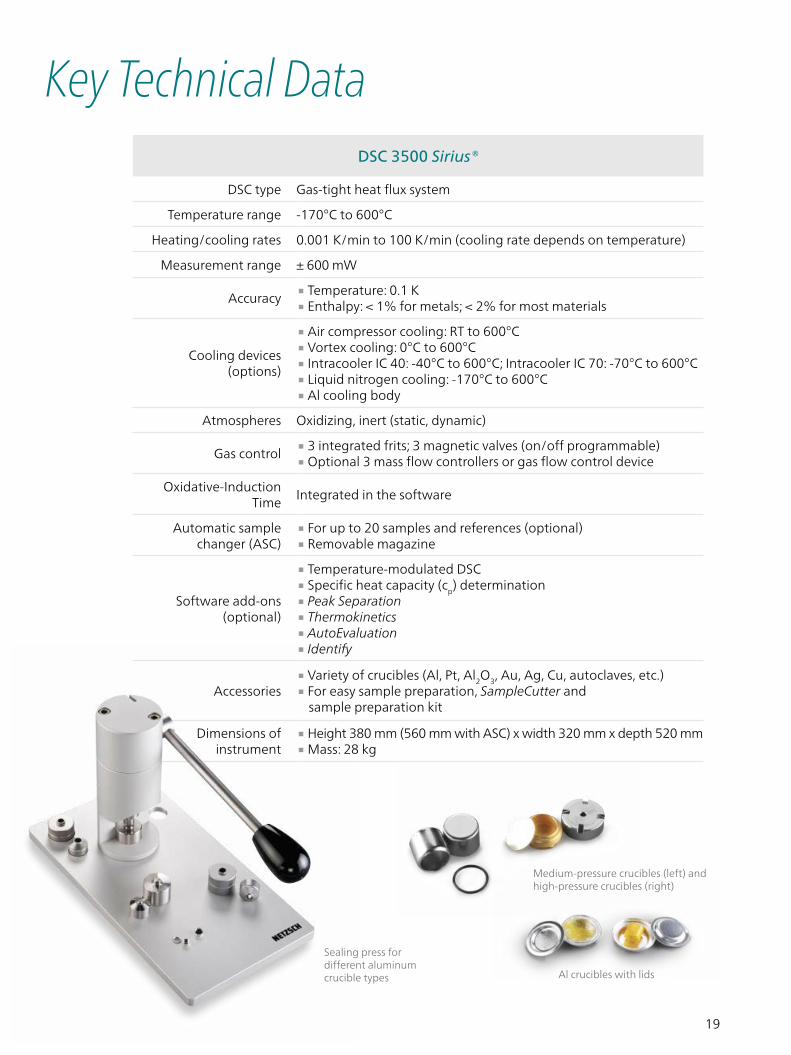
19
Value: -51.60 °C, -0.008 mW
-50-100 0 50 100 150 200
0 50 100 150 200
250 300Temperature/°C
-0.20
-0.15
-0.8
-0.6
-0.4
0.4
-0.2
0.2
-0.0
-0.10
-0.05
0.00
0.05
0.10
0.15
0.20
Value: 282.60 °C, 0.008 mW
↓ exo
-100 -50 0 50 100 150 200 250 300
Temperature/°C
50 100 150 200 250 300 350 400 450 500
Temperature/°C
-1.5
-1.0
-0.5
0.0
0.1
0.2
0.3
0.4
0.5
0.0
0.5
1.0
1.5
1st heating2nd heating
3rd heating
Value: 300.0 °C, -0.012 mWValue: -100.0 °C, 0.004 mWValue: 300.0 °C, -0.005 mWValue: -100.0 °C, 0.009 mW
44.14 °C
Value: 300.0 °C, 0.012 mWValue: -100.0 °C, 0.010 mW
43.01 °C
↓ exo
70 80 90 100 110 120 130Time/min
-0.5
-0.4
-0.3
-0.2
-0.1
0.0
0.1
DSC/(mW/mg)
-20
0
20
40
60
80
100
120
Temperature/°C
0 10 20 30 40 50 60 70 80 90Temperature/°C
-0.15
-0.10
-0.05
0.00
0.05
0.10
DSC/(mW/mg)
N=1N=2Table Value
Cp/(J/(g∙K))
0.0 0.5 1.0 1.5 2.0Time/min
0
5
10
15
20
DSC/(mW/mg)
25
30
35
40
Temp. /°C
0
50
100
150
200
250
Integral /(J/g)
integral curves 60 s
30 s
1 s
10 s
10 s
30 s60 s
1 s
↑ exo
Temperature/°C
DSC/mW
DSC/mW
↓ exoDSC/(μV/mg)
Glass Transition: Mid:73.5 °CDelta Cp*:0.321 J/(g*K)Area: -10.16 J/g
Glass Transition*: Mid: 72.6 °CDelta Cp*: 0.333 J/(g*K):
Area: -11.4 J/g
Complex Peak: Area:-1.219 J/gPeak*:73.8 °C
↑ exo
↑ exo
-80 -60 -40 -20 0Temperature/°C
-1.0
-0.5
0.0
0.5
1.0
1.5
DSC/(mW/mg)
-44.8 °C-64.3 °C-69.4 °C
-18.1 °C
-27.1 °C
Area: -0.2 J/gPeak -3.5 °C*:
Area: 46.9 J/g
Area: -41.7 J/g
Area: -3.7 J/gPeak: 52.8 °C
-11.7 °C
-18.3 °C
↓ exo
heating
cooling
20 40 60 80 100Time/min
-0.6
-0.4
-0.2
0.0
0.2
0.4
0.6
0.8
DSC(mW/mg)
20
40
60
80
100
120
140
160
180
Temp./°C
OIT: 4.2 minOIT: 13.1 min OIT: 63.3 min
↓ exo
Dashed: DSC signal under nitrogen Continuous: DSC signal under air Dotted: Temperature signal
100 150 200 250Temperature/°C
Temperature/°C
1.0
1.5
2.0
2.5
3.0
DSC/(mW/mg)
DSC/(mW/mg)
DSC/(mW/mg)
DS C/(mW/mg)
121.0 °C252.6 °C
107.3 °C
117.2 °C
136.9 °C
Film B
Film C
246.5 °C127.0 °C
159.1 °C
126.4 °C139.5 °C
↓ exo
Film A
0.9
Measured
Curve 1Curve 2Curve 3
0.8
0.7
0.6
0.5
0.4
0.3
0.2
0.1
0
-0.170 80 90 100 110 120 130
Sum of calculated curves
190 200 210 220 230 240
Temperature/°C
0
1
2
3
4
5Onset*: 216.8 °C
Area: 55.36 J/gPeak: 222.1 °C
Area: 55.98 J/gPeak: 220.0 °C Onset: 216.7 °C
Onset*: 216.8 °C
Area: 55.23 J/gPeak: 221.5 °C
Area:55.96 J/gPeak: 219.9 °COnset: 216.7 °C
↓ exo
Lot 1
Lot 2
170 180 190 200 210 220Temperature/°C
-7
-6
-5
-4
-3
-2
-1
0
Area: -55.34 J/gPeak: 186.8 °C End: 187.1 °C
Area: -55.16 J/gPeak: 188.7 °CEnd: 189.0 °C
↓ exo
Dashed: 2nd heating
Solid Line: 1st heating
Lot 1
Lot 2
123.5 124.0 124.5 125.0 125.5126.0 126.5Time/min
818283848586878889
Temp./°C
-10 -8 -6 -4 -2 0 2 4 6Temperature /°C
-0,40
-0,35
-0,30
-0,25
DSC/mW/mg
Area: -0,2 J/gPeak*: -3,5 °C
↓ exo
DSC 3500 Sirius®
DSC type Gas-tight heat flux system
Temperature range -170°C to 600°C
Heating/cooling rates 0.001 K/min to 100 K/min (cooling rate depends on temperature)
Measurement range ± 600 mW
Accuracy ∙Temperature: 0.1 K ∙Enthalpy: < 1% for metals; < 2% for most materials
Cooling devices (options)
∙Air compressor cooling: RT to 600°C ∙Vortex cooling: 0°C to 600°C ∙ Intracooler IC 40: -40°C to 600°C; Intracooler IC 70: -70°C to 600°C ∙Liquid nitrogen cooling: -170°C to 600°C ∙Al cooling body
Atmospheres Oxidizing, inert (static, dynamic)
Gas control ∙3 integrated frits; 3 magnetic valves (on/off programmable) ∙Optional 3 mass flow controllers or gas flow control device
Oxidative-Induction Time
Integrated in the software
Automatic sample changer (ASC)
∙For up to 20 samples and references (optional) ∙Removable magazine
Software add-ons (optional)
∙Temperature-modulated DSC ∙Specific heat capacity (cp) determination ∙Peak Separation ∙Thermokinetics ∙AutoEvaluation ∙ Identify
Accessories ∙Variety of crucibles (Al, Pt, Al2O3, Au, Ag, Cu, autoclaves, etc.) ∙For easy sample preparation, SampleCutter and
sample preparation kit
Dimensions of instrument
∙Height 380 mm (560 mm with ASC) x width 320 mm x depth 520 mm ∙Mass: 28 kg
Key Technical Data
Sealing press for different aluminum crucible types Al crucibles with lids
Medium-pressure crucibles (left) andhigh-pressure crucibles (right)
The NETZSCH Group is a mid-sized, family-owned German company engaging in the manufacture of machinery and instrumentation with worldwide production, sales, and service branches. The three Business Units – Analyzing & Testing, Grinding & Dispersing and Pumps & Systems – provide tailored solutions for highest-level needs. Over 3,300 employees at 210 sales and production centers in 35 countries across the globe guarantee that expert service is never far from our customers.
When it comes to Thermal Analysis, Calorimetry (adiabatic & reaction) and the determination of Thermophysical Properties, NETZSCH has it covered. Our 50 years of applications experience, broad state-of-the-art product line and comprehensive service offerings ensure that our solutions will not only meet your every requirement but also exceed your every expectation.
NETZSCH-Gerätebau GmbHWittelsbacherstraße 42 95100 SelbGermanyTel.: +49 9287 881-0 Fax: +49 9287 881 [email protected] N
GB
· DSC
350
0 Si
rius
® · E
N ·
0616
· N
WS
· Tec
hnic
al s
pec
ifica
tion
s ar
e su
bje
ct to
cha
nge.


