In thermal lens spectroscopy, the heat deposited inthe medium after absorption of the energy from aGaussian laser beam by a sample creates a radiallydependent temperature distribution that, in turn,produces a refractive-index gradient. In most con-densed phases, because of a decrease in density withincreasing temperature, the variation of the refrac-tive index with temperature is negative and the me-dium behaves as a diverging lens. During lensformation, the propagation of the Gaussian beamthrough the sample cell is distorted and expanded.This latter effect is commonly probed by the measure-ment in the far field of the changes in the laser’scenter intensity. The probe beam can be the excita-tion laser itself or another continuous-wave laser.In the first theoretical treatments,1,2 the thermallyinduced refractive index was assumed to be approx-imately parabolic near the beam axis and to behaveas an ideal thin lens. These models, mostly devel-oped for the single-laser apparatus, assume that thelaser beam size remains constant as the laser beampasses through the sample cell. As the photother-mal lens signal cannot be found from the Gaussian
The authors are with the Department of Chemistry and Bio-chemistry, Utah State University, Logan, Utah 84322-0300.
Received 26 February 1996; revised manuscript received 6 Feb-ruary 1997.
beam propagation through the sample cell, Sheldonet al.3 have developed a model that takes into accountthe aberrant nature of the thermal lens. The ther-mal refractive index was approximated as a linearshift, and a diffraction integral was used to solve forthe signal obtained for the single-laser photothermallens. Approximations made in the derivations aresimilar to those of Fresnel or even Fraunhofer dif-fraction and results are valid only for the far-fielddetection plane or pinhole aperture placement. Re-sults obtained from these two models were later an-alyzed,4,5 and the parabolic model was found to beless accurate for a highly absorbing sample. Theparabolic model was corrected to take into accountthe refractive shape of the lens.4 The difference be-tween the beam geometries when the parabolic ap-proximation was used and those obtained withdiffraction is significant, a factor 1 versus 31y2.
The ABCD rule for Gaussian beam propagation hasalso been used to find the radial power distributionfor Gaussian refractive-index perturbations undermode-matched conditions.6,7 The same approachwas used to describe the probe-beam-waist depen-dence on the thermal lens signal8,9 relative to itsposition in the sample for dual-beam pulsed-laser ex-citation. Most recently, the phase-shift method hasbeen used to calculate probe-laser irradiance profilesand photothermal thermal lens signals for nonlinearmultiphoton absorption by use of the z-scan tech-nique.10 Similar calculations were performed bymeans of Fresnel diffraction integrals to find theprobe-laser radial power distribution.11–13 More re-
20 September 1997 y Vol. 36, No. 27 y APPLIED OPTICS 6711
Table 1. Symbols Used in this Paper
Symbol Definition ~Units! Symbol Definition ~Units!
a Absorption coefficient ~m21! r Radius ~m!Cp Heat capacity ~J kg21K21! r Density ~kg m23!d Sample-to-detector distance ~m! S Photothermal lens signal
DT Thermal diffusion coefficient ~W m22! t Time ~s!E Electric field ~W1y2m21! t~r, t! TransmissionE Photothermal enhancement factor tc Characteristic time constant ~s!df Optical phase shift ~rad! T Temperature ~K!f On-axis phase shift ~rad! w Gaussian beam-waist radius ~m!H Integrated irradiance ~Jym2! wp Probe-laser Gaussian beam waist ~m!k Probe-laser wave vector ~m21! YH Heat yieldk Thermal conductivity ~W m21K21! z Spatial coordinate ~m!l Sample path length ~m! z9 Probe focus-to-sample distance ~m!
cently Shen et al.14 used the Fresnel diffraction ap-proach to calculate the photothermal lens signalobtained with the two-laser, mode-mismatched opti-cal apparatus for continuous excitation. As in thework of Sheldon et al.,3 Shen et al. approximated theexponential phase shift in linear terms. However,the latter is the most general of the continuous-excitation-laser results because it can be used to pre-dict the optimum beam conditions for the two-laserapparatus.
All these reports use the same general procedure.First, the complex transmission is determined fromthe temperature change and the resulting refractive-index change. Second, the effect of the passage ofthe Gaussian probe beam through the sample isfound by multiplication by the complex transmissionfunction. Implicit here is the assumption that thesample cell is thin enough that the probe-beam ra-dius does not change significantly as the beam passesthrough the sample. In diffraction, this assumptionis valid when the distance between the sample celland the detection plane is much greater than theoptical path length through the cell. Third, the per-turbed probe beam is progressed to the detectionplane by either a diffraction integral or Gaussianbeam propagation equations.
The purpose of this paper is to illustrate a straight-forward method for determining the effect that aGaussian refractive-index perturbation has on thepropagation of a Gaussian probe-laser beam. Therefractive-index perturbation is cast as a complextransmission element. The electric field of theprobe-laser beam is found first by multiplication bythe complex transmission and then modification ofthe complex beam parameter to account for free-space propagation. The method is simpler than us-ing Fresnel diffraction integrals, although the resultsare almost equivalent. Results obtained with thismethod are equivalent to those obtained by the solu-tion of Fresnel diffraction integrals to within a linearphase-shift term.15 In this paper, a single model isdeveloped that describes photothermal lens signalsproduced by both pulsed and continuous-wave
6712 APPLIED OPTICS y Vol. 36, No. 27 y 20 September 1997
excitation-laser sources. The magnitude and thetime dependence of the thermal lens signal are stud-ied relative to sample cell distance to the detectionplane, and optimum beam geometries are predicted.Enhancement factors obtained under pulsed andcontinuous-wave excitation are also compared. Thegeometry of Twarowski and Kliger16 is used to facil-itate comparison with refraction theory results. Thesymbols used in this paper are given in Table 1.
2. Experimental Section
A 66-MHz 80486 PC with symbolic algebra software~MACSYMA, Symbolics, Inc.! is used to derive the ana-lytical photothermal lens signals. The detailed cal-culation steps were recorded and stored in MACSYMA
batch files to facilitate derivation and model testing.Results from symbolic derivations are written as Clanguage code, which is easily incorporated into thegraphics generation code, also written in C. Simu-lations are calculated with programs written in Clanguage. Each simulation consists of a 200 3 200signal magnitude versus parameter grid and takes;10 s to calculate with the analytical expressions.Surface contour shading uses cosine normal weight-ing for gray-tone generation. The shaded contoursare plotted on a PostScript printer. Copies of theMACSYMA batch files and C language graphics code canbe obtained from the authors.
3. Probe-Laser Diffraction Effects for InstantaneousPulsed Excitation
Photothermal lens signals are calculated by first find-ing the time-dependent temperature change result-ing from instantaneous sample excitation. Next,the radially dependent optical phase shift producedby this temperature change is found. The phaseshift is subsequently used to find the effect on theprobe-laser beam. The temporal impulse responseis subsequently used to determine the photothermallens signals produced from continuous excitation.This is accomplished by the integration of the impulseresponse over the time the continuous-excitation laseris operating. The usual assumptions used to calcu-
late the instantaneous photothermal lens signal areused here.16 In particular, it is assumed that the ex-citation pulse is of short duration relative to the timethat the signal is monitored, that excited-state energytransfer is instantaneous, and that energy transferinstantly produces a density change that is inverselyproportional to the temperature change. The acous-tic wave generated by rapid expansion of the heatedsample is not accounted for with these assumptionsnor is the acoustic-relaxation-limited signal rise time.However, finite excited-state relaxation rates may beaccounted for by convolution of the impulse responsewith the time rate of heat production.
The case of a pulsed-laser-excited sample probedwith a continuous laser is examined first. The ra-dial intensity distribution of a TEM00 Gaussian exci-tation beam can be expressed as
H~r! 52Qpw2 expS22r2
w2 D , (1)
where H~r! ~in joules times inverse square meters! isthe integrated irradiance, Q ~in joules! is the pulseenergy, w ~in meters! is the excitation-beam electric-field radius, and r is the radial distance from thebeam center. The instantaneous heat generated perunit length between r and r 1 dr is
Q~r, t! 5 2pd~t!aH~r!rdr (2)
where a ~in inverse meters! is the exponential absorp-tion coefficient and d~t! is the delta function. Theexpression for the temperature change in the sampleas a function of radius and time can be obtained bythe solution of the heat transfer equation for an in-stantaneous source17:
rCp
ddt
@dT~r, t!# 2 k¹2@dT~r, t!# 5 Q~r, t!, (3)
where r ~in kilograms times inverse cubic meters!, Cp~in joules times inverse kilograms times inverse de-grees Kelvin!, and k ~in joules times inverse meterstimes inverse seconds times inverse degrees Kelvin!are density, specific heat, and thermal conductivity ofthe sample, respectively. Equation ~3! has a solu-tion given by
dT~r, t! 5 *0
t
*0
`
Q~r9, t 2 t9!G~r, r9, t9!dr9 dt9, (4)
where
G~r, r9, t! 51
4pkt9expF2~r2 1 r92!
4DTt9 GI0S rr9
2DTt9D (5)
is the Green’s function for radial symmetric diffusion,DT 5 kyrCp ~in watts times inverse square meters! isthermal diffusivity, and I0 ~ ! is the modified zero-
order Bessel’s function. After the integration is per-formed, the time-dependent temperature change is
dT~r, t! 52aQYH
pw2~t!rCpexpF22r2
w2~t!G , (6)
where YH is the amount of energy converted to heat,w2~t! 5 w2~1 1 2tytc! ~in square meters! is the time-dependent radius of the temperature change, and tc5 w2y4DT is a characteristic thermal time constant ofthe medium.
In pulsed, TEM00 laser excitation, the refractive-index perturbation is radially symmetric and ofGaussian form. Assuming that the excitation-laserand the probe-laser beam waists do not change sig-nificantly through the sample, the time-dependentcomplex transmission t~r, t! is a function of only theradius and the sample path length. The complextransmission is exponentially related to the time- andradial-dependent phase shift df~r, t!. The phaseshift, in turn, is the time-dependent temperaturechange multiplied by the thermo-optical coefficient~dnydT! ~in inverse degrees Kelvin! and the samplepath length l ~in meters!. Thus
where df~r! is the radial-dependent phase shift, i isthe square root of 21, k 5 2pylp ~in inverse meters!is the probe-laser wave vector, and lp ~in meters! isthe probe-laser wavelength.
A schematic of the geometry used to define thetheoretical signal is shown in Fig. 1. The equationthat describes the probe-laser electric field, focused ata distance z9 ~in meters! in front of the sample cell, isthat of a Gaussian beam at distance z9 from the focus.
Without the longitudinal phase terms, the electricfield of a probe laser is
E~r, z9! 5 E0
q~0!
q~z9!expF2ikr2
2q~z9!G . (8)
Fig. 1. Geometry that was used to define the theoretical photo-thermal lens signal. The probe laser enters from the left and isfocused to a minimum spot radius of w0 at a distance z9 before thesample cell. It has a beam-waist radius of w1 at the sample andw2 at the pinhole aperture before the detector. The pinhole ap-erture is a distance d after the sample cell. Probe beams focusedbeyond the sample are indicated by negative z9.
20 September 1997 y Vol. 36, No. 27 y APPLIED OPTICS 6713
The longitudinal or z-axis phase terms do not affectthe probe-beam power and are neglected here infavor of simplicity. q~z9! 5 iz0,p 1 z9, z0,p 5 pw0,p
2ylpis the probe-laser confocal parameter, q~z9! is thecomplex beam parameter at z9 that is normallyfound with the inverse relationship 1yq~z9! 5 1yRp~z9! 2 i2ykwp
2~z9!, where subscript p is used toindicate probe-laser parameters, Rp~z9! is the radiusof curvature of the wave front,18 and wp
2 is the probe-beam radius. The electric field is E~r, z9!t~r, t! afterpassing through and just beyond the sample.
In diffraction theory, we find the electric field in thedetection plane, placed a distance d past the sample,by performing the integrations or Fourier transformsrequired in Fresnel diffraction calculations. For therather complicated form of the phase-shift term pro-duced by the Gaussian temperature change, integra-tion requires some type of simplification. Thissimplification is accomplished by expansion of theexponential transmission in a series, as shown byWeaire et al.6:
t~r, t! 5 exp@idf~r!# 5 (m50
` @if~t!#m
m!expF22mr2
w2~t! G ,
f~t! 5 2k SdndTD 2alQYH
prCpw2~t!
. (9)
With this definition, the negative photothermal lensgenerated in most samples results in a positive on-axis phase shift f. Because the series expansion isa sum over Gaussian terms and because the productof two Gaussians is also a Gaussian, the electric fieldin the detector plane can be found by simple modifi-cation of the complex beam parameter of each Gauss-ian series term by use of the ABCD method forGaussian beam propagation.18 When the electricfield is multiplied by the transmission, the electricfield just past the sample cell is the sum
E~r, z9! 5 E0
q~0!
q~z9! (m50
` @if~t!#m
m!expF2ikr2
2qm~t!G . (10)
The complex beam parameter qm~t! is a function ofboth excitation- and probe-laser beam waists:
1qm~t!
51
Rp~z9!2 i
2kwm
2 ,
1wm
2 51
wp2~z9!
12m
w2~t!, (11)
where Rp~z9! 5 ~z0,p2 1 z92!yz9 and kwp
2~z9!y2 5 ~z0,p2
1 z92!yz0,p are the Gaussian beam parameter defini-tions of the unperturbed probe laser, and the complexbeam parameter for the mth series term is 1yqm~t! 51yq~z9! 2 i@4mykw2~t!#. Because the effect of a lenson the propagation of a Gaussian beam is found from1yq 2 1yf, the Gaussian probe-laser beam apparentlyexperiences a series of complex lenses of focal lengthsf 5 2ikw2~t!y4m. When the ABCD method is used,the complex beam parameter that describes the elec-tric field in the detection plane some distance d past
6714 APPLIED OPTICS y Vol. 36, No. 27 y 20 September 1997
the sample cell is qm~t! 1 d. With this rule appliedto each of the terms in the series, the resulting elec-tric field in the detection plane is
E~r, d! 5 E0
q~0!
q~z9! (m50
` @if~t!#m
m!
3 F qm~t!qm~t! 1 dGexpH 2ikr2
2@qm~t! 1 d#J . (12)
The power of the probe laser is found from the squareof the electric field, F~r, d! } uE~r, d!u2. This resultshows that the electric field in the detection plane isa series of Gaussian beams, each with a differentbeam-waist radius and phase. The first term in theseries describes the unperturbed probe-laser beam.Subsequent terms reflect the corrections due to thephotothermal perturbation. The series will con-verge rapidly for small f~t!. Retaining only the firsttwo terms is probably sufficient for describing mostsmall photothermal lens signals.
The electric-field result shown above is similar tothat obtained by Weaire et al.,6 Bialkowski,8 andKozich et al.10 However, in these studies, only thereal part of the inverse complex beam parameter isretained. Here the complex electric-field amplitudeis retained for each Gaussian beam so that the elec-tric fields may cancel in the superposition. The lin-ear phase-shift term is also neglected. Recall thatthere are actually two parts to the longitudinal phaseshift, a linear term that depends on only the z-axisdistance and a tangent term that depends on thez-axis distance and also on the confocal distance z0.18
Previous derivations6,8,10 included both longitudinalphase-shift terms, in keeping with the Gaussianbeam propagation solution to Maxwell’s equations.With the tangent phase term, the real part of thepre-exponential term, 5$@1 1 dyqm~t!#21%, is used.
The electric-field result is also nearly identical tothat obtained with a Fresnel diffraction integral.11,13
Again, the main difference is the linear longitudinalphase term. In fact, our approach does not explicitlyaccount for linear longitudinal phase shift. Theelectric field calculated by this method can beamended to include the longitudinal phase shift bymultiplication by exp@2i~z9 1 d!# if the phase of theelectric field is important, e.g., for calculating photo-thermal interferometry signals. The longitudinalphase-shift term cancels in the probe power calcula-tion used below.
Although exact, this result does not lend itself toeasy interpretation. In addition to the dependenceon the probe focus z9 and detection plane d positionsand the time-dependent photothermal perturbationstrength f~t!, the diffraction result is a function ofthe radial offset in the detection plane r andexcitation-laser and probe-laser beam-waist radiiw~t! and w0,p. There is no simple way to analyzethese data. We calculate the probe-laser power inthe detection plane by first performing the sum overthe electric field component and then by taking thecomplex square of the field. A discussion of the
probe-laser beam profile changes is found in Ref. 13.The discussions below are restricted to the resultsobtained with a pinhole aperture to monitor thethermal lens signal.
4. Beam-Waist and Position Effects
Insight into how experimental geometry affects themaximum and time-dependent signals can be gainedthrough an approximate analytical expression for thediffractive photothermal lens signal.3 The first twoterms in the series, e.g., m 5 0 and m 5 1, may beused to approximate the probe-laser power passingthrough the pinhole aperture in the detection plane.This is equivalent to approximating the exponentialphase shift by exp~idf! ' 1 1 idf.3,14 The higher-order expansion terms are necessary for accurate sig-nal prediction only in highly absorbing samples orwhen high-power excitation sources are used. Shel-don et al.3 argue that because the induced phase shiftin most photothermal lens experiments is much lessthan 1, higher-order series approximations are notnecessary. Using this approximation allows an an-alytical expression for the probe-laser power trans-mitted through the pinhole aperture. When onlythe first two terms in the series are used and termsup to only the first order in the photothermal phaseshift are retained, the relative time-dependent probe-laser power is
where 1yfpulsed~0! 5 4f~0!ykw2 is the definition forthe initial pulsed-laser photothermal lens focallength predicted from refractive optics theory:
fpulsed1~0! 5 Sdn
dTD 8alYHQpw4rCp
. (16)
This approximate result is similar to that predictedwith refraction optics under the same conditions, 2z9yfpulsed~0!~1 1 2tytc!
2. In fact, when the probe-laserbeam waist w0,p is much smaller than that of theexcitation source, the diffraction and refraction meth-ods yield equivalent results. This may be expectedbecause the probe laser passes through the indexperturbation near the axis when w0,p ,, w and therefractive lens is based on the on-axis, i.e., r 5 0,curvature of the perturbation.1 For finite probe-beam radii, the maximum t 5 0 signal will be a factorof w2y~w2 1 2w0,p
2! smaller than that predicted byrefraction. These results are in keeping with ourearlier diffraction-optics-based signal calculations.8
The probe-laser beam focus position resulting inoptimum signal can be obtained by the maximizationof the initial photothermal lens signal with respect toz9. The resulting optimum focus position is z9opt 56z0,p~1 1 w2y2w0,p
2!. The optimum initial photo-thermal lens signal can be found when this result issubstituted into the signal equation and the terms
where F~t! ~in watts! is the probe-laser power passingthrough a pinhole aperture at r 5 0.
5. Far-Field Detection Plane
If the detector–pinhole plane is in the far field, then
limd3`
F~t!yF~`! < 1 2 f~t!
38kw2~t!z9
k2w4~t! 1 8kw2~t!z0,p 1 16~z0,p2 1 z92!
. (14)
The photothermal lens signal is calculated from thepower ratio. A simple expression for the time-dependent signal is found with the assumption thatfz9 ,, z0,p and uz9u ,, uz0,pu in the denominator of thesignal expression. With these assumptions, thephotothermal lens signal16 is
Spulsed~t! 5F~t! 2 F~`!
F~t!
<2z9
fpulsed ~0!
1~1 1 2w0,p
2yw2 1 2tytc!2 , (15)
that are linear in f are retained:
Spulsed,opt~t! 5 6SdndTD 8alQYH
lprCp
3~2w0,p
2 1 w2!
@2w0,p2 1 w2~1 1 2tytc!#
2 1 ~2w0,p2 1 w2!2 ,
(17)and the zero-time ~maximum! signal is
Spulsed,opt~0! 5 6SdndTD 4alQYH
lprCp~2w0,p2 1 w2!
. (18)
This result explicitly shows how the probe-laserbeam-waist radius affects the photothermal lens sig-nal. The signal is apparently maximized as both theexcitation and the probe-laser beams are more tightlyfocused. Also of interest is that the maximum opti-mum signal is predicted to be inversely proportionalto w2, not w4 as in the refraction result. The maxi-mum is also inversely proportional to lp. Thustightly focused short-wavelength probe lasers shouldbe used with a far-field detection-plane apparatus.The refraction optics approach predicts that decreas-ing the excitation-laser beam waist always increasesthe signal. The results obtained above show that
20 September 1997 y Vol. 36, No. 27 y APPLIED OPTICS 6715
this is true only to a point. If the excitation-laserbeam waist is smaller than that of the probe, then nofurther signal improvement will be obtained.
6. Near-field detection plane
A detector-plane position is found by maximization ofapproximation ~13! with respect to d by use of differ-ential methods. This results in an optimumdetection-plane position of dopt 5 kw2~z0,p
2 1 z92!y@4z0,p
2 1 kw2~z0,p 2 z9! 1 4z92#. Substitution of doptinto the initial photothermal equation, followed by z9optimization, yields z9 5 0. The optimum photother-mal lens signal obtained for this geometry isand the maximum zero-time signal is
This is in contrast to the far-field signal, which ismaximized when both the excitation-laser and theprobe-laser beam waists are minimized.
7. Model Calculations and Experimental Optimization
Optimum geometries obtained with differentialmethods must be checked to ensure that the maximaare indeed found. The signal can also change dra-matically with small errors in the optical design if theoptimum is sought. In either case, it is important toexamine the signal as a function of the geometricparameters in order to gain insight into the optimumapparatus geometry. It is also difficult to comparesignal magnitudes of the far- and the near-field de-
Spulsed,opt~t! 5 SdndTD 8alQYH
lprCp
w0,p2
w2
~2w0,p2 1 w2!
~1 1 2tytc!2~2w0,p
4 1 2w2w0,p2 1 w4! 1 2~2tytc 1 1!w2w0,p
2 1 2w0,p4 , (19)
Spulsed,opt~0! 5 SdndTD 8alQYH
lprCp
w0,p2
w2
1~2w0,p
2 1 w2!. (20)
Although similar to that obtained for the far-fielddetection plane, the near-field signal is optimized forw ,, w0,p, i.e., for small excitation-beam-waist radi-uses. This trend was previously deduced from nu-merical simulations based on the Fresnel diffrationintegral approach.13 However, it is difficult to findoptimum geometries with a numerical simulation ap-proach. The results obtained here explicitly showthe conditions for optimization and give the resultingtime-dependent signal. For a small excitation-laserbeam radius,
limw30
Spulsed,opt~0! 5 SdndTD 4alQYH
lprCpw2 . (21)
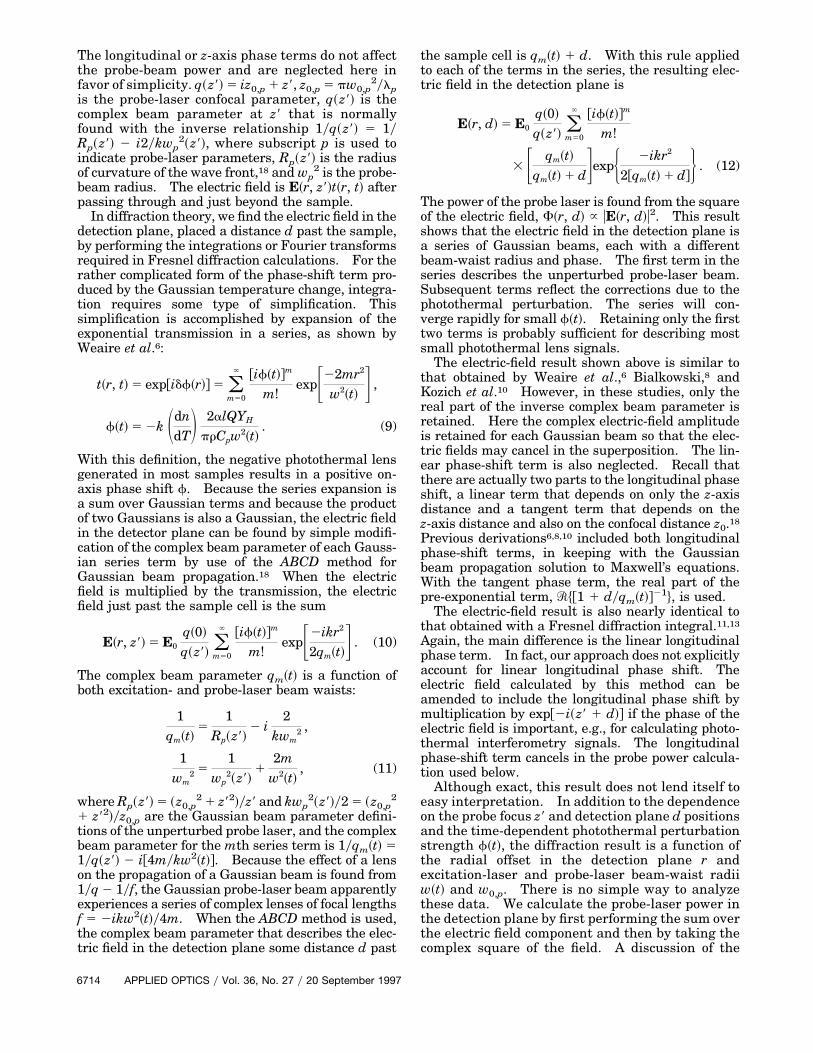
Fig. 2. Pulsed-laser-excited photothermal lens signal predictedfrom diffraction theory as a function of the probe-laser beam ge-ometry. The excitation-laser beam waist was 20 mm in the sam-ple. The minimum 632.8-nm probe-laser beam radius was 100mm. The photothermal perturbation was small, and the signalwas defined in the usual fashion.
6716 APPLIED OPTICS y Vol. 36, No. 27 y 20 September 1997
tection planes from the analytical equations alonebecause the ratio of the respective optimum theoret-ical signals is proportional to a ratio of excitation- andprobe-beam radii, SnearySfar 5 2w0,p
2yw2. Eitherdetection geometry can be optimized relative to theother. Of primary concern are the effects of the rel-ative distances of the probe-laser focus, the distanceto the detection plane, and the relative probe-laserbeam-waist radii.
First, photothermal lens signals calculated for anexcitation-beam waist greater than approximatelyfive probe-beam waists are identical to those pre-dicted by the refraction equation.16 Only when theprobe-laser beam waist becomes of the order of, orgreater than, the pump waist does diffraction theoryneed to be used. Shown in Fig. 2 are results of acalculation for the relative photothermal lens signalfor such a case. In this plot the pulsed-laserexcitation-beam radius is w 5 20 mm and a probe-laser beam waist is w0,p 5 100 mm. These beam-waist radii will favor near-field detection. Theprobe-laser wavelength is 632.8 nm and the confocaldistance is z0,p 5 5 cm. A photothermal phase shiftof f~t! 5 1025 is used because most samples havenegative thermo-optical coefficients. For the plotsshown here, the series was summed up to the twen-tieth power term. This is not usually necessary be-cause convergence typically occurs with two to threeterms. The plot is oriented with the detection-planedistance increasing toward the viewer. The probe-laser focus position varies across the surface. Thed 5 0 point was not plotted. The theoretical signalis found to be zero at this point, independent of the z9distance. In addition, near-field points with d # wpare of questionable value because of the small-angleapproximation implicit in these results.
The signal behavior predicted by this example cal-culation is clearly different from that predicted by therefractive lens theory. In refraction theory, the sig-nal levels off with increasing detection-plane dis-
tance. In contrast, the signal calculated with theequations derived here decreases with detection-plane distance. With the detection plane near thesample cell, the signal is initially positive for negativez9, indicating a decrease in probe-laser power withthe formation of the photothermal lens. This is onlybecause the focus position of the probe beam is be-yond the detection plane. In fact, the same behaviorcan be seen in Fig. 2 for the refractive lens theory.For detection-plane distances far from the samplecell, the signal exhibits a sigmoidal dependence onprobe-laser beam focus position. This is in contrastto the refraction theory in which the signal is approx-imately proportional to z at large d. The sigmoidaldependence is similar to that observed by Berthoud etal.,19 although they used a chopped excitation laser.However, the maximum calculated diffraction signaloccurs at z9 ' z0, not ;=3z0 for this set of calculationparameters.
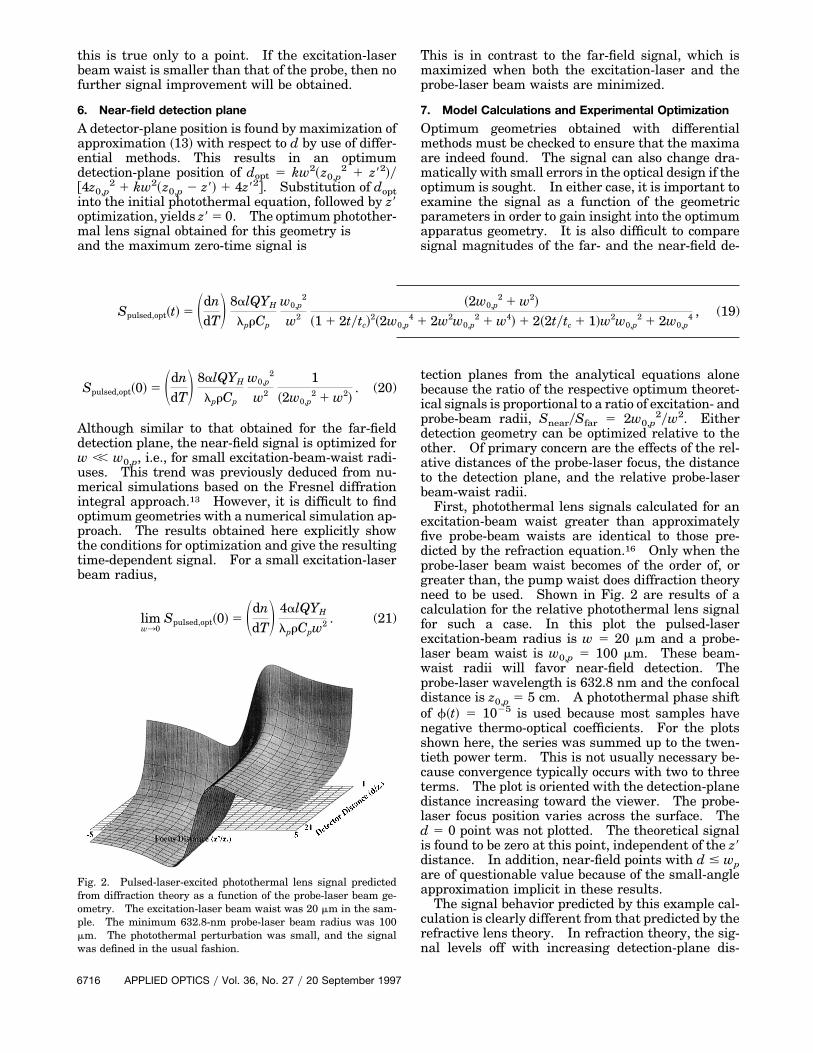
Figures 3~a! and 3~b! illustrate the effect of therelative probe-laser beam waist on the theoretical
Fig. 3. ~a! Far-field diffraction theory predictions for the pulsed-laser-excited photothermal lens signal as a function of the relativeprobe-laser beam-waist radius and focus position. The detectorplane was at d 5 10 m, the excitation beam radius was 100 mm inthe sample, and the perturbation was small ~1025!. ~b! The con-ditions are the same as in ~a!. This view is given to allow inspec-tion of the predicted surface. The line on the right-hand side isequivalent to that predicted from refractive optics.
pulsed-laser-excited photothermal lens signal. Inthis case the detection plane is fixed at a distance of10 m, i.e., far field, and the probe-laser focus positionis in front of the sample. The relative minimumprobe-laser beam-waist radius varies logarithmicallyfrom a factor of 0.1–10 of that of the excitation beam.The excitation-beam-waist radius is 100 mm, theprobe-laser wavelength is 632.8 nm, and the phaseshift is 1025. The figures span a range from thatadequately predicted by refraction theory to a rangewithin which diffraction must be used. It is inter-esting to note that the diffraction result reproducedthe trends predicted from refractive optics in the ap-propriate region. A maximum in signal strength ap-pears for probe-beam-waist radii slightly less thanthat of the excitation source. Whether or not thisindicates a trend can be addressed only by examina-tion of the effects of detection-plane position. Fig-ures 3~a! and 3~b! also show that there is no singleprobe-laser beam focus position that optimizes thesignal. Apparently there is no best z9yz0 for pulsed-laser-excited photothermal lens signals predicted bydiffraction.
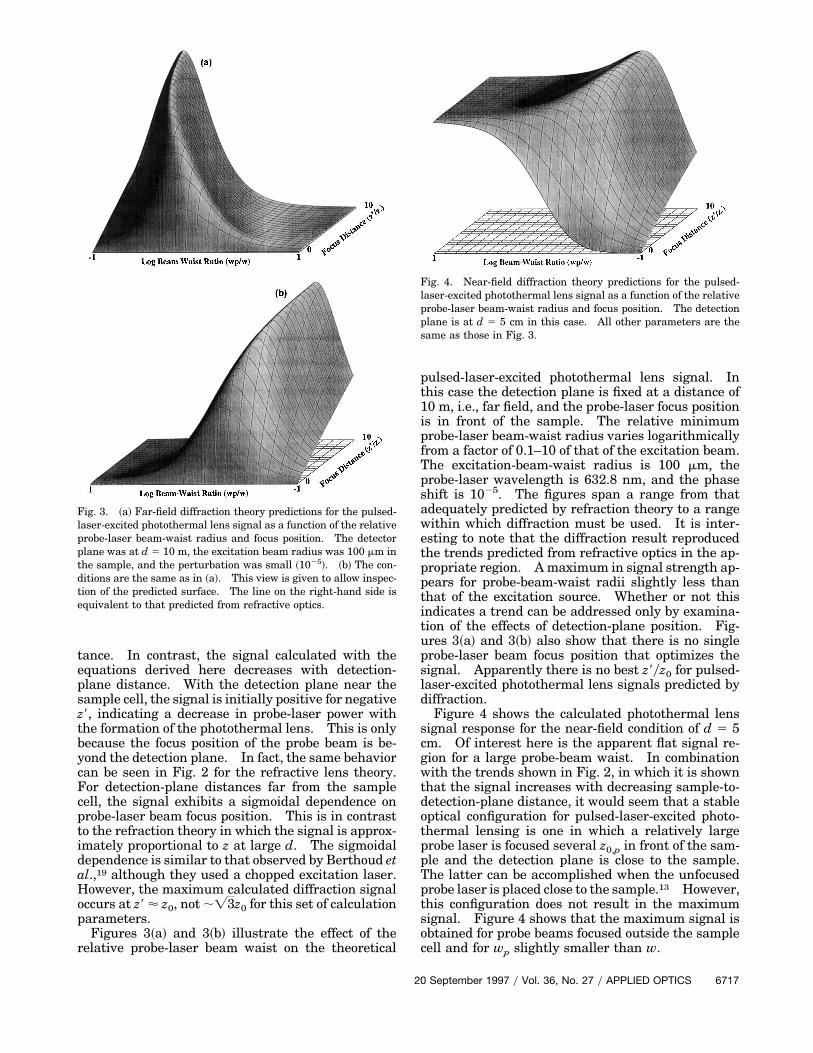
Figure 4 shows the calculated photothermal lenssignal response for the near-field condition of d 5 5cm. Of interest here is the apparent flat signal re-gion for a large probe-beam waist. In combinationwith the trends shown in Fig. 2, in which it is shownthat the signal increases with decreasing sample-to-detection-plane distance, it would seem that a stableoptical configuration for pulsed-laser-excited photo-thermal lensing is one in which a relatively largeprobe laser is focused several z0,p in front of the sam-ple and the detection plane is close to the sample.The latter can be accomplished when the unfocusedprobe laser is placed close to the sample.13 However,this configuration does not result in the maximumsignal. Figure 4 shows that the maximum signal isobtained for probe beams focused outside the samplecell and for wp slightly smaller than w.
Fig. 4. Near-field diffraction theory predictions for the pulsed-laser-excited photothermal lens signal as a function of the relativeprobe-laser beam-waist radius and focus position. The detectionplane is at d 5 5 cm in this case. All other parameters are thesame as those in Fig. 3.
20 September 1997 y Vol. 36, No. 27 y APPLIED OPTICS 6717
8. Probe-Laser Diffraction Effects for ContinuousExcitation
The time integral of the Green’s function result for apulsed Gaussian source yields the temperaturechange produced for continuous-laser excitationwhen the term d~t!H~t! is replaced with irradianceE~t!. Because the photothermal phase shift is pro-portional to temperature, the complex transmissionfor continuous excitation can be obtained by timeintegration of the phase-shift term in Eqs. ~9!:
t~r, t! 5 expFi*0
t
df~r, t9!dt9G5 (
m50
` im
m! H *0
t
f~t9!expF22r2
w2~t9!Gdt9Jm
. (22)
The probe-laser beam electric field may be found inthe same fashion as in the pulsed-excitation case.However, terms with m $ 2 are difficult to evaluate.Again, the linear phase-shift approximation exp~idf!' 1 1 idf is used to simplify the results. Whenterms up to only first order in the photothermal phaseshift are retained, the electric field at the detectorplane is
E~r, d! < E0
q~0!
q~z9 1 d!
1 E0
q~0!
q~z9! *0
t
if~t9! F q1~t9!q1~t9! 1 dG
3 exp$2ikr22@q1~t9! 1 d#dt9%. (23)
For the pinhole detection scheme used in photother-mal lens spectroscopy, the integral is tractable be-cause the radius is zero and thus the exponentialterm is unity. With a little algebra, the integralscan be rewritten in terms of the integration variableT 5 1 1 2tytc:
E~0, d! < E0
q~0!
q~z9 1 d!
1 E0
q~0!
q~z9!
tc
2if~0! *
1
112tytc
3 T21 q~z9!T 2 i4ykw2
@q~z9! 1 d#T 2 i4ykw2 dT. (24)
The probe-laser power ratio is formulated before theintegration over time is performed:
F~t!F~0!
2 1 <tcf
2 *1
112tytc Hiq~z9 1 d!
q~z9!
3 T21 q~z9!T 2 i4ykw2
@q~z9! 1 d#T 2 i4ykw2 1 c.c.J dT,
(25)
6718 APPLIED OPTICS y Vol. 36, No. 27 y 20 September 1997
where c.c. is the complex conjugate of the first term.The probe-laser power ratio for continuous excitationis
F~t!F~0!
< 1 1 tcf tan21Hkw2@z0,p2 1 ~z9 1 d!2# 1 4d2z0,p
4d~z0,p2 1 z92 1 dz9! J
2 tcf tan21
3 Hkw2~1 1 2tytc!@z0,p2 1 ~z9 1 d!2# 1 4d2z0,p
4d~z0,p2 1 z92 1 dz! J .
(26)
Sheldon et al.3 calculated only the far-field result.The above result gives the relative power change forany set of experimental parameters. In continuous-laser-excited photothermal lens spectrometry, themaximum signal is reached for a long irradiationtime. Taking the limit as time approaches infinityand calculating the signal in the usual fashion resultin the signal expression
Scw~`! 5F~0! 2 F~`!
F~`!
<1
1 2 tcf tan21H 4d~z0,p2 1 z92 1 dz9!
kw2@z0,p2 1 ~z9 1 d!2# 1 4d2z0,p
J2 1. (27)
The signal magnitude is a function of the tcf product.This product can be represented in several forms:
2tcf 5w2rCp
4kkSdn
dTD 2alF0YH
prCpw2
5 SdndTD alF0YH
lpk
5l
lp
z0
fcw~`!, (28)
where fcw~`! is the focal length of the thermal lens atinfinite time, produced by continuous-laser excitationand calculated in the usual fashion, i.e., from thesecond derivative of radial refractive-index changedistribution with respect to r. The last expressionshows the relationship to the inverse focal lengthcalculated from refractive optics theory. This con-nection may be used to make adjustments to the re-sult, for example, in the case in which the effectivesample path length is limited by the beam divergenceof the excitation laser.
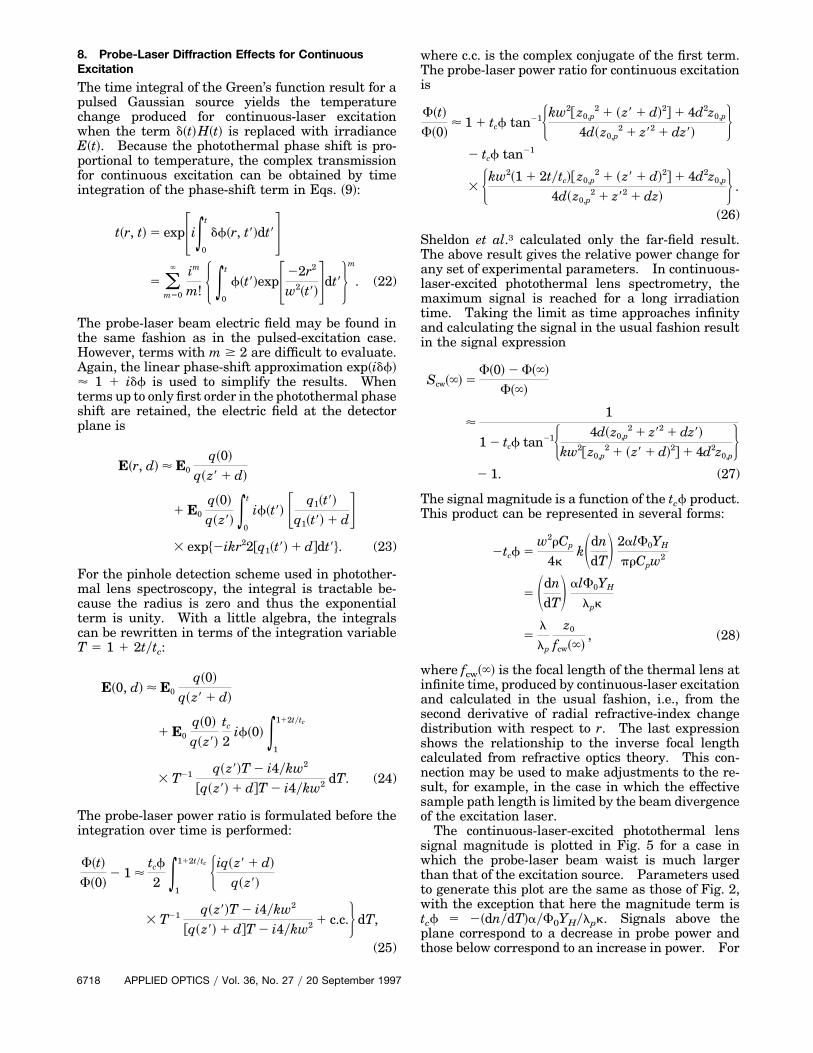
The continuous-laser-excited photothermal lenssignal magnitude is plotted in Fig. 5 for a case inwhich the probe-laser beam waist is much largerthan that of the excitation source. Parameters usedto generate this plot are the same as those of Fig. 2,with the exception that here the magnitude term istcf 5 2~dnydT!ayF0YHylpk. Signals above theplane correspond to a decrease in probe power andthose below correspond to an increase in power. For
detector-plane positions near the sample, only posi-tive signals result. This is because the negative fo-cal length of the thermal lens causes blooming of theprobe beam. As the detector plane is moved awayfrom the sample, the signal can be positive or nega-tive, depending on whether the probe laser was fo-cused in front of or beyond the sample. Within therange of parameters used in this model calculation, amaximum signal occurs for near-field conditions, e.g.,d 5 z0,p and z9 5 65z0,p. When this plot is comparedwith that for pulsed-laser excitation, it is apparentthat the signal varies more slowly with z9 in the farfield. In fact, the behavior is similar to that predictedby refraction theory for probe focus positions within6z0,p. The reason for this may be that thecontinuous-laser-excited photothermal perturbation isbroader than the initial perturbation generated with apulsed source. One final feature of this plot thatshould be noted is the apparent lack of a signal max-imum with respect to z9 position. This is confirmed byexamination of the differential with respect to z9. Ap-parently the continuous-laser-excited photothermallens signal is optimized for large probe-beam focuspositions, but there is no one best probe-laser focusposition.
The relative power resulting from probe-beam dif-fraction may also be compared with the previousstudies of diffraction effects in two-laser, continuous-excitation photothermal lens spectroscopy. To com-pare this with previous results, the detection plane istaken to be far from the sample cell. For this geom-etry the resulting power is
limd3`
F~t!F~0!
< 1 1 tcf tan21Skw2 1 4z0,p
4z9 D2 tcf tan21Fkw2~1 1 2tytc! 1 4z0,p
4z9 G . (29)
This result also leads to a compact expression for themaximum probe-laser power change that would occur
Fig. 5. Continuous-laser-excited photothermal lens signal pre-dicted from diffraction theory. The signal magnitude is definedby @F~`! 2 F~0!#yF~0!. The excitation-laser beam waist is 20 mmand the 632.8-nm laser beam waist is 100 mm. The signal isapparently maximum at small detection-plane distances.
for infinitely long excitation-laser irradiation times.In this case,
F~`!
F~0!2 1 < 2tc f tan21 F 4z9
k~w2 1 2w0,p2!G . (30)
It is interesting that the two-laser apparatus appearsto be linear in absorbed energy tcf when the photo-thermal lens signal is defined by @F~`! 2 F~0!#yF~0!.This expression also shows the signal dependence onthe excitation-laser and probe-laser beam-waist ra-dii. Decreasing either of these will enhance the pho-tothermal lens signal detected in far field for a givenz9, with the caveat that decreasing the excitation-laser beam waist may decrease the effective pathlength through the sample.
9. Diffraction Effects for a Single-Laser PhotothermalLens
Diffraction results for a single-laser photothermal ap-paratus can be found from the continuous-excitationtwo-laser case by simply equating excitation-laserand probe-laser beam parameters. Sheldon et al.3introduced a different way to define the continuous-laser-excited photothermal lens signal that yields amore compact result for diffraction theory. They de-fined the time-dependent signal as a ratio of thepower change to that which occurs at infinite time.With this definition, the time-dependent photother-mal lens signal obtained in the far field is
Scw~t! 5F~t! 2 F~`!
F~`!
5
tcf tan21F 4z9
kw2~1 1 2tytc! 1 4z0G
1 2 tcf tan21S 4z9
kw2 1 4z0D . (31)
z0 is used here because there is no distinction betweenthe excitation and the probe lasers in the single-laserphotothermal lens apparatus. For the mode-matchedconditions of a single-laser experiment, w and z0 arerelated. By first substituting w0
2~1 1 z92yz02! for w2,
where w0 is the minimum beam-waist radius of theGaussian excitation source, then using the definitionfor z0 5 kw0
2y2, we find that the far-field signal for thesingle-laser apparatus is
Scw~t! 5
tcf tan21H 2z9yz0
~z9yz0!2 1 3 1 2@~z9yz0!
2 1 1#tytcJ
1 2 tcf tan21F 2z9yz0
~z9yz0!2 1 3G
.
(32)
With this signal definition, the maximum powerchange is
Scw~0! 51
1 2 tcf tan21F 2z9yz0
~z9yz0!2 1 3G
2 1. (33)
20 September 1997 y Vol. 36, No. 27 y APPLIED OPTICS 6719
It is straightforward to show by derivative methodsthat the maximum signal will occur when z9 56=3z0.
10. Effect of Diffraction on the Thermal LensEnhancement Factor
The photothermal lens enhancement factor intro-duced by Dovichi and Harris20 is a figure of merit thatmay be used to gauge photothermal spectroscopy toconventional absorption spectrophotometry. It isthe ratio of the photothermal lens signal to thechange in power observed by use of absorption spec-trophotometry for small absorbance samples. Theenhancement factor is equal to the signal-to-noiseratio improvement ~or degradation! obtained withphotothermal lens spectroscopy, assuming that bothspectroscopies are limited by equivalent noisesources. For small optical absorbance, the exponen-tial power dependence F 5 F0 exp~2al !, where F0 isthe power at the sample and F is the transmittedpower, may be approximated by a Taylor series.With the first two series terms retained, F . F0~1 2al ! and the power ratio is ~F0 2 F!yF0 . al. Thisabsorption spectrophotometry signal is similar inform to that defining the photothermal lens spectros-copy signal, i.e., a relative power change. The pho-tothermal lens enhancement factor is thus equal tothe photothermal lens signal divided by the al prod-uct.
The pulsed-laser-excited diffraction results can beused to determine the theoretical photothermal lensenhancement factor for a variety of excitation-laserand probe-laser focusing geometries. The enhance-ment based on the far-field result can be comparedwith that obtained with the refraction-based theory,as the enhancement is usually calculated for large din this case. For example, optimizing with respect toprobe-laser focus position z9 5 6z0,p~1 1 w2y2w0,p
2!gives an optimum enhancement factor of
Epulsed,opt 5 USdndTDU 4QYH
lprCp~2w0,p2 1 w2!
. (34)
The enhancement is a function of the minimumbeam-waist radius of both lasers. However, the en-hancement factor is inversely proportional to theprobe-laser wavelength.
If the optics of the apparatus are restrained to haveexcitation-laser and probe-laser beam waists equal atthe focus, i.e., mode matched, then the enhancementfound from approximation ~14! is
Epulsed < USdndTDU 31y2QYH
lw2rCp. (35)
This result can be directly compared with the theo-retical enhancement obtained with refraction opticsfor mode-matched beams: Both are inversely pro-portional to the excitation-laser wavelength. Thediffraction result shown above is a factor of 1y3 lessthan that previously reported, which was obtainedwith a refractive optics approach.21
6720 APPLIED OPTICS y Vol. 36, No. 27 y 20 September 1997
The optimum near-field detector-plane pulsed-laser enhancement is readily found:
Epulsed,opt 5 USdndTDU 8QYH
lprCp
w0,p2
w2
1~2w0,p
2 1 w2!. (36)
As with the mode-matched geometry result, the en-hancement increases with decreasing excitation-beam-waist radius.
When the two-laser continuous-excitation signalfor the detector plane placed in the far-field is definedas in approximation ~29! and the optical phase-shiftterm is substituted, the maximum signal found forlong times is
Scw~`! 5 SdndTD alF0YH
lpktan21F 4z9
k~w2 1 2w0,p2G . (37)
As implied by the results illustrated in Fig. 5, thissignal does not exhibit an optimum z9. A maximumsignal occurs when the argument of the arctangentfunction is infinite. Assuming that z9 .. k~w2 12w0,p
2!, the arctangent function is ;py2 and the pho-tothermal lens enhancement factor is
Ecw~`! 5 USdndTDU pF0YH
2lpk. (38)
The implication here is that the excitation laser isfocused into the sample in order to obtain a negligiblysmall beam radius and that z9 .. z0,p.
The enhancement for single-laser excitation is eas-ier to predict since the beam geometry for optimumsignal is fixed. The optimum single-laser photother-mal lens signal shown in Section 9 for far-field detec-tion is
Scw,max 5F~0! 2 f~`!
f~`!5
p
6tcf
1 2p
6tcf
. (39)
For small thermal perturbations, the term ptcfy6 ismuch less than 1 and can be neglected in the denom-inator. The continuous, single-laser photothermallens enhancement factor Ecw is
Ecw 5
p
6tcf
al5 USdn
dTDU pF0YH
6lk, (40)
which is a factor of py6 ' 0.523 of the enhancementfactor obtained from refractive optics theory. Beforethe development of the diffraction theory, experimen-tal determination of the enhancement factor fell shortof that predicted by refraction. The diffraction the-ory result explains why this was observed.5
11. Summary
In summary, a convenient method for determining dif-fraction effects in photothermal lens spectroscopy hasbeen outlined in this paper. Using the ABCD method
for propagation of Gaussian beams resulting from theaberrant photothermal lens results in signal equationsthat are equivalent to those obtained with the morecomplicated diffraction approach. These results areexplored in terms of how they affect the design of aphotothermal lens apparatus for a number of differentexperiment designs. The method can be used to pre-dict the optimum optical geometries for both pulsed-laser and continuous-excitation-laser experiments.
This research was supported in part by the U.S. Na-tional Institute of Health ~P41RR06030!. A. Chartierthanks the Laboratoire des Sciences Analytiques, Unitede Recherche Associee au Centre National de la Recher-che Scientifique 435. Villeurbanne, France, for grant-ing a sabbatical.
References1. J. P. Gordon, R. C. Leite, R. S. Moore, S. P. Porto, and J. R.
Whinnery, “Long-transient effects in lasers with inserted liq-uid samples,” J. Appl. Phys. 36, 3–8 ~1965!.
2. C. Hu and J. R. Whinnery, “New thermo-optical method and acomparison with other methods,” Appl. Opt. 12, 72–79 ~1973!.
3. S. J. Sheldon, L. V. Knight, and J. M. Thorne, “Laser-inducedthermal lens effect: a new theoretical model,” Appl. Opt. 21,1663–1669 ~1982!.
4. C. A. Carter and J. M. Harris, “Comparison of models describ-ing the thermal lens effect,” Appl. Opt. 23, 476–481 ~1984!.
5. T. Higashi, T. Imasaka, and N. Ishibashi, “Thermal lens spec-trophotometry with argon laser excitation source for nitrogendioxide determination,” Anal. Chem. 55, 1907–1910 ~1983!.
6. D. Weaire, B. S. Wherrett, D. A. B. Miller, and S. D. Smith,“Effect of low power nonlinear refraction on laser-beam prop-agation in InSb,” Opt. Lett. 4, 331–333 ~1979!.
7. M. Sheik-Bahae, A. A. Said, and E. W. Van Stryland, “High-sensitivity, single-beam n2 measurements,” Opt. Lett. 14, 955–957 ~1989!.
8. S. E. Bialkowski, “Photothermal lens aberration effects in twolaser thermal lens spectrophotometry,” Appl. Opt. 24, 2792–2796 ~1985!.
9. J. Castillo, V. P. Kozich, and A. Marcano, “Thermal lensingresulting from one- and two-photon absorption studied witha two-color time-resolved Z scan,” Opt. Lett. 19, 171–173~1994!.
10. V. P. Kozich, A. Marcano, F. E. Hernandez, and J. A. Castillo,“Dual-beam time-resolved Z-scan in liquids to study heatingdue to linear and nonlinear light absorption,” Appl. Spectrosc.48, 1506–1512 ~1994!.
11. J. Slaby, “Calculation of probe beam diffraction at laser in-duced thermal lens,” Opt. Commun. 60, 133–138 ~1986!.
12. J. Slaby, “Background illumination filtering in thermal lensspectroscopy,” Anal. Chem. 61, 2496–2499 ~1989!.
13. J. F. Power, “Pulsed mode thermal lens effect detection in thenear field via thermally induced probe beam spatial phasemodulation: a theory,” Appl. Opt. 29, 52–62 ~1990!.
14. J. Shen, R. D. Lowe, and R. D. Snook, “A model for CW laserinduced mode-mismatched dual beam thermal lens spectrom-etry,” Chem. Phys. 165, 385–396 ~1992!; J. Shen, A. J. Soroka,and R. D. Snook, “A model for cw laser induced mode-mismatched dual-beam thermal lens spectrometry based onprobe beam image detection,” J. Appl. Phys. 78, 700–708~1995!.
15. S. E. Bialkowski, Photothermal Spectroscopy Methods forChemical Analysis ~Wiley, New York, 1996!, Chap. 4.
16. A. J. Twarowski and D. S. Kliger, “Multiphoton absorptionspectra using thermal blooming. I. Theory,” Chem. Phys.20, 253–258 ~1977!.
17. H. S. Carlaw and J. C. Jaeger, Conduction of Heat in Solids,2nd ed. ~Clarendon, Oxford, 1959!.
18. A. Yariv, Introduction to Optical Electronics, 3rd ed. ~Holt,Rinehart & Winston, New York, 1985!.
19. T. Berthoud, N. Delorme and P. Mauchien, “Beam geometryoptimization in dual-beam thermal lensing spectrometry,”Anal. Chem. 57, 1216–1219 ~1985!.
20. N. J. Dovichi and J. M. Harris, “Laser induced thermal lenseffect for calorimetric trace analysis,” Anal. Chem. 51, 728~1979!.
21. K. Mori, T. Imasaka, and N. Ishibashi, “Thermal lens spectro-photometry based on pulsed laser excitation,” Anal. Chem. 54,2034–2038 ~1982!.
20 September 1997 y Vol. 36, No. 27 y APPLIED OPTICS 6721