Diffraction pattern and structure of amorphous solid water at 10 and 77°K A. H. Narten, C. G. Venkatesh, and S. A. Rice Citation: J. Chem. Phys. 64, 1106 (1976); doi: 10.1063/1.432298 View online: http://dx.doi.org/10.1063/1.432298 View Table of Contents: http://jcp.aip.org/resource/1/JCPSA6/v64/i3 Published by the American Institute of Physics. Additional information on J. Chem. Phys. Journal Homepage: http://jcp.aip.org/ Journal Information: http://jcp.aip.org/about/about_the_journal Top downloads: http://jcp.aip.org/features/most_downloaded Information for Authors: http://jcp.aip.org/authors Downloaded 23 Aug 2012 to 139.184.30.132. Redistribution subject to AIP license or copyright; see http://jcp.aip.org/about/rights_and_permissions
Transcript
Diffraction pattern and structure of amorphous solid water at 10 and 77°KA. H. Narten, C. G. Venkatesh, and S. A. Rice Citation: J. Chem. Phys. 64, 1106 (1976); doi: 10.1063/1.432298 View online: http://dx.doi.org/10.1063/1.432298 View Table of Contents: http://jcp.aip.org/resource/1/JCPSA6/v64/i3 Published by the American Institute of Physics. Additional information on J. Chem. Phys.Journal Homepage: http://jcp.aip.org/ Journal Information: http://jcp.aip.org/about/about_the_journal Top downloads: http://jcp.aip.org/features/most_downloaded Information for Authors: http://jcp.aip.org/authors
Downloaded 23 Aug 2012 to 139.184.30.132. Redistribution subject to AIP license or copyright; see http://jcp.aip.org/about/rights_and_permissions
Diffraction pattern and structure of amorphous solid water at 10 and 77 °K*
A. H. Narten
Chemistry Division. Oak Ridge National Laboratory. Oak Ridge. Tennessee 37830
C. G. Venkatesht and S. A. Rice
Department of Chemistry and The James Franck Institute. The University of Chicago. Chicago. Illinois 60637 (Received 18 September 1975)
X-ray diffraction data show that there are at least two forms of amorphous solid water which differ in density and second nearest-neighbor oxygen-oxygen distribution. (a) The lower density form. made at 77'K. has a diffraction pattern consistent with a structure that has oxygen-oxygen nearest-neighbor tetrahedral symmetry on average. and a nearest neighbor 0-0 separation of 2.76 A with small dispersion. The density of this material is estimated to be 0.94 g cm- 3
• While it is not possible to uniquely define the structure. the data available support the notion that its fundamental characteristic is the existence of a randomized network of hydrogen bonds with 0-0-0 angular distribution derived from (i.e .• centered about) that of ice Ih. Comparison of neutron diffraction and x-ray diffraction data suggests strongly that the first shell hydrogen bonds are nearly linear and that orientational correlations between water molecules are limited to nearest neighbors. (b) The higher density form. made at IO'K. has a diffraction pattern similar to. yet distinctively different from. that of the high temperature deposit. The 0-0 nearest neighbor distance is the same. 2.76 A. but the dispersion in this separation is larger in the low temperature form. The diffraction pattern shows an extra peak at 3.3 A. corresponding to about 1.4 molecules. the existence of which is responsible for the estimated higher density. namely 1.1 g cm- 3
• The data are consistent with several models which share the feature of introducing small 0-0-0 angles into the structure. We discuss the relationships between our data. and inferences from the data. and the corresponding data for liquid water.
I. INTRODUCTION
Enormous effort has been invested in experimental determinations of the properties of water, in attempts to interpret these properties in terms of molecular interactions, and in the development of models with which known properties can be correlated and unknown properties predicted. 1 Despite the effort, our factual knowledge is meager and our understanding rUdimentary.
Neither the existing theories of the liquid state, 2 nor the available methods of statistical mechanics have yet provided a useful and tractable description of liquids composed of molecules between which there are strong noncentral, saturable, forces such as exist in water. On the experimental side, the interpretation of the observed properties of water is complicated by the simultaneous presence of structural disorder and thermal excitations. It would hence be valuable to have a substance that is simultaneously "simpler" than liquid water and yet a "good model" of it.
Olander and Rice3 suggested that amorphous solid water [H20(as)], first reported by Burton and Oliver4 in 1935, satisfied these two requirements. Unlike the liquid, H20(as) can be studied at low temperature where the effects of structural and of thermal disorder can be separated. Results from x_ ray S.6 and neutron7 diffraction and from spectroscopics studies of H20(as) and D20(as) have made it plausible to accept as a working hypothesiS that the amorphous solid is, essentially, supercooled liquid water.
We here report results from x-ray diffraction studies of H20(as) at 10 and at 77 OK. We then combine these results with recently reported neutron diffraction data for D20(as) and compare this structural information on
the amorphous solid with results from earlier diffraction experiments on liquid water.
II. EXPERIMENTAL PROCEDURES
In most of the early studies9 of H20(as) the vapor was condensed on metal surfaces in the temperature range 77 °K< T< 153 OK. Immediately above 153 OK cubic ice (Ic) is always the dominant component in the deposit. Examination of the available data convinced Olander and Rice3 that most deposits obtained at or above 77 ° K are likely contaminated with crystalline ice. They established conditions for the deposition of pure Hp(as) on a variety of substrates. Briefly put, the temperature should be low, preferably below 55 OK, and the rate of deposition very small (a few mg/h).
A. Preparation of samples
The cryostat used for sample preparation (Fig. 1) is similar to that employed by Olander and Rice, 3 with a horizontal depOSition block of copper adjustably mounted in the diffractometer axis. Redistilled water was degassed by successive freeze-thaw cycles. It was allowed to deposit slowly on the copper substrate maintained in a vacuum at temperature of 10 OK (with liquid helium in the inner Dewar of Fig. 1) and 77 OK (with liquid nitrogen). The deposition rate was controlled by a fine metering valve, the water reservoir being maintained at room temperature. The sample thickness was determined by raising and lowering the whole assembly shown in Fig. 1 in the x-ray beam at zero angle.
Two deposits of H20(as) were prepared: The first at a deposition rate of - 4 mg/h and a substrate temperature of 10 OK, measured by a thermocouple mounted in
Downloaded 23 Aug 2012 to 139.184.30.132. Redistribution subject to AIP license or copyright; see http://jcp.aip.org/about/rights_and_permissions
Narten, Venkatesh, and R ice: Structure of amorphous solid water 1107
BREAK SEAL
HAMMER
WATER HOLDING TUBE
/' /'
/'/
/'
.... -/'
/' DEPOSITION BLOCK (SINGLE CRYSTAL OF COPPER)
HELIUM RADIATION SHIELD
NITROGEN RADIATION SHIELD
/' /'
/' /
/'
/'
/ /'
/'
OUTER LN2 DEWAR
INNER LHe DEWAR
COPPER COLD FINGER
FIG. 1. Cryostat and deposition tube and block used for preparation of (as)H20.
the deposition block below the sample. Deposition was ended (after 2 weeks) when the sample had reached a thickness of - 1 mm. The second sample was deposited at a rate of -10 mg/h and a substrate temperature of 77 oK to a thickness of - 2 mm. The 10 oK deposit was studied at 10 oK (H20(as) 10 °K/10 OK), then slowly warmed to 77 oK and studied at this temperature (H20(as) 10 °K/77 OK). The 77 oK deposit was studied only at 77 oK (H20(as) 77 °K/77 OK).
A third sample was prepared at a deposition rate of - 300 mg/h and a substrate temperature of 77 oK to a thickness of -15 mm. The x-ray pattern of this deposit was typical of ice Ic in the presence of H20(as), very similar to the pattern shown in Fig. 3 of Dowell and Rinfret's study of the low-temperature forms of ice. 10
The sample was slowly warmed to -150 oK, at which temperature rapid and complete crystallization to hexagonal ice (Ih) was observed. The polycrystaUine sample was then cooled to 77 oK and studied at this temperature.
B. X-ray data collection
The measurements were made in reflection geometryll using Mo Ka. radiation and a graphite monochromator in the diffracted beam. The deposition block (Fig. 1) consisted of a single crystal of copper12 with a carefully machined flat, horizontal surface (2 x 2 cm). The surface was carefully aligned and oriented in the instrument axis to minimize Bragg scattering from the substrate. Scattered intensities from the deposits were
J. Chern. Phys., Vol. 64, No.3, 1 February 1976
Downloaded 23 Aug 2012 to 139.184.30.132. Redistribution subject to AIP license or copyright; see http://jcp.aip.org/about/rights_and_permissions
1108 Narten, Venkatesh, and R ice: Structure of amorphous sol id water
measured with various beam divergences, ranging from 0.5° at the lowest scattering angles to 2.0° at the highest angles. The times for a fixed number of counts, ranging from 50000 at the lowest scattering angles to 500000 at the highest scattering angles, were measured by repeated scanning at intervals in the scattering angle 28 corresponding to a constant increment Ak in the momentum transfer coordinate
k == (47T/A) sin8 ,
A = O. 7107 A being the wavelength of x radiation. The increment chosen was Ak = O. 1 for the amorphous deposits and Ak = O. 031 for the polycrystalline sample. The range of momentum transfer covered by the experiments was O. 4 kl ,,; k ,,; 16 k 1• Data collection extended over about 2 weeks per sample, during which time no systematic changes in the diffraction patterns were observed.
C. Data processing and corrections
After averaging over all repeat runs (typically 10 per section) the measured intensities were corrected for background, polarization, and absorption in the sample. 13 The geometry and slit arrangement of the x-ray experiment11 completely eliminates sample holder absorption and scattering. The overlapping sections measured with different beam divergences were normalized and the resulting intensity function was corrected for double scattering14 and for Compton modified radiation. 11
The absolute intensity scale was established by normalizing the asymptote of the corrected intensity function at large scattering angles to the theoretical scattering curve for independent water molecules [the first term in Eq. (2) below).
III. DATA REDUCTION AND ANALYSIS
The static coherent scattering function, S(k), derived from the diffraction experiments may be written as 15
~ m
S(k) = L L I a:(k)j2+ I ag(k}j2hggO(k) + ... (2) m=O /J=-m.
with a:(k) the molecular scattering factors introduced by Steele and Pecora16 and computed for water by Blum17
from the wavefunctions of Moccia. 18 The double sum in Eq. (2) describes the scattering from an isolated molecule (total scattering), the term I ag(k)t 2 describes the scattering from a molecule of random orientation with respect to any other molecule taken as the origin (spherical part of the scattering), and the term ilggO(k) is the structure function for molecules of spherical symmetry or random orientation. It has been shown17 that the expansion for the molecular x-ray scattering factor of water is rapidly convergent and that, as a consequence, the spherical part of the scattering differs from the total scattering by an amount smaller 19 than the combined uncertainties of the scattering factor calculations and the diffraction experiment, which are of the order 1%. Furthermore, the x-ray scattering function S"(k) is quite insensitive to the small changes in the scattering factor for water which might be expected from a distortion of the distribution of electron density in the condensed state. Hence, the orientationally averaged
structure function, ilggO(k), can be uniquely derived from x-ray diffraction experiments. In the present case, this function is identical to the structure function hoo(k) descriptive of molecular centers (oxygen atoms), and related to the oxygen atom pair correlation function hoo(r), by the expression
hoo(k) == ilggO(k) = I~ 47Tr2pohoo(r)jo(kr) dr , (3)
° withjo(x)==sinx/x, and Po the number density of water molecules.
We mention that the preceding discussion concerns only the case of x-ray scattering from water. In the case of neutron scattering, discussed in Sec. V, the expansion for the molecular scattering factors, and hence for the neutron scattering function SN(k), is poorly convergent, and the orientational correlations "seen" by neutrons cannot be uniquely extracted from a single experiment.
A. Refinement of the structure functions
The structure functions hoo(k) derived from the xray data [Eq. (2)] were refined to minimize small systematic and statistical errors.
Random errors arising predominantly from counting statistics were minimized by standard smoothing procedures. 19
,20 The smoothed curves pass through the original data within 20, 0 being the standard error of a data point.
Systematic errors, ariSing mainly from imperfections in the correction procedures, can usually be eliminated by requiring the correlation function hoo(r) to be featureless inside a hard-core radius ac ' For the calculation of the function hoo(r) from the inverse of Eq. (3) knowledge of the denSity Po is required. Reported values for the density of HzO(as) range from 0.81 g cm-321 to 2.32 g cm-3, 22 with a value of 0.94(2) g cm-3
determined by the most direct technique23 (buoyancy in liquid oxygen). In view of these discrepancies, we have chosen a technique24 of refining the structure function which yields also an estimate of the densities from the diffraction data.
The main result of systematic errors is a smoothly varying, low-frequency "background" in the structure functions derived from diffraction data. This background intensity, I B , can be parameterized in overlapping functions of the form exp(a+ bk 2),
IB(k)=LWJk)exp(a" +bn k2) , n
a technique developed in the field of electron diffraction of gases. 25 Each exponential function overlaps to the midpoint of the adjacent one and is assigned a weight, wn , that varies linearly in the region of overlap from one at its midpoint to zero at the midpOint of the function with which it overlaps, with the exception of the terminal functions which have a weight of unity from their midpoints to the limits of the data. The background function (4) is smooth and sufficiently featureless so as not to affect the real distance contributions
J. Chern. Phys., Vol. 64, No.3, 1 February 1976
Downloaded 23 Aug 2012 to 139.184.30.132. Redistribution subject to AIP license or copyright; see http://jcp.aip.org/about/rights_and_permissions
Narten, Venkatesh, and Rice: Structure of amorphous solid water 1109
TABLE I. Densities (p), average oxygen-oxygen distances (r) with rms variations (l), and coordination numbers (N), for polycrystalline ice-Ih and (as)Hp derived from least-squares analysis of x-ray structure functions.
p(g cm-3) N rUt) l(A)
Ice Ih 0.93(2)
4.0(2) 2.751(3) 0.091(3)
77 °K/77 oK 12.0a 4.5a 0.166(3)
(as)Hp 0.94(2)
3.8(3) 2.76(1) 0.114(3) 77 °K/77 oK 12.0a 4.5" 0.389(5)
if, in the present case, the number of exponential functions is limited to n ~ 4. Following Konnert and Karle24
we now write the desired structure function h(k) as the sum of the experimentally determined function he(k) and the background function I B (k),
with A a constant which scales IB (k) without altering its shape. A background function of the form chosen in Eq. (4) affects the pair correlation function
(6)
near the origin, and can hence be determined by requiring the pair distribution function g(r) '" 1 + h(r) to assume zero value inside a hard-core radius ac' This requirement may be formulated as a least-squares problem, namely to minimize the sum
The rms deviations (variances), l"'8' in the internuclear distances, r ",8, increase rapidly with increasing separation so that at large values of the variable k the relatively sharp distribution of nearest-neighbor oxygen atoms dominates the structure functions hoo(k). We can thus determine the number of nearest-neighbor oxygen atoms, their mean separation, and variance by leastsquares refinement of the parameters in Eq. (8) against the large-k part of the structure functions derived from experiment. The values derived in this manner are listed in Table I, and will be discussed in Sec. III. The structure functions calculated from the refined parameters for near-neighbor interactions are in quantitative agreement with curves derived from experiment for values of k;; 12 A, with disagreement increasing toward lower k values, as expected.
C. Oxygen atom pair correlation functions
The correlation function hoo(r) for crystalline ice-Ih,. calculated from Eq. (6), is shown in Fig. 2 (dashed curve). As expected, the termination of the integral in Eq. (6) at the maximum value of k = 16 kl accessible in our experiments causes the well_known27 ripples on both sides of the first peak in the function hoo(r). Since the following discussion of structure in Hp(as) is based on relatively small differences between the correlation functions derived for the amorphous depOSits, it is desirable to obtain a better estimate of the functions hoo(r).
4
by adjusting the background function parameters an' bn 3 in Eq. (4), the scale factor A in Eq. (5), and the density Po in Eq. (6).
In the present case, the background terms in Eq. (5) were small and minimization of the sum (7) for the values ac equal 2 A was achieved after only a few cycles of the iterative nonlinear least-squares procedure. The density values thus determined are listed in Table I, and the refined structure functions for the amorphous deposits are tabulated in Appendix A.
B. Analysis of the structure functions
The refined structure functions, hoo(k), for crystalline ice-Ih (Fig. 3) and for the amorphous deposits(Fig. 4) oscillate with slowly decreasing amplitude around their asymptotic values hoo( 00) = O. The relationship between the structure functions and the mean internuclear distances, r",B, is given by the Debye equation26 averaged over Gaussian distributions with rootmean-square (rms) deviations l"'B' namely
(8)
-.:: o
~o
2
o
f,
" . 'I" ,.. .. f\ II
-1 I 1/ IJ V IJ V d I'" l'
" U
o 2 4 8 10
FIG. 2. Correlation functions for polycrystalline ice lh. Dashed curve, obtained through use of Eq. (6), shows spurious ripples due to truncation of the Fourier integral. The solid curve was obtained from Eq. (9).
J. Chern. Phys., Vol. 64, No.3, 1 February 1976
Downloaded 23 Aug 2012 to 139.184.30.132. Redistribution subject to AIP license or copyright; see http://jcp.aip.org/about/rights_and_permissions
1110 Narten, Venkatesh, and R ice: Structure of amorphous sol id water
FIG. 3. structure function of polycrystalline ice Ih prepared by vapor deposition at 77 oK from x-ray diffraction.
We have mentioned that the structure functions hoo(k) for values of k> 12 kl can be fitted, within experimental error, with curves calculated from the parameter descriptive of nearest-neighbor oxygen atom pair interactions. We now use these calculated curves hl (k) to extend the experimental structure functions. The expression (6) for the correlation function may be written as
h(r) = (27T2port l {~kmax k[h(k) - h1(k)] sin(kr)dk
+ {O kh1(k)sin(kr)dk} , (9)
with hl(k) given by a single term of the sum (6). The kernel of the first integral has essentially converged at the upper limit kmax, making the truncation error negligible. The second integral in Eq. (9) can be evaluated analytically. 27 The correlation function hoo( r) for polycrystalline ice, calculated from Eq. (9), is also shown in Fig. 2 (solid line). The unphysical termination ripples in the curve obtained from Eq. (6) (dashed curve) have been completely eliminated while the structurally significant features remain unchanged, except for a slight sharpening of the first peak in the function -hoo(r) , not visible on the scale of Fig. 2.
The oxygen atom pair correlation functions obtained from the x-ray data through the use of Eq. (9) are tabulated in Appendix B.
IV. RESULTS AND DISCUSSION
Structure functions descriptive of oxygen atom pair interactions are shown in Fig. 3 for poly crystalline ice Ih and in Fig. 4 for the amorphous deposits. The curves in Fig. 4 show no trace of the sharp Bragg peaks
characteristic of crystalline materials, and we conclude that our samples were not Significantly coritaminated by crystalline ice. This view is supported by the fact that our depOSits were stable over periods of weeks at thicknesses of 1-2 mm, corresponding to 0.4-0.8 g of amorphous material. The curves in Fig. 4 are typical of liquid materials, as is illustrated by the comparison of structure functions for H20(as) at 10 OK and liquid H20 at 277 OK shown in Fig. 5.
Oxygen atom pair correlation functions for polycrystalline ice Ih, H20(as), and also liquid H20 are shown in Fig. 2 and Figs. 6-8. The functions hoo(r) are shown to distances of 10 A, but the range of the correlation functions for the solid materials extends beyond this distance. A measure of these correlations is the second moment of the functions hoo(r), which is in turn related to the limiting curvature of the structure func-
1 1--'-'-----I- -T
0: i
10 0 K/77"K
77°K/77"K
I I I 1 __ ~~_1_...J 6 8 10 12 14 16
k (8.- t )
FIG. 4. Structure functions for solid amorphous water H20(as) deposits from x-ray diffraction.
J. Chern. Phys., Vol. 64, No.3, 1 February 1976
Downloaded 23 Aug 2012 to 139.184.30.132. Redistribution subject to AIP license or copyright; see http://jcp.aip.org/about/rights_and_permissions
Narten, Venkatesh, and Rice: Structure of amorphous solid water 1111
1.0 1.0
0.5 0.5
I 0 0.0
hoo(k)
I LIQUID 277°K
-0.5 0.0
-1.0 -0.5
-1.0 -1.0 0 2 4 6 8 10 12 14 16
-k[;d-
FIG. 5. Structure functions for amorphous solid and for liquid water from x-ray diffraction. [Reproduced from Ref. (6).J
tions at the origin. Since the functions hoo(k) derived from our experiments were extrapolated for values of k < O. 4 A, we cannot rigorously determine the correlation radius. It is nevertheless useful to define a correlation radius, r e , in the following empirical way:
The correlation functions hoo(r) can be computed to any desired value r== r max' and then reinverted to yield
4
3
2 -;:
0 0
.c
o
-1 r------J o
2 4 6 8 10 r (Al
FIG. 6. Oxygen atom pair correlation functions for polycystalline ice Ih (top) and for Hp(as) (bottom), both prepared and studied at 77 oK, derived from x-ray diffraction.
3
2
-;:
0 0
.c 0
-1
-11-----.../
-1L-~ __ ~~ __ ~~L--L--L-~--~~ o 2 4 6 8 10
r (Al
FIG. 7. Oxygen atom pair correlation functions for Hp(as) derived from x-ray diffraction. Top curve is for 77 oK deposit studied at 77 oK; bottom curves are for 10 oK deposit
measured at 10 and at 77 OK.
2
t I hoo(r)
AMORPHOUS lOoK
I 0
-1}------...-/
LlQu I D 277°K
o
-I o 3 456 9
r [A]-10
FIG. B. Oxygen atom pair correlation function for amorphous solid and for liquid water derived from x-ray diffraction. [Reproduced from Ref. (6).]
J. Chern. Phys., Vol. 64, No.3, 1 February 1976
Downloaded 23 Aug 2012 to 139.184.30.132. Redistribution subject to AIP license or copyright; see http://jcp.aip.org/about/rights_and_permissions
1112 Narten, Venkatesh, and Rice: Structure of amorphous solid water
structure functions which agree with the original curves within the computational errors, in our case of the order 10-13. Setting the correlation functions equal to zero for values of rl :s r :s rmax and reinverting, the computed structure functions deviate increaSingly from the experimental curves with decreasing values of the truncation rl' We define a correlation radius, r c ' as the value of rl for which the rms deviation between reinverted and experimental structure functions exceeds the standard error in the curves derived from the diffraction data (typically 10-3, see Appendix A). The values of rc thus determined are 95 A for polycrystalline ice Ih, 15 A for Hp(as), and 8 A for liquid H20 near the melting point. A sphere with a radius of 15 A corresponds to a cube of equal volume with an edge of 24 A, or about four unit cells (of cubic ice Ic) in length. Since the crystalline state is characterized by the regular repetition of the unit cell, we consider it of doubtful Significance to refer to these amorphous materials as microcrystalline phases.
As a point of departure toward elucidating the structure in H20(as), it is instructive to first discuss some aspects of the radial distribution of oxygen atoms in ice.
A. Polycrystalline ice I h at 77 ° K
In the structure function for poly crystalline ice Ih (Fig. 3) the (100), (002), and (101) reflections are not resolved but appear as a single peak centered around 1. 75 .,\.-1. Most of the higher-order reflections are well resolved at positions in excellent agreement with those calculated from the cell parameters. 10 Thermal broadening of the Bragg peaks increases rapidly with increasing momentum transfer, and for values of k;; 12 A-l the structure function shows only the sinusoidal oscillations from nearest-neighbor oxygen atom interactions predicted by Eq. (8). Application of the Scherrer formula to the width of the (102), (110), (103). and (200) reflections between 2. 35 .,\.-1 <: k <: 3. 23.,\.-1 gives a particle size of - 70 A. This number must be regarded as a lower limit because the crystallite size is only one cause of the width of the peaks in Fig. 3, resolution broadening being appreciable. The correlation radius rc = 95 A determined empirically, which corresponds to a cube of edge -150 A, is probably a better estimate of the particle size. The resolution obtained in our diffraction experiments, while marginal by crystallographic standards, is more than adequate for the precise determination of the Short-range ordering in amorphous and poly crystalline materials.
The oxygen atom pair correlation function for crystalline ice Ih is shown in Figs. 2 and 6. The first peak in the function hoo(r) is completely resolved. In our analysis of the large-k part of the structure function, we have shown that this near-neighbor interaction is quantitatively described by a Gaussian distribution3o of distances with mean value ro_o = 2.751(2) A and rms deviation loo = 0.091 (3) A (Table I). The distance compares well with the result from neutron diffraction studies on single crystals of (D20) ice Ih at 123 OK, namely31 r oo =2.75A.
We have analyzed the structure function of crystalline
ice Ih (Fig. 3) in terms of Gaussian distance distributions [Eq. (8)]. The mean oxygen-oxygen separations, to radial distances of 10 A, and the number of pairs at these distances were generated from the cell parameters and atomic positions in the unit cell. 31 The quantities to be found by least-squares refinement were the rms variations in interatomic distance, which cannot be determined from the crystal data. We found that the rms variation, l2' in the second neighbor distance, r 2,
adjusted by least squares and listed in Table I, was sufficient to determine the rms variations in the longer distances through the relation
(10)
Correlation functions obtained by Fourier inversion of the computed structure functions were found to be in quantitative agreement with the functions hoo(r) derived from the diffraction data.
Since the mean 0· .. 0· , , ° angle e = 109.5° in ice Ih is determined by the distance ratio of the peaks descriptive of first and second neighbor distributions, we can estimate its rms variation, (.:le~ 1/2. If we assume that the variance in this angle is given by the variance in the second neighbor distance alone, its magnitude should be (.:le~1/2 "'" 0.166/2.751 = O. 06 rad or about 3°.
We conclude our discussion of crystalline ice Ih with some observations of relevance to our following results on the structure of H20(as):
(1) The assumption made in the reduction of the xray data, namely, that orientational correlations between pairs32 of water molecules are not "seen" by x rays is supported by the shape of the correlation function for ice Ih in the region of radial distances 3 A < r < 4 A: Preferred orientation between pairs of nearest neighbor water molecules would be indicated by 0· . , H distances in this region (and are found in the correlation functions derived from neutron diffraction from D20(as) , see Sec. V). The structural features in the distance region 3 A < r < 4 A, found in one of the amorphous deposits, must therefore be ascribed to oxygen atom pair interactions.
(2) The density of crystalline ice Ih derived from our data is, within the rather large uncertainties of our result (Table I), identical to the density of 0.924 g cm-3
computed from the cell parameters. 10
B. H20(as) 77°K/77°K
Correlation functions hoo(r) for the amorphous deposit prepared and studied at 77 OK are shown in Fig. 6 together with the curve for poly crystalline ice Ih. As in the crystalline phase, the nearest-neighbor oxygenoxygen correlations in HzO(as) occur in an exceptionally narrow band centered at 2.76 A, with rms deviation O. 114 A (Table I). The distance ratio for second and first neighbor interactions indicates tetrahedral coordination on the average, but the second neighbor peak near 4. 5 A is much broader than in crystalline ice. The two major peaks at 2. 76 and 4. 5 A are not completely separated, but we hesitate to ascribe structural significance to the small feature near 3. 3 A.
J. Chem. Phys., Vol. 64, No.3, 1 February 1976
Downloaded 23 Aug 2012 to 139.184.30.132. Redistribution subject to AIP license or copyright; see http://jcp.aip.org/about/rights_and_permissions
Narten, Venkatesh, and Rice: Structure of amorphous solid water 1113
As described for crystalline ice TIl, the structure function for H20(as) 77 °K/77 oK could be well fitted with three adjustable parameters: the nearest neighbor ° ... ° distance, its rms variation, and the variance in the second neighbor distance. All other distances were generated by the symmetry of the ice TIl structure and the rms variations in longer distances from the relation (10). From the variance in the second neighbor distance distribution (Table I) we estimate a rms variation of 8° in the local 0· .• 0· .• ° angles about the mean tetrahedral value. The agreement of the structure and correlation functions for the described model with the curves derived from x-ray diffraction is not unique and hence not suffiCient proof of its reality. However, since the fit was achieved with only three adjustable parameters, two of which are taken essentially unchanged from our analYSis of the ice TIl data, we are convinced that the model is a realistic description of the short-range order in H20(as) 77 °K/77 OK. The only really adjusted parameter of the model is the variance in the second-neighbor distance distribution, which corresponds to a local variation of the 0 ... ° ... ° angle of about 8° about the mean tetrahedral value. It has been shown33 that continuous random tetrahedral network models with fixed near-neighbor distances and angular distributions with rms variation of 7° about the tetrahedral value yield radial distribution functions which indicate positional correlation over only relatively short radial distances. Structure functions for such a random network model34 of H20(as) are in qualitative agreement with results from earlier x-rayS and more recent neutron7 diffraction studies.
The density of H20(as) 77 °K/77 OK derived from the x- ray data (Table I) is in good agreement with the value 0.94(2) g cm-3 obtained for Hp(as) by a more direct technique. 23
C. H20(as) 10 oK/10oK
The correlation function hoo(r) for the amorphous deposit prepared and studied at 10 OK is shown in Fig. 7 together with the curve for H20(as) 77 °K/77 oK. As in H20(as) 77 °K/77 OK, the nearest-neighbor oxygen-oxygen correlations in H20(as) 10 °K/10 OK occur in a narrow band centered at 2. 76 A. The rms variation in this distance, 0.153 A, is Significantly larger than the cor~esponding value for H:p(as) 77 °K/77 OK, namely 0.114 A, indicating a wider distribution of local 0· .. ° distances about the mean value of 2.76 A in the low-temperature deposit. The distance ratio (Table I) for second and first neighbor interactions indicates tetrahedral coordination on the average, and the variance in the second neighbor distance distribution indicates a local variation of about 8° about the mean tetrahedral value.
A striking difference between the functions hoo(r) for H20(as) 10 °K/I0 OK and for H20(as) 77 °K/77 OK (Fig. 7) is apparent in the region of radial distances 3 A < r < 4 A: The curve for low-temperature H20(as) shows a partially resolved peak at 3.3 A and a shoulder near 4 A. The area under this peak or, more precisely, the integral
N= 41rpo [T2r2g0o(r) dr , (11) Tl
with r 1 = 3. 1 A and r2 = 3. 6 A yields a value of 1. 4 water molecules for this interaction. Another significant difference between high- and low-temperature H20(as) is the density of 1. 1(1) g cm-3 for the 10 OK deposit, estimated from the x-ray data as described in Sec. IlIA.
The ice-I model used to describe the structure of H20(as) 77 °K/77 OK does not predict any oxygen-oxygen distances in the region 2. 76 A < r < 4. 5 A and is hence not capable of explaining the observed distance spectrum and density of H20(as) 10 °K/10 OK. However, a short calculation shows that an ice-I network with a nearneighbor distance of 2.76 A has the density and distance spectrum of Hp(as) 10 °K/10 OK if we permit 45% of the cavities characteristic of this structure to be occupied by "interstitial" water molecules. In this picture, 81% of the water molecules would be part of the tetrahedral network, while 19% of the molecules would be in cavity positions. If we make the additional assumption that the cavity molecules are located on the c axis at a distance of 2.76 A from the nearest network molecules, each cavity molecule would have second network neighbors at a distance of 3. 25 A. The average coordination number for the nearest neighbors in such a model would be 4. 3, the same as found for Hp(as) 10 °K/10 OK (Table I). Structure functions calculated for this interstitial variant of a randomized ice-I model are in good agreement with the curves for H20(as) 10 °K/10 OK derived from the x-ray data.
It is worthwhile m.entioning an alternative possibility for the structure of low temperature, high density H20(as).35 It is known1a that ices II and III have the same nearest neighbor 0-0 separation as ice Ih and H20(as), but each has a second nearest-neighbor 0-0 separation of about 3.24 A. The densities of ices II and III are ~. 18 g cm-3 (238 OK) and 1. 15 g cm-3 (251 OK), respectively, rather close to the estimate of 1. 1 g cm-3
for H20(as) 10 °K/I0 OK. Furthermore, although ices II and TIl are less stable than ice Ih at 1 atm, the differences in free energy between ices Ih, II, and III are not large. la Consequently, it is possible that low temperature, high denSity HzO(as) has a structure which can be described as a randomized hydrogen bonded network derived from a lattice configuration like that of ice II or ice III, or possibly some mixture of the two (even including also some ice Ih parentage). The conceptual unity implied by the comparison of this structure for Hp(as) 10 °K/10 OK and that earlier proposed for H20(as) 77 °K/77 OK is pleasing. However, a quantitative description of the random network derived from ice II/ice III parentage has yet to be worked out, and a test of the predicted and observed 0-0 radial distribution has not yet been made.
The two models mentioned have an important common property, namely the presence of 0-0-0 angles which deviate considerably from 109.5° and which appear as distinct peaks in the 0-0-0 population vs angle distribution function. In ice Ih the nearest nonhydrogen bonded neighbors are at 4. 50 A. The increase in the higher ices in number of nonnearest neighbors is accomplished by bending hydrogen bonds. 36 Bending distortion is, however, minimized by a doubling back in
J. Chern. Phys., Vol. 64, No.3, 1 February 1976
Downloaded 23 Aug 2012 to 139.184.30.132. Redistribution subject to AIP license or copyright; see http://jcp.aip.org/about/rights_and_permissions
1114 Narten, Venkatesh, and Rice: Structure of amorphous solid water
the bond network, so what are real space nonhydrogenbonded near neighbors are, in the network topology, more distant neighbors. For example, the 3, 24 A neighbor in ice II is topologically (along the network) a third neighbor. Since ices Ih, II, and III have only a single complete hydrogen bonded network, the consequence of the arrangement described is the introduction into the structure of ices II and III of both very small and very large 0-0-0 angles (ice II 80° -128°, ice III 87° -141 0). NOW, placing an H20 molecule in an interstitial position in an ice Ih lattice also leads to the introduction of unusually small 0-0-0 angles. We think it likely that any model of high denSity H20(as) must include 0-0-0 angles much smaller than 109. 5 0.
The very suggestion of two models implies that neither is unique. Nor does the citing of two models exhaust the structural pOSSibilities. Suppose it is possible to construct several more models of high density H20(as), each derived from some crystalline prototype. The distinctions between these structures and an ice-I structure with interstitial molecules are important and justified for the crystalline parents, but it is not clear whether such distinctions are meaningful for the amorphous phases of solid water because the local environments of water molecules are severely distorted from the average configuration, these distortions leading to the complete loss of all positional correlation a few molecular radii away from any starting point. In view of these distortions, distinction between random network models of unique parentage (Ice Ih with interstitials) and of more complex parentage (high pressure ice polymorphs) will be meaningful only if there exist observable properties assignable to some property of the parent lattice (e. g., proton ordering as in ice 11).
D. H20(as) 10 o K/77°K
The correlation function hoo(r) for the amorphous deposit prepared at 10 OK and studied at 77 OK is shown in Fig. 7 together with the curve for H20(as) 10 OK/ 10 ° K. The only significant difference between the curves for Hp(as) 10 °K/77 OK and H20(as) 10 °K/10 OK is in the shape of the maximum at 3. 3 A. This peak is broader at 77 than at 10 OK, indicating that this interaction may be of a relatively weak nature.
E. Summary
The existence of noncrystalline solid phases of water, metastable with respect to crystalline ice, is now firmly established. We have shown that bulk quantities of these materials can be studied, at low temperature, over long periods of time (at least weeks) without detectable structural changes. Positional correlation between oxygen atoms, i. e., structure, in H20(as) extends to about 15 A, about twice as far as in liquid water near the melting point. As in crystalline ice Ih, the nearest-neighbor correlations in H20(as) occur in a narrow band centered at 2. 76 A. Unlike crystalline ice Ih, the distribution of second neighbors at 4.5 A in H20(as) is very broad and the variance in this distance distribution suggests a rms variation in local 0 ... 0· ., ° angles of - 8° about the mean tetrahedral
value. An angular spread of this magnitude is sufficient to explain the loss of all pOSitional correlation a few molecular radii away from any starting point.
The radial distribution of oxygen atoms in Hp(as) prepared at 10 OK is qualitatively different from that in Hp(as) prepared at 77 OK.
The high-temperature phase has the same denSity as crystalline ice I, and the average structure of this material can be described as a continuous random network of a single parentage, perhaps of the ice-I type.
The low-temperature phase has a denSity of 1. 1 g cm-3 , and the average structure of this material cannot be described in terms of a random network model of a single parentage. A model based on a randomized ice-I structure with interstitial molecules is consistent with our data, and we note that such a model has been shown to be consistent with x-ray diffraction data 11 on liquid water. The mean distance between nearest-neighbor oxygen atoms in liquid water at 277 OK is 2.82 Ai if liquid water could be supercooled with no structural changes other than a uniform contraction of all 0-0 separations so that the near-neighbor distance reduces to 2. 76 A, its density may be estimated as (2. 82/2. 76)3 = 1. 1 g cm-3
, the value found for low temperature H20(as). The oxygen atom pair correlation function for liquid water (Fig. 8) shows an asymmetric distribution of nearest neighbors which overlaps with the distribution of tetrahedrally coordinated second neighbors, centered near 4.5 A. It has been shown11 that the distribution of nearest neighbor oxygen atoms in liquid water cannot be described by a single GaUSSian distance distribution. In the liquid, this complexity of the first coordination shell cannot be uniquely resolved; if the thermal motion could be "frozen in," we would expect a separation of the near-neighbor distance distribution into Gaussian components, as is found in low-temperature H20(as). These observations are consistent with the view that low-temperature Hp(as) is a metastable representative of liquid H20.
V. COMPARISON WITH NEUTRON DIFFRACTION DATA
Neutron diffraction data for D20(as) have recently been reported7 by Wenzel, Linderstom-Lang, and Rice (WLR). The sample (10x30x2 mm) was prepared by vapor deposition at a rate of 20 mg/h on a cadmium substrate maintained at a temperature of about 7 ° K.
At the time the neutron diffraction experiments were carried out it was not known that there are two forms of amorphous solid water. Consequently, although the deposition system was designed to ensure elimination of crystalline ice in the sample, neither the geometry nor the deposition rate were the same as used in the x-ray experiments reported in this paper. We shall argue below that although the substrate temperature used by WLR was low, their data are only consistent with diffraction from high temperature low denSity D20(as).
The neutron scattering function, SN{ft), obtained by WLR may be written as a series expansion in the molecular neutron scattering factors and in the structure
J. Chern. Phys., Vol. 64, No.3, 1 February 1976
Downloaded 23 Aug 2012 to 139.184.30.132. Redistribution subject to AIP license or copyright; see http://jcp.aip.org/about/rights_and_permissions
Narten, Venkatesh, and Rice: Structure of amorphous solid water 1115
function, similar to Eq. (2). However, we have already mentioned that the expansion for the molecular neutron scattering factors, and hence for the function SN(k), converges slowly. Unlike the x-ray case, in which the access ible information -is limited but unique, the orientational correlation between pairs of molecules in D20(as) "seen" by neutrons cannot be uniquely extracted from the data. We therefore interpret the neutron diffraction data of WLR in the simpler terms of structure and correlation functions descriptive of atom pair interactions.
From the neutron scattering function SN (k) obtained by WLR, 37 we construct a total structure function, HN(k), according to the relation
(12)
with fa the atomic neutron scattering factors, and summation over the atoms in a water molecule. The function HN(k) thus obtained was refined as described in Sec. III. A to minimize systematic errors and to obtain an estimate of the density for D 20(as). In the leastsquares refinement a hard core radius of O. 5 A. was assumed and the background function 1B (k) consisted of only two overlapping Gaussians [Eq. (4)]. A value of 1.1(1) g cm-3 was obtained for the density, and the refined total structure function is shown in Fig. 9.
A. Molecular structure
The total neutron structure function may be written as the sum of two terms, namely
(13)
The first term, H~(k), describes the structure of D20 molecules and the second term, H:(k), contains information about orientational and distance correlations between pairs of molecules. The function H:(k) decays to zero value much faster than the function H~(k), so that
FIG. 9. Weighted neutron structure function, kHN(k), derived from data of Wenzel, Linderstrom-Lang, and Rice (Ref. 7). Molecular structure function, kH:' (k), calculated from parameters listed in Table II.
TABLE II. Mean distances, r, and rms variations, l, for the D20 molecule in condensed phases and equilibrium values for D20 vapor.
at large values of the variable k the total structure function is almost completely determined by the molecular structure. This fact may be used to determine the mean distances, r aB, and their rms variations laB' by leastsquares refinement of the molecular structure function
H~(k)= (L: Ifal)-2L: L:exp(-1~Bk2/2) sin(k;aB)/kraB , a B~a
(14) against the large-k part of the total structure function derived from the neutron data. The quantity ~ aB is related to the average distance r aB by the expression
(14a)
Equation (14) assumes38 harmonic vibrational motion, a satisfactory approximation for the range of momentum transfers covered by the neutron data. The O-D distance, its rms variation, and the rms variation in the intramolecular D-D distance were adjusted by least squares. The D-D distance itself was computed from the O-D distance and an assumed D-O-D angle of 104.5°, because its value of 1. 58 A. is too close to the hydrogen-bonded D20 ... D distance expected near 1. 8 A.. Structural parameters for the D20 molecules are listed in Table II. The molecular structure function H~(k) calculated from these parameters is compared with the total structure function HN(k) in Fig. 9.
B. Orientational correlations
With the molecular structure thus determined, we can subtract the computed function H~(k) from the total structure function [Eq. (13)] and obtain the distinct structure function H:(k). The resulting curve is shown in Fig. 10. The function H:(k) is related to the structure functions descriptive of atom pair interactions in D20(as) by the expression
H:(k) = O. 09hoo(k) + O. 42hoD(k) + o. 49hDD(k) , (15)
the weight factors ariSing from the normalized scattering factor products. With the structure functions hoo(k) known from x-ray diffraction, it is instructive to compute a neutron structure function
H~(k) = hoo(k)
x {fo +2fD exp(-1~Dk2/2)jo(kroDW (L:lfa 1)-2
(16)
J. Chern. Phys., Vol. 64, No.3, 1 February 1976
Downloaded 23 Aug 2012 to 139.184.30.132. Redistribution subject to AIP license or copyright; see http://jcp.aip.org/about/rights_and_permissions
1116 Narten, Venkatesh, and Rice: Structure of amorphous solid water
z~ :r:
o 2 4 6
dJiJ
: :: OBSERVED
CALCULATED
8 10 12
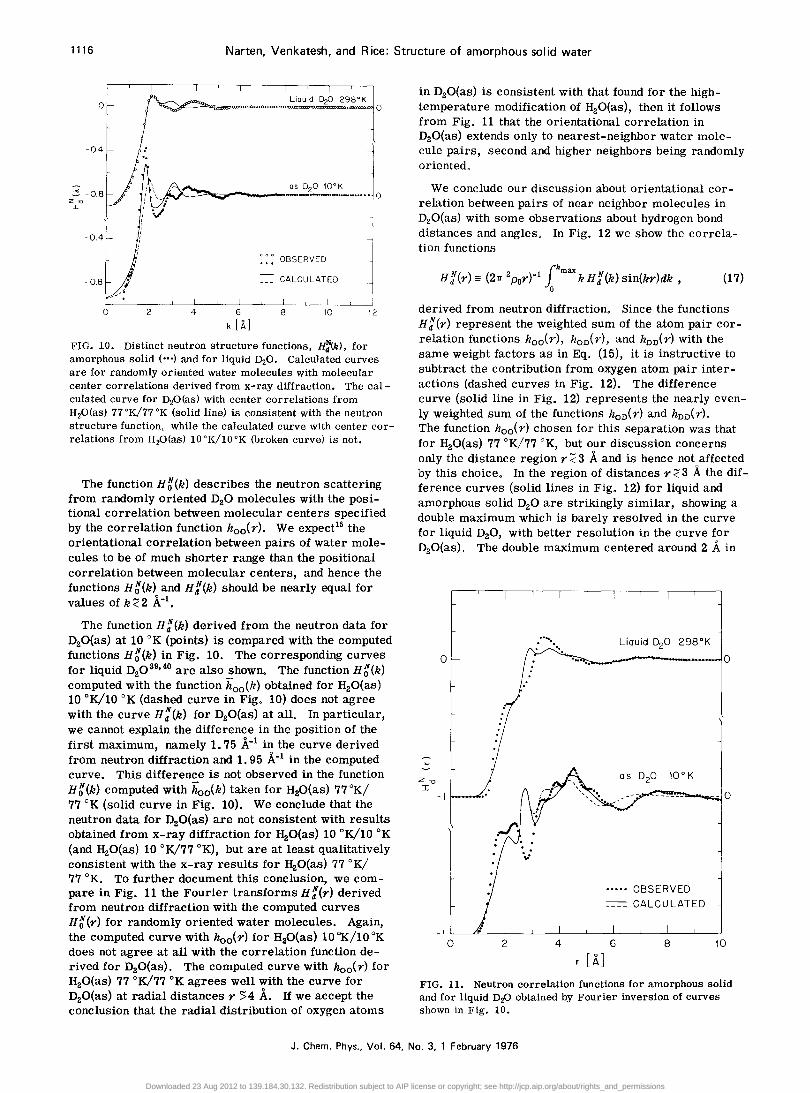
FIG. 10. Distinct neutron structure functions, H:(k) , for amorphous solid ( ... ) and for liquid D20. Calculated curves are for randomly oriented water molecules with molecular center correlations derived from x-ray diffraction. The calculated curve for D20(as) with center correlations from H20(as) 77 °K/77 oK (solid line) is consistent with the neutron structure function, while the calculated curve with center correlations from Hp(as) 10 °KI10 oK (broken curve) is not.
The function H~(k) describes the neutron scattering from randomly oriented DaO molecules with the positional correlation between molecular centers specified by the correlation function hoo(r). We expectl5 the orientational correlation between pairs of water molecules to be of much shorter range than the positional correlation between molecular centers, and hence the functions H~(k) and H%(k) should be nearly equal for values of k<:2 k 1
•
The function H%(k) derived from the neutron data for DaO(as) at 10 OK (points) is compared with the computed functions H~(k} in Fig. 10. The corresponding curves for liquid Da039.40 are also shown. The function H~(k) computed with the function hoo(k) obtained for HaO(as) 10 °K/10 OK (dashed curve in Fig. 10) does not agree with the curve H:(k) for DaO(as) at all. In particular, we cannot explain the difference in the position of the first maximum, namely 1. 75 k 1 in the curve derived from neutron diffraction and 1. 95 k1 in the computed curve. This difference is not observed in the function H~(k) computed with hoo(k) taken for HaO(as) 77°KI 77 OK (solid curve in Fig. 10). We conclude that the neutron data for DaO(as) are not consistent with results obtained from x-ray diffraction for HaO(as} 10 °K/10 OK (and HaO(as) 10 °K/77 OK), but are at least qualitatively consistent with the x-ray results for HaO(as) 77 °KI 77 OK. To further document this concluSion, we compare in Fig. 11 the Fourier transforms H%(r) derived from neutron diffraction with the computed curves H~(r) for randomly oriented water molecules. Again, the computed curve with hoo(r) for HaO(as) 10 "KIlO OK does not agree at all with the correlation function derived for DaO(as). The computed curve with hoo( r) for HaO(as) 77 °K/77 OK agrees well with the curve for DaO(as} at radial distances r 54 A. If we accept the conclusion that the radial distribution of oxygen atoms
in DaO(as) is consistent with that found for the hightemperature modification of HzO(as), then it follows from Fig. 11 that the orientational correlation in DaO(as) extends only to nearest-neighbor water molecule pairs, second and higher neighbors being randomly oriented.
We conclude our discussion about orientational correlation between pairs of near neighbor molecules in DzO(as) with some observations about hydrogen bond distances and angles. In Fig. 12 we show the correlation functions
(17)
derived from neutron diffraction. Since the functions H%(r) represent the weighted sum of the atom pair correlation functions hoo(r), hOD(r), and hDD(r) with the same weight factors as in Eq. (15), it is instructive to subtract the contribution from oxygen atom pair interactions (dashed curves in Fig. 12). The difference curve (solid line in Fig. 12) represents the nearly evenly weighted sum of the functions hOD( r) and hDD( r). The function hoo(r) chosen for this separation was that for HzO(as) 77 °K/77 OK, but our discussion concerns only the distance region r <: 3 A and is hence not affected by this choice. In the region of distances r <: 3 A the difference curves (solid lines in Fig. 12) for liquid and amorphous solid DzO are strikingly Similar, showing a double maximum which is barely resolved in the curve for liquid DzO, with better resolution in the curve for DzO(as). The double maximum centered around 2 A in
2" I
°
-1 "
.,;
....... ".
Liquid D20 298°K ·". __ -------.-10
as D20 10° K
••••• OBSERVED
= CALCULATED
-1 L-~~~ __ -L __ _L __ ~ __ ~ __ L-~ __ ~ __ ~
o 2 4 6 8 10
r[A]
FIG. 11. Neutron correlation functions for amorphous solid and for liqUid DP obtained by Fourier inversion of curves shown in Fig. 10.
J. Chern. Phys., Vol. 64, No.3, 1 February 1976
Downloaded 23 Aug 2012 to 139.184.30.132. Redistribution subject to AIP license or copyright; see http://jcp.aip.org/about/rights_and_permissions
Narten, Venkatesh, and R ice: Structure of amorphous solid water 1117
r[A] FIG. 12. Atom pair correlation functions for amorphous solid and liquid DzO. Dotted curves are weighted sums of contributions from 0-0, O-D, and D-D interactions. Broken curves show ill ntributions from 0-0 interactions alone. Solid curves represent nearly evenly weighted sums of 0-D and D-D atom pair correlation functions.
the difference curve for liquid water has been interpreted39,40 as the superposition of the hydrogen bonded ° ... D distance at 1.92 A and the nearest intermolecular D ' ,. D distance at 2.40 A. The double maximum in the difference curve for D20(as) (Fig. 12) is barely resolved into two separate peaks at 1.76 and at 2.30 A. An ° ' '. D distance of 1. 76 A, when combined with an 0' •. ° distance of 2.76 A (Table I) and an intramolecular O-D distance of 1. 00 A (Table II) indicates linear hydrogen bonds on the average in DzO(as) (as was found for liquid DzO) , If we assume an average ° ' .. ° ... ° angle of 109.5° and an average D-O-D angle of 104.5 0, the resulting average hydrogen-bond angle 0··· OD would be 2.5 0, yielding an 0· .. D distance of 1. 762 A, We estimate that a hydrogen-bond angle greater than 5° on the average is incompatible with the diffraction data on low denSity solid amorphous water.
C. Summary
Our analysis of the neutron diffraction data reported by WLR for D20(as) prepared and studied at 10 oK shows that the average structure of D20 molecules in the amorphous solid is very similar to that found in crystalline ice Ih, The mOlecules in DzO(as) are connected by nearly linear hydrogen bonds, a deviation from average linearity by more than 5 ° being incompatible with the diffraction data. Local deviations from the average linearity of hydrogen bonds seems likely in DzO(as) but
no estimate of the angular distribution can be obtained from the diffraction data alone. As in liquid D20, the preferred average orientation between pairs of molecules in D20(as) extends to nearest neighbors only, second and higher neighbors being randomly oriented,
The radial distribution of oxygen atoms in D20(as) as inferred from the neutron data is incompatible with results derived from x-ray data for H20(as) 10 °K/10 oK, but is consistent with the radial distribution of oxygen atoms in H20(as) 77 °K/77 oK. The estimated mass density of 1.1(1) g cm-3 is the same as that derived for HzO(as) 10 °K/10 oK, However, the quantities to be compared are the particle densities: The values derived from the diffraction data are 0.037(3) k3 for HzO(as) 10 °K/10 oK, 0.031(1) k3 for HzO(as) 77 °K/77 oK, and 0.035(3) k3 for DzO(as) 10 °K/10 oK. The value derived for DzO(as) is compatible with the value obtained for H20(as) 77°K/77°K. In view of the relatively large uncertainties in the density values obtained by our method, a more direct determination is clearly desirable.
We note that the DaO(as) sample studied by WLR was about twice as thick as our H20(as) deposit prepared at lOoK, and that the deposition rate reported by WLR was about four times greater than in our lOoK deposition. These different conditions may well have resulted in substantially higher temperatures at the sample surface in the WLR experiment.
VI. SUMMARY AND CONCLUSIONS
The inferences which can be drawn from the diffraction studies have already been mentioned at appropriate places in the preceding text. We now examine the extent to which other studies of HzO(as) are in agreement with our structural hypotheses.
An extensive Raman spectroscopic study of clean HzO(as) has been reported by Venkatesh, Rice, and Bates (VRB). B High density HzO(as), DzO(as) and a 12% H20/DzO(as) mixture were studied by VRB over the temperature range 30-1200K. The observed unpolarized spontaneous Raman spectral profiles were decomposed into a superposition of Gaussian transition profiles. Analysis of these, using a correlation between O-H stretching frequency and deviation from linearity of hydrogen bonding, led VRB to two suggestions:
(a) The local environment of a water molecule is, on average, tetrahedral. There is, however, a distribution of 0-0-0 angles about the (near) tetrahedral value of about 6 ° (full width at half -height).
(b) The spectral decomposition, taken together with the O-H frequency-O-O-O angle correlation and the nature of the 0-0 distance distribution, suggests the existence of water molecules in enVironments such that the 0-0-0 angles are much smaller than 109.5 ° .
The interpretations of the Raman spectroscopic data and the x-ray and neutron diffraction data agree, then, with respect to the existence of local tetrahedrality in HzO(as), implying near linearity of the hydrogen bonding between nearest neighbor water molecules, with
J. Chem. Phys., Vol. 64, No.3, 1 February 1976
Downloaded 23 Aug 2012 to 139.184.30.132. Redistribution subject to AIP license or copyright; see http://jcp.aip.org/about/rights_and_permissions
1118 Narten, Venkatesh, and Rice: Structure of amorphous solid water
respect to the existence of a distribution of 0-0-0 angles having a sizeable spread (6 ° _8°) about the tetra
hedral value, and with respect to the probable existence of some local environments characterized by rather small 0-0-0 angles. Finally, just as the diffraction data indicate, unequivocally, that HzO(as) has a "liquidlike" structure lacking long-range order, the Raman spectra of HzO(as) are much more like that of the liquid than those of the crystalline ices.
suggest new experiments to guide the choice of approximations in a statistical mechanical theory of HaO(as) and, ultimately, liquid HzO.
ACKNOWLEDGMENTS
The structural differences between the high- and lowtemperature forms of HzO(as) have led one of US 41 to
We thank J. Wenzel for providing us with tabulations of his neutron diffraction data for DzO(as). We are grateful for support from ERDA and the National Science Foundation (Grant NSF GP 42930 and NSF MRL GH 33636A).
APPENDIX A
Refined structure functions, hoo(k), for HaO(as) from x-ray diffraction. The data points listed for values of k < O. 4 A:1 have been extrapolated. The data are for the lOoK deposit studied at lOoK (lOoK/lOOK) and at 77 OK (10 °K/77 OK), and for the 77 OK deposit studied at 77 OK (77 °K/77 OK). The standard error of an average data point (from counting statistics only) is ± O. 002. Also listed are the molecular scattering factors used in the data reduction [Eq. (2)], with the notation < F)2 = I a~(k) 1
2/100 and < F2) = L:;=oZ::='m / a:'(k) /2/100, in electron units.
Oxygen atom pair distribution functions, goo(r) = 1 + hoo(r), computed from the structure functions listed in Appendix A according to Eq. (9). The first integral in Eq. (9) was evaluated numerically using the finite discrete Fourier transform algorithm,28 modified for one-dimensional diffraction data. 29 evaluated analytically. The increment is Ar= 0.1227 A.
*Reseach sponsored by the U. S. Energy Research and Development Administration under contract with the Union Carbide Corporation and by the National Science Foundation.
tpresent address: Department of Chemistry, Syracuse University, Syracuse, NY 13210.
lThree excellent summaries of the experimental information available, and their theoretical interpretation are: (a) D. Eisenberg and W. Kautzmann, The Structure and Properties of Water (Oxford University, 1969); (b) F. Franks, editor, Water, A Conprehensive Treatise (Plenum, New York, 1972); (c) A. Ben-Nairn, Water and Aqueous Solutions (Plenum, New York, 1974).
2See , for example, S. A. Rice and P. Gray, The Statistical Mechanics of Simple Liquids (Wiley, New York, 1965); c. A. Croxton, Liquid State Phyics (Cambridge University, Cambridge, in press).
3D. Olander and S. A. Rice, Proc. Nat!. Acad. Sci. USA, 69, 98 (1972).
4E • F. Burton and W. F. Oliver, Proc. R. Soc. London, Ser. A 153, 166 (1935).
5p. Bondot, C. R. Acad. Sci. Ser. B 265, 316 (1967). 6C. G. Venkatesh, S. A. Rice, and A. H. Narten, Science
186, 927 (1974). 7J. Wenzel, C. Linderstrom- Lang, and S. A. Rice, Science
187, 428 (1975). 8C. G. Venkatesh, S. A. Rice, and J. B. Bates, J. Chern.
Phys. 63, 1065 (1975). 9See the review of N. H. Fletcher, Rep. Prog. Phys. 34, 913
(1971). loL. G. Dowell and A. P. Rinfret, Nature 188, 1145 (1960). I1Reference 1b, Vol. I, p. 312. 12The copper single crystal was kindly provided and cut by F.
W. Young, Jr., Solid State Division, ORNL. 13H. A. Levy, P. A. Agron, and M. D. Danford, J. Appl.
Phys. 30, 2012 (1959). 14B • E. Warren and R. L. Mozzi, Acta Crystallogr. 21, 459
(1966). 15L. Blum and A. H. Narten, Adv. Chern. Phys. (in press). 16W. A. Steele and R. Pecora, J. Chern. Phys. 42, 1863
(1965). 17L. Blum, J. Comput. Phys. 7, 592 (1971). 18R. Moccia, J. Chern. Phys. 40, 2186 (1964). 19A. H. Narten and H. A. Levy, J. Chem. Phys. 55, 2263
21B. A. Seiber, B. E. Wood, A. M. Smith, and P. R. Muller, Science 170, 652 (1970).
22A. H. Delsemme and A. Wenger, Science 167, 44 (1970). 23J. A. Ghormley and C. J. Hochanadel, Science 171, 62
(1971) • 24J • H. Konnert and J. Karle, Acta Crystallogr. Ser. A 29,
702 (1973); Trans. Am. Crystallogr. Assoc. 10, 29 (1974). 25p. D'AntoniO, C. George, A. H. Lowrey, and J. Karle, J.
Chem. Phys. 55, 1071 (1971). 26p. Debye, Ann. Phys. Leipzig 46, 809 (1915), 27J. Waser and V. Schomaker, Rev. Mod. Phys. 25, 671 (1953). 2BJ • W. Cooley and J. W. Tukey, Math. Comput. 19, 297
(1965) . 29F. Vaslow and A. H. Narten, J. Chem. Phys. 59, 4953
(1973). 30Note that the assumption of Gaussian distance distributions
in Eq. (8) corresponds to Gaussian peak shapes in the pair density functions, 47rr2p(r) , with p(r) = pog(r). The peaks in the functions g(r) and h(r) = g(r) -1 are not of Gaussian shape. For a detailed discussion see Ref. 27.
31S. W. Peterson and H. A. Levy, Acta Crystallogr. 10, 70 (1957).
32The apparent contradiction between this statement and the fact that intramolecular 0 - H distances can be "seen" by x rays (see Ref. 11) is resolved if we consider that the intramolecular distances depend only on the molecular scattering factors. Intermolecular O"'H distances contribute to the scattering as the product of the corresponding nonspherical parts of the scattering factor and the nonspherical parts of the correlation functions, these products being negligibly small in the present case.
33D. E. Polk, J. Non-Cryst. Solids 5, 365 (1971). 34R. Alben and P. Boutron, Science 187, 430 (1975). These
authors note that our data for H20(as) 10 °K/10 OK appear to be quite different from the results of Bondot. 5 They conclude that this reflects a fundamental difference in microscopic structure between our lOOK/looK sample and the high temperature deposits reported earlier.
35For a more detailed exposition of the arguments see S. A. Rice, TopiCS in Current Chemistry (in press).
36B. Kamb in, Structual Chemistry and Molecular Biology, edited by A. Rich and N. Davidson (Freeman, San Francisco,
J. Chern. Phys., Vol. 64, No.3, 1 February 1976
Downloaded 23 Aug 2012 to 139.184.30.132. Redistribution subject to AIP license or copyright; see http://jcp.aip.org/about/rights_and_permissions
Narten, Venkatesh, and Rice: Structure of amorphous solid water 1121
1968), p. 507. 31The neutron scattering function Sm(q) reported by WLR (Fig.
3 of Ref. 7) differs from the function SN(k) defined here by the factor (L:~ f,,)2.
38M. I. Davis, Electron Diffraction in Gases (Dekker, New York, 1971), p. 79.
39R. Triolo and A. H. Narten, J. Chern. Phys. 63, 3624 (1975). 40A• H. Narten, J. Chern. Phys. 56, 5681 (1972). 418. A. Rice, Topics in Current Chemistry (in press). 42C. W. Kern and M. Karplus, in Reference 1b, p. 37. 438. J. Cyvin, Molecular Vibrations and Mean Square Ampli
tudes (Elsevier, Amsterdam, 1968), p. 207.
J. Chern. Phys., Vol. 64, No.3, 1 February 1976
Downloaded 23 Aug 2012 to 139.184.30.132. Redistribution subject to AIP license or copyright; see http://jcp.aip.org/about/rights_and_permissions