Page 1
Diffusion and Phase Change During Heat Treatment of Ni-B
Coatings on Steel
By
Kevin Shepardson
A Thesis
Submitted to the Faculty
of the
Worcester Polytechnic Institute
In partial fulfillment of the requirements for the
Degree of Master of Science
In
Materials Science and Engineering
April 2008
APPROVED:
________________________________________
Richard D Sisson Jr., Advisor
George F. Fuller Professor
Materials Science and Engineering Program Head
Page 2
ii
Abstract
Nickel-boron coatings are used to improve friction and wear properties (and, in
some cases, corrosion resistance). The nickel-boron coating investigated here is 5-6 wt%
boron, and is deposited by electroless plating on a 1018 steel substrate. It is amorphous
as-plated, and heat treatment is used to crystallize the coating to improve its hardness.
To better understand and predict the effects of heat treatment, samples that had
been isothermally annealed at various temperatures from 500ºC to 800ºC for either 2h or
5h were examined by several methods to determine the diffusion effects taking place
during annealing. Samples were examined by XRD, both at the coating surface and at
multiple depths within the coating. Optical microscopy and SEM were used to view the
structure of the coating in cross-section. Cross sections were etched and examined by
optical microscopy and SEM, as well as EDS, which was used to develop a Ni-Fe
composition profile at the coating-substrate interface. Microhardness measurements were
taken and used to develop microhardness profiles. Additional samples were annealed to
investigate boron oxidation at the coating surface.
Based on the data, there is a reduced amount of Ni3B near the outer surface of the
heat-treated coatings, with the thickness of the resultant γ-Ni layer increasing with
annealing time and temperature, from 2.4 to just over 13 µm. This low-boron region
indicates that boron is diffusing out through the surface of the coating and oxidizing,
which the literature indicates should result in the formation of B2O3. Because B2O3 is
water-soluble, it is likely that it dissolved during the water quench that concluded most
anneals. Diffraction and EDS data also indicate interdiffusion of the nickel in the coating
and the iron in the steel substrate. This leads to the formation of a soft interdiffusion
Page 3
iii
layer between the Ni3B coating bulk and steel substrate that appears to be a mix of ferrite
and Ni3Fe.
Page 4
iv
Table of Contents Abstract .............................................................................................................................. ii
Table of Contents ............................................................................................................... iv
List of Numbered Figures ................................................................................................... v
List of Numbered Tables ................................................................................................... vi
1. Introduction ................................................................................................................... 1
2. Literature Review ......................................................................................................... 2
2.1 Electroless Ni-B Coatings ......................................................................................... 2
2.2 Previous Work on Heat Treatment of Ni-B Coatings ............................................... 2
2.3 Iron-Nickel Diffusion................................................................................................ 4
2.4 Boron Oxidation........................................................................................................ 5
3. Experimental Plan ........................................................................................................ 6
4. Experimental Procedure .............................................................................................. 7
4.1 Sample Selection ....................................................................................................... 7
4.2 Microscopy and Microhardness ................................................................................ 7
4.3 X-Ray Diffraction ..................................................................................................... 8
4.4 Heat Treatment and Oxidation .................................................................................. 8
4.5 Etching and EDS ....................................................................................................... 9
5. Results and Discussion ................................................................................................ 11
5.1 Microscopy ............................................................................................................. 11
5.1.1 Photomicroscopy.................................................................................................. 11
5.1.2 Scanning Electron Microscopy and EDS ............................................................. 14
5.2 Microhardness Profiles ........................................................................................... 19
5.3 X-Ray Diffraction ................................................................................................... 22
5.4 Heat Treatment and Oxidation ................................................................................ 25
6. Conclusions .................................................................................................................. 27
7. Suggestions for Future Research ............................................................................... 28
8. Works Cited ................................................................................................................. 30
Appendix A1: Optical Microscopy .............................................................................. 301
Appendix A2: SEM and EDS ....................................................................................... 312
Appendix A3: Microhardness Data and Overlays ....................................................... 33
Appendix A4: XRD Phase-composition Profiles .......................................................... 34
Page 5
v
List of Numbered Figures Figure 2.1: Fe-Ni phase diagram ........................................................................................ 4
Figure 5.1: Photomicrographs of sample 7A (no heat treatment) ..................................... 11
Figure 5.3: Surface and interdiffusion layer thicknesses by anneal temperature ............. 13
Figure 5.4: Photomicrograph of Sample 12A after etching .............................................. 14
Figure 5.5: SEM micrograph of coating-substrate interface in as-plated sample. ............ 15
Figure 5.6: SEM micrograph of delaminated sections of sample 6B. .............................. 16
Figure 5.7: EDS spectrum of delaminated area ................................................................ 16
Figure 5.8: EDS spectrum of non-delaminated area ......................................................... 17
Figure 5.9: Fe and Ni concentrations in interdiffusion area of etched Sample 12A. ........ 18
Figure 5.10: Optical photomicrographs of Sample 4A. .................................................... 20
Figure 5.11: Microhardness profile for Sample 10A ........................................................ 21
Figure 5.12: Phase composition profiles and optical photomicrographs .......................... 24
Figure 5.13: Optical photomicrograph of sample 12B (800 ºC, 2h, air cool, top)............ 26
Page 6
vi
List of Numbered Tables
Table 3.1: Heat treatment and designation for original samples. ....................................... 6
Table 3.2: Conditions for new heat-treatment tests. ........................................................... 6
Table 5.1: Surface and interdiffusion layer thicknesses. .................................................. 13
Table 5.2: Maximum microhardness values for each sample. .......................................... 22
Table 5.3: Weights and weight differences before and after heat treatment .................... 25
Page 7
1
1. Introduction
UltraCem™, produced by UCT Coatings, Inc., is an electroless nickel-boron
coating containing approximately 5-6 wt% boron [1]. It is used as a wear-resistant
coating, due to its high hardness. When heat-treated under certain conditions, hardness
values as high as 1400 on the Knoop (25gf, 10s) scale have been reported [2]. Heat
treatment is necessary because the electroless plating process used deposits a mostly
amorphous coating, which has a lower hardness than heat-treated coatings.[Riddle and
Bailer]
Previous work [2][3] has examined the relationship between heat treatment and
coating properties, and determined that phase transformations take place during the
isothermal heat treatment of the Ni-B coatings.
Longabucco and Nowill [2] reported some depletion of the boron in the coating
during heat treatment, but could not explain why this occurred. Also, limited attention
has been paid to variation in hardness with depth into the coating. The goal of this thus is
determine how phase composition and microhardness vary with depth into the coating, to
determine the cause of the boron loss during heat treatment, and to examine the diffusion
between the coating and a steel substrate.
Page 8
2
2. Literature Review
2.1 Electroless Ni-B Coatings
Electroless nickel-boron coatings have long been studied as a method of
improving friction and wear properties of various substrates. [4] One of the more recent
developments, UltraCem (produced by UCT Coatings, Inc.), has demonstrated hardness
values greater than nickel-phosphorus coatings and comparable to hard chrome coatings.
UltraCem, which contains 5-6% boron by weight, has a hardness of Hv100 650-700 in its
mostly amorphous as-plated condition. With proper heat-treatment, however, this
hardness can increase as high as HV100 2000, though this can take in excess of 30 weeks.
[4] Briefer, more practical heat treatments can still produce hardness values of about
HV100 1200, allowing a useful hardness to be achieved by industrial production. [4]
2.2 Previous Work on Heat Treatment of Ni-B Coatings
Because UltraCem is a relatively new technology, the details of the
transformations that take place during heat-treatment are not yet fully understood. For
this reason, Longabucco and Nowill [2] heat treated samples of UltraCem plated on 1018
steel at a variety of temperatures and durations.
Microhardness measurements from the coating were collected, as well as optical
and scanning electron micrographs of the coating cross-section, EDS spectra from
various depths in the coating, and XRD scans of the coating surface.
Longabucco and Nowill reported that for samples heat treated for one hour at
850ºC, some delamination and some coating failure occurred. Because of this, no heat
Page 9
3
treatments were conducted for longer than one hour at 850ºC. Heat treatments at
temperatures above 850ºC were not performed.
The data collected by Longabucco and Nowill indicate that the UltraCem, which
is amorphous as-deposited, crystallizes during heat treatment, forming γ-Ni and Ni3B. [2]
Much of the γ-Ni formed at the outer surface of the coating, indicating some boron
depletion at the surface, which was attributed to oxidation of the boron.
Their hardness data showed, at most temperatures, an increase toward a peak
hardness, followed by a decline. At the lowest temperatures, the highest hardness values
came from the longest heat treatments, suggesting that longer heat treatments may have
followed the same pattern as the higher-temperature heat treatments but required more
time to achieve maximum hardness. The highest-temperature heat treatments showed a
peak hardness at the shortest heat treatment, or no peak at all, suggesting that the
transformation was occurring very rapidly.
Microscopy and EDS showed diffusion of iron from the substrate into the coating,
but no detectable diffusion of nickel from the coating into the substrate. This, they
suggested, led to Kirkendall porosity, which then contributed to the high-temperature
coating failure. [2]
However, most of the measurements made by Longabucco and Nowill were not
taken over a range of depths in the coating. Diffraction data were only obtained at the
coating surface, while microhardness values were determined from averages of many
measurements made at unspecified depths into the coating. From these data alone, it is
not possible to accurately gauge how phase composition and mechanical properties (such
as hardness) vary with depth in the coating. Because the EDS equipment used was
Page 10
4
unable to detect boron, there is no indication of the extent of boron depletion in the
coating. Finally, the question of what happened to the missing boron was not examined
in depth.
2.3 Iron-Nickel Diffusion
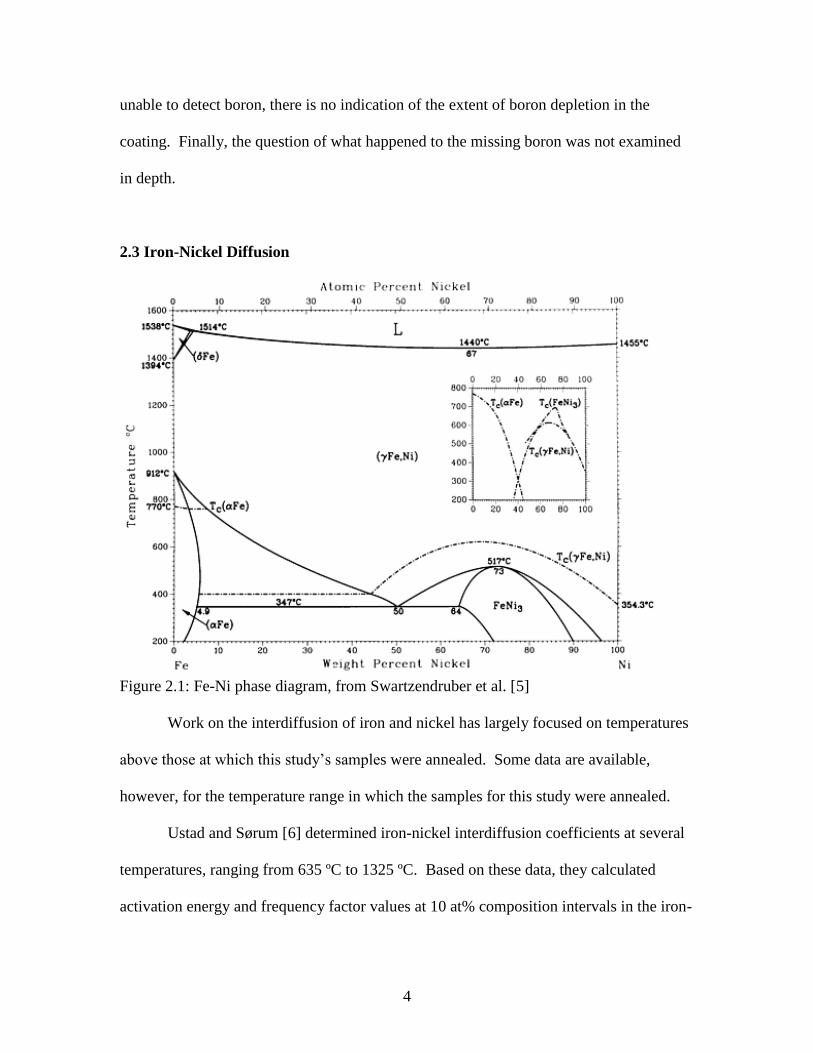
Figure 2.1: Fe-Ni phase diagram, from Swartzendruber et al. [5]
Work on the interdiffusion of iron and nickel has largely focused on temperatures
above those at which this study’s samples were annealed. Some data are available,
however, for the temperature range in which the samples for this study were annealed.
Ustad and Sørum [6] determined iron-nickel interdiffusion coefficients at several
temperatures, ranging from 635 ºC to 1325 ºC. Based on these data, they calculated
activation energy and frequency factor values at 10 at% composition intervals in the iron-
Page 11
5
nickel system. They reported activation energy values from 2.64 to 2.74 eV
(approximately 255 to 264 kJ/mol) and frequency factor values from 0.15 to 0.71 cm2/s.
Ganesan et al [7] reported that iron-nickel diffusion couples annealed at
temperatures from 1073 K to 1373 K showed “smooth variations of” iron and nickel
concentrations across the interface, and that interdiffusion coefficient values below 1173
K were significantly higher than predicted values based on extrapolation of higher-
temperature data. Activation energy values from 310.53 to 350.06 kJ/mol and frequency
factors from 174 to 2850 cm2/s were also reported.
2.4 Boron Oxidation
Wang et al [8] found that pure solid boron, whether amorphous or crystalline,
forms B2O3(s) when exposed to oxygen at elevated temperatures up to approximately
1100 K. Above 1100K, they noted that the oxide tends to desorb from the surface as
primarily B2O2(g), which does not form during lower-temperature oxidation, with a small
amount of B2O3(g) also desorbing. They also concluded that the B2O3 formation resulted
in submonolayer coverage, which indicates that very little oxide actually forms, even on a
surface of pure boron. In addition, B2O3 is water-soluble, so what little oxide does form
is likely to be dissolved by quenching in water.
Page 12
6
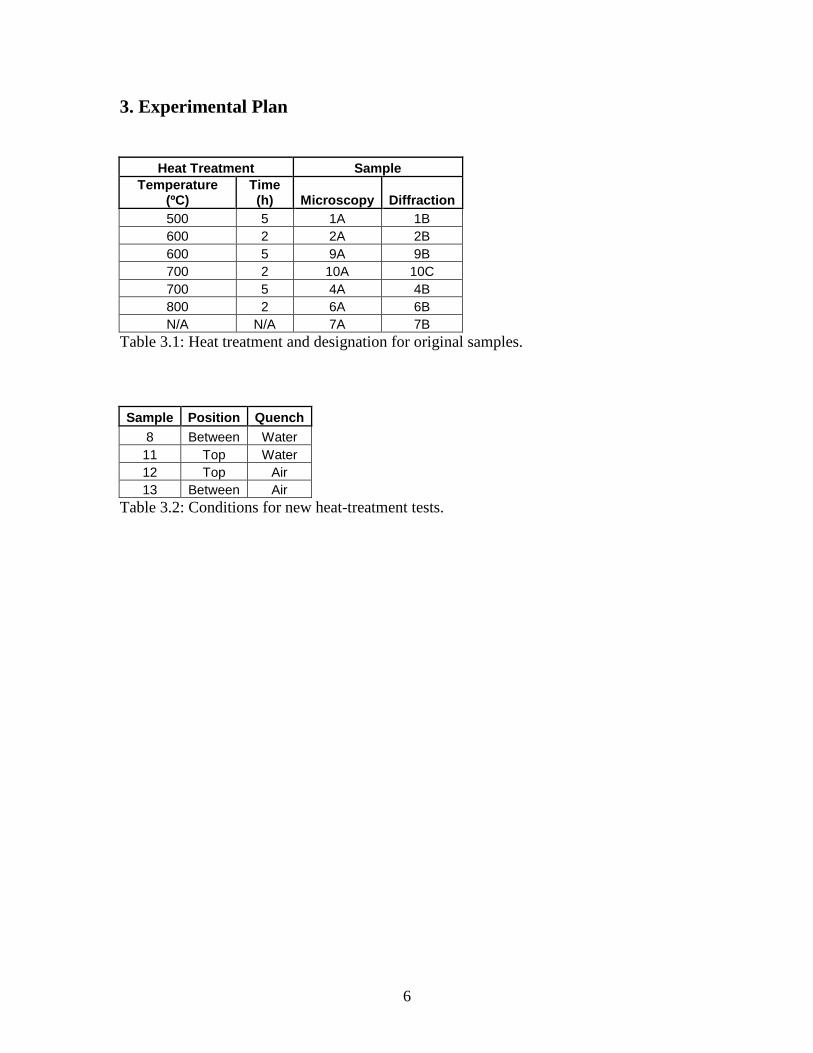
3. Experimental Plan
Heat Treatment Sample
Temperature (ºC)
Time (h) Microscopy Diffraction
500 5 1A 1B
600 2 2A 2B
600 5 9A 9B
700 2 10A 10C
700 5 4A 4B
800 2 6A 6B
N/A N/A 7A 7B
Table 3.1: Heat treatment and designation for original samples.
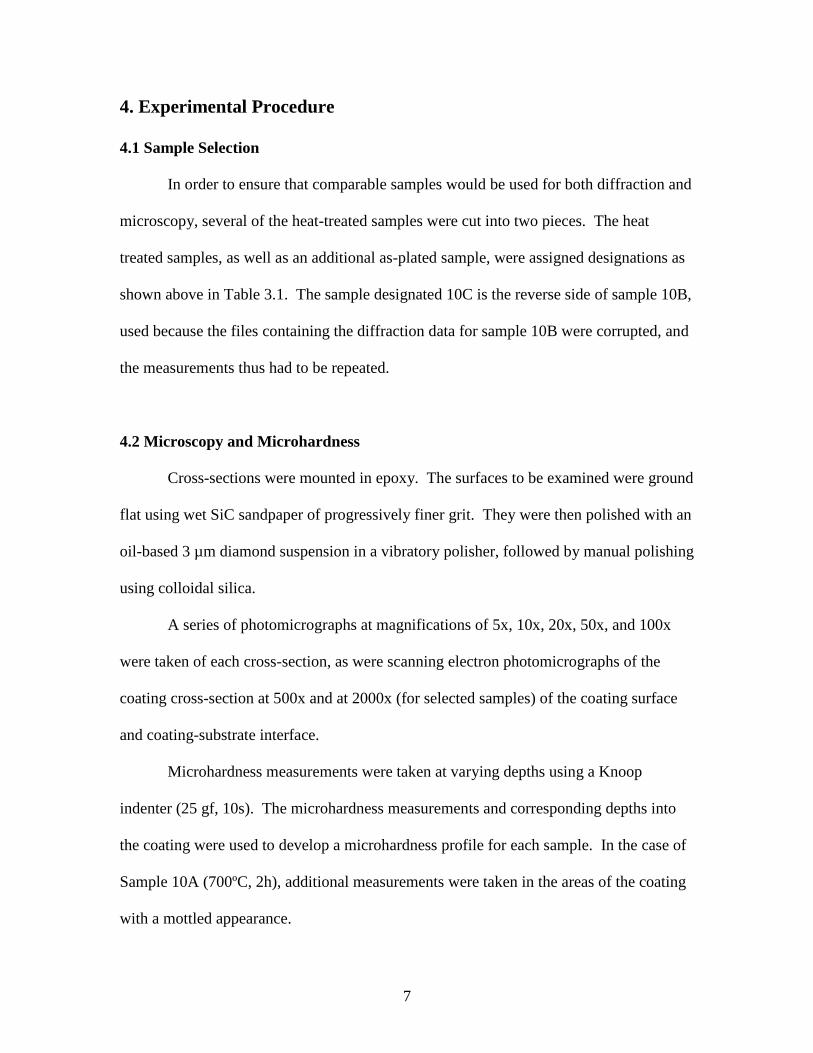
Sample Position Quench
8 Between Water
11 Top Water
12 Top Air
13 Between Air
Table 3.2: Conditions for new heat-treatment tests.
Page 13
7
4. Experimental Procedure
4.1 Sample Selection
In order to ensure that comparable samples would be used for both diffraction and
microscopy, several of the heat-treated samples were cut into two pieces. The heat
treated samples, as well as an additional as-plated sample, were assigned designations as
shown above in Table 3.1. The sample designated 10C is the reverse side of sample 10B,
used because the files containing the diffraction data for sample 10B were corrupted, and
the measurements thus had to be repeated.
4.2 Microscopy and Microhardness
Cross-sections were mounted in epoxy. The surfaces to be examined were ground
flat using wet SiC sandpaper of progressively finer grit. They were then polished with an
oil-based 3 µm diamond suspension in a vibratory polisher, followed by manual polishing
using colloidal silica.
A series of photomicrographs at magnifications of 5x, 10x, 20x, 50x, and 100x
were taken of each cross-section, as were scanning electron photomicrographs of the
coating cross-section at 500x and at 2000x (for selected samples) of the coating surface
and coating-substrate interface.
Microhardness measurements were taken at varying depths using a Knoop
indenter (25 gf, 10s). The microhardness measurements and corresponding depths into
the coating were used to develop a microhardness profile for each sample. In the case of
Sample 10A (700ºC, 2h), additional measurements were taken in the areas of the coating
with a mottled appearance.
Page 14
8
4.3 X-Ray Diffraction
XRD was conducted at the coating surface. The sample was then carefully
ground parallel to the surface to remove approximately 3-10 µm of the coating per grind,
with XRD conducted at each depth. The results were, after background subtraction,
analyzed by the direct comparison method to determine the relative volume fraction of all
crystalline phases present. These data, along with the associated depth measurements,
were used to generate a phase composition profile of each sample.
4.4 Heat Treatment and Oxidation
To examine whether the boron in the coating formed a solid oxide during heat
treatment, four untreated samples were mounted as diffraction samples, and ground
smooth using 600 grit SiC sandpaper. The mountings were then removed, and the
samples were cleaned, photographed, and weighed. For the designations of these
samples and the specific conditions of their heat treatments, see Table 3.2. All heat
treatments were carried out at 800ºC for two hours.
In the heat-treatments of the original samples, a pair of stainless steel blocks were
stacked inside the furnace. After these blocks had come up to temperature, the samples
were placed between them, so that the samples would come up to temperature as quickly
as possible. At the end of the original heat-treatments, the samples were removed from
the furnace and immediately water-quenched. [2]
The first heat-treatment was designed to replicate the parameters of the original
heat-treatment as closely as possible. Two samples were used: One sample was placed
Page 15
9
between the blocks as in the original heat-treatment (indicated by “Between” in Table
Foo2), while the second was placed on top of the upper block (“Top”), with its smooth
face exposed to the air in the furnace, to allow for greater airflow over the surface being
investigated. Both samples were placed in the furnace at approximately 800 ºC for two
hours. They were then water-quenched, dried, photographed, and weighed.
Because of the possibility that any oxide(s) that had formed were water-soluble, a
second pair of samples was heat-treated. This heat-treatment followed the same
procedure as described above, except in that the samples were removed from the furnace
and allowed to air cool. As before, the samples were then photographed and weighed.
After the above experiments, the smooth surfaces of the four heat-treatment
samples were examined by X-ray diffraction, to identify the phases present.
4.5 Etching and EDS
Heat treatment sample 12 (800 ºC, 2h, air cool) was cut. Both halves were then
mounted in cross-section and polished (as described earlier).
Each half of Sample 12 was etched differently. Sample 12A was etched with
nital, in order to more clearly reveal the microstructure of the steel substrate. This was
done to investigate whether the substrate microstructure showed any effects from the heat
treatment and/or interaction with the coating. Selected areas of this sample were then
examined by optical microscopy. This sample was also examined by SEM, and EDS
spectra were taken at multiple locations across the substrate-coating interface. The
results were used to generate concentration profiles for iron and nickel in the interface
region of the sample.
Page 16
10
To display the microstructure of the coating, Kalling’s waterless (also known as
Kalling’s #2) reagent was used first to etch Sample 12B, but examination by SEM
showed that the results were not satisfactory. The nitric/acetic acid solution used by
Longabucco and Nowill [2] was then applied to the cleaned sample, which produced
more satisfactory results.
Page 17
11
5. Results and Discussion
5.1 Microscopy
5.1.1 Photomicroscopy
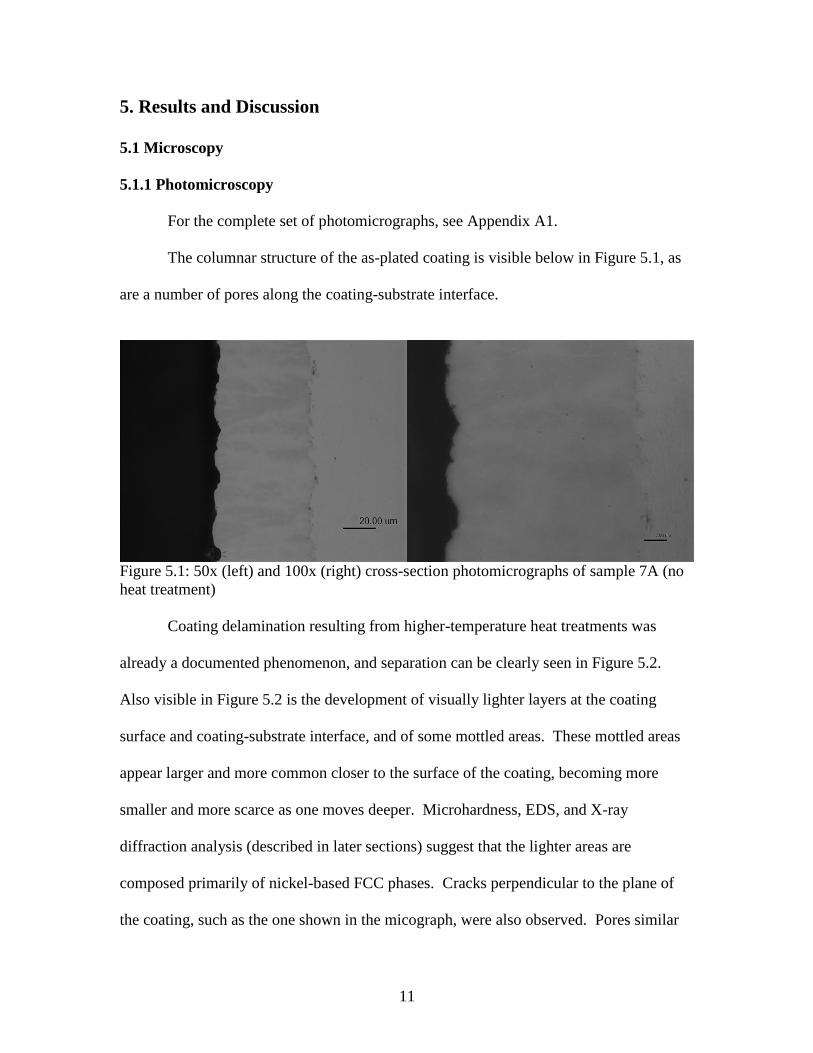
For the complete set of photomicrographs, see Appendix A1.
The columnar structure of the as-plated coating is visible below in Figure 5.1, as
are a number of pores along the coating-substrate interface.
Figure 5.1: 50x (left) and 100x (right) cross-section photomicrographs of sample 7A (no
heat treatment)
Coating delamination resulting from higher-temperature heat treatments was
already a documented phenomenon, and separation can be clearly seen in Figure 5.2.
Also visible in Figure 5.2 is the development of visually lighter layers at the coating
surface and coating-substrate interface, and of some mottled areas. These mottled areas
appear larger and more common closer to the surface of the coating, becoming more
smaller and more scarce as one moves deeper. Microhardness, EDS, and X-ray
diffraction analysis (described in later sections) suggest that the lighter areas are
composed primarily of nickel-based FCC phases. Cracks perpendicular to the plane of
the coating, such as the one shown in the micograph, were also observed. Pores similar
Page 18
12
to those observed at the substrate-coating interface can be seen within the lighter
interdiffusion layer.
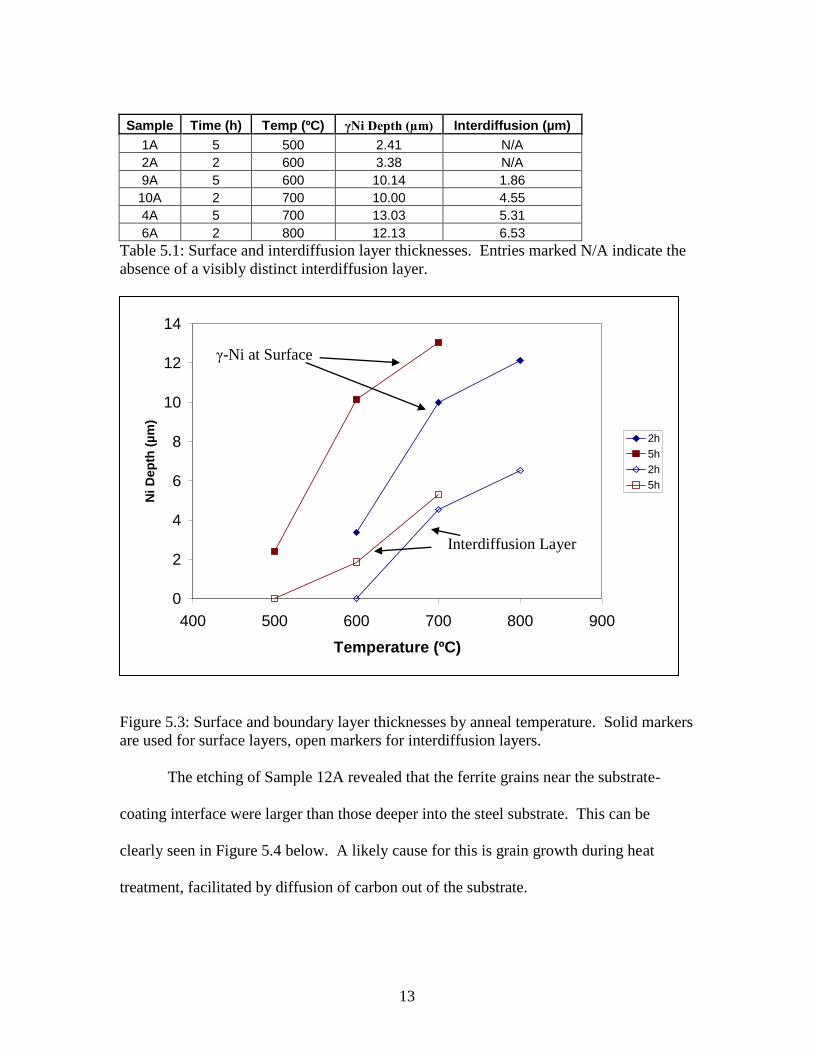
The thickness of the surface and interdiffusion layers was measured for each
sample. These measurements are summed up in Figure 5.3. As would be expected,
thickness of both the surface and interdiffusion layers increases with both temperature
and duration of heat treatment. Interdiffusion layer thickness is given as zero where no
interdiffusion layer was visible or measurable in photomicrographs.
Figure 5.2: 50x photomicrograph of the cross-section of sample 6A (2 hours at 800 ºC)
showing delamination (marker "A"), cracking (B), lighter surface layer (C), lighter
interdiffusion layer (D), and mottled areas (E)
Page 19
13
Sample Time (h) Temp (ºC) γNi Depth (µm) Interdiffusion (µm)
1A 5 500 2.41 N/A
2A 2 600 3.38 N/A
9A 5 600 10.14 1.86
10A 2 700 10.00 4.55
4A 5 700 13.03 5.31
6A 2 800 12.13 6.53
Table 5.1: Surface and interdiffusion layer thicknesses. Entries marked N/A indicate the
absence of a visibly distinct interdiffusion layer.
Figure 5.3: Surface and boundary layer thicknesses by anneal temperature. Solid markers
are used for surface layers, open markers for interdiffusion layers.
The etching of Sample 12A revealed that the ferrite grains near the substrate-
coating interface were larger than those deeper into the steel substrate. This can be
clearly seen in Figure 5.4 below. A likely cause for this is grain growth during heat
treatment, facilitated by diffusion of carbon out of the substrate.
0
2
4
6
8
10
12
14
400 500 600 700 800 900
Temperature (ºC)
Ni
Dep
th (
µm
)
2h
5h
2h
5h
γ-Ni at Surface
Interdiffusion Layer
Page 20
14
Figure 5.4: Photomicrograph of Sample 12A after etching, showing enlarged ferrite
grains (immediately to the right of the interdiffusion layer) in the substrate. 100x
magnification.
5.1.2 Scanning Electron Microscopy and EDS
For a complete set of scanning electron photomicrographs and EDS spectra, see
Appendix A2.
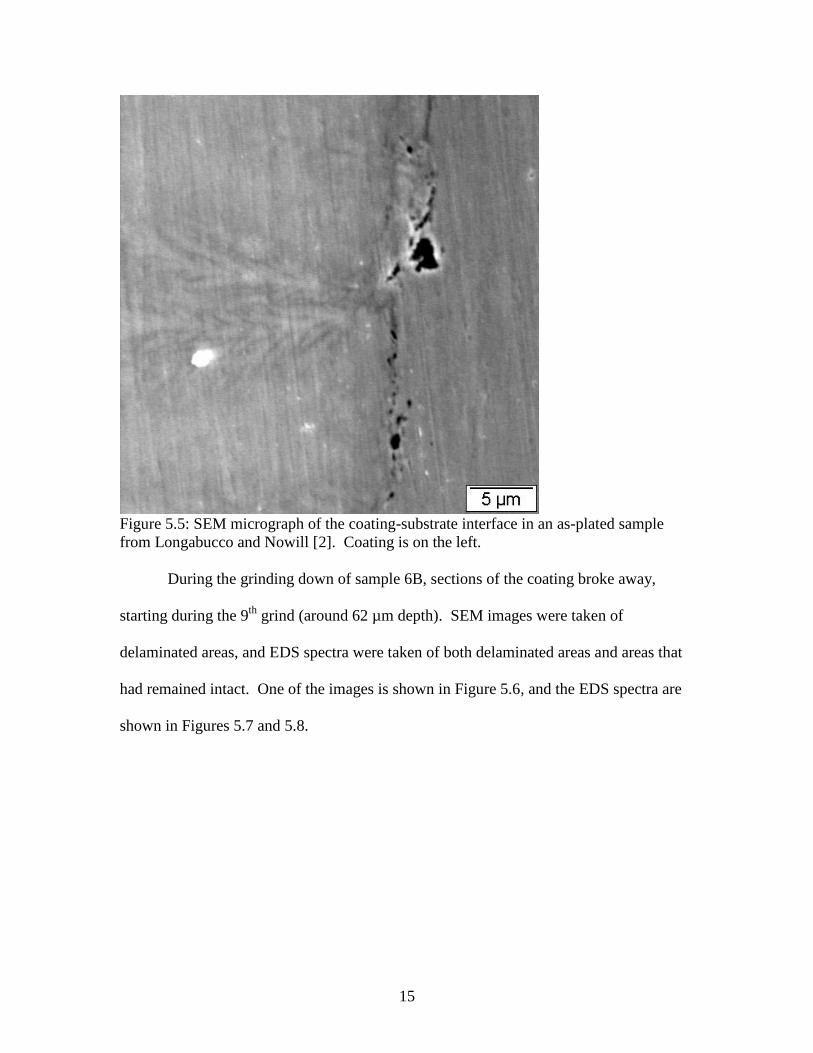
A closer image of pores at the coating-substrate interface in an as-plated sample is
shown in Figure 5.5 below. This image also shows the as-plated structure of the coating
in more detail.
Page 21
15
Figure 5.5: SEM micrograph of the coating-substrate interface in an as-plated sample
from Longabucco and Nowill [2]. Coating is on the left.
During the grinding down of sample 6B, sections of the coating broke away,
starting during the 9th
grind (around 62 µm depth). SEM images were taken of
delaminated areas, and EDS spectra were taken of both delaminated areas and areas that
had remained intact. One of the images is shown in Figure 5.6, and the EDS spectra are
shown in Figures 5.7 and 5.8.
Page 22
16
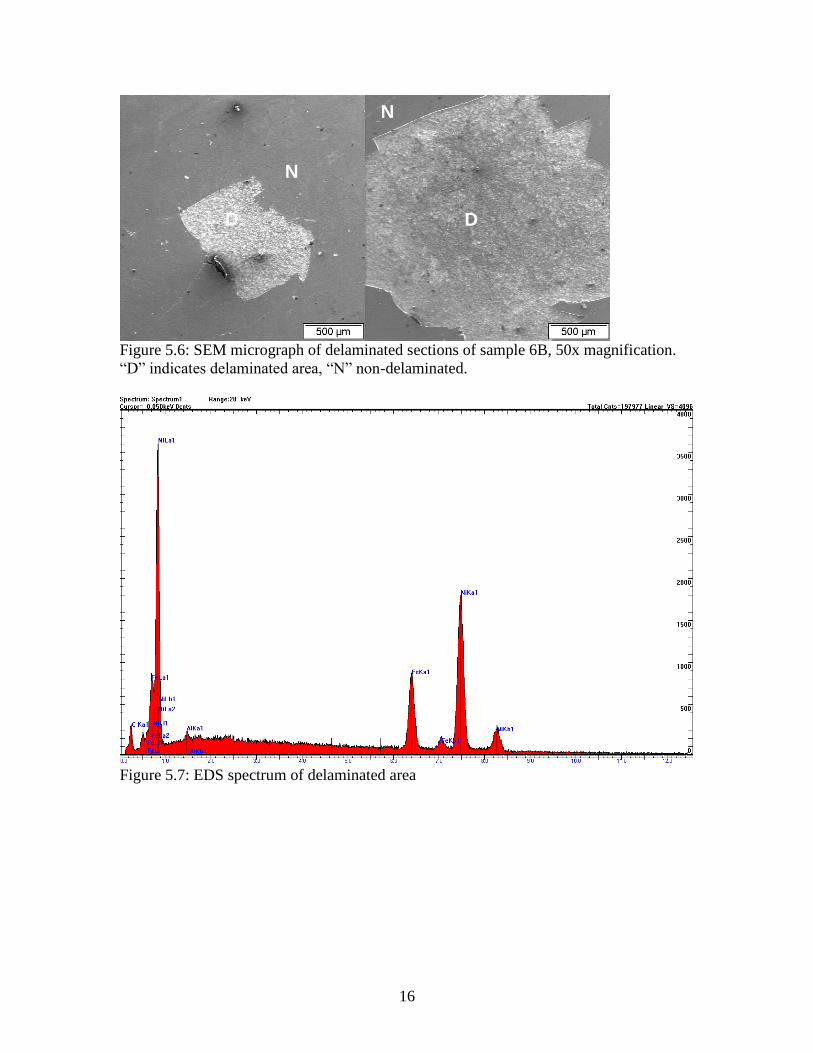
Figure 5.6: SEM micrograph of delaminated sections of sample 6B, 50x magnification.
“D” indicates delaminated area, “N” non-delaminated.
Figure 5.7: EDS spectrum of delaminated area
D D
N
N
Page 23
17
Figure 5.8: EDS spectrum of non-delaminated area
The spectrum of the non-delaminated area of the coating shows only nickel peaks.
This is consistent with the XRD and other results, all of which show that at this depth, the
only phases present should be γ-Ni and Ni3B. Because boron is not detectable by EDS,
the only element detected should be, and is, nickel.
In contrast, the EDS spectrum of the delaminated area shows both iron and nickel,
indicating that failure has occurred within the Fe-Ni interdiffusion zone. Figure 5.2
shows failure occurring at the outward edge of the interdiffusion layer. This suggests that
the interdiffusion layer is composed of a Fe-Ni alloy.
Shown in Figure 5.9 are the relative concentrations of iron and nickel plotted in
front of an SEM image of Sample 12A with the position of each EDS spot marked. One
notable feature in this image is that point H, in the most heavily-etched area, is the first to
show pure iron, as would be expected.
Page 24
18
Figure 5.9: Iron and nickel concentrations in the interdiffusion area of etched Sample
12A.
Page 25
19
5.2 Microhardness Profiles
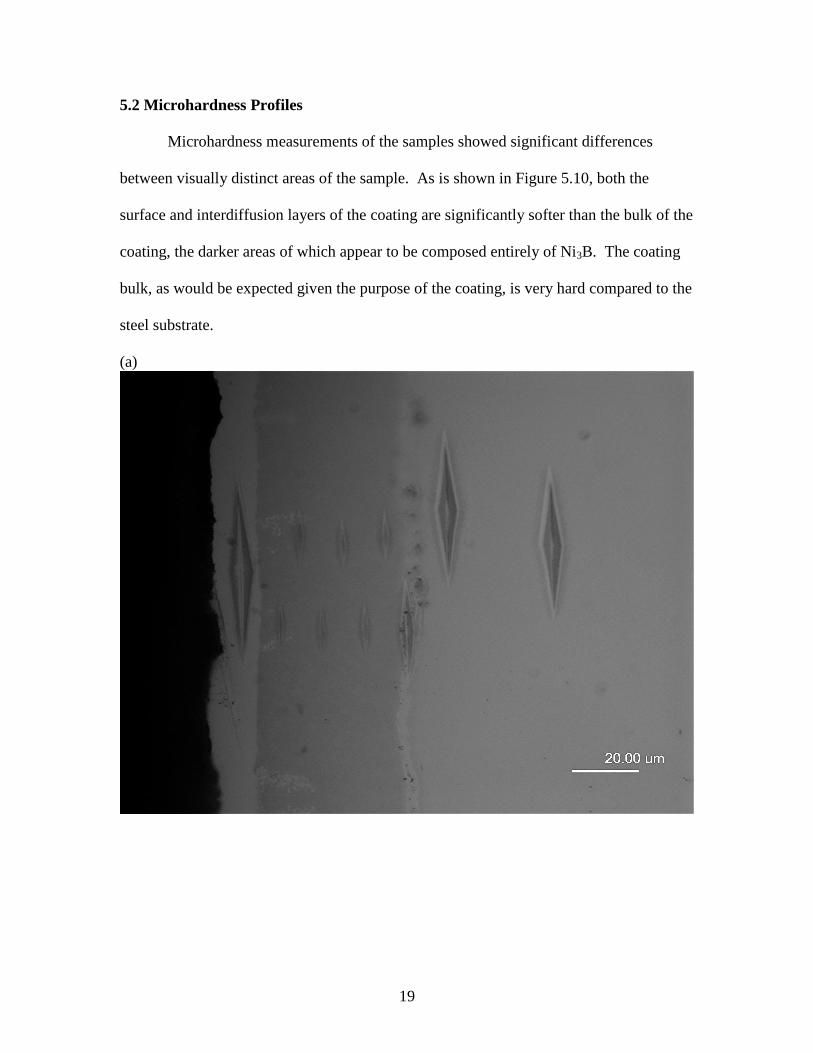
Microhardness measurements of the samples showed significant differences
between visually distinct areas of the sample. As is shown in Figure 5.10, both the
surface and interdiffusion layers of the coating are significantly softer than the bulk of the
coating, the darker areas of which appear to be composed entirely of Ni3B. The coating
bulk, as would be expected given the purpose of the coating, is very hard compared to the
steel substrate.
(a)
Page 26
20
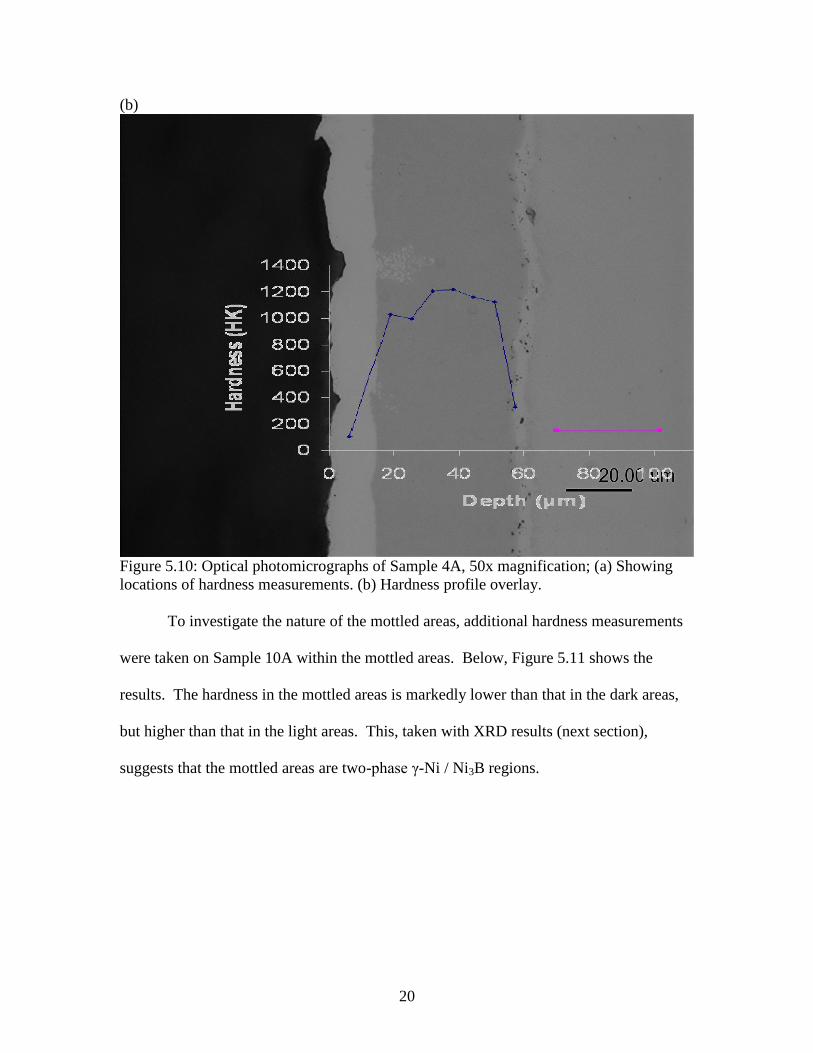
(b)
Figure 5.10: Optical photomicrographs of Sample 4A, 50x magnification; (a) Showing
locations of hardness measurements. (b) Hardness profile overlay.
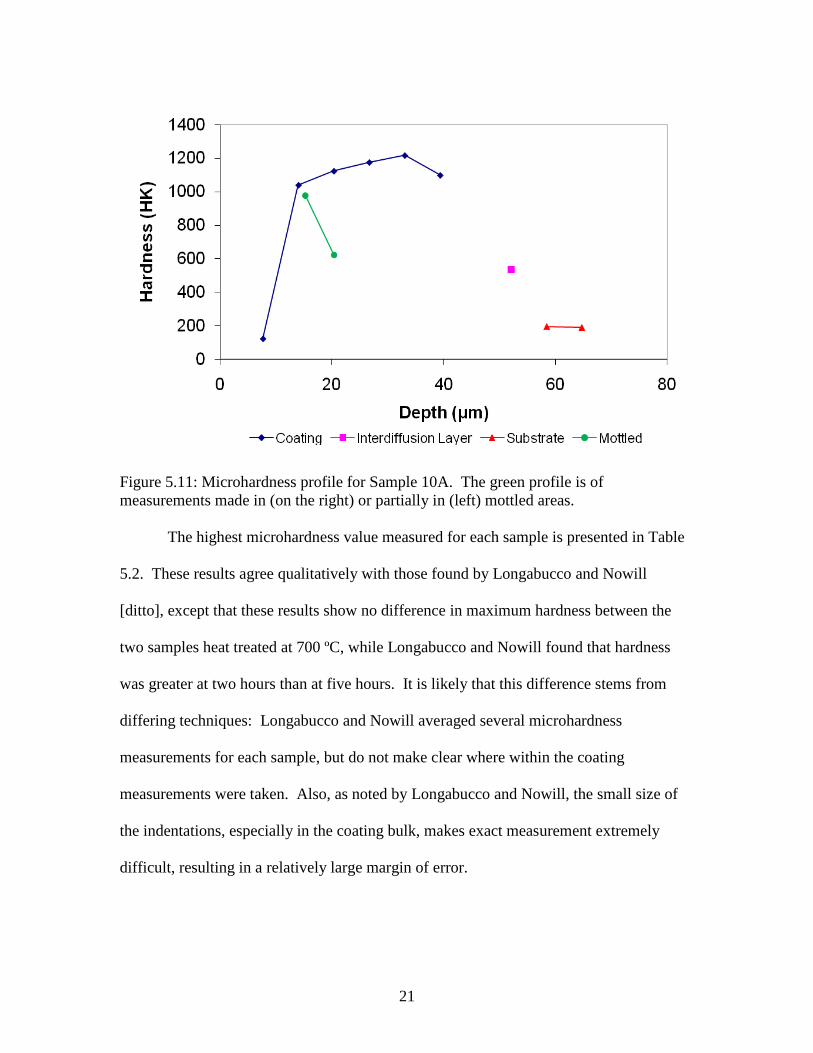
To investigate the nature of the mottled areas, additional hardness measurements
were taken on Sample 10A within the mottled areas. Below, Figure 5.11 shows the
results. The hardness in the mottled areas is markedly lower than that in the dark areas,
but higher than that in the light areas. This, taken with XRD results (next section),
suggests that the mottled areas are two-phase γ-Ni / Ni3B regions.
Page 27
21
Figure 5.11: Microhardness profile for Sample 10A. The green profile is of
measurements made in (on the right) or partially in (left) mottled areas.
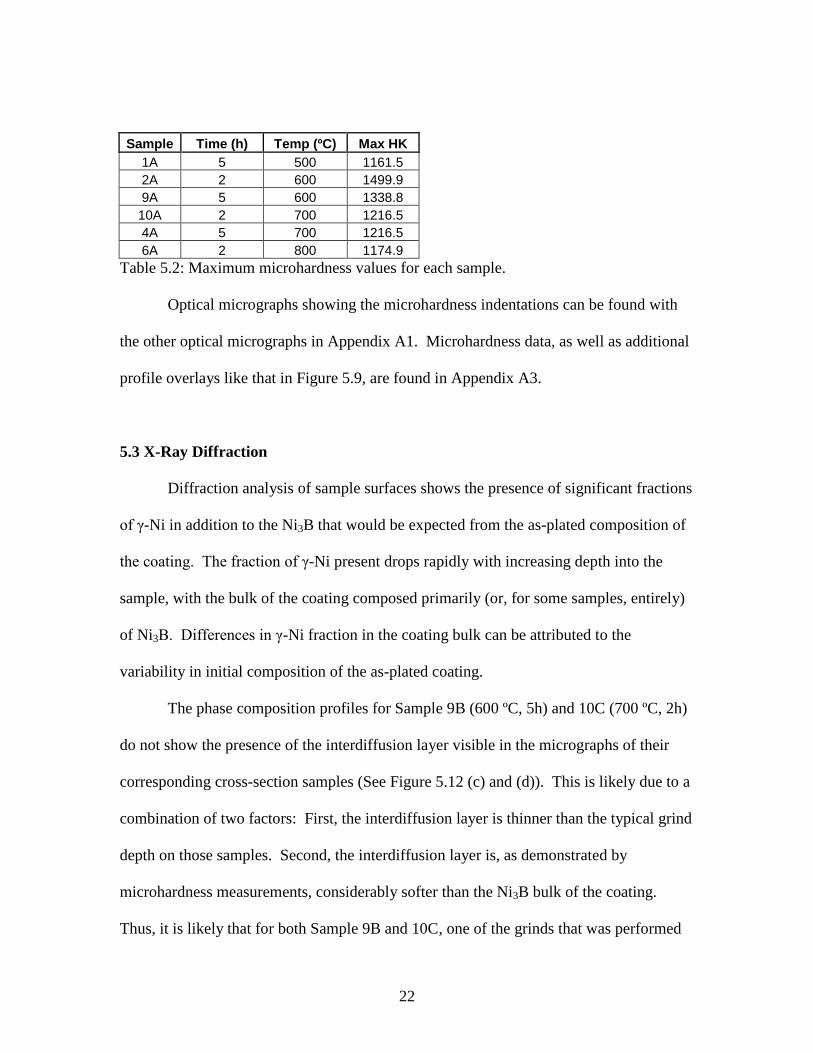
The highest microhardness value measured for each sample is presented in Table
5.2. These results agree qualitatively with those found by Longabucco and Nowill
[ditto], except that these results show no difference in maximum hardness between the
two samples heat treated at 700 ºC, while Longabucco and Nowill found that hardness
was greater at two hours than at five hours. It is likely that this difference stems from
differing techniques: Longabucco and Nowill averaged several microhardness
measurements for each sample, but do not make clear where within the coating
measurements were taken. Also, as noted by Longabucco and Nowill, the small size of
the indentations, especially in the coating bulk, makes exact measurement extremely
difficult, resulting in a relatively large margin of error.
Page 28
22
Sample Time (h) Temp (ºC) Max HK
1A 5 500 1161.5
2A 2 600 1499.9
9A 5 600 1338.8
10A 2 700 1216.5
4A 5 700 1216.5
6A 2 800 1174.9
Table 5.2: Maximum microhardness values for each sample.
Optical micrographs showing the microhardness indentations can be found with
the other optical micrographs in Appendix A1. Microhardness data, as well as additional
profile overlays like that in Figure 5.9, are found in Appendix A3.
5.3 X-Ray Diffraction
Diffraction analysis of sample surfaces shows the presence of significant fractions
of γ-Ni in addition to the Ni3B that would be expected from the as-plated composition of
the coating. The fraction of γ-Ni present drops rapidly with increasing depth into the
sample, with the bulk of the coating composed primarily (or, for some samples, entirely)
of Ni3B. Differences in γ-Ni fraction in the coating bulk can be attributed to the
variability in initial composition of the as-plated coating.
The phase composition profiles for Sample 9B (600 ºC, 5h) and 10C (700 ºC, 2h)
do not show the presence of the interdiffusion layer visible in the micrographs of their
corresponding cross-section samples (See Figure 5.12 (c) and (d)). This is likely due to a
combination of two factors: First, the interdiffusion layer is thinner than the typical grind
depth on those samples. Second, the interdiffusion layer is, as demonstrated by
microhardness measurements, considerably softer than the Ni3B bulk of the coating.
Thus, it is likely that for both Sample 9B and 10C, one of the grinds that was performed
Page 29
23
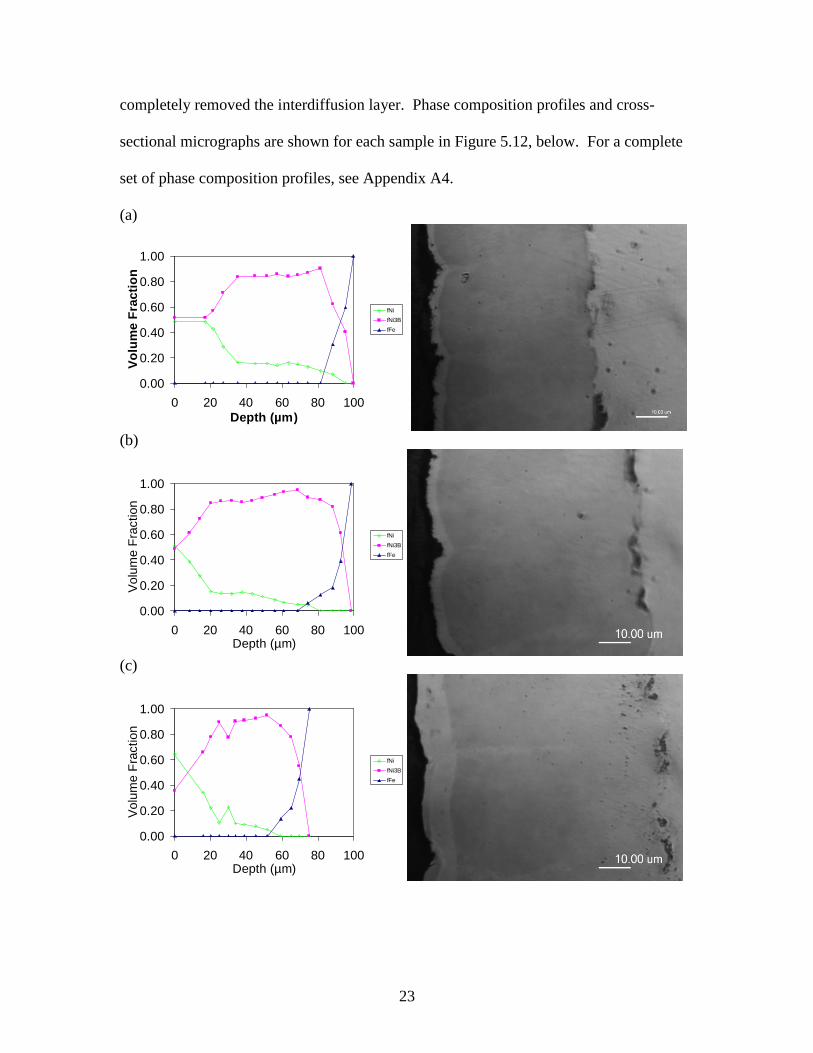
completely removed the interdiffusion layer. Phase composition profiles and cross-
sectional micrographs are shown for each sample in Figure 5.12, below. For a complete
set of phase composition profiles, see Appendix A4.
(a)
0.00
0.20
0.40
0.60
0.80
1.00
0 20 40 60 80 100
Depth (µm)
Vo
lum
e F
rac
tio
n
fNi
fNi3B
fFe
(b)
0.00
0.20
0.40
0.60
0.80
1.00
0 20 40 60 80 100Depth (µm)
Volu
me F
raction
fNi
fNi3B
fFe
(c)
0.00
0.20
0.40
0.60
0.80
1.00
0 20 40 60 80 100Depth (µm)
Vo
lum
e F
ractio
n
fNi
fNi3B
fFe
Page 30
24
(d)
0.00
0.20
0.40
0.60
0.80
1.00
0 20 40 60 80 100Depth (µm)
Vo
lum
e F
ractio
n
fNi
fNi3B
fFe
(e)
0.00
0.20
0.40
0.60
0.80
1.00
0 20 40 60 80 100Depth (µm)
Volu
me F
raction
fNi
fNi3B
fFe
(f)
0.00
0.20
0.40
0.60
0.80
1.00
0 20 40 60 80 100Depth (µm)
Vo
lum
e F
ractio
n
fNi
fNi3B
fFe
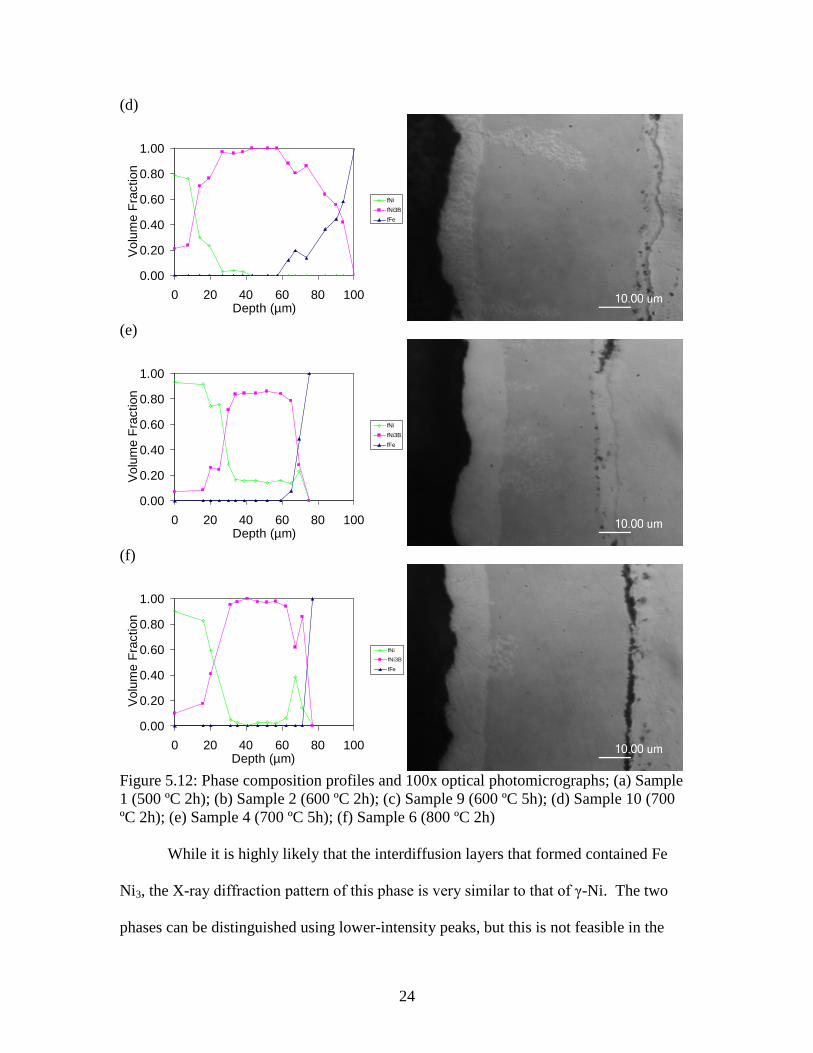
Figure 5.12: Phase composition profiles and 100x optical photomicrographs; (a) Sample
1 (500 ºC 2h); (b) Sample 2 (600 ºC 2h); (c) Sample 9 (600 ºC 5h); (d) Sample 10 (700
ºC 2h); (e) Sample 4 (700 ºC 5h); (f) Sample 6 (800 ºC 2h)
While it is highly likely that the interdiffusion layers that formed contained Fe
Ni3, the X-ray diffraction pattern of this phase is very similar to that of γ-Ni. The two
phases can be distinguished using lower-intensity peaks, but this is not feasible in the
Page 31
25
current study, as the relative intensity of background noise is very high on many of the
later XRD scans.
5.4 Heat Treatment and Oxidation
The weight before and after heat treatment for each sample is shown below in
Table 5.3. Both water-quenched samples showed a net weight loss, whereas both air-
cooled samples showed a net weight gain. This is consistent with the hypothesis that a
layer of solid B2O3 forms on the sample surface during annealing and is then dissolved
away during the water quench.
Sample Position Quench Wt. Before Wt. After Change
8 Between Water 3.9163 g 3.9072 g -9.1 mg
11 Top Water 3.7178 g 3.7093 g -8.5 mg
12 Top Air 2.6195 g 2.6295 g +10 mg
13 Between Air 3.6749 g 3.6840 g +9.1 mg
Table 5.3: Weight measurements and weight differences before and after heat treatment
All heat treatment samples were observed, after annealing, to have a rougher
surface on the side which had previously been ground smooth. Potential contributing
factors are plastic deformation caused by the crystallization of the coating and the
formation of a solid B2O3 layer. However, the uniformity of appearance between the
water-quenched and air-cooled samples suggests that the change in surface finish was not
due to the presence of B2O3 on the sample surface.
Cross-sectional microscopy of sample 12 showed a considerably thicker γ-Ni
surface layer on the side of the coating not in contact with the stainless steel block during
annealing, as shown below in Figure 5.13. Also of note is the absence of cracking
between coating and substrate on the left (block) side of the sample. The coating would
have cooled more slowly on this side of the sample, due to its greater thickness, and
would have cooled significantly more slowly than the coating on the water-quenched
Page 32
26
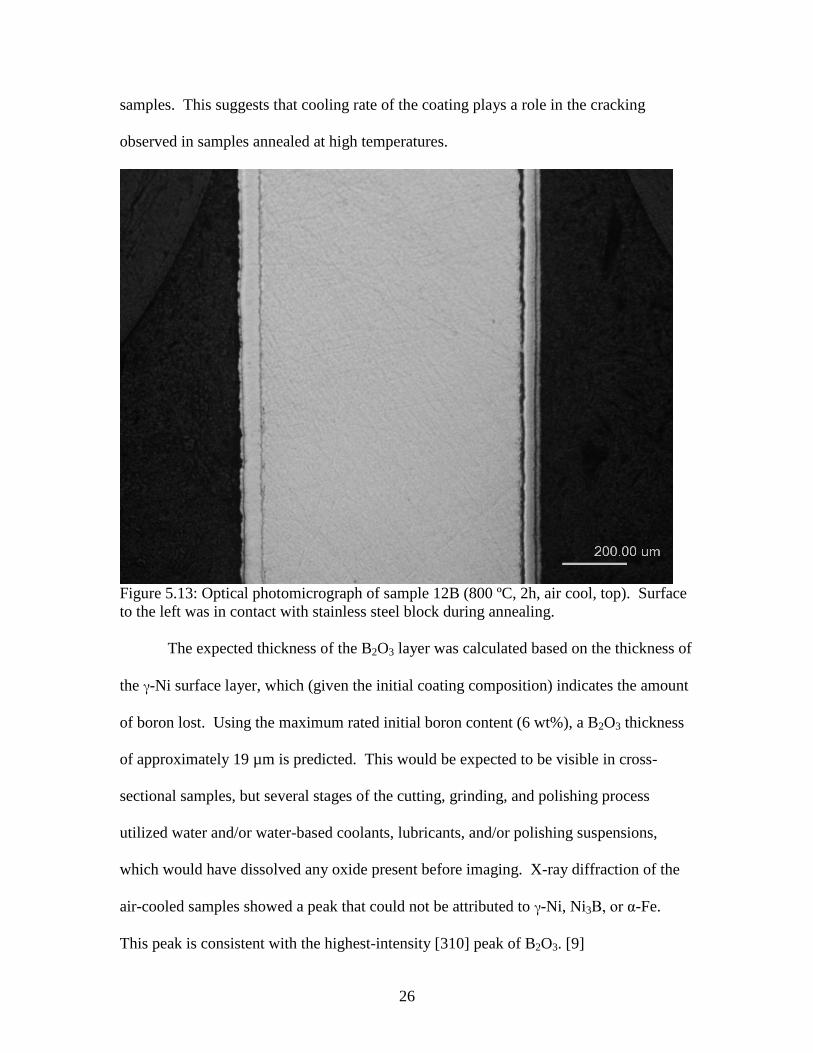
samples. This suggests that cooling rate of the coating plays a role in the cracking
observed in samples annealed at high temperatures.
Figure 5.13: Optical photomicrograph of sample 12B (800 ºC, 2h, air cool, top). Surface
to the left was in contact with stainless steel block during annealing.
The expected thickness of the B2O3 layer was calculated based on the thickness of
the γ-Ni surface layer, which (given the initial coating composition) indicates the amount
of boron lost. Using the maximum rated initial boron content (6 wt%), a B2O3 thickness
of approximately 19 µm is predicted. This would be expected to be visible in cross-
sectional samples, but several stages of the cutting, grinding, and polishing process
utilized water and/or water-based coolants, lubricants, and/or polishing suspensions,
which would have dissolved any oxide present before imaging. X-ray diffraction of the
air-cooled samples showed a peak that could not be attributed to γ-Ni, Ni3B, or α-Fe.
This peak is consistent with the highest-intensity [310] peak of B2O3. [9]
Page 33
27
6. Conclusions
During annealing, boron near the surface of the coating oxidizes to form B2O3(s).
This results in the formation of a soft layer of γ-Ni at the sample surface.
The bulk of the coating after heat treatment is composed either primarily of Ni3B,
depending on the exact as-plated composition of the sample. Uneven distribution of
boron in the as-plated coating may result in two-phase regions of γ-Ni and Ni3Fe after
annealing.
Iron-nickel diffusion between the coating and substrate during annealing leads to
the development of a interdiffusion layer composed of Ni3Fe and α-Fe. The porosity at
this depth observed in previous research and attributed to Kirkendall porosity appears to
be due at least in part to incomplete contact between coating and substrate prior to heat
treatment.
Rapid cooling of samples annealed at higher temperatures (800 ºC and above) is a
significant factor in cracking and subsequent failure of the coating observed in this work
and coating failure reported in previous work.
Page 34
28
7. Suggestions for Future Research
The roughness of the as-plated sample surfaces (and resultant roughness after heat
treatment) presented a difficulty when comparing diffraction data to micrographs, as it
made the exact location of the sample surface ambiguous. For this reason, it is
recommended that future studies grind smooth the coating surface prior to heat treatment,
in order to reduce the roughness of treated samples. In addition, care should be taken to
remove any burrs or other localized deformation caused by sectioning of samples, as
these can interfere with some measurements and prevent the sample from laying flat.
If possible, a method of sectioning and polishing cross sections of air-cooled
samples without the use of water, so that the B2O3 layer can be examined by microscopy.
More detailed study of phase distribution within the coating is suggested. A more
precise method of removing material from the sample is desirable, especially one which
ensures that the new surface generated by material removal is flat and parallel to the
previous surface. Also preferable is a more precise method of measuring the amount of
material removed, in order to more reliably determine the depth within the coating at
which examination is taking place.
Because stainless steel blocks were placed in direct contact with the sample
surface during heat treatment, the possibility exists that diffusion may occur between
these blocks and the sample. Tests should be performed with a known block
composition, examining both contact and non-contact areas before and after heat
treatment. If possible, these results should be compared to those generated using samples
that will not experience sample-block diffusion, controlling for surface finish, to account
Page 35
29
for the possibility that the sample simply impedes furnace atmosphere from reaching the
contact area of the block.
Additional study should be done to quantify the extent of Fe-Ni diffusion between
the coating and substrate, and to compare this to the degree of diffusion reported between
pure iron and nickel.
Page 36
30
8. Works Cited
[1] Riddle, Y.W., UCT Coatings, Inc. (2005) Nickel Boride (Ni3B) Plating
[2] Longabucco, Johnathan, and Nowill, Courtney. “Phase Transformations of Ni-B
Coating.” Major Qualifying Project. Worcester Polytechnic Inst, 2006.
[3] Delaunois, F., Lienard, P. “Heat treatments for electroless nickel-boron plating on
aluminum alloys.” Surface and Coatings Technology. 160 (2002): 239-248.
[4] Riddle, Y.W., Bailer, T.O. “Friction and Wear Reduction via and Ni-B
Electroless Bath Coating for Metal Alloys.” JOM (2005): 40-45.
[5] ASM Handbook. Volume 3, Alloy Phase Diagrams. 10th ed. 2000.
[6] Ustad, T. and Sørum. “Interdiffusion in the Fe-Ni, Ni-Co, and Fe-Co Systems.” Phys.
Stat. Sol. (a) 20 (1973): 285-294.
[7] Ganesan, V; Seetharaman, V.; and Raghunathan, V.S.. “Interdiffusion in the Nickel-
Iron System.” Materials Letters 4.2A (1984): 257-262.
[8] Wang, Yajun; Fan, Jingfu; and Trenary, Michael. “Surface Chemistry of Boron
Oxidation. 1. Reactions of Oxygen and Water with Boron Films Grown on
Ta(110).” Chemistry of Materials 5.2 (1993): 192-198.
[9] JCPDS Card File. Card # 6-0297.
Page 37
31
Appendix A1: Optical Microscopy
See file “Appendix A1.doc” on CD-ROM.
Page 38
32
Appendix A2: SEM and EDS
See file “Appendix A2.doc” on CD-ROM.
Page 39
33
Appendix A3: Microhardness Data and Overlays
See file “Appendix A3.doc” on CD-ROM.
Page 40
34
Appendix A4: XRD Phase-composition Profiles
See file “Appendix A4.doc” on CD-ROM