Page 1
The University of Manchester Research
Diffusion dominant solute transport modelling in fracturedmedia under deep geological environment
Link to publication record in Manchester Research Explorer
Citation for published version (APA):Jivkov, A., & Kwang, S. (2012). Diffusion dominant solute transport modelling in fractured media under deepgeological environment. In Waste Management 2012 (pp. 12211-12211)
Published in:Waste Management 2012
Citing this paperPlease note that where the full-text provided on Manchester Research Explorer is the Author Accepted Manuscriptor Proof version this may differ from the final Published version. If citing, it is advised that you check and use thepublisher's definitive version.
General rightsCopyright and moral rights for the publications made accessible in the Research Explorer are retained by theauthors and/or other copyright owners and it is a condition of accessing publications that users recognise andabide by the legal requirements associated with these rights.
Takedown policyIf you believe that this document breaches copyright please refer to the University of Manchester’s TakedownProcedures [http://man.ac.uk/04Y6Bo] or contact [email protected] providingrelevant details, so we can investigate your claim.
Download date:06. Feb. 2022
Page 2
WM2012 Conference, February 26 - March 1, 2012, Phoenix, Arizona, USA
1
Diffusion Dominant Solute Transport Modelling in Fractured Media
Under Deep Geological Environment – 12211
S. Kwong* and A.P. Jivkov
**
* National Nuclear Laboratory, UK.
** Research Centre for Radwaste and Decommissioning and Modelling and Simulation Centre, University of
Manchester, UK.
ABSTRACT
Deep geologic disposal of high activity and long-lived radioactive waste is gaining increasing support in many
countries, where suitable low permeability geological formation in combination with engineered barriers are
used to provide long term waste contaminant and minimise the impacts to the environment and risk to the
biosphere.
This modelling study examines the solute transport in fractured media under low flow velocities that are
relevant to a deep geological environment. In particular, reactive solute transport through fractured media is
studied using a 2-D model, that considers advection and diffusion, to explore the coupled effects of kinetic and
equilibrium chemical processes. The effects of water velocity in the fracture, matrix porosity and diffusion on
solute transport are investigated and discussed. Some illustrative modelled results are presented to
demonstrate the use of the model to examine the effects of media degradation on solute transport, under the
influences of hydrogeological (diffusion dominant) and microbially mediated chemical processes.
The challenges facing the prediction of long term degradation such as cracks evolution, interaction and
coalescence are highlighted. The potential of a novel microstructure informed modelling approach to account
for these effects is discussed, particularly with respect to investigating multiple phenomena impact on material
performance.
INTRODUCTION
Deep geologic disposal of high activity and long-lived radioactive waste is increasingly becoming the preferred
option in many countries, where suitable low permeability formation in saturated zone can be found to provide
effective long term waste contaminant with minimum impact to the environment and risk to the biosphere.
The use of a multi-barrier system, consisting of engineered barriers and a natural barrier by geological
formations, could further enhance the containment performance of the repository. By making use of the
defence-in-depth principle this helps to maximise the ability to contain the waste and isolate the facility from
external influences such as due to groundwater ingress, seismic events etc. A typical deep repository is likely
to be hundreds of metres below ground, with the waste sealed in durable containers that are surrounded by
low-permeability rock (or clay) barrier to prevent radioactive material leakage into the environment. In the
UK, ongoing studies are carried out to assess the merits of different repository concepts, while a programme
has been initiated to identify a suitable geological site for the management of high- and intermediate-level
radioactive wastes.
One of the main requirements for a suitable deep repository site is that the geological formation surrounding
the repository would ensure slow groundwater transport from the repository to the surface. In addition,
conditions that would favour geochemical and mineralogical processes to prevent and delay radionuclide
transport of dissolved species are also desirable. Further complications may arise as the chemically reactive
processes that occur in disposal facilities may be mediated by microbial processes that metabolise the variety
of chemical compounds present in transuranic and intermediate level wastes (TRU/ILW), together with organic
carbon and hydrogen present in the geological and engineered systems. When groundwater flow is very slow,
radionuclide transport dominated by diffusion and sorption, with the additional effects due to the diffusive
Page 3
WM2012 Conference, February 26 - March 1, 2012, Phoenix, Arizona, USA
2
transport of reactive species that also leads to chemical zonation around waste packages which could provide
additional containment of radionuclides.
As the deep repository system is subjected to a variety of thermo-hydro-chemo-mechanical (THCM) effects
over the long 'operational' lifespan, the integrity of the barrier system will decrease over time (e.g. fracturing,
corrosion, mineral dissolution etc). It is important that these effects are taken into account when assessing the
long-term performance of the repository. Numerical models of groundwater flow, solute transport and
chemical processes offer a viable and cost effective means to study the long term evolution of site condition,
and aid understanding of the behaviour and mobility of the contaminants.
The work presented here demonstrates the use of the GRM code [1] to modelling the effects of media
degradation under the influences of hydrogeological (diffusion dominant) and microbially mediated chemical
effects in geological systems with low groundwater flows for deep geological disposal systems.
In addition, ongoing work on microstructure-informed modelling approaches is presented. This aims to bridge
the gap between the length scale dictated by the defects in typical repository materials and the continuum scale,
thus providing mechanistic understanding of macroscopic parameters, such as permeability and diffusivity, and
their evolution. For the purpose of discussion, permeability is used to illustrate the modelling concepts in this
paper.
OVERVIEW OF THE GRM CODE
The GRM (Generalised Repository Model) is a computer code [1], originally developed by the Research and
Technology department of BNFL (now the National Nuclear Laboratory), to model the long term chemical
evolution of both the near surface and deep disposal facilities. GRM is a biogeochemical reactive-transport
model that considers kinetic controlled corrosion1 and microbiological reactions together with equilibrium
chemical speciation and mineral reaction. GRM includes a comprehensive set of microbial mediated aerobic
and anaerobic kinetic controlled processes that utilise commonly occurring substrates and electron donors and
acceptors. GRM models a number of microbial processes, represented by a Michaelis–Menton kinetic
formulation [2], including aerobic metabolism; denitrification; fermentation; iron reduction; sulphate
reduction; acetogenesis and methanogenesis.
The extent of these microbial processes is determined by input kinetic constants and the concentration of the
metabolic substrates. The current microbial data set has been compiled for studies of low level waste [3]. Both
organic carbon and hydrogen (H2) can be utilised as electron donors for the above processes. The corrosion
module can consider processes of aerobic and anaerobic corrosion. The later anaerobic process is of prime
relevance to geological disposal, where it contributes H2 electron donor for the above microbial processes.
Iron corrosion products also have the potential to control redox potential. Based on the extent of the microbial
processes the GRM selects and calculates redox potential (Eh) for a number of redox couples [3] including:
oxygen, O2 / H2O; nitrate NO3- / N2; iron Fe(III)/Fe(II); sulphur SO4
2- / HS; methane CO2 / CH4 and
fermentation CH2O / CH3COOH + H2.
Using the determined Eh calculated by the kinetic module, the chemical module performs an equilibrium
speciation calculation that considers the dissolution and precipitation reactions of minerals and radionuclides
and determines pH by charge balance.
The GRM computer code utilises a two-dimensional finite difference approach to consider transport in
saturated groundwater. The GRM model also allows species transport from the unsaturated zone to the
saturated zone via a release coefficient model, although this is less relevant for deep geological disposal
applications.
1 The primary degradation processes considered in the GRM include cellulose hydrolysis and steel corrosion,
although cellulose hydrolysis and the associated gas generation often relates to near surface repository rather than
deep geological disposals.
Page 4
WM2012 Conference, February 26 - March 1, 2012, Phoenix, Arizona, USA
3
GRM uses a finite difference approach, evolving the system through a sequence of time steps. Due to the wide
variety of processes modelled and different time scales involved, GRM uses three main modules to handle the
microbial, transport and chemical aspects in sequence.
Reference [1] gives more details of the full suite of microbiological processes, chemical speciation, mineral
reaction, including radionuclide solubility and sorption. Reference [4] documents details of a wide range of
test cases which have been designed to test the extensive capabilities of the GRM program.
ILLUSTRATIVE MODEL OF A GEOLOGICAL WASTE DISPOSAL PACKAGE
An illustrative two-dimensional reactive transport model has been previously developed [5] to examine the
coupled effects of a geological waste disposal package between;
diffusive and advective transport;
kinetic controlled microbial processes; and
equilibrium chemical speciation, mineral and radionuclide dissolution and precipitation.
The present study investigates further the effect of medium degradation on solute transport for such a waste
package. The model can be considered to represent a generic case relevant to geological disposal of TRU/ILW
where a disposal waste package containing contaminants (uranium) and other multivalent reactive species
(iron, sulphate, nitrate) are enclosed in a highly impermeable but reactive medium and where diffusion is the
main transport mechanism. Iron is in the form of Fe(II) and represents corrosion products present in waste and
containers used. The effect of a sealed waste package container (to physically isolate the waste) is not
considered in this scenario. The present model therefore examines the effects that may develop after any such
containment is breached. The model examines how the evolving chemical conditions of the repository and
diffusive properties of the waste and enclosing medium may affect the containment/mobility of the uranium,
when the effect of medium degradation is also considered. The enclosing medium has neutral pH and may
represent a low permeability enclosing medium, such as clay or backfill. Along a boundary of the model is an
advective transport pathway, which can be considered to represent features such as fractures present in the
containment medium. Groundwater that saturates the waste package contains organic matter, and it is assumed
that the containment medium of the disposal facility and other engineering maintain reducing conditions
external to the waste package. These strongly reducing conditions are represented by the partial pressure of
hydrogen (0.99 atm H2) in the model.
The model is configured in a 2-dimensional array of 20 x 20 cells (Fig. 1) where a single row of 20 cells
represents an advective region and 19 adjacent rows of 20 cells represent the diffusive zone (no advective
flow) including an area of waste source with kinetic release over time. The model considers an area of 5m by
0.48m. The advective row has a width of 0.1m while the remaining 19 rows representing the diffusive regions
are of 0.02m width.
The main diffusive region of interest is within the 19 rows over a width of 0.38m (38cm), including the waste
region and enclosing medium. Note that the width (or breadth) of the diffusive region is exaggerated in the
figures. A groundwater flow rates of 10 ml/day was considered in the advective region. In the diffusive region
of the waste and enclosing medium an effective diffusion coefficient of 1.0E-11 m2/s and a porosity of 0.15
were considered. Other modelling studies of diffusion in the low permeability clay have considered similar
diffusion coefficient values [6].
The waste region (shaded red/purple in Fig. 1) contains uranium at a concentration of 1.0E-03 mol/l of pore
fluid. The presence of Fe(II) corrosion products in the form of FeCO3 are considered in the waste. The model
also considers that reactive chemical species nitrate and sulphate are present in the TRU/ILW waste in the two
regions: region 1 (shaded purple) has concentration of 5.0E-3 mol/l NO3- while region 2 (shaded red) has a
lower concentration of 1.0E-3 mol/l. The sulphate concentration in both regions is 1.0E-3 mol/l. Chloride is
also present in the waste at a concentration of 1.1E-1 mol/l in region 1 or 1.5E-1 mol/l in region 2 (to balance
Page 5
WM2012 Conference, February 26 - March 1, 2012, Phoenix, Arizona, USA
4
the nitrate) to provide charge balance to compensate for the additional nitrate in region 1. Chloride is not
reactive in the model.
The enclosing diffusive medium (clay) is represented by the calcium and iron containing carbonates (calcite,
siderite), which is defined by a partial pressure of carbon dioxide (1.45E-2 atm CO2) that buffers pH to near
neutral conditions. Sulphate minerals present in the clay (gypsum, celesite) similarly control the sulphate
concentration in groundwater that saturates the clay. The groundwater that saturates the waste and enclosing
clay also contains dissolved organic matter, which in the GRM is represented by an acetate concentration of
9.2E-5 mol/l.
The GRM model was run to simulate a period of 100 years of reaction and diffusion.
Fig. 1. Schematic illustration of the GRM reactive transport (advection and diffusion) application model [5].
RESULTS AND DISCUSSIONS
The GRM code is used to model an illustrative geological waste disposal package to examine the combined
effect of kinetic biogeochemical processes and diffusive dominant transport, under the influence of media
degradation and fracture.
Baseline Case
With the initial conditions described above, the system representing a TRU/ILW waste package was modelled
for a period of 100 years. Fig. 2 presents summary outputs at the end of the simulation period [5]. Fig. 2a
illustrates the diffusive behaviour of chloride, which is both non reactive and non-sorbing. Chloride presents
in the waste region (purple region in the figure) diffuses away from the source, such that after 100 years the
peak concentration reduces to 4e-2 mol/l (i.e. about 0.88 of the initial maximum concentration in the waste
region). The remaining figures illustrate the biogeochemical reactions occurring mediated by microbial
processes. The presence of nitrate in the waste results in its rapid reaction by denitrifying bacteria, which
utilise organic carbon, H2 and Fe(II) as electron donors. The oxidation of Fe(II) corrosion products results in
the formation of Fe(OH)3. (Fig. 2b), with the amount of Fe(OH)3 formed proportional to the nitrate content of
the waste.
The redox potential (Eh) determined by the kinetic routine is illustrated in Fig. 2c, which shows that the
oxidation of Fe(II) to Fe(III) in the waste to maintain a higher Eh at around -0.1 volts. It is observed that this
Page 6
WM2012 Conference, February 26 - March 1, 2012, Phoenix, Arizona, USA
5
oxidised zone extends into the adjacent clay by diffusion of species and the precipitation of Fe(OH)3, (Fig. 2b).
In the majority of the clay zone sulphate reduction occurs due to the dissolved organic matter input from
groundwater passing through the advective region that diffuses through the clay zone. Hydrogen present also
acts as an electron donor for sulphate reduction. More strongly reducing conditions are established at the inlet
of the advective fracture, where sulphate becomes totally reduced by the inflowing organic carbon. The
microbial biomass that results from these main reactions of the electron acceptors and donors present is
illustrated in Fig. 2d. Most microbial activity is seen to occur in the waste region and at the interface with the
clay zone. A further region of microbial activity occurs near the inlet of the advective region.
The resulting diffusive and chemical effect on uranium is illustrated in Fig. 2e and Fig. 2f. In the waste region
uranium is in the U(VI) oxidation state and has high solubility. Aqueous uranium becomes mobile and readily
diffuses from the waste. Under the sulphate reducing conditions established in the clay, uranium precipitates
as UO2(am) and thus the concentration of dissolved uranium falls significantly compared to that of the non-
reactive chloride species (Fig. 2a). The migration of uranium from the waste region is affected to a small
extent by the different nitrate contents of the waste in region 1 and region 2 (Fig. 1). Uranium is also
precipitated in the advective zone, where the very strongly reducing conditions are developed. The uranium
concentration exiting the advective zone is 1.63e-6 mol/l and is a factor of 0.03 lower than that of the
maximum concentration in the waste region. As a result of the chemical processes occurring, the concentration
gradient of uranium across the diffusion zone is about 30 times that of the non-reactive chloride species.
The effects of media degradation (e.g. fracture and media porosity changes) on solute transport relevant to the
long term prediction of containment performance are illustrated below. This highlights the need for a
mechanistic understanding and quantification of the macroscopic parameters and their evolution. The later
section "Microstructure-Informed Modelling" outlines an ongoing work on microstructure-informed modelling
approaches and concepts, and highlights its potential in supporting solute transport modelling that taking
account the effects of media degradation.
Page 7
WM2012 Conference, February 26 - March 1, 2012, Phoenix, Arizona, USA
6
0
0.5
1
1.5
2
2.5
3
3.5
4
4.5
0.01
0.05
0.09
0.13
0.17
0.21
0.25
0.29
0.33
0.37
0.0E+00
1.0E+00
2.0E+00
3.0E+00
4.0E+00
5.0E+00
6.0E+00
Biomass
Length, m
Breadth, m
0
0.5
1
1.5
2
2.5
3
3.5
4
4.5
0.01
0.07
0.13
0.19
0.25
0.31
0.37
3.5E-02
3.6E-02
3.7E-02
3.8E-02
3.9E-02
4.0E-02
4.1E-02
Cl mol/l
Length, m
Breadth, m
Advective flow
(a) Chloride non-reactive tracer
00.5
11.5
22.5
33.5
44.5
0.01
0.07
0.13
0.19
0.25
0.31
0.37
0.0E+00
5.0E-06
1.0E-05
1.5E-05
2.0E-05
2.5E-05
3.0E-05
3.5E-05
4.0E-05
4.5E-05
5.0E-05
U mol/l
Length, m
Breadth, m
(e) Aqueous uranium reactive species
0
0.5
1
1.5
2
2.5
3
3.5
4
4.5
0.01
0.05
0.09
0.13
0.17
0.21
0.25
0.29
0.33
0.37
1.0E-08
1.0E-07
1.0E-06
1.0E-05
1.0E-04
1.0E-03
U minerals mol/l
Length, m
Breadth, m
(f) Precipitated uranium, UO2 (am)
0
0.5 1
1.5
2
2.5
3
3.5
4
4.5
0.01
0.07
0.13
0.19
0.25
0.31
0.37
-0.5
-0.4
-0.4
-0.3
-0.3
-0.2
-0.2
-0.1
-0.1
0.0
Eh, V
Length, m
Breadth, m
(c) Redox potential (Eh)
Fe(II)/Fe(III) couple
SO42-/HS- couple
Fermentation
(H2) couple
(b) Fe(OH)3 formed
0
0.5
1
1.5
2
2.5
3
3.5
4
4.5
0.01
0.07
0.13
0.19
0.25
0.31
0.37
0.0E+00
5.0E-03
1.0E-02
1.5E-02
2.0E-02
2.5E-02
Fe(OH)3 mol/l
Length, m
Breadth, m
(d) Biomass
Low nitrate waste
Higher nitrate waste
0
0.5
1
1.5
2
2.5
3
3.5
4
4.5
0.01
0.05
0.09
0.13
0.17
0.21
0.25
0.29
0.33
0.37
0.0E+00
1.0E+00
2.0E+00
3.0E+00
4.0E+00
5.0E+00
6.0E+00
Biomass
Length, m
Breadth, m
0
0.5
1
1.5
2
2.5
3
3.5
4
4.5
0.01
0.07
0.13
0.19
0.25
0.31
0.37
3.5E-02
3.6E-02
3.7E-02
3.8E-02
3.9E-02
4.0E-02
4.1E-02
Cl mol/l
Length, m
Breadth, m
Advective flow
(a) Chloride non-reactive tracer
00.5
11.5
22.5
33.5
44.5
0.01
0.07
0.13
0.19
0.25
0.31
0.37
0.0E+00
5.0E-06
1.0E-05
1.5E-05
2.0E-05
2.5E-05
3.0E-05
3.5E-05
4.0E-05
4.5E-05
5.0E-05
U mol/l
Length, m
Breadth, m
(e) Aqueous uranium reactive species
0
0.5
1
1.5
2
2.5
3
3.5
4
4.5
0.01
0.05
0.09
0.13
0.17
0.21
0.25
0.29
0.33
0.37
1.0E-08
1.0E-07
1.0E-06
1.0E-05
1.0E-04
1.0E-03
U minerals mol/l
Length, m
Breadth, m
(f) Precipitated uranium, UO2 (am)
0
0.5 1
1.5
2
2.5
3
3.5
4
4.5
0.01
0.07
0.13
0.19
0.25
0.31
0.37
-0.5
-0.4
-0.4
-0.3
-0.3
-0.2
-0.2
-0.1
-0.1
0.0
Eh, V
Length, m
Breadth, m
(c) Redox potential (Eh)
Fe(II)/Fe(III) couple
SO42-/HS- couple
Fermentation
(H2) couple
(b) Fe(OH)3 formed
0
0.5
1
1.5
2
2.5
3
3.5
4
4.5
0.01
0.07
0.13
0.19
0.25
0.31
0.37
0.0E+00
5.0E-03
1.0E-02
1.5E-02
2.0E-02
2.5E-02
Fe(OH)3 mol/l
Length, m
Breadth, m
(d) Biomass
Low nitrate waste
Higher nitrate waste
Fig. 2. Baseline Case modelled results of an illustrative waste package in a geological repository after 100
years [5].
Page 8
WM2012 Conference, February 26 - March 1, 2012, Phoenix, Arizona, USA
7
Effect of water velocity in the fracture
The effect of fracture on solute transport is investigated by varying the advective flow in the fracture. This may
represent a situation over time where the advective flow increases in response to the development of cracking,
or a decrease in flow resulted from clogging of pore spaces due to precipitation actions. The non-reactive and
non-sorbing chloride clearly illustrates the potential influence of advective flow in the fracture. With low
water flow rate in the fracture, the peak chloride concentration in the waste region remains high and only
reduces slightly to 4.8e-2 mol/l (Fig. 3a). This relates to the reduced ‘flushing’ effect of the lower flow
(velocity) in the fracture, and leads to a lower concentration gradient (between the waste source and fracture
regions) and a reduced diffusive flux away from source. The effect of the higher flow in the fracture is evident
in Fig. 3b, showing chloride concentration at significantly reduced levels.
Most of the biomass (resulting from microbial activity) occurs in the waste region and is similar to the
Baseline case. The effect on biomass production is most significant near the inlet region where a strongly
reducing condition is established with increasing flow rate, (Fig. 3d). Fig. 3e and Fig. 3f show the computed
aqueous uranium for the low and high fracture flow rates respectively. While there is little effect on the mobile
species near the waste region, significant difference in aqueous uranium concentrations occur along the
fracture at a small distance from the inlet. This is closely related to the 'flushing' effect due to the flow in
fracture. Some effect on the aqueous uranium concentrations is apparent in a region adjacent to the fracture
due to changes in concentration gradient, in addition to the effect of uranium precipitation (Fig. 3g and Fig.
3h). For the case with higher advective flow the modelled result shows that uranium precipitates further
downstream in the fracture.
Effect of media porosity
The effect of porosity changes within the waste region is illustrated by varying the porosity and the effective
diffusion coefficient2 (DE)) of the media. Over the long time scale typical of geological disposal applications,
the porosity of the enclosing media may change over time as the pore spaces evolve under the influence of
various effects such as degradation due to chemical effects, corrosion or high level irradiation. Modelled
results are presented below for two situations: one with reduced porosity θ= 0.1 and DE= 5.8E-12 m2/s; the
other with an increased porosity θ= 0.2 and DE= 1.5E-11 m2/s. (this compares with θ= 0.15 and DE= 1.0E-11
m2/s for the Baseline Case).
The non-reactive chloride migrates away from the source region under the diffusive action only, where the
peak concentration decreases with increasing porosity due to the higher diffusive flux away from the source,
(Fig. 4a and Fig. 4b). Similar to the Baseline case, most of the biomass occurs in the waste region and adjacent
area (Fig. 4c and Fig. 4d), with an increase in porosity leading to a slight increase in biomass production in
these areas. The biomass area adjacent to the waste is also seen to spread over a slightly wider area for higher
porosity due to the enhanced diffusion rate. Biomass is also seen to occur near the fracture inlet region where
a strongly reducing condition is established. The effect of porosity change is negligible in this region as this is
dominated by the advective flow.
Fig. 4e to Fig. 4h show the effect of porosity change on uranium under the combined influence of diffusive and
chemical actions. It is interesting to note that the higher porosity case gives a higher peak aqueous uranium
concentration, Fig. 4f. This behaviour is in contrary to the situation for the non-reactive chloride, but can be
explained by the increasing chemical effect seen in the higher porosity case with increasing uranium
precipitation (Fig. 4h). This illustrates the complexity of solute transport behaviour that could occur in a waste
disposal facility, due to the interplay between kinetic biogeochemical processes, advection and diffusion.
2 In saturated conditions, the effective diffusion coefficient (DE) of a solute in a porous medium can be estimated
from the solute's diffusion coefficient in water (Do) using the so-called MQ model [7]: 3
4
oE DD ,where θ is the
porosity of the medium.
Page 9
WM2012 Conference, February 26 - March 1, 2012, Phoenix, Arizona, USA
8
0
0.5 1
1.5 2
2.5 3
3.5 4
4.5
0.01
0.07
0.13
0.19
0.25
0.31
0.37
3.5E-02
3.7E-02
3.9E-02
4.1E-02
4.3E-02
4.5E-02
4.7E-02
4.9E-02
Cl mol/l
Length, m
Breadth, m
R5_0.1xFlow
0
0.5 1
1.5 2
2.5 3
3.5 4
4.5
0.01
0.07
0.13
0.19
0.25
0.31
0.37
3.5E-02
3.7E-02
3.9E-02
4.1E-02
4.3E-02
4.5E-02
4.7E-02
4.9E-02
Cl mol/l
Length, m
Breadth, m
R6_10*Flow
0
0.5
1
1.5
2
2.5
3
3.5
4
4.5
0.01
0.05
0.09
0.13
0.17
0.21
0.25
0.29
0.33
0.37
0.0E+00
1.0E+00
2.0E+00
3.0E+00
4.0E+00
5.0E+00
6.0E+00
Biomass
Length, m
Breadth, m
R5_0.1xFlow
0
0.5
1
1.5
2
2.5
3
3.5
4
4.5
0.01
0.05
0.09
0.13
0.17
0.21
0.25
0.29
0.33
0.37
0.0E+00
1.0E+00
2.0E+00
3.0E+00
4.0E+00
5.0E+00
6.0E+00
Biomass
Length, m
Breadth, m
R6_10*Flow
00.5
11.5
22.5
33.5
44.5
0.01
0.07
0.13
0.19
0.25
0.31
0.37
0.0E+00
5.0E-06
1.0E-05
1.5E-05
2.0E-05
2.5E-05
3.0E-05
3.5E-05
4.0E-05
4.5E-05
5.0E-05
U mol/l
Length, m
Breadth, m
R5_0.1xFlow
00.5
11.5
22.5
33.5
44.5
0.01
0.07
0.13
0.19
0.25
0.31
0.37
0.0E+00
5.0E-06
1.0E-05
1.5E-05
2.0E-05
2.5E-05
3.0E-05
3.5E-05
4.0E-05
4.5E-05
5.0E-05
U mol/l
Length, m
Breadth, m
R6_10*Flow
0
0.5
1
1.5
2
2.5
3
3.5
4
4.5
0.01
0.05
0.09
0.13
0.17
0.21
0.25
0.29
0.33
0.37
1.0E-08
1.0E-07
1.0E-06
1.0E-05
1.0E-04
1.0E-03
U minerals mol/l
Length, m
Breadth, m
R5_0.1xFlow
0
0.5
1
1.5
2
2.5
3
3.5
4
4.5
0.01
0.05
0.09
0.13
0.17
0.21
0.25
0.29
0.33
0.37
1.0E-08
1.0E-07
1.0E-06
1.0E-05
1.0E-04
1.0E-03
U minerals mol/l
Length, m
Breadth, m
R6_10*Flow
Figure 1 Modelled results after 100 years showing the effect of advective flow in fracture, with a factor of 0.1 lower (left) and a
factor of 10 higher (right).
a)
c)
e)
g)
b)
d)
f)
h)
Fig. 3. Modelled results after 100 years showing the effect of advective flow in fracture, with a factor of 0.1
lower (left) and a factor of 10 higher (right).
Page 10
WM2012 Conference, February 26 - March 1, 2012, Phoenix, Arizona, USA
9
0
0.5 1
1.5 2
2.5 3
3.5 4
4.5
0.01
0.07
0.13
0.19
0.25
0.31
0.37
3.5E-02
3.6E-02
3.7E-02
3.8E-02
3.9E-02
4.0E-02
4.1E-02
4.2E-02
Cl mol/l
Length, m
Breadth, m
R3a_Por0.1_DE
0
0.5 1
1.5 2
2.5 3
3.5 4
4.5
0.01
0.07
0.13
0.19
0.25
0.31
0.37
3.5E-02
3.6E-02
3.7E-02
3.8E-02
3.9E-02
4.0E-02
4.1E-02
4.2E-02
Cl mol/l
Length, m
Breadth, m
R4a_Por0.2_DE
0
0.5
1
1.5
2
2.5
3
3.5
4
4.5
0.01
0.05
0.09
0.13
0.17
0.21
0.25
0.29
0.33
0.37
0.0E+00
1.0E+00
2.0E+00
3.0E+00
4.0E+00
5.0E+00
6.0E+00
7.0E+00
8.0E+00
Biomass
Length, m
Breadth, m
R3a_Por0.1_DE
0
0.5
1
1.5
2
2.5
3
3.5
4
4.5
0.01
0.05
0.09
0.13
0.17
0.21
0.25
0.29
0.33
0.37
0.0E+00
1.0E+00
2.0E+00
3.0E+00
4.0E+00
5.0E+00
6.0E+00
7.0E+00
8.0E+00
Biomass
Length, m
Breadth, m
R4a_Por0.2_DE
00.5
11.5
22.5
33.5
44.5
0.01
0.07
0.13
0.19
0.25
0.31
0.37
0.0E+00
1.0E-05
2.0E-05
3.0E-05
4.0E-05
5.0E-05
6.0E-05
U mol/l
Length, m
Breadth, m
R3a_Por0.1_DE
00.5
11.5
22.5
33.5
44.5
0.01
0.07
0.13
0.19
0.25
0.31
0.37
0.0E+00
1.0E-05
2.0E-05
3.0E-05
4.0E-05
5.0E-05
6.0E-05
U mol/l
Length, m
Breadth, m
R4a_Por0.2_DE
0
0.5
1
1.5
2
2.5
3
3.5
4
4.5
0.01
0.05
0.09
0.13
0.17
0.21
0.25
0.29
0.33
0.37
1.0E-08
1.0E-07
1.0E-06
1.0E-05
1.0E-04
1.0E-03
U minerals mol/l
Length, m
Breadth, m
R3a_Por0.1_DE
0
0.5
1
1.5
2
2.5
3
3.5
4
4.5
0.01
0.05
0.09
0.13
0.17
0.21
0.25
0.29
0.33
0.37
1.0E-08
1.0E-07
1.0E-06
1.0E-05
1.0E-04
1.0E-03
U minerals mol/l
Length, m
Breadth, m
R4a_Por0.2_DE
Figure 4. 1 Modelled results after 100 years showing the effect of porosity change in media with porosity decrease to 0.1 (left)
and porosity increase to 0.2 (right).
g)
a) b)
c) d)
e) f)
h)
Fig. 4. Modelled results after 100 years showing the effect of porosity change in media, with porosity decrease
to 0.1 (left) and porosity increase to 0.2 (right).
Page 11
WM2012 Conference, February 26 - March 1, 2012, Phoenix, Arizona, USA
10
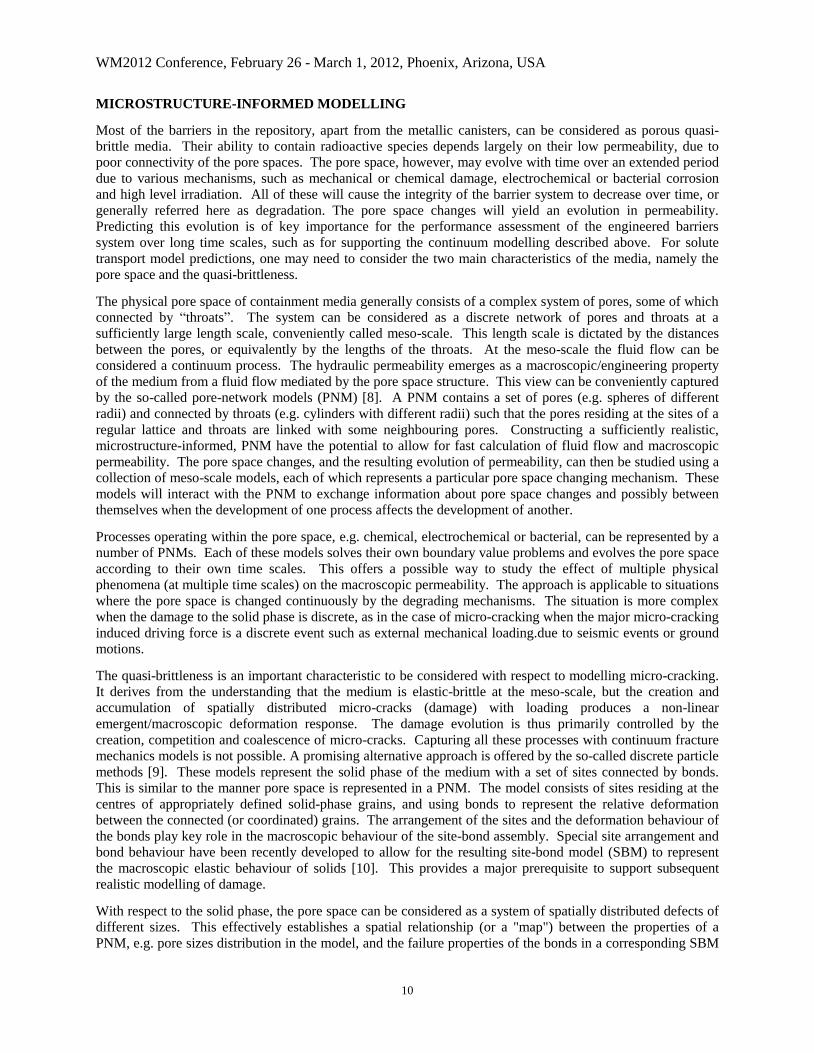
MICROSTRUCTURE-INFORMED MODELLING
Most of the barriers in the repository, apart from the metallic canisters, can be considered as porous quasi-
brittle media. Their ability to contain radioactive species depends largely on their low permeability, due to
poor connectivity of the pore spaces. The pore space, however, may evolve with time over an extended period
due to various mechanisms, such as mechanical or chemical damage, electrochemical or bacterial corrosion
and high level irradiation. All of these will cause the integrity of the barrier system to decrease over time, or
generally referred here as degradation. The pore space changes will yield an evolution in permeability.
Predicting this evolution is of key importance for the performance assessment of the engineered barriers
system over long time scales, such as for supporting the continuum modelling described above. For solute
transport model predictions, one may need to consider the two main characteristics of the media, namely the
pore space and the quasi-brittleness.
The physical pore space of containment media generally consists of a complex system of pores, some of which
connected by “throats”. The system can be considered as a discrete network of pores and throats at a
sufficiently large length scale, conveniently called meso-scale. This length scale is dictated by the distances
between the pores, or equivalently by the lengths of the throats. At the meso-scale the fluid flow can be
considered a continuum process. The hydraulic permeability emerges as a macroscopic/engineering property
of the medium from a fluid flow mediated by the pore space structure. This view can be conveniently captured
by the so-called pore-network models (PNM) [8]. A PNM contains a set of pores (e.g. spheres of different
radii) and connected by throats (e.g. cylinders with different radii) such that the pores residing at the sites of a
regular lattice and throats are linked with some neighbouring pores. Constructing a sufficiently realistic,
microstructure-informed, PNM have the potential to allow for fast calculation of fluid flow and macroscopic
permeability. The pore space changes, and the resulting evolution of permeability, can then be studied using a
collection of meso-scale models, each of which represents a particular pore space changing mechanism. These
models will interact with the PNM to exchange information about pore space changes and possibly between
themselves when the development of one process affects the development of another.
Processes operating within the pore space, e.g. chemical, electrochemical or bacterial, can be represented by a
number of PNMs. Each of these models solves their own boundary value problems and evolves the pore space
according to their own time scales. This offers a possible way to study the effect of multiple physical
phenomena (at multiple time scales) on the macroscopic permeability. The approach is applicable to situations
where the pore space is changed continuously by the degrading mechanisms. The situation is more complex
when the damage to the solid phase is discrete, as in the case of micro-cracking when the major micro-cracking
induced driving force is a discrete event such as external mechanical loading.due to seismic events or ground
motions.
The quasi-brittleness is an important characteristic to be considered with respect to modelling micro-cracking.
It derives from the understanding that the medium is elastic-brittle at the meso-scale, but the creation and
accumulation of spatially distributed micro-cracks (damage) with loading produces a non-linear
emergent/macroscopic deformation response. The damage evolution is thus primarily controlled by the
creation, competition and coalescence of micro-cracks. Capturing all these processes with continuum fracture
mechanics models is not possible. A promising alternative approach is offered by the so-called discrete particle
methods [9]. These models represent the solid phase of the medium with a set of sites connected by bonds.
This is similar to the manner pore space is represented in a PNM. The model consists of sites residing at the
centres of appropriately defined solid-phase grains, and using bonds to represent the relative deformation
between the connected (or coordinated) grains. The arrangement of the sites and the deformation behaviour of
the bonds play key role in the macroscopic behaviour of the site-bond assembly. Special site arrangement and
bond behaviour have been recently developed to allow for the resulting site-bond model (SBM) to represent
the macroscopic elastic behaviour of solids [10]. This provides a major prerequisite to support subsequent
realistic modelling of damage.
With respect to the solid phase, the pore space can be considered as a system of spatially distributed defects of
different sizes. This effectively establishes a spatial relationship (or a "map") between the properties of a
PNM, e.g. pore sizes distribution in the model, and the failure properties of the bonds in a corresponding SBM
Page 12
WM2012 Conference, February 26 - March 1, 2012, Phoenix, Arizona, USA
11
of the solid-phase. The model therefore implies, within a given space, the larger the pore in the PNM the
lower the strength of the corresponding bond in the SBM. The damage evolution in a SBM can be represented
"naturally" as bonds fail when their failure strengths are reached during mechanical loading. This approach
has been applied for predicting the macroscopic stress-strain behaviour of cement under tensile and
compressive loading using microstructure data only [11]. The model was able to reproduce experimentally
measured behaviours, including quasi-hardening and complex softening branches. This suggests that the SBM
could provide reasonable damage evolution predictions that can be used to inform pore space changes in the
PNM. The link between the two models is an ongoing work and is not reported here. The focus here is on the
realistic representation of the pore space. A simplified pore space changing mechanism, mimicking damage, is
used to illustrate how this will be used for predicting permeability evolution.
Early PNMs were based on a cubic lattice with a maximum pore coordination of six [12]. Later experimental
studies showed that pores with larger pore coordination numbers (PCN) can be substantial fractions of all
coordinated pores [13]. These have led to the proposal of PNMs with larger maximum PCN, e.g. 26 in [14],
based on cubic support. Although such PNMs are topologically admissible, they are physically unrealistic
because a large numbers of throats intersect at points that are not pores. Furthermore, for a given average PCN
the existing models reproduce only one PCN spectrum, i.e. number fractions of pores coordinated by different
numbers of throats. This spectrum may not correspond to experimentally determined spectra, such as in [13].
A novel lattice support for PNM construction has been recently proposed and justified [15, 16]. This supports
an assembly of truncated octahedrons that fills the space compactly, as shown in Fig. 5a. The unit cell of the
assembly that illustrates the pore position and the possible coordinating throats are shown in Fig. 5b. Firstly,
the support allows for covering pore coordination numbers up to 14, which is sufficient for all practical
purposes, without compromising the physical realism of the resulting network. Secondly, the presence of two
types of possible throats, T1 along the principal directions of the cell and T2 along the body diagonals, makes
the model very flexible for representing different coordination spectra in a pore space with a given average
coordination, Z. This feature is explored in detail in [15], and is not presented here.
Fig. 5. Lattice support for pore network construction (a) and unit cell (b) showing a pore with all possible
throats.
The PNM construction from this support starts with the distribution of pore sizes within cells according to an
experimental pore size distribution. These are then linked by all possible throats with sizes distributed
according to an experimental throat size distribution. Only a fraction of all throats are made conductive using
an elimination process with two different elimination numbers, 0 < E1 < 1 and 0 < E2 < 1, for the two types of
throats, respectively. For each throat a random number 0 < E < 1 is generated and if E < Ei (i = 1, 2) the throat
is accepted as conductive. The pores that are coordinated by conductive throats form the initial conducting
pore space. The number fractions of pores coordinated by different numbers of conductive throats define the
PCN spectrum, which should be matched with experimental data if available. The average PCN of the system,
Z, is the minimum experimental requirement for the PNM construction, but as mentioned earlier a given Z can
be achieved with a continuum set of (E1, E2), each of which producing a different PCN spectrum. The non-
conductive throats are left in the system as they represent possible links between pores that can be created by
Page 13
WM2012 Conference, February 26 - March 1, 2012, Phoenix, Arizona, USA
12
the evolution of damage. Currently, the conductive throats are assigned local conductivity values proportional
to their cross sectional area. This effectively represents a laminar flow in cylindrical pipes [15], and is
equivalent to the assumption that all throats in the real pore space having identical local morphologies or
shapes. Should experimental data for local morphologies become available, e.g. in terms of conductivity
distribution; it could be used to distribute local conductivities in a manner similar to the throat sizes. The
length scale of the model thus constructed is calculated from the distributions of pore sizes and conductive
throat sizes that are based on experimental porosity data [15].
To illustrate the model performance, pore space data for Ordinary Portland Cement (OPC) obtained with
synchrotron micro tomography is used. The data available contain accessible porosity, distribution of pore
sizes; distribution of throat sizes and numbers of pores coordinated by different numbers of throats. The
cumulative pore and throat size distributions are shown in Fig. 6. These are used to distribute the pore and
throat sizes in the model. The size of a pore or a throat is determined from the corresponding cumulative
distribution with a generator of uniformly distributed random numbers between zero and one.
Fig. 6. Cumulative pore radius (a) and throat radius (b) distributions in OPC determined from pore space
analysis of 3D microtomography images.
Fig. 7a shows the experimentally determined PCN spectrum as well as the spectrum produced by the model.
Of all possible combinations (E1, E2) providing the experimentally determined Z (depicted) the combination
providing a spectrum closest to the experimental one is selected (depicted). Fig. 7b illustrates a segment of the
pore network constructed with the model PCN spectrum and the pore and throat size distributions from Fig. 6.
The total porosity and the calculated model length scale are depicted.
Fig. 7. Experimental and model pore coordination number spectra (a) and an illustration of the resulting pore
network used for permeability calculations (b). (Note that the pore and throat radii are not to scale.)
Page 14
WM2012 Conference, February 26 - March 1, 2012, Phoenix, Arizona, USA
13
Permeability of the PNM is calculated assuming fully saturated conditions. The model is subjected to
experimental boundary conditions and constitutes a boundary value problem. The mathematical description of
this problem is described previously [15]. The numerical solution of the problem provides the pressures values
in all pores and the fluxes in all throats, with which the macroscopic permeability can be readily calculated.
The model is calibrated against an experimentally measured permeability by varying the local conductivity
values of the throats, i.e. by varying the coefficient of proportionally between throat conductivity and cross
section area. This is given in more detail in [16] for two different sandstones. The model illustrated in Fig. 7b
was calibrated against a measured permeability of OPC, K = 1.1×10⁻¹⁸
m2. The model contains approximately
32,000 pores and 224,000 throats, of which approximately 60,800 were initially conductive and 163,200 were
initially non-conductive. The evolution of its permeability with pore space changes was then investigated.
A heuristic argument [15 is employed to mimic mechanical damage without interaction with a corresponding
solid-phase model. It is assumed that at a given simulation step the solid phase fails around the pore which is
simultaneously the largest and best connected. This pore is not considered in the subsequent simulation steps.
The throats coordinating the pore that are currently conductive are then enlarged proportionally by a
predefined factor, S, called damage factor. This has the effect of increasing the local conductivities for
subsequent simulation steps. The throats coordinating the pore that are currently non-conductive are not
enlarged but are made conductive after the step, with conductivities proportional to their cross section area.
The two processes represent local pore space enlargement and creation of new flow channels, respectively,
resulting from mechanical damage. The local changes contribute to changes in global porosity and
permeability, which are re-calculated after each failure event. The main unknown in the procedure is the
damage factor, S, i.e. the relation between a mechanical micro-failure and the increase of local pore space
geometry and conductivity. Further work on the determination of the damage factor is therefore needed.
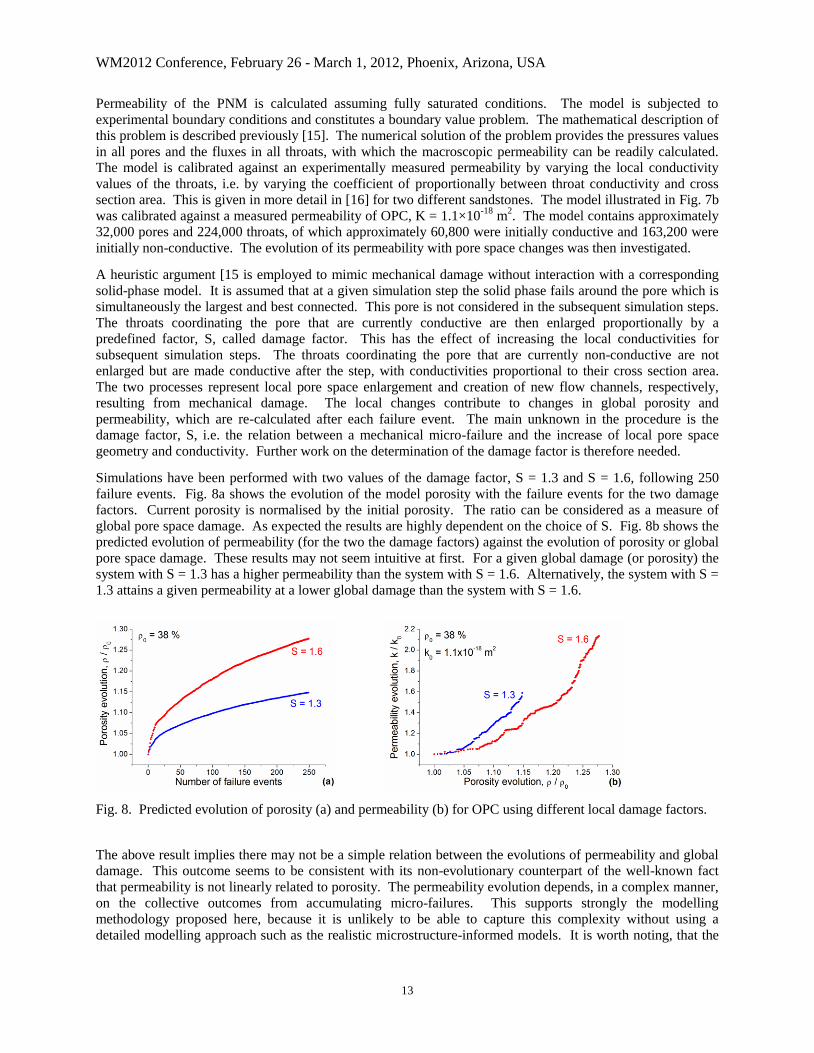
Simulations have been performed with two values of the damage factor, S = 1.3 and S = 1.6, following 250
failure events. Fig. 8a shows the evolution of the model porosity with the failure events for the two damage
factors. Current porosity is normalised by the initial porosity. The ratio can be considered as a measure of
global pore space damage. As expected the results are highly dependent on the choice of S. Fig. 8b shows the
predicted evolution of permeability (for the two the damage factors) against the evolution of porosity or global
pore space damage. These results may not seem intuitive at first. For a given global damage (or porosity) the
system with S = 1.3 has a higher permeability than the system with S = 1.6. Alternatively, the system with S =
1.3 attains a given permeability at a lower global damage than the system with S = 1.6.
Fig. 8. Predicted evolution of porosity (a) and permeability (b) for OPC using different local damage factors.
The above result implies there may not be a simple relation between the evolutions of permeability and global
damage. This outcome seems to be consistent with its non-evolutionary counterpart of the well-known fact
that permeability is not linearly related to porosity. The permeability evolution depends, in a complex manner,
on the collective outcomes from accumulating micro-failures. This supports strongly the modelling
methodology proposed here, because it is unlikely to be able to capture this complexity without using a
detailed modelling approach such as the realistic microstructure-informed models. It is worth noting, that the
Page 15
WM2012 Conference, February 26 - March 1, 2012, Phoenix, Arizona, USA
14
jumps in the permeability curves represent truthful physical events, where a particular pore space failure leads
to the creation of a "shortcut" in the fluid path and hence a stepwise increase in the macroscopic permeability.
In practice, the local damage factor, S, can be calibrated against experimental data for the changes in
macroscopic permeability in specimens subjected to mechanical damage. Such experiments are planned for
the near future and will be used in conjunction with the planned link between the PNM and the corresponding
SBM of the solid phase.
Several strengths of the proposed model are worth mentioning. Firstly, the model is applicable to any porous
quasi-brittle material provided the required supporting microstructure data is available. Secondly, the model
can be used at different length scales, such that the meso-scale referred here can be replaced by a different
length scale to reflect a particular system of defects. For example, it can be used as a productive alternative to
the discrete fracture network approaches for modelling fractured rock. In this case, the sites of the PNM will
be the intersections of rock fractures and the bonds of the PNM will be the segments of these rock fractures
between the intersections. The "meso-scale" here will be dictated by the lengths of the fractures. Regarding
the ability of the model to describe complex pore and solid phase systems the following additional features can
be readily introduced. For the pore space:
connectivity anisotropy and/or heterogeneity via assignment of different elimination numbers to throats
in different directions and/or domains of the model; and
conductivity anisotropy and/or heterogeneity via assignment of different conductivity values to throats
in different directions and/or domains of the model.
For the linked solid phase:
deformation anisotropy and/or heterogeneity via assignment of different mechanical behaviour to bonds
in different directions and/or domains of the model.
And for both systems when linked:
material texture via assignment of different cell sizes in the principal directions. Several of these
features are subjects of ongoing works.
CONCLUSIONS
The GRM code is used to examine the effects of media degradation for a geological waste disposal package,
under the combined hydrogeological (diffusion dominant) and chemical effects in low groundwater flow
conditions that are typical of deep geological disposal systems.
An illustrative reactive transport modelling application demonstrates the use of the code to examine the
interplay of kinetic controlled biogeochemical reactive processes with advective and diffusive transport, under
the influence of media degradation. The initial model results are encouraging which show the disposal system
to evolve in a physically realistic manner.
In the example presented the reactive-transport coupling develops chemically reducing zones, which limit the
transport of uranium. This illustrates the potential significance of media degradation and chemical effect on
the transport of radionuclides which would need to be taken into account when examining the long-term
behaviour and containment properties of the geological disposal system.
Microstructure-informed modelling and its potential linkage with continuum flow modelling is a subject of
ongoing studies. The approach of microstructure-informed modelling is discussed to provide insight and a
mechanistic understanding of macroscopic parameters and their evolution. The proposed theoretical and
methodological basis for microstructure-informed modelling of porous quasi-brittle media has the potential to
develop into an explanatory and predictive tool for deriving mechanism-based, as opposed to
phenomenological, evolution laws for macroscopic properties. These concepts in micro-scale modelling are
likely to be applicable to the diffusion process, in addition to advective transport illustrated here for porous
media.
Page 16
WM2012 Conference, February 26 - March 1, 2012, Phoenix, Arizona, USA
15
REFERENCES
1. S. Kwong. (2009a). Program User’s Guide for the code GRM, Version 6.1. NNL Report.
2. P. L. McCarty and F. E. Mosey. (1991). Modelling of Anaerobic Digestion Processes (A Discussion
of Concepts), Water Sci. Technol. 24 No.8, pp.17-33.
3. J. Small, M. Nykyri, M. Helin, U. Hovi, T. Sarlin and M. Itävaara, M. (2008). "Experimental and
modelling investigations of the biogeochemistry of gas production from low and intermediate level
radioactive waste". Applied Geochemistry Vol 23, pp.1383-1418.
4. S. Kwong. (2009b). Program Verification Report for the code GRM, Version 6.1. NNL Report.
5. S. Kwong and J.S. Small. (2010) "Coupling Diffusive Transport and Chemical Reaction in the
Generalised Repository Model (GRM)", Proceedings of WM2010: The Waste Management
Symposium 2010, Phoenix, US.
6. E.C. Gaucher, P. Blanc, J.M. Matray and N. Michau. (2004). "Modeling diffusion of an alkaline
plume in a clay barrier". Applied Geochemistry Vol 19, pp.1505-1515.
7. R.J. Millington and J. M. Quirk, "Permeability of porous solids". Trans. Faraday Soc. 57:1200-1207
(1961).
8. M.J. Blunt, M.D. Jackson, M. Piri and P.H. Valvatne, (2002). "Detailed physics, predictive
capabilities and macroscopic consequences for pore-network models of multiphase flow". Adv. Water
Resour. Vol 25, pp. 1069-1089.
9. P.A. Cundall and R.D. Hurt. (1992). "Numerical modelling of discontinua". Eng. Comput. Vol 9, pp.
101-113.
10. A.P. Jivkov and J.R. Yates, "Regular site-bond models for solids at meso-scale". To appear in J.
Mech. Phys. Solids.
11. A.P. Jivkov, M. Gunther and K.P. Travis. (2011). "Site-bond models for porous quasi-brittle media".
Proceedings of "Geological Disposal of Radioactive Waste: Underpinning Science and Technology"
Conference 2011, Loughborough, UK.
12. P.C. Reeves and M.A. Celia. (1996). "A functional relationship between capillary pressure, saturation
and interfacial area as revealed by a pore-scale network model". Water Resour. Res. Vol 32, pp. 2345-
2358.
13. A.S. Al-Kharusi and M.J. Blunt. (2007). "Network extraction from sandstone and carbonate pore
space images". J. Petrol. Sci. Eng. Vol. 56, pp. 219-231.
14. A. Raoof and S.M. Hassanizadeh. (2010). "A new method for generating pore-network models of
porous media". Transp. Porous Media Vol 81, pp. 391-407.
15. A.P. Jivkov and C. Hollis, "A novel site-bond support for pore network construction and application to
permeability calculations". To appear in Transp. Porous Media.
16. A.P. Jivkov and J.E. Olele. (2011) "Novel lattice models for porous media". Proceedings of MRS2011
XXXV International Symposium "Scientific Basis for Nuclear Waste Management" 2011, Buenos
Aires, Argentina.


![Review Paper on Soil Physics, Importance, Challenges and ...In[11] Development of realistic models for unsaturated flow and solute transport in fractured rock and other geologic materials](https://static.documents.pub/doc/80x56/5f4f2369a9b82200616d2af5/review-paper-on-soil-physics-importance-challenges-and-in11-development.jpg)


