Page 1
Neuroimag Clin N
Diffusion Tensor Imaging and Fiber Tractography in
Acute Stroke
Pratik Mukherjee, MD, PhDT
Neuroradiology Section, Department of Radiology, University of California at San Francisco, San Francisco, CA, USA
Diffusion tensor imaging (DTI) is an area of bur-
geoning research in technical refinements and clinical
applications. Diffusion MR imaging reflects infor-
mation on a microscopic spatial scale, allowing re-
searchers and clinicians an unprecedented ability to
probe tissue microarchitecture noninvasively. Fiber
tractography based on DTI can reveal the three-
dimensional (3-D) white matter connectivity of the
human brain. In this article, current methods for per-
forming DTI and tractography are examined, fol-
lowed by a brief review of the normal anatomy of
the human brain studied with DTI. Finally, areas of
ongoing clinical research and developing clinical
applications of DTI and tractography for stroke
are presented.
Diffusion tensor imaging methods
Acquisition
The most widely used techniques for acquiring
DTI are the same as for routine clinical diffusion-
weighted imaging (DWI): single-shot, spin-echo echo-
planar imaging (EPI), a method for rapid imaging
that freezes bulk macroscopic motion, thereby per-
mitting imaging of water diffusion at microscopic
spatial scales. DTI requires higher signal-to-noise
1052-5149/05/$ – see front matter D 2005 Elsevier Inc. All rights
doi:10.1016/j.nic.2005.08.010
This article is adapted from Edelman RR, Hesselink JR,
Zlatkin MB, et al. Clinical magnetic resonance imaging. 3rd
edition. Philadelphia: Elsevier; 2005; with permission.
T Neuroradiology Section, Department of Radiology,
University of California at San Francisco, 505 Parnassus
Avenue, Box 0628, San Francisco, CA 94143-0628.
E-mail address: [email protected]
ratio (SNR), however, for accurate assessment of
diffusion anisotropy, preferably greatly exceeding a
SNR of 20 [1]. DTI fiber tractography also requires
better spatial resolution than DWI for detailed
visualization of small white matter tracts, preferably
cubic voxels 2.5 mm on a side or smaller. The use of
cubic voxels, which have the same length in all three
orthogonal dimensions, is recommended for tractog-
raphy to avoid biasing the 3-D tracking algorithm
toward the direction of poorer spatial resolution. EPI
can provide sufficient spatial resolution with adequate
SNR for DTI tractography at 1.5 T in a clinically
feasible acquisition time [2]. Higher field magnets
(3 T and above) enable DTI at higher spatial reso-
lution or shorter acquisition times. Geometric warp-
ing artifacts common to EPI may limit anatomic
fidelity, however, especially in areas of high mag-
netic field susceptibility resulting from brain-air-bone
interfaces, such as the skull base and the posterior
fossa. These susceptibility artifacts can be problem-
atic even at 1.5 T and increase markedly at higher
field strengths. Pulsation artifacts from cerebrospinal
fluid also create artifacts, especially in the posterior
fossa and in regions of the supratentorial brain bor-
dering the lateral ventricles [3–5]. To optimize DTI
of the brainstem and cerebellum, where susceptibility
and pulsation artifacts are greatest, segmented EPI
with phase navigation and cardiac gating is used [6],
although these strategies lengthen the examination
time for patient preparation and image acquisition.
New advances in gradient strength and speed, multi-
channel radio-frequency (RF) coils, and parallel imag-
ing can address these problems.
The new multichannel, phased-array head RF
coils with better SNR characteristics than the standard
birdcage head RF coils have enhanced DTI, which is
Am 15 (2005) 655 – 665
reserved.
neuroimaging.theclinics.com
Page 2
mukherjee656
an SNR-limited imaging modality. The multichannel
RF coils also enable parallel imaging, a technical
advance that can improve the image quality of DTI
[7]. Parallel imaging techniques, such as SMASH
(simultaneous acquisition of spatial harmonics),
SENSE (sensitivity encoding), ASSET (array spatial
sensitivity encoding technique), and iPAT (integrated
parallel acquisition techniques), all can be used to
shorten the echo train length of EPI, thereby miti-
gating geometric warping artifacts and reducing the
blurring of image contrast that occurs with extended
EPI echo trains. These gains increase with the accel-
eration factor used in parallel imaging, but must be
balanced against the greater loss of SNR. With cur-
rent 8-channel head RF coils, acceleration factors of
2 to 3 are optimal [7]. Parallel imaging is instrumental
for ameliorating the greater EPI susceptibility arti-
facts that occur at 3 T and above, thereby permitting
high-field DTI with superior image quality.
Another important hardware consideration for
performing DTI is the gradient performance of the
MR scanner for the diffusion gradients and the EPI
readout gradients. Stronger and faster gradients enable
stronger diffusion weighting in a shorter period of
time and reduce the time required to form an EPI im-
age. This permits DTI to be acquired at a shorter echo
time (TE), which improves SNR and reduces geo-
metric warping artifacts. Hence, the latest generation
of MR images, with 4 G/cm gradient strength, allows
DTI with high spatial resolution and anatomic fidelity.
Other variables that may affect the quality of DTI
and tractography include the b value (diffusion
weighting factor) and the number of directions in
3-D space in which diffusion gradients are applied.
A b value of 1000 s/mm2 has become the standard
for clinical DWI and also is used for DTI in many
studies. The brains of newborns and infants have
much longer T2 relaxation times and much higher
apparent diffusion coefficients (ADC) than adults [8];
therefore, it is standard to use lower b values (eg,
600 s/mm2) for DWI and DTI. The superior gradient
performance of the latest generation of MR scanners
permits the acquisition of DTI at diffusion-weighting
factors much greater than 1000 s/mm2, and applica-
tions for ultrahigh b factor DTI are an area of active
investigation [9]. The minimum number of diffusion-
sensitizing directions needed to solve for the diffu-
sion tensor is six, although each six-direction whole
brain acquisition needs to be repeated several times
and averaged to provide sufficient SNR at high
enough spatial resolution on a 1.5 T scanner for DTI
tractography. DTI performance improves, however,
with greater numbers of diffusion-encoding directions
isotropically distributed in 3-D space [10,11].
DTI can be performed with other types of fast
imaging sequences besides EPI to avoid the artifacts
inherent in single-shot EPI. Examples include line
scan [12], single-shot, fast spin-echo [13], and
PROPELLER (periodically rotated overlapping par-
allel lines with enhanced reconstruction) [14]. All of
these other sequences suffer from less SNR per unit
time compared with EPI and, thus, longer acquisition
times. They may be of benefit for evaluating ischemia
near the skull base, however, in the posterior fossa or
in the spinal cord.
Postprocessing and visualization
DTI postprocessing and visualization require the
generation of parametric maps, the most popular of
which are spatially-averaged ADC (also called Dav, and
mean diffusivity), diffusion anisotropy, directionally en-
coded color anisotropy, and the eigenvalues of the dif-
fusion tensor. Calculation of DTI parametric maps and
3-D tractography may require postprocessing on a
dedicated image workstation, although vendors increas-
ingly incorporate on-line DTI visualization tools in
their latest MR scanner software releases.
There are many different measures of diffusion
anisotropy described in the literature, the most popu-
lar of which are: (1) fractional anisotropy (FA), which
is the most sensitive to low anisotropy values; (2) vol-
ume ratio (VR), which is the most sensitive to high
anisotropy values; and (3) relative anisotropy (RA),
which is more linear across the entire range of an-
isotropy values than the other two metrics. The three
eigenvalues of the diffusion tensor represent the
magnitude of diffusion along the three principal di-
rections in 3-D space, which are mutually orthogonal.
The eigenvalue with the maximum value (the major
eigenvalue) is the magnitude of diffusion along the
orientation in which water diffuses most freely,
whereas the two other eigenvalues (the minor eigen-
values) represent the magnitude of diffusion along the
directions orthogonal to this preferred orientation.
The mean of the three eigenvalues is equivalent to
the ADC, and the variance of the three eigenvalues is
related to the diffusion anisotropy.
White matter anatomy of the human brain
Anisotropy of white matter tracts
DTI excels at depicting the white matter archi-
tecture of the human brain. In conventional T1- and
T2-weighted MR imaging, white matter appears ho-
mogeneous throughout the normal adult brain. DTI
Page 3
dti & fiber tractography in acute stroke 657
can differentiate among different white matter tracts
via two distinct contrast mechanisms: (1) the magni-
tude of anisotropy within the white matter tract and
(2) the orientation of the fibers within the white
matter tract. White matter tracts of the cerebral hemi-
spheres may be classified into three distinct types:
(1) association—those that connect two different re-
gions of the cerebral cortex within the same hemi-
sphere; (2) projection—those that connect the
cerebral cortex to subcortical structures, such as the
thalamus and spinal cord; and (3) commissural—
those that connect cortical regions of the left hemi-
sphere with those of the right hemisphere. In general,
the anisotropy values of association tracts are less
than those of projection tracts, which in turn are
lower than those of commissural tracts [15]. Within
the association category, the anisotropy of short asso-
ciation fibers connecting adjacent regions of cortex,
also known as subcortical U-fibers, is less than those
of long association fibers running in large bundles,
such as the superior longitudinal fasciculus (SLF)
and the inferior longitudinal fasciculus (ILF). Gray
matter of the cerebral cortex is believed to have zero
anisotropy in adults, to within the limits of mea-
surement noise [15,16].
Although water diffuses more freely parallel to
highly collimated axonal bundles than in the plane
perpendicular to the fiber bundles, the biologic basis
for this diffusion anisotropy is not elucidated com-
pletely. It is likely that structural elements, such as
the plasma membrane of axons (the axolemma) and
their myelin sheaths, hinder water diffusion across
fiber bundles. Biophysical processes, such as ion
fluxes across the axolemma and fast axonal transport,
also are implicated. Measurements of diffusion an-
isotropy in vivo and in formalin-fixed myelinated
white matter show similar values, although the ADC
is much lower in fixed tissue, indicating that the de-
terminants of anisotropy in mature myelinated white
matter likely are microstructural and not physiologic
[17,18].
Fiber orientation of white matter tracts
The three major types of white matter tracts also
can be distinguished by the direction of the axons
within their fiber bundles on directionally encoded
color anisotropy maps. Water diffuses more freely
parallel to white matter fibers than orthogonal to
them, which is the basis for white matter diffusion
anisotropy. The fiber orientation of white matter
pathways can be determined from the direction of
maximal diffusivity. This direction corresponds to the
primary eigenvector of the diffusion tensor, which is
associated with the major eigenvalue (defined pre-
viously). The projection of the primary eigenvector
on each of three orthogonal axes (left-right, antero-
posterior, and craniocaudal) can be encoded by dif-
ferent colors. In the most widely accepted directional
encoding scheme, the left-right direction is assigned
to red, the anteroposterior dimension is assigned to
green, and the craniocaudal direction is assigned to
blue [19]. This works well for differentiating large
association tracts, which usually are green because
they connect anterior and posterior cortical regions
within a single cerebral hemisphere, from projection
pathways, which often are blue because they connect
superior cortical areas to inferior subcortical regions,
and also from commissural fibers, which appear red
because of their left-right orientation across the two
hemispheres. DTI cannot distinguish between antero-
grade and retrograde axonal directions along a single
orientation, for example, the corticospinal tract can-
not be separated from the somatosensory radiation
on the basis that, in the former, the axons project
from the cortex down to a subcortical structure,
whereas, in the latter, the axons project from a sub-
cortical structure up to the cortex. Both projection
pathways appear blue on directionally encoded color
FA maps because both have a predominantly cranio-
caudal orientation.
The normal white matter anatomy of the adult
human brain is illustrated in Fig. 1 with DTI
parametric maps. The optimized DTI technique used
to acquire these images at 1.5 T includes 4 G/cm
gradients, a high-sensitivity eight-channel head RF
coil, and parallel imaging. This optimized technique
permits high-quality imaging even in regions of high
susceptibility and cerebrospinal fluid pulsatility, such
as the brainstem, without the need for segmented EPI,
cardiac gating, or phase navigation [20].
Three-dimensional fiber tractography of white matter
Because white matter pathways in the brain exist
in 3-D, even sophisticated 2-D representations, such
as directionally encoded color anisotropy maps,
intrinsically are limited. Moreover, these color anisot-
ropy maps cannot differentiate adjacent white matter
tracts that have the same fiber orientation. These ob-
stacles can be overcome with 3-D fiber tractography.
There are many techniques for performing fiber trac-
tography described in the literature, but most of them
are variations on the same underlying idea of track-
ing bidirectionally along the orientation of the pri-
mary eigenvector of the diffusion tensor from voxel
to voxel in 3-D [21–23]. DTI tractography cannot
distinguish forward from backward along a fiber tra-
Page 4
Fig. 1. DTI of the supratentorial brain in a normal adult. Axial FA images (top row) and the corresponding directionally-encoded
color FA images (bottom row) are shown at the level of the roof of the lateral ventricles (left), the genu and splenium of the
corpus callosum (middle), and the basal ganglia and thalami (right). The top row of FA images show that the commissural and
projectional white matter tracts of the corpus callosum and internal capsule, respectively, have higher FA than the long
association tracts of the SLF or the short association pathways in the subcortical U-fibers. The color FA images display fiber
orientation within white matter as red for left-right, green for anteroposterior, and blue for craniocaudal. Fibers oriented oblique
to these three canonical axes display mixtures of these three colors. aIC, anterior limb of the internal capsule; CB, cingulum
bundle; CC, body of the corpus callosum; CS, centrum semiovale; EC, external capsule; F, body of the fornix; gCC, genu of the
corpus callosum; OR, optic radiation; pIC, posterior limb of the internal capsule, sCC; splenium of the corpus callosum.
mukherjee658
jectory. Tractography can be used to separate func-
tionally distinct white matter pathways using the mul-
tiple region-of-interest (ROI) method [21], in which
a priori knowledge concerning the origin and ter-
mination of a white matter tract is used to delineate
its entire 3-D trajectory. The fiber tracking is initiated
at an ROI defined at one end of the pathway, and
only those fiber tracks that pass through the ROI
defined at the other end of the pathway are retained.
Any other tracks that do not connect to both ROIs
are filtered out. In Fig. 2, the two-ROI tractography
method is used to ‘‘dissect’’ out the commissural,
projection, and association white matter connections
of the left visual cortex. Additional ROIs posi-
tioned at intermediate points along the expected
course of the white matter tract can be used to fur-
ther guide and refine the 3-D fiber tracking. In this
fashion, functionally distinct axonal pathways that
are located adjacent to each other within a white
matter structure, such as the pyramidal tract and the
somatosensory radiation within the internal capsule,
can be differentiated from each other. DTI trac-
tography also can delineate the topographic relation-
ship of fibers within a single white matter pathway,
such as the somatotopy of the somatosensory cortex.
The 3-D trajectory information from tractography
also can be used to measure tract-based ADC, anisot-
ropy, or other DTI parameters. The advantages of
this tract-based quantitation over traditional ROI
measurements within white matter structures are that
it is more specific to the functionally distinct axonal
pathway of interest and that it reflects the entire 3-D
course of the pathway rather than just one location
within the pathway.
Currently, there are several limitations to DTI
fiber tracking that must be considered when applying
this technology. Insufficient spatial resolution to
resolve adjacent axonal pathways may cause fiber
tracks to artifactually ‘‘jump’’ from one tract to
another, invalidating the calculated fiber trajectories.
White matter fibers that make hairpin turns, such as
the optic radiations at Meyer’s loop, may be difficult
to track. Currently, DTI tractography cannot reliably
track through white matter regions where fibers from
distinct axonal pathways cross each other at a micro-
scopic scale, such as the laterally projecting fibers of
Page 5
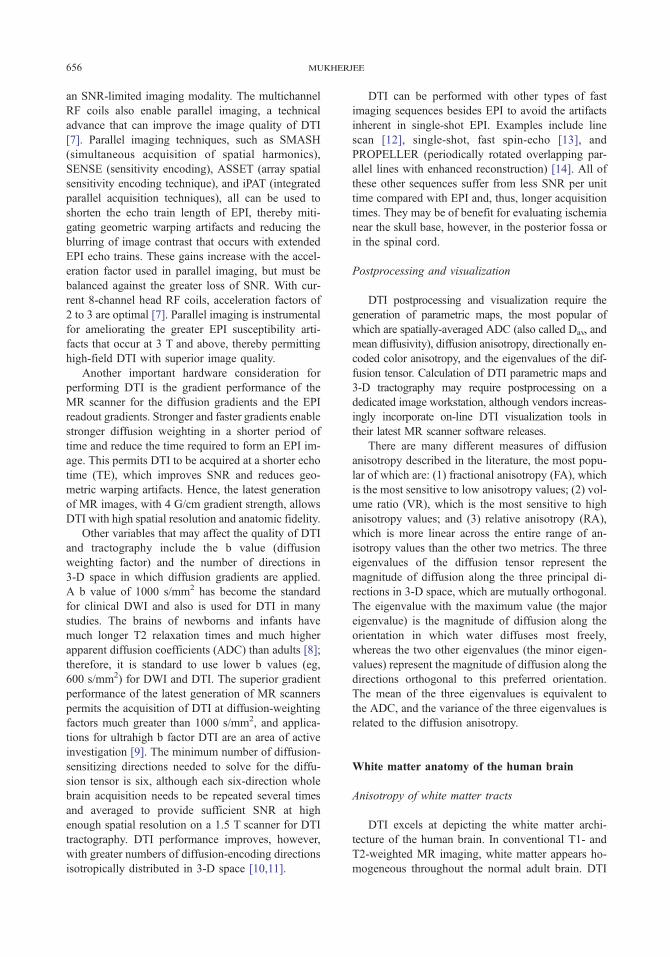
Fig. 2. DTI with 3-D fiber tractography of the white matter connectivity of the left visual cortex in a normal adult. 2-D axial
projections of the 3-D tractography show the commissural visual pathways in the splenium of the corpus callosum (left),
projection tracts of the optic radiation (center), and association tracts of the ILF (right). 3-D fiber tractography was performed
with the two-ROI method for defining white matter pathways based on their origin and termination. 2-D slices of the 3-D ROI
used for initiating fiber tracking in the left occipital lobe are displayed as green ellipses, and 2-D slices of the 3-D ROIs used for
filtering the resulting fiber tracks in the right occipital lobe (left), lateral geniculate nucleus of the thalamus (center), and anterior
temporal lobe (right) are shown as blue ellipses. The color within the fiber tracts indicates the magnitude of anisotropy, varying
continuously from bright white (high anisotropy) to dark orange (low anisotropy). The commissural, projection, and association
tracts all show higher anisotropy at the center of their 3-D trajectory and lower anisotropy toward both termini. This generally is
true of most long white matter pathways, because their fibers tend to be more highly collimated and tightly bundled in the middle
of their course than at their origins and terminations.
dti & fiber tractography in acute stroke 659
the pyramidal tract at the corona radiata, representing
the motor homunculus of the upper part of the body,
which pass through the anteroposteriorly oriented
fibers of the SLF. Additionally, DTI tractography
may not be able to distinguish between ‘‘crossing’’
fiber tracts and ‘‘kissing’’ fiber tracts, which abut
each other but do not pass through each other. Further
advances to DTI tractography are being developed to
address the problem of crossing fibers [24].
Normal development and normal aging cause
alterations in brain water diffusion; therefore, DTI
can characterize age-related changes in white matter
and in gray matter noninvasively [5,25]. During
infancy and childhood, the ADC decreases through-
out the brain and anisotropy increases in developing
white matter tracts. Conversely, during aging, FA of
white matter declines and ADC values rise. These
changes of normal development and aging must be
taken into account when interpreting DTI results in
pediatric stroke and in cerebrovascular disease of the
elderly, respectively.
Applications to stroke
Acute cerebral ischemia in the adult brain
Apparent diffusion coefficients
The most well established clinical application of
diffusion imaging is for the early detection of acute
ischemic stroke. ADC decreases within minutes of
the onset of cerebral ischemia and is reduced by 50%
or more in the acute stage of infarction [26,27].
Therefore, DWI has revolutionized the diagnosis of
hyperacute stroke, allowing delineation of the region
of ischemia/infarction within the first 3 to 6 hours
after symptom onset, when interventions, such as
intravenous or intra-arterial thrombolysis, may be
effective. Furthermore, DWI has found clinical use-
fulness in distinguishing acute infarctions from more
chronic lesions in patients who have suffered multiple
episodes of cerebral ischemia. The ADC of large ter-
ritorial infarctions pseudonormalizes within the first
week after onset of ischemia and continues to in-
crease to supranormal values thereafter [28]. The time
evolution of ADC in watershed infarctions may be
more prolonged, remaining reduced for a month or
longer before pseudonormalization [29].
Quantitative diffusion imaging also can distin-
guish the cytotoxic edema of acute ischemia from
vasogenic edema in disorders where both processes
may coexist [30,31]. ADC is reduced strongly in cyto-
toxic edema, whereas ADC is increased in vasogenic
edema, which is characterized by accumulation of
interstitial water. The diffusion anisotropy is reduced
strongly in vasogenic edema, whereas changes in
anisotropy in cytotoxic edema are smaller and less
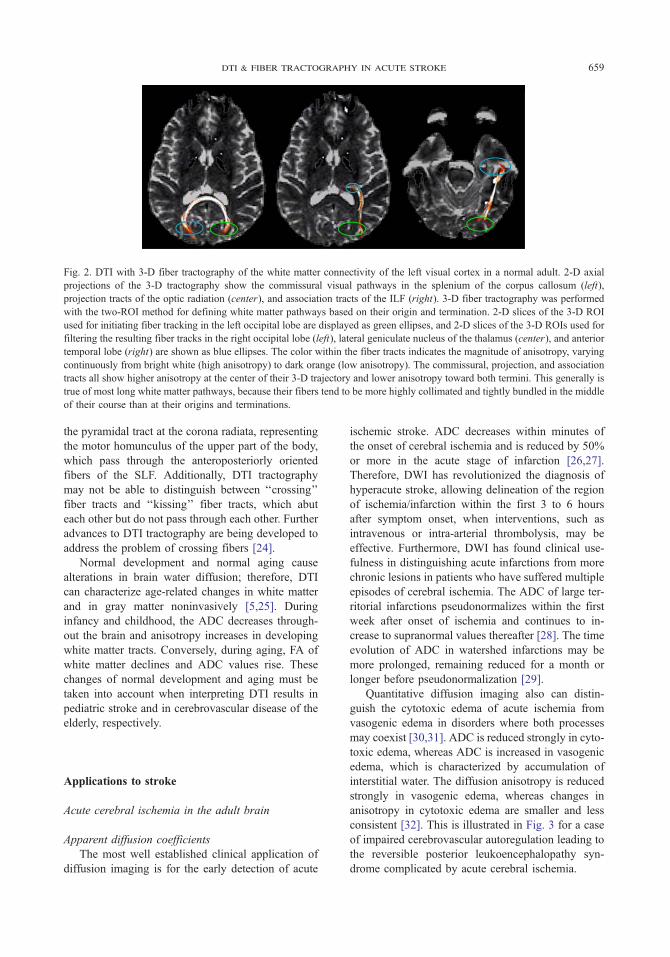
consistent [32]. This is illustrated in Fig. 3 for a case
of impaired cerebrovascular autoregulation leading to
the reversible posterior leukoencephalopathy syn-
drome complicated by acute cerebral ischemia.
Page 6
Fig. 3. DTI can distinguish vasogenic edema from cytotoxic edema in a case of posterior leukoencephalopathy complicated by
acute cerebral ischemia. The patient had a history of lupus nephritis and presented with hypertension and seizures. The top row
(A–D) of axial images illustrates findings in the posterior parietal lobes and the bottom row (E–H) illustrates findings more
caudally in the occipital lobes. (A) The FLAIR (fluid attenuated inversion recovery) image demonstrates asymmetrically
increased T2-weighted signal intensity in the gray matter and subcortical white matter of the parietal lobes, right greater than left.
There also is a smaller focus of increased T2-weighted signal intensity in the right frontal lobe (arrow). (B) DWI also shows
asymmetrically increased signal intensity in both parietal lobes, but left greater than right. (C) ADC image reveals increased
diffusion in the right parietal lobe (closed arrow) and right frontal lobe (open arrow), consistent with vasogenic edema, whereas
the reduced diffusion in the left parietal lobe (arrowheads) reflects cytotoxic edema. (D) There is markedly reduced anisotropy
within the regions of vasogenic edema (open and closed arrows) with relatively preserved anisotropy within the area of cytotoxic
edema (arrowheads). (E) FLAIR image shows T2-weighted hyperintensity in a cortical/subcortical distribution in both occipital
lobes. (F) DWI shows the greatest hyperintensity in the left temporal lobe (arrowheads), left thalamus (straight open arrow),
and isthmus of the left cingulate gyrus (curved open arrow). (G) ADC image confirms that the areas of DWI hyperintensity
show the reduced diffusion characteristic of cytotoxic edema, whereas the occipital poles show the increased diffusion
characteristic of vasogenic edema (closed arrows). (H) Again markedly reduced anisotropy is seen within the areas of vasogenic
edema (closed arrows) with relatively preserved anisotropy within the regions of acute ischemia. (Reproduced from Mukherjee
P, McKinstry RC. Reversible posterior leukoencephalopathy syndrome: evaluation with diffusion-tensor MR imaging. Radiology
2001;219:756–65; with permission.)
mukherjee660
Although DWI has found a role in the evaluation
of acute cerebral ischemia, the added value for per-
forming DTI in this clinical setting is not yet estab-
lished. Moreover, DTI requires longer acquisition
and postprocessing times than DWI, which is unde-
sirable for the assessment of hyperacute stroke.
Hence, to date there are few studies of DTI in acute
cerebral ischemia. Unlike DWI alone, DTI can distin-
guish white matter from gray matter based on differ-
ences in anisotropy and thereby separately quantify
changes of ADC in ischemic gray matter and ische-
mic white matter (Fig. 4). In patients who have acute
to early subacute territorial infarctions, differences
in the time evolution of ADC between white matter
and gray matter are documented with DTI [32–34].
In the first few days after infarction, the ADC re-
mains reduced in white matter for longer than in
gray matter, where pseudonormalization requires less
time. A difference in ADC values between white
matter and gray matter in response to ischemia, how-
ever, has not been observed in the hyperacute phase
of stroke [35].
Diffusion anisotropy and tensor eigenvalues
In addition to the well-known decrease of ADC in
acutely infarcted gray and white matter, alterations in
diffusion anisotropy also are observed in acute white
matter ischemia. The data on anisotropy changes in
acute stroke are conflicting, with some studies show-
Page 7
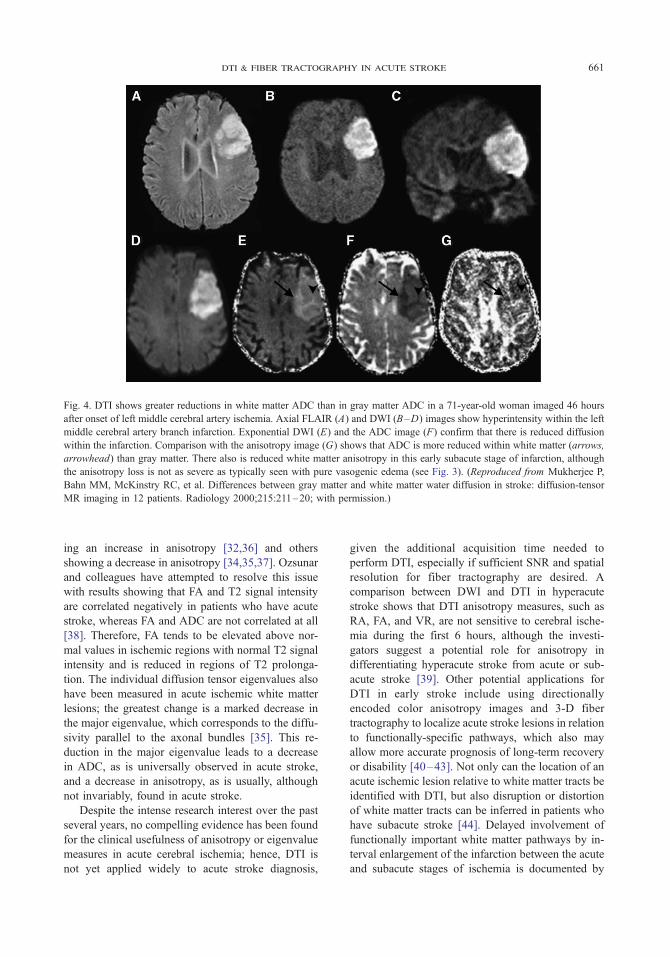
Fig. 4. DTI shows greater reductions in white matter ADC than in gray matter ADC in a 71-year-old woman imaged 46 hours
after onset of left middle cerebral artery ischemia. Axial FLAIR (A) and DWI (B–D) images show hyperintensity within the left
middle cerebral artery branch infarction. Exponential DWI (E) and the ADC image (F) confirm that there is reduced diffusion
within the infarction. Comparison with the anisotropy image (G) shows that ADC is more reduced within white matter (arrows,
arrowhead) than gray matter. There also is reduced white matter anisotropy in this early subacute stage of infarction, although
the anisotropy loss is not as severe as typically seen with pure vasogenic edema (see Fig. 3). (Reproduced from Mukherjee P,
Bahn MM, McKinstry RC, et al. Differences between gray matter and white matter water diffusion in stroke: diffusion-tensor
MR imaging in 12 patients. Radiology 2000;215:211–20; with permission.)
dti & fiber tractography in acute stroke 661
ing an increase in anisotropy [32,36] and others
showing a decrease in anisotropy [34,35,37]. Ozsunar
and colleagues have attempted to resolve this issue
with results showing that FA and T2 signal intensity
are correlated negatively in patients who have acute
stroke, whereas FA and ADC are not correlated at all
[38]. Therefore, FA tends to be elevated above nor-
mal values in ischemic regions with normal T2 signal
intensity and is reduced in regions of T2 prolonga-
tion. The individual diffusion tensor eigenvalues also
have been measured in acute ischemic white matter
lesions; the greatest change is a marked decrease in
the major eigenvalue, which corresponds to the diffu-
sivity parallel to the axonal bundles [35]. This re-
duction in the major eigenvalue leads to a decrease
in ADC, as is universally observed in acute stroke,
and a decrease in anisotropy, as is usually, although
not invariably, found in acute stroke.
Despite the intense research interest over the past
several years, no compelling evidence has been found
for the clinical usefulness of anisotropy or eigenvalue
measures in acute cerebral ischemia; hence, DTI is
not yet applied widely to acute stroke diagnosis,
given the additional acquisition time needed to
perform DTI, especially if sufficient SNR and spatial
resolution for fiber tractography are desired. A
comparison between DWI and DTI in hyperacute
stroke shows that DTI anisotropy measures, such as
RA, FA, and VR, are not sensitive to cerebral ische-
mia during the first 6 hours, although the investi-
gators suggest a potential role for anisotropy in
differentiating hyperacute stroke from acute or sub-
acute stroke [39]. Other potential applications for
DTI in early stroke include using directionally
encoded color anisotropy images and 3-D fiber
tractography to localize acute stroke lesions in relation
to functionally-specific pathways, which also may
allow more accurate prognosis of long-term recovery
or disability [40–43]. Not only can the location of an
acute ischemic lesion relative to white matter tracts be
identified with DTI, but also disruption or distortion
of white matter tracts can be inferred in patients who
have subacute stroke [44]. Delayed involvement of
functionally important white matter pathways by in-
terval enlargement of the infarction between the acute
and subacute stages of ischemia is documented by
Page 8
mukherjee662
DTI fiber tractography, accounting for the worsen-
ing symptoms in a subgroup of patients who have
stroke [43].
Chronic cerebral ischemia in the adult brain
Compared with hyperacute and acute stroke, dif-
fusion anisotropy changes in subacute to chronic ce-
rebral ischemia are well characterized. As illustrated
in Fig. 5, diffusion anisotropy in involved white mat-
ter becomes progressively more reduced during the
subacute to chronic stages of infarction [32,37,45].
A longitudinal DTI study of 32 patients who had
ischemic stroke finds varying degrees of residual
FA in white matter tracts within the infarction zone
at 3 months’ follow-up, indicating that some micro-
structural integrity may persist in a subgroup of
patients [34]. This suggests that residual white mat-
ter FA may have usefulness for predicting pa-
tient outcome.
Another major application for DTI in stroke is to
quantitatively characterize wallerian degeneration of
long white matter tracts remote from the infarction
zone secondary to subacute or chronic ischemia, even
those tracts that appear normal on conventional MR
imaging [45–48]. Anisotropy metrics, such as FA,
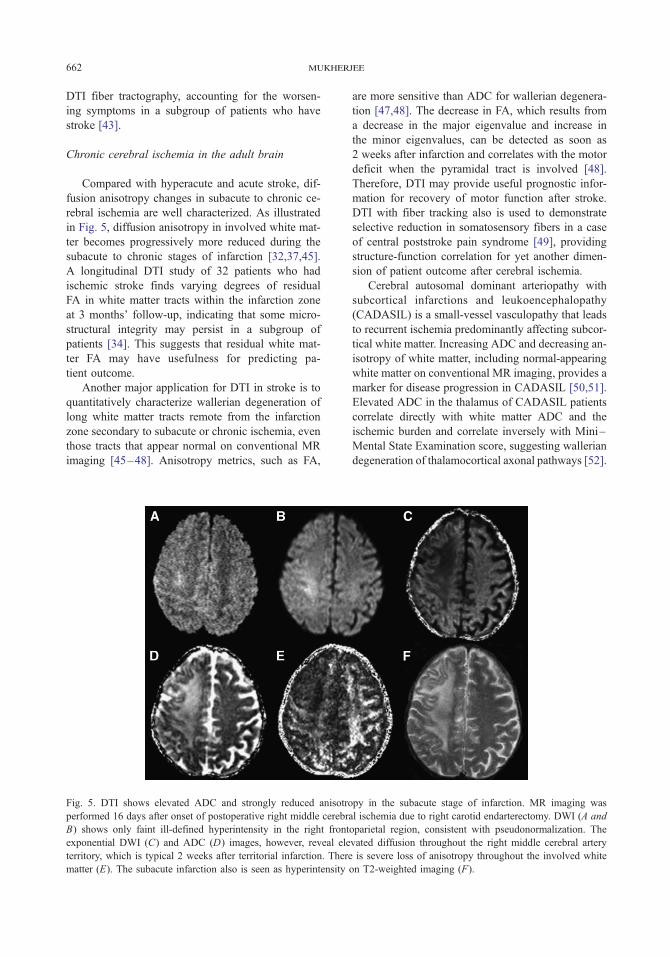
Fig. 5. DTI shows elevated ADC and strongly reduced anisotro
performed 16 days after onset of postoperative right middle cerebr
B) shows only faint ill-defined hyperintensity in the right front
exponential DWI (C) and ADC (D) images, however, reveal ele
territory, which is typical 2 weeks after territorial infarction. There
matter (E). The subacute infarction also is seen as hyperintensity
are more sensitive than ADC for wallerian degenera-
tion [47,48]. The decrease in FA, which results from
a decrease in the major eigenvalue and increase in
the minor eigenvalues, can be detected as soon as
2 weeks after infarction and correlates with the motor
deficit when the pyramidal tract is involved [48].
Therefore, DTI may provide useful prognostic infor-
mation for recovery of motor function after stroke.
DTI with fiber tracking also is used to demonstrate
selective reduction in somatosensory fibers in a case
of central poststroke pain syndrome [49], providing
structure-function correlation for yet another dimen-
sion of patient outcome after cerebral ischemia.
Cerebral autosomal dominant arteriopathy with
subcortical infarctions and leukoencephalopathy
(CADASIL) is a small-vessel vasculopathy that leads
to recurrent ischemia predominantly affecting subcor-
tical white matter. Increasing ADC and decreasing an-
isotropy of white matter, including normal-appearing
white matter on conventional MR imaging, provides a
marker for disease progression in CADASIL [50,51].
Elevated ADC in the thalamus of CADASIL patients
correlate directly with white matter ADC and the
ischemic burden and correlate inversely with Mini–
Mental State Examination score, suggesting wallerian
degeneration of thalamocortical axonal pathways [52].
py in the subacute stage of infarction. MR imaging was
al ischemia due to right carotid endarterectomy. DWI (A and
oparietal region, consistent with pseudonormalization. The
vated diffusion throughout the right middle cerebral artery
is severe loss of anisotropy throughout the involved white
on T2-weighted imaging (F).
Page 9
dti & fiber tractography in acute stroke 663
Hypoxic-ischemic injury in the developing brain
There are several DTI studies of hypoxic-ischemic
injury in the developing human brain. Diffusion imag-
ing may be more sensitive than conventional MR
imaging for detecting perinatal brain injury. One
study finds that abnormal decreases in ADC may
demonstrate and define the extent of perinatal brain
injury better than conventional MR imaging, espe-
cially when obtained between the second and fourth
days of life [53]. The investigators also demonstrate,
however, that DTI might underestimate the extent of
injury if obtained during the first 24 hours of life or
after a week has elapsed. In a study of preterm infants
imaged shortly after birth and again near term-
equivalent age, infants who had moderate to severe
white matter injury of prematurity, also known as
periventricular leukomalacia, did not demonstrate the
expected decrease in ADC and increase in anisotropy
observed during preterm maturation in infants with-
out white matter injury [54]. Those neonates who had
only minimal white matter injury of prematurity
showed the normal decrease in ADC but did not
show the expected increase in frontal white matter
anisotropy. Abnormally decreased anisotropy at the
site of the central white matter injury and in the
ipsilateral internal capsule has been identified in pre-
mature newborns, suggesting impaired development
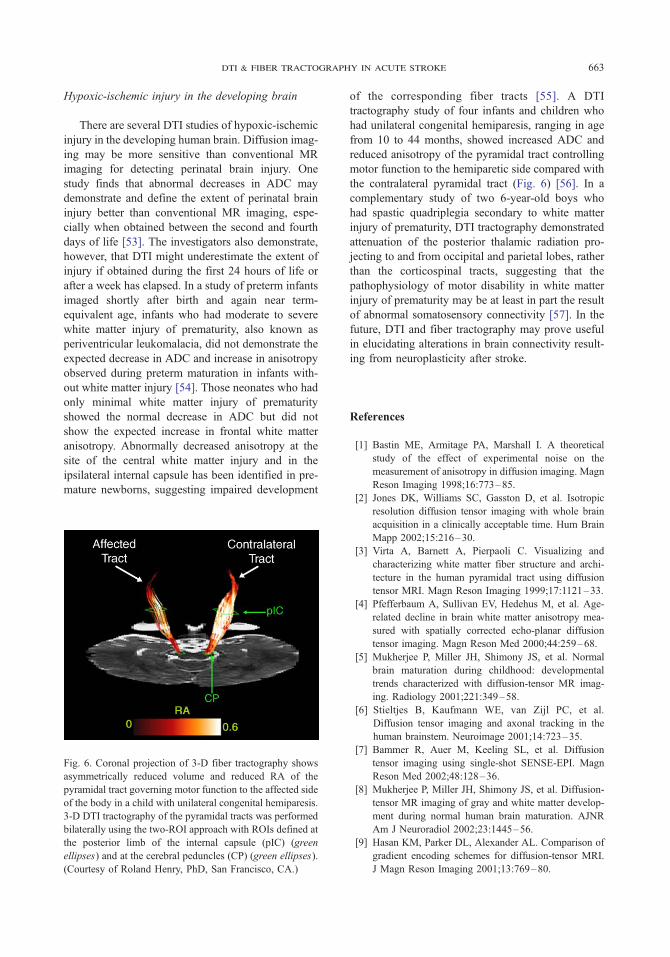
Fig. 6. Coronal projection of 3-D fiber tractography shows
asymmetrically reduced volume and reduced RA of the
pyramidal tract governing motor function to the affected side
of the body in a child with unilateral congenital hemiparesis.
3-D DTI tractography of the pyramidal tracts was performed
bilaterally using the two-ROI approach with ROIs defined at
the posterior limb of the internal capsule (pIC) (green
ellipses) and at the cerebral peduncles (CP) (green ellipses).
(Courtesy of Roland Henry, PhD, San Francisco, CA.)
of the corresponding fiber tracts [55]. A DTI
tractography study of four infants and children who
had unilateral congenital hemiparesis, ranging in age
from 10 to 44 months, showed increased ADC and
reduced anisotropy of the pyramidal tract controlling
motor function to the hemiparetic side compared with
the contralateral pyramidal tract (Fig. 6) [56]. In a
complementary study of two 6-year-old boys who
had spastic quadriplegia secondary to white matter
injury of prematurity, DTI tractography demonstrated
attenuation of the posterior thalamic radiation pro-
jecting to and from occipital and parietal lobes, rather
than the corticospinal tracts, suggesting that the
pathophysiology of motor disability in white matter
injury of prematurity may be at least in part the result
of abnormal somatosensory connectivity [57]. In the
future, DTI and fiber tractography may prove useful
in elucidating alterations in brain connectivity result-
ing from neuroplasticity after stroke.
References
[1] Bastin ME, Armitage PA, Marshall I. A theoretical
study of the effect of experimental noise on the
measurement of anisotropy in diffusion imaging. Magn
Reson Imaging 1998;16:773–85.
[2] Jones DK, Williams SC, Gasston D, et al. Isotropic
resolution diffusion tensor imaging with whole brain
acquisition in a clinically acceptable time. Hum Brain
Mapp 2002;15:216–30.
[3] Virta A, Barnett A, Pierpaoli C. Visualizing and
characterizing white matter fiber structure and archi-
tecture in the human pyramidal tract using diffusion
tensor MRI. Magn Reson Imaging 1999;17:1121–33.
[4] Pfefferbaum A, Sullivan EV, Hedehus M, et al. Age-
related decline in brain white matter anisotropy mea-
sured with spatially corrected echo-planar diffusion
tensor imaging. Magn Reson Med 2000;44:259–68.
[5] Mukherjee P, Miller JH, Shimony JS, et al. Normal
brain maturation during childhood: developmental
trends characterized with diffusion-tensor MR imag-
ing. Radiology 2001;221:349–58.
[6] Stieltjes B, Kaufmann WE, van Zijl PC, et al.
Diffusion tensor imaging and axonal tracking in the
human brainstem. Neuroimage 2001;14:723–35.
[7] Bammer R, Auer M, Keeling SL, et al. Diffusion
tensor imaging using single-shot SENSE-EPI. Magn
Reson Med 2002;48:128–36.
[8] Mukherjee P, Miller JH, Shimony JS, et al. Diffusion-
tensor MR imaging of gray and white matter develop-
ment during normal human brain maturation. AJNR
Am J Neuroradiol 2002;23:1445–56.
[9] Hasan KM, Parker DL, Alexander AL. Comparison of
gradient encoding schemes for diffusion-tensor MRI.
J Magn Reson Imaging 2001;13:769–80.
Page 10
mukherjee664
[10] Papadakis NG, Murrills CD, Hall LD, et al. Minimal
gradient encoding for robust estimation of diffusion
anisotropy. Magn Reson Imaging 2000;18:671–9.
[11] Skare S, Hedehus M, Moseley ME, Li TQ. Condition
number as a measure of noise performance of diffusion
tensor data acquisition schemes with MRI. J Magn
Reson 2000;147:340–52.
[12] Huppi PS, Maier SE, Peled S, et al. Microstructural
development of human newborn cerebral white matter
assessed in vivo by diffusion tensor magnetic reso-
nance imaging. Pediatr Res 1998;44:584–90.
[13] Bastin ME, Le Roux P. On the application of a non-
CPMG single-shot fast spin-echo sequence to diffusion
tensor MRI of the human brain. Magn Reson Med
2002;48:6–14.
[14] Pipe JG, Farthing VG, Forbes KP. Multishot diffusion-
weighted FSE using PROPELLER MRI. Magn Reson
Med 2002;47:42–52.
[15] Shimony JS, McKinstry RC, Akbudak E, et al.
Quantitative diffusion-tensor anisotropy imaging: nor-
mative human data and anatomic analysis. Radiology
1999;212:770–84.
[16] Pierpaoli C, Jezzard P, Basser PJ, et al. Diffusion
tensor MR imaging of the human brain. Radiology
1996;201:637–48.
[17] Guilfoyle DN, Helpern JA, Lim KO. Diffusion tensor
imaging in fixed brain tissue at 7.0 T. NMR Biomed
2003;16:77–81.
[18] Sun SW, Neil JJ, Song SK. Relative indices of wa-
ter diffusion anisotropy are equivalent in live and
formalin-fixed mouse brains. Magn Reson Med 2003;
50:743–8.
[19] Pajevic S, Pierpaoli C. Color schemes to represent the
orientation of anisotropic tissues from diffusion tensor
data: application to white matter fiber tract mapping in
the human brain. Magn Reson Med 1999;42:526–40.
[20] Yamada K, Kizu O, Mori S, et al. Brain fiber tracking
with clinically feasible diffusion-tensor MR imaging:
initial experience. Radiology 2003;227:295–301.
[21] Conturo TE, Lori NF, Cull TS, et al. Tracking neuronal
fiber pathways in the living human brain. Proc Natl
Acad Sci USA 1999;96:10422–7.
[22] Mori S, Crain BJ, Chacko VP, et al. Three-dimensional
tracking of axonal projections in the brain by magnetic
resonance imaging. Ann Neurol 1999;45:265–9.
[23] Basser PJ, Pajevic S, Pierpaoli C, et al. In vivo fiber
tractography using DT-MRI data. Magn Reson Med
2000;44:625–32.
[24] Wiegell MR, Larsson HB, Wedeen VJ. Fiber crossing
in human brain depicted with diffusion tensor MR
imaging. Radiology 2000;217:897–903.
[25] Abe O, Aoki S, Hayashi N, et al. Normal aging in the
central nervous system: quantitative MR diffusion-
tensor analysis. Neurobiol Aging 2002;23:433–41.
[26] Moseley ME, Kucharczyk J, Mintorovitch J, et al.
Diffusion-weighted MR imaging of acute stroke:
correlation with T2-weighted and magnetic suscepti-
bility-enhanced MR imaging in cats. AJNR Am J
Neuroradiol 1990;11:423–9.
[27] Warach S, Chien D, Li W, Ronthal M, et al. Fast
magnetic resonance diffusion-weighted imaging of
acute human stroke. Neurology 1992;42:1717–23.
[28] Schlaug G, Siewert B, Benfield A, et al. Time course
of the apparent diffusion coefficient (ADC) abnormal-
ity in human stroke. Neurology 1997;49:113–9.
[29] Huang IJ, Chen CY, Chung HW, et al. Time course of
cerebral infarction in the middle cerebral arterial
territory: deep watershed versus territorial subtypes
on diffusion-weighted MR images. Radiology 2001;
221:35–42.
[30] Schwartz RB, Mulkern RV, Gudbjartsson H, Jolesz F.
Diffusion-weighted MR imaging in hypertensive en-
cephalopathy: clues to pathogenesis. AJNR Am J Neu-
roradiol 1998;19:859–62.
[31] Mukherjee P, McKinstry RC. Reversible posterior
leukoencephalopathy syndrome: evaluation with dif-
fusion-tensor MR imaging. Radiology 2001;219:
756–65.
[32] Yang Q, Tress BM, Barber PA, et al. Serial study of
apparent diffusion coefficient and anisotropy in
patients with acute stroke. Stroke 1999;30:2382–90.
[33] Mukherjee P, Bahn MM, McKinstry RC, et al. Differ-
ences between gray matter and white matter water
diffusion in stroke: diffusion-tensor MR imaging in
12 patients. Radiology 2000;215:211–20.
[34] Munoz Maniega S, Bastin ME, Armitage PA, Farrall
AJ, Carpenter TK, Hand PJ, et al. Temporal evolution
of water diffusion parameters is different in grey and
white matter in human ischaemic stroke. J Neurol
Neurosurg Psychiatry 2004;75:1714–8.
[35] Sorensen AG, Wu O, Copen WA, et al. Human acute
cerebral ischemia: detection of changes in water
diffusion anisotropy by using MR imaging. Radiology
1999;212:785–92.
[36] Armitage PA, Bastin ME, Marshall I, Wardlaw JM,
Cannon J. Diffusion anisotropy measurements in
ischaemic stroke of the human brain. MAGMA
1998;6:28–36.
[37] Zelaya F, Flood N, Chalk JB, et al. An evaluation of
the time dependence of the anisotropy of the water
diffusion tensor in acute human ischemia. Magn Reson
Imaging 1999;17:331–48.
[38] Ozsunar Y, Grant PE, Huisman TA, et al. Evolution of
water diffusion and anisotropy in hyperacute stroke:
significant correlation between fractional anisotropy
and T2. AJNR Am J Neuroradiol 2004;25:699–705.
[39] Harris AD, Pereira RS, Mitchell JR, et al. A com-
parison of images generated from diffusion-weighted
and diffusion-tensor imaging data in hyper-acute
stroke. J Magn Reson Imaging 2004;20:193–200.
[40] Yoshikawa T, Aoki S, Masutani Y, et al. Diffusion
tensor imaging of cerebral infarction: analysis of ADC
and DTI scalar metrics (fractional anisotropy and
eigenvalues). Radiology 2002;225(Suppl):278–9.
[41] Lie C, Hirsch JG, Rossmanith C, et al. Clinicotopo-
graphical correlation of corticospinal tract stroke:
a color-coded diffusion tensor imaging study. Stroke
2004;35:86–92.
Page 11
dti & fiber tractography in acute stroke 665
[42] Sea Lee J, Han MK, Hyun Kim S, et al. Fiber tracking
by diffusion tensor imaging in corticospinal tract
stroke: topographical correlation with clinical symp-
toms. Neuroimage 2005;26:771–6.
[43] Yamada K, Ito H, Nakamura H, et al. Stroke patients’
evolving symptoms assessed by tractography. J Magn
Reson Imaging 2004;20:923–9.
[44] Gillard JH, Papadakis NG, Martin K, et al. MR
diffusion tensor imaging of white matter tract dis-
ruption in stroke at 3 T. Br J Radiol 2001;74:642–7.
[45] Buffon F, Molko N, Herve D, et al. Longitudinal
diffusion changes in cerebral hemispheres after
MCA infarcts. J Cereb Blood Flow Metab 2005;25:
641–50.
[46] Werring DJ, Toosy AT, Clark CA, et al. Diffusion
tensor imaging can detect and quantify corticospinal
tract degeneration after stroke. J Neurol Neurosurg
Psychiatry 2000;69:269–72.
[47] Pierpaoli C, Barnett A, Pajevic S, et al. Water diffusion
changes in wallerian degeneration and their depen-
dence on white matter architecture. Neuroimage 2001;
13:1174–85.
[48] Thomalla G, Glauche V, Koch MA, et al. Diffusion
tensor imaging detects early Wallerian degeneration of
the pyramidal tract after ischemic stroke. Neuroimage
2004;22:1767–74.
[49] Seghier ML, Lazeyras F, Vuilleumier P, et al. Func-
tional magnetic resonance imaging and diffusion tensor
imaging in a case of central poststroke pain. J Pain
2005;6:208–12.
[50] Chabriat H, Pappata S, Poupon C, et al. Clinical
severity in CADASIL related to ultrastructural damage
in white matter: in vivo study with diffusion tensor
MRI. Stroke 1999;30:2637–43.
[51] Molko N, Pappata S, Mangin JF, et al. Monitoring
disease progression in CADASIL with diffusion
magnetic resonance imaging: a study with whole brain
histogram analysis. Stroke 2002;33:2902–8.
[52] Molko N, Pappata S, Mangin JF, et al. Diffusion tensor
imaging study of subcortical gray matter in CADASIL.
Stroke 2001;32:2049–54.
[53] McKinstry RC, Miller JH, Snyder AZ, et al. A
prospective, longitudinal diffusion tensor imaging
study of brain injury in newborns. Neurology 2002;
59:824–33.
[54] Miller SP, Vigneron DB, Henry RG, et al. Serial
quantitative diffusion tensor MRI of the premature
brain: Development in newborns with and without
injury. J Magn Reson Imaging 2002;16:621–32.
[55] Huppi PS, Murphy B, Maier SE, et al. Microstructural
brain development after perinatal cerebral white matter
injury assessed by diffusion tensor magnetic resonance
imaging. Pediatrics 2001;107:455–60.
[56] Glenn OA, Henry RG, Berman JI, et al. DTI-based
three-dimensional tractography detects differences in
the pyramidal tracts of infants and children with
congenital hemiparesis. J Magn Reson Imaging
2003;18:641–8.
[57] Hoon Jr AH, Lawrie Jr WT, Melhem ER, et al.
Diffusion tensor imaging of periventricular leukoma-
lacia shows affected sensory cortex white matter
pathways. Neurology 2002;59:752–6.