Note: This copy is for your personal non-commercial use only. To order presentation-ready copies for distribution to your colleagues or clients, contact us at www.rsna.org/rsnarights. W
OM
EN’S IM
AG
ING
1393
Diffusion-weighted Imaging of Gynecologic Tumors: Diagnostic Pearls and Potential Pitfalls1
Conventional magnetic resonance (MR) imaging has an established role in gynecologic imaging. However, increasing clinical demand for improved lesion characterization and disease mapping to op-timize patient management has resulted in the incorporation of newer sequences, such as diffusion-weighted (DW) imaging, into routine protocols for pelvic MR imaging. DW imaging provides functional information about the microenvironment of water in tissues, hence augmenting the morphologic information derived from conventional MR images. It can depict shifts of water from extracellular to intracellular compartments, altered cell membrane permeability, disruption of cell membrane depolarization, and increased cellular density. Such changes may be associated with tu-mors. DW imaging has emerged as an important cancer biomarker and takes the role of the radiologist from the level of mere macro-scopic diagnosis to more active participation in determining patient prognosis and management through a better understanding of the tumor microenvironment. With the growing acknowledgment of DW imaging as a pivotal tool in the radiologist’s armamentarium, radiologists must be familiar with the appearances of various gyne-cologic tumors at DW imaging and understand the implications of this sequence for improving diagnostic accuracy and predicting and monitoring treatment response. Although positron emission to-mography/computed tomography is extremely useful for detecting tumor recurrence in cervical and ovarian carcinomas, it has a lim-ited specificity in the immediate posttreatment setting. DW imaging may aid in detection of residual or recurrent tumors in such situ-ations. DW imaging is a potentially useful adjunct to conventional MR imaging for evaluation of gynecologic tumors, thus improving overall diagnostic accuracy, tumor staging, prediction of response to therapy, and treatment follow-up.
Abbreviations: ADC = apparent diffusion co-efficient, DW = diffusion-weighted, LGESS = low-grade endometrial stromal sarcoma, ROI = region of interest
RadioGraphics 2014; 34:1393–1416
Published online 10.1148/rg.345130131
Content Codes: 1From the Departments of Radiology (S.D., M.T.) and Surgical Gynecology (R.K.), Tata Memorial Hospital, Mumbai, India; and Depart-ment of Diagnostic Imaging, National University Hospital, Singapore (P.J.). Presented as an edu-cation exhibit at the 2012 RSNA Annual Meet-ing. Received May 18, 2013; revision requested October 8 and received November 24; accepted February 17, 2014. For this journal-based SA-CME activity, the authors, editor, and review-ers have disclosed no relevant relationships. Address correspondence to S.D., National University Hospital, Department of Radiology, 5 Lower Kent Ridge Rd, Singapore 119074 (e-mail: [email protected]).
After completing this journal-based SA-CME activity, participants will be able to: ■ Recognize the appearances of various
gynecologic tumors at DW imaging.
■ Discuss the use of DW imaging to im-prove lesion detection, characterization, and staging and predict and monitor treatment response in gynecologic ma-lignancies.
■ Describe diagnostic pearls and poten-tial pitfalls related to the use of DW im-aging for female pelvic assessment.
See www.rsna.org/education/search/RG.
SA-CME LEARNING OBJECTIVES
IntroductionMagnetic resonance (MR) imaging has been established as an excel-lent modality for evaluation of gynecologic disease. However, mor-phologic MR imaging has some limitations for lesion detection and characterization. There has been a long-perceived need to improve the accuracy of tumor and lymph node staging, assessment of peri-toneal carcinomatosis, prediction of tumor response to therapy, and differentiation of posttreatment changes from disease recurrence. The innovation of newer functional imaging sequences such as diffu-sion-weighted (DW) imaging has addressed many of these issues and enhanced the diagnostic capabilities of MR imaging (1–6). These
factors influence the functional microenviron-ment of water and result in restriction or facilita-tion of water movement. DW imaging relies on detection of these changes in water movement or diffusivity. Image contrast is derived from differences in water diffusivity in tissues, which depends on tissue cellularity, the integrity of the cell membranes, and the presence of high-density extracellular hydrophobic macromolecules (1–5). No exogenous contrast material administration is required (1–3). Therefore, DW imaging can be used for patients with renal insufficiency or con-trast agent allergy (2).
Restricted diffusion of water molecules is directly proportional to expansion of the intra-cellular compartment, as in cytotoxic edema; in-creased cell membrane density due to hypercellu-larity; increased viscosity of fluid, as in abscesses, epidermoid cysts, and keratinous material; and increased tortuosity of the extracellular space. Facilitation of diffusion is seen in microenviron-ments with fewer cells (eg, necrotic tumors), de-fective cell membranes (eg, liquefactive necrosis), and fluid collections or cystic lesions with low viscosity (1–5).
Image AcquisitionDiffusion effects are generally not visible at conventional MR imaging (2). Hence, the T2-weighted spin-echo MR imaging sequence is mod-ified by adding a pair of motion-probing gradients, one on either side of the 180° refocusing pulse, to generate DW images. The pair of motion-probing gradients consists of symmetrical and equally weighted gradients with opposed polarities that sensitize the T2-weighted sequence to the motion of water molecules in the imaged volume (1–4).
When the first diffusion-sensitizing gradient is applied, static water molecules develop phase incoherencies, which are completely rephased by the subsequent application of the second gradi-ent, with signal preservation. However, in the case of free water molecules, the random dis-placement of moving water molecules to a new magnetic field strength in the time between the first and second gradients prevents rephasing and results in persistent phase incoherence, which leads to signal loss from water motion. These sig-nal changes are measured and reconstructed in the form of an image (Fig 1) (1,2).
The MR imaging signal at DW imaging de-pends on the amplitude of the random motion of water and the degree of diffusion weighting of the sequence (denoted by the b value). The b value (measured in sec/mm2) is determined by the amplitude, duration, and temporal spacing of the paired diffusion-sensitizing (motion-probing) gra-dients. DW imaging is performed at two or more b
developments have been made possible by recent advances in MR imaging hardware and software (eg, multichannel coils, echo-planar imaging, parallel imaging, higher magnetic field strengths, and stronger gradients), which have resulted in a substantial decrease in scan times (2–5). DW im-aging does not require administration of an exog-enous contrast agent and can be used for patients with renal insufficiency or reactions to contrast media (1–3).
As a result of technical developments and recent research, DW imaging has emerged as a promising tool for detecting and characterizing gynecologic tumors, determining the anatomic extent of disease, understanding lesion patho-physiology, and predicting and monitoring treat-ment outcome (1–6). Cervical and endometrial cancers have been shown to have significantly lower apparent diffusion coefficient (ADC) val-ues than those of normal cervical and endome-trial tissues (7–10). DW imaging has the potential ability to help indicate the pathologic grade of these tumors (8,10) as well as facilitate the differ-entiation of benign from malignant endometrial and myometrial lesions (11,12). Changes in ADC values may help predict the response of cervical cancers to chemoradiation treatment, with a bet-ter response noted in tumors with lower pretreat-ment ADC values (13). These changes may also help monitor treatment response, with a positive response seen as a significant rise in ADC values (7,13,14). DW imaging also improves mapping of peritoneal disease spread in gynecologic tu-mors (15). Clinical applications of DW imaging have gained widespread acceptance, prompting its incorporation into routine pelvic MR imaging protocols.
This article describes the DW imaging appear-ances of various gynecologic tumors observed by the authors, highlights the added diagnostic and prognostic value of these findings, and describes the role of DW imaging findings as a potential tumor biomarker. We also discuss potential pit-falls encountered during image acquisition and interpretation that warrant caution on the part of the interpreting radiologist. A brief overview of the underlying principles and techniques of DW imaging is provided to enhance understanding of the biophysical basis of the various imaging appearances.
Principles of DW ImagingFree water molecules in tissues show constant, random, microscopic thermal motion known as Brownian movement. The motion of water mol-ecules in tissues is impeded by interactions with the cell membrane, intracellular organelles, and hydrophobic macromolecules. Various pathologic
RG • Volume 34 Number 5 Dhanda et al 1395
source DW image. Multiple b values are gener-ally used to eliminate the error in ADC calcula-tion, which improves the tissue-characterization capabilities of ADC maps. Areas of restricted diffusion appear bright on gray-scale source DW images and dark on ADC maps, and the opposite findings are true for areas of facilitated diffusion. The ADC value of a lesion can be ascertained by drawing a region of interest (ROI) within the le-sion (1,3). Therefore, DW imaging provides both qualitative (source images) as well as quantitative (ADC map) information regarding microscopic water motion. The source DW images should al-ways be evaluated in conjunction with the ADC maps and correlated with conventional anatomic MR images (T1- and T2-weighted sequences) to avoid diagnostic pitfalls (1–5).
Image DisplayHigh-b-value DW images are displayed as in-verted gray-scale or arbitrary color-scale images. ADC maps are usually displayed as gray-scale images. DW images are usually acquired in the axial plane (the short axis of the uterus or cervix) and angled similarly to T2-weighted MR images. By using the latest techniques and data process-ing software, the DW imaging dataset can be subjected to multiplanar reformation, maximum intensity projection, and volume rendering. DW images can also be coregistered with correspond-ing conventional MR images to optimize ana-tomic information. This type of fusion imaging is performed on images with the same angulation by using a three-step process of superimposition, alignment, and blending of the two datasets (1,5). Fused images can provide a more precise delinea-tion of tumor extent (Fig 2).
values, which include one or more low b values (0, 50, or 100 sec/mm2) and a very high b value (750–1000 sec/mm2) (1–5). On low-b-value images, only tissues with more freely moving water (eg, blood vessels, cysts, ducts, and the bladder) will show signal intensity loss, resulting in high background signal intensity. Low-b-value images reflect both perfusion and diffusion effects. With a high b value, relatively slow-moving water also gets suppressed, and only tissues with significantly restricted diffu-sion will retain bright signal. These images reflect true diffusion in tissues. Hence, very high-b-value images provide maximum fat and background suppression while increasing the conspicuity of areas of severely restricted diffusion. However, the overall signal-to-noise ratio is worse and image dis-tortion (due to longer echo times) is greater with high b values (1–5).
Image AnalysisDW images show signal intensity changes that are based on the actual intravoxel differences in water diffusion during a diffusion-sensitized pe-riod of the MR pulse sequence (1–5). Apparent diffusion denotes the degree of water motion in tissues, which is described quantitatively as the ADC value. The ADC value represents the aver-age diffusional path of water molecules in a spe-cific time interval (2). Areas with restricted dif-fusion show lower ADC values. The ADC value (measured in mm2/sec) is calculated from DW images with different b values. It is calculated by the slope of the line of the natural algorithm of signal intensity for a particular voxel versus the b value. The ADC map is a parametric map. It represents the final image reconstructed with the ADC values, calculated for each pixel in the
Figure 1. Diagram depicts a DW imaging sequence. A pair of symmet-ric diffusion-sensitizing motion-prob-ing gradients are applied on either side of the 180° radiofrequency (RF) pulse during a T2-weighted spin-echo MR imaging sequence. Free random motion of protons manifests as a persistent lack of coherence even after application of the second gradi-ent, which is recorded as a signal loss, while restricted motion of protons permits phase coherence, which translates into signal gain. (Adapted and reprinted, with permission, from reference 3.)
Figure 2. Use of fusion imaging to differentiate stage IB1 cervical carcinoma from stage II disease in a 46-year-old woman. (a) Axial T2-weighted MR image shows an intermediate-signal-intensity cervical mass with contiguous isointense nodular soft tissue (arrowhead) extending into the left medial parame-trium, a finding that probably represents secondary parametrial involvement (stage II). (b) Axial fused image derived from the superimposition of an ADC pseudocolor map onto the T2-weighted MR image delineates the tumor (arrows) as confined to the cervix and clearly shows the absence of parametrial inva-sion (stage IB1). Pathologic examination of the surgical specimen confirmed stage IB1 disease.
Parameters for Optimal DW Imaging of the Pelvis
Pelvic DW imaging is performed by using single-shot echo-planar sequences, which are limited by susceptibility artifacts and a low sig-nal-to-noise ratio. Susceptibility artifacts can be minimized by reducing the echo time (usually to 50–90 msec), reducing the echo train length (by using a parallel imaging technique such as gen-eralized autocalibrating partially parallel acquisi-tion [GRAPPA] or modified sensitivity encod-ing [mSENSE]), and using a wide bandwidth (1500–2000 MHz). The signal-to-noise ratio can be improved by imaging at a high field strength (3 T vs 1.5 T), reducing the echo time to less than 100 msec (usually 50–90 msec), increasing the signal averages to a range of 5–7, and using a section thickness of 4–5 mm and a field of view of 24–28 cm (1–5).
Application of DW Imaging to Gynecologic Oncology
Malignancy has been postulated to restrict water diffusivity by causing the following changes in the microarchitecture of the intracellular and ex-tracellular compartments: (a) increased cellular density, (b) shifting of water from extracellular to intracellular compartments, (c) restricted cel-lular permeability, (d) disrupted cell membrane depolarization, and (e) increased tortuosity of the extracellular space due to the chaotic growth of closely packed and swollen cells in a hypercellular tumor (1–5). The potential application of DW imaging to oncology is a field of extensive ongo-ing research.
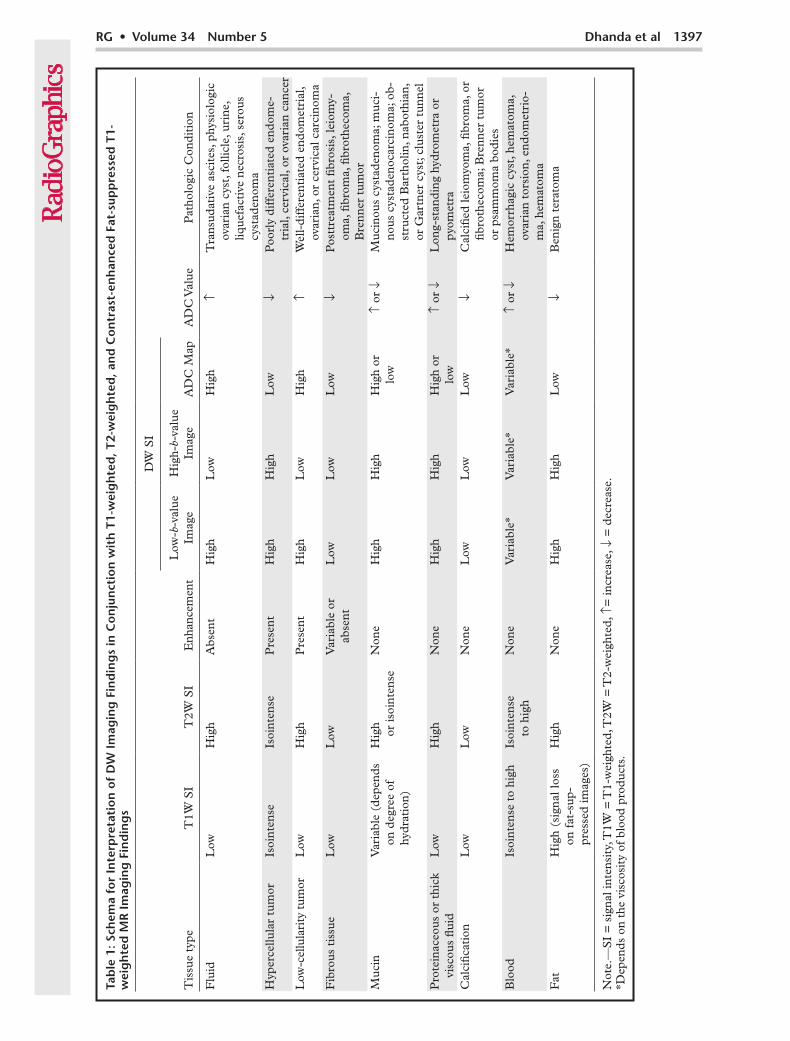
Image InterpretationTable 1 provides a schema for interpreting DW imaging findings in conjunction with findings on conventional T1- and T2-weighted MR im-ages and contrast-enhanced fat-suppressed T1-weighted MR images (1–5).
Pitfalls in Technique and Image Interpretation Table 2 lists various limitations encountered with DW imaging techniques and at image interpreta-tion (1–5).
T2 Shine-through Effect.—DW images are in-trinsically T2-weighted images. Tissues with long relaxation times exhibit high signal intensity on DW images, similar to that seen on conventional T2-weighted MR images. T2 shine-through effect refers to high signal intensity on both DW im-ages and ADC maps. In contrast, true restricted diffusion has high signal intensity on DW images and low signal intensity on ADC maps. DW im-ages should always be reviewed with ADC maps to avoid this pitfall. Isolated viewing of DW im-ages without correlation to ADC maps may lead to false-positive findings of restricted diffusion (1–6). T2 shine-through can also be reduced by using (a) a high b value and short echo time to reduce the T2 signal and (b) an exponential im-aging technique in which a new image is gener-ated by using the ratio of the DW image divided by the nonweighted image (3).
T2 Blackout Effect.—T2 blackout effect refers to hypointense signal intensity on T2-weighted DW
Low Signal-to-Noise Ratio and Low Spatial Res-olution.—The issue of signal-to-noise ratio has been discussed earlier in this article. DW images and ADC maps have poor anatomic detail and low spatial resolution. It is mandatory to analyze DW images and ADC maps in conjunction with higher-resolution anatomic MR images or to use fusion-imaging techniques (5).
No Single Threshold Value for ADC to Predict Pelvic Malignancy.—The DW imaging sequence can be obtained with or without breath holding. However, ADC measurements obtained from
Table 2: Common Technical and Imaging Interpretation Pitfalls at DW Imaging
T2 shine-through effectT2 blackout effectSusceptibility artifacts and image distortionLow spatial resolutionLow signal-to-noise ratioInability to set a universally acceptable standard threshold value for ADCs of different gynecologic tumorsRestricted diffusion in normal and nonmalignant tissuesAbsence of restriction in low-cellularity well-differentiated adenocarcinomas and malignant cystic tumors in the ovaryDW images depict tumor cellularity but not tumor atypia, another indicator of tumor gradeTumor necrosis (an indicator of poor differentiation) results in facilitated diffusion
Figure 3. Benign leiomyoma in a 25-year-old asymp-tomatic woman. (a) Axial T2-weighted MR image shows a well-defined hypointense mass in the posterior myo-metrium. (b, c) The lesion shows mild hypointensity on an axial high-b-value DW image (b = 800 sec/mm2) (b) and ADC map (c). The mean ADC value is 1.62 × 10⁻³ mm2/sec. Pathologic examination of the resected specimen confirmed a benign leiomyoma.
images and ADC maps (5,16,17). This appear-ance results from signal dropout in calcifications or fibrotic tissues and is seen mostly in benign lesions such as uterine leiomyomas (Fig 3), fi-brothecomas, fibromas, Brenner tumors, and cystadenofibromas (5,16,17). However, in cases of peritoneal carcinomatosis, dense calcifications in calcified peritoneal implants from ovarian can-cer may interfere with lesion detection at DW im-aging and with calculation of ADC values (17).
Susceptibility Artifacts and Image Distortion.—The echo-planar sequence used at DW imaging is particularly susceptible to magnetic field inhomo-geneities. A major source of these artifacts at ab-dominopelvic imaging is air in the lung bases and bowel. This problem is amplified at 3-T imaging. Susceptibility artifacts can be reduced by using a shorter echo time, smaller numbers of echo train length, and a greater bandwidth (3,5).
RG • Volume 34 Number 5 Dhanda et al 1399
breath-holding DW images are different than those derived from respiratory-triggered free-breathing DW imaging sequences. The mean ADC values of cancer and normal tissues vary considerably between institutions because of dif-ferences in scanner hardware, the nature of the DW imaging pulse sequence, and the choice of sequence parameters (3,5,18–20). It is difficult to set universally acceptable standard threshold values for the ADCs of different gynecologic tu-mors. In research studies that used different MR imaging systems and different imaging sequences with phantoms, a variation of less than 15% has been found in ADC values, which suggests good reproducibility (5,18,19). However, the ADC values for various tissues should be established for each institution on the basis of findings in an initial patient cohort, and the thresholds de-rived from this cohort should be applied locally (4,18–20).
Restricted Diffusion in Normal Structures and Nonmalignant Lesions.—Restricted diffusion may be noted in normal tissue (Fig 4); in a non-malignant lesion with a high cellular density; and in a cystic nonmalignant lesion with high-viscosity proteinaceous, keratinous, hemorrhagic, or mucinous contents, such as an endometrioma (Fig 5), hematosalpinx (Fig 6), hemorrhagic ovarian cyst (Fig 7), hematometra, pyometra (Fig
8), tubo-ovarian abscess, benign cystic teratoma (Fig 9), Bartholin cyst, or nabothian cyst. We have also observed restricted diffusion that simu-lated findings of carcinoma in a proved case of cervical tuberculosis (Fig 10).
Table 3 lists normal anatomic structures and nonmalignant lesions that may show restricted diffusion at DW imaging (1–5,21).
Absence of Restriction in Some Ovarian Tu-mors.—Overreliance on DW imaging for lesion detection and characterization may result in the overlooking of low-cellularity well-differentiated adenocarcinomas and malignant cystic tumors of the ovary, especially peritoneal implants (17), and erroneous interpretation of malignant ovar-ian lesions as benign (Fig 11) (18). DW imaging findings should always be interpreted in conjunc-tion with the lesion morphology seen on conven-tional MR images and the enhancement pattern seen on dynamic contrast-enhanced MR images (1–5,18).
Tumor Necrosis as a Confounding Factor in ADC Calculation.—Tumor necrosis, an indicator of poor differentiation in a neoplasm, results in facili-tated diffusion. Although there is no standardized method for ROI placement, the size and place-ment of the ROI are crucial for assessing hetero-geneous lesions with necrosis (5,18). For lesion
Figure 4. Cervical carcinoma in a 39-year-old woman. (a) Axial T2-weighted MR image shows an intermediate-signal-intensity mass in the uterine cervix (*), with complete disruption of the stromal ring and an irregular interface with the right parametrium suggestive of invasion. (b, c) Axial high-b-value DW image (b = 800 sec/mm2) (b) shows high signal intensity in the mass, and ADC map (c) shows low signal intensity in the mass, findings consistent with restricted diffusion. The ROI (1) is drawn over the mass. Pathologic examination confirmed cervical carcinoma with parametrial involvement. Also note the curvilinear band of restricted diffusion (arrow in b and c) in the left hemipelvis, an-terolateral to the cervical mass. Correlation with the MR image in a shows the band to be a bowel loop and underscores the im-portance of concomitant interpretation of DW and conventional MR images. An isolated reading of the DW image would have led to misinterpretation of the bowel loop as peritoneal metastases.
Figure 5. Endometrioma in a 33-year-old woman with infertility. (a) Coro-nal T1-weighted MR image shows a left ovarian cyst with homogeneous high signal intensity, a finding that persisted at fat-suppressed T1-weighted MR im-aging (not shown). (b) Coronal T2-weighted MR image shows shading within the cyst, a finding that represents an endometrioma, which was confirmed at laparoscopy and pathologic examination. (c, d) Coronal high-b-value DW im-age (b = 800 sec/mm2) (c) and ADC map (d) show bright and dark signal in-tensity, respectively, in the lesion, findings consistent with restricted diffusion. On the T2-weighted MR image in b, also note a focal hypointense lesion in the posterior myometrium (arrow in b) with ill-defined margins, tiny hyper-intense cystic foci in the lesion, and an indistinct junctional zone, features indicative of an adenomyoma. The lesion shows mildly hypointense signal in c and hyperintense signal in d, findings consistent with facilitated diffusion.
Figure 6. Hematosalpinx in a 28-year-old female pa-tient with endometriosis. (a) Axial T1-weighted MR image shows a dilated left fallopian tube (arrows) with peritubal adhesions (arrowhead), thickened walls, and heterogeneous predominantly hyperintense contents consistent with blood products. (b, c) Axial high-b-value DW image (b = 800 sec/mm2) (b) and ADC map (c) show restricted diffusion in the dilated tube (arrows).
RG • Volume 34 Number 5 Dhanda et al 1401
Figure 7. Hemorrhagic ovarian cysts in a 33-year-old female patient undergoing warfarin therapy for rheumatic heart disease. (a) Axial T1-weighted MR image shows an enlarged left ovary with multiple variously sized round le-sions with variable central signal intensity and hyperintense peripheral signal. The lesions showed hyperintense signal with peripheral hemosiderin staining on T2-weighted MR images (not shown) and persistent high signal intensity and absent enhancement on fat-suppressed T1-weighted MR images (not shown), features representing hemorrhagic cysts. (b, c) Axial high-b-value DW image (b = 800 sec/mm2) (b) and ADC map (c) show hyperintense and hypoin-tense signal intensity, respectively, findings consistent with restricted diffusion in the lesions.
Figure 8. Cervical carcinoma and an obstructed endometrial cavity with high-viscosity retained se-cretions in a 42-year-old female patient. (a) Axial T2-weighted MR image shows an infiltrative cervical mass (arrow) and fluid collection in the endometrial cavity (*). (b, c) Axial pseudocolor high-b-value DW image (b = 800 sec/mm2) (b) and ADC map (c) show restricted diffusion in the cervical and endo-metrial regions (ADC = 0.36 × 10⁻³ and 0.37 × 10⁻³ mm2/sec, respectively.) In such cases, correlation of the DW and anatomic MR images is mandatory to exclude tumor in the endometrial cavity. 3 = endo-metrial ROI, 4 = cervical ROI.
Figure 9. Adnexal masses in a 33-year-old woman with infertility. (a) Axial computed tomographic (CT) image shows bilateral complex adnexal masses. The right adnexal lesion shows fat-fluid level (arrow-head) and mural calcification (arrow), and the left adnexal lesion shows homogeneous fat attenuation, fea-tures consistent with benign cystic teratomas. (b) Axial T1-weighted MR image shows high signal intensity corresponding to the areas of fat attenuation, which showed signal loss on a fat-suppressed T1-weighted image (not shown). (c, d) Axial high-b-value DW image (b = 800 sec/mm2) (c) and ADC map derived from source images with b values of 0 and 800 sec/mm2 (d) show severely restricted diffusion in the fatty component (ADC value = 0.28 × 10⁻³ mm2/sec) and facilitated diffusion in the fluid component (ADC value = 2.82 × 10⁻³ mm2/sec) of the lesions. 3 = ROI in fatty component, 4 = ROI in fluid component.
characterization, the ROI should always be placed on the solid portions of the lesion. Correlation of DW images with conventional MR images should be performed to identify cystic and necrotic areas that should be avoided at ROI placement. ADC measurements calculated from cystic and necrotic areas would be high and could result in misclas-sification of the lesion as benign. However, for as-sessment of a tumor’s treatment response, the ROI should be placed on the same area both before and after treatment. An increase in ADC values in a particular voxel due to necrosis and cystic change after treatment should be documented (18,22).
DW Imaging of Uterine Lesions
Tumor Detection.—Transvaginal sonography (TVS) is the procedure of choice for initial evalu-ation of patients with suspected endometrial car-cinoma. An endometrial thickness of more than
5 mm at TVS in patients with postmenopausal bleeding requires endometrial sampling for diag-nosis of endometrial cancer (5,23,24). However, if TVS cannot be performed or if the histopatho-logic findings are inconclusive, MR imaging can be performed for lesion detection (5). Very early-stage small cancers that do not cause significant endometrial thickening may not be detected at conventional MR imaging. However, endometrial cancer shows evidence of restricted diffusion, and DW imaging may be useful in such isolated cases. The normal proliferative endometrium is hypercellular and may demonstrate bright signal intensity on source DW images; however, the ADC values of endometrial cancer are signifi-cantly lower than those of the normal endome-trium (Fig 12). Hence, DW imaging may be used to help differentiate endometrial cancer from the normal endometrium (1,10,25–28). The ADC values of higher-grade endometrial cancers tend
RG • Volume 34 Number 5 Dhanda et al 1403
to decrease compared with those of lower-grade cancers. However, the use of DW imaging to dif-ferentiate histologic grades of endometrial cancer is much debated because of the considerable overlap reported in ADC values (10,25–28).
Determining Depth of Myometrial Invasion in Endometrial Carcinoma.—In addition to tu-mor grade, histologic subtype, and lymph node involvement, the depth of myometrial invasion is an important prognostic marker in patients
with endometrial cancer. It predicts the risk for lymph node metastases and determines the type of hysterectomy required and the need for lymph node dissection (5,29,30). Endometrial cancer is hypovascular relative to the myometrium. Hence, dynamic contrast-enhanced MR imaging is performed as an adjunct to high-resolution T2-weighted MR imaging for highly accurate assess-ment of myometrial invasion (5,30). Determining the depth of myometrial invasion may be difficult in the region of the uterine cornua; if there are
Figure 10. Restricted diffusion in a 70-year-old woman with post-menopausal bleeding in whom speculum examination revealed a friable papillary growth on the ectocervix. (a) Sagittal T2-weighted MR image shows an infiltrative exophytic mass of ectocervix (arrow) extending into the posterior vaginal wall. The endometrium is irregular, with al-tered myometrial signal intensity and loss of the zonal anatomy of the uterus. (b, c) Axial high-b-value DW image (b = 800 sec/mm2) (b) and ADC map (c) show restricted diffusion in the cervical lesion (arrow), which raises a strong possibility of malignant growth. However, a cervi-cal biopsy (repeated twice) showed chronic cervicitis with noncaseating granulomas. Endometrial sampling showed chronic endometritis. The lesions regressed with antitubercular treatment, which confirmed their tubercular origin.
Table 3: Restricted Diffusion in Normal Anatomic Structures and Nonmalignant Lesions
Normal tissues with high cellular density that may show restricted diffusion Normal proliferative endometrium Normal or reactive lymph nodes Normal bowel mucosa Normal ovariesNonmalignant pathologic conditions with restricted diffusion Coagulative necrosis Abscesses (eg, endometrial, tubo-ovarian) Retained mucus in an obstructed endometrial cavity Dense keratinous contents in a mature cystic teratoma Dense hemorrhagic contents in an endometrioma, hemorrhagic cyst, or hematosalpinx Fibrosis
polyps) have been shown to have significantly dif-ferent ADC values; thus ADC values are a poten-tial tool for differentiating benign from malignant lesions (Fig 14) (11,33,34).
DW imaging may also aid in differentiating benign lesions (eg, leiomyomas, adenomyosis) from malignant myometrial lesions (Figs 3, 5, 15) (5,12,26,35,36). Uterine sarcomas (most com-
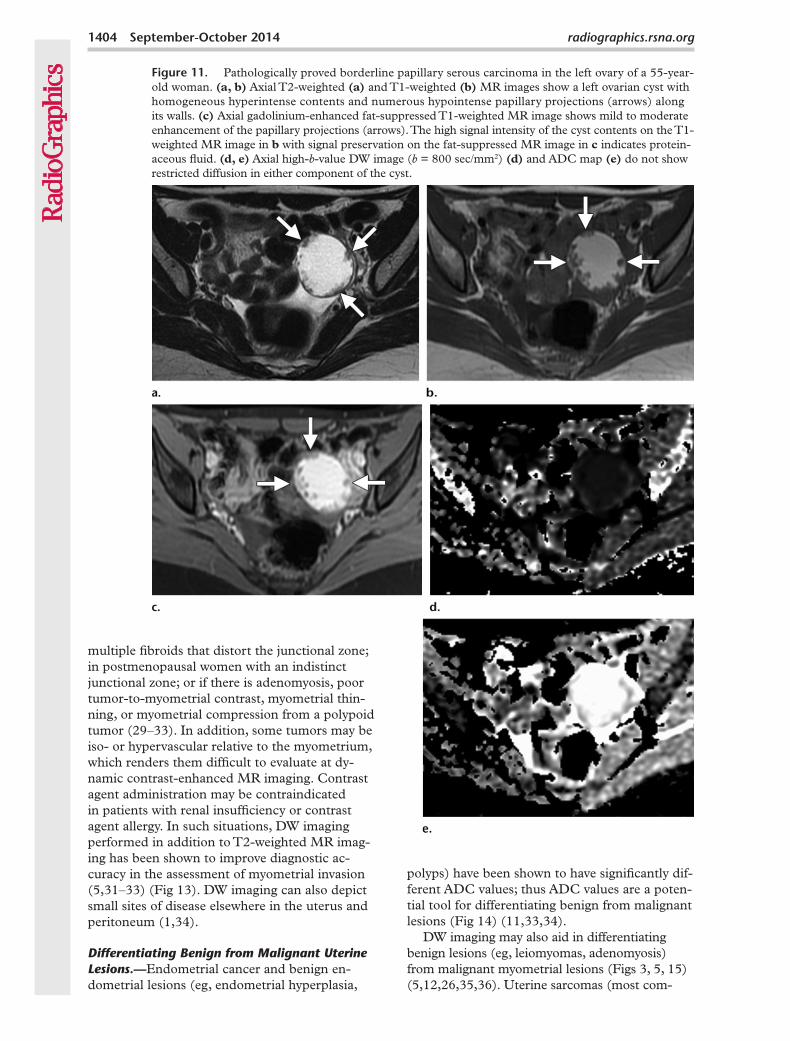
Figure 11. Pathologically proved borderline papillary serous carcinoma in the left ovary of a 55-year-old woman. (a, b) Axial T2-weighted (a) and T1-weighted (b) MR images show a left ovarian cyst with homogeneous hyperintense contents and numerous hypointense papillary projections (arrows) along its walls. (c) Axial gadolinium-enhanced fat-suppressed T1-weighted MR image shows mild to moderate enhancement of the papillary projections (arrows). The high signal intensity of the cyst contents on the T1-weighted MR image in b with signal preservation on the fat-suppressed MR image in c indicates protein-aceous fluid. (d, e) Axial high-b-value DW image (b = 800 sec/mm2) (d) and ADC map (e) do not show restricted diffusion in either component of the cyst.
multiple fibroids that distort the junctional zone; in postmenopausal women with an indistinct junctional zone; or if there is adenomyosis, poor tumor-to-myometrial contrast, myometrial thin-ning, or myometrial compression from a polypoid tumor (29–33). In addition, some tumors may be iso- or hypervascular relative to the myometrium, which renders them difficult to evaluate at dy-namic contrast-enhanced MR imaging. Contrast agent administration may be contraindicated in patients with renal insufficiency or contrast agent allergy. In such situations, DW imaging performed in addition to T2-weighted MR imag-ing has been shown to improve diagnostic ac-curacy in the assessment of myometrial invasion (5,31–33) (Fig 13). DW imaging can also depict small sites of disease elsewhere in the uterus and peritoneum (1,34).
Differentiating Benign from Malignant Uterine Lesions.—Endometrial cancer and benign en-dometrial lesions (eg, endometrial hyperplasia,
RG • Volume 34 Number 5 Dhanda et al 1405
monly leiomyosarcomas, mixed mullerian tumors, endometrial stromal sarcomas, and rhabdomyosar-comas) are commonly seen as large heterogeneous masses with intermediate to high T2 signal inten-sity, irregular margins, and invasion of adjoining structures. They may show foci of hyperintensity on T1-weighted images that correspond to areas of hemorrhage (37,38). In contrast, leiomyomas typically appear as well-circumscribed masses that are isointense relative to muscle on T1-weighted images and hypointense on T2-weighted images. Leiomyomas are composed of whorls of uniform smooth muscle cells with varying amounts of fi-brous connective tissue. Their morphology may be cellular (compact smooth muscle cells with little or no collagen), nondegenerated fibrous (predomi-nantly collagenous), or degenerated. Diagnosis of ordinary leiomyomas on the basis of morphologic MR imaging findings is straightforward. However, cellular and degenerated fibroids have variable imaging appearances, with high signal intensity on T2-weighted images and heterogeneous enhance-ment on contrast-enhanced MR images, and may be difficult to differentiate from uterine sarcomas on conventional MR images alone (2,5,39). The mean ADC values of uterine sarcomas have been
shown to be significantly lower than those of nor-mal myometrium and benign leiomyomas (Fig 3) (5,12). However, cellular leiomyomas may have ADC values that overlap with those of leiomyosar-comas (2,12).
Another application of DW imaging is re-lated to the monitoring and follow-up of ab-lated uterine fibroids after MR image–guided high-frequency ultrasonographic (US) surgery, as demonstrated by Jacobs et al (40). An initial posttreatment decrease in ADC values was ob-served in successfully ablated tissues, followed by a temporal increase at 6-month follow-up (hy-pothesized to be due to initial treatment-induced cytotoxic edema [infarction]) and necrosis and cell loss at long-term follow-up.
Intramyometrial LGESS may simulate ad-enomyosis on conventional T2-weighted MR images (41). Myometrial invasion by an LGESS is very infiltrative. It is characteristically seen on T2-weighted MR images as preserved low-signal-intensity muscle bundles in a high-signal-inten-sity tumor. At DW imaging, it shows high signal intensity with decreased ADC values, which provides a clue to diagnosis of this rare malig-nant tumor when interpreted in conjunction with
Figure 12. Stage T1a endometrial carcinoma in a 62-year-old woman. (a) Sagittal T2-weighted MR image shows an intermediate-signal-inten-sity mass in the endometrial cavity causing stretching of the junctional zone, with a sharp tumor-myometrial interface; however, there is no frank myometrial invasion. (b, c) Axial high-b-value DW image (b = 800 sec/mm2) (b) and ADC map (c) reveal very high and low signal intensity, re-spectively, in the mass (arrow). The mean ADC value of the mass is 0.87 × 10⁻³ mm2/sec, a finding consistent with restricted diffusion.
high-resolution T2-weighted MR images (36). DW imaging is also useful for preoperative plan-ning because it can demonstrate tumor extension along the vessels, which is another characteristic of an LGESS (Fig 15) (36,41).
DW Imaging of Cervical Lesions
Lesion Detection and Staging.—Cervical car-cinoma is primarily diagnosed on the basis of cytology (at screening) or biopsy (after clinical presentation). At conventional MR imaging, a visible tumor indicates stage IB or higher cancer. Imaging detection of carcinoma in situ or a stage IA tumor remains a challenge. Hence, conven-tional MR imaging has a limited clinical use for primary diagnosis of cervical cancer. However, MR imaging is widely used for therapeutic plan-ning and preoperative staging of cervical can-cer to assess tumor size, the pattern of disease growth, parametrial and pelvic sidewall invasion, and lymph node status. The tumor is best de-lineated on T2-weighted MR images, where it is seen as an intermediate-signal-intensity mass that is easily distinguishable from the low-signal-in-
tensity cervical stroma. However, in patients with isointense tumors (eg, young women where the stroma may not be very hypointense), diffusely infiltrating adenocarcinomas, or early cervical cancer if fertility-preserving surgery is planned, T2-weighted MR images may be suboptimal for tumor delineation (5,30,42). Cervical carcinoma shows restricted diffusion, and DW imaging may add diagnostic value in these cases (Fig 16).
A study by Naganawa et al (7) of 12 patients with cervical cancer demonstrated significantly lower mean ADC values in cervical cancer lesions (1.09 ± 0.20 × 10⁻³ mm2/sec) than in normal cervical tissue (1.79 ± 0.24 × 10⁻³ mm2/sec) (P < .0001), findings that suggest the potential use of DW imaging as a tool to differentiate nor-mal from cancerous cervical tissue. Charles-Ed-wards et al (43) reported that DW imaging with use of an endovaginal coil could further improve detection of early stage IA and IB disease, even in patients after cone biopsy where granulation tis-sue may be a confounding factor on conventional T2-weighted MR images. Many recent investiga-tions have suggested that ADC measurements may help differentiate normal from cancerous
Figure 13. Pathologically proved stage IIIA endometrial carcinoma in a 58-year-old woman. (a) Sagittal T2-weighted MR image shows an intermediate-signal-intensity endometrial mass with ill-defined margins and poor distinction from the myometrium. (b, c) Axial high-b-value DW image (b = 800 sec/mm2) (b) and ADC pseudocolor map (c) show deep myometrial invasion, with focal tumor extension to the serosa along the anterior surface (arrow).
RG • Volume 34 Number 5 Dhanda et al 1407
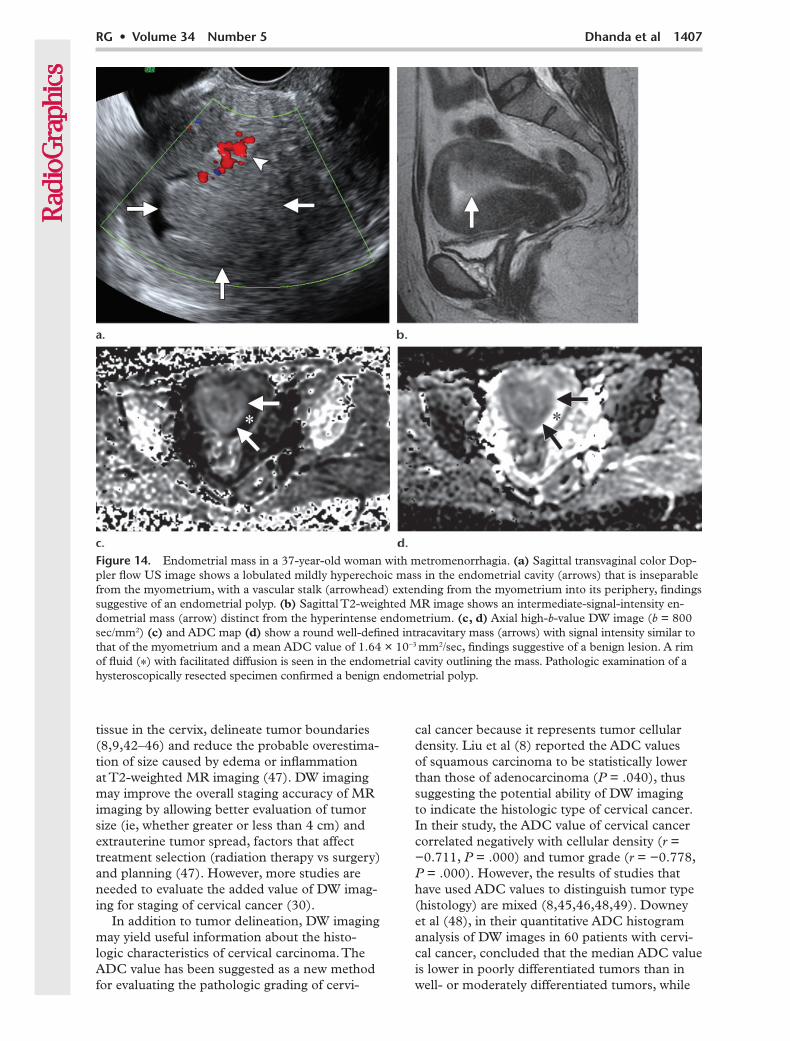
Figure 14. Endometrial mass in a 37-year-old woman with metromenorrhagia. (a) Sagittal transvaginal color Dop-pler flow US image shows a lobulated mildly hyperechoic mass in the endometrial cavity (arrows) that is inseparable from the myometrium, with a vascular stalk (arrowhead) extending from the myometrium into its periphery, findings suggestive of an endometrial polyp. (b) Sagittal T2-weighted MR image shows an intermediate-signal-intensity en-dometrial mass (arrow) distinct from the hyperintense endometrium. (c, d) Axial high-b-value DW image (b = 800 sec/mm2) (c) and ADC map (d) show a round well-defined intracavitary mass (arrows) with signal intensity similar to that of the myometrium and a mean ADC value of 1.64 × 10⁻³ mm2/sec, findings suggestive of a benign lesion. A rim of fluid (*) with facilitated diffusion is seen in the endometrial cavity outlining the mass. Pathologic examination of a hysteroscopically resected specimen confirmed a benign endometrial polyp.
tissue in the cervix, delineate tumor boundaries (8,9,42–46) and reduce the probable overestima-tion of size caused by edema or inflammation at T2-weighted MR imaging (47). DW imaging may improve the overall staging accuracy of MR imaging by allowing better evaluation of tumor size (ie, whether greater or less than 4 cm) and extrauterine tumor spread, factors that affect treatment selection (radiation therapy vs surgery) and planning (47). However, more studies are needed to evaluate the added value of DW imag-ing for staging of cervical cancer (30).
In addition to tumor delineation, DW imaging may yield useful information about the histo-logic characteristics of cervical carcinoma. The ADC value has been suggested as a new method for evaluating the pathologic grading of cervi-
cal cancer because it represents tumor cellular density. Liu et al (8) reported the ADC values of squamous carcinoma to be statistically lower than those of adenocarcinoma (P = .040), thus suggesting the potential ability of DW imaging to indicate the histologic type of cervical cancer. In their study, the ADC value of cervical cancer correlated negatively with cellular density (r = −0.711, P = .000) and tumor grade (r = −0.778, P = .000). However, the results of studies that have used ADC values to distinguish tumor type (histology) are mixed (8,45,46,48,49). Downey et al (48), in their quantitative ADC histogram analysis of DW images in 60 patients with cervi-cal cancer, concluded that the median ADC value is lower in poorly differentiated tumors than in well- or moderately differentiated tumors, while
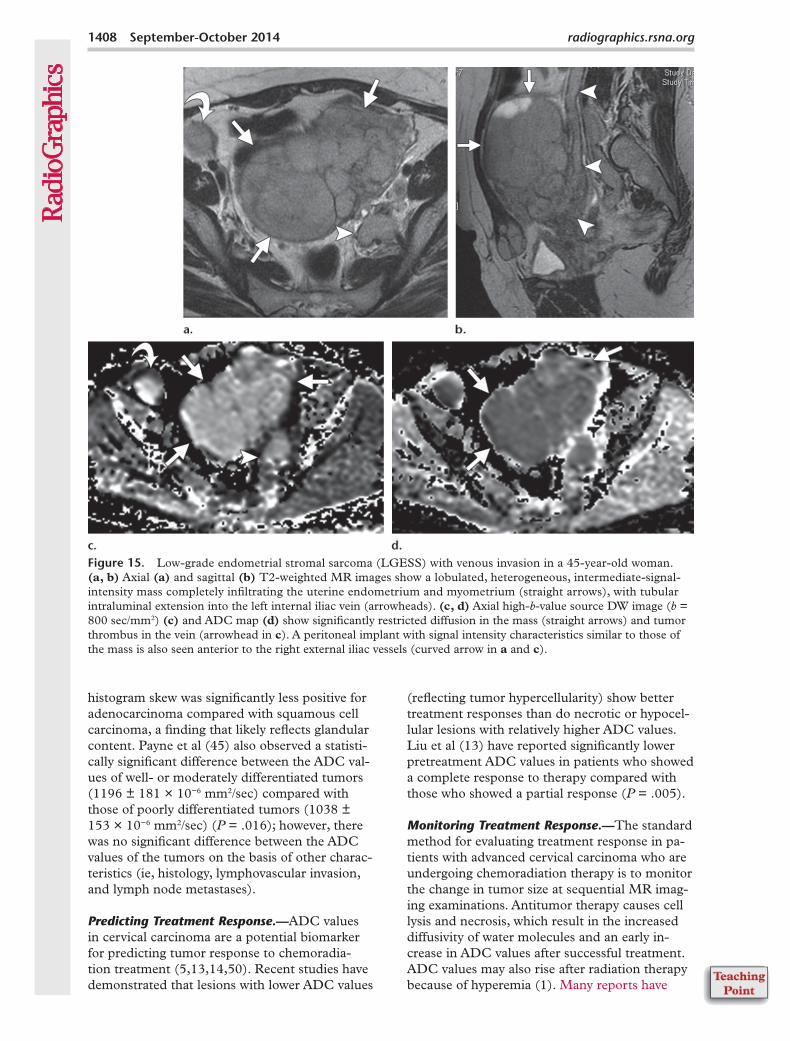
Figure 15. Low-grade endometrial stromal sarcoma (LGESS) with venous invasion in a 45-year-old woman. (a, b) Axial (a) and sagittal (b) T2-weighted MR images show a lobulated, heterogeneous, intermediate-signal-intensity mass completely infiltrating the uterine endometrium and myometrium (straight arrows), with tubular intraluminal extension into the left internal iliac vein (arrowheads). (c, d) Axial high-b-value source DW image (b = 800 sec/mm2) (c) and ADC map (d) show significantly restricted diffusion in the mass (straight arrows) and tumor thrombus in the vein (arrowhead in c). A peritoneal implant with signal intensity characteristics similar to those of the mass is also seen anterior to the right external iliac vessels (curved arrow in a and c).
histogram skew was significantly less positive for adenocarcinoma compared with squamous cell carcinoma, a finding that likely reflects glandular content. Payne et al (45) also observed a statisti-cally significant difference between the ADC val-ues of well- or moderately differentiated tumors (1196 ± 181 × 10−6 mm2/sec) compared with those of poorly differentiated tumors (1038 ± 153 × 10−6 mm2/sec) (P = .016); however, there was no significant difference between the ADC values of the tumors on the basis of other charac-teristics (ie, histology, lymphovascular invasion, and lymph node metastases).
Predicting Treatment Response.—ADC values in cervical carcinoma are a potential biomarker for predicting tumor response to chemoradia-tion treatment (5,13,14,50). Recent studies have demonstrated that lesions with lower ADC values
(reflecting tumor hypercellularity) show better treatment responses than do necrotic or hypocel-lular lesions with relatively higher ADC values. Liu et al (13) have reported significantly lower pretreatment ADC values in patients who showed a complete response to therapy compared with those who showed a partial response (P = .005).
Monitoring Treatment Response.—The standard method for evaluating treatment response in pa-tients with advanced cervical carcinoma who are undergoing chemoradiation therapy is to monitor the change in tumor size at sequential MR imag-ing examinations. Antitumor therapy causes cell lysis and necrosis, which result in the increased diffusivity of water molecules and an early in-crease in ADC values after successful treatment. ADC values may also rise after radiation therapy because of hyperemia (1). Many reports have
RG • Volume 34 Number 5 Dhanda et al 1409
described the potential role of DW imaging as a surrogate marker for early detection of treatment response (1,4,5,8,13,14,22,30,42). It can be used to assess response qualitatively, by inspecting signal intensity changes on high-b-value images, and quantitatively, by using ADC measurements (1,30). Harry et al (22) reported that an increase in ADC values after 2 weeks of treatment was indicative of response even before changes in tumor size occurred. Postchemotherapy changes manifest more rapidly and earlier at DW imaging than at dynamic contrast-enhanced MR imaging, which depicts changes after one or two chemo-therapy cycles. After tumor embolization, ADC values change after several days. Functional MR images obtained after chemoradiation therapy should be interpreted against the background of the patient’s treatment schedule (1,30). However, necrotic lesions will show facilitated diffusion be-fore and after chemoradiation therapy and cannot be evaluated in this manner.
Tumor Recurrence.—Recurrent disease after surgery or chemoradiation therapy shows signal intensity characteristics, an enhancement pat-tern, and restricted diffusion similar to those of the primary disease (Fig 17). Hence, DW imag-ing can facilitate differentiation of posttreatment
fibrosis from disease recurrence when interpreted in conjunction with T2-weighted MR images. Posttreatment fibrosis will show dark signal on T2-weighted MR and DW images and ADC maps (Fig 18), while residual disease will show persistent restricted diffusion with intermedi-ate signal intensity on T2-weighted MR images (5). In the immediate posttreatment setting, the specificity of positron emission tomography (PET)/CT may be reduced because of possibly indistinguishable morphologic features and in-tense radiotracer uptake in both inflammatory tissues and tumors. DW imaging may be useful for assessment in such situations, where edema and inflammation tend to show high ADC values, while low ADC values suggest residual active tu-mor cells (6).
DW Imaging for Pelvic Lymph Node StagingLymph node metastases have an important impact on surgery and radiation therapy plan-ning in cases of female pelvic cancer (30). The standard method for predicting nodal metastases at CT and MR imaging is based on size, with a short-axis diameter that exceeds 10 mm com-monly used as the threshold value. However, this criterion is a poor discriminator of metastatic
Figure 16. Stage IB1 cervical squamous cell carcinoma in a 37-year-old woman. (a) On an axial T2-weighted MR image, the cervical lesion is difficult to visualize. An ill-defined area of focal intermediate signal intensity is seen in the endocervical canal, with an intact stromal ring. (b, c) Axial high-b-value source DW image (b = 800 sec/mm2) (b) shows a hyperintense focal lesion (arrows) in the same location as in a. The lesion has correspond-ing low signal intensity on the ADC map (c).The DW image and ADC map clearly delineate a small early-stage cancer.
and benign nodes (1,30,44). Morphologic signs of nodal involvement such as necrosis (very high positive predictive value), signal intensity similar to that of the primary tumor, irregular borders, and extranodal spread are infrequently seen (1,30). The challenge lies in detection of nodal metastases in small nodes (Fig 19). Because DW imaging increases the conspicuity of hypercellular nodes, it can be used as a valuable lymph node mapping tool in patients with ascites or a paucity of pelvic fat, conditions which otherwise render small nodes less visible (1).
The use of DW imaging to differentiate metastatic from reactive nodes is still under in-vestigation. Conflicting reports have appeared in the literature, with a few series reporting the mean ADC values of metastatic nodes to be significantly lower than those of benign nodes (44,46,51–54), while other investigators report no statistical significance (55,56). Necrosis is a confounding factor on DW images and results in raised ADC values in necrotic nodes (1). However, the overall evidence to date supports the potential role of DW imaging in predicting nodal metastases, and further research is needed to validate these findings. Lin et al (52) showed that compared with conventional MR imaging,
a method that combined size and relative ADC values had an improved sensitivity (25% vs 83%) and similar specificity (98% vs 99%) for detect-ing pelvic lymph node metastasis in patients with cervical and uterine cancers. The smallest meta-static lymph node detected by this method mea-sured 5 mm at its short axis. Choi et al (51) also reported superior correlation of ADC values with PET/CT findings for detecting metastatic nodes compared with use of conventional size-based criteria on T2-weighted MR images.
DW Imaging of Ovarian Lesions
Lesion Characterization.—US is the primary procedure of choice for detecting and character-izing adnexal lesions. Conventional MR imag-ing is reserved as a problem-solving tool when US findings are indeterminate. The additional diagnostic contribution of DW imaging for differ-entiating benign from malignant adnexal lesions remains controversial (57–61).
DW imaging gives variable results for ovar-ian carcinomas because of morphologic hetero-geneity and low cellularity in the large cystic components of solid cystic and multilocular cystic masses and in well-differentiated epithelial
Figure 17. Vaginal vault recurrence in a 49-year-old female pa-tient after surgery for cervical carcinoma. (a) Axial T2-weighted MR image shows an intermediate-signal-intensity nodular thick-ening in the vaginal vault (arrows). (b, c) Axial high-b-value DW image (b = 1000 sec/mm2) (b) and ADC map (c) show high and low signal intensity of the lesion, respectively (arrows), findings consistent with restricted diffusion in the thickened vault, with a mean ADC value of 0.94 × 10⁻³ mm2/sec.
RG • Volume 34 Number 5 Dhanda et al 1411
Figure 18. Vaginal vault fibrosis in the same patient as in Fig-ure 17 after radiation therapy for the recurrent lesion. Follow-up axial T2-weighted MR image (a), axial high-b-value DW image (b = 1000 sec/mm2) (b), and ADC map (c) show bandlike low signal intensity at the vaginal vault (arrowheads), a finding that represents fibrosis.
Figure 19. Lymph node metastasis in a 46-year-old woman with stage IB1 cervical squamous cell carci-noma. (a) Axial T2-weighted MR image shows an intermediate-signal-intensity left external iliac lymph node (arrow) with a short-axis dimension of 10 mm. (b, c) Axial high-b-value DW image (b = 1000 sec/mm2) (b) and ADC map (c) show restricted diffu-sion in the lymph node (LN, 3), with an ADC value of 0.94 × 10⁻³ mm2/sec. CT-guided fine-needle aspi-ration cytology of the node revealed metastatic squa-mous cell carcinoma.
Figure 20. Recurrent malignant granulosa cell tumor in a 72-year-old woman. (a) Axial fat-suppressed T2-weighted MR image shows a solid cystic pelvic mass with an intermediate-signal-intensity mural nodule (arrow). (b–d) The nodule (arrow) shows intense homogeneous enhancement on a contrast-en-hanced fat-suppressed T1-weighted image (b) and restricted diffusion on a high-b-value DW image (b = 800 sec/mm2) (c) and ADC map (d).
tumors (Figs 11, 20) (58–61). On the contrary, restricted diffusion may be seen in many benign lesions, such as mature cystic teratomas (Fig 9), endometriomas (Fig 5), hemorrhagic functional cysts (Fig 7), and cysts that contain dense mu-cinous material. Benign lesions with restricted diffusion may be accurately diagnosed when DW images are interpreted in conjunction with conventional T1-weighted and fat-suppressed T1- and T2-weighted MR images (Figs 5–9) (58–61).
ADC values have not proved useful in cystic adnexal masses to differentiate benign from ma-lignant lesions (59,60). Mature cystic teratomas exhibit lower ADC values than do any other benign or malignant adnexal lesions because of their keratinous contents (Fig 9) (2,21,58). This characteristic may add useful differential diag-nostic information for mature cystic teratomas in patients with a paucity of fat (21,58).
The hypercellular components of malignant lesions may demonstrate restricted diffusion (Fig 20). According to Thomassin-Naggara et al (16), complex adnexal lesions with a solid component
that were hypointense on both high-b-value DW images and T2-weighted MR images were found to be benign, while lesions with bright signal in-tensity on DW images and intermediate signal intensity on T2-weighted MR images were found to be malignant (Fig 20).
Recurrent Disease.—CT findings and serum can-cer antigen (CA)–125 levels are routinely used to assess disease recurrence in patients with ovarian cancer (5). PET/CT is considered the imaging investigation of choice for detecting relapse, es-pecially in patients with rising CA-125 levels and normal findings at conventional imaging (62). However, during the early postoperative period, PET/CT and conventional MR imaging have low specificity because of the frequently overlap-ping morphologic features of inflammatory tissue and tumor and the intense radiotracer uptake of both entities. DW imaging has been reported to be useful for detecting recurrence of ovarian carcinoma in both the pelvis and peritoneum, with areas of tumor recurrence showing restricted
RG • Volume 34 Number 5 Dhanda et al 1413
diffusion (5). However, because of the dearth of published data on the utility of DW imaging in posttreatment evaluation of ovarian carcinomas, further studies are needed to establish its role in this clinical setting.
DW Imaging of Meta static Peritoneal Implants
Detection.—The peritoneal cavity is a common site of metastases for gynecologic malignan-cies, especially ovarian cancers (5). Accurate mapping of peritoneal implants in patients with advanced ovarian cancer is important for mak-ing optimal management decisions (ie, chemo-therapy vs cytoreduction); however, it may be compromised because of the small size of the implants and the complex anatomy of the peri-toneal cavity (17). Hypercellular implants show restricted diffusion and hence are rendered more conspicuous because of remarkable con-trast with the surrounding organs and ascites,
Figure 21. Undifferentiated ovarian adenocarcinoma with peritoneal dissemination. Axial T2-weighted MR im-age (a) shows intermediate-signal-intensity nodular peritoneal metastases (arrows) in the pouch of Douglas, altered myometrial signal intensity with surface irregularity that represents uterine infiltration by peritoneal implants (*), and omental caking (arrowheads). These areas show bright signal intensity on an axial source DW image (b) and dark signal intensity on an ADC map (c), findings consistent with restricted diffusion that highlight the extent of pelvic disease. The restricted diffusion in the bowel noted in Figure 4 simulates the omental caking seen in this case, but review of the DW image in conjunction with the conventional MR image in Figure 4 helps in differentiation.
which show signal suppression on high-b-value DW images (Fig 21) (63). This enables detec-tion of small peritoneal implants, even in ana-tomically challenging locations, that may be missed on anatomic MR or CT images (15,17). Fujii et al (15) reported a sensitivity and speci-ficity of 90% and 95.5%, respectively, for detec-tion of peritoneal dissemination at DW imaging. The smallest implant detected in this study was 5 mm. Small implants may be obscured because of image degradation from cardiac and respira-tory motion in the upper abdomen and suscep-tibility artifacts at air-tissue interfaces on the bowel and diaphragmatic surface (64). In a DW imaging study that used b values of 400–500 sec/mm2 and a breath-holding technique, Low et al (64) reported better visualization of implants in the mesentery, bowel serosa, and peritoneal reflections around the liver, pancreas, and pelvis (surface of the bladder and uterus).
Treatment Response.—The role of DW imaging in the evaluation of treatment response in patients with ovarian carcinomatosis is still under investiga-tion. Sala et al (65) reported a significantly lower mean baseline ADC value and reduced blood flow for peritoneal deposits than for ovarian lesions and omental cake. These findings may explain the mixed treatment response that occurs at differ-ent disease sites, with peritoneal sites showing a relatively poor response. After treatment, ovarian sites showed a significant increase in ADC values in responders compared with nonresponders. ADC values for peritoneal disease and omental cake did not show significant change. Kyriazi et al (66) observed that quantitative DW imaging can
aid in the early monitoring of treatment efficacy in patients with advanced ovarian cancer. They reported an early increase in ADC values in re-sponse to chemotherapy.
ConclusionsDW imaging provides indispensable qualitative as well as quantitative information about gynecologic tumors and aids in superior lesion characteriza-tion, tumor staging, treatment planning, and dis-ease follow-up. Its potential to help predict and assess treatment response earlier than other tech-niques may provide insight into novel personalized approaches to patient care in gynecologic oncol-ogy and future drug development (18). Although DW imaging is an area of ongoing research, recent technical advances and increasing clinical interest in its role as a functional imaging tool are instru-mental in making it an integral part of pelvic MR imaging protocols without significantly increasing scan times. However, the interpreting radiologist should be cautious about overemphasizing DW imaging findings when viewed alone, owing to the considerable overlap between the DW imaging features of benign and malignant pathologic con-ditions. Because of the lack of universally accepted standard ADC threshold values for various tis-sues, each center needs to establish its own ADC values on the basis of an initial patient cohort to ensure good reproducibility of future results. Op-timal clinical application of DW imaging requires a thorough knowledge of its principles, imaging protocols, data processing software, and strengths and limitations, as well as a scheme for image interpretation.
wick M, Padhani AR. Diffusion-weighted MR im-aging of female pelvic tumors: a pictorial review. RadioGraphics 2009;29(3):759–774; discussion 774–778.
2. Saremi F, Knoll AN, Bendavid OJ, Schultze-Haakh H, Narula N, Sarlati F. Characterization of geni-tourinary lesions with diffusion-weighted imaging. RadioGraphics 2009;29(5):1295–1317.
3. Malayeri AA, El Khouli RH, Zaheer A, et al. Princi-ples and applications of diffusion-weighted imaging in cancer detection, staging, and treatment follow-up. RadioGraphics 2011;31(6):1773–1791.
4. Punwani S. Diffusion weighted imaging of female pelvic cancers: concepts and clinical applications. Eur J Radiol 2011;78(1):21–29.
5. Nougaret S, Tirumani SH, Addley H, Pandey H, Sala E, Reinhold C. Pearls and pitfalls in MRI of gynecologic malignancy with diffusion-weighted technique. AJR Am J Roentgenol 2013;200(2): 261–276.
6. Levy A, Medjhoul A, Caramella C, et al. Interest of diffusion-weighted echo-planar MR imaging and apparent diffusion coefficient mapping in gyneco-
logical malignancies: a review. J Magn Reson Imag-ing 2011;33(5):1020–1027.
7. Naganawa S, Sato C, Kumada H, Ishigaki T, Miura S, Takizawa O. Apparent diffusion coefficient in cer-vical cancer of the uterus: comparison with the nor-mal uterine cervix. Eur Radiol 2005;15(1):71–78.
8. Liu Y, Bai R, Sun H, Liu H, Wang D. Diffusion-weighted magnetic resonance imaging of uterine cervical cancer. J Comput Assist Tomogr 2009;33 (6):858–862.
9. McVeigh PZ, Syed AM, Milosevic M, Fyles A, Haider MA. Diffusion-weighted MRI in cervical cancer. Eur Radiol 2008;18(5):1058–1064.
11. Fujii S, Matsusue E, Kigawa J, et al. Diagnostic accuracy of the apparent diffusion coefficient in dif-ferentiating benign from malignant uterine endome-trial cavity lesions: initial results. Eur Radiol 2008; 18(2):384–389.
12. Tamai K, Koyama T, Saga T, et al. The utility of diffusion-weighted MR imaging for differentiating uterine sarcomas from benign leiomyomas. Eur Radiol 2008;18(4):723–730.
13. Liu Y, Bai R, Sun H, Liu H, Zhao X, Li Y. Diffusion-weighted imaging in predicting and monitoring the response of uterine cervical cancer to com-bined chemoradiation. Clin Radiol 2009;64(11): 1067–1074.
14. Hamstra DA, Rehemtulla A, Ross BD. Diffusion magnetic resonance imaging: a biomarker for treat-ment response in oncology. J Clin Oncol 2007;25 (26):4104–4109.
15. Fujii S, Matsusue E, Kanasaki Y, et al. Detection of peritoneal dissemination in gynecological malig-nancy: evaluation by diffusion-weighted MR imag-ing. Eur Radiol 2008;18(1):18–23.
16. Thomassin-Naggara I, Daraï E, Cuenod CA, et al. Contribution of diffusion-weighted MR imaging for predicting benignity of complex adnexal masses. Eur Radiol 2009;19(6):1544–1552.
17. Kyriazi S, Collins DJ, Morgan VA, Giles SL, deSouza NM. Diffusion-weighted imaging of peritoneal disease for noninvasive staging of advanced ovarian cancer. RadioGraphics 2010;30(5):1269–1285.
18. Padhani AR, Liu G, Koh DM, et al. Diffusion-weighted magnetic resonance imaging as a cancer biomarker: consensus and recommendations. Neo-plasia 2009;11(2):102–125.
19. Chenevert TL, Galbán CJ, Ivancevic MK, et al. Diffusion coefficient measurement using a temper-ature-controlled fluid for quality control in multi-center studies. J Magn Reson Imaging 2011;34(4): 983–987.
20. Ogura A, Hayakawa K, Miyati T, Maeda F. Imaging parameter effects in apparent diffusion coefficient determination of magnetic resonance imaging. Eur J Radiol 2011;77(1):185–188.
21. Nakayama T, Yoshimitsu K, Irie H, et al. Diffusion-weighted echo-planar MR imaging and ADC map-ping in the differential diagnosis of ovarian cystic masses: usefulness of detecting keratinoid sub-stances in mature cystic teratomas. J Magn Reson Imaging 2005;22(2):271–278.
22. Harry VN, Semple SI, Gilbert FJ, Parkin DE. Dif-fusion-weighted magnetic resonance imaging in the early detection of response to chemoradiation in cer-vical cancer. Gynecol Oncol 2008;111(2):213–220.
RG • Volume 34 Number 5 Dhanda et al 1415
23. Reinhold C, Khalili I. Postmenopausal bleeding: value of imaging. Radiol Clin North Am 2002;40 (3):527–562.
24. Ascher SM, Reinhold C. Imaging of cancer of the endometrium. Radiol Clin North Am 2002;40(3): 563–576.
25. Inada Y, Matsuki M, Nakai G, et al. Body diffusion-weighted MR imaging of uterine endometrial can-cer: is it helpful in the detection of cancer in non-enhanced MR imaging? Eur J Radiol 2009;70(1): 122–127.
26. Kilickesmez O, Bayramoglu S, Inci E, Cimilli T, Kayhan A. Quantitative diffusion-weighted magnetic resonance imaging of normal and diseased uterine zones. Acta Radiol 2009;50(3):340–347.
27. Bharwani N, Miquel ME, Sahdev A, et al. Diffu-sion-weighted imaging in the assessment of tumour grade in endometrial cancer. Br J Radiol 2011;84 (1007):997–1004.
28. Rechichi G, Galimberti S, Signorelli M, et al. En-dometrial cancer: correlation of apparent diffusion coefficient with tumor grade, depth of myometrial invasion, and presence of lymph node metastases. AJR Am J Roentgenol 2011;197(1):256–262.
29. Freeman SJ, Aly AM, Kataoka MY, Addley HC, Reinhold C, Sala E. The revised FIGO staging sys-tem for uterine malignancies: implications for MR imaging. RadioGraphics 2012;32(6):1805–1827.
30. Sala E, Rockall A, Rangarajan D, Kubik-Huch RA. The role of dynamic contrast-enhanced and diffu-sion weighted magnetic resonance imaging in the female pelvis. Eur J Radiol 2010;76(3):367–385.
31. Rechichi G, Galimberti S, Signorelli M, Perego P, Valsecchi MG, Sironi S. Myometrial invasion in endometrial cancer: diagnostic performance of dif-fusion-weighted MR imaging at 1.5-T. Eur Radiol 2010;20(3):754–762.
32. Beddy P, Moyle P, Kataoka M, et al. Evaluation of depth of myometrial invasion and overall staging in endometrial cancer: comparison of diffusion-weighted and dynamic contrast-enhanced MR im-aging. Radiology 2012;262(2):530–537.
33. Takeuchi M, Matsuzaki K, Nishitani H. Diffusion-weighted magnetic resonance imaging of endome-trial cancer: differentiation from benign endometrial lesions and preoperative assessment of myometrial invasion. Acta Radiol 2009;50(8):947–953.
34. Shen SH, Chiou YY, Wang JH, et al. Diffusion-weighted single-shot echo-planar imaging with par-allel technique in assessment of endometrial cancer. AJR Am J Roentgenol 2008;190(2):481–488.
35. Takeuchi M, Matsuzaki K, Nishitani H. Hyperin-tense uterine myometrial masses on T2-weighted magnetic resonance imaging: differentiation with diffusion-weighted magnetic resonance imaging. J Comput Assist Tomogr 2009;33(6):834–837.
36. Fujii S, Kaneda S, Tsukamoto K, et al. Diffusion-weighted imaging of uterine endometrial stromal sarcoma: a report of 2 cases. J Comput Assist To-mogr 2010;34(3):377–379.
37. Sahdev A, Sohaib SA, Jacobs I, Shepherd JH, Oram DH, Reznek RH. MR imaging of uterine sarcomas. AJR Am J Roentgenol 2001;177(6):1307–1311.
38. Tirumani SH, Ojili V, Shanbhogue AK, Fasih N, Ryan JG, Reinhold C. Current concepts in the im-aging of uterine sarcoma. Abdom Imaging 2013;38 (2):397–411.
39. Yamashita Y, Torashima M, Takahashi M, et al. Hy-perintense uterine leiomyoma at T2-weighted MR
imaging: differentiation with dynamic enhanced MR imaging and clinical implications. Radiology 1993;189(3):721–725.
40. Jacobs MA, Herskovits EH, Kim HS. Uterine fi-broids: diffusion-weighted MR imaging for monitor-ing therapy with focused ultrasound surgery—pre-liminary study. Radiology 2005;236(1):196–203.
41. Takeuchi M, Matsuzaki K. Adenomyosis: usual and unusual imaging manifestations, pitfalls, and prob-lem-solving MR imaging techniques. RadioGraphics 2011;31(1):99–115.
42. Chen J, Zhang Y, Liang B, Yang Z. The utility of diffusion-weighted MR imaging in cervical cancer. Eur J Radiol 2010;74(3):e101–e106. Published May 13, 2009. Accessed January 5, 2013.
43. Charles-Edwards EM, Messiou C, Morgan VA, et al. Diffusion-weighted imaging in cervical cancer with an endovaginal technique: potential value for improving tumor detection in stage Ia and Ib1 dis-ease. Radiology 2008;249(2):541–550.
44. Chen YB, Hu CM, Chen GL, Hu D, Liao J. Staging of uterine cervical carcinoma: whole-body diffusion-weighted magnetic resonance imaging. Abdom Imaging 2011;36(5):619–626.
45. Payne GS, Schmidt M, Morgan VA, et al. Evalua-tion of magnetic resonance diffusion and spectros-copy measurements as predictive biomarkers in stage 1 cervical cancer. Gynecol Oncol 2010;116 (2):246–252.
46. Xue HD, Li S, Sun F, et al. Clinical application of body diffusion weighted MR imaging in the diag-nosis and preoperative N staging of cervical cancer. Chin Med Sci J 2008;23(3):133–137.
47. Nicolet V, Carignan L, Bourdon F, Prosmanne O. MR imaging of cervical carcinoma: a practi-cal staging approach. RadioGraphics 2000;20(6): 1539–1549.
48. Downey K, Riches SF, Morgan VA, et al. Relation-ship between imaging biomarkers of stage I cervi-cal cancer and poor-prognosis histologic features: quantitative histogram analysis of diffusion-weighted MR images. AJR Am J Roentgenol 2013;200(2): 314–320.
49. Rosenkrantz AB. Histogram-based apparent diffu-sion coefficient analysis: an emerging tool for cervi-cal cancer characterization? AJR Am J Roentgenol 2013;200(2):311–313.
50. Chopra S, Verma A, Kundu S, et al. Evaluation of diffusion-weighted imaging as a predictive marker for tumor response in patients undergoing chemo-radiation for postoperative recurrences of cervical cancer. J Cancer Res Ther 2012;8(1):68–73.
51. Choi EK, Kim JK, Choi HJ, et al. Node-by-node correlation between MR and PET/CT in patients with uterine cervical cancer: diffusion-weighted imaging versus size-based criteria on T2WI. Eur Radiol 2009;19(8):2024–2032.
52. Lin G, Ho KC, Wang JJ, et al. Detection of lymph node metastasis in cervical and uterine cancers by diffusion-weighted magnetic resonance imaging at 3T. J Magn Reson Imaging 2008;28(1):128–135.
53. Kim JK, Kim KA, Park BW, Kim N, Cho KS. Fea-sibility of diffusion-weighted imaging in the differ-entiation of metastatic from nonmetastatic lymph nodes: early experience. J Magn Reson Imaging 2008;28(3):714–719.
54. Chen YB, Liao J, Xie R, Chen GL, Chen G. Dis-crimination of metastatic from hyperplastic pelvic lymph nodes in patients with cervical cancer by
diffusion-weighted magnetic resonance imaging. Abdom Imaging 2011;36(1):102–109.
55. Roy C, Bierry G, Matau A, Bazille G, Pasquali R. Value of diffusion-weighted imaging to detect small malignant pelvic lymph nodes at 3 T. Eur Radiol 2010;20(8):1803–1811.
56. Nakai G, Matsuki M, Inada Y, et al. Detection and evaluation of pelvic lymph nodes in patients with gynecologic malignancies using body diffusion-weighted magnetic resonance imaging. J Comput Assist Tomogr 2008;32(5):764–768.
57. Chilla B, Hauser N, Singer G, Trippel M, Froehlich JM, Kubik-Huch RA. Indeterminate adnexal masses at ultrasound: effect of MRI imaging findings on diagnostic thinking and therapeutic decisions. Eur Radiol 2011;21(6):1301–1310.
58. Mohaghegh P, Rockall AG. Imaging strategy for early ovarian cancer: characterization of adnexal masses with conventional and advanced imaging techniques. RadioGraphics 2012;32(6):1751–1773.
59. Fujii S, Kakite S, Nishihara K, et al. Diagnostic ac-curacy of diffusion-weighted imaging in differentiat-ing benign from malignant ovarian lesions. J Magn Reson Imaging 2008;28(5):1149–1156.
60. Katayama M, Masui T, Kobayashi S, et al. Dif-fusion-weighted echo planar imaging of ovarian tumors: is it useful to measure apparent diffusion coefficients? J Comput Assist Tomogr 2002;26(2): 250–256.
61. Moteki T, Ishizaka H. Diffusion-weighted EPI of cystic ovarian lesions: evaluation of cystic contents using apparent diffusion coefficients. J Magn Reson Imaging 2000;12(6):1014–1019.
62. Gu P, Pan LL, Wu SQ, Sun L, Huang G. CA 125, PET alone, PET-CT, CT and MRI in diagnosing recurrent ovarian carcinoma: a systematic review and meta-analysis. Eur J Radiol 2009;71(1):164–174.
63. Bozkurt M, Doganay S, Kantarci M, et al. Compari-son of peritoneal tumor imaging using conventional MR imaging and diffusion-weighted MR imaging with different b values. Eur J Radiol 2011;80(2): 224–228.
64. Low RN, Sebrechts CP, Barone RM, Muller W. Diffusion-weighted MRI of peritoneal tumors: com-parison with conventional MRI and surgical and histopathologic findings—a feasibility study. AJR Am J Roentgenol 2009;193(2):461–470.
65. Sala E, Priest AN, Kataoka M, et al. Apparent dif-fusion coefficient and vascular signal fraction mea-surements with magnetic resonance imaging: feasi-bility in metastatic ovarian cancer at 3 Tesla: technical development. Eur Radiol 2010;20(2):491–496.
66. Kyriazi S, Collins DJ, Messiou C, et al. Metastatic ovarian and primary peritoneal cancer: assessing chemotherapy response with diffusion-weighted MR imaging—value of histogram analysis of appar-ent diffusion coefficients. Radiology 2011;261(1): 182–192.
This journal-based SA-CME activity has been approved for AMA PRA Category 1 CreditTM. See www.rsna.org/education/search/RG.
Teaching Points September-October Issue 2014
Diffusion-weighted Imaging of Gynecologic Tumors: Diagnostic Pearls and Potential PitfallsSunita Dhanda, MD, FRCR • Meenakshi Thakur, MD • Rajendra Kerkar, MS • Pooja Jagmohan, MD, FRCR
Page 1394Image contrast is derived from differences in water diffusivity in tissues, which depends on tissue cel-lularity, the integrity of the cell membranes, and the presence of high-density extracellular hydrophobic macromolecules. No exogenous contrast material administration is required. Therefore, DW imaging can be used for patients with renal insufficiency or contrast agent allergy.
Page 1394Restricted diffusion of water molecules is directly proportional to expansion of the intracellular compart-ment, as in cytotoxic edema; increased cell membrane density due to hypercellularity; increased viscos-ity of fluid, as in abscesses, epidermoid cysts, and keratinous material; and increased tortuosity of the extracellular space. Facilitation of diffusion is seen in microenvironments with fewer cells (eg, necrotic tumors), defective cell membranes (eg, liquefactive necrosis), and fluid collections or cystic lesions with low viscosity.
Page 1395Therefore, DW imaging provides both qualitative (source images) as well as quantitative (ADC map) information regarding microscopic water motion. The source DW images should always be evaluated in conjunction with the ADC maps and correlated with conventional anatomic MR images (T1- and T2-weighted sequences) to avoid diagnostic pitfalls.
Pages 1408–1409Many reports have described the potential role of DW imaging as a surrogate marker for early detec-tion of treatment response. It can be used to assess response qualitatively, by inspecting signal intensity changes on high-b-value images, and quantitatively, by using ADC measurements.
Page 1413Accurate mapping of peritoneal implants in patients with advanced ovarian cancer is important for making optimal management decisions (ie, chemotherapy vs cytoreduction); however, it may be com-promised because of the small size of the implants and the complex anatomy of the peritoneal cavity. Hypercellular implants show restricted diffusion and hence are rendered more conspicuous because of remarkable contrast with the surrounding organs and ascites, which show signal suppression on high-b-value DW images.