9
1 Digest 5 COVID 19 Impact on Vulnerable Groups People with Disabilities
1
Digest 5
COVID 19 Impact on Vulnerable Groups
People with Disabilities

2
A rapid survey on occupational groups
COVID 19 Impact on Vulnerable Groups
Digest 5: People with Disabilities
Background Innovision Consulting is conducting primary
research on low income occupational and
underprivileged groups to assess the impact of
COVID-19 on their livelihood. This digest explains
the impact of COVID 19 on the livelihood of the
people with disabilities who used to work in
different vocational activities. We expect that our
analysis will provide useful insights to
policymakers and relevant private, NGO, civil
society stakeholders to safeguard the livelihood
of these people with appropriate interventions. It
is estimated that around 10% of Bangladesh
population has some form of disability1. We
undertook a survey on the impact of COVID 19
with 100 People with Disabilities across
Bangladesh from 7th to 13th April 2020. The
sample solely consists of the people with
disabilities population who were engaged in
some kind of economic activity before COVID
lockdown.
Scope and Methodology
We undertook simple random sample survey on
100 respondents from urban and rural areas (48
urban and 52 rural) and segregated between
male and female respondents (51 male and 49
female). The samples were randomly selected
from lists of people with
disability that we collected from
organizations working with
people with disabilities and from
our previous surveys. Our target
was to have almost equal
distribution between urban and
rural areas and between male
and female so that there is no weight on the
stratas. To check for data validity, the analysts
conducted separate phone calls with samples
where data was found as outlier. Besides, the
research team lead conducted several in-depth
interviews to understand the current situation
and livelihood coping strategy. The findings of
these in-depth interviews are presented as cases.
1 Worldbank - Disability in Bangladesh, 2004
However, the samples are skewed in terms of
geographic distribution. Of the samples, 77% are
from Chittagong Division, 12% from Rajshahi and
Rangpur Division, 6% from Khulna Division and
3% from Dhaka division. This is because we had
contacts of higher number of
people with disabilities from
Chittagong if compared to the
rest. This data should therefore
not be interpreted as
representative of the country
but more of the situation in
Chittagong. Among the
samples, about sixty-five percent (65%) of the
respondent has difficulty walking and moving,
twenty-two percent (22%) has vision impairment,
six percent (6%) are hearing impaired, five
percent (5%) has impaired hands, three percent
(3%) has communication disability and the rest
has intellectual disability (some people have
multiple disability).
Of the samples, 77% are from
Chittagong Division, 12% from
Rajshahi and Rangpur Division, 6%
from Khulna Division and 3% from
Dhaka division. This is because we
had contacts of higher number of
people with disabilities from
Chittagong if compared to the rest.

3
Of the samples, 63% are married. Majority of the
married respondents (86%) have children and in
93% cases their children live with them. Average
family size of the respondents is 4.6.
Key Findings
Primary Occupation of the People with Disabilities
Twenty nine percent (29%) of the samples are
involved in skilled labour which includes
vocations like handicraft, electrical works etc. Of
the samples, 14% are in private service, 11% are
involved in small business, 10% are in involved in
agriculture, 8% in livestock. Other occupations
include tuition (8%), trading (5%), transport work
(4%), begging (4%). The rest (7%) are involved in
variety of occupations which includes household
help (3%), sales in small shop (3%) and cleric
(1%).
Of the respondents, 70% work from home, 27%
from a specific workplace and the rest 3% need
to earn their living by moving to different places.
If compared to men (63%) more women work
from home (77%). Eighty one percent (81%) of the
people with disabilities in rural areas work from
home while 58% of the people with disabilities in
urban areas work from home. Of the female
respondents, 52% are married. In contrast, of the
male respondents, 73% are married. This can be
attributed to the fact that 33% of the female
respondents belong to the age group of up to 25
years while 17% of the male respondents belong
to that age group.
The average monthly income of the respondents
is BDT 8,600. The average income of the male
respondents is BDT 10,862. In contrast, the
29
14
1110
8
8
5
44
3 3 1
Skilled Labour Private Service Small Business
Agriculture Livestock Tuition
Trading Transport Work Begging
Household help Sales in small shop Cleric
has difficulty walking and moving
67%
communication disability
3%
has vision impairment
22%
are hearing impaired
6%
has intellectual disability
1%
has impaired hands
5%
(some people have multiple disabilities)
Married
93% Average family size
of the respondents
4.6
BDT 8,600
average monthly
income of the
respondents BDT 10,862
average income
of the male
respondents BDT 6,245
average income
of the female
respondents
4
average income of the female respondents is
BDT 6,245. Urban (average. BDT 10,115) group
earns significantly more than their rural (average
BDT 7,202) counterparts. The average total
household income is BDT 15,235. Usually, other
household members who earn are of immediate
relations like father, mother, wife, brother, son-in-
law, etc. Seventy-five percent (75%) of the female
members said they have other household
members who earn, while it is forty-eight (48%)
for male members. Almost all the respondents
(98%) contributes economically in the family. The
contribution varies; 51% contributes less than
BDT 5,000; 29% contributes between BDT 5,000
to 10,000 and 20% contributes more than BDT
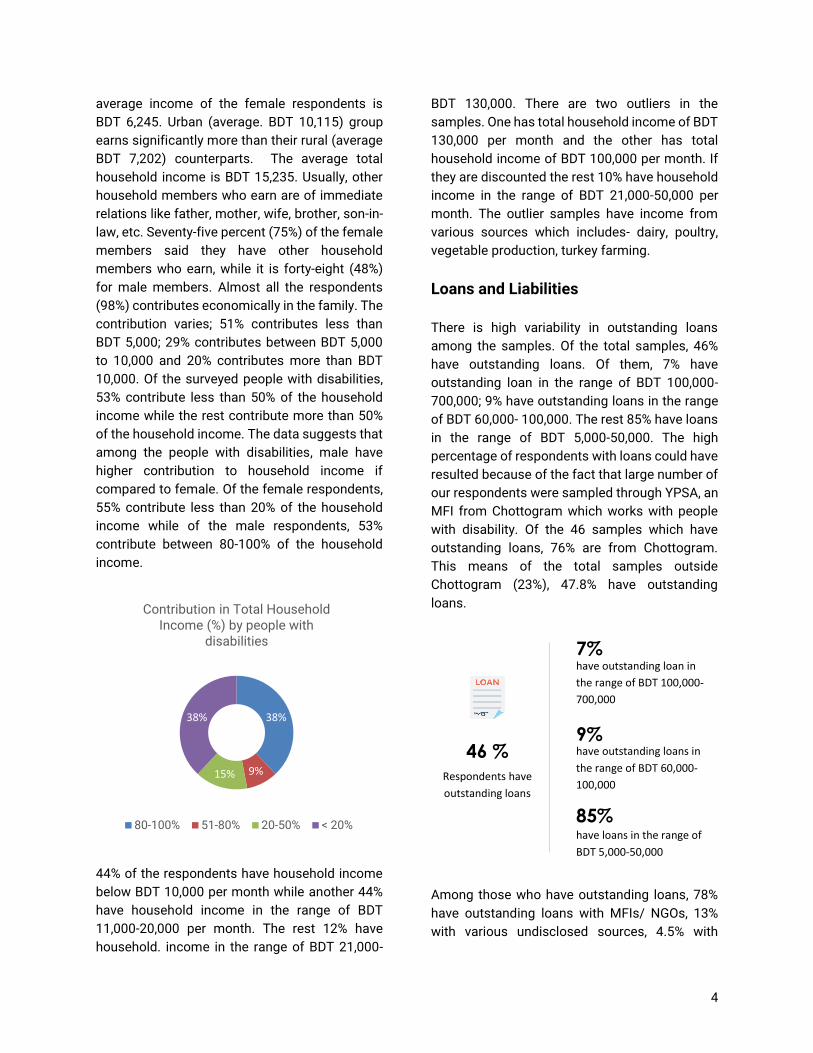
10,000. Of the surveyed people with disabilities,
53% contribute less than 50% of the household
income while the rest contribute more than 50%
of the household income. The data suggests that
among the people with disabilities, male have
higher contribution to household income if
compared to female. Of the female respondents,
55% contribute less than 20% of the household
income while of the male respondents, 53%
contribute between 80-100% of the household
income.
44% of the respondents have household income
below BDT 10,000 per month while another 44%
have household income in the range of BDT
11,000-20,000 per month. The rest 12% have
household. income in the range of BDT 21,000-
BDT 130,000. There are two outliers in the
samples. One has total household income of BDT
130,000 per month and the other has total
household income of BDT 100,000 per month. If
they are discounted the rest 10% have household
income in the range of BDT 21,000-50,000 per
month. The outlier samples have income from
various sources which includes- dairy, poultry,
vegetable production, turkey farming.
Loans and Liabilities
There is high variability in outstanding loans
among the samples. Of the total samples, 46%
have outstanding loans. Of them, 7% have
outstanding loan in the range of BDT 100,000-
700,000; 9% have outstanding loans in the range
of BDT 60,000- 100,000. The rest 85% have loans
in the range of BDT 5,000-50,000. The high
percentage of respondents with loans could have
resulted because of the fact that large number of
our respondents were sampled through YPSA, an
MFI from Chottogram which works with people
with disability. Of the 46 samples which have
outstanding loans, 76% are from Chottogram.
This means of the total samples outside
Chottogram (23%), 47.8% have outstanding
loans.
Among those who have outstanding loans, 78%
have outstanding loans with MFIs/ NGOs, 13%
with various undisclosed sources, 4.5% with
38%
9%15%
38%
Contribution in Total Household Income (%) by people with
disabilities
80-100% 51-80% 20-50% < 20%
have outstanding loan in
the range of BDT 100,000-
700,000
7%
46 %
Respondents have
outstanding loans
have outstanding loans in
the range of BDT 60,000-
100,000
9%
have loans in the range of
BDT 5,000-50,000
85%
5
relatives and 4.5% with neighbours. Of the
surveyed samples who have outstanding loans,
39% have taken loans for small business or to
procure raw materials for their small business,
13% for medical treatment, 13% for house
construction. About 15% have taken loans for
miscellaneous purposes. This includes, paying
off for other loan, wedding of family member,
purchasing furniture, expenditure for household
expenses.
Savings
Of the total surveyed respondents, 36% have
loans with MFIs/NGOs. They all have savings
with the NGOs but these savings are tied to the
micro-credit. However, only 33% of them
acknowledged of having savings. This indicates
that the majority of the borrowers do not account
for the savings attached to the micro-credit.
Altogether, 44% have savings. Of them, 81% have
savings that are attached to the micro-credit, 15%
have savings with banks, the rest 4% have
insurance and savings at home. Only 13% of our
samples were able to report on their aggregate
savings. We are therefore not able to analyse the
savings per capita among the people with
disabilities.
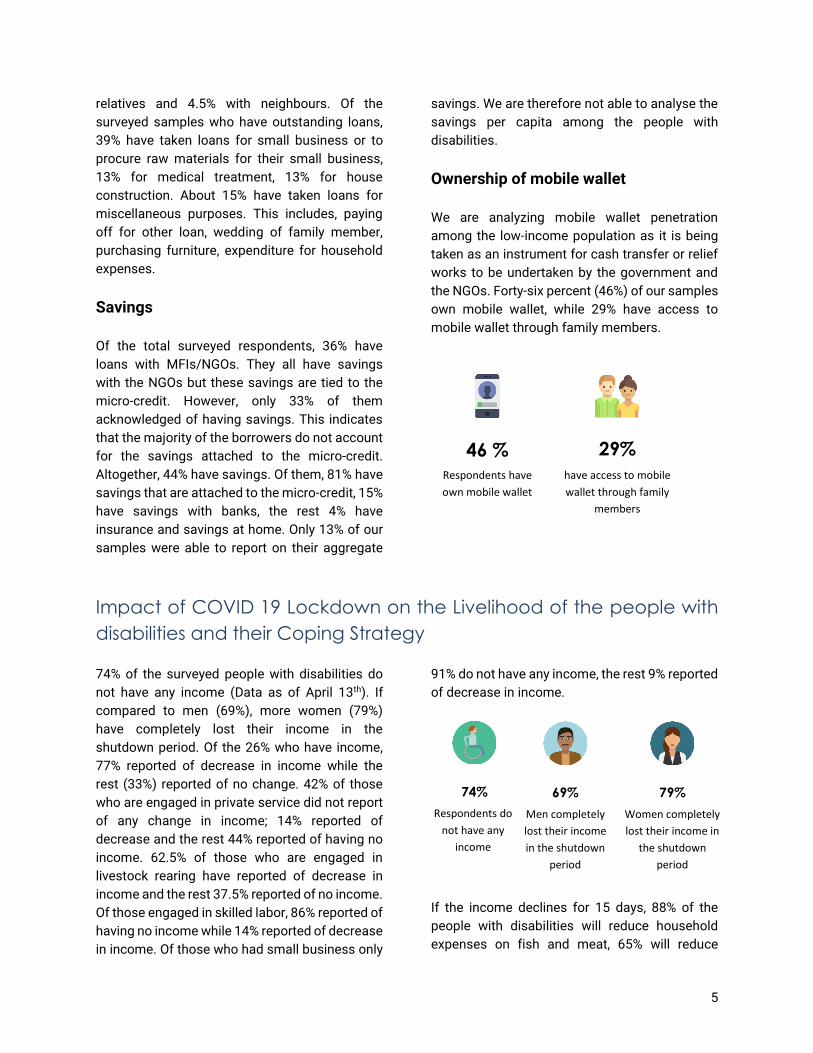
Ownership of mobile wallet
We are analyzing mobile wallet penetration
among the low-income population as it is being
taken as an instrument for cash transfer or relief
works to be undertaken by the government and
the NGOs. Forty-six percent (46%) of our samples
own mobile wallet, while 29% have access to
mobile wallet through family members.
Impact of COVID 19 Lockdown on the Livelihood of the people with
disabilities and their Coping Strategy
74% of the surveyed people with disabilities do
not have any income (Data as of April 13th). If
compared to men (69%), more women (79%)
have completely lost their income in the
shutdown period. Of the 26% who have income,
77% reported of decrease in income while the
rest (33%) reported of no change. 42% of those
who are engaged in private service did not report
of any change in income; 14% reported of
decrease and the rest 44% reported of having no
income. 62.5% of those who are engaged in
livestock rearing have reported of decrease in
income and the rest 37.5% reported of no income.
Of those engaged in skilled labor, 86% reported of
having no income while 14% reported of decrease
in income. Of those who had small business only
91% do not have any income, the rest 9% reported
of decrease in income.
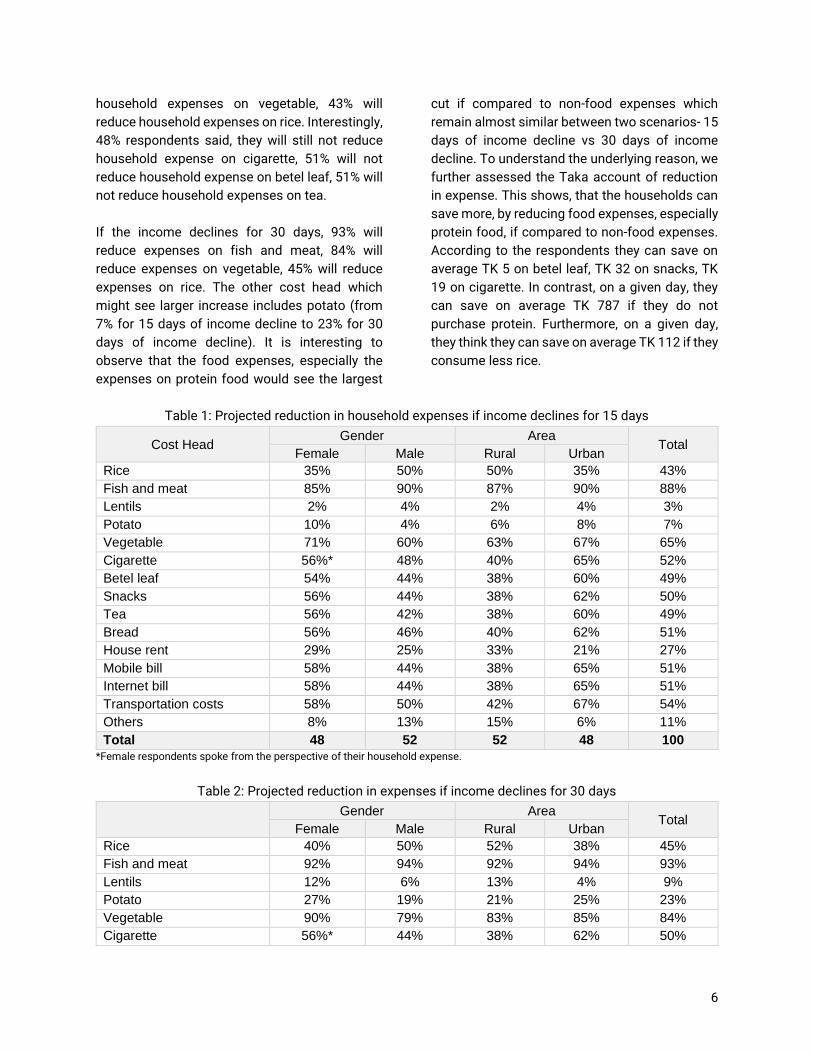
If the income declines for 15 days, 88% of the
people with disabilities will reduce household
expenses on fish and meat, 65% will reduce
have access to mobile
wallet through family
members
29% 46 %
Respondents have
own mobile wallet
74%
Respondents do
not have any
income
69%
Men completely
lost their income
in the shutdown
period
79%
Women completely
lost their income in
the shutdown
period
6
household expenses on vegetable, 43% will
reduce household expenses on rice. Interestingly,
48% respondents said, they will still not reduce
household expense on cigarette, 51% will not
reduce household expense on betel leaf, 51% will
not reduce household expenses on tea.
If the income declines for 30 days, 93% will
reduce expenses on fish and meat, 84% will
reduce expenses on vegetable, 45% will reduce
expenses on rice. The other cost head which
might see larger increase includes potato (from
7% for 15 days of income decline to 23% for 30
days of income decline). It is interesting to
observe that the food expenses, especially the
expenses on protein food would see the largest
cut if compared to non-food expenses which
remain almost similar between two scenarios- 15
days of income decline vs 30 days of income
decline. To understand the underlying reason, we
further assessed the Taka account of reduction
in expense. This shows, that the households can
save more, by reducing food expenses, especially
protein food, if compared to non-food expenses.
According to the respondents they can save on
average TK 5 on betel leaf, TK 32 on snacks, TK
19 on cigarette. In contrast, on a given day, they
can save on average TK 787 if they do not
purchase protein. Furthermore, on a given day,
they think they can save on average TK 112 if they
consume less rice.
Table 1: Projected reduction in household expenses if income declines for 15 days
Cost Head Gender Area
Total Female Male Rural Urban
Rice 35% 50% 50% 35% 43%
Fish and meat 85% 90% 87% 90% 88%
Lentils 2% 4% 2% 4% 3%
Potato 10% 4% 6% 8% 7%
Vegetable 71% 60% 63% 67% 65%
Cigarette 56%* 48% 40% 65% 52%
Betel leaf 54% 44% 38% 60% 49%
Snacks 56% 44% 38% 62% 50%
Tea 56% 42% 38% 60% 49%
Bread 56% 46% 40% 62% 51%
House rent 29% 25% 33% 21% 27%
Mobile bill 58% 44% 38% 65% 51%
Internet bill 58% 44% 38% 65% 51%
Transportation costs 58% 50% 42% 67% 54%
Others 8% 13% 15% 6% 11%
Total 48 52 52 48 100
*Female respondents spoke from the perspective of their household expense.
Table 2: Projected reduction in expenses if income declines for 30 days
Gender Area Total
Female Male Rural Urban
Rice 40% 50% 52% 38% 45%
Fish and meat 92% 94% 92% 94% 93%
Lentils 12% 6% 13% 4% 9%
Potato 27% 19% 21% 25% 23%
Vegetable 90% 79% 83% 85% 84%
Cigarette 56%* 44% 38% 62% 50%
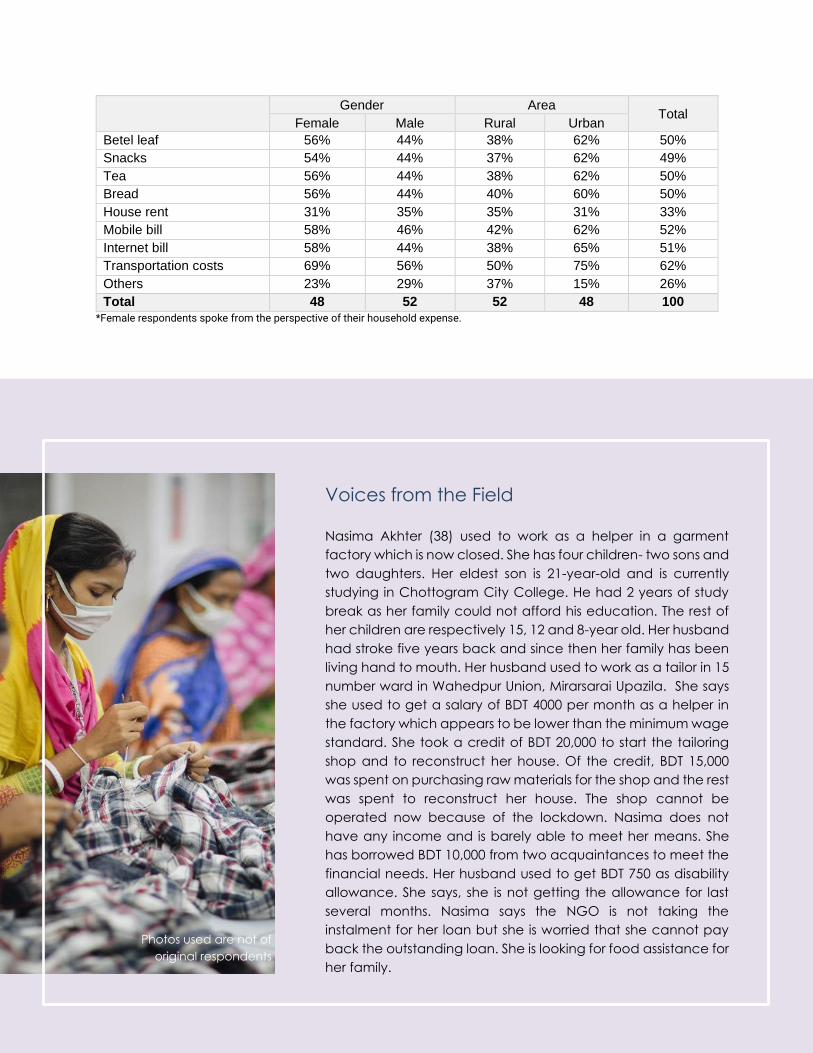
7
Gender Area Total
Female Male Rural Urban
Betel leaf 56% 44% 38% 62% 50%
Snacks 54% 44% 37% 62% 49%
Tea 56% 44% 38% 62% 50%
Bread 56% 44% 40% 60% 50%
House rent 31% 35% 35% 31% 33%
Mobile bill 58% 46% 42% 62% 52%
Internet bill 58% 44% 38% 65% 51%
Transportation costs 69% 56% 50% 75% 62%
Others 23% 29% 37% 15% 26%
Total 48 52 52 48 100
*Female respondents spoke from the perspective of their household expense.
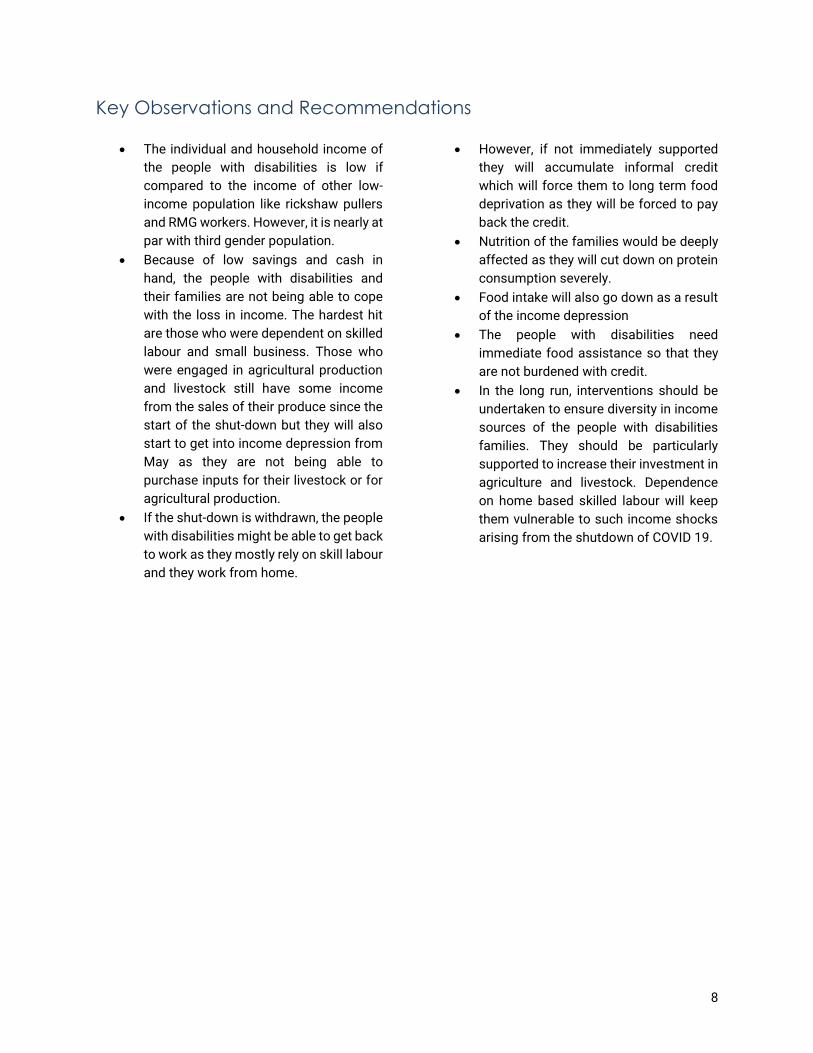
Voices from the Field
Nasima Akhter (38) used to work as a helper in a garment
factory which is now closed. She has four children- two sons and
two daughters. Her eldest son is 21-year-old and is currently
studying in Chottogram City College. He had 2 years of study
break as her family could not afford his education. The rest of
her children are respectively 15, 12 and 8-year old. Her husband
had stroke five years back and since then her family has been
living hand to mouth. Her husband used to work as a tailor in 15
number ward in Wahedpur Union, Mirarsarai Upazila. She says
she used to get a salary of BDT 4000 per month as a helper in
the factory which appears to be lower than the minimum wage
standard. She took a credit of BDT 20,000 to start the tailoring
shop and to reconstruct her house. Of the credit, BDT 15,000
was spent on purchasing raw materials for the shop and the rest
was spent to reconstruct her house. The shop cannot be
operated now because of the lockdown. Nasima does not
have any income and is barely able to meet her means. She
has borrowed BDT 10,000 from two acquaintances to meet the
financial needs. Her husband used to get BDT 750 as disability
allowance. She says, she is not getting the allowance for last
several months. Nasima says the NGO is not taking the
instalment for her loan but she is worried that she cannot pay
back the outstanding loan. She is looking for food assistance for
her family.
Photos used are not of
original respondents
8
Key Observations and Recommendations
• The individual and household income of
the people with disabilities is low if
compared to the income of other low-
income population like rickshaw pullers
and RMG workers. However, it is nearly at
par with third gender population.
• Because of low savings and cash in
hand, the people with disabilities and
their families are not being able to cope
with the loss in income. The hardest hit
are those who were dependent on skilled
labour and small business. Those who
were engaged in agricultural production
and livestock still have some income
from the sales of their produce since the
start of the shut-down but they will also
start to get into income depression from
May as they are not being able to
purchase inputs for their livestock or for
agricultural production.
• If the shut-down is withdrawn, the people
with disabilities might be able to get back
to work as they mostly rely on skill labour
and they work from home.
• However, if not immediately supported
they will accumulate informal credit
which will force them to long term food
deprivation as they will be forced to pay
back the credit.
• Nutrition of the families would be deeply
affected as they will cut down on protein
consumption severely.
• Food intake will also go down as a result
of the income depression
• The people with disabilities need
immediate food assistance so that they
are not burdened with credit.
• In the long run, interventions should be
undertaken to ensure diversity in income
sources of the people with disabilities
families. They should be particularly
supported to increase their investment in
agriculture and livestock. Dependence
on home based skilled labour will keep
them vulnerable to such income shocks
arising from the shutdown of COVID 19.
9
Study Team
Lead Researcher
Md. Rubaiyath Sarwar and Sadruddin Imran
Research Associate
Nafees Muhammad Mosharrof
Data Collection
Aftab Uddin
Data Analyst
Parvez Mahmud
Innovision Consulting Private Limited
Plot 26, Road 6,
Block J, Pragati Sarani,
Baridhara, Dhaka 1212
Contact
Phone: +8802 883 2178
Email: [email protected]
Website: www.innovision-bd.com
Innovision Consulting Private Limited
Plot 26, Road 6,
Block J, Pragati Sarani,
Baridhara, Dhaka 1212


