13
Public Affairs Directorate: Digital Communications Office Digital Analytics Dashboard Understanding and presenting commonly used digital metrics 16 June 2015 – Stephen Sangar
Public Affairs Directorate: Digital Communications Office
Digital Analytics
Dashboard Understanding and presenting commonly used digital metrics
16 June 2015 – Stephen Sangar
Public Affairs Directorate: Digital Communications Office
Overview
• Where are we now?
• Some common Google Analytics terms
• Strategy
• Different sources of data
• Digital Dashboards
Public Affairs Directorate: Digital Communications Office
Current situation?
• Google Analytics – look at occasionally or
for particular campaigns/goals
• Social media accounts – look at “followers”
but not any analytics
Public Affairs Directorate: Digital Communications Office
Defining some Google
Analytics terms (1) • Users, Sessions, Page views, Unique Page
Views, Pages/session, Average session
duration
• Average Time on Page, Bounce rate, Exit
(%)
• Referral, Direct, Organic/Paid search,
Social, Email, Other
• Campaign, Source, Medium
Public Affairs Directorate: Digital Communications Office
Defining some Google
Analytics terms (2) • Conversions, Goals
• Events
• Any others?
• Not from Google Analytics – Followers,
Subscribers, Likes, Shares, Engagement
(per post)
Public Affairs Directorate: Digital Communications Office
Strategy
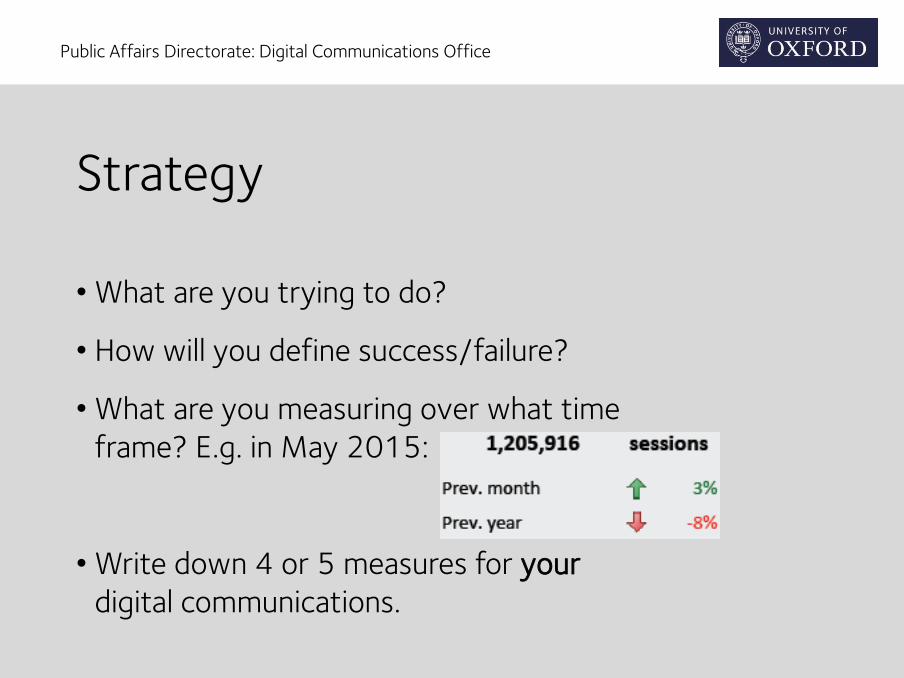
• What are you trying to do?
• How will you define success/failure?
• What are you measuring over what time
frame? E.g. in May 2015:
• Write down 4 or 5 measures for your
digital communications.

Public Affairs Directorate: Digital Communications Office
Some data sources (1)
• Google Analytics – Campaigns, segments,
goals
• Google Tag Manager
• Link shorteners (e.g. TinyURL, Po.st)
• Facebook insights
• analytics.twitter.com
Public Affairs Directorate: Digital Communications Office
Some data Sources (2)
• YouTube (www.youtube.com/analytics)
• Instagram (InsTrack app)
• E-Newsletters
• Search
• SiteImprove
• Any others?
Public Affairs Directorate: Digital Communications Office
Digital Dashboards
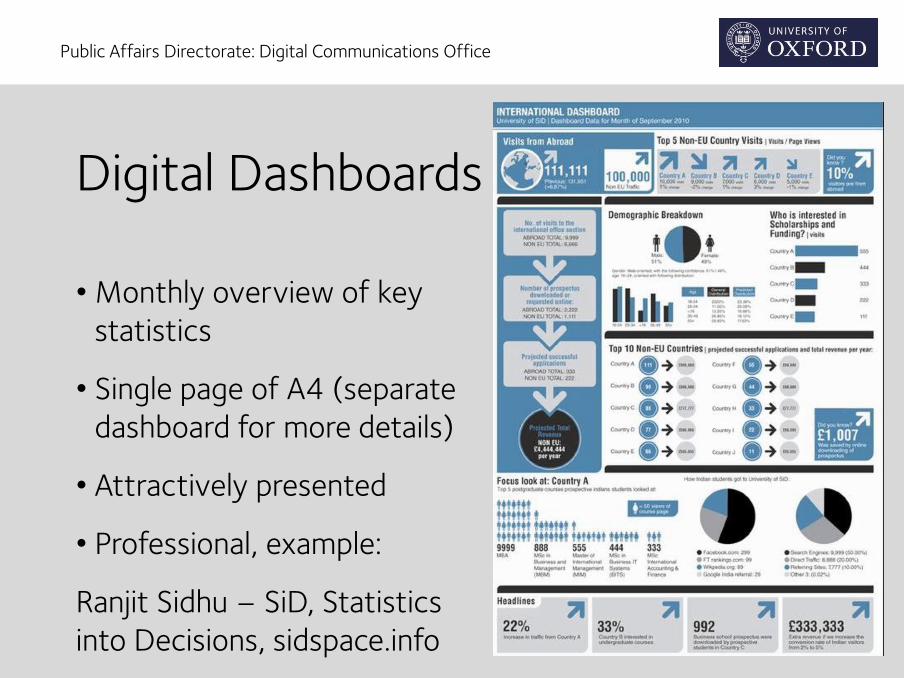
• Monthly overview of key
statistics
• Single page of A4 (separate
dashboard for more details)
• Attractively presented
• Professional, example:
Ranjit Sidhu – SiD, Statistics
into Decisions, sidspace.info
Public Affairs Directorate: Digital Communications Office
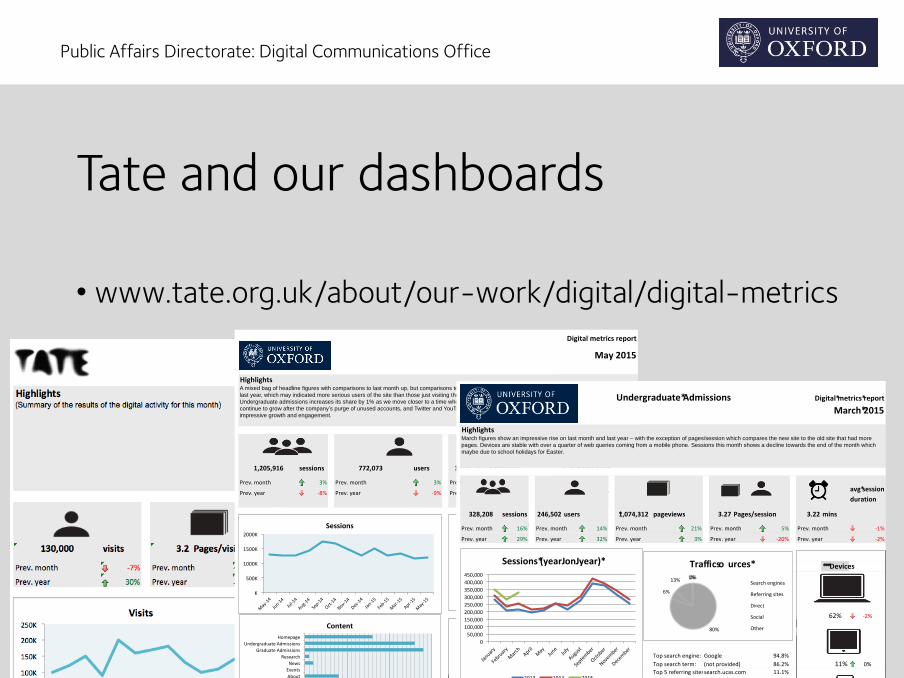
Tate and our dashboards
• www.tate.org.uk/about/our-work/digital/digital-metrics
Highlights
sessions 772,073 users 3,906,181 pageviews 3.24 pages/visit
Prev.month 3% Prev.month 3% Prev.month 3% Prev.month -1%
Prev.year -8% Prev.year -9% Prev.year -5% Prev.year 4%
71% 0% 7% 0% 21% 0%
2,230,542 2% 15.6% -14%
215,259 3% 2.8% -13%
Total Prev.month
Views 4,416,280 3%
Subscribers 39,347 4%
Likes 18,076 3%
Total Prev.month
Followers 13,418 33%
Likes 120,487 69%
Engagementperphoto 725 32%
Externaltraffic(i.e.excludingtrafficfromtheOxfordUniversitynetwork)
sessions 713,704 users 3,336,053 pageviews 3.42 pages/visit
Prev.month 1% Prev.month 1% Prev.month 1% Prev.month 1%
Prev.year -9% Prev.year -11% Prev.year -5% Prev.year 5%
976,699
Countriesofvisitors
May2015
Digitalmetricsreport
Followers %Engagedusers
1,205,916
A mixed bag of headline figures with comparisons to last month up, but comparisons to last year (generally) down. The pages per visit are up 4% compared to
last year, which may indicated more serious users of the site than those just visiting the home page of the newly designed site last year. In “content”
Undergraduate admissions increases its share by 1% as we move closer to a time when school/college students consider university. Facebook users
continue to grow after the company’s purge of unused accounts, and Twitter and YouTube also show modest gains. Instagram continues to receive
impressive growth and engagement.
K
500K
1000K
1500K
2000K
Sessions
67%
8%
21%
3%1%
Traffic so urces
Searchengines
Referringsites
Direct
Social
Other
DeviceHomepage
UndergraduateAdmissions
GraduateAdmissions
Research
News
Events
About
Staff
Students
Visitors
Localcommunity
Search
0% 10% 20% 30%
Content
UnitedKingdom
UnitedStates
India
China
Australia
Canada
Germany
France
Indonesia
Italy
Others
Undergraduate*Admissions
Highlights
avg*session
duration
sessions 246,502 users 1,074,312* pageviews 3.27 Pages/session 3.22 mins
****Devices
Most*viewed*pages Most*visited*outbound*linksTitle Views url Visitis
Undergraduate*admisions*(Homepage)
YouTube*J*top*5*videos Social*Media Newsletter*statsVideo Views
Followers %*Engaged*users
Digital*metrics*report
March figures show an impressive rise on last month and last year – with the exception of pages/session which compares the new site to the old site that had more
pages. Devices are stable with over a quarter of web queries coming from a mobile phone. Sessions this month shows a decline towards the end of the month which
maybe due to school holidays for Easter.
March*2015
328,208
Traffic
*
so urces*
Sessions*this*month*
Content*
Top*10*visitors'*countries*
Sessions*(yearJonJyear)*
Public Affairs Directorate: Digital Communications Office
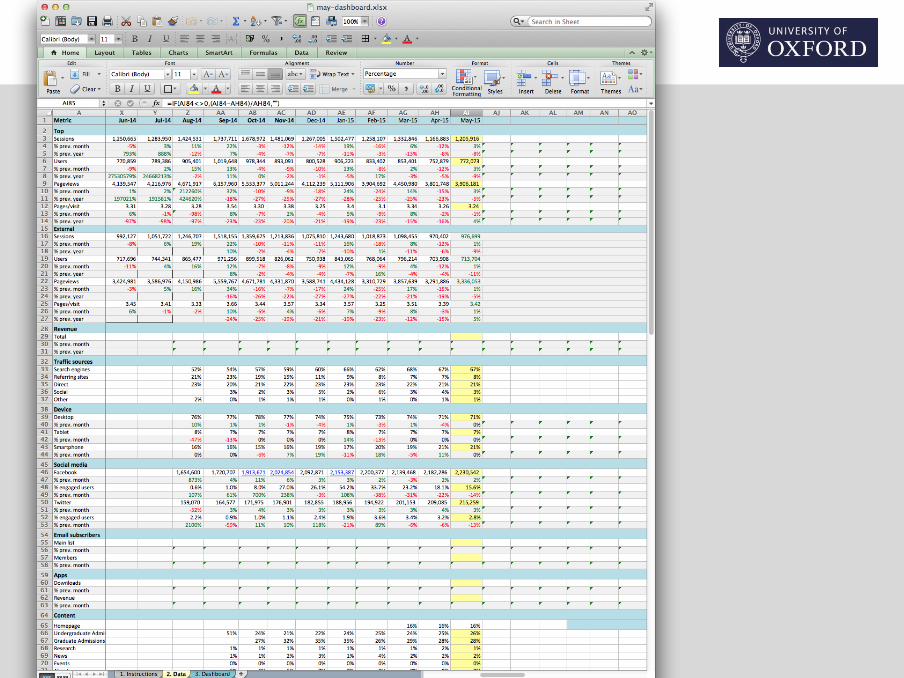
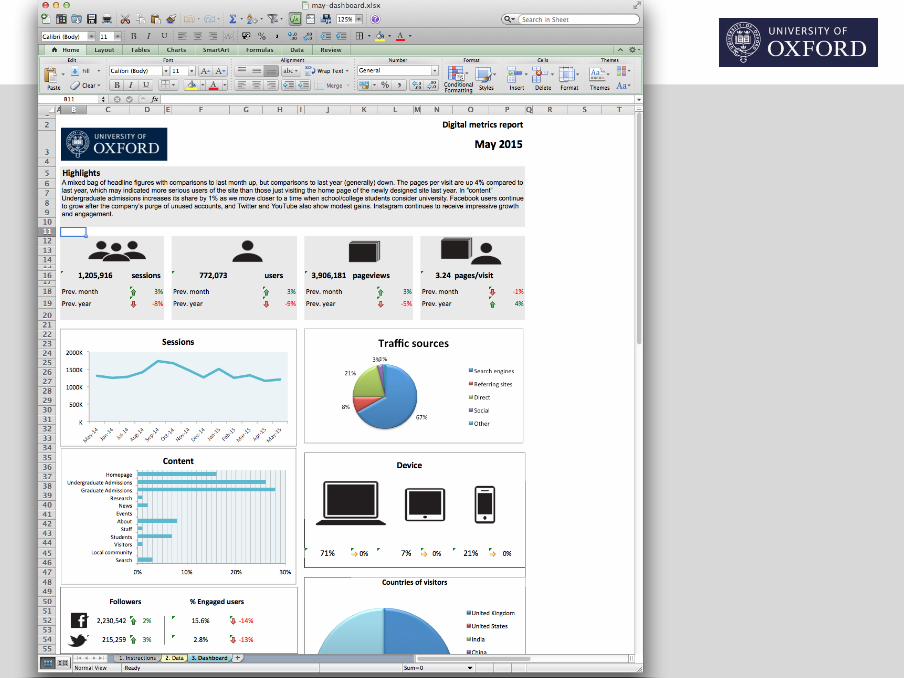
How they work
• Single Excel file – one sheet for dashboard,
on sheet for data
Public Affairs Directorate: Digital Communications Office
Public Affairs Directorate: Digital Communications Office


