47
Digital Culture 2019 1 Digital Culture 2019 November 2019

Digital Culture 2019
1
Digital Culture 2019 November 2019

Digital Culture 2019
2
Nesta is an innovation foundation. For us, innovation means turning bold ideas into reality and changing lives for the better.
We use our expertise, skills and funding in areas where there are big challenges facing society.
Nesta is based in the UK and supported by a financial endowment. We work with partners around the globe to bring bold ideas to life to change the world for good.
www.nesta.org.uk
If you’d like this publication in an alternative format such as Braille, large print or audio, please contact us at: [email protected]
Design: Green Doe Graphic Design Ltd
Arts Council England champions, develops and invests in artistic and cultural experiences that enrich people’s lives. We support activities across the arts, museums and libraries – from theatre to digital art, reading to dance, music to literature, and crafts to collections.
Between 2018 and 2022, we will invest £1.45 billion of public money from government and an estimated £860 million from the National Lottery to help create these experiences for as many people as possible across the country.
To find out more visit www.artscouncil.org.uk
Participants
We would like to thank the 1,182 organisations who gave their time to take part in the survey.
Research consultants
Caroline Wren, MTM Natalia Kumar, MTM Sarah White, MTM Megan Strachan, MTM
Project management
Shoubhik Bandopadhyay, Nesta Melissa Wong, Nesta
Special thanks to Arts Council England and Nesta colleagues
Paul Glinkowski, Arts Council England Ben Lane, Arts Council England Gillian Greaves, Arts Council England Cat Hammersley, Arts Council England Tonya Nelson, Arts Council England Francis Runacres, Arts Council England Fran Sanderson, Nesta Hasan Bakhshi, Nesta
Acknowledgements

Digital Culture 2019
1. Foreword 4
2. Executive summary 5
3. Introduction 7 3.1 Recap of Digital Culture 2017 findings 8
3.2 How this report is structured 9
4. Business models and 10 income generation 4.1 Overview 10
4.2 Undertaking new and advanced 13 revenue-generating activities
4.3 Comparing organisations by 15 turnover
4.4 Business models and income 16 generation in NPOs
5. Audience development 20 and data use 5.1 Overview 20
5.2 Audience reach: width, breadth 22 and depth
5.3 Using data 25
5.4 Audience development and data 27 use in NPOs
5.5 Comparing organisations by 29 turnover
6. Research and 30 Development 6.1 Overview 30
6.2 Attitudes to R&D 30
6.3 R&D behaviours 33
6.4 R&D in NPOs 35
7. Enablers and barriers 36 7.1 Overview 36
7.2 Investing in digital technology 36
7.3 Digital skills 38
7.4 Digital skills within NPOs 38
7.5 How digital capabilities are 40 distributed throughout organisations
7.6 Additional barriers hindering 42 the realisation of aspirations for digital technology
8. Conclusions 44
9. Endnotes 45
November 2019

Digital Culture 2019
4
1. ForewordDigital Culture is Arts Council England and Nesta’s longitudinal survey of the adoption, usage and impact of digital technologies in the arts and cultural sector. From 2013–2019, it has charted how organisations are using digital technologies and has also captured information on the attitudes and digital skills that are enabling arts and cultural organisations to use digital technology effectively in the delivery of their mission.
With the forthcoming launch of Arts Council England’s 2020–2030 strategy, there is fresh impetus for the arts and culture sector to address recognised structural challenges, including business innovation, environmental sustainability, diversity and inequalities of access and engagement. Digital technologies have an important role to play and, alongside this report, new initiatives are being introduced to the arts, cultural and heritage sectors to aid their digital development. These include the Digital Culture Network and the Digital Culture Compass tool (produced by The Space and partners on behalf of Arts Council England and the National Lottery Heritage Fund), developed in response to the Department for Digital, Culture, Media and Sport’s 2018 policy paper Culture is Digital.
The 2019 findings in Digital Culture suggest a more complex picture relative to 2017. Whilst the impact of digital technology on business models remains higher than 2013, for example, it has declined slightly from 2017, and when it comes to reaching more diverse and younger audiences, organisations are reporting that digital may be having less of an impact now than when the study began in 2013.
In these key business areas, organisations with a turnover of more than £500,000 are making much greater strides with digital technology than the sector as a whole. Ensuring that smaller organisations can also benefit from such technologies should be a priority as we move into the 2020–2030 strategic cycle.
We hope that the Digital Culture survey findings are a useful resource for arts and culture organisations, and for the agencies and networks who support them, and can help them to make informed decisions about their engagement with digital technologies. To support this, alongside this main report we have created factsheets on individual artforms, on museums and on National Portfolio Organisations to enable organisations in these categories to gain a deeper insight into their specific area of practice.
We remain grateful, as ever, to those individuals and organisations who took the time to complete the survey, without whom this insight could not be gained. A special thanks is due, in particular, to the 87 organisations who have taken the time to contribute to all five Digital Culture surveys.
Francis Runacres, Executive Director, Enterprise & Innovation, Arts Council England
Hasan Bakhshi, Executive Director, Creative Economy and Data Analytics, Nesta

Digital Culture 2019
5
2. Executive summaryThis is the fifth Digital Culture report, following those published in 2013, 2014, 2015 and 2017. Through this study, Arts Council England (ACE) and Nesta are seeking to understand the role and impact that digital technology is having on arts and cultural organisations in England and how that is changing over time.
This year, in addition to highlighting major changes observed over the last six years, the report considers the survey findings through the prism of three areas highlighted in the Arts Council’s draft 2020–30 strategy: business models and income generation; audience development and data use; and research and development. It then considers what might enable more organisations to meet their aspirations with digital technologies. Alongside this main report, a series of eight factsheets provide further detail on different artforms, museums and Arts Council National Portfolio Organisations (NPOs).
The 2019 survey findings present a complex picture in relation to business models. Although business models is the only area of activity in which digital technology is proportionately more important now than in 2013 (49 per cent say it is essential or important in 2019, compared to 34 per cent in 2013) fewer organisations say that it is important to business models than it is to other aspects of their work (for marketing, 88 per cent say it is essential or important; preserving and archiving, 74 per cent; operations, 74 per cent; creation, 58 per cent; and distribution and exhibition, 50 per cent).
Twenty two percent of organisations report that digital technologies are having a major impact on their revenue and profitability. While this is the highest percentage since the survey began in 2013, it nonetheless means that over three quarters of organisations are still to derive major benefits from digital technologies in this key business area. Albeit starting from a higher base, established income-generating activities are not showing significant growth. For example, just under half of all organisations are selling tickets online and only two fifths are collecting donations online, and neither figure has shown much change since 2013. Meanwhile the uptake of more advanced digitally-enabled methods and technologies, such as dynamic pricing and controlling ticket resales, is low, at just 7 per cent and 4 per cent respectively.
The 2019 survey shows disparities between large organisations (those with a turnover >£500k) and small organisations (with turnover <£100k). The findings are also significantly more positive for NPOs, considered as a group.
Across all years of the survey, small organisations have reported a very similar level of major impact from digital on their revenue generation (48 per cent reported this in 2013 and 51 per cent in 2019). In contrast, the proportion of large organisations that report major impact has risen substantially (from 54 per cent in 2013 to 83 per cent in 2019). NPOs are significantly more likely to engage in a variety of revenue generating digital activities than are arts and culture sector organisations as a whole. And both large organisations and NPOs are much more likely to be developing advanced business model capabilities. For example, 16 per cent of large organisations use dynamic pricing versus just 4 per cent of small organisations.

Digital Culture 2019
6
The 2019 findings suggest that digital technology is not having a greater positive impact on audience development objectives than in previous years. The percentages of organisations reporting a major impact on reaching a more diverse audience (34 per cent now versus 32 per cent in 2013), reaching a younger audience (26 per cent now, unchanged from 2013) or engaging more extensively with existing audiences (46 per cent now, versus 47 per cent in 2013) have remained broadly static. The figure for international audiences has fallen, from 33 per cent in 2013 to 29 per cent now.
The apparent lack of progress in relation to audience development is mirrored by a similar lack of progress in data use. There have been no increases in the proportion of organisations undertaking data-related activities since 2013 but there have been significant falls. More sophisticated uses of data remain the exception rather than the rule, with 41 per cent of organisations using data to develop online strategy, 38 per cent using data to inform their broader, strategic direction and just 14 per cent using data to model future trends.
There appears to be a clear gulf between the data capabilities of large and of small organisations. For example, 76 per cent of large organisations reported that they use digital technology ‘to understand their audience better through data analysis, segmentation and/or profiling’, compared to 28 per cent of small organisations. Large organisations are also much more likely than small organisations to carry out audience segmentation (65 per cent versus 15 per cent) and to use customer relationship management (CRM) software (68 per cent versus 12 per cent).
There is evidence from this year’s survey that organisations are becoming less experimental and more risk averse in their approach to digital technologies. Overall, there has been a downward trend in R&D behaviours, with the proportion of organisations agreeing that they engage in experimentation and take risks with digital technology falling from 33 per cent in 2014 (the first year this question was asked) to 27 per cent in 2019. It appears that more organisations are disinclined to lead the way in experimentation with digital technologies and more likely to let others take the risk, preferring to adopt ideas already proven to be successful. These findings could point to a failure of organisational culture to evolve and adapt in response to digital opportunities.
The role of senior leadership is brought into focus by the findings for the 2019 survey. The proportion of all organisations that agree that their senior management are knowledgeable about digital technology has fallen from 22 per cent in 2013 to 13 per cent in 2019. The proportion who say that senior management is more focused on innovation in non-digital areas has increased from 12 per cent in 2013 to 17 per cent in 2019. It could be inferred, therefore, that the decrease in digital expertise and strategic leadership at senior management level may have contributed to a turn away from digital innovation. An increase in digital knowledge and capacity at senior leadership level would seem an obvious way in which sector organisations could be enabled to make greater progress in their digital development in the future.
The findings for Digital Culture 2019 suggest that larger organisations and NPOs are demonstrating some ability to adopt new digital technologies and work strategically with technology to develop audiences and, to some extent, business models, but there has not been marked progress across the sector as a whole over the six years of the study. A widening gulf between large and small organisations is notable in many areas investigated by the survey. While the ability to invest in new technologies and benefit from economies of scale that come with higher overall income is undoubtedly a factor in these disparities, it is not the full picture. Whatever their scale and the resources available, organisations need to develop the right organisational structure, priorities and skills, backed up by senior level commitment, in order to create the conditions in which to benefit fully from digital technologies.
Digital Culture 2019
7
3. IntroductionDigital technology continues to be one of the major forces shaping our society today. Since the publication of the first Digital Culture report in 2013, digital technologies are appearing in more and more areas of our lives, transforming how we communicate with each other, how we learn and share ideas, and what it means to be ‘present’ in a space. In recent years cultural institutions, including the Barbican Centre and Victoria & Albert Museum, have explored the implications of our increasing reliance on these technologies in many aspects of our lives through landmark events and exhibitions, and artists and arts organisations such as Blast Theory and Invisible Flock are also beginning to explore how established concepts such as concerts, visual arts exhibitions, museum collections and theatrical performances can be reimagined for audiences with different attitudes and expectations. Alongside these exciting creative developments, another set of technologies have emerged which are influencing all areas of organisations’ operations, including financial management, customer relationship management, marketing and communications.
The Digital Culture research project was developed in 2013 to help us better understand how organisations in the arts and cultural sector were using digital technology and how they perceived its impact on their performance. This is the fifth Digital Culture report, following those published in 2013, 2014, 2015 and 2017, which allows us to reflect on how much the sector in England has changed digitally since 2013. This year 944 organisations completed the survey, with a further 190 partial completions which were also used in our analysis. For the majority of this report data from 2013, 2015, 2017 and 2019 is shown, allowing two-year intervals to be compared. However, where questions were only introduced in 2014 the data from 2014, 2015, 2017 and 2019 is shown.1
The sample frame is built on contact information for Arts Council England (ACE) NPOs, Museums from the UK’s Museum Accreditation Scheme and organisations that had previously applied for funding from ACE. In 2019, over 10,000 organisations were invited to complete the Digital Culture survey, which ran from March to May. Respondents were distributed across English regions and across ACE art and cultural forms2 and the reporting sample has been weighted to be representative of the profile of organisations in England.
One of the challenges with this study is that while this is a robust sample, with rigorous efforts made to achieve a profile that is reflective of the sector, it is only a sample and not a census – as such, observed scores vary each time the study is repeated and these can reflect both genuine changes in organisational behaviours but also variation in line with error margins on the data collected. To give further assurance that the trends reported in this year’s report are valid, they are all checked against analysis of a panel data set of 87 organisations which have completed the survey in all five years. The findings from the wider 2019 sample reported here as trends over time are all consistent3 with the responses of this smaller, constant group.

Digital Culture 2019
8
In 2019, new technologies continue to emerge, promising more sophistication, efficiency and, ultimately, better performance. To reflect this and help keep the survey up to date, this year’s survey asked about certain new behaviours and activities which have become more prevalent in the last two years. As will be expanded on in section 3.2, this report focuses on four key areas:
• Business models and income generation
• Audience development and data use
• Research and development
• Enablers and barriers to increasing digital activity
Alongside this main report, we have published eight factsheets. Seven of these summarise the key findings for the main art and cultural forms included in the study – Visual Arts, Theatre, Music, Literature, Dance, Combined Arts and Museums – and one looks at Arts Council England National Portfolio Organisations (NPOs) as a separate group.
3.1 Recap of Digital Culture 2017 findings
The Digital Culture 2017 report revealed that, despite declining levels of activity in some areas and a fall in the average number of digital activities undertaken per organisation, almost 70 per cent of respondents reported a major positive impact from digital technology on their ability to deliver their mission.
One of the main areas of development was business models and operations. The proportion of organisations regarding digital as important or essential to their business model had increased from 34 per cent in 2013 to 51 per cent in 2017 and the proportion of organisations reporting major positive impacts on their business model and operations rose from 53 per cent in 2013 to 68 per cent in 2017. However, despite these increases business models was an area where the majority of organisations felt that they only had basic skills compared to their peers.
A significant increase was noted in 2017 in the proportion of organisations reporting a major positive impact in increasing audience reach. This was despite the fact that the majority of arts and cultural organisations still did not use data for important purposes such as understanding their audiences better through data analysis and profiling.
Whilst lack of funding to allocate to digital was still a major barrier, the proportion of organisations who reported this fell from 68 per cent to 62 per cent, and the proportion who reported difficulty in accessing external funding also fell from 61 per cent to 55 per cent.

Digital Culture 2019
9
3.2 How this report is structured
While the 2017 report looked broadly at the use and impact of digital technology, this report takes a more focused look at four areas within the survey which feel particularly relevant to the sector today. These are: business models and income generation; audience development and data use; research and development; and enablers and barriers to increasing digital activity. The first two are key business areas for all arts and cultural organisations to consider for their future sustainability and relevance, whilst the second two are focused on developing organisational capabilities which will be fundamental to the sector’s ability to adapt to new technologies and stay up to date with developments in the wider world.
Business models and income generation: Arts and cultural organisations are being encouraged to become more entrepreneurial and to diversify their income streams, which will enable them to be less reliant on public funding. Over the first two years of the Digital Culture study, from 2013 to 2014, there was a significant increase in the proportion of organisations that reported that digital technology played an important role in their business model development. However, our survey data shows that this initial upward trend has not continued in the period from 2014 to 2019.
Audience development and data use: Across many sectors of the economy, organisations are making increased use of their customer data to inform their decision-making. There is a similar opportunity for arts and cultural organisations to use audience data to inform their decision-making and to take a more audience-focused approach to their programming. Understanding how to gather, analyse and interpret audience data is therefore becoming essential to developing effective audience engagement strategies, including understanding who audiences are and the behaviours, tastes and expectations of different audience types.
Research and Development: The case for change set out in Shaping the next ten years, which summarises the findings of Arts Council England’s consultation for the 2020–2030 strategy, identified a reported retreat from innovation and risk-taking and the 2017 Digital Culture survey highlighted a retreat from experimentation with digital technology – both artistically and operationally. Finding ways to undertake research and development activities remains important, even when the pressure on resources is growing, to ensure that the sector can continue to innovate.
Enablers and barriers to increasing digital activity: This section focuses on some of the factors that the data set suggests can either support or impede digital activity, considering how investment skills and organisational structure can help organisations achieve their aspirations with digital technology.
Each of these sections outlines the key findings relating to that theme, comparing data longitudinally from previous iterations of the survey. The authors of this report recognise that these sections explore themes which are all necessarily interrelated and co-dependent. Nonetheless, this structure provides a helpful framework for analysing the 2019 Digital Culture data set. In keeping with the approach taken in 2017, the report omits the 2014 data to provide more regular intervals for comparison, unless the questions being discussed were only introduced in 2014.

Digital Culture 2019
10
4. Business models and income generation 4.1 Overview
Arts Council England’s draft 2020–2030 strategy states that:
“The business models of publicly funded cultural organisations are often fragile and generally lack the flexibility to address emerging challenges and opportunities, especially those relating to operating within the digital economy and in the context of declining public funding.”
Data from the Arts Council England Annual Survey of NPOs shows that between 2013/14 and 2017/18 earned income, including ticket sales, workshop fees, merchandising and membership fees, remained relatively stable as a proportion of overall income, increasing slightly from 52 per cent to 54 per cent of income for NPOs. While we do not have the same data for the rest of the sector, it suggests nonetheless that Arts Council funded organisations have not made substantive progress during this time towards diversifying their income model by increasing their earned revenue. This section looks at the digital activities that organisations are undertaking to increase revenue and develop their business model.
Figure 1 demonstrates a significant rise since 2013 in organisations reporting that digital technology is important to their business models. However, at 49 per cent it remains low compared to, for example, 88 per cent who consider it important for marketing and 74 per cent for preserving and archiving.

Digital Culture 2019
11
In 2019, 93 per cent of organisations report that digital technology is having a positive impact on business-model-related activities and, of these, 65 per cent report a major impact, increasing from 51 per cent reporting major impact in 2013.4 Taken into consideration with the data in Figure 1, this suggests that digital technologies are having increasing impact and are of greater importance to the sector’s business models. Figure 2 shows that greater proportions of organisations reported major positive impact on their profitability and revenues than in previous years. However, these remain at relatively low levels, with less than one in four organisations reporting major positive impact on these areas.
How important is digital technology to your organisation overall, at the present time, in each of the following areas?
Base: 2013 – all respondents (n = 891); 2015 – all respondents (n = 982); 2017 – all respondents (n = 1,385); 2019 – all respondents (n = 1,113) Arrows denote significant movements at 95 per cent confidence level since 2013.
Figure 1: The importance of digital technology to different business areas, 2013, 2015, 2017 and 2019
Essential Important
‘13 ‘15 ‘17 ‘19 ‘13 ‘15 ‘17 ‘19 ‘13 ‘15 ‘17 ‘19 ‘13 ‘15 ‘17 ‘19 ‘13 ‘15 ‘17 ‘19 ‘13 ‘15 ‘17 ‘19
Marketing Preserving and archiving
Operations Distribution and exhibition
Creation Business models
18% 20% 22%
73% 70% 70%
22%
66%
27% 28% 27%
57% 52% 51%
28%
46%
24% 22% 25%
56% 52% 51%
24%
50%
30% 24% 26%
32% 28% 27%
25%
25%
28%
27% 29%
36% 27% 27%
28%
30%
17%
20% 25%
17% 25% 28%
22%
27%

Digital Culture 2019
12
Over the past 12 months, would you say use of the internet and digital technology has had a MAJOR positive impact on each of the following … ?
Base: All respondents in the following years: 2013 (n = 890); 2017 (n = 1,236); 2019 (n = 997). Arrows denote significant movements at 95 per cent confidence level since 2013.
Figure 2: Proportion of organisations experiencing a major positive impact of digital on their business models and operations, 2013–2019
35%
27%
37%
16%
22%
17%
28% New in 2014
22%
2013 2015 2017 2019
Product sales (e.g. online merchandising, downloads)
Our organisation’s overall revenue
Successful funding applications
Helping us operate more efficiently (e.g. recruitingstaff, training, sharing information
Donations and fundraising
Overall strategy development and prioritisation
Selling tickets online for events and/or exhibitions
Our organisation’s overall profitability

Digital Culture 2019
13
Now thinking about your organisation’s digital activities, please indicate which of the following your organisation currently does.
Base: Whole sector: 2013 (n = 891); 2015 (n = 984); 2017 (n = 1,424); 2019 (n = 1,134).
4.2 Undertaking new and advanced revenue-generating activities
Over the period of the Digital Culture study, there has been only limited change within the sector in terms of uptake of revenue-generating activities, as demonstrated in Figure 3:
Figure 3: Proportion of organisations using digital technologies for revenue generation, 2013–20175
The most common revenue-generating digital activity remains selling tickets online. The proportion of organisations reporting that they have engaged in this activity has varied slightly since 2013, increasing from 45 per cent in 2013 to a peak of 52 per cent in 2017, followed by a decline to 48 per cent in 2019. Revenue from ticket sales is an important component of many arts and culture organisations’ income models – the mean earned income per attendance amongst NPOs in 2017/18 was £11.026 – and it is perhaps surprising that over half of organisations surveyed are currently not selling tickets online.7
Industries such as travel and commercial entertainment have introduced significant innovations in online ticketing in recent years that help to improve yield as well as customer satisfaction and inclusion. A very small proportion of the survey respondents say they have begun to adopt such innovations. For example, 7 per cent of respondents report using a
48%
45%
30%
36%
41%
35%
19%
19%
7%
8%
9%
11%
2013
0% 10% 20% 30% 40% 50% 60%
2015 2017 2019
Accept online donations
Sell event tickets online on your own websiteor on a third-party site
Offer exclusive online content as an incentive toencourage people to take up membership
of your organisation
Use third party platforms to generaterevenue from content
Use crowdfunding platforms such as Kickstarter,GoFundMe or EasyFundraising to raise money for
new projects
Sell products or merchandise online

Digital Culture 2019
14
dynamic pricing system for online tickets sales, where prices are algorithmically modified in response to changing market demand. Similarly, just 4 per cent of organisations report using digital technologies to ‘control the re-sale of tickets to avoid touting’.
‘We tested dynamic ticket pricing across a number of shows during our 2018 festival and it was particularly successful for one production where the initial run of tickets sold out prior to opening. We were able to release more tickets at a higher rate which boosted overall income by 12 per cent’London International Festival of Theatre (medium theatre, NPO)
‘We have used data analysis to introduce demand management techniques including revenue maximisation and dynamic pricing. This involved analysing past performance data and using digital revenue management tools and had the impact of increasing ticket sale revenue by c.£150,000–£175,000 per year’ Nottingham Playhouse Trust (large theatre, NPO)
As the above quotes demonstrate, dynamic pricing can help to increase income from ticket sales. Research suggests that it can also make tickets more affordable to customers with a lower willingness to pay8 (those who are inclined to spend less per ticket than others in the market). Introducing such technologies can be expensive and technically complex and will not therefore be a realistic option for all organisations. However, there are simpler, more affordable, intermediate approaches to dynamic pricing which are more accessible, including using two or three manual price brackets or using discounting or other incentives to increase the volume of sales. These can help organisations achieve some of the benefits of dynamic pricing without requiring the same level of resource or expertise.
One activity which has increased slightly since 2013 is online donations, and the quotes below suggest that organisations who accept online donations find that they are a relatively low-yield technology in terms of revenue generation, but they are also easy to set up and administer, so they could be a relatively low-risk option for more organisations to explore.
‘Our JustGiving page and the donation button on our website enables simple online donations and independent fundraising on our behalf. It doesn’t bring in huge amounts but it’s worthwhile and easy to administer’ ALDATERRA (small combined arts organisation)
‘We now have a way for people to donate via our website and Facebook page. So we have the capability but we now need to make more of this’ Artswork Limited (medium youth organisation)
Meanwhile, the percentage of organisations utilising crowdfunding to source income has remained static at 19 per cent per cent since 2014. This is despite one fifth of organisations who were not currently using crowdfunding telling us in the 2014, 2015 and 2017 surveys that they planned to use crowdfunding in the next 12 months.

Digital Culture 2019
15
4.3 Comparing organisations by turnover9
As in previous years, the 2019 survey shows disparities between larger organisations (with a turnover >£500k) and smaller organisations (turnover <£100k). The data shows a growing gap in the perceived impact of digital technology on revenue generation reported by large and by small organisations. In 2013, 48 per cent of small organisations perceived a major impact. Whilst this has risen to 51 per cent in 2019, by comparison, 83 per cent of large organisations reported major impact in 2019, up from 54 per cent in 2013.
Figure 4: Proportion of organisations perceiving a major impact of digital on revenue generation
Figure 4 shows that small organisations reported a progressive overall increase in impact on revenue generation (albeit not on the scale of large organisations) until 2017 but have reported a much lower impact in 2019, almost regressing to the impact reported in 2013. By comparison, there was a 29 percentage point increase in large organisations reporting a major impact on revenue generation in 2019 compared to 2013, though the progressive trend for larger organisations has also arrested since 2017. The growing gap between large and small organisations could be explained in part by the higher cost of investing in new, potentially high-impact technologies such as dynamic pricing and customer relationship management software (CRM is discussed further in section 5) which are being implemented primarily by large organisations: 16 per cent of large organisations are using dynamic pricing versus 4 per cent of small organisations.
‘[Dynamic pricing has given us the] ability to gain committed early sales through advanced booking discounts’ Large museum, NPO (full details not disclosed)10
Large organisations (turnover >£500k)
Small organisations (turnover <£100k)
2013
54%
48%
2015
67%
56%
2017
82%
64%
2019
83%
51%
Base: Large organisations in the following years: 2013 (n = 246); 2014 (n = 278); 2015 (n = 267); 2017 (n = 267); 2019 (n = 305). Small organisations in the following years: 2013 (n = 301); 2014 (n = 299); 2015 (n = 350); 2017 (n = 535); 2019 (n = 365).

Digital Culture 2019
16
Looking at the qualitative findings, there is evidence that the relationship between audience data and business modelling, particularly around the use of fully integrated CRM software, could be a factor contributing to the growing impact gap reported by large organisations as compared to small organisations. This is explored in section 5.4 of the report. The quotes below suggest that the ability to integrate data and revenue streams, which would traditionally function independent of each other, has enabled some large organisations to increase both donations and earned income.
[The] new [box office] system fully integrates all activity strands – sales, marketing, development etc. – creating a co-ordinated non-siloed approach to revenue streams.Hampstead Theatre (large theatre, NPO)
Being able to sell tickets online and in advance is essential, not only for income generation but as an indicator of audience interest. Also bring (sic) donations onto our site (both through tap to donate and website widgets) and offering different types of repeat donation, has led to an increase in donation frequency. Large heritage organisation, NPO
Two new ticketing platforms have enabled a vastly improved online customer journey, with data capture and email marketing benefits too. We are now seeing a huge shift in advance tickets sold online.Hampshire County Council Museums and Archives Services (large heritage organisation)
4.4 Business models and income generation in NPOs
NPOs are more likely than the sector overall to engage in more advanced revenue-generating activities. For example, 16 per cent use dynamic pricing compared to 7 per cent in the sector overall and 8 per cent control ‘the re-sale of tickets to avoid touting’ versus 4 per cent of the total sample. This demonstrates that NPOs are at the head of the adoption curve within the sector with regards to deploying innovations introduced first in other industries.
This is consistent with previous Digital Culture reports that show NPOs ahead on the innovation adoption curve compared to the sector as a whole. Figure 5 demonstrates that NPOs are also significantly more likely than the sector overall to be engaging in all of the digital revenue-generating activities included in the survey. This year 91 per cent of NPOs are doing at least one such activity, compared to 71 per cent of the sector overall.

Digital Culture 2019
17
Now thinking about your organisation’s digital activities, please indicate which of the following your organisation currently does.
Base: 2019 – all respondents (n = 1,134), 2019 – NPOs (n = 412).
Figure 5: Digital revenue-generating activities done by NPOs versus the sector overall, 2019
For some revenue-generating activities, the gap between NPOs and the sector as a whole has increased steadily since 2013, as a result either of NPOs sustaining growth, or of the sector as a whole regressing. Figure 6 shows that the difference between NPOs and the sector overall in relation to selling products or merchandise online was 11 percentage points in 2013 and this has risen to 19 percentage points in 2019 (36 per cent of all respondents were doing this in 2013 versus 47 per cent of NPOs; in 2019 30 per cent of organisations were doing it vs 49 per cent of NPOs).
48%
41%
30%
19%
9%
7%
7%
4% 8%
16%
11%
15%
27%
49%
72%
70%
All organisations NPOs
Use crowdfunding platforms e.g. Kickstarter
Use third party platforms to generate revenuefrom content
Use a dynamic pricing system for online ticket sales
Control the re-sale of tickets to avoid touting
Sell event tickets online on your own website or ona third-party site
Accept online donations
Sell products or merchandise online
Offer exclusive online content as an incentive toencourage people to take up membership of
your organisation

Digital Culture 2019
18
Now thinking about your organisation’s digital activities, please indicate which of the following your organisation currently does.
Base: Whole sector: 2013 (n = 891); 2015 (n = 984); 2017 (n = 1,424); 2019 (n = 1,134). NPO: 2013 (n = 391); 2015 (n = 363); 2017 (n = 362); 2019 (n = 412).
Figure 6: Online sales, comparing NPOs and the sector overall, 2013–2019
These activities – selling tickets and retailing – can make a substantial contribution to organisations’ income generation and using digital platforms to support these activities can have benefits in terms of increasing income, saving staff time and reducing risk by helping organisations more accurately forecast customer interest or make advanced sales.
36% 34% 33%30%
47% 46%51% 49%
Sell products or merchandise online
2013 2015 2017 2019
100%
80%
60%
40%
20%
0%
45% 45%52%
48%
62%
70% 71% 70%
Sell event tickets online on your own website or on a third party site
2013 2015 2017 2019
100%
80%
60%
40%
20%
0%
Whole sector NPOs
Whole sector NPOs

Digital Culture 2019
19
Now thinking about your organisation’s digital activities, please indicate which of the following your organisation currently does.
Base: Whole sector: 2014 (n = 947); 2015 (n = 984); 2017 (n = 1424); 2019 (n = 1,134). NPO: 2014 (n = 432); 2015 (n = 363); 2017 (n = 362); 2019 (n = 412).
The gap between NPOs and the sector as a whole for revenue-generating activities which use open platforms, such as crowdfunding or gaining advertising revenue from video-sharing sites, is much smaller, as Figure 7 demonstrates. Although there is no guarantee that these activities will generate income, the barriers to using these technologies are much lower and therefore they are less risky for organisations to experiment with.
Figure 7: Crowdfunding and monetised content, NPOs versus the whole sector, 2014–2019
18% 19% 19%
22% 24%
19%
18%
27%
Use crowdfunding platforms such as Kickstarter, GoFundMe or EasyFundraising to raise money for new projects
2014 2015 2017 2019
100%
80%
60%
40%
20%
0%
8% 10%7%
12% 12% 11%
Use third party platforms to generate revenue from content (e.g. via high numbers of views on YouTube or other platforms)
2015 2017 2019
100%
80%
60%
40%
20%
0%
Whole sector NPO
Whole sector NPO

Digital Culture 2019
20
5. Audience development and data use 5.1 Overview
Arts Council England’s draft 2020–2030 strategy states that:
As technology evolves, so our museums, libraries, arts and cultural organisations must evolve too … experimenting with new ways of reaching the public …
We want our cultural sector in every part of this country to be outward-looking. We will therefore support cities, towns and villages that use culture to connect internationally, and that reflect the diverse influences of their diaspora communities.
This suggests a desire for the cultural sector to think more imaginatively and strategically about how they identify and communicate with audiences, both locally and further afield. The headline finding from the 2019 survey is that, regardless of the innovations available to support work in this field, the sector does not perceive an increased major impact on any of the main measures of audience reach – audience width, breadth and depth.11 As Figure 8 demonstrates, there has been no sustained progress across these measures since 2013.

Digital Culture 2019
21
Over the past 12 months, would you say use of the internet and digital technology has had a MAJOR positive impact on each of the following … ?
Base: All respondents in the following years: 2013 (n = 890); 2015 (n = 979); 2017 (n = 1,239); 2019 (n = 997).
Further analysis reveals a more complex landscape, however, and this section will examine in more detail some of the digital activities which organisations are undertaking and their perceived impact and importance. This covers a broad set of activities, including audience engagement via social media, programming for specific audiences and, crucially, using audience data to inform decision-making around audience development strategies.
Figure 8: Reported major positive impact of digital on audience development objectives, 2013–2019
55%
53%
60%
51%
57%
53%
62%
54%
52%
49%
60%
52%
2013 2015 2017 2019
Audience breadth Audience width Audience depth

Digital Culture 2019
22
Over the past 12 months, would you say use of the internet and digital technology has had a MAJOR positive impact on each of the following … ?
Base: 2013 – all respondents (n = 891); 2015 – all respondents (n = 984); 2017 – all respondents (n = 1,239); 2019 – all respondents (n = 997).
As Figure 9 shows, a higher proportion of organisations report that digital technology is having a major impact on reaching a bigger audience than on reaching a younger, more diverse or a more international audience. More organisations also report that digital technology is having a major impact on boosting their public profile than it is on engaging more deeply with their existing audiences or understanding their audiences and what they are saying about them. This suggests that, whilst organisations are being encouraged to think more ambitiously about how they engage new audiences and create more meaningful relationships with their audiences, digital technology is not currently making a greater impact on these objectives than when first measured in 2013.
5.2 Audience reach: width, breadth and depth
Figure 9: Reported major positive impact of digital technology on audience-related activities
54%
32%
26%
26%
29%
51%
34%
33%
47%
46%
58%
61%
30%
33%
2013 2015 2017 2019
Reaching an international audience
Boosting our public profile
Reaching a bigger audience
Understanding our audience and what they are sayingabout us
Reaching a more diverse audience
Reaching a younger audience
Engaging more extensively and deeply with our existingaudience
Digital Culture 2019
23
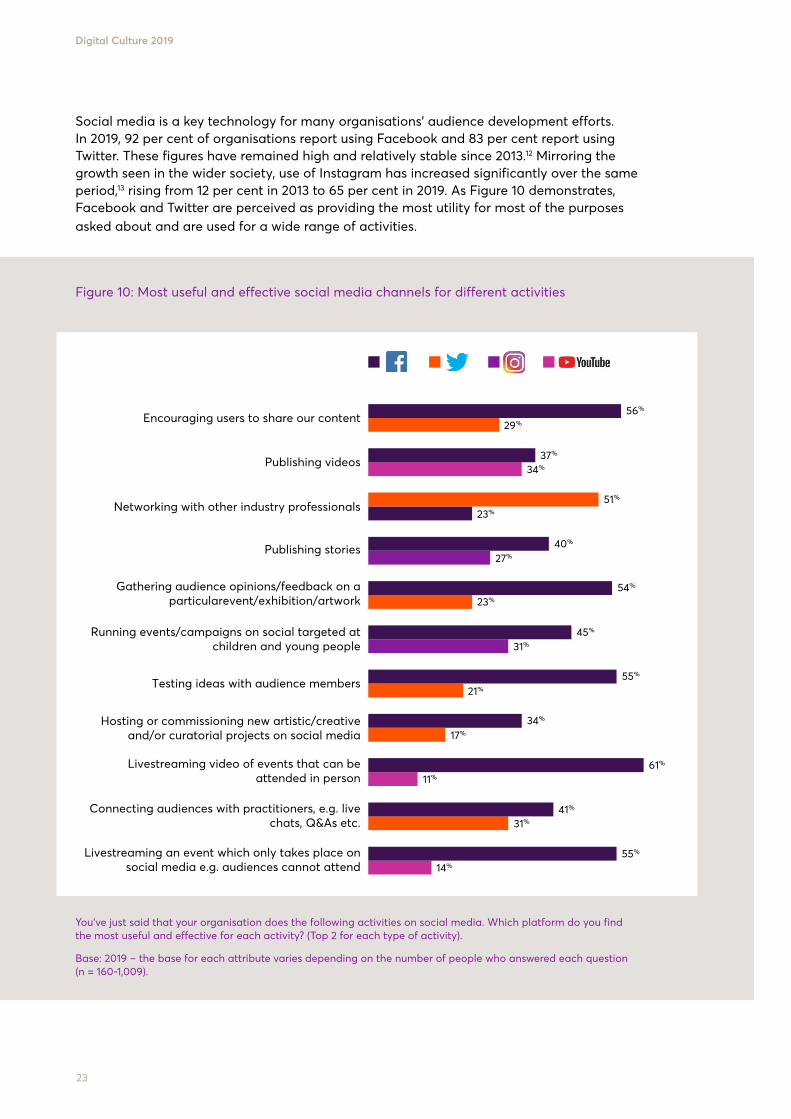
You’ve just said that your organisation does the following activities on social media. Which platform do you find the most useful and effective for each activity? (Top 2 for each type of activity).
Base: 2019 – the base for each attribute varies depending on the number of people who answered each question (n = 160-1,009).
Social media is a key technology for many organisations’ audience development efforts. In 2019, 92 per cent of organisations report using Facebook and 83 per cent report using Twitter. These figures have remained high and relatively stable since 2013.12 Mirroring the growth seen in the wider society, use of Instagram has increased significantly over the same period,13 rising from 12 per cent in 2013 to 65 per cent in 2019. As Figure 10 demonstrates, Facebook and Twitter are perceived as providing the most utility for most of the purposes asked about and are used for a wide range of activities.
Figure 10: Most useful and effective social media channels for different activities
56% 29%
37% 34%
51% 23%
40% 27%
23%
45% 31%
55% 21%
34%
61%
41% 31%
55% 14%
17%
11%
54%
Encouraging users to share our content
Publishing videos
Networking with other industry professionals
Publishing stories
Gathering audience opinions/feedback on aparticularevent/exhibition/artwork
Running events/campaigns on social targeted atchildren and young people
Testing ideas with audience members
Livestreaming video of events that can beattended in person
Connecting audiences with practitioners, e.g. livechats, Q&As etc.
Livestreaming an event which only takes place onsocial media e.g. audiences cannot attend
Hosting or commissioning new artistic/creativeand/or curatorial projects on social media

Digital Culture 2019
24
Which of the following things has your organisation ever tried on social media, and which have you adopted as part of your regular activity?
Base: 2019 – the base for each attribute varies depending on the number of people who answered each question (n = 1,009-1,010). Please note: Percentages may not add up to 100 per cent due to rounding.
Figure 11, below, shows that only 11 per cent of organisations are using social media regularly to try and engage younger audiences. Only 27 per cent are regularly gathering feedback and 9 per cent are testing ideas with audiences which suggests that more use could be made of social media to achieve deeper engagement with audiences. The high percentages of organisations who haven’t tried these activities yet suggests that there is opportunity for social media to make more impact on audience development if organisations could adopt a more experimental mindset.
Figure 11: Percentage of organisations carrying out different activities on social media
Encouraging users to share our content
Publishing videos
Networking with other industry professionals
Publishing stories
Gathering audience opinions/feedback on aparticularevent/exhibition/artwork
Running events/campaigns on social targeted atchildren and young people
Testing ideas with audience members
Livestreaming video of events that can beattended in person
Connecting audiences with practitioners, e.g. livechats, Q&As etc.
Livestreaming an event which only takes place onsocial media e.g. audiences cannot attend
Hosting or commissioning new artistic/creativeand/or curatorial projects on social media
This is now part of our regular activity
We’ve tried this occasionally
We’ve never tried this
47% 37% 17%
46% 37% 16%
29% 41% 29%
28% 36% 37%
27% 42% 31%
11% 28% 61%
9% 30% 60%
6% 19% 74%
6% 27% 67%
6%
2%
21% 72%
11% 88%

Digital Culture 2019
25
Arts Council England’s 2020–2030 draft strategy encourages organisations to think about their international profile and building international partnerships, so that the cultural sector is ‘outward-looking and globally connected’. As Figure 9 shows, this is an area where the majority currently report that digital technology is not having a major impact. Although the reasons for this are not immediately apparent, the quotes below indicate that organisations who report success in reaching international audiences see a relationship between their international reach and creating digital and remotely accessible work.
‘By creating digital records of our activities – full-length videos of our works, galleries of images etc., we are able sell these works to venues/festivals/programmers that are unable to view them first hand. This has given us a huge amount of profile and enabled us to tour internationally with company rep as well as on new commissions’ 2Faced Dance Company Limited (small dance organisation, NPO)
‘We have created a series of podcasts around a mental health and a spoken word project that has enabled us to share the voices or marginalised groups to an international audience’Take Art Ltd, small combined arts organisation, NPO
5.3 Using data
Since the previous Digital Culture survey in 2017, a greater emphasis has been placed by Arts Council England and the support organisations that it works with (including the Audience Agency and Counting What Counts) on the value and benefits of data collection, data analysis and data-led decision making, particularly in relation to understanding audiences and impact. This is signalled by the Arts Council’s creation of a new Audience Insight and Innovation directorate and introducing new funding requirements14 for the organisations in its 2018–22 portfolio.
Figure 12 below shows, however, that there have been no increases in any data-related area since 2013 and that there have been significant falls, both in the overall period since 2013 and specifically over the last two years, in a number of data-related activities. Apart from the most basic data-related activity of using audience contact details to send out newsletters, no other data activity is being carried out by a majority of sector organisations. More sophisticated uses of data remain the exception rather than the rule, with 41 per cent of organisations using data to develop online strategy, 38 per cent using data to inform their broader, strategic direction and just 14 per cent using data to model future audience trends.
Considering the more commercial uses of data, 15 per cent of organisations in the sector are using data to develop new products or services and 31 per cent are personalising campaigns for marketing, sales and fundraising. This contrasts with the commercial use of customer or end-user data in many other sectors such as retail, healthcare, transport and banking.15
The fall in organisations using data to engage with their members or most valuable audience members, visitors and supporters and the low proportion using data to improve membership schemes, as shown in Figure 12, could be possible reasons why organisations have reported almost unchanged levels of major impact on audience depth in the period 2013 to 2019.

Digital Culture 2019
26
Thinking about how you use audience or visitor data (generated either via your own website, social media, offline engagement, or a third-party platform such as Audience Finder), which of the following activities do you do?
Base: Respondents in the following years: 2013 (n = 879); 2015 (n = 979); 2017 (n = 1,298); 2019 (n = 1,036). Arrows denote significant movements at 95 per cent confidence level since 2013.
Figure 12: Proportion of organisations undertaking data-related activities
67%
41%
35%
39%
43%
38%
31%
25%
15%
18%
14%
20%
21%
22%
2%
2013 2015 2017 2019
Use analytics and insight from audience/visitor data toimprove our website
Use data to inform the broader strategic direction ofour organisation
Use audience/visitor contact details to send outnewsletters
Use audience/visitor data to personalise and tailordifferent marketing, sales and/or fundraising campaigns
for different types of user
Use data to develop our online strategy (e.g. investmentand social media presence)
Use data to identify and engage with our most valuableaudience members, visitors and supporters
Use data to understand our audience betterthrough data analysis, segmentation and/or profiling
Use data to model future trends in ourenvironment/audience
Use data to benchmark our organisation againstother organisations
Use data to inform the process of developing/commissioningcreative art works, events or exhibitions
Share audience/visitor data with other organisations
Use machine learning/AI e.g. to understand more aboutaudiences, to target marketing campaigns or promote
a website
Use data to inform the process of developing newcommercial products or services
Use data to administer and improve membershipschemes
Use audience/visitor data to create a CRM system
New in 2019
New in 2019
New in 2019
New in 2019
New in 2015

Digital Culture 2019
27
Thinking about how you use audience or visitor data (generated either via your own website, social media, offline engagement, or a third-party platform such as Audience Finder), which of the following activities do you do?
Base: All respondents: 2019 (n = 1,036). NPOs: 2019 (n = 398).
5.4 Audience development and data use in NPOs
A condition of ACE NPO funding for 2018–2020 is to sign up to data reporting requirements that are predicated on digital technologies such as Audience Finder and the recently introduced Insight and Impact Toolkit. It is unsurprising, therefore, that NPOs collectively are ahead of the sector as a whole in engaging with data-led activities, and that the gap between NPOs and others is growing. Figure 13 shows a significantly higher proportion of NPOs undertaking all data-related activities – most of which are focused on audience data – compared to the sector as a whole.
Figure 13: Proportion of all organisations versus NPOs undertaking data-related activities (2019)
67% 90%
43% 80%
41% 74%
39% 69%
38% 69%
35% 56%
31% 60%
25% 36%
22% 57%
21% 49%
20%
18% 38%
15% 30%
14% 29%
2% 4%
45%
All organisations NPOs
Use analytics and insight from audience/visitordata to improve our website
Use data to identify and engage with our mostvaluable audience members, visitors and supporters
Use audience/visitor data to personalise and tailordifferent marketing, sales and/or fundraising
campaigns for different types of user
Use data to inform the process of developingcommissioning creative art works, events or exhibitions
Share audience/visitor data with other organisations
Use data to benchmark our organisation against otherorganisations
Use audience/visitor data to create a CRM system
Use data to administer and improve membershipschemes
Use data to inform the process of developing newcommercial products or services
Use data to model future trends in ourenvironment/audience
Use machine learning/AI e.g. to understand more aboutaudiences, to target marketing campaigns or promote
a website
Use audience/visitor contact details to send outnewsletters
Use data to understand our audience better throughdata analysis, segmentation and/or profiling
Use data to develop our online strategy(e.g. investment and social media presence)
Use data to inform the broader strategic directionof our organisation

Digital Culture 2019
28
Thinking back over the past 12 months, would you say your organisation’s use of the internet and digital technology has had a major positive impact, a minor positive impact, or no positive impact at all on each of the following?
Base: All organisations: 2019 (n = 997). NPOs: 2019 (n = 393).
NPOs are also more likely than the sector as a whole to be taking a systematic approach to data; 71 per cent of NPOs in 2019 have run an audience segmentation in the past 12 months, compared to only 29 per cent of organisations overall,16 and 45 per cent are using a CRM compared to 20 per cent overall.
It is unsurprising, therefore, that there has been an increase over time in NPOs reporting that they are using audience data in more sophisticated ways compared to the sector as a whole. In 2013, 68 per cent of NPOs were using data to understand their audience better, whilst the overall figure for the sector was 43 per cent, a gap of 25 percentage points. In 2019, this gap has widened to 37 percentage points (80 per cent versus 43 per cent). Additionally, in 2019, 29 per cent of NPOs are modelling future trends in their environment or audience versus 14 per cent of the sector as a whole. This means that NPOs are more than twice as likely to be predicting future audience behaviours and motivations which would help to inform their future audience development strategies.
This difference in the number of data-related activities NPOs are carrying out compared to the wider sector appears to correlate with greater reported impact from digital audience-related activities, as Figure 14 demonstrates. However, the pattern reported across the sector remains; NPOs are also more likely to be experiencing major positive impact from digital technology on reaching a bigger audience and boosting public profile than they are on reaching younger, more diverse or more international audiences.
Figure 14: Proportion of all organisations versus NPOs experiencing major positive impact across audience areas (2019)
61%
54% 69%
46% 64%
29% 39%
34% 45%
33% 48%
26% 40%
75%
All organisations NPOs
Reaching an international audience
Understanding our audience and what they aresaying about us
Reaching a younger audience
Boosting our public profile
Reaching a bigger audience
Engaging more extensively and deeply with ourexisting audience
Reaching a more diverse audience

Digital Culture 2019
29
5.5 Comparing organisation by turnover
Overall, only 44 per cent of small organisations currently report that digital technology is having a major impact on a wider audience, compared to 70 per cent of large organisation. There is an increasing gap between large and small organisations with regards to reaching younger audiences; 14 per cent more of large organisations report major impact in this area, showing a steady increase over the lifetime of the study, whilst small organisations remain at very similar levels to 2013.
Figure 15: Proportion of organisations perceiving a major positive impact of digital on reaching a younger audience
This could be explained in part by the reported use of more advanced data collection and analysis activities. Large organisations are leading the way in trying more sophisticated digital activities relating to data use. For example, in 2019, 68 per cent of large organisations are using customer relationship management software (CRM), compared to only 12 per cent of small organisations. Similarly, 65 per cent of large organisations have conducted an audience segmentation compared to only 15 per cent of small organisations,17 and 76 per cent of large organisations report using data ‘to understand our audience better through data analysis, segmentation and/or profiling’, compared to 28 per cent of small organisations, figures which have remained static since 2013. This kind of data-intensive work, possibly involving expensive software licenses, training for staff and even contracting out work to segmentation experts is more accessible to both larger organisations and organisations with greater resources.
Our cinema has increased revenue by 36 per cent since we used Audience Finder and found out that ‘Facebook Families’ are a segment of the audience that book tickets, and a segment that could grow further. Customs House Trust Ltd (large combined arts organisation, NPO)
Small organisations
Large organisations
2013
22%
24%
2015
26%
37%
2017
28%
41%
2019
23%
38%
Thinking back over the past 12 months, would you say your organisation’s use of the internet and digital technology has had a major positive impact, a minor positive impact, or no positive impact at all on each of the following?
Small organisations in the following years: 2013 (n = 300); 2015 (n = 347); 2017 (n = 538); 2019 (n = 365); Large organisations in the following years: 2013 (n = 246); 2015 (n = 267); 2017 (n = 305); 2019 (n = 308).

Digital Culture 2019
30
6. Research and Development 6.1 Overview
Arts Council England’s draft 2020–2030 strategy states that:
While recent funding pressures have made it harder for many of our cultural organisations to experiment and undertake formal research and development, we believe that risk-taking and innovation are critical to the ongoing success of our sector … Many creative practitioners and leaders of cultural organisations report a retreat from innovation, risk-taking and sustained talent development.
Section 6 looks at the data around a set of questions assessing attitudes, behaviours and investments relating to R&D, exploring whether the ‘retreat from innovation [and] risk taking’ identified by Arts Council England is impacting negatively on R&D with digital technology and, if so, where this impact is being most keenly felt. R&D is defined broadly for the purposes of the survey, including the willingness and ability of an organisation to experiment and take risks, to reflect on and evaluate their experimentation and to work collaboratively to share expertise and skills.18
6.2 Attitudes to R&D
The data from the 2019 survey supports the Arts Council’s analysis that digital innovation is becoming less possible for arts and cultural organisations. It shows that, since 2013, experimental and risk-taking attitudes towards digital have trended downwards whilst more risk-averse and cautious attitudes have trended upwards. Figure 16 provides evidence of this and also indicates that digital expertise is less available at senior level and is less widely distributed within organisations than when the survey was first introduced.

Digital Culture 2019
31
Here are some statements that other people have made about their organisations. Please indicate which of the pair of statements is the best fit for your organisation, if both are equally true, please select ‘in the middle’. See endnote for explanation of missing data.
Base: Respondents in the following years: 2013 (n = 891); 2015 (n = 984); 2017 (n = 1,113); 2019 (n = 939). Arrows denote significant movements at 95 per cent confidence level since 2013.
Figure 16: Proportion of organisations choosing each statement, within the following pairs of statements, that they feel best describes their organisation19
22%
13%
18%
13%
17%
11%
15%
10%
10%
16%
8%
18%
12%
17%
15%
18%
Proportion of organisations who agree with this statement:
Most of our senior management are knowledgeable about digital technologies
We try to experiment with digital technologies. Sometimes this means ideas don’t work but other times they do and our peers often imitate us
Coming up with new digital ideas is a priority for our senior management team
Digital expertise is distributed across all parts of our organisation
Most of our seniormanagement are not that
knowledgeable aboutdigital technologies
We prefer to let othersexperiment with digitaltechnologies and then
we’ll save time andmoney by adopting
the ideas that work best
Our senior managementteam is more
focused on innovationin non-digital areas
Digital expertise isconcentrated in specialistparts of our organisation
e.g. marketing
Proportion of organisations whoagree with this statement:
2013 2015 2017 2019

Digital Culture 2019
32
The quote below suggests that one explanation of why the proportion who prefer to let others experiment with digital technologies has risen may be that some organisations feel that they are too far behind on the adoption curve to test out new technologies themselves.
We are still playing catch up in digital display/exhibition technology so I think we can let other organisations test the water before we do!Hampshire County Council Museums and Archives Services (large heritage organisation)
A potential factor in the apparent retreat from digital experimentation could be the attitudes and skill levels of senior management. For example, the proportion of organisations who agree that their senior management are not knowledgeable about digital technologies has increased from 10 per cent in 2013 to 16 per cent in 2019. Furthermore, the proportion claiming that senior management is more focused on innovation in non-digital areas has increased from 12 per cent in 2013 to 17 per cent in 2019. It could be inferred, therefore, that a decrease in digital understanding and expertise within senior management has contributed to a turn away from digital innovation.
The proportion of organisations who say that they see digital activity as an optional extra that can be cut when budgets are tight has increased from 16 per cent in 2017, when this question was first asked, to 21 per cent in 2019.20
Our main problem with any digital activity is twofold: a lack of staff time and money. So we don’t really have the resources to invest in digital beyond the basic and social media is the first thing to be dropped when we’re busy.Heritage organisation (size of organisation not disclosed)
The quotes below suggests that some organisations are wary of investing either time or money in new digital technologies as they have found that digital technologies or trends rapidly become redundant.
A general comment here is on the ability of us, as a small organisation, to be able to keep apace with digital technologies in the current financial climate. We are having to replace software that has expired with newer versions and adapt our business models to incorporate this which can be challenging.The Civic Barnsley (medium arts centre, NPO)
There are risks we have taken to trial new things that have turned out to be more time consuming than we appreciated. Trends change quite quickly so it’s easy to invest time in something that seems like a good idea, but quickly becomes obsolete.Wild Rumpus CIC (medium combined arts organisation)

Digital Culture 2019
33
6.3 R&D behaviours
Overall, there has been a downward trend in R&D behaviours. Figure 17 shows, for example, that the proportion of organisations agreeing that they engage in experimentation and take risks with digital technology has fallen from 33 per cent in 2014 to 27 per cent in 2019 and the proportion of organisations claiming to evaluate the impact of their digital work on their core mission has dropped from 33 per cent in 201421 to 26 per cent in 2019.
Figure 17: R&D behaviours for all organisations, 2014–201922
How well do you think the following statements describe your organisation’s behaviour with regard to digital research and development (R&D)?
Base: Respondents in the following years: 2014 (n = 945); 2015 (n = 984); 2017 (n = 1,183); 2019 (n = 958).
In 2017, a new question was introduced asking if organisations worked in partnership with others in the arts and culture sector to achieve their digital ambitions. This might help organisations overcome both resource and skills shortfalls and provide access to specific technological expertise for short-term projects, as this quote suggests.
‘We worked in partnership with a local arts organisation to enhance our temporary exhibition with VR and app development.Wakefield Council – Libraries & Museums (medium heritage organisation, NPO)
The percentage of organisations reporting partnerships with other arts organisations, 28 per cent, has not changed from 2017. The fact that little more than a quarter of organisations are working in partnership on digital projects suggests that there is an opportunity for substantial further collaboration in this area.
25%
27%
26%
18%
15%
28%
11%
2014 2015 2017 2019
We partner with technology providers on collaborativeprojects
We partner with other arts organisations on projectswith a digital component
We use our knowledge and resources to support other sectororganisations to develop their digital R&D capabilities
We actively seek to share our experiences with peersoutside the organisation
We engage in experimentation and take risks withdigital technology
We evaluate the impact of our digital work on our coremission
We have built strong networks of contacts to supportour digital R&D
New in 2019
New in 2017

Digital Culture 2019
34
The data concerning R&D behaviours shows differences between disciplines and the sector as a whole, particularly when looking at heritage organisations (museums, libraries and archives). Figure 18 shows that organisations in these categories appear currently to be well behind the sector as a whole in exhibiting R&D behaviours.
Figure 18: Comparing R&D in heritage organisations (museums, libraries and archives) with the sector
How well do you think the following statements describe your organisation’s behaviour with regard to digital resarch and development (R&D)?
Base: All respondents: 2019 (n = 958); Museums, libraries and archives; 2019 (n = 171).
We use our knowledge and resources to supportother sector organisations to develop their
digital R&D capabilities
0%
Overall sector in 2019
10%5% 15% 20% 25% 30%
We partner with other arts and cultureorganisations on projects with a digital component
We have built strong networks of contacts tosupport our digital R&D
We actively seek to share our experiences withpeers outside the organisation
We evaluate the impact of our digital work onour core mission
We engage in experimentation and take risks withdigital technology
We partner with technology providers oncollaborative projects
Museums, libraries and archives in 2019
11%
28% 18%
15% 9%
25%
14%
14%
18%
10%
26%
27%
11%
4%

Digital Culture 2019
35
6.4 R&D in NPOs
There is evidence that NPOs are engaged in R&D behaviours more than the sector overall. For example, 46 per cent of NPOs evaluate the impact of their digital work on their mission and 45 per cent of NPOs partner with other arts and culture organisations on projects with a digital component, versus 26 per cent and 28 per cent respectively for the sector as a whole. These figures have remained largely static since 2014.
NPOs also tend to be more satisfied with their current investments in digital technology: 71 per cent are either satisfied or very satisfied versus 62 per cent amongst the sector overall. NPOs are also more likely to report that they are planning to increase their investments in digital: 78 per cent plan to invest more time and resources in the next 12 months versus 63 per cent across the wider sector.
Overall however, NPOs also remain cautious and risk averse in their attitudes towards R&D. For example, only 13 per cent of NPOs try to experiment with digital technologies. Senior management within NPOs appear less engaged with digital innovation: only 15 per cent of NPOs agree that their senior management prioritise coming up with digital ideas and the same percentage agree that their senior management are knowledgeable about digital technology. These numbers have all trended down slightly since 2014, and it seems that the sector as a whole has struggled during the period of the Digital Culture study to develop a more experimental mindset regarding digital technologies.23

Digital Culture 2019
36
7. Enablers and barriers 7.1 Overview
Arts Council England’s draft 2020–2030 strategy states that:
We want to work in partnership with further and higher education and the commercial sector to strengthen training opportunities so that more people working in the cultural sector become ready adopters and developers of new technologies. We believe that this will increase the adaptability of people coming into creative careers, supporting them to move back and forth between the publicly funded cultural sector and the commercial creative industries, circulating knowledge and skills as they do so.
Sections 4 and 5 reveal a continuation of the trends reported in 2017 and imply that advanced and strategic behaviours in business model development and uses of audience data have so far failed to establish deep roots in the sector. Section 6 highlights a decline in organisations undertaking research and development behaviours and suggests that they may be adopting a more cautious approach to undertaking new digital activity. To understand why this may be the case, this section explores what the enablers and barriers are to organisations achieving their digital aspirations.
7.2 Investing in digital technology
The most frequently cited barriers to organisations realising their digital aspirations are lack of funding to allocate to digital (70 per cent in 2019); difficulty in accessing external funding for digital projects (58 per cent); and lack of in-house staff time (68 per cent).24
These figures have all remained largely static since 2013. Despite the perceived pressures on funding however, responses to a new question introduced in 2019 show that the majority of organisations (63 per cent) are planning to increase their investments in digital technology in the next 12 months. A further 34 per cent plan to maintain their current levels of investment, which indicates that 97 per cent of organisations overall retain an ongoing commitment to their digital activities.24 Those projecting increases could as a result experience a reduction in financial barriers and perhaps an increase in staff resource to support their digital work. However, alongside available finances, there are other enablers and barriers to organisations achieving their aspirations for digital technology.25

Digital Culture 2019
37
Another question introduced in 2019 looked at organisations’ satisfaction with current investments.26 Figure 19 shows that 61 per cent of organisations were either satisfied or very satisfied, with a further 31 per cent claiming to be neutral, and only 7 per cent either dissatisfied or very dissatisfied with their investments in digital technology.
Figure 19: Organisations’ satisfaction with current investments in digital technology (2019)
How satisfied is your organisation with the investments it has made into digital technologies overall?
Base: 2019: All respondents (n = 978).
Organisations who are satisfied with their investments are more likely to engage in experimentation and take risks with digital technology than those who are dissatisfied, 34 per cent who are satisfied, compared to 25 per cent of those dissatisfied. Similarly, those who are satisfied with their investments are more likely to evaluate the impact of their digital work on their organisation’s core mission than those who are dissatisfied (33 per cent versus 19 per cent ) and 32 per cent of organisations who are satisfied with investments actively seek to share their experiences with peers outside the organisation, compared to only 20 per cent of those who are dissatisfied. Although these figures are all proportionately low, organisations who are satisfied with their investments are more likely to be carrying out these R&D behaviours.27
2%
Very satisfied Satisfied Neutral Dissatisfied Very dissatisfied
5%31%48%13%

Digital Culture 2019
38
7.3 Digital skills
Organisations that say that they are satisfied with their current investments in digital technology also tend to feel better served for digital skills than organisations who are dissatisfied: those that are satisfied feel poorly served for an average of only four skill areas, versus seven skill areas amongst those who are dissatisfied.28 Amongst those who claim advanced skills in business models, 80 per cent are satisfied with their current investments in digital. This suggests that skills levels are an important factor in maximising benefits and impact from digital technologies, leading to greater satisfaction in digital investments.29
The area in which most organisations feel well served (66 per cent ) is digital marketing, which was also the case in all previous years of the survey. This is unsurprising given that marketing is one of the most common business areas in which digital technology can support day-to-day activities. This means more regular expertise is required, rather than one-off, project-based expertise which may more likely be contracted out to a third-party supplier. Conversely, the percentage of organisations reporting that they are well served for digital production has declined (down from 50 per cent in 2013 to 30 per cent in 2019), along with project management (31 per cent to 25 per cent ) and multimedia or website design (56 per cent to 51 per cent ). The decline in production and project management skills could be an explanatory factor in the decrease in organisations creating standalone digital exhibits/works of art (down from 26 per cent of organisations in 2013 to 21 per cent in 2019) and digital works connected to an exhibition/artwork, but that offer a distinct experience (down from 29 per cent of organisations in 2013 to 23 per cent in 2019),30 both of which were reported in this year’s survey.
7.4 Digital skills within NPOs
Figure 20 shows that in 9 out of 11 skills areas the sector as a whole reports a decline in the perception of being ‘well served’ in 2019 compared to 2013. NPOs though are bucking the overall downturn in skills, reporting an increase in eight out of 11 skills areas relative to 2013. They are relatively well served for skills in creation, marketing, preserving and archiving and business models. As in previous years, NPOs feel they are better served across all skills areas than organisations overall. This points to a potential underlying cause for the growing gap between NPOs and non-NPOs in their ability to maximise benefits from digital technology.
Figure 20 points to growing disparities between NPOs and the sector overall in terms of feeling well served for skills. Even those skills areas where NPOs have reported a decline have declined more in the sector as whole. The areas in which NPOs report being best served for skills compared to the sector as a whole are data analysis (56 per cent versus 29 per cent in 2019), database management (53 per cent versus 29 per cent ) and digital strategy and planning (59 per cent versus 33 per cent ). This correlates strongly with the findings in section 5.4, which highlighted that NPOs are currently undertaking significantly more data-related activities than the rest of the sector.

Digital Culture 2019
39
Here is a list of skills and capabilities in key areas relating to digital technology and digital R&D. Please rate each one according to the extent to which your organisation is well served or under-served for its needs in these areas.
Base: NPOs in the following years: 2013 (n = 383), 2019 (n = 388); All organisations in the following years: 2013 (n = 879), 2019 (n = 970).
Figure 20: Proportion of NPOs and all organisations reporting to be well served for different skills areas – 2013 and 2019
86% 90%
68% 66%
59% 49%
50% 30%
45% 53%
31% 29%
48% 56%
29% 29%
41% 43%
34% 31%
69% 68%
57% 51%
31% 33%
32%
0% 10% 20% 30% 40% 50% 60% 70% 80% 90% 100%
24% 21%
30%
32% 25%
32% 42%
24% 25%
29%
21% 19%
38% 39%
25% 24%
23%
NPO 2013 NPO 2019 Sector 2013 Sector 2019
Data analysis
Multimedia/website design (including audio, graphics, text,animation, video)
Legal advice around intellectual property rights (e.g. inrelation to collaborative projects)
Rights clearance
User interface design and user testing
Project management (including agile developmentmethodologies)
Digital commissioning and partner management(e.g. creative, curatorial, or other professional services)
Digital marketing (including use of Facebook and Twitter,email newsletters)
Digital production (including virtual reality and augmentedreality, audio and film production and editing)
Database management/Customer RelationshipManagement (CRM)
Software development (including website and appdevelopment)

Digital Culture 2019
40
7.5 How digital capabilities are distributed throughout organisations
This section focuses on the deployment of digital capabilities within organisations. It looks at the distribution of digital skills across organisations and how the proportion of staff that have a digital remit has evolved since 2013. Figure 21 suggests that over time, the proportion of staff that have a digital remit has fallen. For example, the proportion of organisations who say they have no staff with a digital remit has risen over successive surveys from 4 per cent in 2013 to 19 per cent in 2019. In terms of how digital capability is organised within staffing structures, the proportion of organisations who agree that digital expertise is distributed across their organisational structure has fallen from 15 per cent in 2013 to 10 per cent in 2019.
Rolling out digital work can be difficult in terms of defining outcomes and ensuring that its use is embedded across teams. Use of digital can be a bit siloed in marketing.Bristol Music Trust (large music organisation, NPO)
We are trying to introduce new internal management tools but it has been slow to get adoption across enough staff.Medium museum and gallery, NPO
Figure 21: Proportion of full-time/part-time paid staff who have a digital remit
How many of the staff within your organisation play an active role in carrying out and developing your digital activities?
Base: All organisations in the following years: 2013 (n = 740); 2015 (n = 790); 2017 (n = 1,064); 2019 (n = 899).
None (0%)
2013
2015
2017
2019
1%-25% 26%-50% 51%-75% 76%-100% Don’t know
0% 10% 20% 30% 40% 50% 60% 70% 80% 90% 100%
4% 17% 28% 9% 37% 5%
5% 15% 29% 11% 35%
18% 13% 26% 11% 30%
2%
5%
19% 14% 24% 11% 28% 4%

Digital Culture 2019
41
The proportion of organisations with no staff with a digital remit has increased by 15 percentage points since 2013 (from just 4 per cent to 19 per cent), whilst the category which suggests the widest distribution of digital capabilities, 76–100 per cent , has declined by nine percentage points (from 37 per cent to 28 per cent).
Figure 22, which looks at the same data set through the lens of organisations’ turnover, shows that the decline in staff with a digital remit is concentrated on small organisations (turnover <£100k) where there has been a substantial rise in organisations reporting that they have no staff with a digital remit, from just 1 per cent in 2013 to 23 per cent in 2019.31 This is likely to be a contributory factor in the disparities between small and large organisations highlighted throughout this report. However, small organisations are also more likely than large organisations (with turnover >£500k) to report a higher distribution of digital skills across their staff. This would be consistent with the fact that in organisations with few staff, staff members are more likely to have to perform multiple job functions.
Figure 22: Proportion of staff with a digital remit by organisation size
How many of the staff within your organisation play an active role in carrying out and developing your digital activities?
Base: Small organisations in the following years: 2013 (n = 186); 2019 (n = 257). Large organisations in the following years: 2013 (n = 234); 2019 (n = 309).
None (0%)
Smallorganisations
2013
Smallorganisations
2019
Largeorganisations
2013
Largeorganisations
2019
1%-25% 26%-50% 51%-75% 76%-100% Don’t know
0% 10% 20% 30% 40% 50% 60% 70% 80% 90% 100%
1%
7% 25% 5% 55% 8%
23% 4% 22% 7% 40% 7%
14% 40% 22% 11% 10% 3%
17% 37% 26% 7% 9% 4%

Digital Culture 2019
42
7.6 Additional barriers hindering the realisation of aspirations for digital technology
In addition to the funding, staffing and skills constraints highlighted in sections 7.1 to 7.4, there is evidence that expertise in digital technology is not being developed or augmented at the top levels of arts and cultural organisations. The proportion of all organisations that agree that their senior management are knowledgeable about digital technology has fallen from 22 per cent in 2013 to 13 per cent in 2019. The findings from the 2019 survey therefore suggest that organisations should focus on developing digital skills across their staff vertically as well as horizontally. There are numerous ways in which the decline in expertise at top level could be detrimental to an organisation’s ability to develop digitally. For example, Figure 23 shows that 60 per cent of organisations who claim advanced skills in business models cite support from senior members of the team as an enabling factor.32 An increase in digital knowledge and capacity at senior leadership level would seem an obvious way in which sector organisations could be enabled to make better progress in their digital development in the future.
Figure 23: Factors considered important for raising skill levels, as reported by those with basic and those with advanced digital skills in business models
Those with advanced skills: Thinking about income generation, which, if any, of the following methods have been used at your organisation to raise those specific skill levels or ensure that skill levels are high enough.
Those with basic skills: Which of the following, if any, would help you advance your digital skills across business models?
Base: 2019: Respondents with basic skills (n = 545), 2019: Respondents with advanced skills (n = 208).
Recruitment of staff with specific skills/knowledgeplatforms
Organisations with basic skills: methods that would help raise skill levels
Support from senior members of the team
Training sessions delivered by external trainingsuppliers
Partnerships with other organisations who haveshared their knowledge
Time is dedicated to developing digital skillsrelated to business models
Training sessions delivered by existing membersof staff
Support from funding bodies such as Arts Council,Nesta, The Space etc.
Funding is dedicated to developing digital skillsrelated to business models
Organisations with advanced skills: methods used to achieve these skills
36% 65%
60%
55%
55%
50%
48%
32%
26%
7%
53%
49%
43%
8%
65%
46%

Digital Culture 2019
43
In addition to support from senior team members, 48 per cent of organisations with advanced skills in business models identified training by existing staff members as an important factor. Amongst those with basic skills, however, only 8 per cent said internal training would help to improve their skill levels. Peer-to-peer skills sharing can be a relatively inexpensive and quickly administered form of staff development, and usually results in a more even distribution of skills across organisations. Although in smaller organisations skills and capacity are likely to be more thinly spread, the survey data shows that a significant number of smaller organisations with advanced digital skills in business models also report benefiting from internal training.33

Digital Culture 2019
44
8. Conclusions This year’s survey findings suggest that progress will need to be made if digital technologies are to play their part in helping the sector meet the challenges set out in Arts Council England’s draft 2020–2030 strategy. There are signs that older, more established digital technologies may be reaching saturation within the sector and beginning to decrease, both in their perceived importance and in some cases their actual impact, and organisations of all kinds appear to be less engaged in R&D behaviours and in experimenting with and developing new technologies.
The uptake of newer technologies appears to be limited and concentrated in specific groups within the sector, in particular larger organisations and those within the Arts Council’s national portfolio. Both of these groups are, for example, more likely to use technologies such as CRM software and dynamic pricing which enable sophisticated data use. Lower-cost digital technologies and business solutions are, however, increasingly becoming available, which may mean that the barriers to entry for smaller, less well-resourced organisations will lessen over time. The relative skills shortage reported in particular by smaller, non-NPO organisations, could potentially be addressed, in part, through seeking to work in partnership more, either with other arts and culture organisations or with digital specialists. The concentration of digital skills within a smaller set of staff within organisations and the low levels of digital expertise and skills in senior leadership may also need to be addressed if arts and culture organisations are to maximise the benefits potentially available to them from digital technology.
The increased financial pressure which organisations are working under will inevitably impact on their ability to adopt more resource-intensive digital activities, such as dynamic pricing or virtual or augmented reality technology, and it is unrealistic and probably undesirable for organisations to prioritise more sophisticated technologies for marginal gains. The challenge for organisations is to engage with digital technology more strategically; to seek those technologies which are best suited to their mission and aims; and to reflect more, particularly at a senior level, on the value that they are seeking to create for their audiences, workforce and artists through the use of technology.
A widening gulf between large and small organisations is notable in many areas investigated by the survey. While the ability to invest in new technologies and benefit from economies of scale that come with higher overall income is undoubtedly a factor in these disparities, it is not the full picture. Whatever their scale and the resources available to them, organisations need to develop the right organisational structure, priorities and skills, backed up by senior level commitment in order to create the conditions in which to benefit fully from the opportunities presented by digital technologies.

Digital Culture 2019
45
9. Endnotes1. On occasion, differences between subgroups are
described as ‘statistically significant’. This refers to the use of a statistical hypothesis testing technique known as T-testing, which has been employed to lend weight to the observation of varying findings from one subgroup to another. Statistically significant differences indicate that there is a greater than 95 per cent probability that the difference between subgroups has not arisen by chance; that is, there is a high degree of certainty that the two subgroups are materially different with respect to the variable in question.
2. In line with previous versions of the study, libraries have not been included in the organisations invited to complete the survey, unless they are Arts Council England NPOs.
3. By ‘consistent’ here, we mean that the full sample and the returning ‘panel’ sample do not contradict one another. There are cases when the full sample may show a statistically significant change over time, but the panel sample does not, at least in part because it is much smaller, so a higher degree of movement is needed in order to deliver a change that is statistically significant at a 95 per cent confidence level.
4. Q28 – Thinking back over the past 12 months, would you say your organisation’s use of the internet and digital technology has had a major positive impact, a minor positive impact, or no positive impact at all on each of the following? Base: All organisations in the following years: 2013 (n = 891); 2015 (n = 984); 2017 (n = 1,239); 2019 (n = 997).
5. Between 2013 and 2014 the description of business models was changed; specifically, one of the examples given was changed from ‘syndicating digital content to a third-party ad-funded site’ to ‘allowing online donations through your organisation’s website’.
6. 2017–2018 NPO Annual Data Survey Full Report, page 51, section 6.1.2.
7. Q12 – Now thinking about your organisation’s digital activities, please indicate which of the following your organisation currently does. Base: 2013 (n = 891); 2015 (n = 984); 2017 (n = 1,424); 2019 (n = 1,134).
8. https://www.artsprofessional.co.uk/magazine/article/are-you-sure-price-right
9. We have compared organisations with turnover <£100,000 and with turnover >£500,000 when considering size of organisation. This enables a simpler conclusion to be drawn as to whether or not organisation size is a determining factor in our analysis.
10. Where requested by the contributing survey respondent, specific attribution of quotes has not been made public.
11. Definitions of nets: audience breadth (reaching a more diverse audience, reaching a younger audience, reaching an international audience); audience width (reaching a bigger audience); audience depth (engaging more extensively, understanding our audiences).
12. Use of Facebook: 90 per cent in 2013 survey and 92 per cent in 2019. Use of Twitter: 79 per cent in 2013 survey and 83 per cent in 2019.
13. Q18 – On which, if any, of the following social networks/websites does your organisation currently have a regularly active profile? Base: 2013 – all respondents (n = 891); 2019 – all respondents (n = 1,029).
14. All NPOs are required to sign up to Audience Finder to help them understand more about audience demographics, motivations and behaviours. They provide an annual summary report to Arts Council. For Band 2 and 3 NPOs this report must include demographic information about their audiences in relation to age, gender, ethnicity and disability. Band 2 and 3 NPOs are required to use the Impact and Insight Toolkit to evaluate four pieces of work each year. This provides insight into the impact their work has had on audiences and peers and how well their creative intentions have been met. They provide an annual summary report to Arts Council.
15. https://towardsdatascience.com/5-industries-becoming-defined-by-big-data-and-analytics-e3e8cc0c0cf
16. Q12 – Now thinking about your organisation’s digital activities, please indicate which of the following your organisation currently does. Base: 2019 all respondents (n = 1,134), NPOs (n = 412).

Digital Culture 2019
46
17. 2019 was the first year that this data was collected so there is no contextual data from previous years.
18. For more information on defining R&D for the creative industries, read this policy briefing, co-authored by Nesta and UCL.
19. Please note that we have only shown the extreme ends of the scale (i.e. agreement with each statement) and have not shown the middle of the scale. We presented each of the pairs of statements at opposite ends of an 11-point scale. Here, we have only shown those selecting 0/1 for the statements on the left-hand side, and 9/10 for the statements on the right-hand side.
20. Q72 – How do the following statements describe your organisation. Base: All respondents: 2017 (n = 1,180), 2019 (n = 953).
21. This question was first introduced in 2014.
22. Questions first introduced in 2014, 2017 and 2019.
23. Q49A – How well do you think the following statements describe your organisation’s behaviour with regard to digital research and development (R&D)? Base: All respondents – 2014 (n = 945), 2019 (n = 958), NPOs – 2014 (n = 431), 2019 (n = 384). Q73 – How satisfied is your organisation with the investments it has made in digital technologies overall? Base: All respondents – 2019 (n = 978), NPOs – 2019 (n = 390). Q74 – Please think about how much time and resources your organisation currently invests in digital. Compared to this, how much time and resources does your organisation plan to invest in digital in the next 12 months? Base: All respondents – 2019 (n = 977), NPOs – 2019 (n = 390). Q72 – How well do the following statements describe your organisation? Base: NPOs – 2019 (n = 384).
24. Q37 – Overall, how great an impact do you feel digital technology has had on your organisation’s ability to fulfil its mission effectively?
25. Q74 – Please think about how much time and resources your organisation currently invests in digital. Compared to this, how much time and resources does your organisation plan to invest in digital in the next 12 months? Base: All respondents: 2019 (n = 977).
26. Q73 – How satisfied is your organisation with the investments it has made in digital technologies overall? Q74 – Please think about how much time and resources your organisation currently invests in digital. Compared to this, how much time and resources does your organisation plan to invest in digital in the next 12 months?
27. Q49A – Base: Organisations who are satisfied with digital investments (n = 621), Organisations who are unsatisfied with digital investments (n = 65).
28. Q45 – Here is a list of skills and capabilities in key areas relating to digital technology and digital R&D. Please rate each one according to the extent to which your organisation is well served or under-served for its needs in these areas. There were 14 skills areas tested in 2019. Base: 2019 – satisfied with digital investments (n = 627); 2019 – dissatisfied with digital investments (n = 65).
29. Q73 – Base: Respondents who reported advanced skills in business models (n = 208).
30. Q45 – Base: All respondents: 2019 (n = 969). Q12 – Now thinking about your organisation’s digital activities, please indicate which of the following your organisation currently does. Base: 2019 – all respondents (n = 1,134); 2013 – all respondents (n = 891).
31. Q48 – Base: Small organisations in the following years: 2013 (n = 186); 2014 (n = 192); 2015 (n = 201); 2017 (n = 346); 2019 (n = 257). Large organisations in the following years: 2013 (n = 234); 2014 (n =2 61); 2015 (n = 249); 2017 (n = 312); 2019 (n = 309).
32. Q67a – Those with advanced skills: Thinking about income generation, which, if any, of the following methods have been used at your organisation to raise those specific skill levels or ensure that skill levels are high enough? (2019 only) Q67b – Those with basic skills: Which of the following, if any, would help you advance your digital skills across business models? (2019 only).
33. 57 per cent of large organisations and 44 per cent of small organisations with advanced business model skills report internal training as an important factor.

58 Victoria Embankment London EC4Y 0DS
+44 (0)20 7438 2500 [email protected] @nesta_uk www.facebook.com/nesta.ukwww.nesta.org.uk
Nesta is a registered charity in England and Wales with company number 7706036 and charity number 1144091. Registered as a charity in Scotland number SCO42833. Registered office: 58 Victoria Embankment, London, EC4Y 0DS.


