68
Digital Culture: How arts and cultural organisations in England use technology

Digital Culture: How arts and cultural organisations in England use technology

Foreword 3
Executive summary 4
1 Introduction 11
2 Use of digital technology by arts and cultural organisations 15
3 Barriers and enablers for digital technology 36
4 Maximising the impact of digital technologies 44
5 Conclusions: on a digital journey 50
Appendix A: Project background and methodology 52
Appendix B: Arts and cultural organisations represented in the survey 58
Endnotes 64
Image credits 67
Table of contents
Digital Culture: How arts and cultural organisations in England use technology

3 Foreword
Digital Culture: How arts and cultural organisations in England use technology
Experimentation lies at the heart of practice for so many arts and cultural organisations. But as a sector we are not always so good at sharing the results.
As with innovation more generally, arts and cultural organisations have a great deal to learn from the successes and failures of others, but for this they need mechanisms through which they can share and tap relevant insights.
Nesta first joined forces in 2011 with Arts Council England and the Arts and Humanities Research Council to build a programme for just this purpose. The Digital R&D Fund for the Arts, since developed into a three-year programme in England and separately piloted in Scotland and Wales, funds arts and cultural organisations who, in partnership with technology companies and academic researchers, want to test audience engagement or business model propositions involving the innovative use of digital technologies.
A defining feature of all the R&D funds is that the insights and results from the experiments they support are captured and energetically disseminated across the sector. A three-year study of how arts and cultural organisations are using new technologies is an integral part of this effort. The survey’s longitudinal nature allows organisations to benchmark their performance against their peers over time. In addition, by tracking the technology journeys of different organisations, the survey will, in time, allow the funders to rigorously establish the additional impact the Fund has had.
This first year report paints a rich picture of how arts and cultural organisations in England are making use of digital technologies in pursuit of their core missions. It sheds much needed quantitative light on previously understood trends, such as the use of digital technologies for marketing purposes. It also measures the rate of adoption of different technologies by cultural institutions, and outlines what organisations can learn from the ‘cultural digirati’ who are embracing technologies most widely and who, the survey suggests, are seeing significant paybacks.
Thank you to those organisations who completed the survey.
We hope you find the research findings as intriguing as we do and, as ever, welcome your reactions and comments on twitter, using the hashtag #artsdigital, or via email at [email protected]
Hasan Bakhshi Director, Creative Economy, Nesta Policy & Research Unit
Foreword
4 Executive Summary
Digital Culture: How arts and cultural organisations in England use technology
Introduction
Digital technologies are disrupting established practices and creating new opportunities for innovation across the creative economy. Some forms of cultural experience, such as video games, only exist by virtue of digital technology. Others, including film, music and literature, pre-date digital technology, but are now being made or distributed using it. The public’s appetite for discovering, consuming and sharing cultural content and experiences through the internet, and on social and mobile media, appears to have no end.
Accordingly there is much discussion about the potential of digital technologies for arts and cultural organisations. A 2010 study by Hasan Bakhshi and David Throsby suggested that organisations can use technologies to reach new audiences, generate new revenue streams, improve operating efficiency and generate entirely new forms of artistic experience and cultural value.1 The opportunities presented by digital technology led Nesta, Arts Council England and the Arts and Humanities Research Council (AHRC) to establish the Digital R&D Fund for the Arts to encourage organisations to experiment with digital technologies and share their findings publicly.
However, the quantitative evidence in this area is limited. How are different cultural institutions in England using digital technologies? What kinds of impacts are they experiencing, and in particular are digital technologies helping organisations to pursue their core missions? What barriers are there to the adoption of digital technologies and what can be learned from the experiences of those organisations that have embraced new technologies most wholeheartedly?
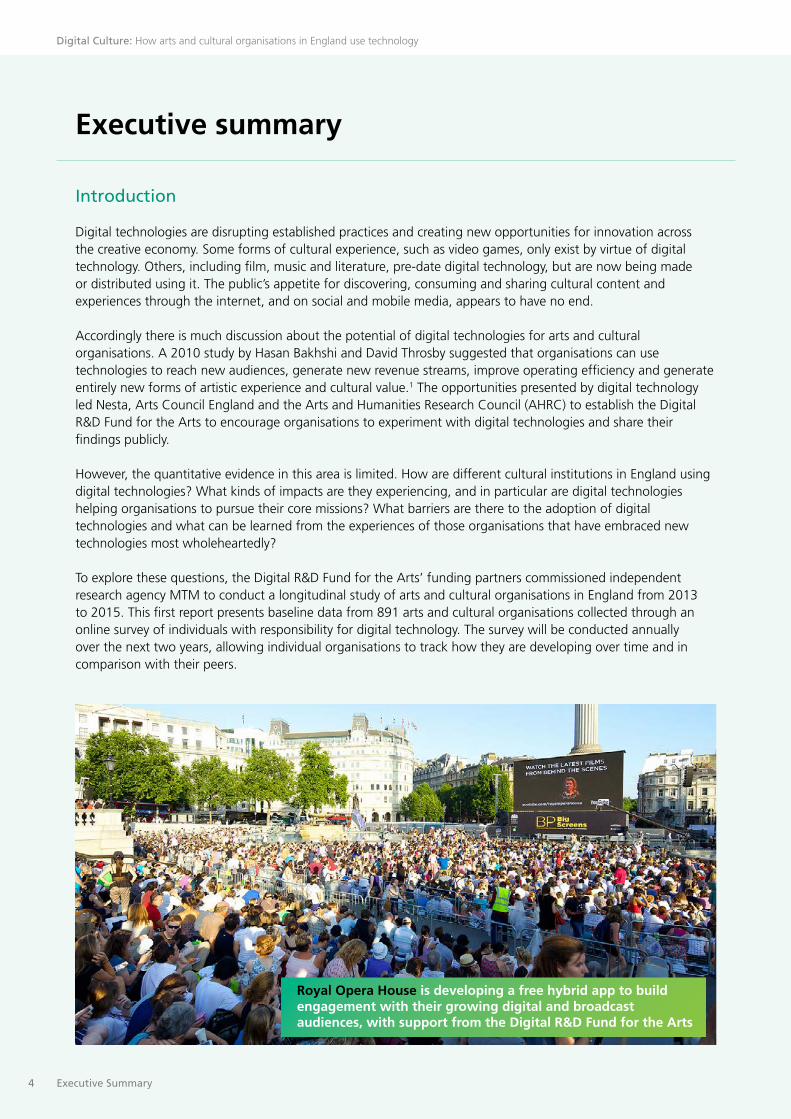
To explore these questions, the Digital R&D Fund for the Arts’ funding partners commissioned independent research agency MTM to conduct a longitudinal study of arts and cultural organisations in England from 2013 to 2015. This first report presents baseline data from 891 arts and cultural organisations collected through an online survey of individuals with responsibility for digital technology. The survey will be conducted annually over the next two years, allowing individual organisations to track how they are developing over time and in comparison with their peers.
Executive summary
Royal Opera House is developing a free hybrid app to build engagement with their growing digital and broadcast audiences, with support from the Digital R&D Fund for the Arts

5 Executive Summary
Digital Culture: How arts and cultural organisations in England use technology
Key findings from the survey include:
• Almost three-quarters of organisations now regard digital as essential to their marketing, and almost 60 per cent view it as essential for preserving and archiving their work, and for their operations. In creation and distribution, around one-third of organisations see digital technologies as essential, though the picture varies by art and cultural form.
• Between 25 per cent and 50 per cent of organisations report that digital technologies are delivering them major positive impacts in terms of audience development, creative output and operating efficiency. Just over one in ten report a major positive impact on revenues.
• Museums are less likely than the rest of the sector to report positive impacts from digital technologies, particularly in terms of revenue generation and audience development.
• Over 60 per cent of arts and cultural organisations report that they are primarily constrained in their digital activities by a lack of staff time and funding, and over 40 per cent report a lack of key technical skills such as data management.
• The 10 per cent of organisations who have embraced technology most wholeheartedly (seeing it as essential to all aspects of their work) are reaching larger digital audiences and are more likely to report positive impacts from technology compared with the rest of the sector.
• These ‘cultural digirati’ are making greater use of a wide range of resources for advice and ideas, are more open to experimentation, and have digital skills spread throughout their organisation rather than concentrated in any one area.
The majority of organisations regard digital technologies as essential to marketing, preserving and archiving, and operations
Across the sector as a whole digital technology is permeating almost all aspects of organisations’ activities.
The clear majority of organisations regard digital technology as essential to marketing, preserving and archiving, and operations:
• 73 per cent say digital technology is now essential to their marketing and audience development, and a further 19 per cent say it is important. Almost all organisations surveyed (92 per cent) have their own branded website and over 90 per cent are active on social media.
• The majority also regard digital technology as essential to preserving and archiving, and to their operations (57 per cent and 56 per cent respectively).2
6 Executive Summary
Digital Culture: How arts and cultural organisations in England use technology
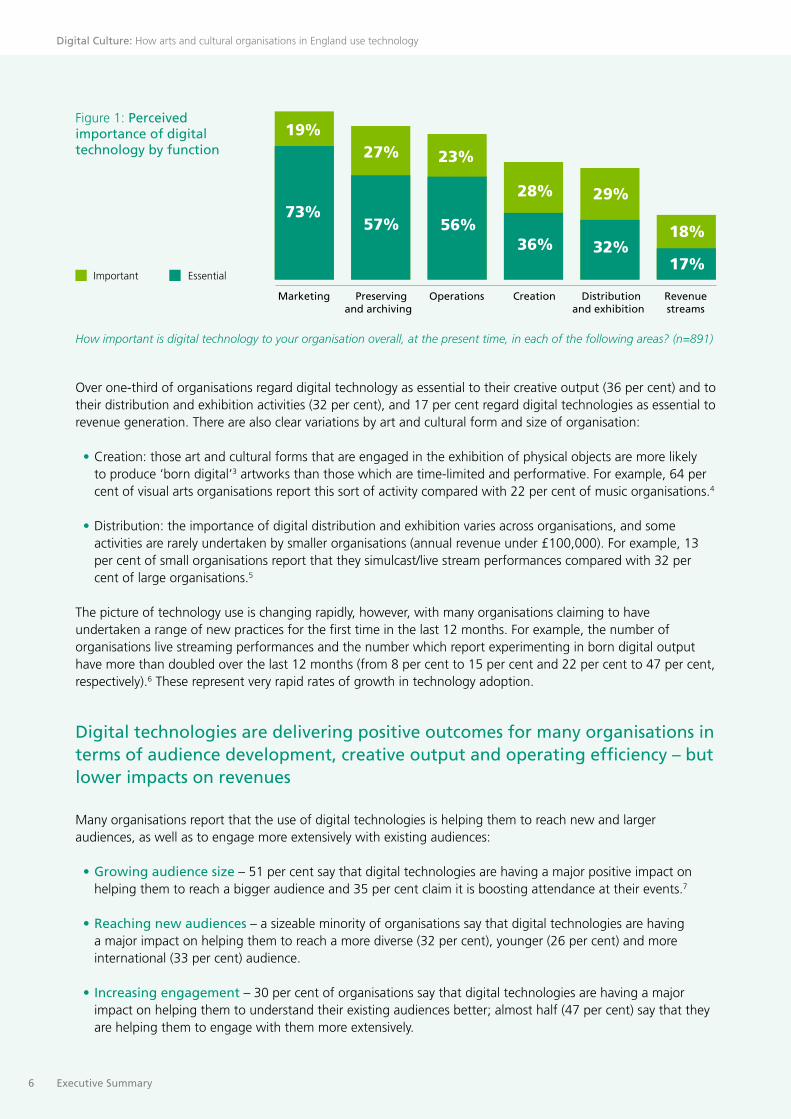
How important is digital technology to your organisation overall, at the present time, in each of the following areas? (n=891)
Over one-third of organisations regard digital technology as essential to their creative output (36 per cent) and to their distribution and exhibition activities (32 per cent), and 17 per cent regard digital technologies as essential to revenue generation. There are also clear variations by art and cultural form and size of organisation:
• Creation: those art and cultural forms that are engaged in the exhibition of physical objects are more likely to produce ‘born digital’3 artworks than those which are time-limited and performative. For example, 64 per cent of visual arts organisations report this sort of activity compared with 22 per cent of music organisations.4
• Distribution: the importance of digital distribution and exhibition varies across organisations, and some activities are rarely undertaken by smaller organisations (annual revenue under £100,000). For example, 13 per cent of small organisations report that they simulcast/live stream performances compared with 32 per cent of large organisations.5
The picture of technology use is changing rapidly, however, with many organisations claiming to have undertaken a range of new practices for the first time in the last 12 months. For example, the number of organisations live streaming performances and the number which report experimenting in born digital output have more than doubled over the last 12 months (from 8 per cent to 15 per cent and 22 per cent to 47 per cent, respectively).6 These represent very rapid rates of growth in technology adoption.
Digital technologies are delivering positive outcomes for many organisations in terms of audience development, creative output and operating efficiency – but lower impacts on revenues
Many organisations report that the use of digital technologies is helping them to reach new and larger audiences, as well as to engage more extensively with existing audiences:
• Growing audience size – 51 per cent say that digital technologies are having a major positive impact on helping them to reach a bigger audience and 35 per cent claim it is boosting attendance at their events.7
• Reaching new audiences – a sizeable minority of organisations say that digital technologies are having a major impact on helping them to reach a more diverse (32 per cent), younger (26 per cent) and more international (33 per cent) audience.
• Increasing engagement – 30 per cent of organisations say that digital technologies are having a major impact on helping them to understand their existing audiences better; almost half (47 per cent) say that they are helping them to engage with them more extensively.
19%
73%
27%
57%
23%
56%
28%
36%
29%
32%18%
17%
Marketing Preservingand archiving
Operations Creation Distributionand exhibition
Revenuestreams
Important Essential
Figure 1: Perceived importance of digital technology by function
7 Executive Summary
Digital Culture: How arts and cultural organisations in England use technology
A good number also report that digital technologies have impacted their art and cultural work: 34 per cent describe them as having a major impact on production (for example creating new work, capturing existing work, or altering or enhancing work) and 27 per cent of organisations cite a major impact on how they exhibit their end product.8
The majority of organisations (60 per cent) report that digital technology has had a major impact on their ability to fulfil their mission effectively.9
Digital technology appears to have been more important in influencing operations than revenues. Whilst 31 per cent cite a major positive impact in terms of helping them operate more efficiently, the figure is significantly lower (11 per cent) when it comes to impacting overall revenues and to profitability.
Museums are less likely than the rest of the sector to report positive impacts from digital technologies
Analysis by organisation type suggests that museums may be less engaged with digital technology than other arts and cultural organisations. This is particularly evident in terms of audience development: 37 per cent of museums report a major positive impact on audience size, compared with 51 per cent of the total sample.10
Museums also report lower levels of activity and impact from digital technology on revenue generation. They report having lower than average levels of digital expertise and empowerment from their senior management and a lower than average focus on digital experimentation, and research and development.
Organisations feel constrained in their digital activities by a lack of staff time and funding, and a lack of key technical skills such as data management
Respondents identify a lack of resource in terms of staff time (68 per cent), internal budgets (68 per cent) and external funding (61 per cent) as the top three barriers to realising their digital aspirations.11 In terms of skills and capabilities, the areas in which the greatest number of organisations feel that they are not well-served are technical areas such as data analysis (41 per cent), database/customer relationship management (41 per cent) and software development (40 per cent), closely followed by legal advice on intellectual property (40 per cent) and user interface design (39 per cent). The least significant skills gaps are in the area of creative skills, such as digital production and marketing.12
Availability of funding is identified as a significant barrier to realising aspirations for digital technologies, and only 39 per cent of the organisations surveyed have applied for external funding for digital projects.13 Awareness of different funding sources seems high in general: 69 per cent of organisations are aware of the Digital R&D Fund, higher than for the Wellcome Trust Arts Awards (61 per cent) but lower than for Arts Council England’s Grants for the Arts (96 per cent).14
Organisations identify a number of sources of advice and expertise as important to their digital work. Over two-thirds (69 per cent) report that informal mentors, networks and partners are their most important sources, followed by in-house research / data analysis (59 per cent), funding bodies (58 per cent) and third-party suppliers (57 per cent).15
Many respondents who are aware of the Digital R&D Fund have discussed the Fund or its projects internally (39 per cent) and one quarter (25 per cent) have engaged with its case studies and podcasts. Although the Fund had not been active for long at the time of the survey, some respondents say they have already been inspired by the Fund to try new things with digital technology (12 per cent) or learned useful lessons from the Fund’s projects (7 per cent).16
8 Executive Summary
Digital Culture: How arts and cultural organisations in England use technology
The 10 per cent for whom technology is most important are reaching larger digital audiences and are more likely to experience positive impacts from technology in all areas, in particular financial performance
When organisations are ranked by how important they judge digital technology to be to their different activities (creation, marketing, distribution and exhibition, preserving and archiving, operations and business models), the top 10 per cent can be analysed as a group of ‘cultural digirati’. They represent a varied group of organisations, from the viewpoint of their art and cultural forms, their size and their region, and in many areas they exhibit characteristics and behaviours that are significantly different from the sector as a whole:
1. They undertake a wider range of digital activities, particularly in terms of digital creation and distribution. They are over twice as likely as their counterparts to be creating standalone born digital works and on average they have introduced more new digital activities in the last year.17
2. They reach larger digital audiences and use more sophisticated techniques. The average combined website/Facebook/Twitter audience for cultural digirati is almost double the sector average.18 Cultural digirati are also significantly more likely to make use of data-driven marketing techniques19 and mobile platforms.20
3. They are more likely to report major positive impacts from digital technology, especially in financial performance terms, where they are over three times more likely to say that digital technology has had a major impact on both overall revenues and profitability.21
The cultural digirati make greater use of a wide range of resources for advice and ideas, are more open to experimentation, and have digital skills spread throughout their organisation rather than concentrated in one area
In terms of barriers and enablers, the cultural digirati also exhibit particular characteristics that distinguish them from the rest of the sample:
1. They are twice as likely to agree that digital expertise is distributed throughout their organisation and almost twice as likely to agree that most of their senior management team is knowledgeable about digital technologies.
2. They are more likely to see resources outside full- and part-time employees as important for their organisation’s digital work. Just over half (51 per cent) see non-executive directors as important or fundamental to their organisation’s digital work, compared with 32 per cent of all organisations, and 58 per cent describe conferences, trade fairs and exhibitions as important compared with 29 per cent of all organisations.
3. They perceive fewer skills gaps in key areas. The cultural digirati feel much more comfortable with their capabilities than other organisations in almost all skills areas, and in particular with regard to software development, user interface design and digital commissioning.
4. Their culture and mindset is more geared towards digital experimentation. They tend to have a more positive attitude to digital research and development. Whereas only 17 per cent of all organisations think that coming up with digital ideas is a priority for senior management, 29 per cent of the cultural digirati hold this view. Similarly, 30 per cent of the cultural digirati agree that they try to experiment with digital technologies, compared with 18 per cent of all organisations.22
9 Executive Summary
Digital Culture: How arts and cultural organisations in England use technology
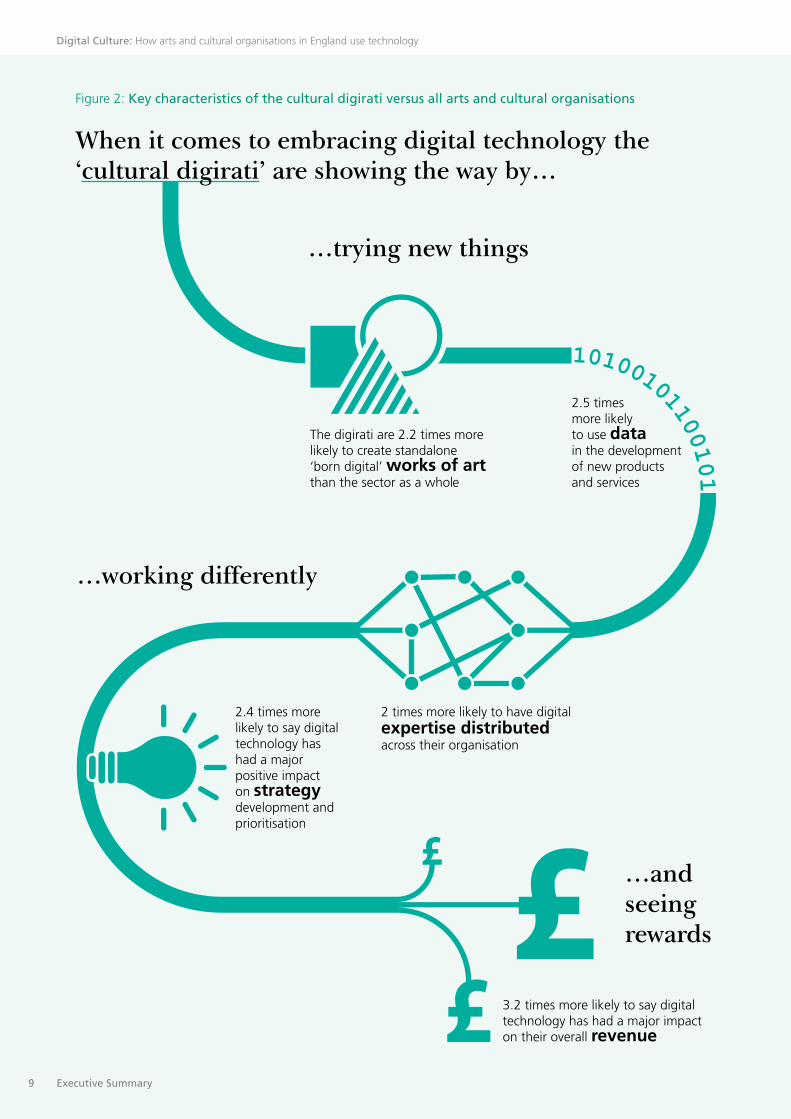
Figure 2: Key characteristics of the cultural digirati versus all arts and cultural organisations
When it comes to embracing digital technology the ‘cultural digirati’ are showing the way by…
…trying new things
…and seeing rewards
…working differently
2.5 times more likely to use data in the development of new products and services
The digirati are 2.2 times more likely to create standalone ‘born digital’ works of art than the sector as a whole
2 times more likely to have digitalexpertise distributedacross their organisation
2.4 times more likely to say digital technology has had a major positive impact on strategy development and prioritisation
3.2 times more likely to say digital technology has had a major impact on their overall revenue
10 Executive Summary
Digital Culture: How arts and cultural organisations in England use technology
Conclusions: on a digital journey
The survey findings paint a picture of an arts and cultural sector on a digital journey. A clear majority of organisations report that new technologies are already essential to their marketing, archiving and preservation, and operations. Over a third of organisations claim that digital technologies are essential to their creative work. A sizeable minority (17 per cent) report that they are also essential for generating revenues.
Different parts of the sector are experiencing different levels of impact from digital technology. Museums report lower levels of impact in many areas. In contrast, performing arts venues are much more likely to report major positive impacts, including on their revenues (almost a third compared with just 3 per cent of museums).
The 10 per cent who value digital technologies most highly – the cultural digirati – span a range of art and cultural forms, sizes and regions, and are more likely to report major positive impacts across the board. They have larger digital audiences and enjoy greater financial returns from their use of digital technologies. They make greater use of a wider range of resources for advice and expertise, embed digital skills across their organisation and are more open to experimentation.
These results are the baseline against which the findings of future surveys will be compared. As well as tracking the progress of arts and cultural organisations along their digital journeys, longitudinal data will enable more robust exploration of the impact of technology adoption on organisations. It will also enable exploration of the additional impact of the Digital R&D Fund on supported projects, and on digital research and development by arts and cultural organisations across England.
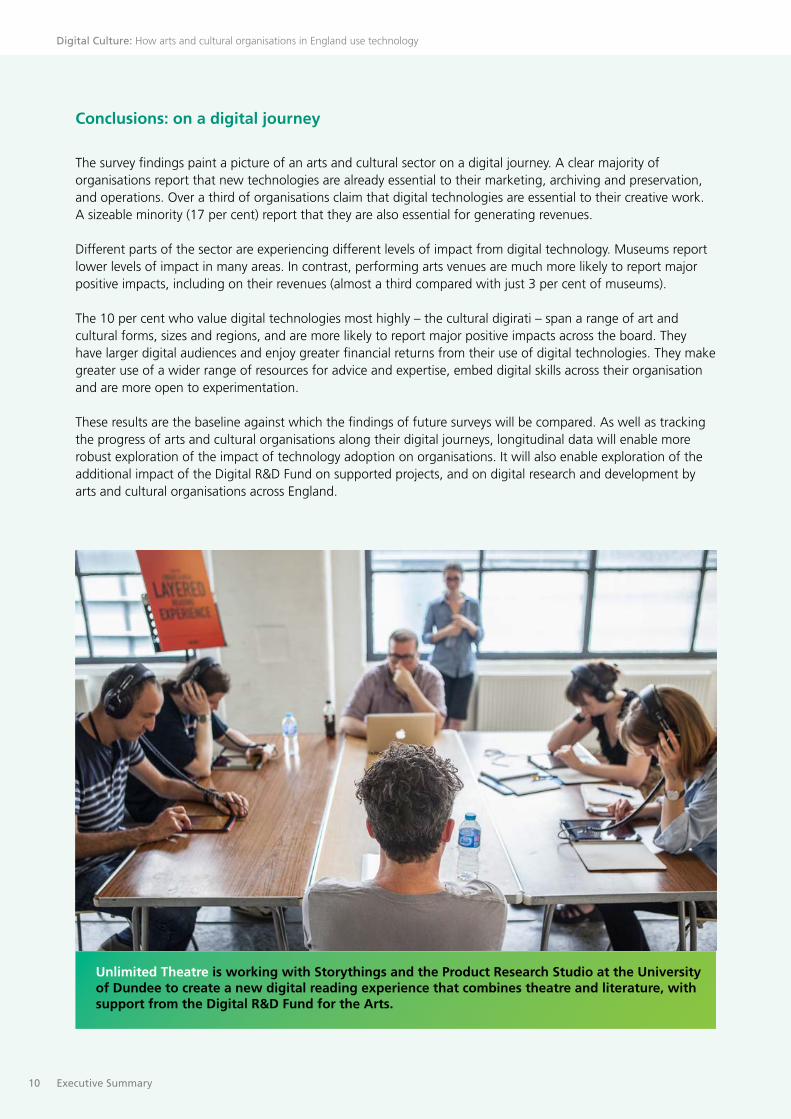
Unlimited Theatre is working with Storythings and the Product Research Studio at the University of Dundee to create a new digital reading experience that combines theatre and literature, with support from the Digital R&D Fund for the Arts.
1 Introduction
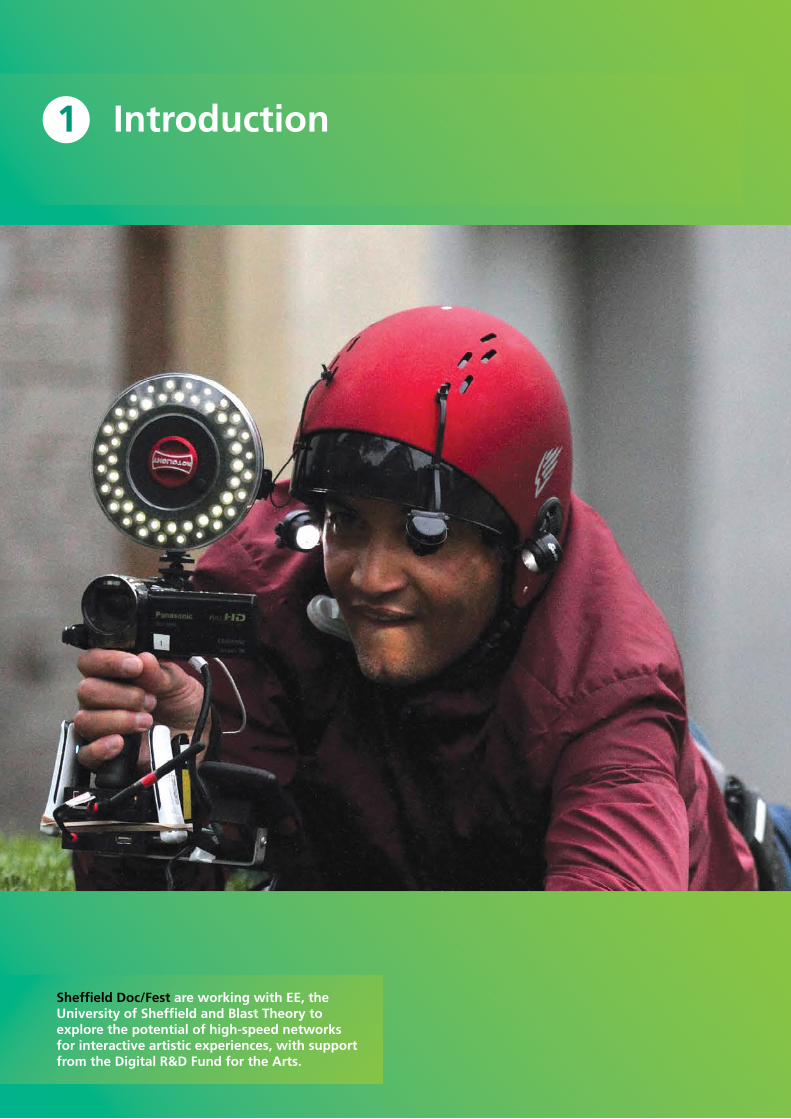
Sheffield Doc/Fest are working with EE, the University of Sheffield and Blast Theory to explore the potential of high-speed networks for interactive artistic experiences, with support from the Digital R&D Fund for the Arts.
12 Introduction
Digital Culture: How arts and cultural organisations in England use technology
Rapid changes are occurring in digital technology and consumer behaviours are constantly evolving. Businesses are transforming their products, services and business models to take advantage of the opportunities created and to manage the uncertainties. And the potential is not limited to just a small number of high technology sectors. Studies of the charitable sector report on the positive impacts of digital technologies, claiming in one case that 90 per cent of charities save time as a result of digital advances, 66 per cent save money and 73 per cent see increased interaction with their supporters.23
Digital technologies are also impacting on the arts and culture sectors. Some forms of artistic or cultural experience, such as computer games, only exist because of technology. Others, including film, music and literature, pre-date digital technology but are now often made or distributed using it. Use of the internet for consuming media and cultural experiences has become mainstream in the UK, with almost half (47 per cent) of internet users watching TV and video online, and one third downloading music/films/video clips.24
A 2010 study by Hasan Bakhshi and David Throsby suggested that cultural institutions can use technology to reach new audiences, generate revenue, improve operating efficiency and generate new forms of artistic experience and cultural value.25 This led Arts Council England, the Arts and Humanities Research Council and Nesta to create the Digital R&D Fund for the Arts, a £7 million fund to encourage collaboration between arts and cultural organisations, technology companies, and researchers. Between 2012 and 2015, the Fund will support projects that use digital technology to enhance audience reach and/or develop new business models for the arts and cultural sector.
However, the quantitative evidence base remains limited. In the US, a survey of arts organisations by the Pew Research Center in 2012 found that “the internet, social media, and mobile connectivity now permeate their operations and have changed the way they stage performances, mount and showcase their exhibits, engage their audiences, sell tickets, and raise funds.”26 The Pew report provides valuable insights into what American organisations are doing and the benefits they are seeing, but it is a cross-sectional – not longitudinal – study, limiting what it can say about change and causality, and until now there has been no equivalent dataset for England.
Recognising this, the Digital R&D Fund for the Arts commissioned MTM to conduct a three-year survey of how the arts and cultural sector in England is using digital technology, and to track the impact this has on the wider behaviours and performance of arts and cultural organisations. Our primary research questions include:
• How many cultural institutions in England are making use of digital technologies and to what end? How does the picture differ across art and cultural form?
• What are the key enabling factors for innovation with digital technology in cultural institutions?
• What are the main barriers to take up of new technologies? What can be learned from the experience of the most enthusiastic adopters to guide other organisations about how to overcome those barriers?
• In what ways are digital technologies helping cultural institutions to pursue their core missions more effectively and can impacts on their performance be discerned?
• What effect does participating in the Digital R&D Fund have on organisations and what are the impacts on innovation in the wider sector?
1.1 Introducing this study and the Digital R&D Fund
13 Introduction
Digital Culture: How arts and cultural organisations in England use technology
The survey will be repeated annually over the next two years in order to track how the sector is developing. It will enable participating organisations to benchmark their practices against their peers through a dedicated portal. The longitudinal dimension will also allow the funders to address questions of causality: what impact does digital technology have on organisations, after accounting for other factors such as their size? And a question of particular interest to policymakers: do organisations that receive support from funding initiatives like the Digital R&D Fund change their behaviour as a result, does this enhance their performance, and how does public knowledge generated by the Fund impact on the wider sector?
The survey questionnaire was developed following a literature review and extensive consultation with funding bodies and industry experts. It was then cognitively tested on eight arts and cultural organisations of varying sizes and characteristics. A revised questionnaire was then further tested with the first 5 per cent of organisations in the sampling frame on 29 May 2013, and final quality checks were carried out before the survey was launched. The questionnaire was administered online and took in the region of 30-40 minutes to complete.
The study’s sampling frame was defined around three categories of organisation within England’s arts and cultural sector:
• Arts Council England’s National Portfolio Organisations (NPOs): as of April 2013 there were 693 arts organisations in receipt of multi-year funding from Arts Council England.
• Museums: there are around 1,800 museums in England accredited through the UK’s Museum Accreditation Scheme,27 administered by Arts Council England. These include the 16 Renaissance Major Partner Museums (MPMs) that receive multi-year funding from Arts Council England.28
• Other organisations: around 1,700 organisations (excluding NPOs) received project funding from Arts Council England in 2010-11 and 2011-12 (over and above the NPOs). In addition, large numbers of organisations applied unsuccessfully for grant funding during this period and as a result Arts Council had the contact details for roughly 3,000 more organisations (approximately 4,700 in total).
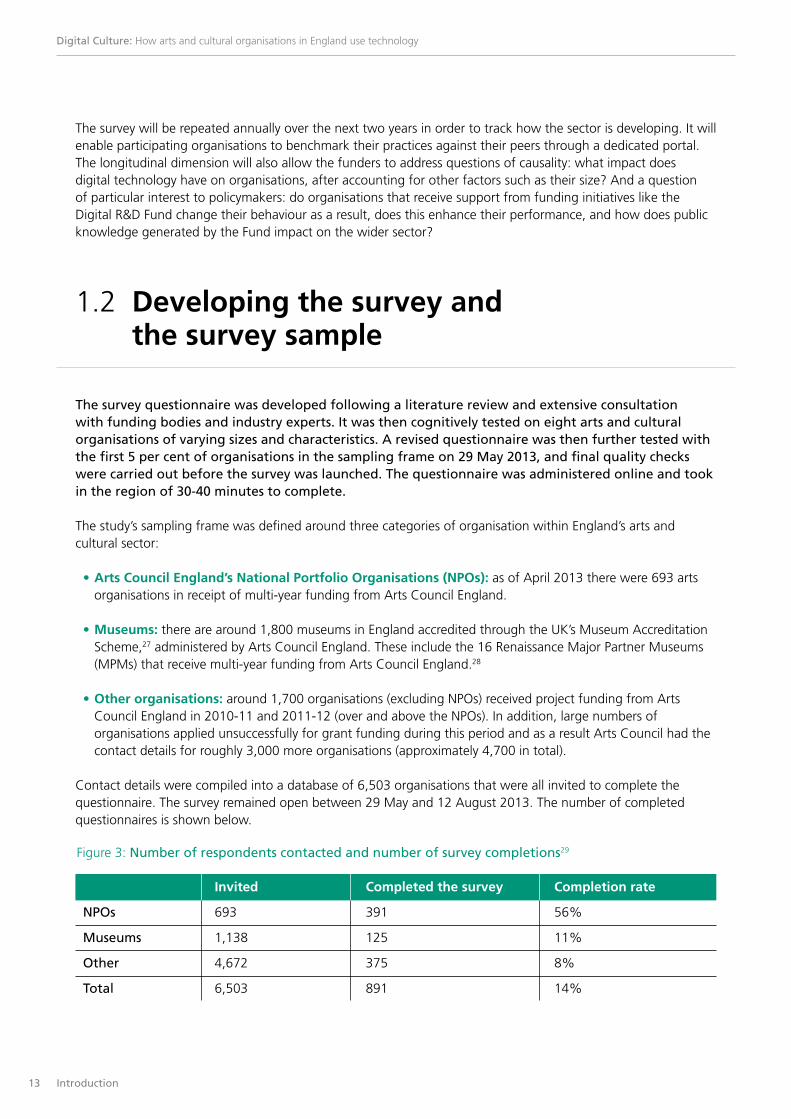
Contact details were compiled into a database of 6,503 organisations that were all invited to complete the questionnaire. The survey remained open between 29 May and 12 August 2013. The number of completed questionnaires is shown below.
1.2 Developing the survey and the survey sample
Invited Completed the survey Completion rate
NPOs 693 391 56%
Museums 1,138 125 11%
Other 4,672 375 8%
Total 6,503 891 14%
Figure 3: Number of respondents contacted and number of survey completions29

14 Introduction
Digital Culture: How arts and cultural organisations in England use technology
Completed the Breakdown of Weighted survey (number of respondents (representative) organisations) profile
NPOs 391 44% 10%
Museums 125 14% 19%
Other 375 42% 71%
Figure 4: Profile of organisations surveyed31
The sample included respondents from the visual arts, music, theatre, dance, literature, combined arts and heritage sectors. The largest represented groups were theatre (19 per cent) and combined arts (18 per cent).30 Responses also came from organisations of different sizes. The majority of respondents (53 per cent) reported earning revenues of less than £100,000 per year, however, the survey was also completed by many of the sector’s largest organisations, with 32 respondents representing organisations with annual revenues in excess of £5 million.
The Digital R&D Fund’s partners were especially interested in encouraging responses from NPOs as a group so they were over-sampled compared with other organisations. For the purposes of this report, the responses were weighted to ensure that the profile was representative of the organisations in the sample frame as a whole, as shown below:
Minor weighting adjustments were also made to ensure the survey respondent profile accurately reflected the sample profile in terms of art and/or cultural form (details in Appendix A: Project background and methodology).
Respondents were asked a range of questions to classify their organisation. Some of these have then been used in the analysis of the survey results. The most commonly used classifications are:
• Art and/or cultural form: visual arts, theatre, music, literature, dance, combined arts and heritage.
• Organisation type: museum, gallery, combined arts centre, performing arts venue, performing group and festival/events organiser.
• Revenues: based on the previous year’s reported income, the sample has been split into small (up to £100,000 per year), medium (£100,000–£499,999 per year) and large (over £500,000 per year) organisations.
1.3 Analysing the survey results
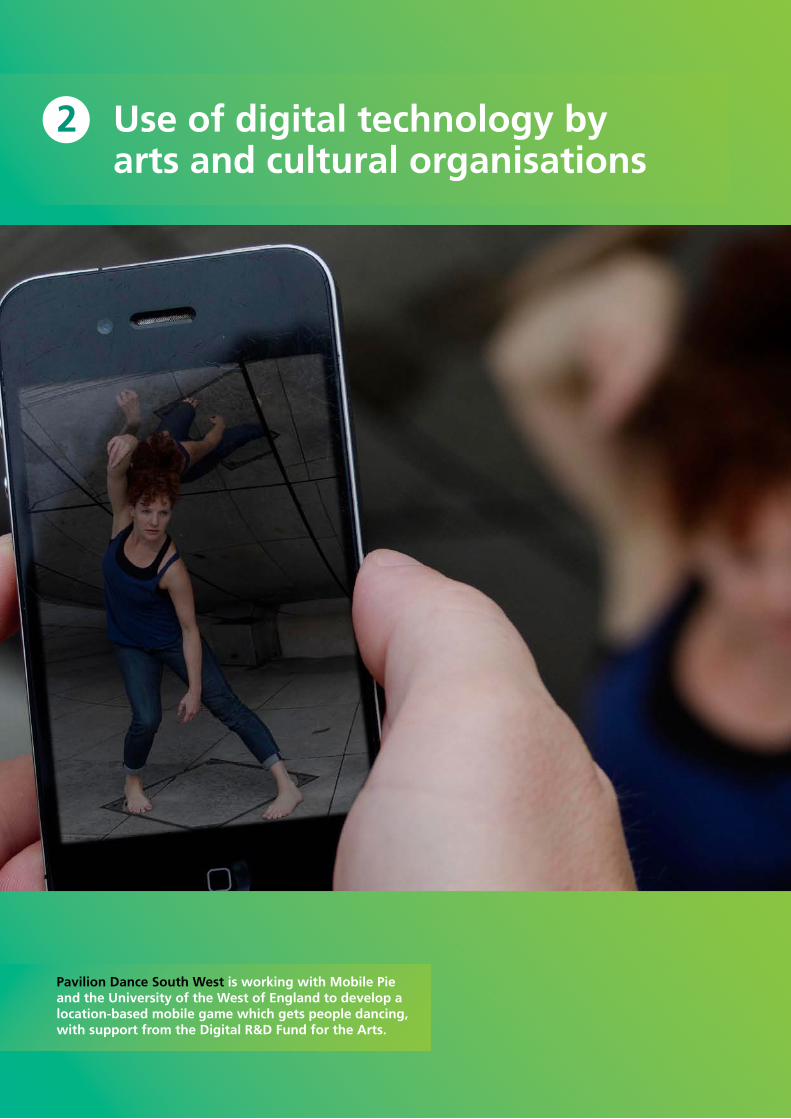
2 Use of digital technology by arts and cultural organisations
Pavilion Dance South West is working with Mobile Pie and the University of the West of England to develop a location-based mobile game which gets people dancing, with support from the Digital R&D Fund for the Arts.
16 Use of digital technology by arts and cultural organisations
Digital Culture: How arts and cultural organisations in England use technology
19%
73%
27%
57%
23%
56%
28%
36%
29%
32%18%
17%
Marketing Preservingand archiving
Operations Creation Distributionand exhibition
Revenuestreams
Important Essential
The questionnaire asked respondents about the importance of digital technology in their organisations, the different digital activities they are undertaking, and any impacts that their organisation had experienced as a result. In analysing those responses, this section explores five areas in turn:
• Creation: the use of digital technology in the creative, curatorial and/or production process.
• Preserving and archiving: the use of digital technology to create permanent records of objects and of events that may be transitory and time-limited.
• Distribution and exhibition of arts and cultural experiences through digital channels.
• Marketing and audience development: marketing arts and cultural experiences and building deeper relationships with audiences through digital channels.
• Business and operational models: both generating revenue streams through selling products and accepting donations digitally, and enabling organisations to operate more efficiently and effectively.
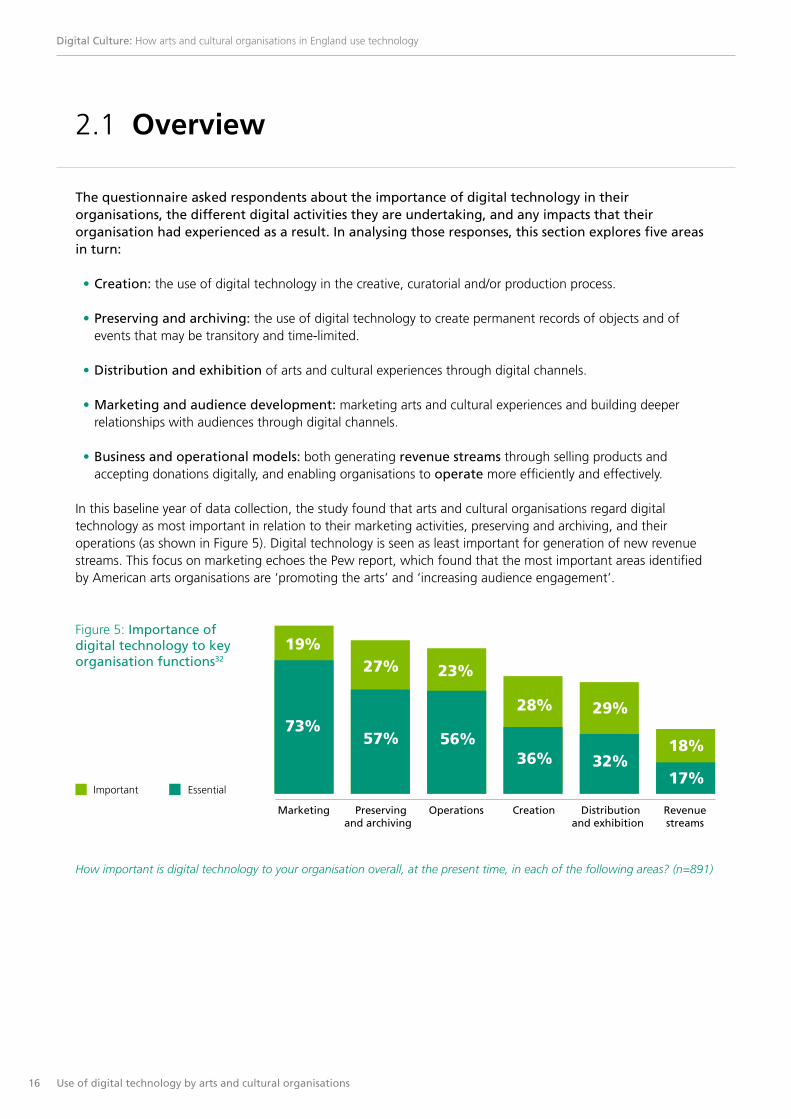
In this baseline year of data collection, the study found that arts and cultural organisations regard digital technology as most important in relation to their marketing activities, preserving and archiving, and their operations (as shown in Figure 5). Digital technology is seen as least important for generation of new revenue streams. This focus on marketing echoes the Pew report, which found that the most important areas identified by American arts organisations are ‘promoting the arts’ and ‘increasing audience engagement’.
Figure 5: Importance of digital technology to key organisation functions32
How important is digital technology to your organisation overall, at the present time, in each of the following areas? (n=891)
2.1 Overview

17 Use of digital technology by arts and cultural organisations
Digital Culture: How arts and cultural organisations in England use technology
2.2 Creation
Digital activity is forcing us to rethink our creative practice. For over a hundred years our activity has been grounded in collections displayed in buildings. The affordances of digital means we are rethinking this. The Tate Gallery33
A large number of arts and cultural organisations claim to use digital technology as part of their creative and cultural practice: 64 per cent say digital technology is now either important or essential to how they produce, create, alter or enhance the work they do.34
Digital technology may play a role in many different parts of the creative process, from planning through to production, post-production and publishing. This section focuses specifically on what can be called born digital works – that is, output that is “native to and created for the digital space”.35 Just under half (47 per cent) of organisations say that they have produced one or more forms of born digital output, and 54 per cent of these report that they have done so for the first time in the past year. This figure is higher than for almost all the other digital activities covered by the survey, suggesting that the change is occurring more rapidly here than in other areas of organisations’ work.36
Across art and cultural forms the picture varies, with fewer dance companies reporting born digital output (34 per cent). Though even here the rate of change is fast with 67 per cent of dance companies reporting producing born digital output having started doing so in the last year.37
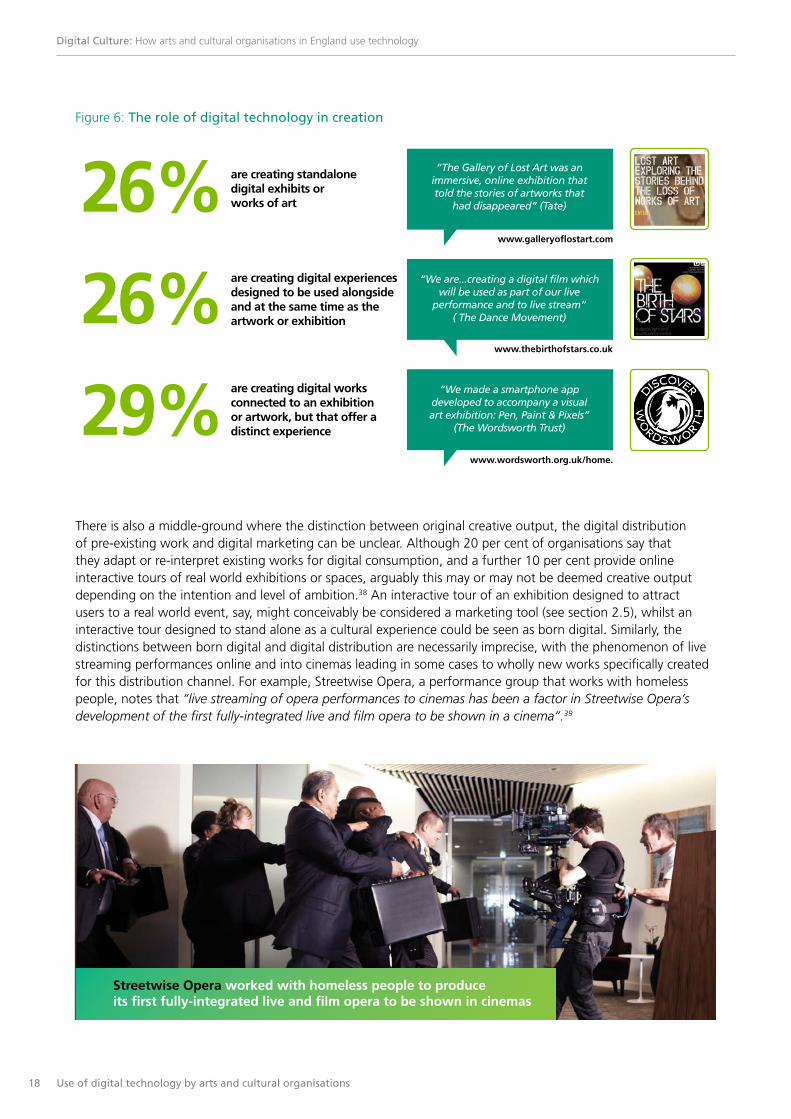
Figure 6 shows some examples of this activity, which at a high level can be grouped into three broad categories:
• Standalone digital exhibits or works of art.
• Digital experiences designed to be used alongside and at the same time as the artwork or exhibition.
• Digital works that are connected to an exhibition or artwork, but that offer a distinct experience rather than a recreation of the real-world equivalent.
Tate Modern produces new interactive digital projects Bloomberg Connects for gallery visitors
18 Use of digital technology by arts and cultural organisations
Digital Culture: How arts and cultural organisations in England use technology
26%are creating standalonedigital exhibits orworks of art
www.galleryoflostart.com
“The Gallery of Lost Art was animmersive, online exhibition thattold the stories of artworks that
had disappeared” (Tate)
26%are creating digital experiencesdesigned to be used alongsideand at the same time as theartwork or exhibition
www.thebirthofstars.co.uk
“We are...creating a digital film whichwill be used as part of our live
performance and to live stream”( The Dance Movement)
29%are creating digital worksconnected to an exhibitionor artwork, but that offer adistinct experience
www.wordsworth.org.uk/home.
“We made a smartphone appdeveloped to accompany a visualart exhibition: Pen, Paint & Pixels”
(The Wordsworth Trust)
There is also a middle-ground where the distinction between original creative output, the digital distribution of pre-existing work and digital marketing can be unclear. Although 20 per cent of organisations say that they adapt or re-interpret existing works for digital consumption, and a further 10 per cent provide online interactive tours of real world exhibitions or spaces, arguably this may or may not be deemed creative output depending on the intention and level of ambition.38 An interactive tour of an exhibition designed to attract users to a real world event, say, might conceivably be considered a marketing tool (see section 2.5), whilst an interactive tour designed to stand alone as a cultural experience could be seen as born digital. Similarly, the distinctions between born digital and digital distribution are necessarily imprecise, with the phenomenon of live streaming performances online and into cinemas leading in some cases to wholly new works specifically created for this distribution channel. For example, Streetwise Opera, a performance group that works with homeless people, notes that “live streaming of opera performances to cinemas has been a factor in Streetwise Opera’s development of the first fully-integrated live and film opera to be shown in a cinema”.39
Figure 6: The role of digital technology in creation
Streetwise Opera worked with homeless people to produce its first fully-integrated live and film opera to be shown in cinemas
19 Use of digital technology by arts and cultural organisations
Digital Culture: How arts and cultural organisations in England use technology
The use of digital technology in creative practice varies across the sector. Organisation size appears to be important, with the prevalence of this type of activity rising to 60 per cent amongst large organisations. However, 39 per cent of small organisations also report born digital work, creating digital-only experiences or providing links between the physical event and associated digital spaces. For instance, the Dales Countryside Museum (a museum in rural Yorkshire) created “a QR (Quick Response) code trail round the museum and our outdoor sculpture trail. Visitors can access material on site or from the codes on the sheets they can take away. We have created digi-stories and animations which are displayed within the galleries and online.”40
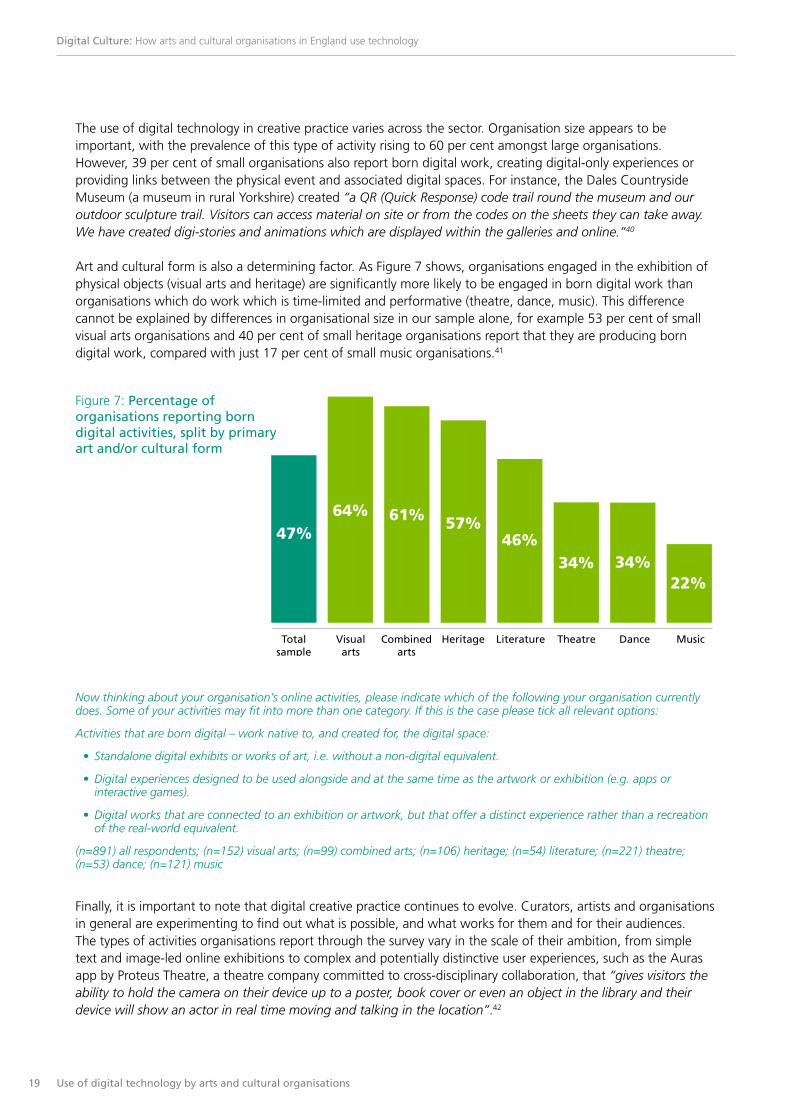
Art and cultural form is also a determining factor. As Figure 7 shows, organisations engaged in the exhibition of physical objects (visual arts and heritage) are significantly more likely to be engaged in born digital work than organisations which do work which is time-limited and performative (theatre, dance, music). This difference cannot be explained by differences in organisational size in our sample alone, for example 53 per cent of small visual arts organisations and 40 per cent of small heritage organisations report that they are producing born digital work, compared with just 17 per cent of small music organisations.41
47%64% 61% 57%
46%34% 34%
22%
Totalsample
Visualarts
Combinedarts
Heritage Literature Theatre Dance Music
Figure 7: Percentage of organisations reporting born digital activities, split by primary art and/or cultural form
Now thinking about your organisation’s online activities, please indicate which of the following your organisation currently does. Some of your activities may fit into more than one category. If this is the case please tick all relevant options:
Activities that are born digital – work native to, and created for, the digital space:
• Standalone digital exhibits or works of art, i.e. without a non-digital equivalent.
• Digital experiences designed to be used alongside and at the same time as the artwork or exhibition (e.g. apps or interactive games).
• Digital works that are connected to an exhibition or artwork, but that offer a distinct experience rather than a recreation of the real-world equivalent.
(n=891) all respondents; (n=152) visual arts; (n=99) combined arts; (n=106) heritage; (n=54) literature; (n=221) theatre; (n=53) dance; (n=121) music
Finally, it is important to note that digital creative practice continues to evolve. Curators, artists and organisations in general are experimenting to find out what is possible, and what works for them and for their audiences. The types of activities organisations report through the survey vary in the scale of their ambition, from simple text and image-led online exhibitions to complex and potentially distinctive user experiences, such as the Auras app by Proteus Theatre, a theatre company committed to cross-disciplinary collaboration, that “gives visitors the ability to hold the camera on their device up to a poster, book cover or even an object in the library and their device will show an actor in real time moving and talking in the location”.42

20 Use of digital technology by arts and cultural organisations
Digital Culture: How arts and cultural organisations in England use technology
2.3 Preserving and archiving
Digital allows us to record and make available a permanent record of a transitory and installation based event. Battle Arts, a multidisciplinary organisation dedicated to promoting the arts around Battle43
2.4 Distribution and exhibition
Digitising our collection and putting it online has had a huge lasting impact on the organisation. Wallace Collection, a London-based museum of fine and decorative arts47
The cost of preserving and archiving creative output has fallen dramatically over the last decade. With cheaper equipment, free editing software and pay-as-you-use cloud storage, arts and cultural organisations can now create records of time-limited events, faster and more economically than ever before.
Consistent with this, 84 per cent of organisations describe digital technologies as essential or important for preserving and archiving. There is little variation by size, with 58 per cent of small organisations regarding it as essential, compared with 53 per cent of large.44 There is some variation by art and cultural form, however, with 71 per cent of visual arts organisations feeling that digital technologies are essential in this area, compared with 47 per cent of heritage organisations.45
Almost half (44 per cent) of organisations say that digital technologies have had a ‘major impact’ on the way in which they archive their art and cultural outputs. This result does not vary significantly across different art and cultural forms and organisational size.46
Alongside helping organisations to preserve and archive their creative activities more extensively and cheaply, the growth in broadband internet, IP-connected devices and low-cost production technologies has created new opportunities to distribute and exhibit work.
Today, arts and cultural organisations can publish quickly, cheaply and at a high quality, through a wide variety of digital distribution channels and platforms, from the open internet through to physical venues such as cinemas. Figure 8 attempts to summarise this array of distribution channels, platforms and services, and gives examples of how they are used by respondents to our survey. Note that some distributors operate across multiple channels, for example Digital Theatre distributes online through its website as well as direct to TVs through a connected TV app.
Overall, around a third of all respondents say that digital distribution and exhibition is now ‘essential’ to their organisation, with a further 29 per cent regarding it as ‘important’.48 As shown in Figure 9, the survey asked about three different activities within digital distribution: simulcast/live streaming, making existing recordings/exhibits available digitally, and providing online interactive tours. Of these, by far the most common is making existing recordings or exhibits available through social media platforms or organisations’ own websites, with 60 per cent of organisations reporting this. The technology required is relatively cheap and accessible, and large numbers of both smaller (57 per cent) and larger organisations (71 per cent) are making recordings and exhibits available through platforms such as YouTube and iTunes.49

21 Use of digital technology by arts and cultural organisations
Digital Culture: How arts and cultural organisations in England use technology
Figure 8: Digital distribution channels, platforms and services
Live streaming to cinemas- e.g. Streetwise Opera producework especially for cinemastreaming
Cinema:
Digital in live exhibition andstreaming to outdoor venues- e.g. Royal Opera House bigscreen in Trafalgar Square
Othervenues:
Online platforms, e.g.:- The National GalleryYouTube channel- Imperial War Museumpodcast on iTunes
Generalistaggregators:
Distribution/exhibition on ownsite or bespoke mini-sites- e.g. Eclipse Theatre ‘10 by 10’,available on eclipsetheatre.org.uk
Ownbrandedwebsite:
Mainstream and specialist TV channels- e.g. Sheffield DocFest From theSea to the Land Beyond on BBC4
BroadcastTV channels:
ConnectedTV service:
Cinema
Othervenues:
Generalistaggregators
Ownbrandedwebsite
BroadcastTV channels
ConnectedTV service
Online artsservices:
Online artsservices
Generalists (e.g. LOVEFiLM) andspecialists (e.g. Digital Theatre)- e.g. Artprojx and Frantic Assemblyon Digital Theatre TV
Live TV
Online
National (The Space, Digital Theatre)and international (medici.tv)- e.g. Multistory photographicexhibition on The Space
22 Use of digital technology by arts and cultural organisations
Digital Culture: How arts and cultural organisations in England use technology
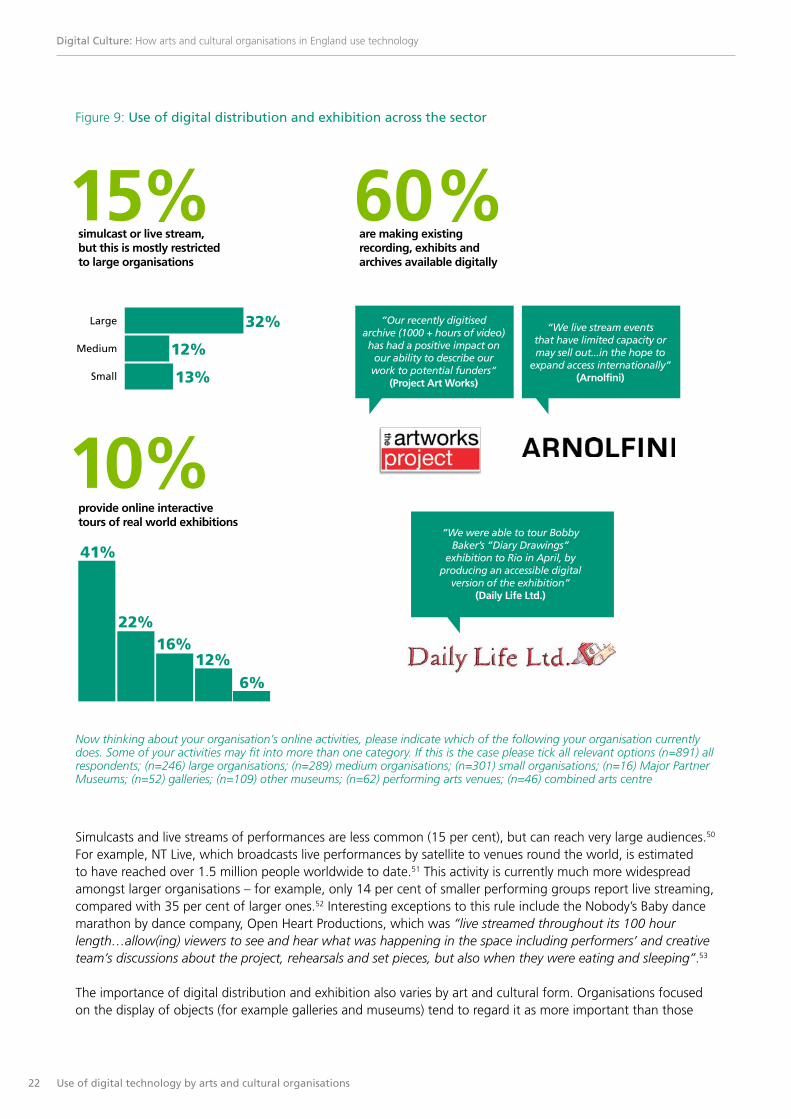
Figure 9: Use of digital distribution and exhibition across the sector
15%simulcast or live stream,but this is mostly restrictedto large organisations
“Our recently digitisedarchive (1000 + hours of video)has had a positive impact on
our ability to describe ourwork to potential funders”
(Project Art Works)
“We live stream eventsthat have limited capacity ormay sell out...in the hope to
expand access internationally”(Arnolfini)
“We were able to tour BobbyBaker’s ”Diary Drawings”
exhibition to Rio in April, byproducing an accessible digital
version of the exhibition”(Daily Life Ltd.)
60%are making existingrecording, exhibits andarchives available digitally
10%provide online interactivetours of real world exhibitions
Large 32%
12%Medium
13%Small
MPM
41%
22%
Galle
ry
16%
Other
muse
um
12%6%
Perfo
rmin
g arts
venue
Combin
ed a
rts ce
ntreNow thinking about your organisation’s online activities, please indicate which of the following your organisation currently does. Some of your activities may fit into more than one category. If this is the case please tick all relevant options (n=891) all respondents; (n=246) large organisations; (n=289) medium organisations; (n=301) small organisations; (n=16) Major Partner Museums; (n=52) galleries; (n=109) other museums; (n=62) performing arts venues; (n=46) combined arts centre
Simulcasts and live streams of performances are less common (15 per cent), but can reach very large audiences.50 For example, NT Live, which broadcasts live performances by satellite to venues round the world, is estimated to have reached over 1.5 million people worldwide to date.51 This activity is currently much more widespread amongst larger organisations – for example, only 14 per cent of smaller performing groups report live streaming, compared with 35 per cent of larger ones.52 Interesting exceptions to this rule include the Nobody’s Baby dance marathon by dance company, Open Heart Productions, which was “live streamed throughout its 100 hour length…allow(ing) viewers to see and hear what was happening in the space including performers’ and creative team’s discussions about the project, rehearsals and set pieces, but also when they were eating and sleeping”.53
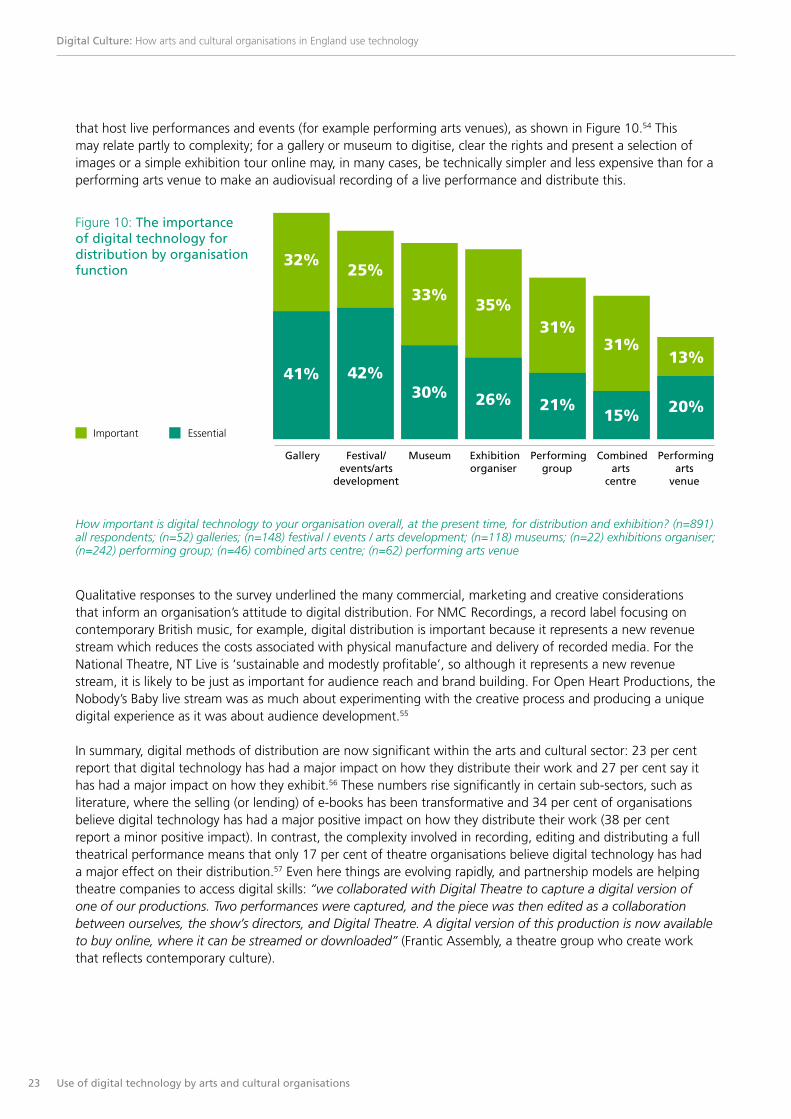
The importance of digital distribution and exhibition also varies by art and cultural form. Organisations focused on the display of objects (for example galleries and museums) tend to regard it as more important than those
23 Use of digital technology by arts and cultural organisations
Digital Culture: How arts and cultural organisations in England use technology
that host live performances and events (for example performing arts venues), as shown in Figure 10.54 This may relate partly to complexity; for a gallery or museum to digitise, clear the rights and present a selection of images or a simple exhibition tour online may, in many cases, be technically simpler and less expensive than for a performing arts venue to make an audiovisual recording of a live performance and distribute this.
32%25%
33%35%
31%31%
13%
Gallery Festival/events/arts
development
Museum Exhibitionorganiser
Performinggroup
Combinedarts
centre
Performingarts
venue
Important Essential
41% 42%30% 26% 21%
15% 20%
Figure 10: The importance of digital technology for distribution by organisation function
How important is digital technology to your organisation overall, at the present time, for distribution and exhibition? (n=891) all respondents; (n=52) galleries; (n=148) festival / events / arts development; (n=118) museums; (n=22) exhibitions organiser; (n=242) performing group; (n=46) combined arts centre; (n=62) performing arts venue
Qualitative responses to the survey underlined the many commercial, marketing and creative considerations that inform an organisation’s attitude to digital distribution. For NMC Recordings, a record label focusing on contemporary British music, for example, digital distribution is important because it represents a new revenue stream which reduces the costs associated with physical manufacture and delivery of recorded media. For the National Theatre, NT Live is ‘sustainable and modestly profitable’, so although it represents a new revenue stream, it is likely to be just as important for audience reach and brand building. For Open Heart Productions, the Nobody’s Baby live stream was as much about experimenting with the creative process and producing a unique digital experience as it was about audience development.55
In summary, digital methods of distribution are now significant within the arts and cultural sector: 23 per cent report that digital technology has had a major impact on how they distribute their work and 27 per cent say it has had a major impact on how they exhibit.56 These numbers rise significantly in certain sub-sectors, such as literature, where the selling (or lending) of e-books has been transformative and 34 per cent of organisations believe digital technology has had a major positive impact on how they distribute their work (38 per cent report a minor positive impact). In contrast, the complexity involved in recording, editing and distributing a full theatrical performance means that only 17 per cent of theatre organisations believe digital technology has had a major effect on their distribution.57 Even here things are evolving rapidly, and partnership models are helping theatre companies to access digital skills: “we collaborated with Digital Theatre to capture a digital version of one of our productions. Two performances were captured, and the piece was then edited as a collaboration between ourselves, the show’s directors, and Digital Theatre. A digital version of this production is now available to buy online, where it can be streamed or downloaded” (Frantic Assembly, a theatre group who create work that reflects contemporary culture).

24 Use of digital technology by arts and cultural organisations
Digital Culture: How arts and cultural organisations in England use technology
2.5 Marketing and audience development
Using digital technologies for marketing, particularly social media, has allowed us to reach a wider audience and sell more tickets to our performance event. Restoke, a performance company from Staffordshire58
Marketing and audience development is the area in which the impact of digital technologies has been most widely felt. Over 90 per cent of respondents regard it as essential or important to their activities in this area. This figure is relatively consistent across art and cultural forms, organisation types and sizes, and is easily the highest amongst the six areas set out in Figure 5. Most organisations now prioritise digital channels in allocating marketing resources: 52 per cent of arts and cultural organisations report allocating over half of their available marketing resources to digital channels, and this figure rises to 56 per cent for smaller organisations.59
Digital marketing activities are also very common: 92 per cent of organisations have their own branded website and they are present on an average of four social media platforms, with Facebook and Twitter being the most common, as shown in Figure 11.
Many engage in a broad array of direct marketing activities across these and other channels. For example,
• 81 per cent use email marketing newsletters, and 38 per cent tailor communications based on audience data.
• 84 per cent publish content on social platforms such as Facebook and YouTube, whilst 77 per cent do the same on their own website.
• 44 per cent use Search Engine Optimisation, and 14 per cent use paid search or paid display advertising.60

25 Use of digital technology by arts and cultural organisations
Digital Culture: How arts and cultural organisations in England use technology
Facebook 90%
79%Twitter
53%Youtube
30%Vimeo
27%Flickr
27%Wordpress
16%Pinterest
15%Soundcloud
12%Instagram
10%Tumblr
12%Google+
32%Linkedln
11%have more than10,000 followersacross Facebookand Twitter*
*Data has been calculated by addingFacebook fans to Twitter followers
10,000
Figure 11: Use of social media platforms
On which, if any, of the following social networks/websites does your organisation currently have a regularly active profile? (n=891) all respondents
How many fans/friends does your organisation have on its Facebook profile(s) at present? (n=818) all respondents to this question
How many followers does your organisation have on its Twitter account(s) at present? (n=758) all respondents to this question
Many organisations produce a rich mix of material designed to engage audiences. Overall, 47 per cent say they are making audiovisual content available, such as behind-the-scenes interviews with artists, curators and other key figures. Furthermore, 43 per cent maintain a blog with commentary and critical reflection, whilst 38 per cent provide educational content or online events for schools and other audiences.61
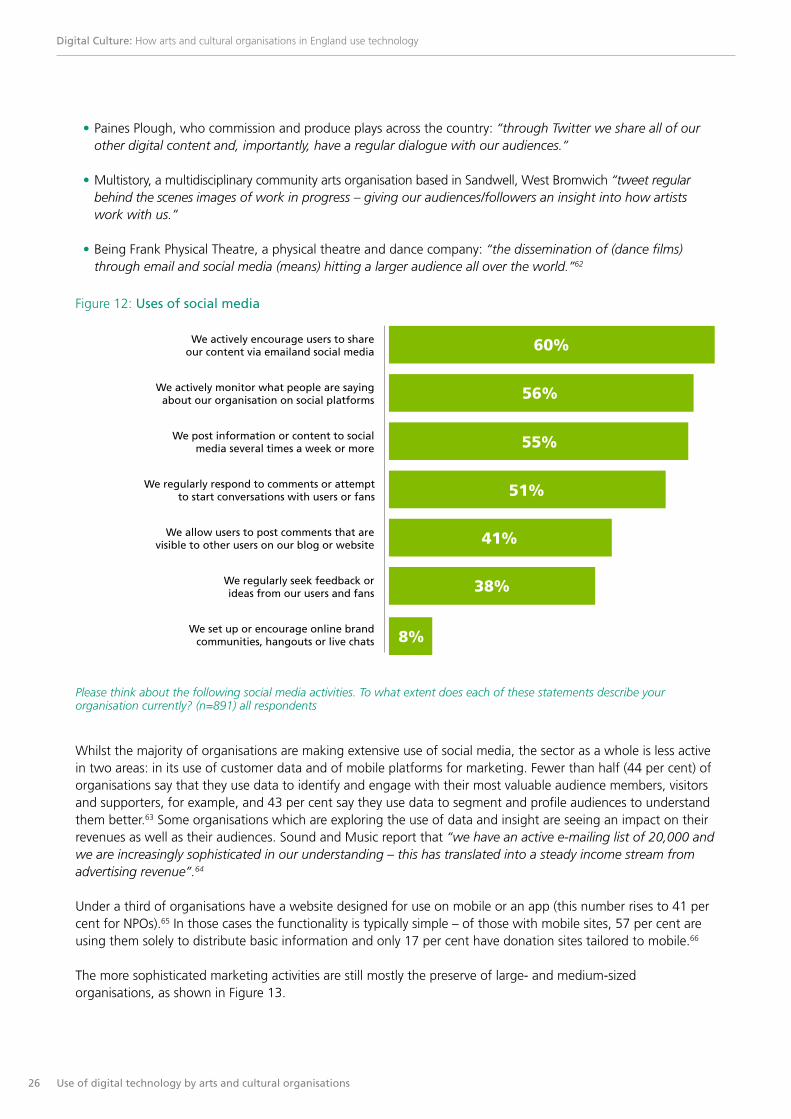
Social media is particularly important for broadening and deepening audience engagement. As shown in Figure 12, 60 per cent of organisations encourage users to share their content and 51 per cent of organisations report using social media to respond regularly to comments and start conversations with users:
Being Frank Physical Theatre disseminates dance films to international audiences through social media
26 Use of digital technology by arts and cultural organisations
Digital Culture: How arts and cultural organisations in England use technology
• Paines Plough, who commission and produce plays across the country: “through Twitter we share all of our other digital content and, importantly, have a regular dialogue with our audiences.”
• Multistory, a multidisciplinary community arts organisation based in Sandwell, West Bromwich “tweet regular behind the scenes images of work in progress – giving our audiences/followers an insight into how artists work with us.”
• Being Frank Physical Theatre, a physical theatre and dance company: “the dissemination of (dance films) through email and social media (means) hitting a larger audience all over the world.”62
We actively encourage users to shareour content via emailand social media
We set up or encourage online brandcommunities, hangouts or live chats
We regularly seek feedback orideas from our users and fans
We allow users to post comments that arevisible to other users on our blog or website
We regularly respond to comments or attemptto start conversations with users or fans
We post information or content to socialmedia several times a week or more
We actively monitor what people are sayingabout our organisation on social platforms
60%
56%
55%
51%
41%
38%
8%
Figure 12: Uses of social media
Please think about the following social media activities. To what extent does each of these statements describe your organisation currently? (n=891) all respondents
Whilst the majority of organisations are making extensive use of social media, the sector as a whole is less active in two areas: in its use of customer data and of mobile platforms for marketing. Fewer than half (44 per cent) of organisations say that they use data to identify and engage with their most valuable audience members, visitors and supporters, for example, and 43 per cent say they use data to segment and profile audiences to understand them better.63 Some organisations which are exploring the use of data and insight are seeing an impact on their revenues as well as their audiences. Sound and Music report that “we have an active e-mailing list of 20,000 and we are increasingly sophisticated in our understanding – this has translated into a steady income stream from advertising revenue”.64
Under a third of organisations have a website designed for use on mobile or an app (this number rises to 41 per cent for NPOs).65 In those cases the functionality is typically simple – of those with mobile sites, 57 per cent are using them solely to distribute basic information and only 17 per cent have donation sites tailored to mobile.66
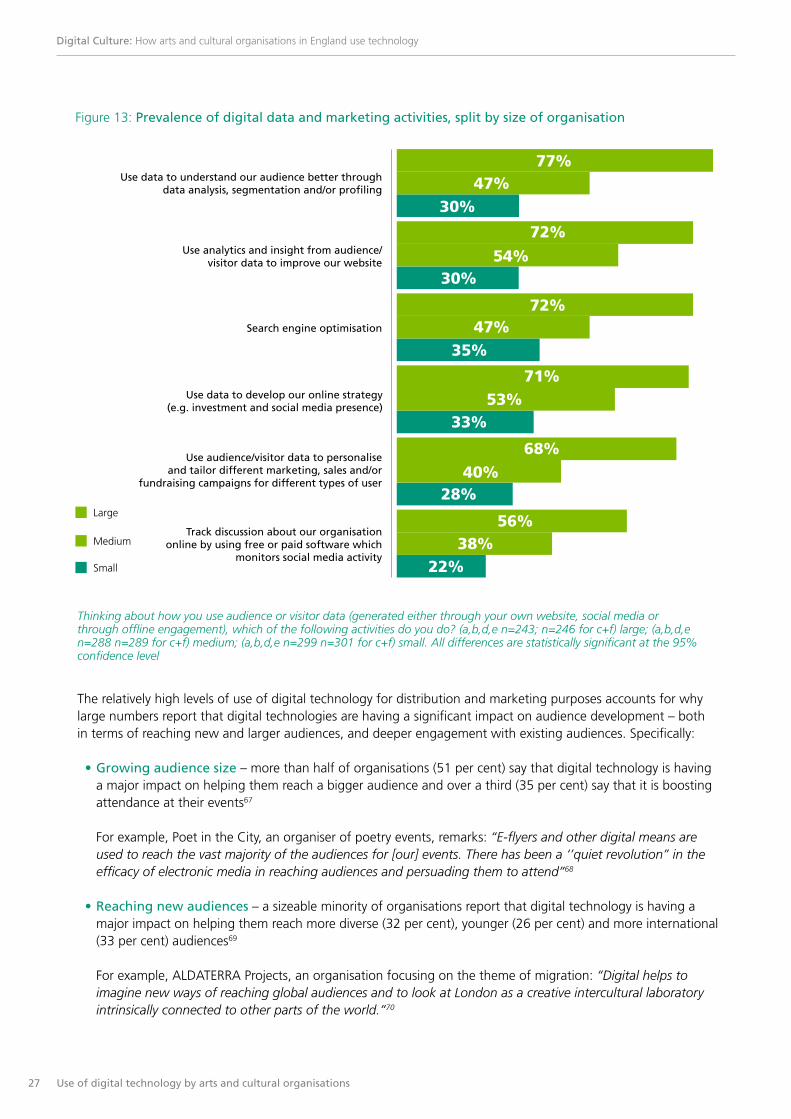
The more sophisticated marketing activities are still mostly the preserve of large- and medium-sized organisations, as shown in Figure 13.
27 Use of digital technology by arts and cultural organisations
Digital Culture: How arts and cultural organisations in England use technology
Use data to understand our audience better throughdata analysis, segmentation and/or profiling
Track discussion about our organisationonline by using free or paid software which
monitors social media activity
Use audience/visitor data to personaliseand tailor different marketing, sales and/or
fundraising campaigns for different types of user
Use data to develop our online strategy(e.g. investment and social media presence)
Search engine optimisation
Use analytics and insight from audience/visitor data to improve our website
77%47%
30% 72%
54%
72%
72%
30%
35%
71%53%
33%
40%28%
68%
Large
Medium
Small
47%
56%38%
22%
Figure 13: Prevalence of digital data and marketing activities, split by size of organisation
Thinking about how you use audience or visitor data (generated either through your own website, social media or through offline engagement), which of the following activities do you do? (a,b,d,e n=243; n=246 for c+f) large; (a,b,d,e n=288 n=289 for c+f) medium; (a,b,d,e n=299 n=301 for c+f) small. All differences are statistically significant at the 95% confidence level
The relatively high levels of use of digital technology for distribution and marketing purposes accounts for why large numbers report that digital technologies are having a significant impact on audience development – both in terms of reaching new and larger audiences, and deeper engagement with existing audiences. Specifically:
• Growing audience size – more than half of organisations (51 per cent) say that digital technology is having a major impact on helping them reach a bigger audience and over a third (35 per cent) say that it is boosting attendance at their events67
For example, Poet in the City, an organiser of poetry events, remarks: “E-flyers and other digital means are used to reach the vast majority of the audiences for [our] events. There has been a ‘’quiet revolution’’ in the efficacy of electronic media in reaching audiences and persuading them to attend”68
• Reaching new audiences – a sizeable minority of organisations report that digital technology is having a major impact on helping them reach more diverse (32 per cent), younger (26 per cent) and more international (33 per cent) audiences69
For example, ALDATERRA Projects, an organisation focusing on the theme of migration: “Digital helps to imagine new ways of reaching global audiences and to look at London as a creative intercultural laboratory intrinsically connected to other parts of the world.”70
28 Use of digital technology by arts and cultural organisations
Digital Culture: How arts and cultural organisations in England use technology
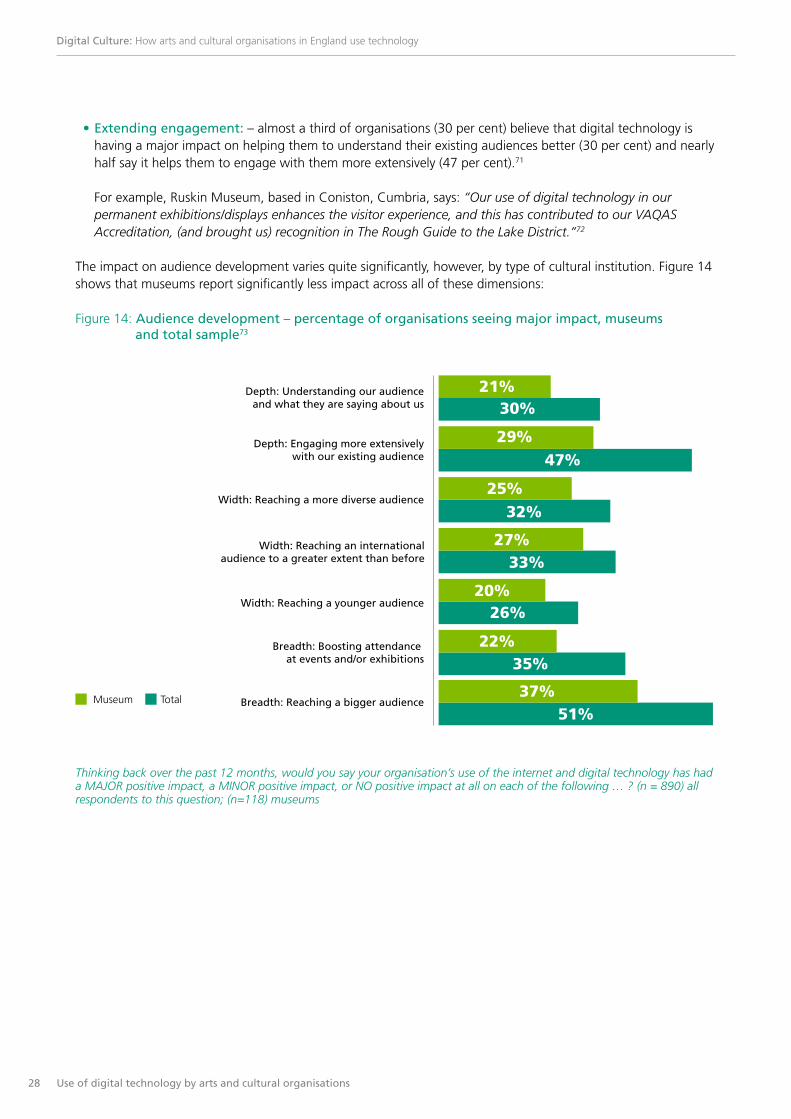
Depth: Understanding our audienceand what they are saying about us
Breadth: Reaching a bigger audience
Breadth: Boosting attendance at events and/or exhibitions
Width: Reaching a younger audience
Width: Reaching an internationalaudience to a greater extent than before
Width: Reaching a more diverse audience
Depth: Engaging more extensivelywith our existing audience
21%
29%
25%32%
27%
20%26%
33%
47%
30%
30%
29%
51%
41%
22%
37%
35%
51%Museum Total
Thinking back over the past 12 months, would you say your organisation’s use of the internet and digital technology has had a MAJOR positive impact, a MINOR positive impact, or NO positive impact at all on each of the following … ? (n = 890) all respondents to this question; (n=118) museums
• Extending engagement: – almost a third of organisations (30 per cent) believe that digital technology is having a major impact on helping them to understand their existing audiences better (30 per cent) and nearly half say it helps them to engage with them more extensively (47 per cent).71
For example, Ruskin Museum, based in Coniston, Cumbria, says: “Our use of digital technology in our permanent exhibitions/displays enhances the visitor experience, and this has contributed to our VAQAS Accreditation, (and brought us) recognition in The Rough Guide to the Lake District.”72
The impact on audience development varies quite significantly, however, by type of cultural institution. Figure 14 shows that museums report significantly less impact across all of these dimensions:
Figure 14: Audience development – percentage of organisations seeing major impact, museums and total sample73

29 Use of digital technology by arts and cultural organisations
Digital Culture: How arts and cultural organisations in England use technology
2.6 Business and operational models
Digital downloads play an important role in our revenue and reaching worldwide consumers. In 2012-13 digital sales were up 26 per cent and accounted for 24 per cent of our total revenue. NMC Recordings, a record label focused on new British music74
The survey asked arts and cultural organisations to report the different ways in which digital technology has impacted on their business models, either through the use of digital technologies to improve the way they run their organisations or through the generation of new revenue streams.
2.6.1 Operations
The majority of arts and cultural organisations describe digital technologies as being important for their operations: 56 per cent report that digital technology is essential in this area, with a further 23 per cent describing it as important.75 The proportion regarding digital technologies as essential to their operations rises to 70 per cent for galleries.76
South Asian Arts UK provides digital sitar lessons to children in Hull

30 Use of digital technology by arts and cultural organisations
Digital Culture: How arts and cultural organisations in England use technology
While organisations highlight a number of different ways in which digital technologies help them to manage their costs and operate more efficiently, the most common examples cited fall into three broad areas:
• Automating processes, such as online ticket sales. 45 per cent of all organisations sell tickets online (a third of these introduced this facility in the last year), rising to 95 per cent of performing arts venues and 65 per cent of music organisations. In addition, automated systems for venue and collections management are mentioned frequently, for example Inner City Music (a charity supporting music production and performance in inner city areas) states that “(our) internal venue management system… significantly improves (our) efficiency.” 77
• Replacing paid with low-cost/free: organisations are able to cut costs by using low-cost or free-to-use digital tools, for example mail-out costs for direct marketing can be replaced by email newsletters, and fees for recruitment and job listings can be cut through the use of online recruitment sites.
• Reducing overheads: 39 per cent of organisations report that they use cloud computing to run software or store or host data, and 44 per cent of these started doing so in the last year. South Asian Arts-UK, an Indian music and dance organiser, notes that “our cloud-based data management system... has had a tremendous effect on the accuracy and quality of our statistics and efficiency of our office management”. Some organisations manage without a physical presence altogether, with 3 per cent of organisations describing themselves as totally virtual.78
The impact of digital technology on organisations’ operations appears to be broadly consistent across different art and cultural forms, with 31 per cent of organisations reporting a major impact. Museums are again the exception, with just 18 per cent reporting a major impact on operations compared with 39 per cent for galleries.79
2.6.2 Revenues
Generating new revenue streams is regarded as the least important of the six areas studied, with 17 per cent of organisations reporting that the use of digital technologies is essential to this and a further 18 per cent describing it as important (Figure 5).80 Organisations that say that digital technologies are essential in this area claim to be experiencing a range of impacts: they are significantly more likely than other organisations to report a ‘major impact’ on their fundraising, revenues, profitability, and product and ticket sales.81
The survey considered three main types of direct digital revenue-generating activities by arts and cultural organisations:
• Development of new digital products and services, ranging from paid-for mobile apps, e-books, music and games to live streamed or on-demand content sold directly to consumers or syndicated to third parties.
• Sale of products and merchandise, using online channels to increase physical product and merchandise sales.
• Fundraising, accepting donations through online and mobile channels, and raising funding through online campaigns, tools and services, such as Kickstarter, a crowdfunding tool.
31 Use of digital technology by arts and cultural organisations
Digital Culture: How arts and cultural organisations in England use technology
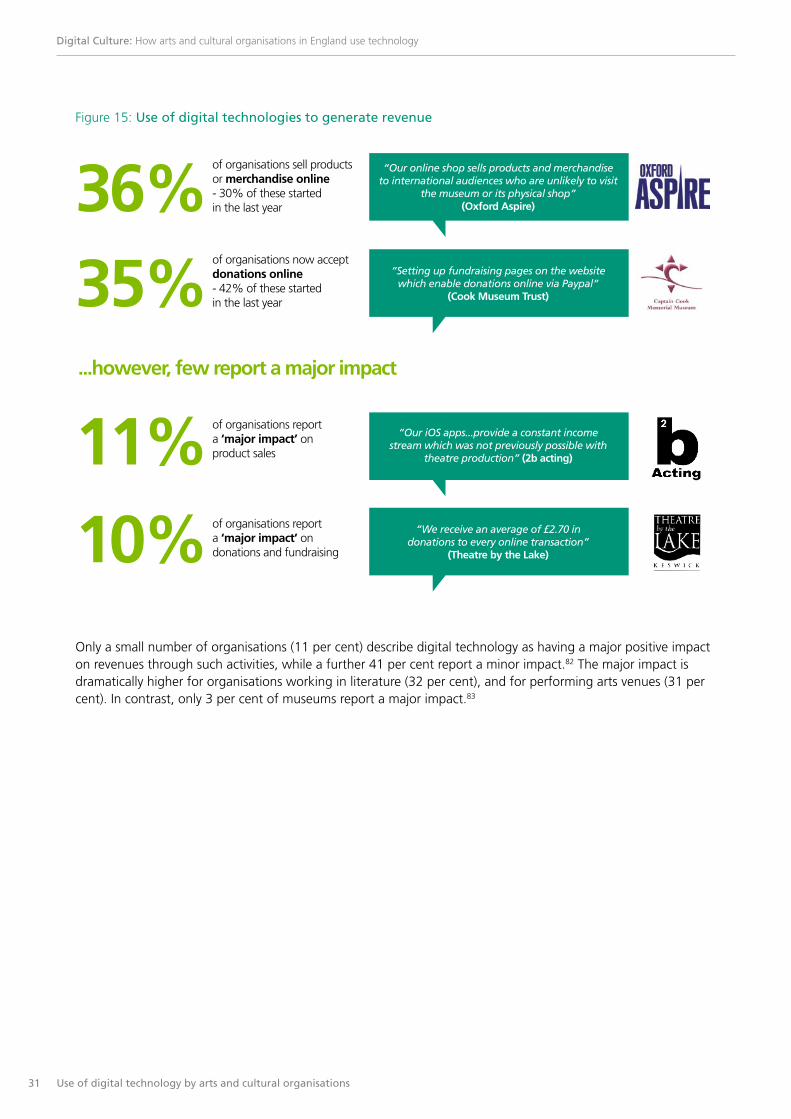
“Our online shop sells products and merchandiseto international audiences who are unlikely to visit
the museum or its physical shop”(Oxford Aspire)
“Setting up fundraising pages on the websitewhich enable donations online via Paypal”
(Cook Museum Trust)
“Our iOS apps...provide a constant incomestream which was not previously possible with
theatre production” (2b acting)
“We receive an average of £2.70 indonations to every online transaction”
(Theatre by the Lake)
36%of organisations sell productsor merchandise online- 30% of these startedin the last year
...however, few report a major impact
35%of organisations now acceptdonations online- 42% of these startedin the last year
11% of organisations reporta ‘major impact’ onproduct sales
10% of organisations reporta ‘major impact’ ondonations and fundraising
Figure 15: Use of digital technologies to generate revenue
Only a small number of organisations (11 per cent) describe digital technology as having a major positive impact on revenues through such activities, while a further 41 per cent report a minor impact.82 The major impact is dramatically higher for organisations working in literature (32 per cent), and for performing arts venues (31 per cent). In contrast, only 3 per cent of museums report a major impact.83

32 Use of digital technology by arts and cultural organisations
Digital Culture: How arts and cultural organisations in England use technology
Figure 16: Percentage of organisations reporting a ‘major positive impact’ from digital technologies on their revenues, split by organisation type
31%
24%
12% 10%7%
3%
32%
14% 12% 11%9%
6% 5%
Tota
l sam
ple
Perfo
rmin
g arts
venue
Combin
ed a
rts ce
ntre
Festi
val/e
vents/
arts
dev
elopm
ent
Galle
ry
Perfo
rmin
g gro
up
Muse
um
Liter
ature
Music
Combin
ed A
rts
Thea
tre
Visual
arts
Dance
Herita
ge
11%Organisation type
Art and cultural form
Thinking back over the past 12 months, would you say your organisation’s use of the internet and digital technology has had a MAJOR positive impact, a MINOR positive impact, or NO positive impact at all on your organisation’s overall revenues? (n = 891) all respondents; (n=62) performing arts venue; (n=46) combined arts centre; (n=148) festival / events / arts development; (n=52) galleries; (n=242) performing group; (n=118) museums; (n=152) visual arts; (n=221) theatre; (n=121) music; (n=54) literature; (n=53) dance; (n=99) combined arts; (n=106) heritage
There is a modest net effect of all these impacts of digital technology on operating costs and revenues for the majority of organisations, with 11 per cent reporting that it has had a major positive impact on their profitability, and 35 per cent claiming a minor impact. Over a quarter (28 per cent) say it has had no positive impact at all.84
33 Use of digital technology by arts and cultural organisations
Digital Culture: How arts and cultural organisations in England use technology
2.7 Overall impact of digital technology
Not so long ago, it would have been easy for us to identify exactly where and how digital technologies directly impact. Now it is simply “integrated wholesale’’ into how we plan for, deliver, promote and evaluate all of our activity. The Big Difference Company, a Leicester-based comedy and performance group85
When asked about the overall effect of digital technologies, organisations were overwhelmingly positive about the impact on their organisation and the wider sector:
• 79 per cent agree that the internet and digital technologies have played a major role in broadening the boundaries of what is considered art and culture.
• 75 per cent disagree that the use of the internet and digital technologies is hurting arts and cultural organisations by decreasing attendance in person.
• 92 per cent agree that digital technologies will be fundamentally important to helping their organisation achieve its mission in the future.86
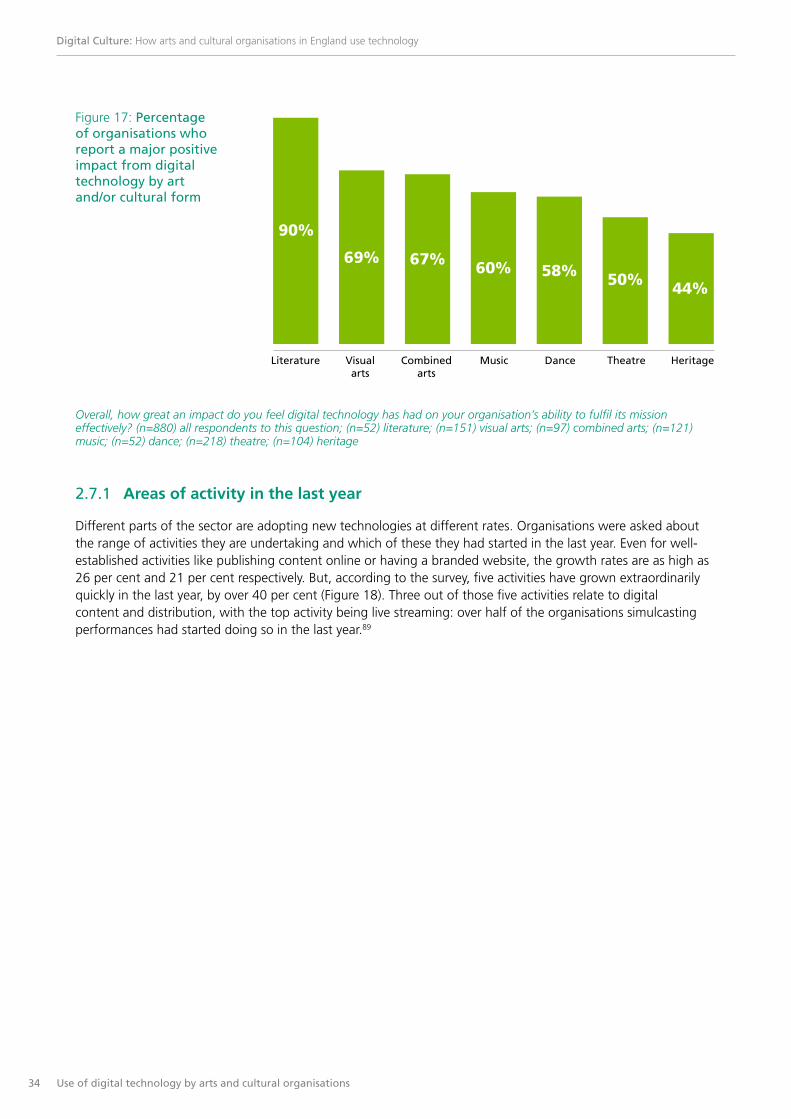
Furthermore, 60 per cent of organisations report that digital technologies are already having a major positive impact on their ability to fulfil their mission effectively. As Figure 17 shows, however, this varies significantly by art and/or cultural form, and as with other areas of the survey, heritage organisations (including museums) report lower levels of impact (44 per cent report a major positive impact compared with 90 per cent for literary organisations).87 The one notable exception relates to improving access, where 31 per cent of heritage organisations report a major positive impact, compared with an average of 23 per cent for arts and cultural organisations as a whole.88
34 Use of digital technology by arts and cultural organisations
Digital Culture: How arts and cultural organisations in England use technology
90%
69% 67% 60% 58% 50% 44%
Visualarts
Combinedarts
Heritage Literature Theatre Dance Music
Figure 17: Percentage of organisations who report a major positive impact from digital technology by art and/or cultural form
Overall, how great an impact do you feel digital technology has had on your organisation’s ability to fulfil its mission effectively? (n=880) all respondents to this question; (n=52) literature; (n=151) visual arts; (n=97) combined arts; (n=121) music; (n=52) dance; (n=218) theatre; (n=104) heritage
2.7.1 Areas of activity in the last year
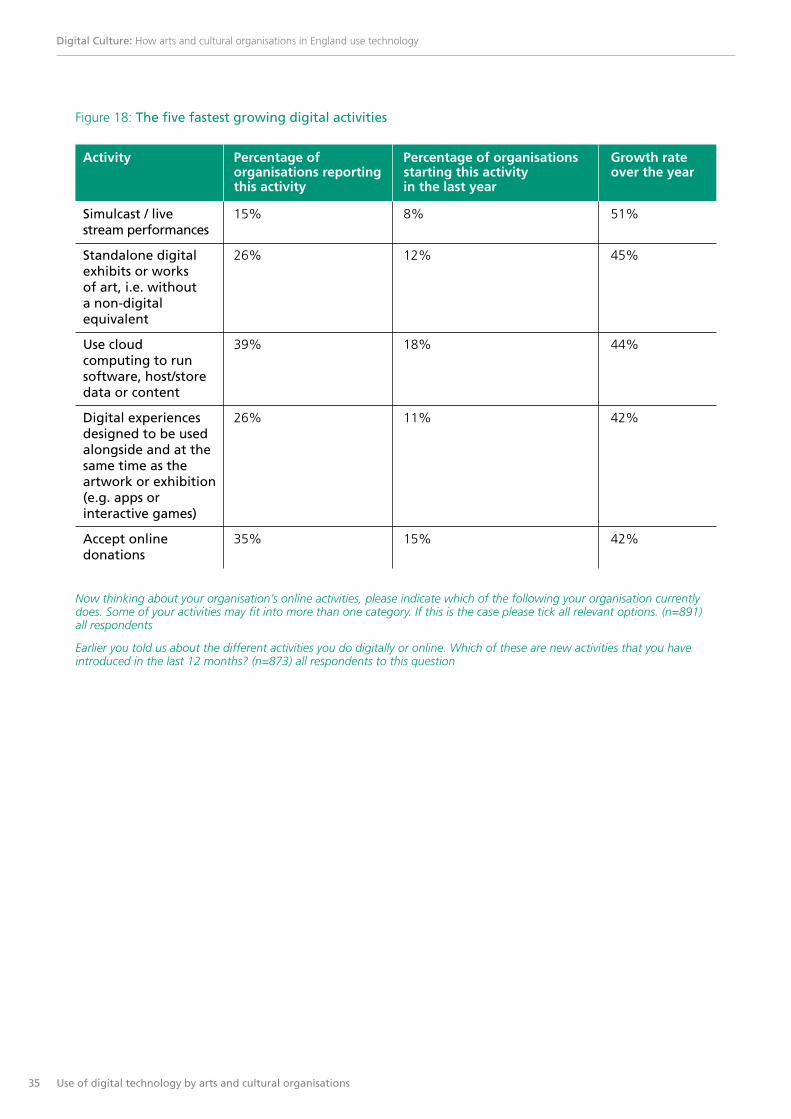
Different parts of the sector are adopting new technologies at different rates. Organisations were asked about the range of activities they are undertaking and which of these they had started in the last year. Even for well-established activities like publishing content online or having a branded website, the growth rates are as high as 26 per cent and 21 per cent respectively. But, according to the survey, five activities have grown extraordinarily quickly in the last year, by over 40 per cent (Figure 18). Three out of those five activities relate to digital content and distribution, with the top activity being live streaming: over half of the organisations simulcasting performances had started doing so in the last year.89
35 Use of digital technology by arts and cultural organisations
Digital Culture: How arts and cultural organisations in England use technology
Activity Percentage of Percentage of organisations Growth rate organisations reporting starting this activity over the year this activity in the last year
Simulcast / live 15% 8% 51% stream performances
Standalone digital 26% 12% 45% exhibits or works of art, i.e. without a non-digital equivalent
Use cloud 39% 18% 44% computing to run software, host/store data or content
Digital experiences 26% 11% 42% designed to be used alongside and at the same time as the artwork or exhibition (e.g. apps or interactive games)
Accept online 35% 15% 42% donations
Now thinking about your organisation’s online activities, please indicate which of the following your organisation currently does. Some of your activities may fit into more than one category. If this is the case please tick all relevant options. (n=891) all respondents
Earlier you told us about the different activities you do digitally or online. Which of these are new activities that you have introduced in the last 12 months? (n=873) all respondents to this question
Figure 18: The five fastest growing digital activities
3 Barriers and enablers for digital technology
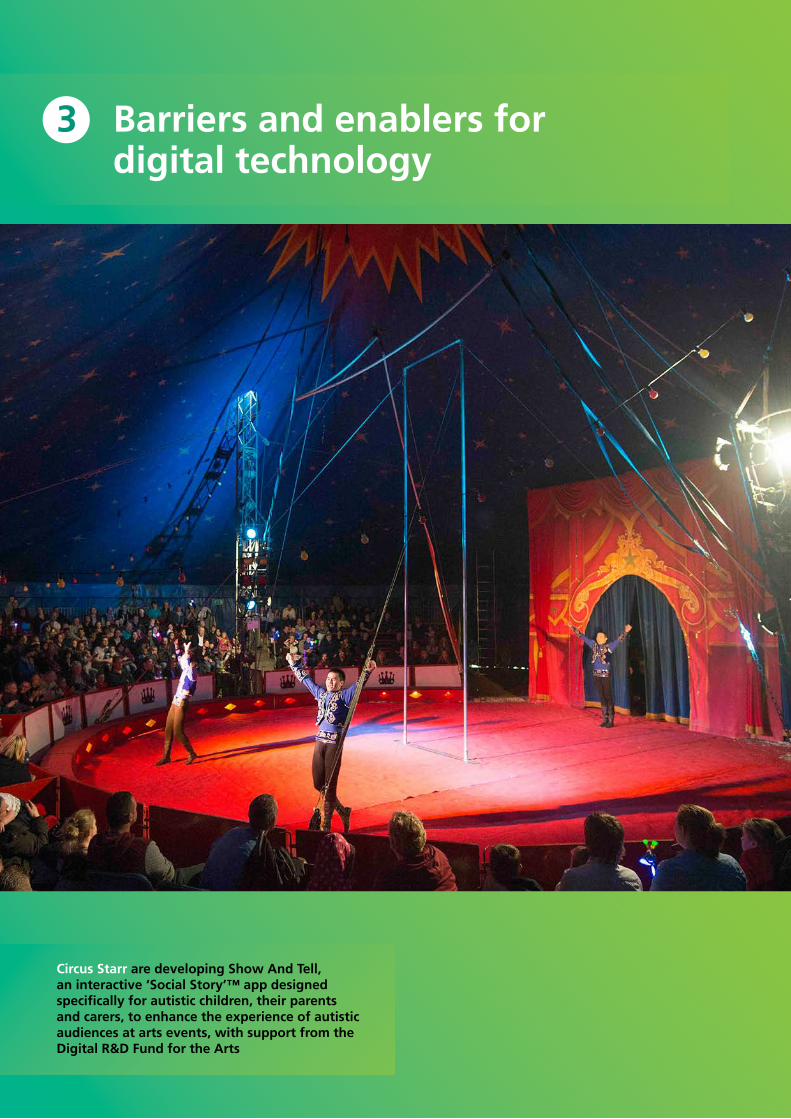
Circus Starr are developing Show And Tell, an interactive ‘Social Story’™ app designed specifically for autistic children, their parents and carers, to enhance the experience of autistic audiences at arts events, with support from the Digital R&D Fund for the Arts
37 Barriers and enablers for digital technology
Digital Culture: How arts and cultural organisations in England use technology
Lack of funding to allocate to digital projects
Lack of in-house staff time
Difficulty in accessing external funding
Lack of in-house skills / knowledge
Lack of expert advice
Slow / limited IT systems or networks
No senior manager with a digital remit
Lack of in-house confidence
Lack of control over our IT systems / infrastructure
Lack of understanding of what digital can do
Lack of strategy / planning
Lack of suitable external suppliers / freelance staff
Digital not valued in the organisation
68%
68%
61%
37%
34%
33%
31%
27%
26%
23%
23%
22%
9%
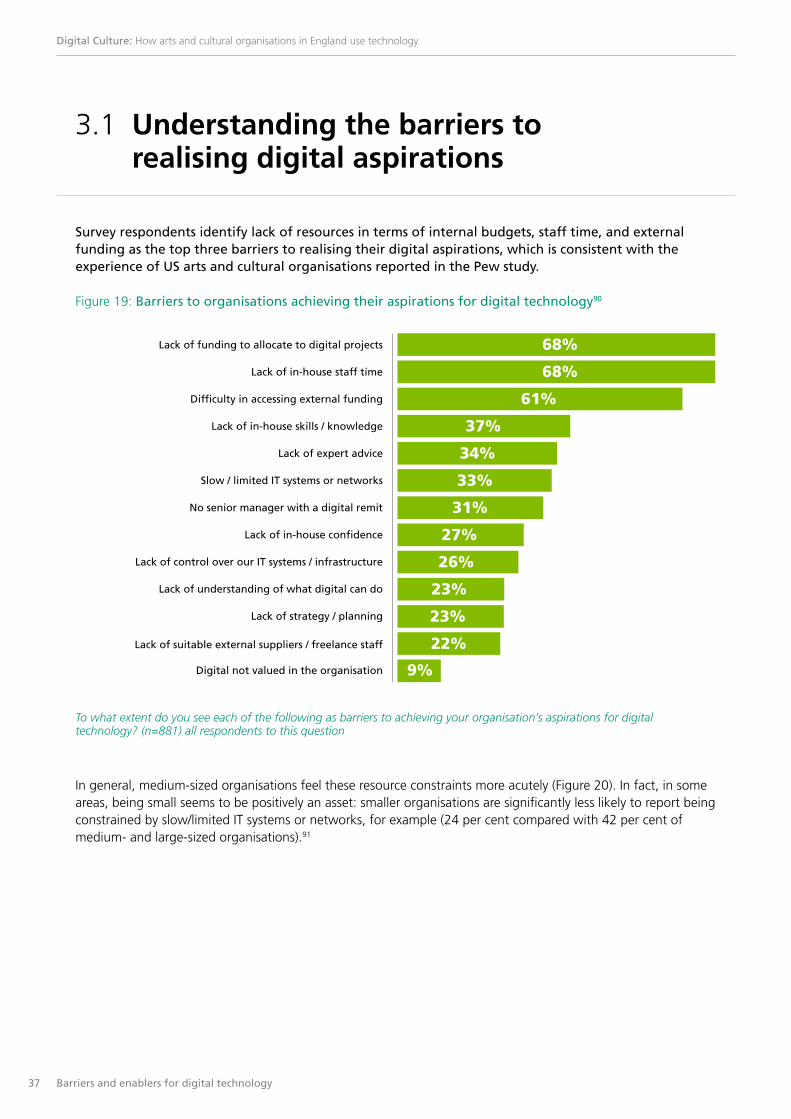
Survey respondents identify lack of resources in terms of internal budgets, staff time, and external funding as the top three barriers to realising their digital aspirations, which is consistent with the experience of US arts and cultural organisations reported in the Pew study.
Figure 19: Barriers to organisations achieving their aspirations for digital technology90
3.1 Understanding the barriers to realising digital aspirations
To what extent do you see each of the following as barriers to achieving your organisation’s aspirations for digital technology? (n=881) all respondents to this question
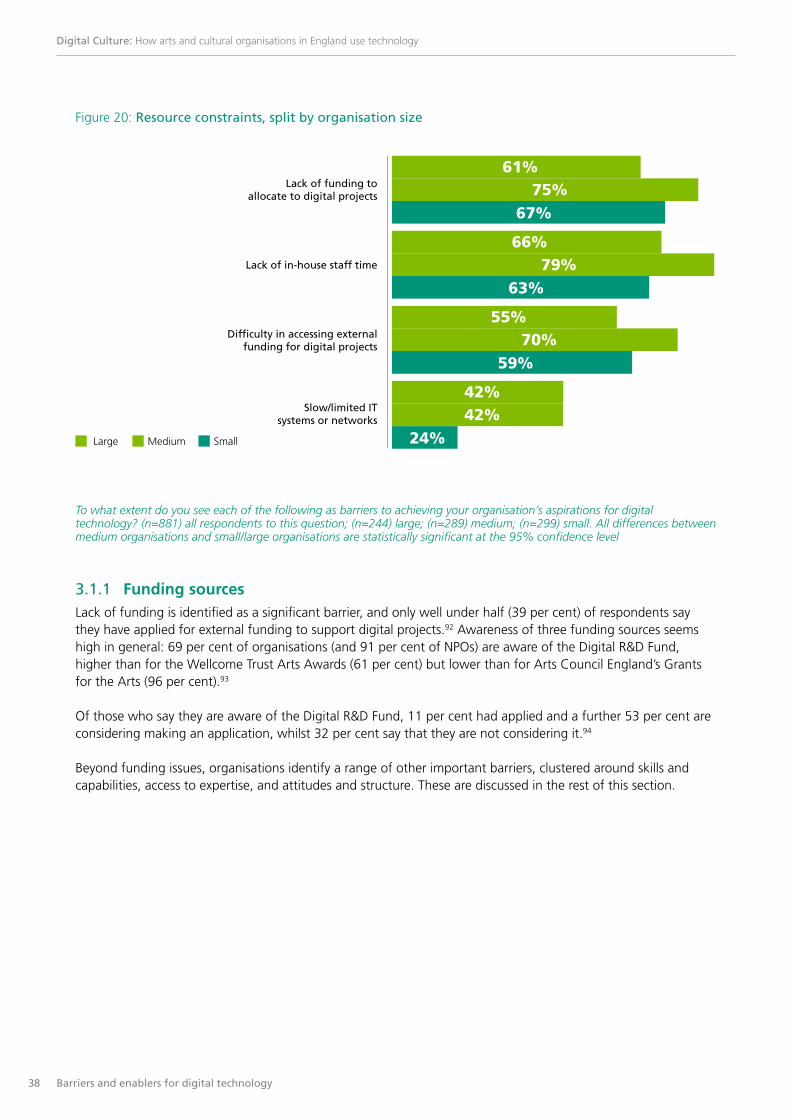
In general, medium-sized organisations feel these resource constraints more acutely (Figure 20). In fact, in some areas, being small seems to be positively an asset: smaller organisations are significantly less likely to report being constrained by slow/limited IT systems or networks, for example (24 per cent compared with 42 per cent of medium- and large-sized organisations).91
38 Barriers and enablers for digital technology
Digital Culture: How arts and cultural organisations in England use technology
Figure 20: Resource constraints, split by organisation size
Lack of funding toallocate to digital projects
Slow/limited ITsystems or networks
Difficulty in accessing externalfunding for digital projects
Lack of in-house staff time
75%61%
67%
42%42%
24%
70%55%
59%
79%66%
63%
Large Medium Small
To what extent do you see each of the following as barriers to achieving your organisation’s aspirations for digital technology? (n=881) all respondents to this question; (n=244) large; (n=289) medium; (n=299) small. All differences between medium organisations and small/large organisations are statistically significant at the 95% confidence level
3.1.1 Funding sourcesLack of funding is identified as a significant barrier, and only well under half (39 per cent) of respondents say they have applied for external funding to support digital projects.92 Awareness of three funding sources seems high in general: 69 per cent of organisations (and 91 per cent of NPOs) are aware of the Digital R&D Fund, higher than for the Wellcome Trust Arts Awards (61 per cent) but lower than for Arts Council England’s Grants for the Arts (96 per cent).93
Of those who say they are aware of the Digital R&D Fund, 11 per cent had applied and a further 53 per cent are considering making an application, whilst 32 per cent say that they are not considering it.94
Beyond funding issues, organisations identify a range of other important barriers, clustered around skills and capabilities, access to expertise, and attitudes and structure. These are discussed in the rest of this section.

39 Barriers and enablers for digital technology
Digital Culture: How arts and cultural organisations in England use technology
Organisations require a wide and rapidly evolving set of skills and capabilities in order to undertake digital technology projects, ranging from creative skills (such as production and user interface design) and technical skills (such as database management and software development) through to practical business competencies (such as project management and understanding of legal compliance).
Surveyed organisations identify the most significant gaps to be in technical areas – data analysis, database management (customer relationship management) and software development – closely followed by legal advice on intellectual property and user interface design, as shown in Figure 21.
Although skills shortages are felt across different art and cultural forms, there are some differences in the reported skills gaps. So, for example, just under one half of organisations without physical venues say they have a shortage of data analysis skills, compared with around one-third (34 per cent) of organisations with physical venues.95 This may reflect the fact that venues are more experienced at dealing with customer data through ticketing systems and membership schemes, whereas those without a physical presence may rely more on third-party venues to manage their customer interactions and therefore have less experience in handling data.
Figure 21: Underserved skills areas96
3.2 Skills and capabilities
Here is a list of skills and capabilities in key areas relating to digital technology. Please rate each one according to the extent to which your organisation is well served for its needs in these areas. (n=879) all respondents to this question
Data analysis
Database management / CRM
Software development
Legal advice around intellectual property rights
User interface design and user testing
Rights clearance
Digital commissioning and partner management
Project management
Multimedia / website design
Digital production
Digital marketing
41%
41%
40%
40%
39%
30%
30%
29%
27%
26%
18%
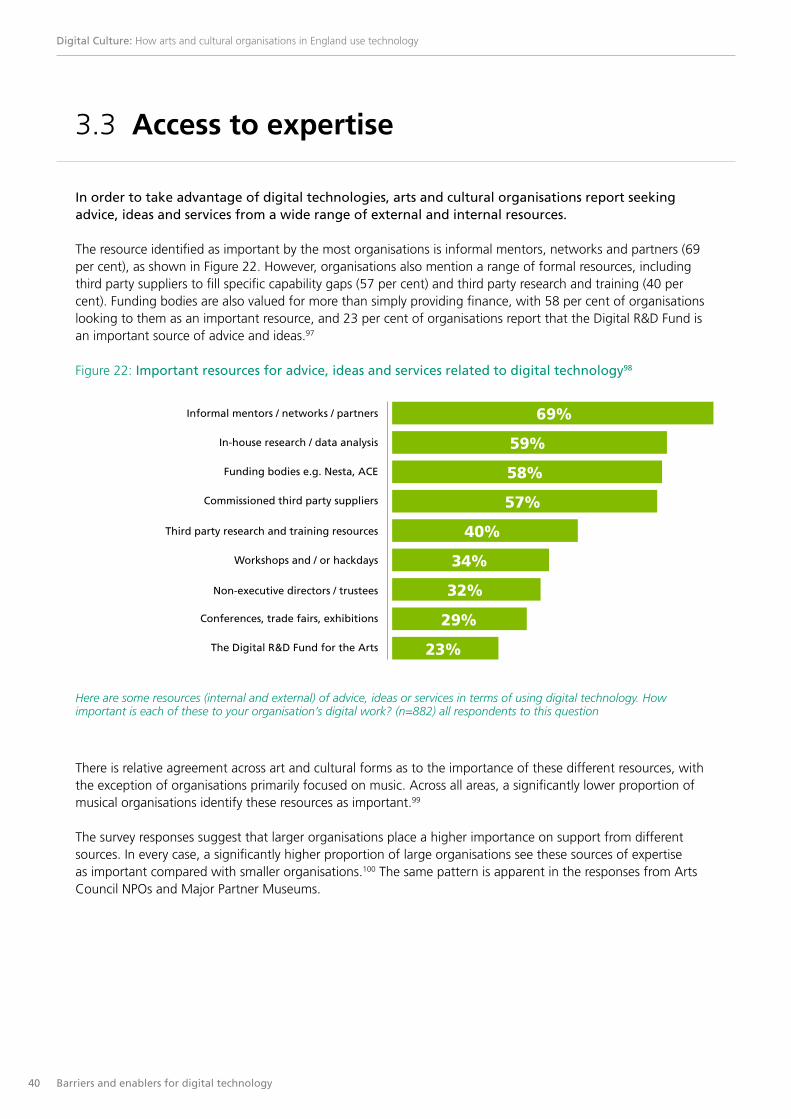
40 Barriers and enablers for digital technology
Digital Culture: How arts and cultural organisations in England use technology
In order to take advantage of digital technologies, arts and cultural organisations report seeking advice, ideas and services from a wide range of external and internal resources.
The resource identified as important by the most organisations is informal mentors, networks and partners (69 per cent), as shown in Figure 22. However, organisations also mention a range of formal resources, including third party suppliers to fill specific capability gaps (57 per cent) and third party research and training (40 per cent). Funding bodies are also valued for more than simply providing finance, with 58 per cent of organisations looking to them as an important resource, and 23 per cent of organisations report that the Digital R&D Fund is an important source of advice and ideas.97
Figure 22: Important resources for advice, ideas and services related to digital technology98
3.3 Access to expertise
Here are some resources (internal and external) of advice, ideas or services in terms of using digital technology. How important is each of these to your organisation’s digital work? (n=882) all respondents to this question
There is relative agreement across art and cultural forms as to the importance of these different resources, with the exception of organisations primarily focused on music. Across all areas, a significantly lower proportion of musical organisations identify these resources as important.99
The survey responses suggest that larger organisations place a higher importance on support from different sources. In every case, a significantly higher proportion of large organisations see these sources of expertise as important compared with smaller organisations.100 The same pattern is apparent in the responses from Arts Council NPOs and Major Partner Museums.
69%
59%
58%
57%
40%
34%
32%
23%
29%
Informal mentors / networks / partners
In-house research / data analysis
Funding bodies e.g. Nesta, ACE
Commissioned third party suppliers
Third party research and training resources
Workshops and / or hackdays
Non-executive directors / trustees
Conferences, trade fairs, exhibitions
The Digital R&D Fund for the Arts
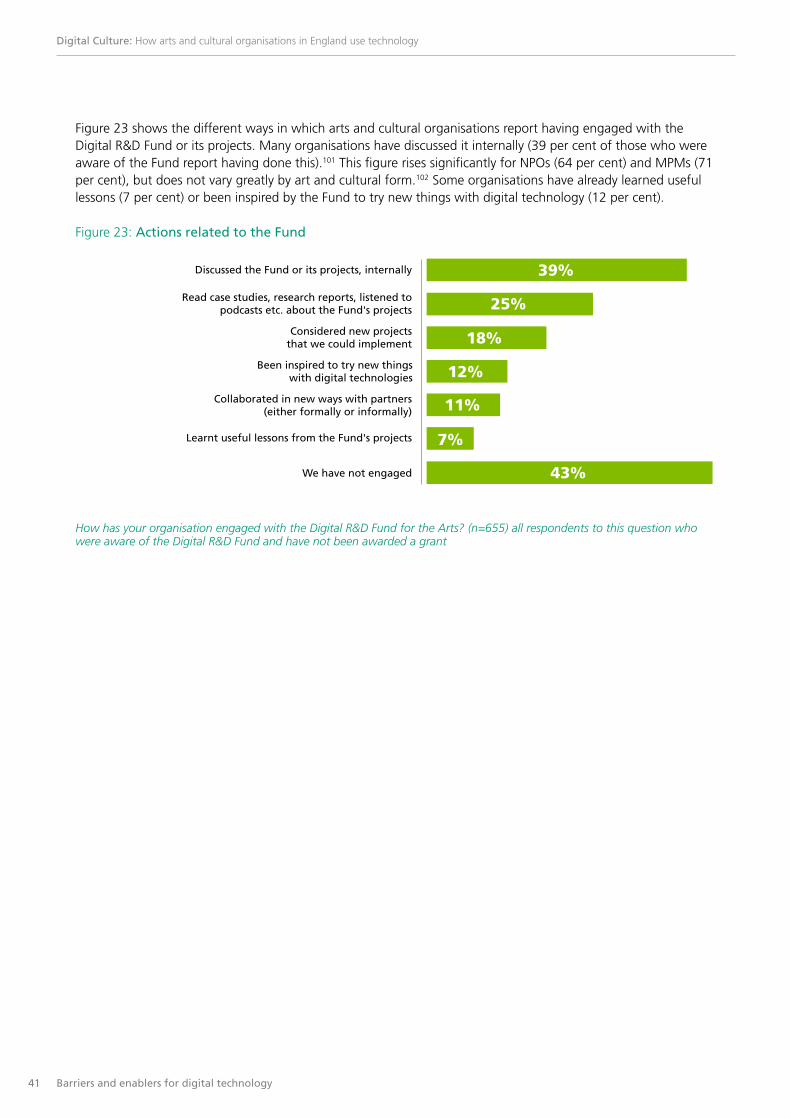
41 Barriers and enablers for digital technology
Digital Culture: How arts and cultural organisations in England use technology
Figure 23 shows the different ways in which arts and cultural organisations report having engaged with the Digital R&D Fund or its projects. Many organisations have discussed it internally (39 per cent of those who were aware of the Fund report having done this).101 This figure rises significantly for NPOs (64 per cent) and MPMs (71 per cent), but does not vary greatly by art and cultural form.102 Some organisations have already learned useful lessons (7 per cent) or been inspired by the Fund to try new things with digital technology (12 per cent).
Figure 23: Actions related to the Fund
Discussed the Fund or its projects, internally
We have not engaged
Learnt useful lessons from the Fund's projects
Collaborated in new ways with partners(either formally or informally)
Been inspired to try new thingswith digital technologies
Considered new projectsthat we could implement
Read case studies, research reports, listened topodcasts etc. about the Fund's projects
39%
25%
18%
12%
11%
7%
43%
How has your organisation engaged with the Digital R&D Fund for the Arts? (n=655) all respondents to this question who were aware of the Digital R&D Fund and have not been awarded a grant

42 Barriers and enablers for digital technology
Digital Culture: How arts and cultural organisations in England use technology
The survey also asked respondents to assess the extent to which they agreed with a set of statements focusing on organisational structure, culture and mindset relating to digital technologies (Figure 24).
There appears to be great variation across organisations. Digital knowledge and expertise is clearly lacking in many organisations, both at senior level and across the organisation – 31 per cent of organisations feel that most of their senior management are not that knowledgeable about digital and 39 per cent felt that digital expertise is concentrated in specific parts of their organisations. Consistent with this, some organisations are prioritising training schemes.103 For example, the Imperial War Museum, a national museum organisation that covers conflicts, especially those involving Britain, has instituted internal digital capability building programmes and has made digital competencies part of its management structure and appraisal: “the core aspiration for our new strategy is ‘to develop the confidence, initiative and digital capability of staff at all levels, so that they embed digital media instinctively in their work’. We have introduced a museum computer club to increase digital capability for all staff. We have introduced digital competencies and digital leadership roles – these are part of new job descriptions, staff appraisals and forward job plans”.104
When split by organisation type, museums again report significantly different results to other arts and cultural organisations. For all five statements, museums are significantly more likely to disagree, suggesting they perceive greater structural and cultural challenges. For example, 22 per cent of arts and cultural organisations as a whole strongly agree that most of their senior management are knowledgeable about digital technologies, compared to just 10 per cent for museums.105
3.4 Attitudes and organisational structure
Imperial War Museum used social media to encourage visitors to respond to objects in its collection, with support through the pilot Digital R&D Fund for the Arts.

43 Barriers and enablers for digital technology
Digital Culture: How arts and cultural organisations in England use technology
Most of our ideas for digital activities aregenerated in-house and then, if we need support,
we specify what we want in briefs to suppliers
We tend to collaborate with external suppliersto generate new ideas and briefs for digitalactivities and services
Digital expertise is distributed across allparts of our organisation
Digital expertise is concentrated in specialistparts of our organisation, e.g. marketing
Our senior management team is morefocused on innovation in non-digitaI areas
Coming up with new digital ideas is a priority for our senior management team
We prefer to let others experiment with digitaltechnologies and then we'll save time and
money by adopting the ideas that work best
We try to experiment with digital technologies.Sometimes this means ideas don't work but other times they do and our peers often imitate us
Most of our senior management are not thatknowledgeable about digital technologies
Most of our senior management areknowledgeable about digital technologies
22% 25% 21% 22% 10%
11% 17% 24% 25% 23%
15% 23% 28% 18% 16%
16% 20% 32% 20% 12%
18% 29% 29% 16% 8%
Strongly agree
Stronglyagree
Stronglyagree
Agree In the middle/don’t know
Agree
Strongly agreeIn the middle/don’t know
Figure 24: Agreement with statements about structure and culture106
Here are some statements that other people have made about their organisations. Please indicate which apply to your organisation. (n=891) all respondents

Knowle West Media Centre is working with IBM and the University of West England to explore how live and open data can be used as the basis of community-based creative projects, with support from the Digital R&D Fund for the Arts
4 Maximising the impact of digital technologies
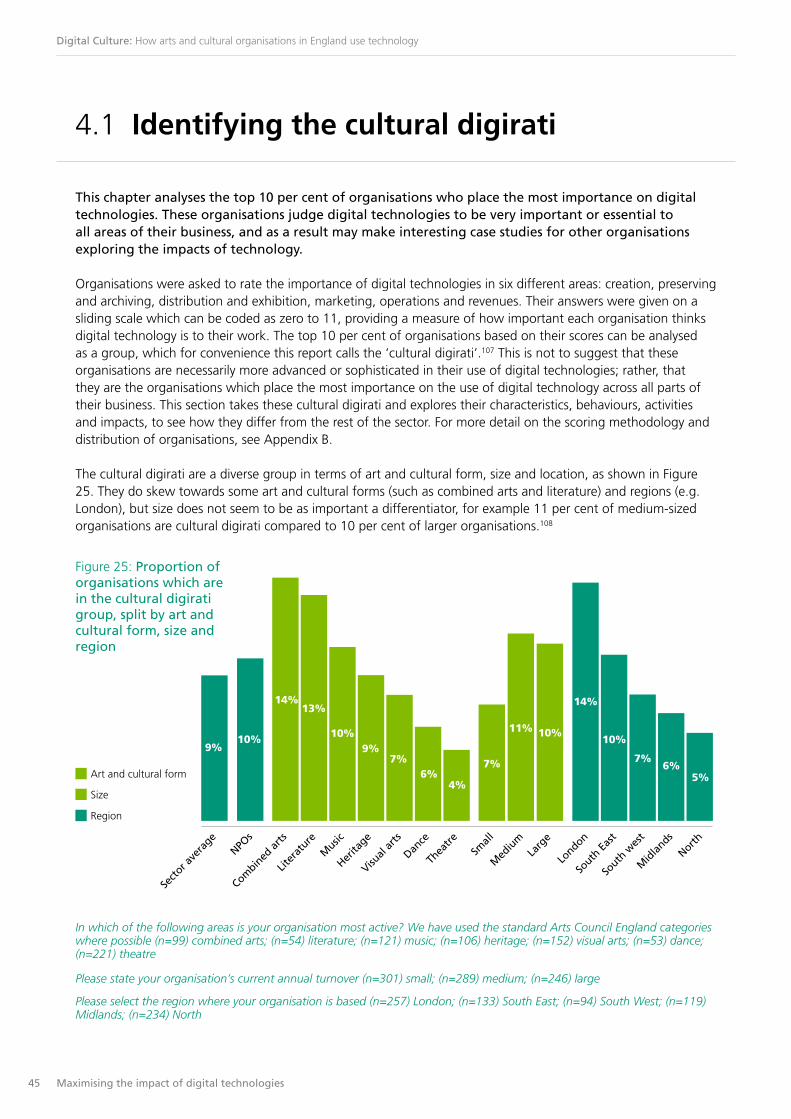
45 Maximising the impact of digital technologies
Digital Culture: How arts and cultural organisations in England use technology
This chapter analyses the top 10 per cent of organisations who place the most importance on digital technologies. These organisations judge digital technologies to be very important or essential to all areas of their business, and as a result may make interesting case studies for other organisations exploring the impacts of technology.
Organisations were asked to rate the importance of digital technologies in six different areas: creation, preserving and archiving, distribution and exhibition, marketing, operations and revenues. Their answers were given on a sliding scale which can be coded as zero to 11, providing a measure of how important each organisation thinks digital technology is to their work. The top 10 per cent of organisations based on their scores can be analysed as a group, which for convenience this report calls the ‘cultural digirati’.107 This is not to suggest that these organisations are necessarily more advanced or sophisticated in their use of digital technologies; rather, that they are the organisations which place the most importance on the use of digital technology across all parts of their business. This section takes these cultural digirati and explores their characteristics, behaviours, activities and impacts, to see how they differ from the rest of the sector. For more detail on the scoring methodology and distribution of organisations, see Appendix B.
The cultural digirati are a diverse group in terms of art and cultural form, size and location, as shown in Figure 25. They do skew towards some art and cultural forms (such as combined arts and literature) and regions (e.g. London), but size does not seem to be as important a differentiator, for example 11 per cent of medium-sized organisations are cultural digirati compared to 10 per cent of larger organisations.108
4.1 Identifying the cultural digirati
Sect
or ave
rage
NPOs
Combin
ed a
rts
Larg
eSm
all
Med
ium
Liter
ature
Music
London
South
Eas
t
South
wes
t
Mid
lands
North
Thea
tre
Visual
arts
Dance
Herita
ge
13%14%
10%9%
7%6%
4%
14%
10%
7%6%
5%
9%10%
11% 10%
7%Art and cultural form
Size
Region
In which of the following areas is your organisation most active? We have used the standard Arts Council England categories where possible (n=99) combined arts; (n=54) literature; (n=121) music; (n=106) heritage; (n=152) visual arts; (n=53) dance; (n=221) theatre
Please state your organisation’s current annual turnover (n=301) small; (n=289) medium; (n=246) large
Please select the region where your organisation is based (n=257) London; (n=133) South East; (n=94) South West; (n=119) Midlands; (n=234) North
Figure 25: Proportion of organisations which are in the cultural digirati group, split by art and cultural form, size and region

46 Maximising the impact of digital technologies
Digital Culture: How arts and cultural organisations in England use technology
They are more diverse in their activities and more innovative, especially in digital content and distribution
The cultural digirati appear to be more diverse than their peers in the way they use digital technologies. Of the 22 digital activities covered by the survey, they report on average undertaking thirteen of them, compared with nine for the whole sector.109 They also appear more likely to experiment with new activities – on average they had introduced five new activities in the last year compared with three for arts and cultural organisations as a whole. There is again a good deal of variation here, revealing some organisations to be evolving particularly rapidly in their adoption of digital technologies.110
The differences between the cultural digirati and other organisations are particularly marked in relation to digital content and distribution:
• 57 per cent report creating standalone born digital works of art (26 per cent in the sector as a whole), and over half of these (55 per cent) say that they have started doing this in the past year (compared with 45 per cent of all organisations).
• 41 per cent report adapting/re-staging works to make them suitable for digital consumption (sector average 20 per cent), and over half of these (56 per cent) have started doing this in the past year (sector average 38 per cent).111
They reach a larger digital audience, across more platforms, using more sophisticated techniques
The cultural digirati report being more active and successful in their digital marketing efforts – their average website audience is 67,500 (compared with a sector average of 38,500), and 13 per cent of them have audiences over 100,000 (sector average 5 per cent).112 When it comes to social media the difference is even greater: the cultural digirati are present on an average of seven social media platforms, compared with an average of four in the sector as a whole, and have an average combined Facebook/Twitter audience of 31,500, over double the sector average of 14,000. They are more likely to post content regularly (67 per cent do this several times a week, compared with a sector average of 55 per cent), encourage sharing (71 per cent versus 60 per cent), respond to fans regularly (67 per cent versus 51 per cent) and monitor actively what people are saying (71 per cent versus 56 per cent of all organisations).113
They are also more sophisticated in their marketing activities – in particular, they are significantly more likely to be making use of data-driven techniques and mobile platforms. So,
• Over half (53 per cent) use data in the development of new creative works, events or exhibitions (compared with a sample average of 27 per cent), and 53 per cent use data in the development of new commercial products or services (average 21 per cent).114
• Roughly half (48 per cent) have a mobile presence (sector average 33 per cent) and 78 per cent of these use this to make audiovisual content available, optimised for mobile (average 53 per cent).115
They are also experiencing a much higher level of impact from digital technology, especially on profitability and revenues
As well as being significantly more technology-active, the cultural digirati also report a significantly higher level of impact from digital technologies. Overall, 89 per cent feel that digital technologies have had a ‘major impact’ on their ability to fulfil their mission effectively, compared with a sector average of 60 per cent.116
4.2 Activities and outcomes

47 Maximising the impact of digital technologies
Digital Culture: How arts and cultural organisations in England use technology
In fact, in all 23 specific digital impact areas covered by the study, the cultural digirati are significantly more likely to have felt a ‘major impact’ from digital technology. In some areas, the difference is particularly striking. Although the cultural digirati are in line with the rest of the sector in terms of how their funding splits between public grants, earned and contributed income, they seem to be much more successful in using digital technologies to enhance their financial performance:
• 35 per cent report a major impact from digital technologies on their overall revenues, compared with 11 per cent for organisations as a whole.
• 42 per cent report a major impact on profitability, compared with 11 per cent of all organisations.117
As well as undertaking different sets of activities and experiencing different outcomes, the cultural digirati also exhibit particular characteristics that distinguish them from the rest of the sector. In terms of the barriers and enablers discussed in Section 3, for example, the four areas in which they differ most from the rest of the sector are:
They are more likely to report that digital expertise is distributed throughout their organisation
Just under a third (30 per cent) of the cultural digirati strongly agree that digital expertise is distributed across their organisation, compared with 15 per cent of the sector overall.118 Similarly, whilst 22 per cent of all organisations say that most of their senior management team is knowledgeable about digital technology, this figure rises to 41 per cent for the cultural digirati.119 This is also reflected in the proportion of staff that play an active role in carrying out digital activities – the cultural digirati report that 72 per cent of paid staff (full- and part-time) have a digital remit, higher than 60 per cent in the sector as a whole.120
They are more likely to attribute a high level of importance to resources outside their immediate staff
The cultural digirati consistently regard the sources of expertise, advice and ideas covered by the survey (see Section 3.3) as more important than other organisations. The areas of greatest difference are external resources and non-executive governance positions – over half of the cultural digirati (51 per cent) see trustees as important, compared with 32 per cent for the sector as whole, and the cultural digirati are twice as likely (58 per cent) as all organisations (29 per cent) to see conferences, trade fairs and exhibitions as important.121
4.3 Key characteristics of the cultural digirati
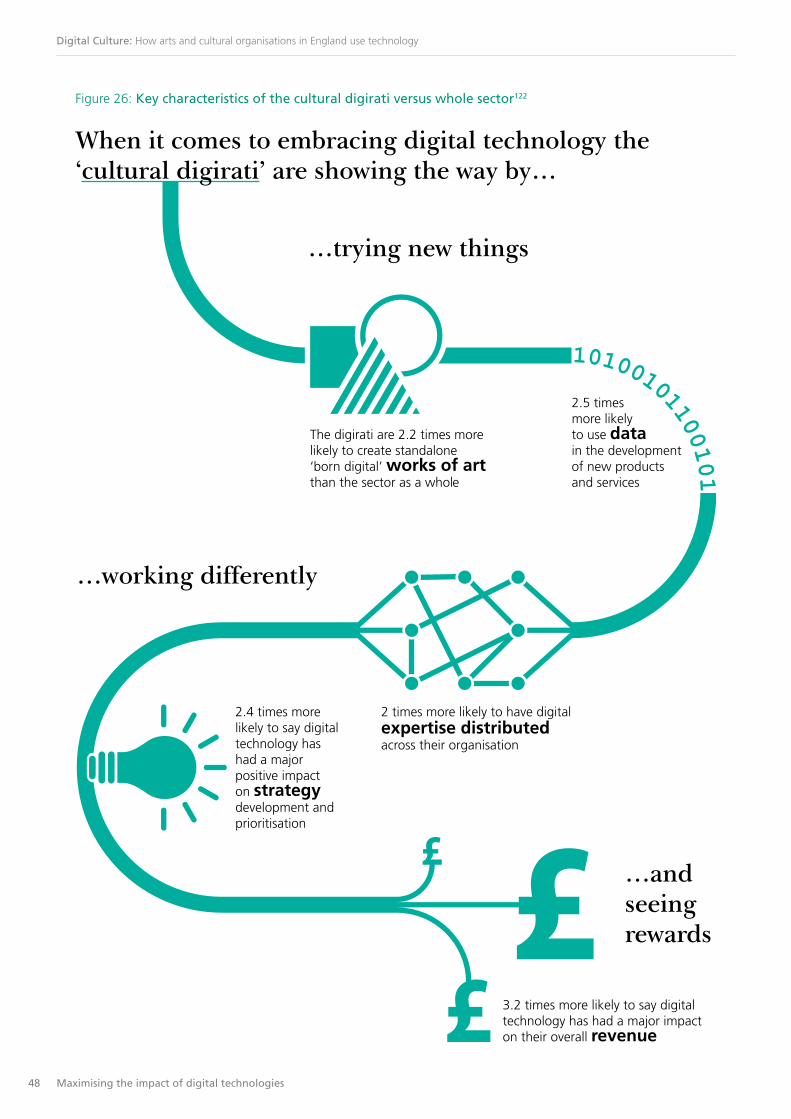
48 Maximising the impact of digital technologies
Digital Culture: How arts and cultural organisations in England use technology
Figure 26: Key characteristics of the cultural digirati versus whole sector122
When it comes to embracing digital technology the ‘cultural digirati’ are showing the way by…
…trying new things
…and seeing rewards
…working differently
2.5 times more likely to use data in the development of new products and services
The digirati are 2.2 times more likely to create standalone ‘born digital’ works of art than the sector as a whole
2 times more likely to have digitalexpertise distributedacross their organisation
2.4 times more likely to say digital technology has had a major positive impact on strategy development and prioritisation
3.2 times more likely to say digital technology has had a major impact on their overall revenue
49 Maximising the impact of digital technologies
Digital Culture: How arts and cultural organisations in England use technology
Fewer perceive skills gaps in all key areas
The cultural digirati feel more comfortable that they are well-served for all the skills areas covered by the survey, through internal skills and external partnerships. This is most pronounced with regard to software development, user interface design and digital commissioning, all capabilities which are important for developing successful audience-facing digital services. In some areas, however, the cultural digirati feel similar skills gaps to the rest of the sector: for example, 39 per cent report that they are not well-served for database management / CRM, compared to 40 per cent for all organisations, and 28 per cent feel not well-served for project management (including agile development methodologies), compared to 29 per cent for all organisations.123
They have a more positive attitude to research and development, and innovation
The cultural digirati are also more likely than other organisations to prioritise research and development, and innovation. Whereas only 17 per cent of the wider sector think that coming up with new digital ideas is a priority for their senior management, 29 per cent of the cultural digirati hold this view, perhaps suggesting a structure and mindset in which digital technology is integrated into all strategy and planning, rather than treated as a discrete business activity.124 This interpretation is consistent with the impact areas felt as a result of digital technology: 52 per cent of the cultural digirati report a major impact on strategy development and prioritisation, compared with just 22 per cent for the sector as a whole.125
Similarly, 30 per cent of the cultural digirati strongly agree that they try to experiment with digital technologies (compared with an average of 18 per cent), suggesting higher levels of investment in, and commitment to, research and development.126

Extant are using haptic technology to create cultural experiences for blind and sighted audiences, with support from the Digital R&D Fund for the Arts.
5 Conclusions: on a digital journey

51 Conclusions: on a digital journey
Digital Culture: How arts and cultural organisations in England use technology
The survey findings paint a picture of an arts and cultural sector well on its way on a digital journey.
A clear majority of organisations report that new technologies are already essential to their marketing, archiving and preservation, and operations. Over a third of organisations claim that digital technologies are essential to their creative work. A sizeable minority (17 per cent) report that they are also essential for generating revenues.
Different parts of the sector are experiencing different levels of impact from digital technology. Museums report lower levels of impact in many areas. In contrast, performing arts venues are much more likely to report major positive impacts, including on their revenues (almost a third compared with just 3 per cent of museums).127
The 10 per cent who value digital technologies most highly – the cultural digirati – span a range of art and cultural forms, sizes and regions, and are more likely to report major positive impacts across the board. They have larger digital audiences and enjoy greater financial returns from their use of digital technologies. They make greater use of a wider range of resources for advice and expertise, embed digital skills across their organisation and are more open to experimentation.
These results are the baseline against which the findings of future surveys will be compared. As well as tracking the progress of arts and cultural organisations along their digital journeys, longitudinal data will enable more robust exploration of the impact of technology adoption on organisations. It will also permit a rigorous evaluation of the additional impact the Digital R&D Fund has had on supported organisations, and whether it inspires research and development by others.
5 Conclusions: on a digital journey

52 Appendix
Digital Culture: How arts and cultural organisations in England use technology
Background
MTM was commissioned by the Digital R&D Fund partners (Nesta, Arts Council England and the Arts and Humanities Research Council) to undertake a three-year longitudinal study into the use of digital technology by arts and cultural organisations.
The overall aim is to produce a broad measure of digital activities and capabilities of the arts and cultural sector, and to monitor sector progress and track the impact of the Digital R&D Fund for the Arts over its three-year duration, 2012-15.128 The survey will be administered each year to a representative sample of organisations, to allow analysis of the ‘distance travelled’ in terms of progress with digital technology and its impact on arts and cultural organisations, and also helping stakeholders to understand what makes digital innovation projects more successful. This report covers year one.
Definition of digital technologyThe following definition was used for the purposes of the online survey:
Digital technology means different things to different people. To be clear, in this survey:
We use the term ‘digital technologies’ in a broad sense, to refer to any technologies that enable information to be created, stored or shared in digital form.
These technologies include hardware (e.g. a camera or laptop), software (e.g. video editing programmes, or apps), networks (e.g. the internet), websites and mobile devices.
Many of these digital technologies are having a profound impact on the way art and cultural artefacts are created, produced, preserved, marketed, distributed and consumed. Some forms of art or culture only exist because of technology (e.g. digital arts), some are influenced by technology (e.g. electronic distribution in literature and music), and for other parts of the sector the role for digital technologies may be limited.
Importantly, this survey seeks to take account of views from all these parts of the sector.
Survey design processIn order to create a questionnaire that served all of the objectives MTM developed the survey in several phases.
Initially desk research and a literature review were conducted. In particular these drew on similar work conducted by Pew129 in the US, relevant work by Nesta in the UK, and consumer surveys such as DCMS’s Taking Part130 and Arts Council England’s Digital Audiences research.131 Following this there was a qualitative research phase where interviews were conducted with stakeholders and industry experts to ensure that the survey encompassed all relevant issues.
A drafted questionnaire was then shown to an advisory board drawn from the funding partners. Their collated feedback informed the development of the final draft which was then shown to eight pilot organisations for cognitive testing. The resulting final survey was soft launched to the first 5 per cent of the contact database on 29 May 2013, and final quality checks were carried out before full launch. The survey was administered online and takes in the region of 30-40 minutes to complete.
Appendix A: Project background and methodology
53 Appendix
Digital Culture: How arts and cultural organisations in England use technology
Survey process
Contact proceduresIn order to achieve the highest possible response rate, potential respondents were initially sent an email introducing the survey and laying out its core aims before being sent a personalised email with an individual link to complete the survey. The first email also described the type of individuals that were considered to be best suited to completing the survey (see 6.4.4.) and enquired as to the best contact person within the organisation. In some cases, organisations provided alternative contact details for the survey invitation.
Respondent selectionParticipants were screened to ensure that respondents to the survey were appropriate representatives of the sector and their organisation. Early survey questions screened on these measures:
• Job role – the survey had to be completed by senior members of staff or those in specifically digital job roles, to ensure that they were knowledgeable enough about their organisation to give accurate and reliable responses.
• Organisation – the survey had to be completed by respondents who were representing an arts or cultural organisation, rather than individuals who were not attached to an organisation.
• Function – the main purpose of the organisation had to be an arts or cultural function (and, of course, this was not necessarily the case for all the organisations in our contact database because the full range of funding applications to Arts Council England includes a wide range of organisation types).
• Region – only organisations based in England were invited to take part in the survey.
Respondents were instructed to answer on behalf of their organisations, confer with colleagues if necessary, and were offered a bespoke referral system that allowed respondents to send individual questions to some of their colleagues if they needed assistance with some of the more specialist topics.
Further to this, the questionnaire explained that ‘if you represent an arts or cultural organisation within a larger body whose main activities lie outside the sector (e.g. a university museum / arts centre, a gallery within a local authority), then you should answer with reference to your smaller organisation – the one focused on arts and culture.’
Response rate At a total sample level the 891 respondents reflect responses from approximately 13 per cent of the compiled database. The response rate was highest amongst NPOs (391 out of 693 equating to 56 per cent) which was, at least partially, due to these organisations being actively encouraged to take the survey by Arts Council England in separate communications.
In total 6,503 organisations were invited to take the survey. Of these 1,113 organisations started the survey but 71 did not complete it, with a further 151 being ‘screened out’ (they were not suitable for the survey due to the reasons described in 6.4.4). The remaining 891 respondents completed the survey and are reported in the data set. However not every organisation answered every question, resulting in fluctuating base sizes.
Weighting the data to match the population profileAll findings in this report are based on weighted data: our sample was weighted to reflect the composition of the arts and cultural sector.132 However, all base sizes in data source notes have been quoted using the unweighted numbers of respondents from whom the percentages were sourced.
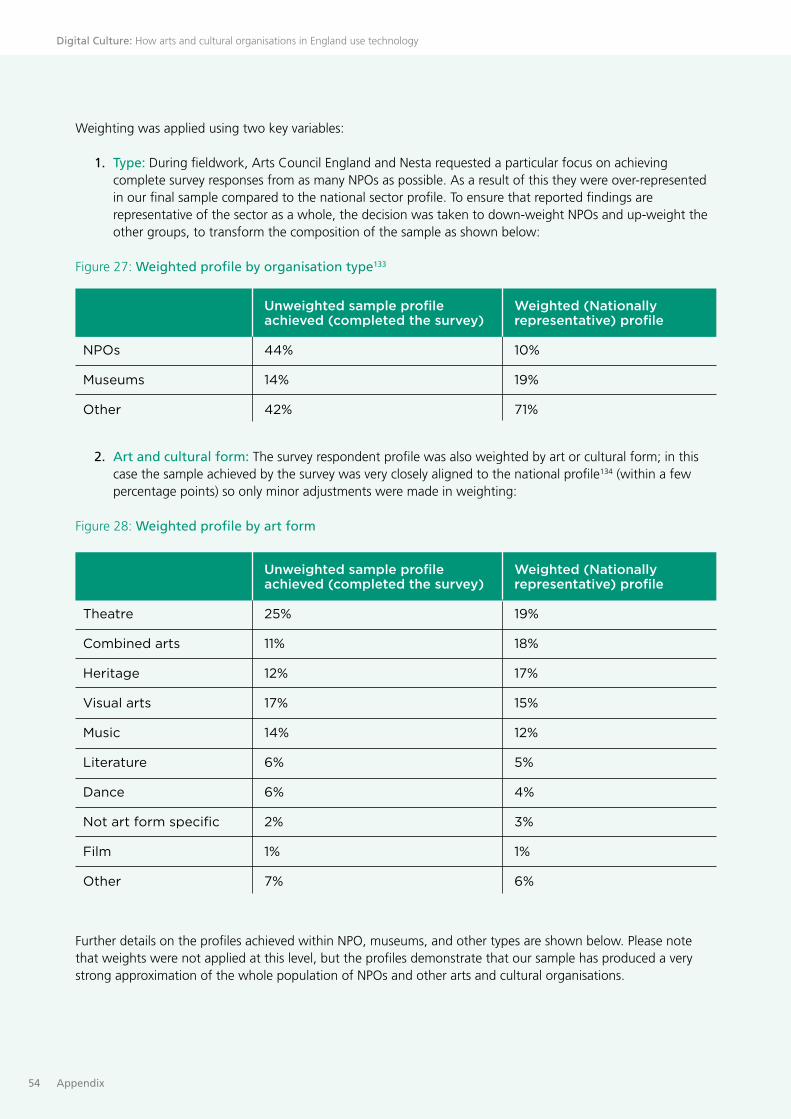
54 Appendix
Digital Culture: How arts and cultural organisations in England use technology
Weighting was applied using two key variables:
1. Type: During fieldwork, Arts Council England and Nesta requested a particular focus on achieving complete survey responses from as many NPOs as possible. As a result of this they were over-represented in our final sample compared to the national sector profile. To ensure that reported findings are representative of the sector as a whole, the decision was taken to down-weight NPOs and up-weight the other groups, to transform the composition of the sample as shown below:
Figure 27: Weighted profile by organisation type133
2. Art and cultural form: The survey respondent profile was also weighted by art or cultural form; in this case the sample achieved by the survey was very closely aligned to the national profile134 (within a few percentage points) so only minor adjustments were made in weighting:
Figure 28: Weighted profile by art form
Further details on the profiles achieved within NPO, museums, and other types are shown below. Please note that weights were not applied at this level, but the profiles demonstrate that our sample has produced a very strong approximation of the whole population of NPOs and other arts and cultural organisations.
Unweighted sample profile Weighted (Nationally achieved (completed the survey) representative) profile
NPOs 44% 10%
Museums 14% 19%
Other 42% 71%
Unweighted sample profile Weighted (Nationally achieved (completed the survey) representative) profile
Theatre 25% 19%
Combined arts 11% 18%
Heritage 12% 17%
Visual arts 17% 15%
Music 14% 12%
Literature 6% 5%
Dance 6% 4%
Not art form specific 2% 3%
Film 1% 1%
Other 7% 6%
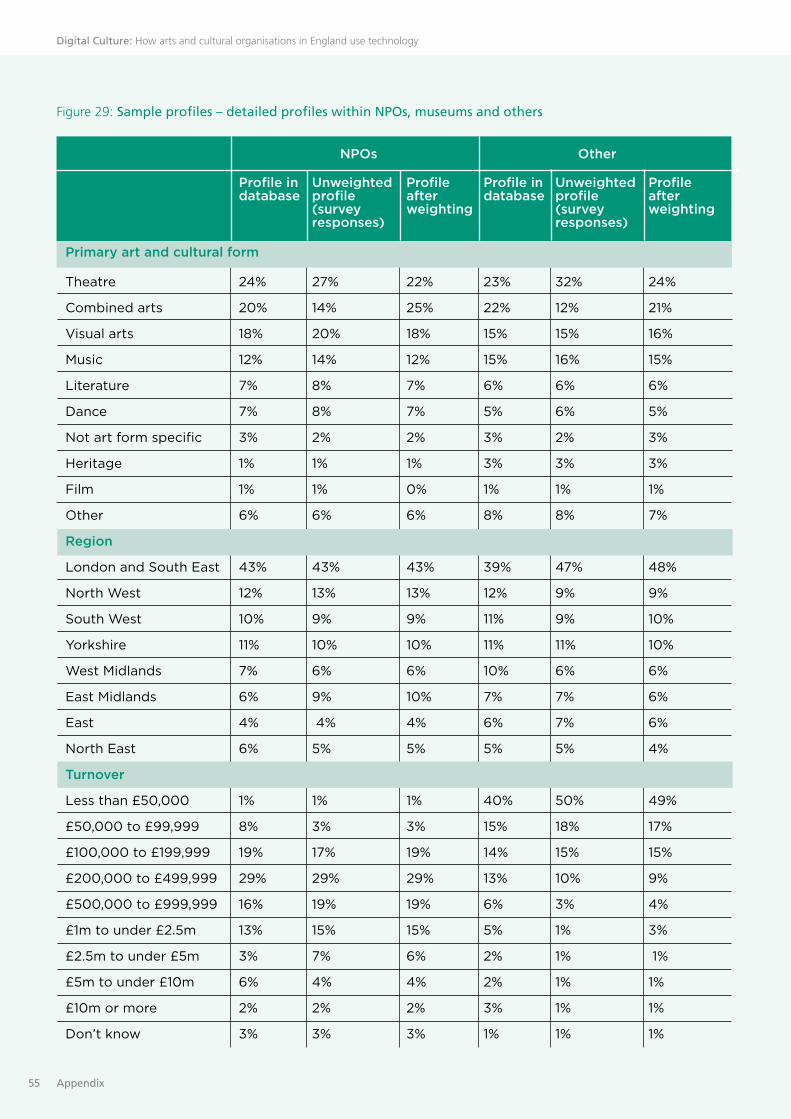
55 Appendix
Digital Culture: How arts and cultural organisations in England use technology
Figure 29: Sample profiles – detailed profiles within NPOs, museums and others
NPOs Other
Profile in Unweighted Profile Profile in Unweighted Profile database profile after database profile after (survey weighting (survey weighting responses) responses)
Primary art and cultural form
Theatre 24% 27% 22% 23% 32% 24%
Combined arts 20% 14% 25% 22% 12% 21%
Visual arts 18% 20% 18% 15% 15% 16%
Music 12% 14% 12% 15% 16% 15%
Literature 7% 8% 7% 6% 6% 6%
Dance 7% 8% 7% 5% 6% 5%
Not art form specific 3% 2% 2% 3% 2% 3%
Heritage 1% 1% 1% 3% 3% 3%
Film 1% 1% 0% 1% 1% 1%
Other 6% 6% 6% 8% 8% 7%
Region
London and South East 43% 43% 43% 39% 47% 48%
North West 12% 13% 13% 12% 9% 9%
South West 10% 9% 9% 11% 9% 10%
Yorkshire 11% 10% 10% 11% 11% 10%
West Midlands 7% 6% 6% 10% 6% 6%
East Midlands 6% 9% 10% 7% 7% 6%
East 4% 4% 4% 6% 7% 6%
North East 6% 5% 5% 5% 5% 4%
Turnover
Less than £50,000 1% 1% 1% 40% 50% 49%
£50,000 to £99,999 8% 3% 3% 15% 18% 17%
£100,000 to £199,999 19% 17% 19% 14% 15% 15%
£200,000 to £499,999 29% 29% 29% 13% 10% 9%
£500,000 to £999,999 16% 19% 19% 6% 3% 4%
£1m to under £2.5m 13% 15% 15% 5% 1% 3%
£2.5m to under £5m 3% 7% 6% 2% 1% 1%
£5m to under £10m 6% 4% 4% 2% 1% 1%
£10m or more 2% 2% 2% 3% 1% 1%
Don’t know 3% 3% 3% 1% 1% 1%

56 Appendix
Digital Culture: How arts and cultural organisations in England use technology
Museums were only profiled by region (as they did not contain the same variation by art and cultural form, and financial information was not available in these cases).
Significance and reliability On a sample of 891 respondents, the confidence limits for an observed percentage (often thought of as the margin of error) are within + or – 3 per cent (at the 95 per cent confidence level), so the data from this survey can be considered highly robust. A look-up table of confidence limits is shown below:
Figure 30: Look-up table of confidence limits around percentages, for various sample sizes
Museums (MPMs and Other museums)
Profile Unweighted Profile in profile after database (survey weighting responses)
Region
London and South East 38% 24% 25%
East of England 15% 7% 7%
East Midlands 11% 8% 8%
London 10% 19% 20%
North West 9% 16% 15%
West Midlands 7% 7% 7%
Yorkshire 7% 17% 17%
North East 3% 2% 2%
Sample size 5% or 95% 10% or 90% 20% or 80% 30% or 70% 40% or 60% 50%
50 6 9 11 13 14 14
75 5 7 10 11 11 11
100 5 6 8 9 10 10
150 4 5 7 8 8 8
200 3 5 6 7 7 7
300 3 4 5 6 6 6
500 2 3 4 5 5 5
100 2 2 3 3 3 3

57 Appendix
Digital Culture: How arts and cultural organisations in England use technology
Where the quantitative research data compares different subgroups, reference is often made to the ‘average’ or ‘total sample’: the observed results among the total (weighted) research sample of 891 respondents to this year’s survey.
On occasion, differences between subgroups are described as ‘statistically significant’. This refers to the use of a statistical hypothesis testing technique known as T-testing, which has been employed to lend weight to the observation of varying findings from one subgroup to another. Statistically significant differences indicate that there is a greater than 95 per cent probability that the difference between subgroups has not arisen by chance; that is, there is a high degree of certainty that the two subgroups are materially different with respect to the variable in question.
Percentages in this report are based on weighted data, yet the base sizes quoted in footnotes are the unweighted base sizes (i.e. the actual number of respondents providing answers), in order to give a true sense of how many respondents have been included in providing that part of the data.
Qualitative insightsIn this report, the quantitative data has been supplemented and illustrated with qualitative examples and insights. All verbatim quotes (in italics) have been taken from the open-ended questions in the survey where respondents wrote free-text responses.
Those organisations have given their permission to be identified in this report. Otherwise, all survey data has been treated anonymously and confidentially.
Appendix B describes in detail the composition of the weighted profile of respondents.
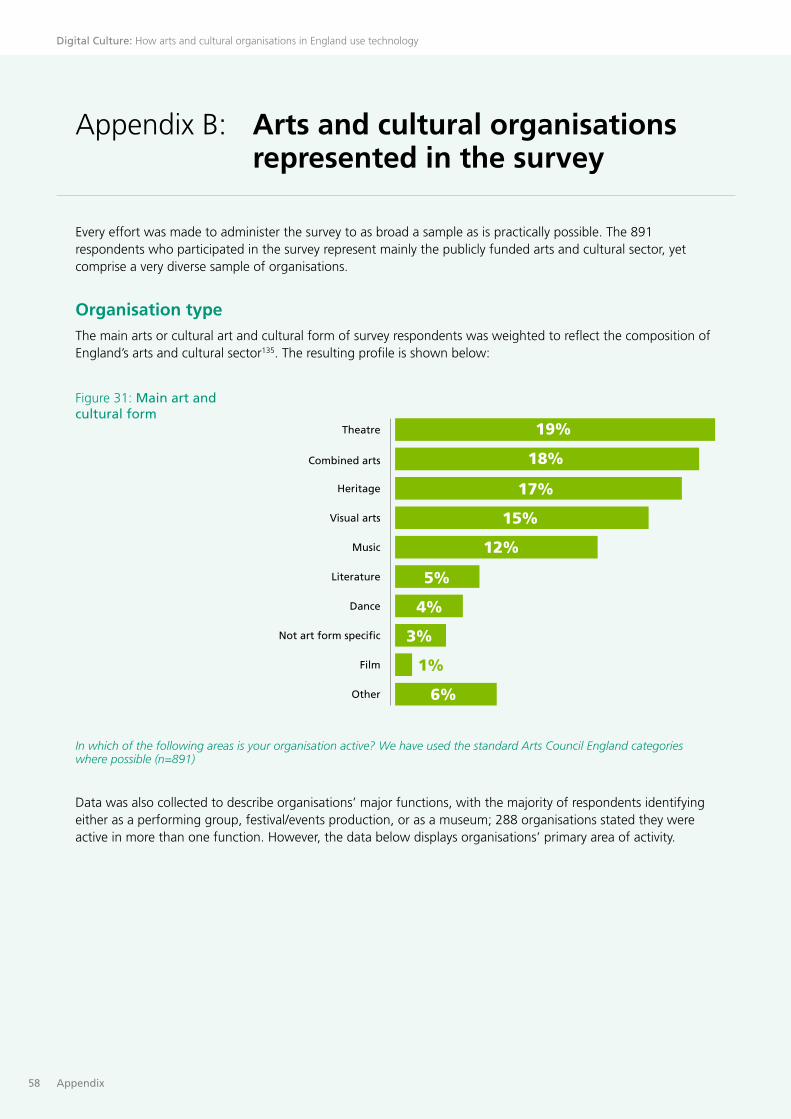
58 Appendix
Digital Culture: How arts and cultural organisations in England use technology
Every effort was made to administer the survey to as broad a sample as is practically possible. The 891 respondents who participated in the survey represent mainly the publicly funded arts and cultural sector, yet comprise a very diverse sample of organisations.
Organisation type The main arts or cultural art and cultural form of survey respondents was weighted to reflect the composition of England’s arts and cultural sector135. The resulting profile is shown below:
In which of the following areas is your organisation active? We have used the standard Arts Council England categories where possible (n=891)
Data was also collected to describe organisations’ major functions, with the majority of respondents identifying either as a performing group, festival/events production, or as a museum; 288 organisations stated they were active in more than one function. However, the data below displays organisations’ primary area of activity.
Appendix B: Arts and cultural organisations represented in the survey
Theatre
Combined arts
Heritage
Visual arts
Music
Literature
Dance
Not art form specific
Film
Other
19%
18%
17%
15%
12%
5%
4%
3%
1%
6%
Figure 31: Main art and cultural form
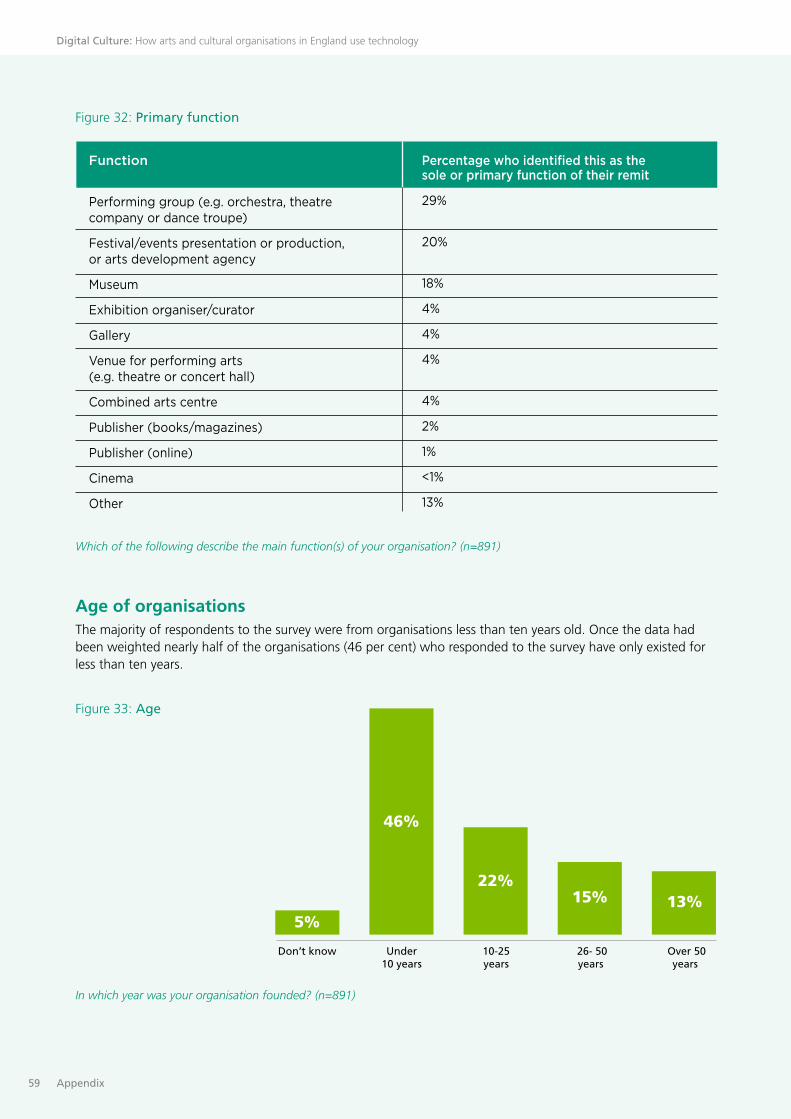
59 Appendix
Digital Culture: How arts and cultural organisations in England use technology
Which of the following describe the main function(s) of your organisation? (n=891)
Age of organisations The majority of respondents to the survey were from organisations less than ten years old. Once the data had been weighted nearly half of the organisations (46 per cent) who responded to the survey have only existed for less than ten years.
Figure 32: Primary function
In which year was your organisation founded? (n=891)
5%
46%
22%15% 13%
Don’t know Under10 years
10-25years
26- 50years
Over 50years
Figure 33: Age
Percentage who identified this as the sole or primary function of their remit
29%
20%
18%
4%
4%
4%
4%
2%
1%
<1%
13%
Function
Performing group (e.g. orchestra, theatre company or dance troupe)
Festival/events presentation or production, or arts development agency
Museum
Exhibition organiser/curator
Gallery
Venue for performing arts (e.g. theatre or concert hall)
Combined arts centre
Publisher (books/magazines)
Publisher (online)
Cinema
Other
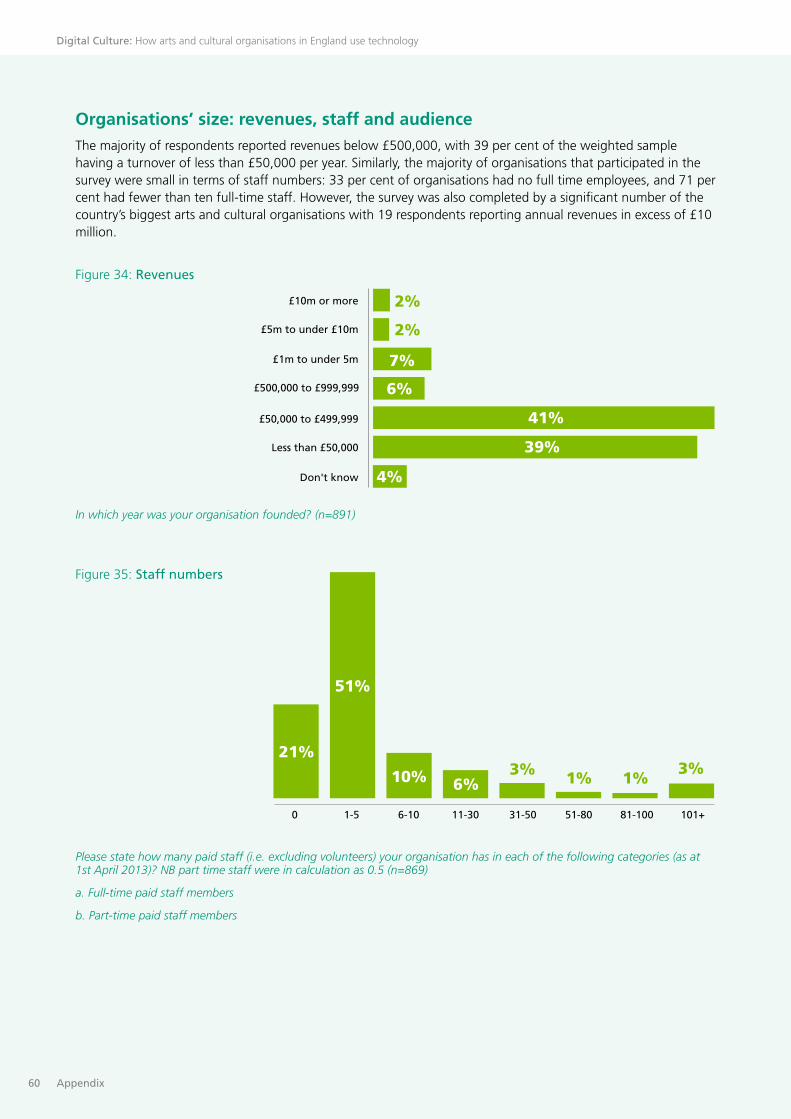
60 Appendix
Digital Culture: How arts and cultural organisations in England use technology
Organisations’ size: revenues, staff and audience
The majority of respondents reported revenues below £500,000, with 39 per cent of the weighted sample having a turnover of less than £50,000 per year. Similarly, the majority of organisations that participated in the survey were small in terms of staff numbers: 33 per cent of organisations had no full time employees, and 71 per cent had fewer than ten full-time staff. However, the survey was also completed by a significant number of the country’s biggest arts and cultural organisations with 19 respondents reporting annual revenues in excess of £10 million.
In which year was your organisation founded? (n=891)
Please state how many paid staff (i.e. excluding volunteers) your organisation has in each of the following categories (as at 1st April 2013)? NB part time staff were in calculation as 0.5 (n=869)
a. Full-time paid staff members
b. Part-time paid staff members
£10m or more
Don't know
Less than £50,000
£50,000 to £499,999
£500,000 to £999,999
£1m to under 5m
£5m to under £10m
2%
2%
7%
6%
41%
39%
4%
21%
51%
10% 6%3% 1% 1%
3%
0 1-5 6-10 11-30 31-50 51-80 81-100 101+
Figure 34: Revenues
Figure 35: Staff numbers

61 Appendix
Digital Culture: How arts and cultural organisations in England use technology
The respondents also represented a wide range of audience levels; the majority reported less than 50,000 in physical audience per year. However, 2 per cent of respondents have physical audiences of over one million people per year. Survey data suggests that the majority of organisations’ website audiences still lag behind that of the physical audience:
Approximately how many monthly unique visitors does your organisation’s main branded website receive? Please give us an average for the past 12 months. Please give us the answer in total, which might be global rather than UK-only (n=873).
Please tell us the actual or estimated total attendance at your organisation’s programme of activity (including education and outreach work) over the last 12 months (n=869).
28%
21%17%
10%6% 1%
<1000 1-5k 5-25k 25-100k >100k Don'tknow
Notapplicable
17%
65%
6% 8% 2% 10%
1 to 50k 50-100k 100k-1million
1 million + Don'tknow
Notapplicable
7%
Figure 36: Organisations’ website audience size
Figure 37: Organisations’ physical audience size

62 Appendix
Digital Culture: How arts and cultural organisations in England use technology
Location
Survey respondents represented organisations from all over England and different community settings. After weighting, the final profile of the survey respondents is represented below:
Please select the region where your organisation is based (n=891)
Which one of the following best describes the community in which your organisation is currently based? (n=891)
29%
15%
11%
11%
11%
7%
6%
4%
6%
London
South East
North West
South West
Yorkshire and The Humber
East Midlands
East of England
West Midlands
North East
46%
11%
33%
20%
3%A majorurbancentre
A suburbnear an
urban centre
A smallcity ortown
A ruralarea
Virtual/onlineorganisation
only
Figure 38: Region
Figure 39: Community location

63 Appendix
Digital Culture: How arts and cultural organisations in England use technology
The cultural digirati – importance score
Responses regarding the importance of digital technologies across six areas were aggregated to give an importance score. Respondents scored each area on a scale from 1-11, giving a maximum score of 66 which has then been re-based out of 100. Chapter 4 discusses the characteristics and behaviours of the organisations with the highest scores – the cultural digirati who regard digital technologies as essential to their work across creation, preserving and archiving, distribution and exhibition, marketing and audience development, operations and revenues. The analysis isolates the top 10 per cent, as shown in Figure 40, which due to the distribution of scores is actually 9 per cent of the total sample.
Figure 40: Importance score
How important is digital technology to your organisation overall, at the present time, in each of the following areas? Creation, Marketing, Distribution and exhibition, Preserving and archiving, Operations, Business models (n=891)
Frequency
Importance score
Top decile
0% 20% 40% 60% 100%80%
50%
40%
30%
20%
10%
0%
64 Endnotes
Digital Culture: How arts and cultural organisations in England use technology
1. Bakhshi, H. and Throsby, D. (2010) ‘Culture of Innovation.’ London: NESTA.
2. MTM (2013) ‘Digital Landscape Study.’ London: MTM; (n=891) all respondents.
3. Born digital being “work native to and created for the digital space”, as defined in Arts Council England (2012) ‘Creative media policy.’
London: Arts Council.
4. MTM (2013); (n=152) visual arts; (n=121) music. The difference is statistically significant at the 95 per cent confidence level.
5. MTM (2013); (n=301) small organisations defined as those with revenues of under £100,000; (n=246) large organisations defined as
those with revenues of over £500,000. The difference is statistically significant at the 95 per cent confidence level.
6. MTM (2013); (n=891) all respondents. The survey asked organisations which activities they are currently undertaking, and which have
been newly introduced in the past 12 months.
7. MTM (2013); (n=890) all respondents to this question.
8. MTM (2013); (n=891) all respondents.
9. MTM (2013); (n=880) all respondents to this question.
10. MTM (2013); (n=62) performing arts venues; (n=118) museums. The difference between performing arts venues and museums is statis-
tically significant at the 95 per cent confidence level.
11. MTM (2013); (n=881) all respondents to this question.
12. MTM (2013); (n=879) all respondents to this question.
13. MTM (2013); (n=884) all respondents to this question.
14. MTM (2013); (n=873) all respondents to this question; (n=383) NPOs.
15. MTM (2013); (n=882) all respondents to this question.
16. MTM (2013); (n=655) all respondents to this question who were aware of the Fund and have not been awarded a grant.
17. MTM (2013); (n=891) all respondents; (n=83) digirarti. All digirarti differences reported are statistically significant at the 95 per cent
confidence level.
18. 81,000 compared with 45,000.
19. MTM (2013); (n=879) all respondents to this question; (n=80) digirarti.
20. MTM (2013); (n=887) all respondents to this question; (n=80) digirarti.
21. MTM (2013); (n=891) all respondents; (n=80) digirarti.
22. MTM (2013); (n=891) all respondents; (n=80) digirarti.
23. Go on UK and Lloyds Banking Group (2012) ‘ Britain’s Digital Opportunity: A Study of Digital Maturity within Britain’s Businesses and
Charities.’ Edinburgh: Lloyds Banking Group.
24. Ofcom (2013) ‘Communications Market Report.’ London: Ofcom.
25. Bakhshi, H. and Throsby, D. (2010) ‘Culture of Innovation.’ London: NESTA.
26. Pew Research Center (2013) ‘Arts Organizations and Digital Technologies.’ Washington DC: Pew Research Center.
27. The Accreditation Scheme recognises museums that meet nationally agreed standards based on their commitment to managing collec-
tions effectively for the enjoyment and benefit of users. http://www.artscouncil.org.uk/what-we-do/supporting-museums/accreditation-
scheme/
28. Arts Council England (2013) Renaissance Major Grants Programme
29. MTM (2013); (n=891) all respondents.
30. Combined arts encompasses a range of organisations that work across multiple artforms to achieve their aims, including festivals, carni-
val, arts centres and presenting venues, rural touring circuits and agencies.
31. Data provided by Arts Council England; MTM (2013); (n=869) all respondents to this question.
32. Respondents scored the importance of digital technology in these areas on an 11 point scale (0-10); essential represents a score of 9-10
and important represents scores of 7-8.
33. MTM (2013).
34. MTM (2013); (n=891) all respondents.
35. Arts Council England (2012) ‘Creative Media Policy.’ London: Arts Council England: “Art and cultural works and arts practice in which
digital technologies and media are an integral part of the creation of the artwork/experience e.g. artists film and video, digital arts,
participatory and interactive media, augmented reality games, pervasive and transmedia storytelling. ”
36. MTM (2013); (n=891) all respondents.
37. MTM (2013); (n=873) all respondents to this question; (n=53) dance companies. The difference is statistically significant at the 95 per
cent confidence level.
38. MTM (2013); (n=891) all respondents.
39. MTM (2013).
40. MTM (2013); (n=891) all respondents; (n=246) large organisations defined as reporting revenues of £500,000 or more; (n=301) small
organisations defined as reporting revenues of less than £100,000. The difference is statistically significant at the 95 per cent confidence
level.
41. MTM (2013); (n=891) all respondents; (n=43) small visual arts; (n=35) small heritage; (n=50) small music. The difference is statistically
significant at the 95 per cent confidence level.
Endnotes
65 Endnotes
Digital Culture: How arts and cultural organisations in England use technology
42. MTM (2013).
43. MTM (2013).
44. MTM (2013); (n=891) all respondents; (n=301) small; (n=246) large.
45. MTM (2013); (n=891) all respondents; (n=152) visual arts; (n=106) heritage. The difference is statistically significant at a 95 per cent
confidence level.
46. MTM (2013); (n=890) all respondents to this question.
47. MTM (2013).
48. MTM (2013); (n=891) all respondents.
49. MTM (2013); (n=246) large; (n=301) small. The difference is statistically significant at the 95 per cent confidence level.
50. MTM (2013); (n=891) all respondents.
51. National Theatre (2013) ‘NT Live: About Us.’ London: National Theatre.
52. MTM (2013); (n=122) large performing groups; (n=44) small performing groups. The difference is statistically significant at the 95 per
cent confidence level.
53. MTM (2013).
54. MTM (2013); (n=891) all respondents.
55. MTM (2013). See NMC quotation in section 2.5.
56. MTM (2013); (n=890) all respondents to this question.
57. MTM (2013); (n=221) all theatre respondents to this question. The difference is statistically significant at the 95 per cent confidence
level.
58. MTM (2013).
59. MTM (2013); (n=891) all respondents; (n=301) small.
60. MTM (2013); (n=879) all respondents to this question.
61. MTM (2013); (n=891) all respondents.
62. MTM (2013); (n=891) all respondents.
63. MTM (2013); (n=879) all respondents to this question.
64. MTM (2013).
65. MTM (2013); (n=887) all respondents to this question. The difference is statistically significant at the 95 per cent confidence level.
66. MTM (2013); (n=328) all respondents to this question.
67. MTM (2013); (n=890) all respondents to this question.
68. MTM (2013).
69. MTM (2013); (n=890) all respondents to this question.
70. MTM (2013).
71. MTM (2013); (n=890) all respondents to this question.
72. MTM (2013).
73. The differences between museums and several other types of organisations for all the questions reported are statistically significant at
the 95 per cent confidence level.
74. MTM (2013).
75. MTM (2013); (n=891) all respondents.
76. MTM (2013); (n=52) galleries; (n=46) combined arts. The difference is statistically significant at the 95 per cent confidence level.
77. MTM (2013); (n=891) all respondents; (n=62) performing arts centres; (n=121) music. The difference is statistically significant at the 95
per cent confidence level.
78. MTM (2013); (n=891) all respondents.
79. MTM (2013); (n=890) all respondents to this question; (n=118) museums; (n=51) galleries. The difference is statistically significant at the
95 per cent confidence level.
80. MTM (2013); (n=891) all respondents.
81. MTM (2013); (n=148) organisations that regarded digital as “essential” to generating new revenue.
82. MTM (2013); (n=890) all respondents to this question.
83. MTM (2013); (n=54) literature; (n=62) performing arts venues; (n=46) combined arts; (n=118) museums. The difference is statistically
significant for all examples at the 95 per cent confidence level.
84. MTM (2013); (n=890) all respondents to this question.
85. MTM (2013).
86. MTM (2013); (n=888) all respondents to this question. Respondents scored their responses on a 5 point scale from ‘strongly disagree’ to
‘strongly agree’, data shown here is for organisations responding ‘agree’ and ‘strongly agree’.
87. MTM (2013); (n=880) all respondents to this question; (n=52) literature; (n=104) heritage. The difference is statistically significant at the
95 per cent confidence level.
88. MTM (2013); (n=890) all respondents to this question; (n=106) heritage. The difference between heritage and theatre, music or dance is
statistically significant at the 95 per cent confidence level.
89. MTM (2013); (n=891) all respondents.
90. Respondents scored barriers on a 5 point scale from ‘not at all’ to ‘significant’ barrier’; charted ‘barrier’ data represents scores of 4 or 5.
91. MTM (2013); (n=299) small; (n=289) medium; (n=244) large. The difference is statistically significant at the 95 per cent confidence level.
92. MTM (2013); (n=884) all respondents to this question.

66 Endnotes
Digital Culture: How arts and cultural organisations in England use technology
93. MTM (2013); (n=873) all respondents to this question; (n=383) NPOs.
94. MTM (2013); (n=663) all respondents who were aware of the Digital R&D Fund and have not been awarded a grant.
95. MTM (2013); (n=350) physical venue; (n=529) no venue. The difference is statistically significant at the 95 per cent confidence level.
96. Respondents scored skills on a five point scale from ‘very underserved’ to ‘very well served’, chart represents very underserved (1) and
quite underserved (2). Well-served was defined as having sufficient in-house skills or the ability to import skills from external providers
and advisers.
97. MTM (2013); n=882 all respondents to this question. Respondents scored importance on a five point scale from ‘not important at all’ to
‘fundamental’; chart represents the data for scores 4 and 5.
98. Respondents scored importance on a five point scale from ‘not important at all’ to ‘fundamental’; chart represents the data for scores
4 and 5.
99. MTM (2013); (n=882) all respondents to this question; (n=120) music. The difference is statistically significant at the 95 per cent
confidence level.
100. MTM (2013); (n=246) large; (n=301) small.
101. MTM (2013); (n=655) all respondents to this question who were aware of the Digital R&D Fund and have not been awarded a grant.
102. NPOs n=339; MPMs n=14 (Caution: low base size) The difference is statistically significant at the 95 per cent confidence level.
103. MTM (2013); (n=891) all respondents. The figures quoted here do not correspond exactly with those in Figure 24 due to rounding
effects.
104. MTM (2013).
105. MTM (2013); (n=891) all respondents; (n=118) museums. The difference is statistically significant at the 95 per cent confidence level.
106. Respondents were asked to score agreement on an 11 point scale between a pair of opposing statements; chart shows scores 0-1 as
“strongly agree”, 2-4 as “agree”, 5 as “in the middle / don’t know”, 6-8 as “agree”, 9-10 as “strongly agree”.
107. Scores were based on Q10 with a maximum score of 66. Organisations scoring 64 and above were included for this analysis, meaning
an unweighted base of 80 and a weighted base of 78 – actually 9 per cent of the total sample rather than exactly 10 per cent.
108. The difference by size is not statistically significant.
109. MTM (2013); (n=891) all respondents; (n=80) cultural digirati. All differences reported in this chapter are statistically significant at a 95
per cent confidence level. Digital activities covered by this question include, for example, live streaming performances, posting video/
audio content online, maintaining a blog, using paid search or online display advertising, publishing onto social media platforms, sell-
ing tickets online etc.
110. MTM (2013); (n=873) all respondents to this question; (n=78) cultural digirati.
111. MTM (2013); (n=891) all respondents; (n=80) cultural digirati.
112. MTM (2013); (n=873) all respondents to this question; (n=79) cultural digirati.
113. MTM (2013); (n=891) all respondents; (n=80) cultural digirati.
114. MTM (2013); (n=879) all respondents to this question; (n=80) cultural digirati.
115. MTM (2013); (n=887) all respondents to this question; (n=80) cultural digirati; (n=328) organisations with a mobile presence; (n=43)
cultural digirati with a mobile presence.
116. MTM (2013); (n=880) all respondents to this question; (n=79) cultural digirati.
117. MTM (2013); (n=891) all respondents; (n=80) cultural digirati.
118. In contrast, just 8 per cent of cultural digirati strongly agreed with the opposing statement that digital expertise is concentrated in
specialist parts of our organisation e.g. marketing (compared to 15 per cent for the sector as a whole) .
119. MTM (2013); (n=891) all respondents; (n=80) cultural digirati.
120. MTM (2013); (n=740) all respondents to this question; (n=75) cultural digirati.
121. MTM (2013); (n=882) all respondents to this question; (n=80) cultural digirati.
122. MTM (2013); (n=891) all respondents; (n=80) cultural digirati. See Section 4 for base sizes.MTM (2013); (n=891) all respondents;
(n=80) cultural digirati
123. MTM (2013); (n=891) all respondents; (n=80) cultural digirati.
124. MTM (2013); (n=891) all respondents; (n=80) cultural digirati.
125. MTM (2013); (n=891) all respondents; (n=80) cultural digirati.
126. MTM (2013); (n=891) all respondents; (n=80) cultural digirati. The full statement was: “We try to experiment with digital technologies.
Sometimes this means ideas don’t work but other times they do and our peers often imitate us”.
127. MTM (2013); (n=62) performing arts venues; (n=118) museums. The difference is statistically significant at the 95 per cent confidence
level.
128. The Digital Research and Development Fund for the Arts was set up by Nesta, Arts Council England and the Arts and Humanities
Research Council. More than £7 million will be made available over three years to support c.90-100 digital research and development
projects.
129. Pew Research Center (2013) ‘Arts Organizations and Digital Technologies.’ Washington DC: Pew Research Center.
130. Department for Culture Media and Sport (2013) ‘Taking Part Survey.’ London: DCMS.
131. MTM for Arts Council England (2010) ‘Digital Audiences: Engagement with Arts and Culture Online.’ London: MTM.
132. A nationally representative profile was determined from the contact database – this was deemed comprehensive as it contained de-
tails of all NPOs, all applicants for Grants for the Arts funding (both successful and unsuccessful) and over 1,000 museums.
133. MTM (2013); (n=891) all respondents.
134. Data provided by Arts Council England.
135. Data provided by Arts Council England.

67 Image credits
Digital Culture: How arts and cultural organisations in England use technology
Page 1 – Tate Photography
Page 4 – Elliott Franks courtesy of Royal Opera House
Page 10 – Silvia Novak courtesy of Unlimited Theatre
Page 11 – David Chang courtesy of Sheffield Doc/Fest
Page 15 – Kevin Clifford courtesy of Pavilion Dance South West
Page 17 – Tate Photography
Page 18 – Curtis Gibson, courtesy of Streetwise Opera Company
Page 25 – Kate Green, courtesy of Being Frank Physical Theatre Company
Page 29 – South Asian Arts UK
Page 36 – Circus Starr
Page 42 – Imperial War Museum
Page 44 – Lee Magpie Smith courtesy of Knowle West Media Centre
Page 50 – Alex Eisenberg courtesy of Extant
Image credits
Nesta
1 Plough Place London EC4A [email protected] www.twitter.com/nesta_uk www.facebook.com/nesta.uk
www.nesta.org.uk
Arts & Humanities Research Council
Polaris House North Star Avenue Swindon SN2 [email protected] www.twitter.com/ahrcpress
www.ahrc.ac.uk
Arts Council England
14 Great Peter Street London SW1P [email protected] www.twitter.com/ace_national www.facebook.com/artscouncilofengland
www.artscouncil.org.uk


