Digital Laser Raman Spectrometer System with On-Line Computer Control of Data Acquisition and Reduction Charles H. Warren and Louis Ramaley An interface for coupling a laser Raman spectrometer employing photon counting detection to an on-line programmable calculator or minicomputer is described. The resulting system provides both background and spectral data in digital form that allows data manipulation to be easily performed. In addition on- line computer control allows the enhancement of the signal-to-noise ratio by signal averaging. The spec- trum of gaseous N 2 and 02 taken with the system illustrates the capability of the interface and computer when coupled with the spectrometer to make precise and sensitive measurements. Introduction Digital evaluation of spectra has led in various ways to improvements in signal-to-noise ratios by collecting data over long counting intervals or alter- natively through multiscan averaging by computer. Once the spectra are in digital form, data smoo- thing, curve analysis of overlapping bands, band in- tensity integration measurement of peak positions, and spectral sensitivity corrections to relative band intensities are all easily and automatically achieved. One system for on-line control and data acquisi- tion has been described' that uses a large and so- phisticated computer to operate both Raman and ir spectrometers in a time-shared mode. Such a sys- tem is necessarily quite complex and out of the reach of many laboratories. The advent of the minicom- puter and programmable calculator has changed this to a large extent. The advantages of the small com- puters, and especially the programmable calculator, are that they are relatively inexpensive and thus can be justified for use with a single instrument. Pro- grams to control the instrumentation are easy to write, modify, and correct, and the calculator is available for general use when not controlling the in- strument. The disadvantages are the limited mem- ory core for storage of data and programs and the speed at which data can be input or output. This latter factor is often no limitation, since for many experiments the rate-determining step is not the The authors are with the Chemistry Department, Dalhousie University, Halifax, Nova Scotia. Received 29 January 1973. data transfer time of the calculator but, for example, the frequency scan period of the spectrometer or the finite length of the photon counting interval. One system has been described 2 using a programmable calculator to take spectral data, but the instrument was not calculator-controlled. In this paper we describe a digital data acquisition system and interface that is relatively simple but that provides background subtraction and spectrom- eter control either by a minicomputer or a program- mable calculator. Although the system was de- signed for a Raman spectrometer, it can be used with any instrument in which photon counting de- tection is employed. The operation of the spectrometer (stepping in for- ward and reverse modes) and collection of data are controlled automatically by the calculator. A chop- per system is employed in the incident laser beam such that signal plus background counts are collect- ed for a preset interval of time during one-half of the chopper cycle while background counts are collected during the opposite half. These two counts are stored in memory and allowed to accumulate for a preset number of chopper cycles. When this number is reached, the two counts are subtracted to obtain a true signal count and this result is stored in an inter- mediate memory buffer in the calculator or output directly to a digital plotter. When the buffer is filled, the data are transferred to some mass storage device. After the spectral data at a certain frequency have been collected by the calculator, a signal is automat- ically sent to the spectrometer, the grating drive is incremented by a preset number of steps through a stepper-synchronous motor, and the above sequence is repeated, all completely under program control. The monochromator used in the system is designed 1976 APPLIED OPTICS / Vol. 12, No. 8 / August 1973
Transcript
Digital Laser Raman Spectrometer System withOn-Line Computer Control of Data Acquisition andReduction
Charles H. Warren and Louis Ramaley
An interface for coupling a laser Raman spectrometer employing photon counting detection to an on-lineprogrammable calculator or minicomputer is described. The resulting system provides both backgroundand spectral data in digital form that allows data manipulation to be easily performed. In addition on-line computer control allows the enhancement of the signal-to-noise ratio by signal averaging. The spec-trum of gaseous N2 and 02 taken with the system illustrates the capability of the interface and computerwhen coupled with the spectrometer to make precise and sensitive measurements.
Introduction
Digital evaluation of spectra has led in variousways to improvements in signal-to-noise ratios bycollecting data over long counting intervals or alter-natively through multiscan averaging by computer.Once the spectra are in digital form, data smoo-thing, curve analysis of overlapping bands, band in-tensity integration measurement of peak positions,and spectral sensitivity corrections to relative bandintensities are all easily and automatically achieved.
One system for on-line control and data acquisi-tion has been described' that uses a large and so-phisticated computer to operate both Raman and irspectrometers in a time-shared mode. Such a sys-tem is necessarily quite complex and out of the reachof many laboratories. The advent of the minicom-puter and programmable calculator has changed thisto a large extent. The advantages of the small com-puters, and especially the programmable calculator,are that they are relatively inexpensive and thus canbe justified for use with a single instrument. Pro-grams to control the instrumentation are easy towrite, modify, and correct, and the calculator isavailable for general use when not controlling the in-strument. The disadvantages are the limited mem-ory core for storage of data and programs and thespeed at which data can be input or output. Thislatter factor is often no limitation, since for manyexperiments the rate-determining step is not the
The authors are with the Chemistry Department, DalhousieUniversity, Halifax, Nova Scotia.
Received 29 January 1973.
data transfer time of the calculator but, for example,the frequency scan period of the spectrometer or thefinite length of the photon counting interval. Onesystem has been described2 using a programmablecalculator to take spectral data, but the instrumentwas not calculator-controlled.
In this paper we describe a digital data acquisitionsystem and interface that is relatively simple butthat provides background subtraction and spectrom-eter control either by a minicomputer or a program-mable calculator. Although the system was de-signed for a Raman spectrometer, it can be usedwith any instrument in which photon counting de-tection is employed.
The operation of the spectrometer (stepping in for-ward and reverse modes) and collection of data arecontrolled automatically by the calculator. A chop-per system is employed in the incident laser beamsuch that signal plus background counts are collect-ed for a preset interval of time during one-half of thechopper cycle while background counts are collectedduring the opposite half. These two counts arestored in memory and allowed to accumulate for apreset number of chopper cycles. When this numberis reached, the two counts are subtracted to obtain atrue signal count and this result is stored in an inter-mediate memory buffer in the calculator or outputdirectly to a digital plotter. When the buffer isfilled, the data are transferred to some mass storagedevice.
After the spectral data at a certain frequency havebeen collected by the calculator, a signal is automat-ically sent to the spectrometer, the grating drive isincremented by a preset number of steps through astepper-synchronous motor, and the above sequenceis repeated, all completely under program control.The monochromator used in the system is designed
such that when scanning, a signal pulse is transmit-ted every 10 cm-' of the scan. This pulse is generallyused to fire an event marker on a strip chart record-er, but has been incorporated into our interface sys-tem as a rough bookkeeping device. The calculatormonitors this signal. This allows one to automati-cally scan beyond the starting point, reverse thescan, and then automatically scan to the startingpoint before data are collected. This minimizesbacklash errors and also ensures that identical por-tions of the same gear teeth are engaged for repeatscans.
Weak signals are detected by accumulating thephoton counts over a long counting interval. In thiscase, photon counts can be accumulated for a fixednumber of time intervals or they can be averagedover a variable number of time intervals until a cer-tain preset statistical criterion is satisfied for thedata. An alternate approach for detecting weak sig-nals is to accumulate many relatively rapid scans ofthe full spectrum so that signals add coherentlywhereas the noise adds randomly. This latter meth-od requires that the calculator have the use of an on-line mass storage device such as a disk or tape drive.This cating technique is not only an effective meansof increasing the signal-to-noise ratio3' 4 but alsominimizes the errors associated with laser intensity,temperature, and atmospheric pressure fluctuations.
Once the final spectrum is taken, the raw spectraldata are analyzed with the use of the calculator.The data can be first smoothed by a numerical con-volution procedure.5 Peak positions are next deter-mined and calibrated. This operation is facilitatedby numerically obtaining the first and second deriva-tives of the spectrum. Other operations can also beperformed on the data automatically by the calcula-tor.
Interface Description and Operation
The interface and data acquisition system weredesigned to operate with a Spex Model 1401 doublemonochromator and an SSR photon counting detec-tion system. Other monochromators equipped withstepper scan motors and other photon counting sys-tems could be adapted to the interface with minormodification.
Data are brought to the interface from an SSR1105 ratemeter in the form of 10-nsec pulses atMotorola MECL II logic levels. The pulses werepreviously shaped and discriminated by an SSRModel 1120 amplifier discriminator. The wavenum-ber marker signal is brought to the interface directlyfrom the monochromater. The incident laser beamis chopped by a rotating mirror driven by a variable-speed motor. A very small portion of the choppedlaser beam is directed onto an H-P 5082-4220 photo-diode. The signal from this detector is amplifiedand sent to the interface as a square wave in phasewith the pulsating laser beam striking the sample.
Since no modifications were made in any of thecommercial components of the spectrometer to facili-
tate interfacing, the spectrometer can still be oper-ated in-the normal fashion. When under computercontrol, the operation of the spectrometer is thesame whether interfaced to a minicomputer or a cal-culator. However, the interfacing to a calculator ismore difficult and will be discussed first.
Calculators generally transfer data in codes suchas binary-coded decimal (BCD) or ASCII, one digitor symbol at a time (bit parallel, digit serial), andthey do not generally have a priority interrupt sys-tem or multiple input/output channels. Thus theinterface must be able to properly code and decodeinformation sent to and received from the calculator,and it must oversee the data transfer process.
The interface was specifically designed for usewith Wang 700 Series calculators but could be usedafter only minor modifications with any calculatorthat operates in the manner described above. Data,program commands, information codes, etc., areinput and output by the calculator in a two-digithexadecimal BCD code (8 bits) at TTL compatiblelogic levels. When an operation is to be performedby the interface, the calculator outputs a code re-questing the desired action along with a 20-gisec out-put strobe pulse. After the operation is finished, theinterface furnishes a Go code and a 20-,4sec inputstrobe pulse to the calculator. The calculator canperform no arithmetic operations until a Go code isreturned.
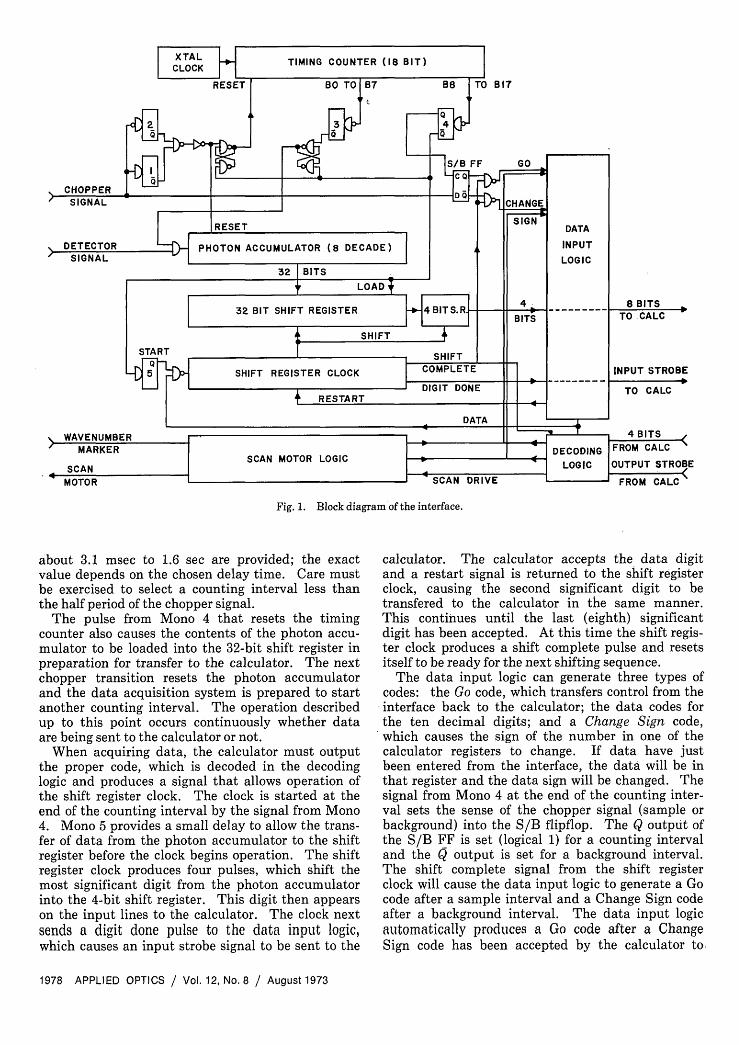
A block diagram of the interface is shown in Fig. 1.The signal from the laser chopper controls the timingfor photon counting. When this signal undergoes atransition (sample to background or vice versa) apulse from either Monostable (Mono) 1 or 2 removesthe reset signal from the timing counter (an 18-bitsynchronous binary counter) and counts from the81.92-kHz crystal oscillator begin to accumulate inthe timing counter. Mono 3 is connected by aneight-position switch to one of the first eight flipflops(FF) in the counter. When sufficient counts haveaccumulated to cause the selected flipflop to set andthen reset (go to logical 1 and back to 0), Mono 3generates a short pulse that enables detector countsto start accumulating in the photon accumulator (aneight-decade BCD counter). This provides an ad-justable delay between the chopper signal transitionand the onset of the photon counting.
Mono 4 is connected in the same manner to one ofthe last flipflops in the timing counter. When suffi-cient counts have accumulated to cause this selectedflipflop to set and then reset, Mono 4 generates apulse that resets the entire timing counter, preparingit for the next chopper signal transition and prevent-ing any more detector pulses from entering the pho-ton accumulator. The photon counting interval isdetermined by the settings of the switches on thetiming counter and the frequency of the crystal oscil-lator. This arrangement makes the reproducibilityof this interval dependent on the stability of thecrystal oscillator (0.01%) rather than the angular ve-locity of the chopper. Counting intervals from
about 3.1 msec to 1.6 sec are provided; the exactvalue depends on the chosen delay time. Care mustbe exercised to select a counting interval less thanthe half period of the chopper signal.
The pulse from Mono 4 that resets the timingcounter also causes the contents of the photon accu-mulator to be loaded into the 32-bit shift register inpreparation for transfer to the calculator. The nextchopper transition resets the photon accumulatorand the data acquisition system is prepared to startanother counting interval. The operation describedup to this point occurs continuously whether dataare being sent to the calculator or not.
When acquiring data, the calculator must outputthe proper code, which is decoded in the decodinglogic and produces a signal that allows operation ofthe shift register clock. The clock is started at theend of the counting interval by the signal from Mono4. Mono 5 provides a small delay to allow the trans-fer of data from the photon accumulator to the shiftregister before the clock begins operation. The shiftregister clock produces four pulses, which shift themost significant digit from the photon accumulatorinto the 4-bit shift register. This digit then appearson the input lines to the calculator. The clock nextsends a digit done pulse to the data input logic,which causes an input strobe signal to be sent to the
calculator. The calculator accepts the data digitand a restart signal is returned to the shift registerclock, causing the second significant digit to betransfered to the calculator in the same manner.This continues until the last (eighth) significantdigit has been accepted. At this time the shift regis-ter clock produces a shift complete pulse and resetsitself to be ready for the next shifting sequence.
The data input logic can generate three types ofcodes: the Go code, which transfers control from theinterface back to the calculator; the data codes forthe ten decimal digits; and a Change Sign code,which causes the sign of the number in one of thecalculator registers to change. If data have justbeen entered from the interface, the data will be inthat register and the data sign will be changed. Thesignal from Mono 4 at the end of the counting inter-val sets the sense of the chopper signal (sample orbackground) into the S/B flipflop. The Q output ofthe S/B FF is set (logical 1) for a counting intervaland the Q output is set for a background interval.The shift complete signal from the shift registerclock will cause the data input logic to generate a Gocode after a sample interval and a Change Sign codeafter a background interval. The data input logicautomatically produces a Go code after a ChangeSign code has been accepted by the calculator to.
transfer control to the calculator. The backgroundcount appears to the calculator as a negative numberand can be directly added to the sample count to geta corrected sample count. The next transition of thechopper signal starts the entire operation over again.Photon pulses can be accumulating in the photonaccumulator while the previous count is being shift-ed into the calculator. The only requirement is thatthe counting interval be slightly longer than theshifting time.
Figure 2 depicts the decoding logic and the scanmotor logic in greater detail. The interface is de-signed to accept six codes. These are (1) masterreset, which resets all interface counters and flip-flops; (2) data, which enables the shift register clockand sets the data input logic for data transfer; (3)motion, which sets the scan motor logic for motion;(4) forward, which sets the direction of the scanmotor for forward motion; (5) reverse, which sets thedirection of the scan motor for reverse motion; and(6) wavenumber reset, which resets the wavenumberFF. The master reset, forward, reverse, and waven-umber reset all return Go codes immediately to thecalculator, since these codes require no extended op-
eration of the interface. The code from the calcula-tor is decoded by the BCD to the decimal converter.The signal from the converter in turn sends the out-put strobe from the calculator out on only one of thesix code lines to the proper section of the interface.
To operate the scan motor a direction code is firstoutput by the calculator. The forward code closesrelay A and the reverse code closes relay B, estab-lishing the proper direction configuration. The scanmotor clutch is always left engaged. Next a motioncode is output that enables the NAND gate at theinput to Mono 8. Mono 7 is used to temporarilydelay enabling of the NAND gate to allow the direc-tion relays to settle before any attempt is made tostart the scan motor. It was found that if relays Aor B were carrying current while switching or set-tling, noise was generated that interfered with theinterface operation. Enabling the NAND gate al-lows the signal from Q to trigger Mono 8. The Qisignal is derived from the high side of the isolationtransformer and is a 60-Hz square wave in phasewith the line voltage. Mono 8 produces a pulse of 12msec (three-fourths of a full ac cycle) on the posi-tive-going zero crossing of the ac line and turns on
Fig. 3. Pure rotational spectrum of N2 and02 in air (1 atm) excited with a power of -800mW at 488 nm. Data collected at 0.11-cm-'
intervals for -1 sec.
MA sA On~~~~5
triac T for a full ac cycle throught Q2. This pro-duces a pulse of current to operate the scan motor inthe stepping mode. Mono 8 will continue to fireuntil the motion FF is reset by a master reset code.The trailing edge of the Mono 8 pulse triggers Mono9, which in turn sends a signal to the data inputlogic to produce either a Go or Change Sign code tothe calculator. Thus the calculator records everypulse sent to the scan motor. Normally the waven-umber FF routes pulses from Mono 9 to the Go sec-tion of the data input logic. When a wavenumbermarker signal occurs (every 10 cm-'), the Mono 9pulse produces a Change Sign code that allows thecalculator to keep track of the monochromator posi-tion.
Mono 10 has a longer pulse period than Mono 9, sothat should Mono 10 fire during the period of Mono9, the wavenumber FF will be reset only after the Gocode has been sent to the calculator. This avoids amixup in logic signals. The following scan motorpulse will produce the Change Sign code. Thewavenumber FF is set again after a Change Signcode by a signal from the data input logic. The sep-arate output code from the calculator can also beused for this purpose, since the master reset shouldnot be used in this regard.
Interfacing to a minicomputer is somewhat sim-pler. The instrument interfaced to the spectrometerin our laboratory was a Hewlett-Packard 2114B com-puter. One 16-bit TTL compatible input/outputregister card was used to link the computer to thespectrometer, Four of the computer output bits andthe output strobe (control bit) were connected to the
decoding logic as with the calculator. The Q out-puts of the photon accumulator, the wavenumber FF(Fig. 2), and the S/B FF (Fig. 1) were connected tothe computer input register through a digital multi-plexer. The interface input strobe was connected tothe computer flag line. Finally the shift registerclock and the change sign logic were disabled and.the output of Mono 4 (Fig. 1) was used to produce acomputer flag signal at the end of the photon count-ing interval. If a minicomputer alone were to be in-terfaced to the spectrometer, the shift register andits clock and much of the input logic would be un-necessary.
The counters and shift register are of standard de-sign. All integrated circuits used were Texas Instru-ments SN7400 SSI and MSI TTL circuits except forthe first decade of the photon accumulator. Anupper frequency limit of 100 MHz required that thisdecade be constructed from the faster MotorolaMECL II logic.6 A more detailed account of the in-terface and a complete wiring diagram may be ob-tained from the authors on request.
Application
The Raman spectrum of a sample of air at atmo-spheric pressure was recorded in order to illustratethe operation of the system. The 4880-A line (-800mW) of a Carson Model 101 argon ion laser was usedas the incident light source. No special optics or gascells were used in obtaining the spectrum. Lightscattered at 900 to the incident radiation was collect-ed and focused on the entrance slit (r1 cm-') of theSpex 1401 double monochromator, which is a double
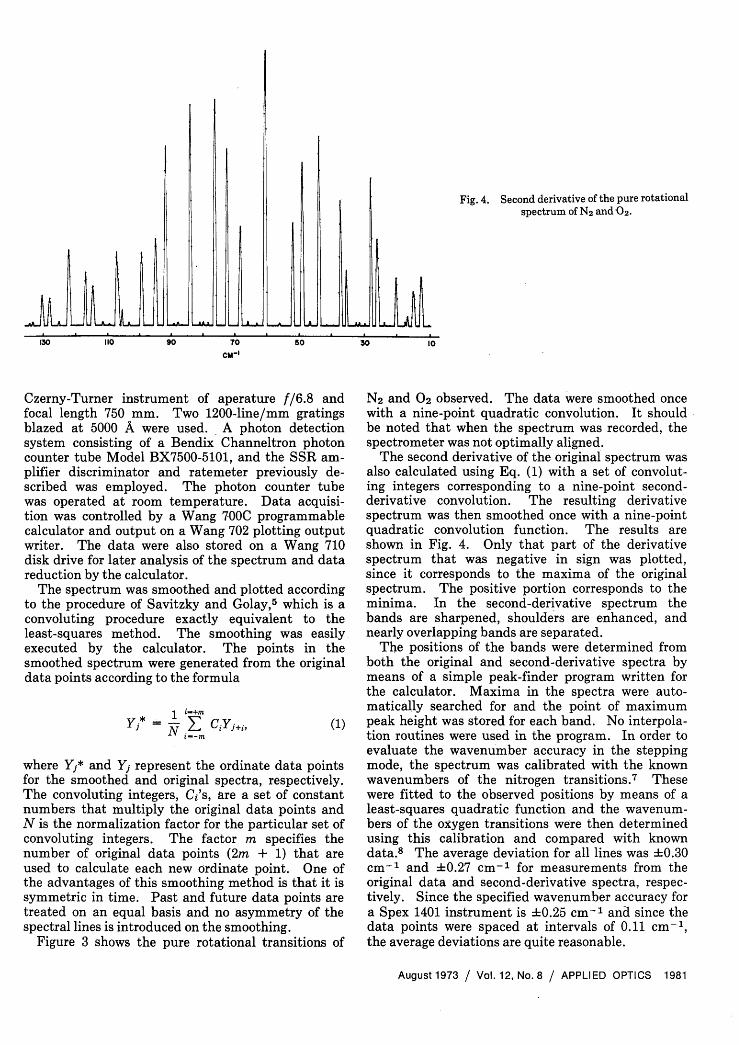
Fig. 4. Second derivative of the pure rotationalspectrum of N2 and-0 2.
10
Czerny-Turner instrument of aperature f/6.8 andfocal length 750 mm. Two 1200-line/mm gratingsblazed at 5000 A were used. A photon detectionsystem consisting of a Bendix Channeltron photoncounter tube Model BX7500-5101, and the SSR am-plifier discriminator and ratemeter previously de-scribed was employed. The photon counter tubewas operated at room temperature. Data acquisi-tion was controlled by a Wang 700C programmablecalculator and output on a Wang 702 plotting outputwriter. The data were also stored on a Wang 710disk drive for later analysis of the spectrum and datareduction by the calculator.
The spectrum was smoothed and plotted accordingto the procedure of Savitzky and Golay,5 which is aconvoluting procedure exactly equivalent to theleast-squares method. The smoothing was easilyexecuted by the calculator. The points in thesmoothed spectrum were generated from the originaldata points according to the formula
- 1 i-+MN E (1)
where Yj* and Yj represent the ordinate data pointsfor the smoothed and original spectra, respectively.The convoluting integers, C's, are a set of constantnumbers that multiply the original data points andN is the normalization factor for the particular set ofconvoluting integers. The factor m specifies thenumber of original data points (2m + 1) that areused to calculate each new ordinate point. One ofthe advantages of this smoothing method is that it issymmetric in time. Past and future data points aretreated on an equal basis and no asymmetry of thespectral lines is introduced on the smoothing.
Figure 3 shows the pure rotational transitions of
N2 and 02 observed. The data were smoothed oncewith a nine-point quadratic convolution. It shouldbe noted that when the spectrum was recorded, thespectrometer was not optimally aligned.
The second derivative of the original spectrum wasalso calculated using Eq. (1) with a set of convolut-ing integers corresponding to a nine-point second-derivative convolution. The resulting derivativespectrum was then smoothed once with a nine-pointquadratic convolution function. The results areshown in Fig. 4. Only that part of the derivativespectrum that was negative in sign was plotted,since it corresponds to the maxima of the originalspectrum. The positive portion corresponds to theminima. In the second-derivative spectrum thebands are sharpened, shoulders are enhanced, andnearly overlapping bands are separated.
The positions of the bands were determined fromboth the original and second-derivative spectra bymeans of a simple peak-finder program written forthe calculator. Maxima in the spectra were auto-matically searched for and the point of maximumpeak height was stored for each band. No interpola-tion routines were used in the program. In order toevaluate the wavenumber accuracy in the steppingmode, the spectrum was calibrated with the knownwavenumbers of the nitrogen transitions. 7 Thesewere fitted to the observed positions by means of aleast-squares quadratic function and the wavenum-bers of the oxygen transitions were then determinedusing this calibration and compared with knowndata.8 The average deviation for all lines was 0.30cm-' and ±0.27 cm-1 for measurements from theoriginal data and second-derivative spectra, respec-tively. Since the specified wavenumber accuracy fora Spex 1401 instrument is 40.25 cm-' and since thedata points were spaced at intervals of 0.11 cm-',the average deviations are quite reasonable.
The results show that the interfacing of a pro-grammable calculator with a Raman instrument pro-vides an inexpensive, sensitive, and accurate systemfor the acquisition of Raman spectral data. Datataken by such a system are in digital form and areeasily manipulated as shown above in such opera-tions as peak finding, smoothing, etc. Finally, thesensitivity of such a system could be enhanced bysignal averaging through on-line computer control.
This work was financially supported by the Na-tional Research Council of Canada.
References1. J. R. Scherer and S. Kint, Appl. Opt. 9, 1615 (1970).2. G. K. Klauminzer, Appl. Opt. 9, 2183 (1970).3. M. P. Klein and G. W. Barton, Rev. Sci. Instrum. 34, 754
(1963).4. R. P. Ernst, Rev. Sci. Instrum. 36, 1689 (1965).5. A. Savitzky and M. J. E. Golay, Anal. Chem. 36, 1627 (1964).6. W. R. Blood Jr., MECL System Design Handbook (Motorola
Semiconductor Products, Inc., Phoenix, Arizona, 1971).7. B. P. Stoicheff, Can. J. Phys. 32, 630 (1954).8. B. P. Stoicheff, in Advances in Spectroscopy, H. W. Thomp-
son, Ed. (Wiley-Interscience, Inc., New York, 1959), Vol. 1, p.110.
TECHNOLOGY UTILIZATION PROGRAM
NOV. 29-30, 1973, SHERATON-CHICAGO HOTEL, CHICAGO, ILLINOISGENERAL CO-CHAIRMEN:WILLIAM C. ZARNSTORFF, Associate Professor of Medicine, Cardio-vascular Research Laboratory, University of Wisconsin MedicalCenterWILLIAM R. HENDEE, Associate Professor of Radiology, Univer-sity of Colorado Medical CenterTECHNICAL CHAIRMAN:PAUL L. CARSON, Assistant Professor of Radiology, University ofColorado Medical Center
The first SPIE Technology Utilization Program on Appli-cation of Optical Instrumentation in Medicine in Novem-ber, 1972 was very well received. Since that meeting,considerable encouragement has been received to developa continuing dialogue among physicians, physicists, engi-neers and manufacturers concerning state-of-the-artdevelopments and applications of optical instrumentationin medicine. This second Technology Utilization Programis in response to that encouragement.
The scope of the first meeting was ambitiously broad andthe second meeting is directed toward identification ofspecific areas for increased depth of discussion. How-ever, one afternoon is dedicated to special topics whichotherwise might be excluded from the three areas identi-fied for in-depth analysis. Four half-day sessions areplanned for the meeting.
PAPERS IN ANY OF THE FOLLOWING AREAS ARE INVITED:* Construction and Performance Evaluation of Image In-tensification Systems * Approaches to Image Storage,Retrieval, Transmission and Reconstruction * ImageEnhancement and Pattern Recognition * Special Topics
SUBMIT 100-200 WORD ABSTRACT AND 100 WORD BIOGRAPHYBY SEPTEMBER 15, 1973. COMPLETE MANUSCRIPTS DUE BYNOVEMBER 1, 1973.'First Serilinar held Noveniber 29-30, 1972, SheratonlBlachstolle lotel,Chicago, Illinois. Proceedings Volume 35.
SPIE CALL FOR PAPERSSEMINAR-IN-DEPTH
AND EQUIPMENT DEMONSTRATION
IIN§TrRLUJMWmTIIO9NON A!1TRfONOAS9IIII*
MARCH 4-6, 1974, RAMADA INN, TUCSON, ARIZONA
CHAIRMAN:DR. LEWIS LARMORE, Office of Naval Research
HONORARY CHAIRMAN:DR. DONALD H. MENZEL, Former Director, Harvard CollegeObservatory
The growing sophistication of astronomical instrumenta-tion demonstrates the need for a second in-depth look atmodern telescopes, auxiliary instruments and data hand-ling techniques. At this Seminar, instrumentation will beconsidered for ground-based, airborne or space astron-omy. Papers are invited in any of the following subjectareas:
* GROUND-BASED TELESCOPES * AIRBORNE AND SPACETELESCOPES * SPECTROGRAPHS * PHOTOMETRIC IN-STRUMENTS AND DETECTORS * CAMERAS FOR GROUND-BASED TELESCOPES * SPACE CAMERAS * SOLAR OB-SERVATIONS * LUNAR OBSERVATIONS * PLANETARYOBSERVATIONS * STELLAR OBSERVATIONS * PHOTO-GRAPHIC DATA PROCESSING * PROCESSING OF DATAFROM SPACE INSTRUMENTS * X-RAY AND ULTRAVIOLETINSTRUMENTATION
The intent of the Seminar is to keep the coverage ofinstrumentation in astronomy as broad as possible.Papers should, however, be limited to means of gatheringor handling data, as opposed to the theories and conclu-sions which might be drawn from new data.
SUBMIT 100-200 WORD ABSTRACT AND 100 WORD BIOGRAPHYBY NOVEMBER 1, 1973. COMPLETE MANUSCRIPTS DUE BYFEBRUARY 1, 1974.
First Seminar held March 13-15, 1972, Ramada Inn, Tucson, Arizona.Proceedings Volume 28.