16
Digital Leak Detector Digital Sound Quality Sensitive Lightweight Easy to use
| Date post: | 11-May-2018 |
| Category: |
Documents |
| Upload: | nguyenxuyen |
| View: | 219 times |
| Download: | 0 times |

Digital Leak Detector
Digital Sound QualitySensitiveLightweightEasy to use

FeaturesDigital Audio Processor
• Dynamic range compression - accentuates leak sounds,reduces loud noises
• Hears leaks where other instruments cannot• Precise digital filters block ambient noise• Automatic rejection of electrical interference (60dB)• Lightweight (< 1 lb.)• Wearable, strap or belt clip
High-Resolution, Waterproof Universal Sensor• Contact microphone for meters and fittings• Ground listening plate with quick-release sensor• Magnetic base for hydrants and valves
Smart Volume Limiting• Continuous, automatic volume protection• Suppresses clicks, pops and sudden loud sounds
User Interface ButtonsLISTEN: Click on/off or press-and-hold to listenVOLUME: 45 dB range in 29 stepsFILTER: Five digital filters for:
• Ground (Gnd): Hard surfaces, soil, plastic pipe• Service (SEr): Service pipes• Contact (Con): Valve, hydrant, service connections• Survey (SUr): Surveying• Open (OPn): Full listening range
Technical Specifications
Automatic Leak Location• Leak Index Score from 0 to 999 provides a
visual determination when you are over the leak
Digital Audio Processor Unit:Frequency range: 30 - 4,000HzPower supply: 2 AA alkaline batteriesBattery life: > 12.5 hours continuous listeningDisplay: LCDProtection: IP54, weatherproof, splash-proofWeight: 15 ounces (408.2 grams)Dimensions: 5” x 3.5” x 1.5”
(127mm x 88.9mm x 38.1mm)
Universal Sensor:Type: High-resolution piezo-ceramicSensitivity: 20V/gResolution: 0.05μg/ HzProtection: IP68, waterproof, fully submersibleShock proof: 6,000g
Ground Microphone Unit:Dimensions: Height - 34”; Disk - 4.5” diameter
(h = 860mm; d = 114mm)Weight: 2 lbs. (910g) with sensor attachedMaterials: Rod - anodized aluminum
Disk - stainless steel
2 Clock Tower Place, Ste 425Maynard, MA 01754 USA800.517.4737www.flowmetrix.com
Accessories:Carrying Case: Rugged, light-weightProbe: Stainless steel; connects to sensor

ZCorr: Multi-Sensor Overnight Leak Survey and Pinpointing In One Step
The ZCorr system is a new, systematic approach to pipeline surveying. ZCorr digital correlating loggers offer significant advantages over listening loggers by detecting and pinpointing multiple leaks in a zone overnight. ZCorr’s technical advances make leak surveying viable for water utilities at less effort and cost.
The ZCorr Concept ZCorr is a software-driven approach that allows a distribution system leak survey to be efficiently directed from the office, integrating leak detection data, maps, and database tools to: 1. Plan the survey and print deployment orders 2. Pinpoint leaks and print repair reports 3. Track survey progress and performance The ZCorr survey has 3 steps: DEPLOY, RETRIEVE and ANALYZE. Each step can be performed either in the office or in the field.
1. Deploy Eight ZCorr loggers are held in a compact Docking Station, which is connected to a PC. The docking station communicates with the ZCorr logger electronically, without cables. The PC software user:
• Sets the synchronized recording times (by
default, 3 AM, 3:30 AM, and 4 AM) • Places the loggers on a map image • Optionally prints a deployment work order
The ZCorr loggers are then deployed in the field in readiness for the nighttime recording.
eployment is typically in underground valve s.
2. Retrieve During the night the
ser-
then
d
3. Analyze a is downloaded from the ZCorr
irs
e
How ZCorr Loggers Work
n the
processing, and PC software analysis.
Dchambers, on fire hydrants, or other pipe fitting
synchronized ZCorr loggers record at the uprogrammed times. Recorded vibration samples are saved inmemory. The loggersenter low-power mode until they are reconnectewith the docking station.
The recorded datloggers, via the docking station, using the PC software. Eight loggers produce 28 distinct pafor correlation analysis. ZCorr analysis finds all significant leak noise correlations automatically. Results are ranked by Correlation Score (0 – 100), scored by the determination of leakage versus usage, correlation signal quality, and thsmallest estimated error in pinpointed location ofany leak(s).
The ZCorr system has several patented1 innovations, described in the next sections, iareas of synchronization (timing), data recording,
1 U.S. Patent #: 6,567,006
1

Real-Time Clock At the heart of the ZCorr logger is an ultra low-
pensated Real-Time s used to synchronize
a
er
gger is fitted with a low-noise celeration sensor, known as an ccelerometers sense vibration
nd
st, gnals are sensed from pipes as a varying
i.e.
real-
.
with ustic loggers use
etween 8 and 12 bits, allowing a digitizing resolution of between 1 part in 256 and 4096.
0. A r
saved in low-power memory. The ogrammed to employ es in different
rials
are all
ia the ZCorr
king station. A roof connector
e on,
al
a
ALFA Optimal Correlation nced leak
FA, or
ustic nd
, ern, and is
the
d ue
power, temperature-comClock (RTC). The RTC iZCorr loggers via the docking station. Over an 18-hour period, between deployment and retrieval for an overnight recording, an ordinary wrist watch would drift in time by up to 50 partsper million (ppm), i.e. about 3 seconds. Incorrelation analysis this could lead to errors of 10,000 feet or more in the pinpointed location of a leak. Using a combination of ultra-low powelectronic and software techniques, timing driftsare reduced by a factor of 2,500 times. The patented method of timing compensation restricts errors in leak location to typically less than 3 feet.
Recording The ZCorr lopiezo-ceramic acaccelerometer. Aand convert it to a tiny electrical charge. Sensitive conditioning electronics amplify and filter this electrical response. As with audio andother amplifiers, the accuracy, precision, aintrinsic noise level of the amplifier is more important to the recording quality than the gain or volume level, per se. In an accelerometer, intrinsic noise is often defined by resolution and gain is referred to as sensitivity. In ZCorr, a sensitivity of 1V/g at a resolution of 0.025 µg /√Hz is followed by additional electronic gain. The earth’s gravitational field is defined as having a constant acceleration of 1 g. In contraleak sipattern of acceleration as small as microg’s,millionths of g’s. These are imperceptible levels of vibration to humans and require very low-noise, precise electronic amplification and filtering to preserve the leak signal. In addition, in a correlating logger the sensor is positionedvery close to the logger’s electronics. Mosttime correlators can advantageously separate the sensor and recording electronics by a long cableTo overcome this potential interference problem, the ZCorr logger uses a custom-designed discrete amplifier and filter circuit, integrated very closely with the sensor. Digitizing of the analog signal is performeda 23-bit ADC. Most acob
Vibration signals on pipes have a useful dynamic range of up to 80 dB, i.e. one part in 10,0023-bit ADC, with a resolution of 1 part in ove500,000, is therefore adequate and necessary topreserve the fine detail of pipe vibrations and the leak signal.
Data Processing After digitizing, the pipe vibration signal is encoded andZCorr data processor is prspecial encoding techniqusituations. For example, different pipe mate(plastic, cement or metal), large-diameter pipes, and long distances between loggers (with the presumption of very small leak signals), situations where the encoding is set to enhance the leak acoustic signature.
Data Downloading Data is downloaded to aPC vdocwaterpfacilitates a high-speed data link between thlogger, docking statiand PC. This is the finlink in the chain of high resolution recording, processing, and data transfer for correlation analysis.
lysis ZCorr Data An
Flow Metrix has developed an advanoise correlation method called ALAutomatic Leak Frequency Analysis. ALFA works by identifying a leak acosignature in 2-logger recordings. The leak soumay be very different between the 2 loggersboth in sound level and frequency pattoften not audible or otherwise discernible to human user. The ALFA process identifies the acoustic signature of the leak sound at each logger and designs an optimal correlation filter that is unique for that 2-logger recording. The ALFA filter concentrates on the leak sounds andiscards other vibrations, for example those dto normal flow, transient usage, and environmental sounds such as traffic.
2

ALFA is particularly useful with large-diampipes, multiple leaks, and noisy environmen
eter ts.
he graphic above shows a ZCorr correlation
ore leaks may readily produce a total of 28 of
s,
ith
s, which only store
gger
me of the night. Each logger is represented by
rted from the utility’s m (GIS) and interface
FinanSurve
– n. The example
4 million gallons 15%
tor t he a recoverable
le
tire
00, cost of $13,200 plus the
ears e
Tresult with 6 correlation peaks, identifying 6 leaks in and outside a 530-foot recording span. Another benefit of ALFA is enhanced productivity. Recordings in a zone with one or mcorrelations, one for every possible pairloggers. ALFA produces 28 optimal correlationeach ranked by Correlation Score, without theneed for time-consuming experimentation wmanual filter settings.
Enhanced Listening Analysis Unlike listening loggerstatistics, ZCorr stores actual CD quality recorded nighttime sound.
A Leak Index (a 0 – 100 ranking) for each loshows the sound levels present at the quietest tia bar (red = abnormal leak index; green = normal). The listening and sound analysis provide additional capabilities that can supplement the correlation information.
Data Management The ZCorr PC software includes:
1. Electronic maps conveGeographic Information Systeintegrated into the ZCorr user
2. An integrated Data Manager that: • Stores an unlimited number of ZCorr
recordings in a database tions,• Provides typical database func
such as searching and sorting • Can export recording information and
results to other database and GIS software programs
cial Benefits of a Leak y Program
The following Financial Benefit Analysis is typical for a small town (population 20,000 50,000) or a network regiodistribution system has: • 100 miles of mains pipe • 10,000 service connections Daily production of •• Unaccounted for water of Using the Flow Metrix Water Loss Calcula
2 alf of tsof ware program , approximately hn ccounted for water is likely to beu
leakage (the remainder is due to meter error andun-metered or unauthorized usage). Recoverableakage is expected to be 312,000 gallons per day, with 4 mains leaks at 30 gallons per minute (gpm) and 15 service line leaks at 6.5 gpm. Eight ZCorr loggers deployed overnight at spacings of 1,000 feet will survey an estimated 2
miles of pipe. This pipe mileage includes½lateral mains and services that convey leak sounds to the loggers. The operational expense is calculated for one leak detection crew for 3 hours, at a total cost of $100 per hour. The endistribution system is surveyed in 44 nights. The value of lost water is taken to be $1.50 per thousand gallons. The chart below shows a benefit of over $170,000 per year, with a total cost of $17,7.e. an annual crewi
ZCorr equipment cost amortized over 5 y($4,500). The operational expense outweighs thcapital expense, despite the fact that ZCorr is significantly more productive than other leak detection methods. The financial benefit of recovered leakage pays for the entire leak
2 www.flowmetrix.com
3

4
0
40
80
120
160
200
AmortizedEquipment
Cost
Crew Cost Total Cost Benefit
Annual Costs and Savings ($000's)
e
ersus Other Logger
orrelating loggers such as ZCorr offer gnificant advantages over listening loggers:
. A single overnight correlation study of 3 recordings almost completely eliminates any false positive detection of leak noise.
. A listening logger can only register leak noise that is close to or louder than background vibration levels. In contrast, the ZCorr correlation process is capable of
hat is eter
tion process
The bar graph above compares the capital and operational expense of ZCorr (green bars) and listening logger (blue bars) survey programs. The following assumptions were made: 1. The listening loggers are used for 3 nights at
each location
2. re
) positive detections.
et long-running service
- and
spectran s oper quipment cost. The
lecorr s:
detection program and generates a considerablsurplus to invest in other operations and maintenance activities.
Productivity Comparison: Corr VZ
Technologies Csi 1
2
detecting and pinpointing leak noise tinaudible and over a hundred times quithan background noise.
3. The ZCorr correlasimultaneously detects and pinpointsmultiple leaks between any 2 loggers.
Three times as many listening loggers aneeded at 1/3 the cost of ZCorr loggers
3. Two thirds of leakage is successfully recovered using real-time correlation to investigate true (30%) and false (70%
4. One third of recoverable leakage is missed; typically very quiline leaks.
The correlative domain is more sensitive toific for - leak noise. This advantage slates into finding more leakage with lesational effort and less e
tab below shows a comparison of ZCorr elating loggers and simple listening logger
Parameter ZCorr Listening Logger
Comments
Inter-logger spacing
800 – 1,500 feet
Up to 500 feet
ZCorr loggers have wider coverage
Duration of deployment
Overnight 1 – 7 nights
ZCorr loggers work overnight
False positive rate of leak detection
L ess than5%
67 – 90% Listening loggers have a high false positive rate
Sensitivity to leak
Very high Moderate
noise
The correlation process will detect & pinpoint inaudible leak sounds
Operational effort
About 20 minutes
per logger
20 minutes per logger
+ leak
verification +
leak pinpointing
effort
It is time-consuming to rule out leakage when the majority of indications are false positives
SummaryThe ZCorr correlating log isoperationally viable for most utiover 2,000 service connectperformance and is cost-e m
her leak survey methods.
ger system
water lities with superior pared to
ions. It hasffective, co
ot
0
40
80
120
160
200
AmortizedEquipment
Cost
Crew Cost Total Cost B
ZCorr Versus Listening Loggers
Annual Costs and Savings ($000's)
enefit

EquipmentDDLD
Flow Metrix is most proud of itsapplications and technical supportorganization - unequaled in the industrytoday. Customers may contact FlowMetrix Support via our toll-free number,fax or e-mail for assistance. Problemresolution begins immediately.
Support
AnalysisFlow Metrix’s advanced leakdetection software allowsunprecedented ease-of-use: leakdetection at the press of a button inthe field to analysis of thedistribution system in the office.Data from our products can be sentelectronically to Flow Metrix forcomprehensive analysis. You willreceive the analysis results and reportvia email.
Flow Metrix's professional trainingteam will explain the leak surveyplan and method to utilitypersonnel, teach them to use theequipment, and assist inimplementing the plan at allstages.
Training
Flow Metrix’s Digital Correlating Loggers givebreakthrough price/ performance in detectingand pinpointing leaks over several miles of waterdistribution system pipe. Their patentedtechnology makes highly synchronized soundrecordings overnight from valves. After daytimeretrieval of the loggers, Flow Metrix’s advancedsignal processing software automaticallypinpoints any leak(s) present. ZCorr technologyis patent-protected (U.S. Patent No. 6,567,006).
These light-activated digital soundloggers economically survey a widearea of a distribution system forleakage. They rule out leakage inmost areas, allowing leakpinpointing efforts to beproductively concentrated in areaswhere leaks are probable.
The third generation of the DigiCorr -the original true digital correlator.DigiCorr III uses state-of-the-art soundprocessing and high resolution digitalradio links to find leaks other correlatorsmiss. DigiCorr technology is patent-protected (U.S. Patent No. 5,974,862).
MLOG is a network of intelligent, leak detecting sensors whichmonitors the entire water distribution system 365 days a year.MLOG is the first affordable and comprehensive solution tominimizing water losses in a distribution system. Leak detectiondata is collected automatically by radio from throughout thedistribution system (optionally as part of the meter reading process).With many advanced software features, the patented MLOG systemcan detect and localize leaks and direct pinpointing, repair andremediation efforts (U.S. Patent No. 6,957,157).
DigiCorr III
ZCorr
n lUnilog
ogMlog
DLD is the first true digital leak detector in theindustry. It is light-weight and easy to use. Usingdynamic range compression and digital precision,DLD eaily identifies leaks that are undectable withother leak detectors.
F low Metrix develops cutting edge products which are the framework for trueenterprise solutions to water loss management. Our products are designed to fit thespecific needs of every type of utility and its budget. All Flow Metrix products arepatented or patent pending.
Our enterprise solutions have been designed to ensure success in reducing UnaccountedFor Water and maintaining the integrity of your distribution system infrastructure andinclude the following:
•Planning - We help you design a complete leakage management plan,including digital map integration
•Training - We train utility personnel to implement your plan efficiently andeffectively
•Digital Leak Detection Equipment - We help you determine whichequipment you need to make your plan work
•Analysis - We support you through the analysis stage by helping youunderstand your results and by providing a comprehensive analysis service
•Support - Flow Metrix Support is always available, offering assistance eitheron-site or via telephone, fax or email
○
○
○
○
○
○
○
○
○
○
○
○
○
○
○
○
○
○
○
○
○
○
○
○
○
○
○
○
○
○
○
○
○
○
○
○
○
○
○
○
○
○
○
○
○
○
○
○
○
○
○
○
○
○
○
○
○
○
○
○
○
○
○
○
○
○
○
○
○
○
○
○
○
○
○
○
○
○
○
○
○
○
○
○
○
○

More Information:
Flow Metrix, Inc.One Clock Tower Place
Suite 100Maynard, MA 01754 USA
Toll Free: 800.517.4737Tel: 978.897.2033Fax: 978.897.1292
Flow Metrix is a growing,dynamic, and innovativecompany, providingtechnologically superior leakdetection solutions to thewater industry whilemaintaining a company-widededication to building positiveand energetic relationshipswith our customers.
Enterprise Solutions forWater Loss Management
WHITE PAPER
DigiCorr: The Original True-Digital Correlator Water demand is now doubling every 20 years and it is predicted that approximately 60%
of the world’s population will be short of water by 2025. With losses from water distribution systems varying from 10% to 60% (dependant upon geography, measurement
method and politics) it is widely recognized that these losses are not sustainable. This paper identifies the important role of the leak noise correlator for modern leak location in water pipes. It sets out the major innovations and advantages of DigiCorr, compared to
the older technologies in other leak noise correlators.
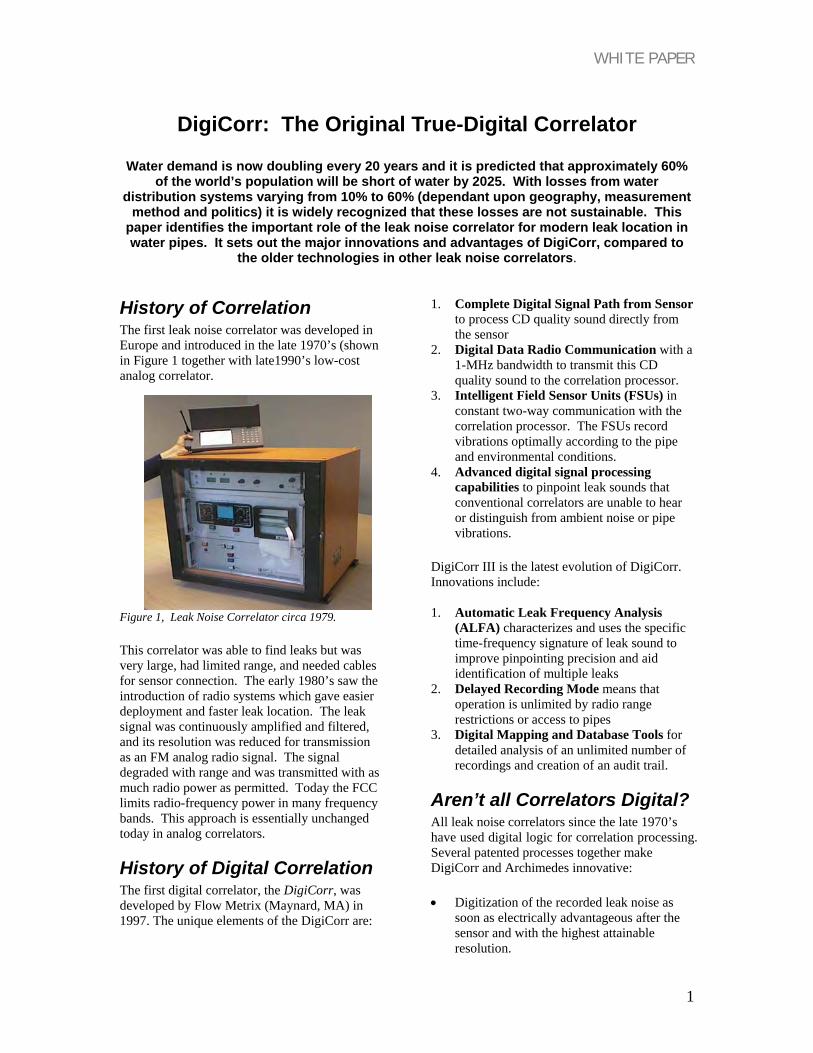
History of Correlation The first leak noise correlator was developed in Europe and introduced in the late 1970’s (shown in Figure 1 together with late1990’s low-cost nalog correlator. a
Figure 1, Leak Noise Correlator circa 1979. This correlator was able to find leaks but was very large, had limited range, and needed cables for sensor connection. The early 1980’s saw the introduction of radio systems which gave easier deployment and faster leak location. The leak signal was continuously amplified and filtered, and its resolution was reduced for transmission as an FM analog radio signal. The signal degraded with range and was transmitted with as much radio power as permitted. Today the FCC limits radio-frequency power in many frequency bands. This approach is essentially unchanged today in analog correlators.
History of Digital Correlation The first digital correlator, the DigiCorr, was developed by Flow Metrix (Maynard, MA) in 1997. The unique elements of the DigiCorr are:
1. Complete Digital Signal Path from Sensor
to process CD quality sound directly from the sensor
2. Digital Data Radio Communication with a 1-MHz bandwidth to transmit this CD quality sound to the correlation processor.
3. Intelligent Field Sensor Units (FSUs) in constant two-way communication with the correlation processor. The FSUs record vibrations optimally according to the pipe and environmental conditions.
4. Advanced digital signal processing capabilities to pinpoint leak sounds that conventional correlators are unable to hear or distinguish from ambient noise or pipe vibrations.
DigiCorr III is the latest evolution of DigiCorr. Innovations include: 1. Automatic Leak Frequency Analysis
(ALFA) characterizes and uses the specific time-frequency signature of leak sound to improve pinpointing precision and aid identification of multiple leaks
2. Delayed Recording Mode means that operation is unlimited by radio range restrictions or access to pipes
3. Digital Mapping and Database Tools for detailed analysis of an unlimited number of recordings and creation of an audit trail.
Aren’t all Correlators Digital? All leak noise correlators since the late 1970’s have used digital logic for correlation processing. Several patented processes together make DigiCorr and Archimedes innovative: • Digitization of the recorded leak noise as
soon as electrically advantageous after the sensor and with the highest attainable resolution.
1

WHITE PAPER
• Transmission with CD sound quality through the digital radio system to the correlation processing stage, providing a high resolution leak signal which can be pinpointed where conventional correlators sometimes fail.
• Advanced PC-based digital signal processing to analyze data more effectively than older, expensive microprocessor-based units.
Figure 2. The DigiCorr III Field Sensor Unit (FSU), with intelligent processing and 2-way digital radio communication.
Leak Noise Resolution The idea of a ‘digital data path’ has been uniquely introduced in the DigiCorr. This digital data path is at the core of the patented DigiCorr architecture1. The sensor, a micro-machined accelerometer, is a purely analog device which transduces the analog pipe vibration into an analog charge. An ultra low-noise charge amplifier converts the flow of charge to a signal voltage suitable for digitizing. The sensor is hermetically sealed in a stainless steel vessel designed to isolate this circuitry from the environment both physically, electrically, and magnetically. Alternatively, a hydrophone sensor can be used, where suitable fittings allow, providing direct detection of the acoustic energy from the water. A low-noise, electrically
1 US Patent No. 5,974,862, Lander et al., “Method for detecting leaks in pipelines”. Patent pending in other territories.
shielded cable brings power into the sensor from the FSU and conveys the signal voltage to the digitizer at a necessary distance within the FSU.
Why Not Digitize in the Sensor? To preserve the fidelity of the signal voltage it is important to isolate sources of interference physically from the sensor and charge amplifier. The inevitable interference sources encountered include: 1. Noise from the digital power supplies
needed for the digitizer and processor. This noise is kept physically remote from the sensor by the cable. The low-noise cable appears ‘invisible’ to the digitizer because the impedance of the cable is many millions of times lower than the input impedance of the digitizer.
2. Electromagnetic (’60-Hz’) interference from power lines. This interference is removed digitally in the PC software, eliminating the need for leak signal distorting electronic filters.
3. Interference caused by movement of the cable, due to wind or environmental vibrations. This low-frequency interference is picked up by the sensor in all correlators. When transmitted it can significantly limit the resolution of the leak noise. It is removed in DigiCorr by software digital signal processing, both in the FSU and the PC software. Artifact due to the ‘tribo-electric effect’ (caused by vibration of the charge amplifier itself), is avoided altogether in DigiCorr & Archimedes by selection of materials.
The Intelligent Digital FSU Once the signal voltage reaches the FSU it is immediately digitized without any filtering. The variations in amplitude of the acoustic signal depend upon the noise in the pipe, particularly the low-frequency components. This range is very wide (on the order of 1:10,000). Conventional correlators can transmit a signal range of the order of only 1:100 and therefore must significantly reduce the resolution of the leak noise. DigiCorr uses software programmable-gain and a 16-bit Analog to Digital Converter (ADC), achieving a useful signal range of over 1:500,000. DigiCorr is therefore able to capture the signal from the pipe at any level and to convert it to a digital representation with better than CD quality.
2

WHITE PAPER
DigiCorr’s digital data radios are inherently 2-way devices, putting the FSUs in constant communication with the correlation processor (PC software). This permits the correlation processor to: 1. Manage power in the FSUs remotely 2. Program the FSU with the recording
parameters that best suit the environment (large-diameter or plastic pipes, long range, etc.)
3. Implement unique features, such as remote access and delayed recording, under user control
Unlike conventional correlators, DigiCorr can optimize its recording protocol (sampling rate, data resolution, transmission coding, and other parameters) in every recording. The recording protocol is set transparently to the user, in response to commands from the PC software and digital processing performed in the FSU.
Digital Data Radio Communication DigiCorr uses sophisticated frequency-hopping spread spectrum (FHSS), digital radios, which operate at 2.4GHz. These radios are sometimes called “software” radios because of their ability to transmit large amounts of digital data intelligently. Conventional Frequency Modulated (FM) radios transmit an analog representation of the vibration sensed from the pipe. The sound quality deteriorates with distance transmitted and is typically poor (analogous to a 78-rpm record) upon reception at the base station. If another transmitter is present at the same frequency then the transmission will be blocked (jammed). FM radios in leak noise correlators typically transmit at 433 - 470 MHz, with an available bandwidth of 25 kHz (or 10 kbps) and require product approval in most parts of the world. In contrast, FHSS digital radios utilize a bandwidth of 1 MHz (or typically 256 kbps). This makes it possible for DigiCorr to transmit high resolution vibrations sensed from the pipe. The transmission is a true digital signal (approximately equal to or better than CD quality). Within certain power and antenna limits DigiCorr can be programmed for license-free use worldwide.
If another transmitter is present, frequency hopping radios will automatically switch to another frequency channel to avoid jamming. This feature is becoming particularly important with the proliferation of wireless devices. If the radio-frequency environment is noisy (poor reception, other transmitters, etc.) DigiCorr will automatically re-transmit any data from the FSUs that was not received by the base station.
ALFA – Automatic Leak Frequency Analysis Introduction DigiCorr has introduced a powerful new software tool – ALFA. Conventional leak noise correlators are limited by: 1. Their need for manual selection of discrete
filters at the base station. 2. Disturbance of the correlation from flow
noise, usage, traffic and other environmental noise
3. Loss of the leak noise correlation due to limited recording resolution
The need for discrete filters has significantly limited the usefulness of conventional leak noise correlators. A skilled operator must sometimes experiment with a selection of filters either to detect a leak or to pinpoint the leak accurately. Occasionally a leak is missed (does not correlate) because no single (parametric) linear bandpass filter is able to isolate a coherent leak sound at both sensors. This process can be time-consuming for the user and requires their attention after each recording. Multiple leaks present in one recording can be missed.
How ALFA Works DigiCorr uses a system of Automatic Leak Frequency Analysis (ALFA) to detect and pinpoint leak sounds with no user intervention. ALFA is a digital signal process capable of isolating (multiple) leak sounds individually at either sensor and statistically optimizing their correlation at each possible value of time delay. It can be thought of as constantly scanning the data arriving at each sensor, looking for energy that is coherent in time and frequency between the two sensors. Unlike conventional filters, ALFA is able to extract leak sounds from the recording even when much greater noise may be present at the same frequencies. It is able to
3
WHITE PAPER
collect leak sound energy from many different frequencies – not just a single frequency band - and to discriminate among multiple sources of leak sounds. ALFA tracks the spectral patterns of leak sound over time to ‘tune in’ to the leak sound even when other noise dominates the recording. Once ALFA has registered the characteristics of the leak sound, the results of the correlation process will be significantly less susceptible to disruption by ambient noise, such as traffic, or changing flow noise due to usage variations. A key aspect of ALFA is that this tracking and characterization of leak sounds is performed uniquely and optimized in every recording.
The Benefits of ALFA With ALFA an accurate registration and pinpointing of each leak sound occurs automatically with every recording. This includes multiple leak sounds within a correlation span and leak sounds that would have been lost in analog FM radio transmission). When no leak is present no correlation occurs. It is not necessary to re-record with many different filter settings to ensure that ‘no leak’ is truly present.
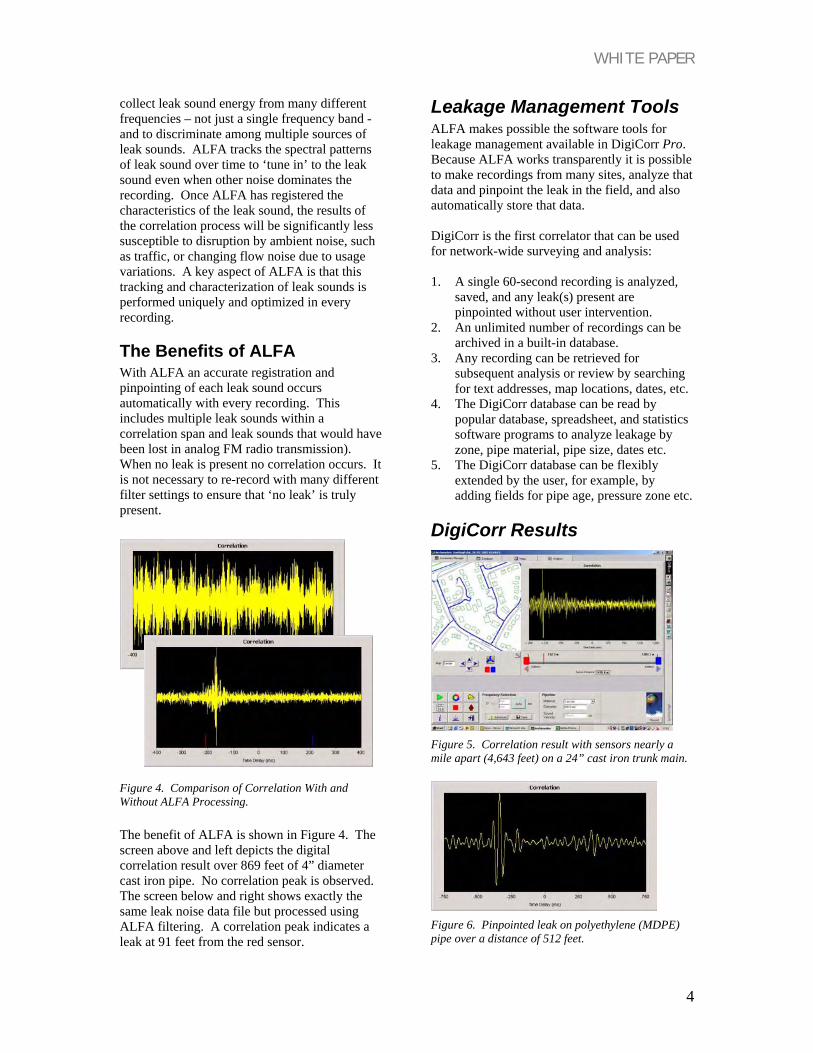
Figure 4. Comparison of Correlation With and Without ALFA Processing. The benefit of ALFA is shown in Figure 4. The screen above and left depicts the digital correlation result over 869 feet of 4” diameter cast iron pipe. No correlation peak is observed. The screen below and right shows exactly the same leak noise data file but processed using ALFA filtering. A correlation peak indicates a leak at 91 feet from the red sensor.
Leakage Management Tools ALFA makes possible the software tools for leakage management available in DigiCorr Pro. Because ALFA works transparently it is possible to make recordings from many sites, analyze that data and pinpoint the leak in the field, and also automatically store that data. DigiCorr is the first correlator that can be used for network-wide surveying and analysis: 1. A single 60-second recording is analyzed,
saved, and any leak(s) present are pinpointed without user intervention.
2. An unlimited number of recordings can be archived in a built-in database.
3. Any recording can be retrieved for subsequent analysis or review by searching for text addresses, map locations, dates, etc.
4. The DigiCorr database can be read by popular database, spreadsheet, and statistics software programs to analyze leakage by zone, pipe material, pipe size, dates etc.
5. The DigiCorr database can be flexibly extended by the user, for example, by adding fields for pipe age, pressure zone etc.
DigiCorr Results
Figure 5. Correlation result with sensors nearly a mile apart (4,643 feet) on a 24” cast iron trunk main.
Figure 6. Pinpointed leak on polyethylene (MDPE) pipe over a distance of 512 feet.
4

MLOG: Comprehensive Pipeline Integrity Management For Water Distribution Systems
Water loss from pipelines impacts ecological and infrastructure integrity. MLOG is the first proactive permanent tool for continuous assessment of pipeline integrity. An enterprise solution, MLOG enables water utilities to prevent water loss and manage pipeline integrity in a sustainable and affordable manner.
Water Distribution Systems Water distribution systems in the U.S. typically draw water from surface or underground sources. Water is treated and pumped into a network of transmission, distribution, and service pipes.
This buried infrastructure is documented by Geographic Information Systems (GIS). Pipelines are currently maintained by excavation and infrequent acoustic surveys – little changed in 150 years.
The U.S. Environmental Protection Agency estimates that up to $200 billion will be required by 2025 to maintain and rehabilitate the aging pipeline infrastructure. The MLOG system addresses a pressing need for monitoring pipeline integrity automatically, 365 days a year.
Water Losses Breaks in transmission and distribution pipes, with diameters ranging of 2 to 96 inches, may occur randomly due to corrosion and stress or because of third party damage or ground movement. Mains breaks have a tendency to occur on cold Winter nights, when the pipe is weakest and the static pressure is maximal. The mains break below spilled over 1 million gallons of water in 48 hours, at a rate of 400 gallons per minute (gpm).
Perhaps surprisingly, such mains breaks typically account for less than 1% of water produced annually. A chronic service line leak of 7 gpm will lose more water every 90 days and will typically run undetected for several years. One in approximately every 600 – 1,000 services will fail every 12 months1, due to corrosion or stress. Losses from long-running pipeline leaks, the majority in smaller service pipes, typically account for 5 – 15% of total water produced. These leaks often do not propagate a strong acoustic signal during the daytime since operating pressures (and therefore sound levels) are reduced, flow thru the leak is laminar, and usage flows on the mains masks the audible leak sound energy. As a result long-running leakage – which forms the core of water loss - is often difficult to detect during daytime acoustic surveys.
Economic Cost of Lost Water The amount of lost water in a distribution system can generally be predicted using some simple assumptions and readily available operating data2. Service line leakage predominates, typically accounting for more than 70% of total water lost. Breaks in mains tend to occur in particular areas related to pipe types and diurnal pressure variations3. The cost of pipeline integrity failures in water distribution systems include: • Production / treatment cost of lost water • Wholesale or retail value of lost water • Damage to buried infrastructure (power,
communications etc.) caused by pipeline breaks • Capital and interest expense invested in surplus
production facilities • Intangible costs from depletion of water
resources, water scarcity, and hurdles to economic development
1 See www.flowmetrix.com and www.iwahq.org.uk 2 Flow Metrix has a simple Water Loss Calculator software program which can be used by any water utility with over 5,000 service connections. 3 See references in Note 1 above.
1

There is a tendency to underestimate the true cost of pipeline integrity failures by considering only the immediate operational cost, i.e. production / treatment expenses.
The MLOG Concept The MLOG sensor is a low-cost, battery-powered sensor, permanently installed near a water service meter. The sensor is waterproof and can be installed indoors or in outdoor meter pits.
MLOG sensors are installed by field crews, typically on every 10th water service, or about every 500 feet of water mains. An installation plan is developed within the MLOG software program from a graphical mapping interface.
Installation can advantageously be performed on the same schedule as installation of meter or Automatic Meter Reading (AMR) equipment. Once installed the MLOG sensor is maintenance-free, with a 15-year battery life.
MLOG Analysis Every night each MLOG sensor records vibrations over a period of 4 hours. The recordings are processed to characterize the evolving nighttime sound patterns over days and months. The processed sound patterns are stored in memory and transmitted by radio on demand. MLOG PC software analyzes all available data from the entire distribution system and assigns each MLOG sensor a Leak Status:
The MLOG software provides tools for:
No leak present Possible leak Probable leak No data available
• Visualizing leak locations on water distribution
system maps • Ranking all MLOG sensors by leak status and
other factors • Printed and electronic reports
Acoustic Leak Index™ The Leak Index is the signal processing heart of the MLOG system. It is a number from 0 to 100, indicating the likelihood of a leak being present in the vicinity of each MLOG sensor. The MLOG analysis considers many factors in computing leak index: 1. Historical sound patterns at each sensor. 2. Groups of MLOG sensors, with unusual or
changing activity. A group may be defined by
2

geography, particular types of pipe, or other user-defined characteristics.
3. Information from leaks discovered previously. The MLOG software is able to refine the definition of a leak acoustic signature, improving the accuracy of leak identification, size & type.
he leak index for every MLOG sensor in the network
ne particular innovation of the MLOG system is the
al
ver
MLOG Color Map™ ts the leak index over a
Tcan be ranked to show locations with the greatest likelihood of leakage. Osystem-wide, adaptive approach to characterizing leak sounds. The MLOG sensor uses patented signprocessing techniques4 to model the vibration patterns present in its vicinity and track them otime.
The MLOG color map™ plogeographical area, superimposing a solid color map from blue (low leak index) to red (high leak index) on a utility GIS map.
the MLOG Color Map above, 2 (red) areas of
k noise
learn
Inleakage are discerned. This image guides the pinpointing crews to deploy Flow Metrix’s leacorrelating tools to verify 2 or more leaks. Subsequent feedback from the detection andpinpointing process helps the MLOG softwareto identify leaks more effectively. Printed reports
peed
e n
LOG Data Collection leak detecting collection of
radio network, reading MLOG sensors every few
• ty personnel, reading MLOG sensors
Connecting MLOG Sensors to an
ey utility meter readings to a
by le;
seamlessly to different MR units by emulating a register-encoded water
elivered effortlessly to the utility desktop every day
MLOG s omplementary data to the
eter data: the meter registers billing revenues while 4 US Patent: Tracking vibrations in a pipeline network, publication date and patent number pending
and MOG color maps sthe leak pinpointing and verification process. Electronic reports allow thutility to add informatioabout non-revenue water andpipeline integrity to GIS.
MA key feature of the MLOG automaticsystem is the transparent and effortlessdata from MLOG sensors distributed throughout the water distribution system. MLOG transmits leak detection data to a central computer in one of 2 ways: • Via AMR, typically with a fixed installation
hours With a handheld MLOG radio controller carried by utilievery 30-60 days
AMR Network AMR networks are proprietary wireless data networks which convcentral computer. Fixed installation networkstypically read meters every few hours, while drive-systems read meters on a data collection scheduusually every 30 – 90 days. The MLOG sensor interfaces Ameter. In some cases the MLOG sensor can connect to the same AMR port as the meter, transferring its data before the meter has been read. This allows the MLOG sensor to be retrofitted to an existing AMR unit. A few drive-by AMR systems are capable of receiving up to 30 days of MLOG sensor data. AMRdata from MLOG sensors is separated from the billing data by software, prior to being analyzed in the MLOG PC software. In general, fixed installation AMR is a superior means of reading MLOG sensor data because:
• Leak information is d
• A response time to new leaks of less than 24 hours is typical
ensors provide cm
3

0
500
1000
1500
2000
2500
3000
3500
Cap Ex Op Ex Repair Total Cost Benefit
Annual Cost / Benefit ($000's)
MLOG data provides the means indirectly to measuand recover non-revenue water.
Collecting Data From M
re
LOG Sensors
ly downloads leak
a
unicates with the MLOG sensor w ess protocol, operating
.
ces a number of important choices. The first is the
ut
nt
e-offs involved in picking the equency of operation. These include cost, range,
at operates in the equency band 902 – 928 MHz. It is frequency-
,
With a Radio Controller The MLOG radio controller automaticalinformation when brought near an MLOG sensor. The portable controller is batterypowered and can store data from over 4,000 sensors. Datis then transferred to a PC through a USB port.
The controller commusing a sophisticated irellicense-free in the U.S. under FCC rules, part 15.2475
MLOG is an intelligent (software programmable), short-range radio device, designed to minimize its radio emissions and power consumption and to maximize speed and reliability of communication. The designer of wireless instruments for utilities fafrequency of operation, ranging from 300 to 2,400MHz. In general devices that use lower frequencies (up to 500 MHz) have longer range in urban areas bcan transfer only small amounts of data. Devices that operate at high frequencies (greater than 1,000 MHz) can transfer more data and link to more distareceivers, if the receiver is located in line-of-sight and/or at elevation, such as on rooftops. Single-channel devices require a license and are vulnerable to jamming. Invariably there are tradfrbandwidth (how much data can be transferred in a given time period), immunity to jamming (the bet that a little used channel today will remain quiet in the coming 10 – 20 years), connectivity in a typicalenvironment (urban, suburban, rural), and the expected location of the receiver (fixed at elevation, vehicle-based, or handheld). MLOG is a multi-channel device thfrhopping, which means that it can intelligently hop among multiple frequency channels to avoid jamming. MLOG is also a spread-spectrum device
el to
le to communicate with a controller Avoids collisions with other transmitters
ieve a
chieving Sustainable Minimal
, an utility with
U.S.) tility
t).
Using the Flow Metrix Water Loss Calculator this utility statistically might have 100-300 service line
or is d to
.
e MLOG system is a complete solution for ater and monitoring pipeline s include optimizing operating
ial 5 FCC ID: RIC-MLOG01
meaning it regularly hops from channel to channspread radio emissions over a wider bandwidth. As a frequency-hopping, spread-spectrum device MLOG has a software-programmable radio with enhanced performance: • Always ab•• Sends and receives large quantities of data
quickly and reliably • Minimizes radio power consumption to ach
15-year battery life
ALevels of Lost Water To examine the economics of an MLOG deploymentconsider a hypothetical urban/suburb1,000 miles of mains, 80,000 service connections (serving a population of 500,000), and daily production of 80 million gallons. Assuming unaccounted for water at 15% (typical for theand a value of $1.50 per thousand gallons, the uis losing over $3.5 million annually ($44 per accoun
leaks and 20-100 mains leaks at any one time. The capital expense (Cap Ex) of 8,000 MLOG sensors is less than $3.00 per service annually, amortized over 5 years. (NB: The MLOG sensspecified for 15 years.) Operational (Op Ex) anpipe repair expenses are both reduced comparedroutine expenditures in reactive leak repair programsA total payback time of less than 2.5 years is typical.
Summary Threcovering lost wintegrity. Benefitresources and long-term reduction of the financand other costs of developing water resources.
4
![Leak Detector [HELIOT 900 Series ] Leak Detector [HELIOT ......Leak Detector Leak Detector ULVAC, Inc. Components Division Overseas Sales in Japan TEL +81-467-89-2261 USA : UL VAC](https://static.documents.pub/doc/80x56/614653bd8f9ff812542031c4/leak-detector-heliot-900-series-leak-detector-heliot-leak-detector-leak.jpg)


