Digital Mammography with a Photon Counting Detector in a Scanned Multislit Geometry Magnus ˚ Aslund Doctoral Thesis Department of Physics Royal Institute of Technology Stockholm, Sweden 2007
Transcript
Digital Mammography with a Photon CountingDetector in a Scanned Multislit Geometry
Magnus Aslund
Doctoral ThesisDepartment of Physics
Royal Institute of TechnologyStockholm, Sweden 2007
Akademisk avhandling som med tillstand av Kungliga Tekniska Hogskolan framlagges tilloffentlig granskning for avlaggande av teknologie doktorsexamen fredagen den 20 april 2007klockan 14.00 i F3, Lindstedtsvagen 26, Kungliga Tekniska Hogskolan, Stockholm.
Mammography screening aims to reduce the number of breast cancer deaths by earlydetection of the disease, which is one of the leading causes of deaths for middle agedwomen in the western world. The risk from the x-ray radiation in mammography isrelatively low but still a factor in the benefit-risk ratio of screening. The characteri-zation and optimization of a digital mammography system is presented in this thesis.The investigated system is shown to be highly dose efficient by employing a photoncounting detector in a scanning multislit geometry.
A novel automatic exposure control (AEC) is proposed and validated in clinicalpractise. The AEC uses the leading detector edge to measure the transmission of thebreast. The exposure is modulated by altering the scan velocity during the scan. AW-Al anode-filter combination is proposed.
The characterization of the photon counting detector is performed using the detec-tive quantum efficiency. The effect of the photon counting detector and the multislitgeometry on the measurement method is studied in detail. It is shown that the de-tector has a zero-frequency DQE of over 70% and that it is quantum limited even atvery low exposures.
Efficient rejection of image-degrading secondary radiation is fundamental for adose efficient system. The efficiency of the scatter rejection techniques currentlyused are quantified and compared to the multislit geometry.
A system performance metric with its foundation in statistical decision theoryis discussed. It is argued that a photon counting multislit system can operate atapproximately half the dose compared to several other digital mammography tech-niques.
Paper 1 M. Aslund, B. Cederstrom, M. Lundqvist, and M. Danielsson. AEC forscanning digital mammography based on variation of scan velocity. MedicalPhysics, 32(11):3367-3374, 2005.
Paper 2 M. Aslund, B. Cederstrom, M. Lundqvist, and M. Danielsson. Scatterrejection in multislit digital mammography. Medical Physics, 33(4):933-940,2006.
Paper 3 M. Aslund, E. Fredenberg, B. Cederstrom, and M. Danielsson. Spectralshaping for photon counting digital mammography. Accepted for publicationin Nuclear Instruments and Methods in Physics Research Section A.
Paper 4 M. Aslund, B. Cederstrom, M. Lundqvist, and M. Danielsson. Physicalcharacterization of a scanning photon counting digital mammography systembased on Si-strip detectors. Accepted for publication in Medical Physics.
Paper 5 M. Aslund, B. Cederstrom, M. Lundqvist, and M. Danielsson. Evalua-tion of an AEC system for scanning photon counting mammography based onvariation of scan velocity. Submitted to Medical Physics.
Reprints were made with permission from the publishers.
iii
The author has been a contributor to the following publications, which are notincluded in the thesis:
• M. Lundqvist, D. Bergstrom, B. Cederstrom, V. Chmill, A. Chuntonov, M.Danielsson and M. Aslund. Physical Evaluation of a Prototype for the SectraMicrodose Mammography System. In H. Peitgen, editor, Digital Mammography/ IWDM, Proceedings 6th International Workshop on Digital Mammography,Springer, 2002.
• B. Hansson, B. Cederstrom, M. Danielsson and M. Aslund. Dose Measurementson a Scanning Multi-slit Digital Mammography System. In H. Peitgen, editor,Digital Mammography / IWDM, Proceedings 6th International Workshop onDigital Mammography, Springer, 2002.
• M. Lundqvist, M. Danielsson, B. Cederstrom, V. Chmill, A. Chuntonov, andM. Aslund. Measurements on a full-field digital mammography system witha photon counting crystalline silicon detector. In M. Yaffe and L. Antonuk,editors, Medical Imaging 2003: Physics of Medical Imaging, volume 5030 ofProceedings of SPIE, SPIE, 2003.
• M. Aslund, B. Cederstrom, M. Lundqvist, and M. Danielsson. Scatter rejectionin scanned multislit mammography. In M. Yaffe and M. Flynn, editors, MedicalImaging 2004: Physics of Medical Imaging, volume 5368 of Proceedings of SPIE,2004.
• M. Aslund, B. Cederstrom, M. Lundqvist, and M. Danielsson. Optimized AECfor scanning digital mammography based on local variation of scan velocity. InM. Flynn, editor, Medical Imaging 2005: Physics of Medical Imaging, volume5745 of Proceedings of SPIE, 2005.
• M. Aslund, B. Cederstrom, M. Lundqvist, and M. Danielsson. Optimizationof operating conditions in photon-counting multi-slit mammography based onSi-strip detectors. In M. Flynn and J. Hsieh, editors, Medical Imaging 2006:Physics of Medical Imaging, volume 6142 of Proceedings of SPIE, 2006.
• M. Aslund, Latest advancements in digital mammography, Hospital Imaging &Radiology Europe. 1(4):29-31, 2006.
• M. Lundqvist, M. Aslund, B. Cederstrom, and M. Danielsson. Phantom con-struction considerations. In M. Flynn and J. Hsieh, editors, Medical Imaging2007: Physics of Medical Imaging, volume 6510 of Proceedings of SPIE, 2007.
• E. Fredenberg, B. Cederstrom, M. Aslund, M. Danielsson, and C. Ribbing. Atunable energy filter for medical x-ray imaging. Revision submitted to MedicalPhysics.
Author’s contribution
The experiments on the multi-prim x-ray lens and its theoretical description in Pa-per 3 were performed by the second author of that paper, Erik Fredenberg. Withthat exception, Papers 1 to 5 are based on work performed almost exclusively by theauthor, which includes the majority of the theory, the experiments, the simulationsand the writing of the papers.
In Europe it is estimated that every two minutes a women is diagnosed with breastcancer and every sixth minute someone dies from the disease. This translates toabout 275 000 diagnoses of breast cancer per year in the European Union (EU)and approximately 88 000 deaths. For women in the EU, breast cancer is the mostfrequent form of cancer and the leading cause of death in the 35-59 years age range [1].Mammography screening aims to detect breast cancer early and thus improve thechances of curing the disease. Over the past 40 years seven randomized controlledtrials (four from Sweden) have measured the deaths from breast cancer among a studygroup offered mammography screening and a control group. Three trials measuredstatistically significant reductions in breast cancer mortality in the 23-32% rangeand three measured statistically non-significant reductions in the 14-20% range. In2001, Tabar at al. showed a reduction in breast cancer deaths of at least 50% usingdata from the organized screening programmes initiated in Sweden in 1986 [2]. Thebenefit of mammography screening can be considered established for women aged50-69 years and recommendations vary for women aged 40-49 years [3]. In 1998,22 countries world wide had implemented population based screening programmes tosome extent [4]. In 2003, an EU council recommendation was adopted recommendingmember states to implement screening programmes for women aged 50-69 years [5].In 2006, 11 out of 25 member states offer nationwide mammography screening –Belgium, the Czech Republic, Estonia, Finland, France, Hungary, Luxembourg, theNetherlands, Sweden, Spain and the United Kingdom.
Screen-film mammography systems have been used during the evolution of themammography screening programmes. Screen-film mammography has been consid-ered the most sensitive modality for early detection of breast cancer. When performedoptimally, 69-90% of breast cancers are found with the technique [6]. Disadvantageswith screen-film mammography are the radiation and that the sensitivity for detect-ing breast cancer is diminished in radiographically dense breasts, which limits itsusefulness in high-risk younger women [3, 6]. Minimizing radiation risk is importantin general as manifested by the ALARA (as low as reasonably achievable) principle.Radiation risk is a factor in the benefit–risk ratio of mammography [7]. To quan-tify the risk from radiation in mammography, the average glandular dose (AGD) isused. The efficacy of mammography rely on that the systems are optimized withrespect to the benefit–risk ratio and that the AGD and image quality is monitoredin quality control programmes. Another problem with screen-film mammographyis the low specificity; only 5-40% of the detected lesions recommended for biopsyare malignant [8], which results in unnecessary biopsies and patient stress. Digi-tal mammography has been developed during the past two decades with the aim ofovercoming some of these issues.
1.2. DIGITAL MAMMOGRAPHY 3
1.2 Digital mammography
1.2.1 Energy integrating technology
Computed radiography (CR) was considered for digital mammography as early as25 years ago. The technology was mainly an adoption of CR plates used for generalradiography. CR plates use a storage phosphor to absorb x-rays and convert itsenergy into trapped charges in the phosphor crystal lattice. After the exposure theimage of the accumulated trapped charges is scanned with a laser, which causes thetrapped electrons to return to their original state within the phosphor. The phosphoris doped to create energy transitions, which causes blue light to be emitted as theelectrons return. It is the blue light that is collected and digitized into an image. Theamount of blue light from an absorbed photon and thus the photon’s contribution tothe total value of an image pixel is proportional to the energy of the photon. The CRplates have evolved from having 100 µm pixel size to systems with 50 µm pixel size(Kodak, Konica-Minolta, Agfa, FuijFilm). The system from Fuji has been improvedby collecting the blue light on both sides of the plate [9]. CR systems are employedwith conventional screen-film mammography systems by replacing the film-screencassettes with CR cassettes. Among the weaknesses are the low resolution due toscattering of the red laser in the phosphor and the added noise from the low collectionefficiency of the blue light.
The next technical advancement was to use a scintillator (that absorb the x-rayand converts its energy to visual light) coupled to a charge-coupled device (CCD)(that converts the visible light to an electrical signal that can be digitized). Thescintillator has to be optically coupled to the CCD, e.g. by using optical fibres. Inmammography, a relatively large field of view is required to image the entire breast.The first CCD based digital mammography systems had relatively small detector areaand were used for stereotactic localization and biopsies, procedures in which only apart of the breast need to be imaged. A system with a field a view large enough formammography was referred to as full field digital mammography system (FFDM).A scanning FFDM system from Fischer Imaging used a smaller CCD based detectorto scan the larger field of view. Another FFDM system from Lorad tiled severalsmaller CCD detectors to create the larger field of view. Both these approaches werediscontinued. In 1999, an FFDM system was introduced by General Electric, whichreplaced the CCD with an a-Si flat-panel with a thin film-photodiode array. Thephotodiode array records the light from the scintillator deposited on-top. The chargegenerated by the photodiodes is accumulated in a storage capacitor at each pixel. CsImanufactured with a columnar structure to guide the light towards the photodiodebeneath was used as scintillator. The readout electronics take up a portion of thepixel area, which is thereby insensitive to x-rays and makes it difficult to reduce thepixel size below 100 µm. Among the weaknesses are the relatively large pixel size,degradation of resolution from visual light spread in the CsI and memory effects inthe detector often referred to as ghosting.
4 CHAPTER 1. INTRODUCTION
x-ray photons
electrons
holes
post-collimator
compression plate
Si strip-detector lines
pre-collimator
x-ray fan beam
in scatter shield
Figure 1.1: Left: Picture of the latest model of the MicroDose Mammography systemfrom Sectra Mamea. Center: Schematics of the scanning multislit system. Right:Schematics of the Si-strip detector for photon counting detection.
In 2002, a flat-panel detector was introduced by Hologic. Instead of the scintilla-tor, an a-Se photoconductor was deposited on the flat-panel and charge was therebycreated directly at the interaction site of an absorbed x-ray photon. An electrical fieldguides the charges to the a-Si thin-film transistor pixel array. The charges createdduring the exposure are accumulated in a capacitor at each 70 µm pixel. Among theweaknesses are memory effects and poor stability of the a-Se.
1.2.2 Photon counting technology
In 2003, the MicroDose Mammography (MDM) system was introduced by SectraMamea. This system is the main focus of the investigations made in this thesis. Thesystem uses a direct photon counting detector in a scanning geometry as illustratedin Fig. 1.1. The x-ray beam is collimated to a fan beam matching the pre-collimator.This fan beam is enclosed in a scatter protection device that blocks secondary ra-diation from the air volume before the pre-collimator to reach the patient. Thepre-collimator transforms the beam to several equidistant line beams. Beneath thebreast support there is a detector box containing a post-collimator and the x-raydetector. The detector is comprised of several lines of photon counting Si-strip de-tectors matching the line beams exiting the breast. The fan beam, pre-collimator,post-collimator and detector trace, with a continuous motion, an arc with the axisof rotation co-linear with the x-ray tube focal spot. The source-to-image distance is70 cm, the field of view (FOV) 24 × 26 cm2, the pixel size 50 µm and the air gap2 cm.
The Si-strip detectors are similar to the ones used for tracking particles in highenergy physics experiments [10]. On the backside, the sensor has a continuous elec-trode. On the opposite side, the linear detectors are segmented into pixels by Alstrip electrodes, which we refer to as channels. The linear detectors are mountedparallel to the slits in the pre-collimator with the Al strips pointing back to the x-raysource. The detectors are 500 µm thick and mounted nearly edge-on with respect
1.2. DIGITAL MAMMOGRAPHY 5
to the x-ray beam. The strip pitch and the length of the focal spot determine thespatial resolution in the slit direction (perpendicular to the chest wall). In the scandirection (parallel to the chest wall) pixels are created by retrieving the number ofcounted photons from each channel every 50 µm during the continuous scan. In thisdimension it is the stepping distance and the width of the line beams that determinethe spatial resolution. The width of the line beams are defined by the slit width in thepre-collimator and the width of the focal spot. The slit width of the post-collimatoras well as the projected width of the Si-strip detectors onto this dimension is widerthan the width of the line beams including the penumbra. This enables 100% pri-mary transmission through the post-collimator after proper alignment and 100% fillfactor in irradiated areas [Paper 2]. The purpose of the post-collimator is to preventscattered photons from hitting detector and electronics.
Each strip forms a separate reversed bias PIN-diode, which is fully depleted bya bias voltage and virtually no current flows unless photons interact in the sensorand create electron-hole pairs. Electrons drift to the electrode on the backside andholes towards the strip on the front side of the sensor. The motion of drifting chargesinduces currents to the electrodes. Each strip is wire bonded to a separate pulse-counter. The counter is incremented if the pulse is above an electronic thresholdlevel. Several thousands of electron-hole pairs are typically created for each photon,whereas the noise level in the electronics is on the order of 200 electrons root-mean-square. Thus, it is possible to set the electronic threshold as to detect the currentpulses induced by absorbed photons while not detecting the noise from the electron-ics [Paper 4].
The detection process is direct in the sense that there is no intermediate step thatinvolves visual light diffusion, which typically degrades the MTF.
1.2.3 Transition to digital mammography
The transition from screen-film to digital mammography has been slow. The tran-sition started with the CR systems 25 years ago but it is not until 2006 that thistechnology was approved by the Food and Drug Administration in the United States.Another example is that it is only recently that the FFDM systems are referred toas digital mammography systems. One reason for the slow transition is the high de-mands on image quality. Small (100-300 µm) microcalcifications and lesions of subtlecontrast must be detectable in the mammograms. The efficacy of screen-film mam-mography has been proven in randomized controlled trials and it seemed reasonableto require that digital mammography should have similar physical performance. Itwas soon realized that it was difficult to match the resolution of screen-film systems,while the contrast resolution could be improved. The scientific community thereforehad to argue that the resolution of the digital systems available was adequate andthat the improved contrast transfer at lower frequencies was more important for theimaging task. This had to be proven in clinical trials in which the sensitivity andspecificity was measured against screen-film. In 2005, the performance of several dig-
6 CHAPTER 1. INTRODUCTION
ital technologies was demonstrated to be equal to that of screen-film mammographyin a large clinical trial [11].
A screen-film has a relatively narrow exposure window in which a small exposuredifference (the result of for example a lesion) yields a visible optical difference in thedeveloped film. This led to the development of automatic exposure control (AEC)systems with radiation sensors beneath the screen-film. The AEC terminates theexposure when the film is adequately exposed. Digital mammography detectors havea much wider dynamic range. In addition, the contrast can be modified before theimage is displayed on a monitor or printed on a film. This means that a digital imageis not limited by the display contrast in the sense that a film is and therefore anAEC system was no longer required to yield good image quality. In fact, most digitalmammography systems were not equipped with an AEC as they were introduced.It was not until 2006 that digital systems were required to have an AEC by theEuropean guidelines [12]. There is a limit to the extent a signal difference (the resultof for example a lesion) in the digital image can be visualized in the displayed image.This limitation can be quantified by the signal-difference-to-noise ratio (SDNR) [13].
Ever since the introduction of the first FFDM systems, clinical trials showingdigital mammography’s efficacy have been desired and required for the technologyto become widely accepted. Instead of conducting a randomized controlled trial tocompare digital mammography with a control group which is not offered mammog-raphy, the digital mammography trials have been designed to compare its sensitivityand specificity to screen-film mammography. Until 2005, the Oslo I [14], Oslo II [15]and Lewin [16] studies were the large clinical trials that had been conducted. Withthese studies it was realized that the difference between digital and screen-film mam-mography in screening for breast cancer was small relative the study design, i.e. itwas difficult to show statistically significant differences. In 2005, a study which en-rolled 49528 women showed that for breast cancer screening digital mammographyhas significantly greater diagnostic accuracy than film for women with dense breasts,women under 50 years and pre- and peri-menopausal women. For the entire popula-tion studied, digital was equivalent to film [11]. The reason for the improved accuracyin women with dense breasts is likely the separate acquisition and display. It allowsimage processing to visualize small contrast differences, e.g. between a cancer andadjacent dense tissue. For the majority of the digital systems studied, the improvedperformance was achieved at a lower x-ray dose than film [17]. This is likely theresult of the superior detector performance of the digital systems. There are severalother advantages with having digital mammograms, e.g. it facilitates archiving andtransport, telemammography and computed aided detection.
A clinical trial is very expensive, time consuming and difficult to design so thatstatistically significant results can be shown. The reason for this is the small numberof cancers present in a normal screening population. The performance of an individ-ual mammography apparatus has to be verified by physical metrics that are moreaccurate, less expensive and less time consuming to determine. The performancein clinical practice has to be inferred from these physical metrics and the results
1.2. DIGITAL MAMMOGRAPHY 7
of clinic trials performed on a similar system. Standardized procedures for physicalcharacterization of screen-film mammography had evolved in quality control guide-lines and standards from the International Electrotechnical Commission (IEC). It isbelieved that the efficacy of breast cancer screening is correlated to the implementa-tion of best practise quality control programs. Therefore quality control guidelineshave been adopted in the EU with the first edition in 1992 [12]. In 2006 the fourthedition of these guidelines were adopted, which now included a chapter treating digi-tal mammography. An IEC standard [18] for measuring digital detector performanceis also near completion.
In mammography a projection image of the breast is acquired. The breast is firmlycompressed during acquisition in order to minimize movement, reduce structuraloverlap in the image, reduce x-ray attenuation and thereby x-ray dose and reducethe amount of scattered photons. Scattered radiation is a major source of imagequality degradation. Nearly half of the photons reaching the detector beneath amedium sized breast are scattered photons. In screen-film mammography grids areused to try to block photons not pointing back to the x-ray source. The improvementfrom using a grid can be seen by the improved image quality in the developed film.These grids also blocked some of the primary radiation. In screen-film mammographythe dose to the detector has to be maintained since the dynamic range is limited.Therefore the radiation dose has to be increased as the grid is introduced. Metricswere developed to quantify the increase in radiation dose and the improvement inimage quality. With the somewhat arbitrary dose that can be used with the digitaldetectors these metrics were no longer ideal and the benefit of the grids was no longerevident.
8 CHAPTER 1. INTRODUCTION
1.3 Overview of the thesis
I started research and development work on the photon counting digital mammog-raphy system from Sectra Mamea in 2000. Today the system is installed in over10 countries. During this time standards, metrics and AEC systems suited for thedigital technology have evolved. The main results from my research were publishedin peer-reviewed journals. These papers form the basis of this thesis. The theoreticaldescription of image quality pioneered in the 1940’s is outlined in Chapter 2. Chap-ter 3 describes the design and evaluation of the AEC system. Chapter 4 describesthe physical characterization of the system.
Chapter 2
Theory
9
10 CHAPTER 2. THEORY
2.1 Introduction
Assessment of image quality in digital mammography has developed along with theimprovement of medical imaging devices. Over the recent decades a revolution inthe theoretical description of medical imaging quality has occurred through the ap-plication of modern imaging theory [19]. Image quality assessment can be dividedinto two stages. The first stage is the quality of the data as perceived by the idealBayesian observer. The second stage as it is perceived by an observer using displayeddata as input [13]. In this section we consider the quantitative assessment of thefirst stage. Such assessments can be used for quality control, in design optimizationand for comparing different systems. In addition, it can be used for understandingoutcomes of second stage assessment, e.g. clinical trials.
Rose introduced the quantum efficiency in 1946, which in the 1970’s was extendedto the detective quantum efficiency (DQE) using applied linear systems theory [20,21, 19]. The DQE is frequently used to quantify detector performance in digitalmammography and an IEC standard will soon be released on DQE measurementsfor digital mammography [18]. Rose also introduced a model to quantify the imagequality in terms of SDNR. The theory was later formalized in the framework ofstatistical decision analysis. The 54:th ICRU report [13] describes the SDNR conceptin detail and proposes a framework within which the diagnostic quality of imagesproduced by a variety of clinical imaging devices can be evaluated.
Using this framework we define an absolute measure of image quality as thespatial-frequency dependent SDNR2. In analogy with the relative DQE measure, asignal-difference quantum efficiency (SDQE) is defined.
2.2 Signal-difference-to-noise ratio
Rose [20] showed that image quality is directly related to the signal-to-noise-ratio(SNR). The spatial-frequency dependent noise equivalent quanta (NEQ) was laterdefined as
NEQ(ω) ≡ SNR2(ω) =MTF2(ω)
NNPS(ω), (2.1)
where MTF is the modulation transfer function and NNPS is the normalized noisepower spectrum [21, 22]. The noise equivalent quanta is the number of Poisson-distributed quanta that would produce the same SNR given an ideal detector. Aspatial-frequency dependent DQE is defined as the ratio of the noise equivalent quantaover the incident number of quanta or equivalently as the ratio of the square of theoutput SNR over the square of the input SNR, i.e.
DQE(ω) =NEQout(ω)
Qin
≡ SNR2out(ω)
SNR2in(ω)
, (2.2)
where Qin is the incident number of Poisson-distributed quanta. To model a knownlow-contrast target on a uniform background we define o(x) as the function that
2.2. SIGNAL-DIFFERENCE-TO-NOISE RATIO 11
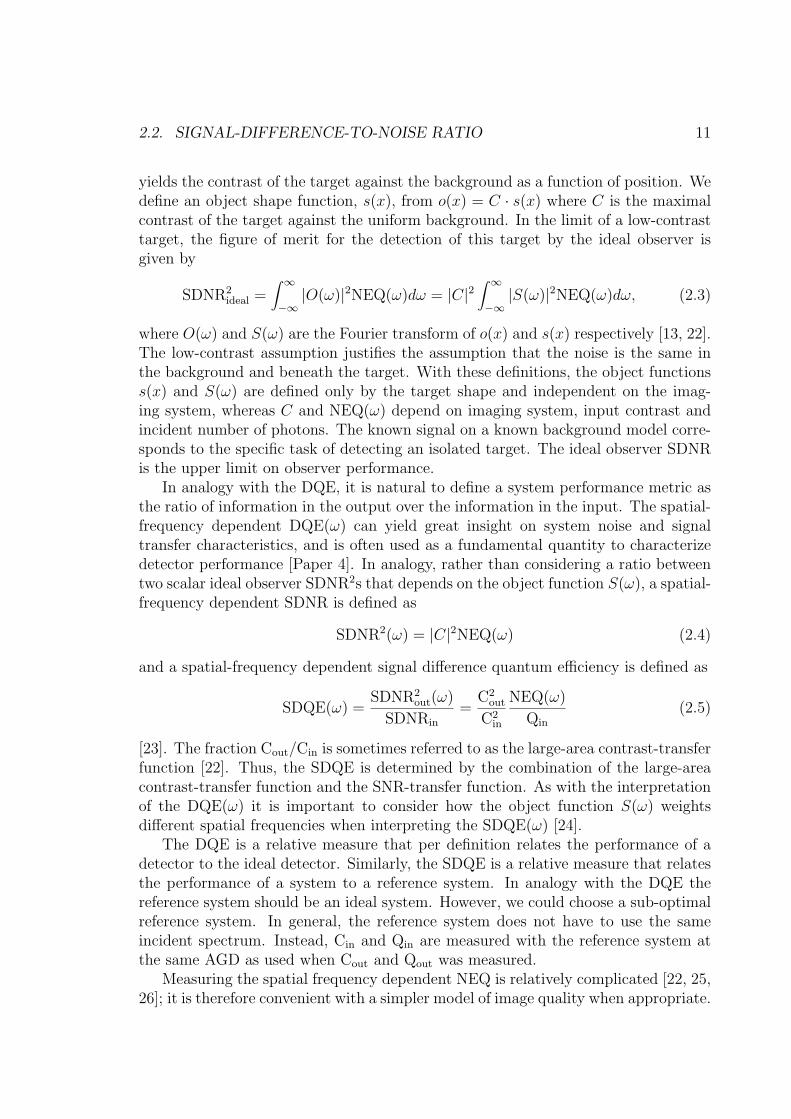
yields the contrast of the target against the background as a function of position. Wedefine an object shape function, s(x), from o(x) = C · s(x) where C is the maximalcontrast of the target against the uniform background. In the limit of a low-contrasttarget, the figure of merit for the detection of this target by the ideal observer isgiven by
SDNR2ideal =
∫ ∞
−∞|O(ω)|2NEQ(ω)dω = |C|2
∫ ∞
−∞|S(ω)|2NEQ(ω)dω, (2.3)
where O(ω) and S(ω) are the Fourier transform of o(x) and s(x) respectively [13, 22].The low-contrast assumption justifies the assumption that the noise is the same inthe background and beneath the target. With these definitions, the object functionss(x) and S(ω) are defined only by the target shape and independent on the imag-ing system, whereas C and NEQ(ω) depend on imaging system, input contrast andincident number of photons. The known signal on a known background model corre-sponds to the specific task of detecting an isolated target. The ideal observer SDNRis the upper limit on observer performance.
In analogy with the DQE, it is natural to define a system performance metric asthe ratio of information in the output over the information in the input. The spatial-frequency dependent DQE(ω) can yield great insight on system noise and signaltransfer characteristics, and is often used as a fundamental quantity to characterizedetector performance [Paper 4]. In analogy, rather than considering a ratio betweentwo scalar ideal observer SDNR2s that depends on the object function S(ω), a spatial-frequency dependent SDNR is defined as
SDNR2(ω) = |C|2NEQ(ω) (2.4)
and a spatial-frequency dependent signal difference quantum efficiency is defined as
SDQE(ω) =SDNR2
out(ω)
SDNRin
=C2
out
C2in
NEQ(ω)
Qin
(2.5)
[23]. The fraction Cout/Cin is sometimes referred to as the large-area contrast-transferfunction [22]. Thus, the SDQE is determined by the combination of the large-areacontrast-transfer function and the SNR-transfer function. As with the interpretationof the DQE(ω) it is important to consider how the object function S(ω) weightsdifferent spatial frequencies when interpreting the SDQE(ω) [24].
The DQE is a relative measure that per definition relates the performance of adetector to the ideal detector. Similarly, the SDQE is a relative measure that relatesthe performance of a system to a reference system. In analogy with the DQE thereference system should be an ideal system. However, we could choose a sub-optimalreference system. In general, the reference system does not have to use the sameincident spectrum. Instead, Cin and Qin are measured with the reference system atthe same AGD as used when Cout and Qout was measured.
Measuring the spatial frequency dependent NEQ is relatively complicated [22, 25,26]; it is therefore convenient with a simpler model of image quality when appropriate.
12 CHAPTER 2. THEORY
Using Parseval’s theorem and assuming a flat-topped object of area A,
∫ ∞
−∞|S(ω)|2dω =
∫ ∞
−∞|s(x)|2dx = A. (2.6)
If uncorrelated noise is assumed the variance of the pixel values is σ2bg = NPS(0)/Apixel,
where Apixel is the area of a pixel [22]. If it is also assumed that MTF = 1 whereS(ω) has significant values and that s(x) describes a flat-topped square of area Atarget
(with edges that coincides with the edges of pixels) Eq. 2.3 can be written as
SDNR2σ = |C|2 S2
bg
NPS(0)
∫ ∞
−∞|S(ω)|2dω = |C|2 Atarget
Apixel
SNR2pixel, (2.7)
where Sbg is the mean pixel value in the background and SNRpixel = Sbg/σbg.If the pixel values of a system are Poisson-distributed, Sbg = σ2
bg and SNR2pixel =
Sbg. Such as system is referred to as quantum limited. In addition to the assumptionsmade in Eq. 2.7, the Rose model assumes a photon counting quantum limited systemwith N = Sbg/Apixel counted photons per unit area. Eqs. 2.3 and 2.7 then simplifyto
SDNR2Rose = |C|2AtargetN. (2.8)
In chapter 3 the SDNRRose is used to model the system and SDNRσ is used tovalidate the model. The SDQE of Eq. 2.5 is used as figure of merit in the beamquality optimization of the AEC. In chapter 4 the SDNRRose and the SDQE are usedto investigate the effect of scattered radiation on system performance. The chapteralso includes discussions on the measurements of the DQE, NEQ and the SDQE.
Chapter 3
Exposure Control
13
14 CHAPTER 3. EXPOSURE CONTROL
3.1 Introduction
The goal in medical x-ray imaging is to obtain the image quality required for a givendetection task, while ensuring that the patient dose is kept as low as reasonablyachievable. Modern high-speed screen-film combinations have a relatively narrowexposure window, which has led to the development of AEC systems with radiationsensors beneath the screen-film. The number of photons that reach the detectorcan be controlled via the x-ray tube emission current or by controlling the exposureduration, the product of the two is referred to as the current time product. Thescreen-film and digital systems usually obey a reciprocal law so that the detectorsignal is determined by the current time product without the need to know theemission current and exposure duration separately.
The broader dynamic range and ability to alter the display contrast made it pos-sible to use the digital systems with manual exposure control or with look-up tablesthat specify the exposure parameters for different breast thicknesses. The reasonfor an advanced AEC system in digital mammography is therefore minimization ofradiation dose [12]. The AEC systems used with screen-film mammography wereinitially designed only to control the optical density by terminating the exposureat the correct moment. These systems evolved into also controlling the beam qual-ity [27, 28]. As AEC systems were eventually designed for the digital systems, theautomatic beam quality selection was usually considered from the beginning [29]. ACR system uses the dedicated AEC sensors of the analog unit which it is employedwith, whereas direct digital radiography systems can use the imaging detector itselfas the AEC sensor [Paper 1].
The SDNR and the AGD depend on several factors in the imaging chain: thebeam quality, the breast and the current time product. These factors should beoptimized to maximize the benefit-risk ratio for each exposure. The SDNR alsodepends on other system properties, such as the detector and the scatter rejection,which should be optimized when the system is designed. By compressing the breastfor each exposure, the thickness is reduced and it is fixated, which leads to increasedSDNR and reduced AGD. In this chapter an AEC for scanning digital mammographyis introduced. The topic of the first section is the beam quality optimization publishedin Paper 3, followed by a section on the theoretical evaluation of the AEC publishedin Paper 1. The last section discusses the research on the physical evaluation of theAEC published in Paper 5.
3.2 Beam quality
Paper 3 uses a theoretical model of the MDM system to calculate the SDNR. Themodel is described and validated in Aslund et al. [30]. The theoretical model is similarto the Rose model. The MDM detector is photon counting and quantum limited inthe entire exposure range for which it is used [Paper 4]. This is the reason why theSDNRRose used in the model agrees well with the SDNRσ used to validate the model.
3.2. BEAM QUALITY 15
Using SDNRσ rather than the SDNRideal relied on assuming uncorrelated pixel valuesand that the MTF was unity where S(ω) has significant values. The MDM systemhas no correlations in the noise in the scan direction and little correlation betweenthe pixel values in the slit direction [Paper 4]. For smaller targets the assumptionabout the MTF will not hold. In situations where the pixel values are correlatedor the MTF is not unity where S(ω) has significant values, which is usually thecase, modeling the SDNR as SDNRσ may still be useful. If it can be assumed thatthe shape of the spatial frequency dependent factors of the noise and the MTF areconstant in the cases being compared, SDNRσ can be used in relative comparisons.An example of such a case is the optimization of the beam quality [31]. There aresome considerations to be made when implementing the low-contrast target in suchan optimization [32].
In the beam quality optimization, the spectral quantum efficiency [33] is used asfigure of merit. The spectral quantum efficiency is the SDQE in Eq. 2.5 with thereference system defined as the investigated system using the ideal monochromaticx-ray beam. Beam quality optimizations have been performed previously both forscreen-film systems [34, 35, 36, 37] and digital systems [38, 39, 29, 40, 33]. The beamquality depends on anode material in the x-ray tube, filter materials in the x-ray beamand the tube voltage (U). With the exception of the work by Fahrig et al. [38], mostwork on optimization of these parameters has been performed without a constrainton the SDNR2-rate or imaging time. However, the SQE usually increases [41] withfilter thickness while the SDNR2-rate decreases. The opposite is often true for tubevoltages where an increased U decreases the SQE but increases the SDNR2-rate [30].A decreased SDNR2-rate must be compensated for by an increased imaging time formaintained SDNR. There are clinical disadvantages with too long acquisition times,such as patient discomfort and image blurring from patient movement. There arealso technological limitations, such as the heat load and emission limitations of thex-ray tube. Therefore an SDNR2-rate constraint always exists and consequently theoptimization of beam quality should be made with this constraint if the optimalparameters are to be found. Finding the optimal filter material is an example whereit makes much sense to optimize under iso-SDNR2-rate condition.
The main conclusion from this work is that an Aluminium filter material is appro-priate for the MDM system when using the Tungsten anode x-ray tube, particularlyif a single filter is used for all breast thicknesses [30]. A modest improvement in SQEof less than 4% could be achieved by using optimal K-edge filters. If the use of K-edgefilters were to be implemented on the system, one would have to consider that anoptimal filter for one breast thickness is suboptimal for another breast thickness.
Fahrig et al. [38] predicted that higher tube voltages and harder beams were op-timal in digital mammography compared to screen-film mammography. Williams etal. [42] showed that the hardest beam resulted in the highest SQE for four inves-tigated digital mammography systems. Similar to our findings, they show that theTungsten anode outperformed the Molybdenum anode. The MDM system can beconsidered optimized when using a fixed W-Al anode-filter combination for all breast
16 CHAPTER 3. EXPOSURE CONTROL
26 28 30 32 34 36 380.35
0.4
0.45
0.5
0.55
0.6
0.65
0.7
Tube voltage (kV)
SQ
E
Z = 13Z = 42Z = 45Z = 48
Figure 3.1: SQE versus tube voltage for filters made of Al (Z=13), Mo (Z=42), Rh(Z=45) and Cd (Z=48). The SQE is a metric quantifying the dose efficiency orSDNR2 AGD−1. The filter thickness is changed for each point along the plotted linesso that the SDNR2-rate is constant. This means that the imaging time to achievea target SDNR for each point in the graph is the same, whereas the AGD typicallydiffers.
thicknesses. The remaining parameter to control is the tube voltage, which accordingto Williams et al. had only a slight affect on the SQE. The peaks in Fig. 3.1 corre-spond to the optimal tube voltages of some filter materials. These tube voltages yieldthe same SDNR2-rate and are higher than the tube voltage that would be found ifthe filter thickness had been fixed in the comparison. The AEC of the MDM systemshould optimally use the tube voltage as found in an iso-SDNR2-rate comparisongiven that the system is indeed operating at that SDNR2-rate. If it is possible toimprove the SQE by changing the tube voltage while maintaining the same filter, itmeans that a different SDNR2-rate is acceptable. The iso-SDNR2-rate optimizationshould then be re-executed and the outcome is likely to be a tube voltage close tothe iso-SDNR2-rate tube voltage found previously, but this time with a new filterthickness [30].
3.3 AEC for a scanning system
Apart from the beam quality selection, the goal of the AEC is to control the currenttime product so that the target SDNR is achieved. A system with stable and pre-dictable image quality can be adjusted exactly to the desired benefit-risk ratio. Thisis the reason for the strict requirements on reproducibility in image quality set bythe quality control programmes even for the digital systems [12].
Figure 3.2: SDNR for a fixed current time product versus breast thickness and threehomogenous glandular fraction by weight breast compositions. The SDNR is nor-malized to one for the 50 mm thick breast of 50% glandular fraction by weightcomposition. The SDNR is calculated for a low-contrast 0.1 mm Al target embeddedin a homogenous breast.
If an ideal quantum limited system is assumed and the Beer-Lambert law is usedto describe the number of transmitted photons trough a homogenous breast we get
SNR2pixel = p0e
−µt, (3.1)
where p0 is the number of photons impinging on the breast, µ is the linear attenuationcoefficient of the breast and t its thickness. Eq. 3.1 describes that the required numberof photos impinging on the breast to achieve a target SDNR grows exponentially withbreast thickness. The required exposure to the breast and the required current timeproduct therefore also grows exponentially with breast thickness for a fixed targetSDNR. Typically, the SDNR is allowed to decrease with breast thickness [12] andin practice contrast detail scores for both digital and screen-film systems decreasewith breast thickness [43]. The MDM system is configured with a target SDNR as afunction of breast thickness.
The transmission of photons trough the breast is not as dependent on the com-position of the breast as it is on the thickness as can be seen in Fig. 3.2, which wasgenerated using the theoretical model of the MDM system [30]. This is the reasonwhy several digital systems chose to use look-up tables where the required currenttime product for each breast thickness was given. The early version of the MDMsystem (D20) uses such methods.
To minimize the AGD the current time product should be controlled so that theSDNR in the image is equal to the target SDNR. To do this accurately an AEC
18 CHAPTER 3. EXPOSURE CONTROL
system must measure the actual breast transmission. While the AEC of an areasystem can control the exposure of a pixel by changing either the emission currentor the exposure length, a scanning system controls the exposure by changing theemission current or the scan time. To minimize the scan time, the MDM system usesthe maximal emission current and changes the scan time. Modeling the x-ray beamduring a scan is challenging since intensity variations must be small or compensatedfor as to not render the image unusable [44]. However, intensity variations modulatedvia changes in scan velocity are relatively easy to monitor and the MDM system cantherefore compensate for this when constructing the image. For digital systems, thedensest region has the most statistical noise and hence fundamentally the lowestimage quality. To be able to minimize the dose and avoid underexposures, alsodigital system should control the exposure based on the transmission of the densestpart [Paper 1]. The AEC of area detector systems may use a low-dose pre-exposureto optimize exposure parameters and find the densest region [29, 45]. A scanningsystem must use a different approach to find the densest region. One AEC designhas been described for scanning digital mammography in which the emission currentwas determined based on the transmission of the densest region found in a low-dosepre-scan [44]. The approach investigated in Paper 1 and Paper 5 is one where theexposure is modulated during the scan by varying the scan velocity based on themeasured transmission by the leading detector edge. The goal is to minimize theSDNR in each region of the image, with the constraint that it should be less than orgreater than the target SDNR. The benefits are expected to be reductions in dose andscan time as compared to the constant velocity scan that yields the correct SDNR inthe densest part.
The AEC evaluated in Paper 1 is implemented on the latest version of the MDMsystem (L30). Paper 1 estimates a dose reduction of 12% and a scan time reductionof 26% for this system. The maximal velocity (0.2 ms−1) and acceleration (2.5 ms−2)constraints that were used in Paper 1 have been realized to be impractical. A maximalvelocity of 0.2 ms−1 and a maximal acceleration of 0.25 ms−2 are more realistic. Thedose and scan time reductions for various constraints on the maximal accelerationand velocity are plotted in Fig. 3.3. In Paper 1 the detector was assumed to becompletely outside the field of view in the start and end of the scan. In Fig. 3.3, themodel was modified to take into account that the L30 has 1/3 of the detector widthoutside the field of view at the start and end of the scan. These results show thatneither does the performance improve much by increasing the maximal accelerationabove 0.25 ms−2 nor does it improve much by increasing the maximal velocity above0.1 ms−1.
3.4 Evaluation of the AEC
From 2006, MDM systems (D40) were equipped with an AEC that modulates theexposure by changing the scan velocity during the scan. The implementation on this
3.4. EVALUATION OF THE AEC 19
0 500 1000 1500 2000 250010
10.5
11
11.5
Acc (mms-2)
Esak r
eduction (
%)
0 500 1000 1500 2000 25006
8
10
12
14
16
18
20
22
Acc (mms-2)
Scantim
e r
eduction (
%)
v = 250 mms-1 v = 200 mms-1 v = 150 mms-1
v = 100 mms-1 v = 75 mms-1 v = 50 mms-1
Figure 3.3: Left: Reduction in entrance surface air kerma (ESAK). Right: Reduc-tion in scan time. In both cases as a function of maximal acceleration constraint(Acc) for several maximal velocity constraints (v) using the data and methods of Pa-per 1. The reductions are relative reductions from implementing a velocity regulationAEC that modulates the x-ray intensity distribution to match the breast transmis-sion properties compared to a conventional AEC that creates a homogenous x-rayintensity distribution.
20 CHAPTER 3. EXPOSURE CONTROL
Tube voltage (kV)
Sca
n t
ime
(s)
Required scan time (s)
Nu
mb
er
of
exp
osu
res
Nu
mb
er
of
exp
osu
res
Glandular fraction (%)25 30 35 402
4
6
8
10
125 cm
0 5 100
1000
2000
30004.5 - 5.5 cm
-50 50 1501000
4.5 - 5.5 cm
0
1000
2000
3000GF = 0%
GF = 50%
GF = 100%
Figure 3.4: Left: Glandular fraction by weight estimates for breasts in the 4.5-5.5 cmthickness range using the data and methods of Paper 5. Center: The required scantime to reach a constant SDNR as a function of tube voltage for three glandularfraction by weight breast (GF) compositions. The SDNR is calculated for a low-contrast 0.1 mm Al foil embedded in a 5 cm thick breast. Right: The actual requiredscan times encountered in clinical practise for breasts in the 4.5-5.5 cm thickness rangeusing the data and methods of Paper 5.
model only allows it to reduce the velocity. The AEC optimizes the beam qualityfor each exposure by changing the tube voltage, U . The optimization takes intoaccount the compressed breast thickness, tb, and the target image quality, SDNRtg.The target image quality is a function of compressed breast thickness. The systemcalculates a target SNR as
SNRtg(tb, U) = SDNRtg(tb)/C(tb, U), (3.2)
where C yields the contrast of 0.1 mm Al against a homogenous background. The op-timal current time product yields the target SNR. The required current time productis estimated as
where φ is the number of counted photons per current time product [Paper 5].The AEC is currently allowed to change the scan time in the 3-8.5 s range. It
is the readout frequency of the photon counters that is the limiting factor for theshortest scan time. Tube loading, motion blurring and patient discomfort are limit-ing factors for the longest scan time. Unlike the compressed breast thickness, whichis automatically tallied, it is difficult to predict the breast composition before theexposure. Several systems therefore use a low-dose pre-exposure to sample the com-position before the actual exposure that forms the image. The AEC of the MDMsystem does not do a pre-exposure and it cannot change the tube voltage during
3.4. EVALUATION OF THE AEC 21
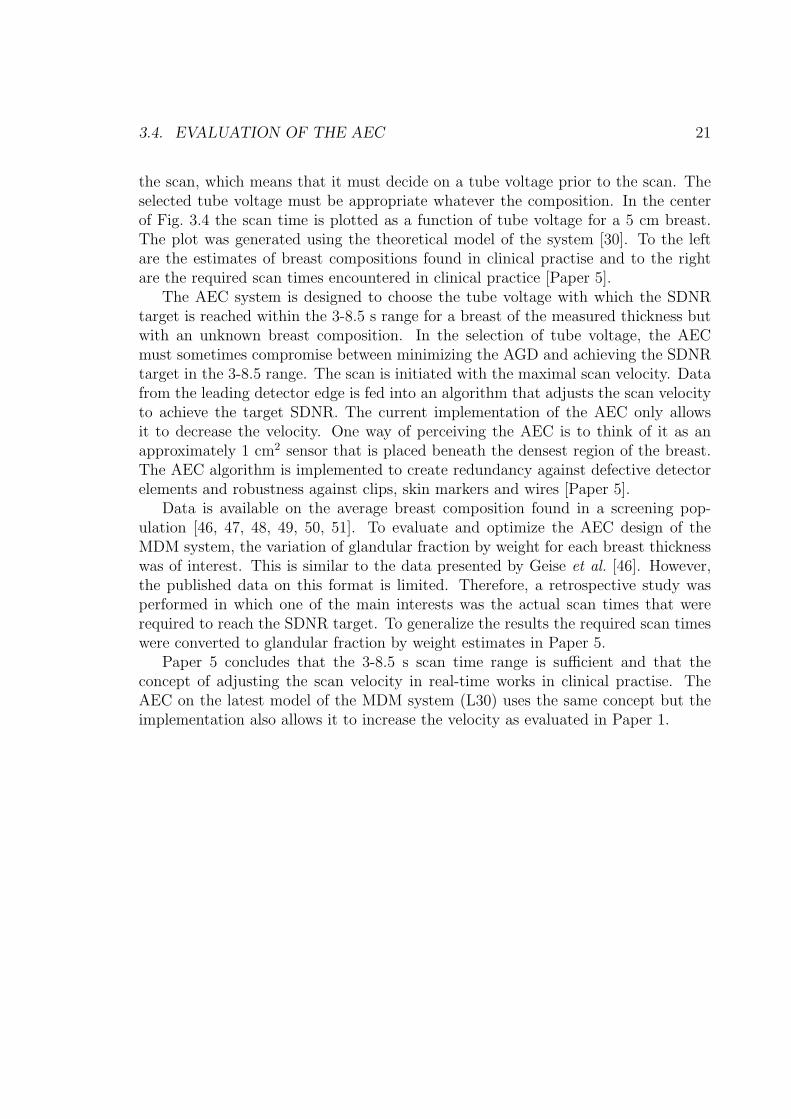
the scan, which means that it must decide on a tube voltage prior to the scan. Theselected tube voltage must be appropriate whatever the composition. In the centerof Fig. 3.4 the scan time is plotted as a function of tube voltage for a 5 cm breast.The plot was generated using the theoretical model of the system [30]. To the leftare the estimates of breast compositions found in clinical practise and to the rightare the required scan times encountered in clinical practice [Paper 5].
The AEC system is designed to choose the tube voltage with which the SDNRtarget is reached within the 3-8.5 s range for a breast of the measured thickness butwith an unknown breast composition. In the selection of tube voltage, the AECmust sometimes compromise between minimizing the AGD and achieving the SDNRtarget in the 3-8.5 range. The scan is initiated with the maximal scan velocity. Datafrom the leading detector edge is fed into an algorithm that adjusts the scan velocityto achieve the target SDNR. The current implementation of the AEC only allowsit to decrease the velocity. One way of perceiving the AEC is to think of it as anapproximately 1 cm2 sensor that is placed beneath the densest region of the breast.The AEC algorithm is implemented to create redundancy against defective detectorelements and robustness against clips, skin markers and wires [Paper 5].
Data is available on the average breast composition found in a screening pop-ulation [46, 47, 48, 49, 50, 51]. To evaluate and optimize the AEC design of theMDM system, the variation of glandular fraction by weight for each breast thicknesswas of interest. This is similar to the data presented by Geise et al. [46]. However,the published data on this format is limited. Therefore, a retrospective study wasperformed in which one of the main interests was the actual scan times that wererequired to reach the SDNR target. To generalize the results the required scan timeswere converted to glandular fraction by weight estimates in Paper 5.
Paper 5 concludes that the 3-8.5 s scan time range is sufficient and that theconcept of adjusting the scan velocity in real-time works in clinical practise. TheAEC on the latest model of the MDM system (L30) uses the same concept but theimplementation also allows it to increase the velocity as evaluated in Paper 1.
22 CHAPTER 3. EXPOSURE CONTROL
Chapter 4
Physical Characterization
23
24 CHAPTER 4. PHYSICAL CHARACTERIZATION
4.1 Introduction
High contrast resolution, as quantified by the number of line-pairs resolved in alead-bar phantom or the MTF measured with an edge- or slit-method, is used asa figure of merit for contrast-limited screen-film mammography systems. Thereforethe high contrast resolution is sometimes used to characterize digital systems as well.However, digital systems are noise-limited and the fundamental measure of resolutionin a noise-limited imaging system should be defined from the NEQ [24]. The DQE isconsidered by many to be the best parameter to describe and characterize the physicalperformance of digital mammography detectors [52]. Methods to measure the DQEhave evolved over the past decades. One of the problems is that the DQE resultsfrom different working groups are sometimes incommensurable [52]. A standardizedDQE measurement method for digital mammography was therefore considered ofimportance and a standard is near completion by the IEC [18].
The methods to measure the DQE are designed to remove the effect from allsystem components but the detector, e.g. the beam quality, the x-ray tube focalspot, the scattered radiation and the attenuation in the breast support. However,it is of interest to compare system level performance. The goal is to be able to usea physical measure to predict how a system would perform in clinical practise. Thereason is that investigations using human observers suffer from being expensive, timeconsuming and subjective. This includes both clinical trials and phantom studies.One option is the use of computer programs implementing an observer in phantomevaluations, but these suffer from having varying observer efficiency for differentsystems [53]. The effect on system performance from individual components in theimaging chain has been studied, e.g. beam quality [33], energy weighting [54, 55, 56]and scattered radiation [57, 58, 59]. Few attempts have been made to define a systemperformance metric that can be derived from statistical decision theory and is easyto determine experimentally [23, 60].
The research conducted on measuring the DQE on a scanning photon countingsystem in accordance with the standardized method is discussed in section 4.2 andPaper 4. The benefits of the efficient scatter rejection with the multislit geometryversus area detectors and grids are discussed in section 4.3 and Paper 2. Systemperformance is discussed in section 4.4.
4.2 DQE
Several assumptions are made when using the Fourier-transform linear-systems ap-proach that forms the basis of the DQE metric. A Fourier based approach requiresthat the system is linear and its response shift-invariant. By restricting the regionof interest (ROI) used to determine the DQE it is assumed that the system is ap-proximately shift-invariant in that ROI [18]. The linearity is usually experimentallyverified for the exposure range in which the DQE is determined [Paper 4].
4.2. DQE 25
0 5 10 15 200
0.1
0.2
0.3
0.4
0.5
0.6
0.7
0.8
0.9
1
Frequency (mm-1)
MT
F
123
Figure 4.1: The MTF measured on the MDM system in the slit direction (perpen-dicular to the scan direction). The average of five repeated MTF measurements forthree different methods are plotted. 1: A method similar to that used in Saunderset al., using a 10 mm edge-spread function and a Hanning window to force the edgesof the point-spread function to zero. 2: The IEC method, which uses very little dataconditioning. In this case a 10 mm edge-spread function is used. 3: The IEC methodwith the prescribed 50 mm edge-spread function across the edge.
26 CHAPTER 4. PHYSICAL CHARACTERIZATION
A slanted edge method is often used to measure the presampled MTF. The pre-sampled MTF describes the system’s response except for the stage of sampling [22].In order to get the point-spread function, the method involves the derivation of anedge-spread function (ESF) as measured across the edge of an opaque test object.The slanted edge makes it possible to sample the ESF with a finer resolution than thepixel pitch. Assume we want to measure the point-spread function in the detectorcolumn direction. The edge is then positioned nearly parallel with the detector rowdirection. Methods exist in which the oversampled ESF is created from combiningneighboring ESFs as given by pixel columns across the edge [18, 61]. There are alsomethods which use the data in the row direction (nearly parallel to the edge) as theoversampled ESFs [62, 63]. The derivation makes the slanted edge method sensitiveto noise in the ESF. The methods allow different amounts of data conditioning. Toensure long enough tails of the ESF to detect a low frequency drop in the MTF,data from approximately 25 mm along the edge is used to generate the ESFs in theIEC method [18, 61]. The methods have been shown to yield slightly different re-sults [64, 26]. The standardization of the method is therefore an important step inmaking the results portable. For the investigated system the results of three meth-ods are plotted Fig. 4.1. The more data conditioning - the smoother MTF and thesmaller low-frequency drop. The differences are quite small compared to the error inthe MTF. The errorbars of the MTFs in Fig. 4.1 (as given by the standard error inthe mean calculated from the five MTFs averaged for each MTF in Fig .4.1) overlapeven at the low-frequencies, which is why they were not included in the figure.
The NPS is measured in uniform images that are assumed to have stationaryand ergodic noise. Stationary means that the noise characteristics are the samethroughout the image and ergodic means that a spatial average may be used insteadof an ensemble average. Stationary noise is usually true in low-contrast imagingtasks while the ergodicity is more difficult to prove [19]. In each uniform image, theROI is divided into smaller ROIs (e.g. 258 by 258 pixels), which in some methodsoverlap. The smaller ROIs from several images at the same dose may be combinedto reduce the error in the measured NPS. The two dimensional NPS of an ROI isgiven by the squared absolute value of the two-dimensional Fast Fourier transformsnormalized with the inverse of the pixel area and the ROI area. The NPS is calculatedas the average of the NPS of the smaller ROIs. A Heel effect may cause a lowfrequency non-stationary mean and variance. This low-frequency trend is usuallyreduced by subtracting a second-order polynomial surface to the image before theNPS is calculated. The NNPS is the NPS scaled with the squared inverse of themean signal in the ROI. By calculating the NNPS already on the smaller ROIs, theeffect of exposure variations across the image is further reduced [22].
The main conclusions from the physical characterization in Paper 4 are: (1) thesystem is perfectly quantum limited even at low exposures, which reflects that thephoton counters block all the detector noise; (2) the system has a high DQE, whichreflects that the edge-on Silicon absorbs most of the incident photons; (3) it is difficultto decouple system from detector performance of a scanning multislit system.
4.3. SCATTERED RADIATION 27
0 1 2 30
0.05
0.1
0.15
0.2
w (mm)
SP
R
0 2 4 6 8 100
0.02
h (mm)
SP
R
0.04
0.06
0.08
0.10
50400 3020100
0.01
0.02
0.03
0.04
0.05S
PR
(m
m-1
)
x (mm)
Figure 4.2: Left: SPR (mm−1) as a function of distance from primary beam, whichwas used to evaluate the post-collimator performance. Center: SPR as a functionof post-collimator slit width. The height of the slits was 6.5 mm. Right: SPR as afunction of post-collimator slit height. The width of the slits was 0.7 mm. In bothcases the slits were separated by 3.5 mm.
4.3 Scattered radiation
A system that scans a larger field of view with a smaller detector reduces the amountof scattered radiation that reaches the detector. A system with a slot scan geometrymay therefore have a relatively low scatter to primary ratio (SPR) [65] and it is notevident that a grid would improve the performance in such a geometry [66]. Themultislit geometry has been suggested as one in which very efficient scatter rejectionshould be possible [67, 68]. Alignment problems have forced some of these designs toirradiate outside sensitive detector area [66, 68]. The MDM system was designed tohave a low SPR at a high primary transmission. The sensitive area of the detector onthe MDM system is wider than the x-ray beam as shaped by the pre-collimator. Thismakes it possible to have a post-collimator slit width that is wider than the x-raybeam [Paper 2]. On the D40, the post-collimator is comprised of two sheets with aseparation, h, equal to 6.5 mm to narrow the angular acceptance. The width, w, ofthe slits is 0.7 mm and slits are distributed with a pitch, p, of 3.5 mm, i.e. effectively20% of the area is open. Fig. 4.2 plots the results of Monte-Carlo simulations used toevaluate the effect of the width and height of the post-collimator [69], which showsthat the parameters of the MDM system should yield a low SPR.
In screen-film mammography where the dose to the detector must be maintained,two separate metrics are used to assess the performance of a grid. For digital systemswhere the dose to the detector is somewhat arbitrary, a scatter DQE can be defined
28 CHAPTER 4. PHYSICAL CHARACTERIZATION
to assess the performance of a grid [57]. The scatter DQE is the SDQE of Eq. 2.5calculated as the SDNR2 of an otherwise ideal system that uses a grid over the SDNR2
of an ideal system (this time the grid is also ideal). Thus, the scatter DQE measuresthe efficiency of the scatter device in transferring the available SDNR2. Scatteredphotons reach quite far from the primary beam from where it was scattered, creatinga relatively broad scatter point spread function (see Fig. 4.2). This creates a slowlyvarying scatter field behind the breast that decreases towards its edges [70]. Theeffect on the MTF from a broad scatter point-spread function is on the low spatialfrequencies [71]. If we approximate the scatter point-spread function as infinitelybroad, the MTF would not be affected. The NPS is also not affected by the scatteredphotons since they do not induce any correlations in the photons detected by theassumed ideal counting detector. Thus, the simpler SDNRRose defined in Eq. 2.8 canbe used in the calculations of the scatter DQE.
The scatter field depends mainly on the breast thickness and it is well categorizedby the SPR parameterized as a function of breast thickness and semicircular breastdiameter [72]. The measurements of the SPR for a scanning multislit geometry wereconducted with a beam stop method.
The main conclusions in Paper 2 are: (1) that the two figures of merit used forscreen-film systems (the contrast improvement factor and the Bucky factor) can becombined into one suited for digital system; (2) the benefit of grids is not evident fordigital mammography; (3) the multislit geometry has nearly perfect scatter rejectionand thus the geometry should be able to operate at approximately 60% of the AGDat maintained image quality when compared to conventional area systems.
4.4 System DQE
The effect of scattered radiation is excluded in the DQE metric. The scatter DQEquantifies the SDNR2 transfer through the scatter rejection device. Thus, a systemperformance metric could be defined as the DQE of the detector multiplied with thescatter DQE [58]. On the positive side are: (1) that it is a good approximationconsidering that the scatter point-spread function is broad; (2) scattered radiation isa major source of image quality degradation; (3) the efficiency of the scatter rejectiondevices used by different systems differ. On the negative side is that the effect fromother system components are not included, e.g. the beam quality, focal-spot blur andattenuation in breast support. In Fig. 4.3, DQE measured by Monnin et al. [73] onseveral systems and the scatter DQE from Paper 2 are combined. The Sectra MDMsystem is the most dose efficient system. Thus, it can be concluded that this systemcan provide the same image quality at reduced doses. This conclusion is supportedby phantom evaluations in which image quality of a digital area system employing aCsI scintillator could be matched at 54% of the AGD [74].
The SDQE defined in Eq. 2.5 is a system performance metric. To determine theSDQE the output SDNR of the system must be measured using the most suitable
Figure 4.3: System DQE calculated as the product of the DQE and the scatter DQEas suggested by Samei et al. [58] using the data from Monnin et al. [73] and Aslundet al. [Paper 2].
of Eqs. 2.4, 2.7 or 2.8. SDNRσ and SDNRRose are straightforward to measure us-ing a homogenous phantom with an added low-contrast object [31]. To measure thespatial frequency dependent SDNR defined in Eq. 2.4, the methods evolved for thedetermination of the NEQ [18] can be used but also here with the addition of a con-trast measurement. Fig. 4.4 compares the SDNR measured with different electronicthresholds in the photon counters. A higher threshold results in lower NEQ acrossall frequencies. The likely reason is that the photons with the lowest energies arenot detected as the threshold is increased. This is also why the measured contrastdecreases with increasing threshold. The threshold corresponding to the peak NEQis not the lowest threshold. The likely reason is that the charge sharing and thus thecorrelations in the noise increase with decreased threshold. The SNRpixel on the otherhand increases with more correlations, since it smoothes the noise. The SDNR2(ω)in Fig. 4.4 demonstrates how a comparison between different SDQE would look like.The SDQE would be the SDNR2(ω) normalized with the square of the input contrastand the number of incident quanta, which were both constant in this comparison.The determination of the input contrast is one problem that would have to be solvedfor an absolute SDQE measure to be portable between different laboratories. Onewould either have to manufacture precise contrasts so that a tabulated contrast valuecould be used or calibrate the contrast on a reference system [23]. The last graph ofFig. 4.4 demonstrates that different optima may be found using the different SDNRsas figure of merit. The threshold affects the MTF and the correlations in the noise,which means that the entire frequency range of the SDNR2(ω) should be consideredin an optimization of the threshold. The arguments for the need of a standardized de-
30 CHAPTER 4. PHYSICAL CHARACTERIZATION
0 2 4 6 8 100
2
4
6
8x 10
5
NE
Q(ω
) (m
m-2
) Th = 1 Th = 2Th = 3Th = 4
1 2 3 44.7
4.8
4.9
5
5.1
5.2
Th
Co
ntr
ast
(%
)
1400
1600
1800
2000
2200
2400
SN
R2
pix
el
Contrast
0 2 4 6 8 100
500
1000
1500
2000
SD
NR
2(ω
) (
mm
-2)
Th
SDNRσ/Apixel
SDNR(0)
SNR2
Th = 1 Th = 2Th = 3Th = 4
Spatial frequency (mm−1
)
Spatial frequency (mm−1
)
1 2
3 41 2 3
1000
1500
2000
2500
3000
SD
NR
2(0
) (
mm
-2)
4
Figure 4.4: Repeated exposures were made of a homogenous phantom simulating a5 cm breast with a 0.1 mm Al foil added. The threshold (Th) of the photon counterswas changed between the exposures. A higher nominal Th value corresponds to ahigher threshold energy. 1: NEQ as a function of spatial frequency for differentthresholds. 2: Contrast of a 0.1 mm Al foil for different thresholds. Included in thegraph is also the SNR2
pixel measured in the homogenous background. 3: SDNR2(ω)as defined in Eq. 2.4. 4: SDNR2
σ/Apixel as defined in Eq. 2.7 with Atarget = 1 mm2
and Apixel = 502 µm2. Included is also the SDNR2(0) as defined in Eq. 2.4.
4.4. SYSTEM DQE 31
finition and method to measure system performance are similar to those of the DQE.The system performance metric has the additional advantage of at least in theorybeing closer to linking physical performance to performance in clinical practise.
32 CHAPTER 4. PHYSICAL CHARACTERIZATION
Acknowledgements
I would like to thank Mats Lundqvist and Bjorn Cederstrom for sharing your knowl-edge in this field for the last seven years. You’re two of the brightest people I know.Torbjorn Hjarn – thank you for making jigs for the DQE experiments and for yourideas. Hans Bornefalk – for being in the same situation. Erik Fredenberg for thecollaboration with Paper 3. I have also received advices and expert options frommany of my other colleges at Sectra and KTH. I would like to express my admirationand gratitude to my supervisor, professor Mats Danielsson. Without your inspiringguidance, connections and visions I would not have endured. Andreas Lundgren –thank you for the supporting messages and for reminding me that there is light atthe end of the tunnel. Finally, I would like thank my wife for your patience.
33
34 CHAPTER 4. PHYSICAL CHARACTERIZATION
Bibliography
[1] P. Boyle and J. Ferlay. Cancer incidence and mortality in Europe, 2004. Ann.Oncol., 16(3):481–8, 2005.
[2] L. Tabar, B. Vitak, H. Chen, M. Yen, S. Duffy, and R. Smith. Beyond random-ized controlled trials: organized mammographic screening substantially reducesbreast carcinoma mortality. Cancer, 91(9):1724–31, 2001.
[3] S. Moss, H. Cuckle, A. Evans, L. Johns, M. Waller, and L. Bobrow. Effectof mammographic screening from age 40 years on breast cancer mortality at 10years’ follow-up: a randomised controlled trial. Lancet, 368(9552):2053–60, 2006.
[4] C. Klabunde, H. Sancho-Garnier, S. Taplin, S. Thoresen, N. Ohuchi, andR. Ballard-Barbash. Quality assurance in follow-up and initial treatment forscreening mammography programs in 22 countries. Int. J. Qual. Health Care,14(6):449–61, 2002.
[5] Commission of the European Communities. Proposal for a council recommen-dation on cancer screening. Brussels 0093 (CNS), May 2003.
[6] J. Smith and E. Andreopoulou. An overview of the status of imaging screeningtechnology for breast cancer. Ann. Oncol., 15 Suppl 1(NIL):I18–I26, 2004.
[7] K. Faulkner. Mammographic screening: is the benefit worth the risk? Radiat.Prot. Dosim., 117(1-3):318–20, 2005.
[8] M. Mahesh. AAPM/RSNA physics tutorial for residents: digital mammography:an overview. Radiographics, 24(6):1747–60, 2004.
[9] K. Fetterly and B. Schueler. Performance evaluation of a ”dual-side read” dedi-cated mammography computed radiography system. Med. Phys., 30(7):1843–54,2003.
[10] Y. Unno. Atlas silicon microstrip semiconductor tracker (sct). Nucl. Instrum.Meth. Sect. A, 2-3:109–120, 2000.
[11] E. Pisano, C. Gatsonis, E. Hendrick, M. Yaffe, J. Baum, S. Acharyya, E. Co-nant, L. Fajardo, L. Bassett, C. D’Orsi, R. Jong, and M. Rebner. Diagnostic
35
36 BIBLIOGRAPHY
performance of digital versus film mammography for breast-cancer screening. N.Engl. J. Med., 353(17):1773–83, 2005.
[12] N. Perry, M. Broeders, C. de Wolf, S. Tornberg, R. Holland, and L. von Karsa,editors. European Guidlines for quality assurance in breast cancer screening.Office for Official Publications of the European Communities, Luxembourg, 4edition, 2006.
[13] P. Sharp, C. Metz, R. Wagner, K. Myers, and A. Burgess. ICRU Rep. 54Medical imaging: the assessment of image quality. International Commission onRadiological Units and Measurements, Bethesda, Md, 1996.
[14] P. Skaane, K. Young, and A. Skjennald. Population-based mammography screen-ing: comparison of screen-film and full-field digital mammography with soft-copyreading–Oslo I study. Radiology, 229(3):877–84, 2003.
[15] P. Skaane and A. Skjennald. Screen-film mammography versus full-field digitalmammography with soft-copy reading: randomized trial in a population-basedscreening program–the Oslo II Study. Radiology, 232(1):197–204, 2004.
[16] J. Lewin, C. D’Orsi, R. Hendrick, L. Moss, P. Isaacs, A. Karellas, and G. Cutter.Clinical comparison of full-field digital mammography and screen-film mammog-raphy for detection of breast cancer. Am. J. Roentgenol, 179(3):671–7, 2002.
[17] A. Bloomquist, M. Yaffe, E. Pisano, R. Hendrick, G. Mawdsley, S. Bright,S. Shen, M. Mahesh, E. Nickoloff, R. Fleischman, M. Williams, A. Maidment,D. Beideck, J. Och, and J. Seibert. Quality control for digital mammography inthe ACRIN DMIST trial: part I. Med. Phys., 33(3):719–36, 2006.
[18] 62220-1-2: Medical electrical equipment characteristics of digital X-ray imag-ing devices - Part 1-2: Determination of the detective quantum efficiency -Mammography detectors. International Electrotechnical Commission, Geneva,Switzerland, 62b/587/cdv edition, 2005.
[19] I. Cunningham and R. Shaw. Signal-to-noise optimization of medical imagingsystems. J. OPT. SOC. AM. A, 16(3):621–632, 1999.
[20] A. Rose. Vision: Human and Electronic. New York: Plenum Press, 1973, 1973.
[21] J. Dainty and R. Shaw. Image science. Principles, analysis and evaluation ofphotographic-type imaging processes. London: Academic Press, 1974, 1974.
[22] J. Beutel, H. Kundel, and R. Van Metter, editors. Handbook of medical imaging,volume 1. SPIE Press, Bellingham, Washington, 2000.
[23] M. Lundqvist. Silicon Strip Detectors for Scanned Multi-Slit X-Ray Imaging.PhD thesis, Department of Physics, Kunliga Tekniska Hogskolan, Stockholm,Sweden, 2003.
BIBLIOGRAPHY 37
[24] R. Wagner and D. Brown. Unified snr analysis of medical imaging systems.Phys. Med. Biol., 30(6):489–518, 1985.
[25] J. III Dobbins, E. Samei, N. Ranger, and Y. Chen. Intercomparison of meth-ods for image quality characterization. II. Noise power spectrum. Med. Phys.,33(5):1466–75, 2006.
[26] E. Samei, N. Ranger, J. III Dobbins, and Y. Chen. Intercomparison of methodsfor image quality characterization. I. Modulation transfer function. Med. Phys.,33(5):1454–65, 2006.
[27] K. Young, M. Ramsdale, and A. Rust. Dose and image quality in mammographywith an automatic beam quality system. Br. J. Radiol., 69:555–62, 1996.
[28] K. Young, M. Ramsdale, A. Rust, and J. Cooke. Effect of automatic kv selectionon dose and contrast for mammographic x-ray system. Br. J. Radiol., 70:1036–1042, 1997.
[29] R. Hendrick E. Berns and G. Cutter. Optimization of technique factors for asilicon diode array full-field digital mammography system and comparison toscreen-film mammography with matched average glandular dose. Med. Phys.,30(3):334–40, 2003.
[30] M. Aslund, B. Cederstrom, M. Lundqvist, and M. Danielsson. Optimizationof operating conditions in photon-counting multi-slit mammography based onsi-strip detectors. In M. Flynn and J. Hsieh, editors, Medical Imaging 2006:Physics of Medical Imaging, volume 6142 of Proceedings of SPIE. SPIE, 2006.
[31] E. Samei, J. III Dobbins, J. Lo, and M. Tornai. A framework for optimising theradiographic technique in digital X-ray imaging. Radiat. Prot. Dosim., 114(1-3):220–9, 2005.
[32] M. Lundqvist, M. Aslund, B. Cederstrom, and M. Danielsson. Phantom con-struction considerations. In M. Flynn and J. Hsieh, editors, Medical Imaging2007: Physics of Medical Imaging, volume 6510 of Proceedings of SPIE. SPIE,2007.
[33] M. Andre and B. Spivey. Optimization of tungsten x-ray spectra for digitalmammography: comparison of model to experiment. In R. Van Metter andJ. Beutel, editors, Medical Imaging 1997: Physics of Medical Imaging, volume3032 of Proceedings of SPIE. SPIE, 1997.
[34] R. Jennings, R. Eastgate, M. Siedband, and D. Ergun. Optimal x-ray spectrafor screen-film mammography. Med. Phys., 8(5):629–39, 1981.
[35] E. Gingold, X. Wu, and G. Barnes. Contrast and dose with Mo-Mo, Mo-Rh, andRh-Rh target-filter combinations in mammography. Radiology, 195(3):639–44,1995.
38 BIBLIOGRAPHY
[36] A. Thilander-Klang, P. Ackerholm, I. Berlin, N. Bjurstam, S. Mattsson, L. Mans-son, C. von Scheele, and S. Thunberg. Influence of anode-filter combinations onimage quality and radiation dose in 965 women undergoing mammography. Ra-diology, 203(2):348–54, 1997.
[37] C. Kimme-Smith, J. Sayre, M. McCombs, N. DeBruhl, and L. Bassett. Breastcalcification and mass detection with mammographic anode-filter combinationsof molybdenum, tungsten, and rhodium. Radiology, 203(3):679–83, 1997.
[38] R. Fahrig, J. Rowlands, and M. Yaffe. X-ray imaging with amorphous selenium:optimal spectra for digital mammography. Med. Phys., 23(4):557–67, 1996.
[39] D. Dance, A. Thilander, M. Sandborg, C. Skinner, I. Castellano, and G. Carls-son. Influence of anode/filter material and tube potential on contrast, signal-to-noise ratio and average absorbed dose in mammography: a Monte Carlo study.Br. J. Radiol., 73(874):1056–67, 2000.
[40] W. Huda, A. Sajewicz, K. Ogden, and D. Dance. Experimental investigation ofthe dose and image quality characteristics of a digital mammography imagingsystem. Med. Phys., 30(3):442–8, 2003.
[41] T. Nishino, X. Wu, and R. Johnson. Thickness of molybdenum filter and squaredcontrast-to-noise ratio per dose for digital mammography. Am. J. Roentgenol,185(4):960–3, 2005.
[42] M. Williams, P. Raghunathan, A. Seibert, A. Kwan, J. Lo, E. Samei, L. Fa-jardo, A. Maiment, M. YAffe, and A. Bloomquist. Beam optimization for digitalmammography - ii. In Astley et al. [75], pages 273–280.
[43] R. Hendrick E. Berns and G. Cutter. Performance comparison of full-field digitalmammography to sceen-film mammography in clinical practise. Med. Phys.,29(4):830–834, 2002.
[44] I. Elbakri, A. Lakshminarayanan, and M. Tesic. Automatic exposure control fora slot scanning full field digital mammography system. Med. Phys., 32(9):2763–2770, 2005.
[45] N. Shramchenko, P. Blin, C. Mathey, and R. Klausz. Optimized exposure controlin digital mammography. In Yaffe and Flynn [76].
[46] R. Geise and A. Palchevsky. Composition of mammographic phantom materials.Radiology, 198(2):347–50, 1996.
[47] R. Klein, H. Aichinger, J. Dierker, J. Jansen, S. Joite-Barfuss, M. Sabel,R. Schulz-Wendtland, and J. Zoetelief. Determination of average glandular dosewith modern mammography units for two large groups of patients. Phys. Med.Biol., 42(4):651–71, 1997.
BIBLIOGRAPHY 39
[48] K. Young, M. Ramsdale, and F. Bignell. Review of Dosimetric Methods forMammography in the UK Breast Screening Programme. Radiat. Prot. Dosim.,80(1-3):183–186, 1998.
[49] J. Beckett and C. Kotre. Dosimetric implications of age related glandular changesin screening mammography. Phys. Med. Biol., 45(3):801–813, 2000.
[50] B. McParland and M. Boyd. A comparison of fixed and variable kVp techniqueprotocols for film-screen mammography. Br. J. Radiol., 73(870):613–626, 2000.
[51] N. Jamal, K. Ng, D. McLean, L. Looi, and F. Moosa. Mammographic breastglandularity in Malaysian women: data derived from radiography. Am. J.Roentgenol, 182(3):713–7, 2004.
[52] U. Fischer, K. Hermann, and F. Baum. Digital mammography: current stateand future aspects. Eur. Radiol., 16(1):38–44, 2006.
[53] K. Young, J. Cook, and J. Oduko. Automated and human determination ofthreshold contrast for digital mammography systems. In Astley et al. [75], pages266–272.
[54] R. Cahn, B. Cederstrom, M. Danielsson, A. Hall, M. Lundqvist, and D. Ny-gren. Detective quantum efficiency dependence on x-ray energy weighting inmammography. Med. Phys., 26(12):2680–3, 1999.
[55] M. Tapiovaara and R. Wagner. Snr and dqe analysis of broad spectrum x-rayimaging. Phys. Med. Biol., 30(6):519–529, 1985.
[56] J. Marchal. Extension of x-ray imaging linear systems analysis to detectors withenergy discrimination capability. Med. Phys., 32(8):2717–28, 2005.
[57] R. Wagner. Noise equivalent parameters in general medical radiography: Thepresent picture and future pictures. Photogr. Sci. Eng., 21:252–262, 1977.
[58] E. Samei, R. Saunders, J. Lo, J. III Dobbins, J. Jesneck, C. Floyd, and C. Ravin.Fundamental imaging characteristics of a slot-scan digital chest radiographicsystem. Med. Phys., 31(9):2687–98, 2004.
[59] I. Kyprianou, S. Rudin, D. Bednarek, and K. Hoffmann. Generalizing the MTFand DQE to include x-ray scatter and focal spot unsharpness: application to anew microangiographic system. Med. Phys., 32(2):613–26, 2005.
[60] M. Tapiovaara and R. Wagner. Snr and noise measurements for medical imaging:I. a practical approach based on statistical decision theory. Phys. Med. Biol.,38(1):71–92, 1993.
40 BIBLIOGRAPHY
[61] H. Illers, E. Buhr, S. Gunther-Kohfahl, and U. Neitzel. Measurement of themodulation transfer function of digital X-ray detectors with an opaque edge-testdevice. Radiat. Prot. Dosim., 114(1-3):214–9, 2005.
[62] E. Samei, M. Flynn, and D. Reimann. A method for measuring the presampledMTF of digital radiographic systems using an edge test device. Med. Phys.,25(1):102–13, 1998.
[63] R. Saunders, E. Samei, J. Jesneck, and J. Lo. Physical characterization of aprototype selenium-based full field digital mammography detector. Med. Phys.,32(2):588–99, 2005.
[64] A. Carton, D. Vandenbroucke, L. Struye, A. Maidment, Y. Kao, M. Albert,H. Bosmans, and G. Marchal. Med. Phys., 32(6):1684–95, 2005.
[65] J. Boone, J. Seibert, C. Tang, and S. Lane. Grid and slot scan scatter reductionin mammography: comparison by using Monte Carlo techniques. Radiology,222(2):519–27, 2002.
[66] S. Shen, A. Bloomquist, G. Mawdsley, M. Yaffe, and I. Elbakri. Effect of scatterand an antiscatter grid on the performance of a slot-scanning digital mammog-raphy system. Med. Phys., 33(4):1108–15, 2006.
[67] M. King, G. Barnes, and M. Yester. Reduced Dose Mammography. Masson, NewYork, 1979.
[68] M. Yester, G. Barnes, and M. King. Experimental measurements of the scatterreduction obtained in mammography with a scanning mutliple slit assembly.Med. Phys., 8:158–162, 1981.
[69] M. Aslund, B. Cederstrom, M. Lundqvist, and M. Danielsson. Scatter rejectionin scanned multislit mammography. In Yaffe and Flynn [76].
[70] J. Boone and V. III Cooper. Scatter/primary in mammography: Monte Carlovalidation. Med. Phys., 27(8):1818–31, 2000.
[71] J. Boone, B. Arnold, and J. Seibert. Characterization of the point spread func-tion and modulation transfer function of scattered radiation using a digital imag-ing system. Med. Phys., 13(2):254–6, 1986.
[72] J. Boone, K. Lindfors, V. Cooper III, and J. Seibert. Scatter/primary in mam-mography: Comprehensive results. Med. Phys., 27:2408–2416, 2000.
[73] P. Monnin, D. Gutierrez, S. Bulling, D. Guntern, and F. Verdun. A comparisonof the performance of digital mammography systems. Med. Phys., 34(3):906–914,2007.
BIBLIOGRAPHY 41
[74] A. Fischmann and G. Steidle. Image quality of a photon-counting mammographysystem compared to digital mammography based on amorphous silicon with csi-scintillator. In Astley et al. [75], pages 441–446.
[75] S. Astley, M. Brady, C. Rose, and R. Zwiggelaar, editors. Digital Mammography,8th International Workshop, IWDM 2006, Manchester, UK, June 18-21, 2006,Proceedings, volume 4046 of Lecture Notes in Computer Science. Springer, 2006.
[76] M. Yaffe and M. Flynn, editors. volume 5368 of Proceedings of SPIE. SPIE,2004.