21
DIGITAL MONEY TRENDS REPORT PRESENTED BY

DIGITAL MONEY TRENDS REPORT
PRESENTED BY
INTRODUCTIONCanadians continue to look beyond traditional sources when
learning about and applying for personal finance products. Sites
like RateHub.ca, which attracts 500,000+ monthly visitors, allow
Canadians to compare and apply for mortgage rates, credit
cards, and bank accounts. Other financial technology (“fintech”)
companies are offering personal loans or wealth management
services online, amongst other products and services.
The 2016 RateHub.ca Digital Money Trends Report provides
insights into how Canadians use financial technology, how they
manage their finances, and how their behaviour affects the
financial services landscape in Canada.
The data in this report are based on two main sources:
RateHub.ca Mortgage User DataThis report incorporates more than 100,000 mortgage rate requests between January 2012 andNovember 2016. This data represents actual consumer behaviour based on real product offerings.
RateHub.ca Digital Money Trends SurveyRateHub.ca conducted an online survey of more than 1,000 Canadians from September 2016 to November 2016 to ask them about their personal finance habits.
The report also includes information from Google, including RateHub.ca traffic data, plus Google search volumes data, which is the primary source in all “search” sections.
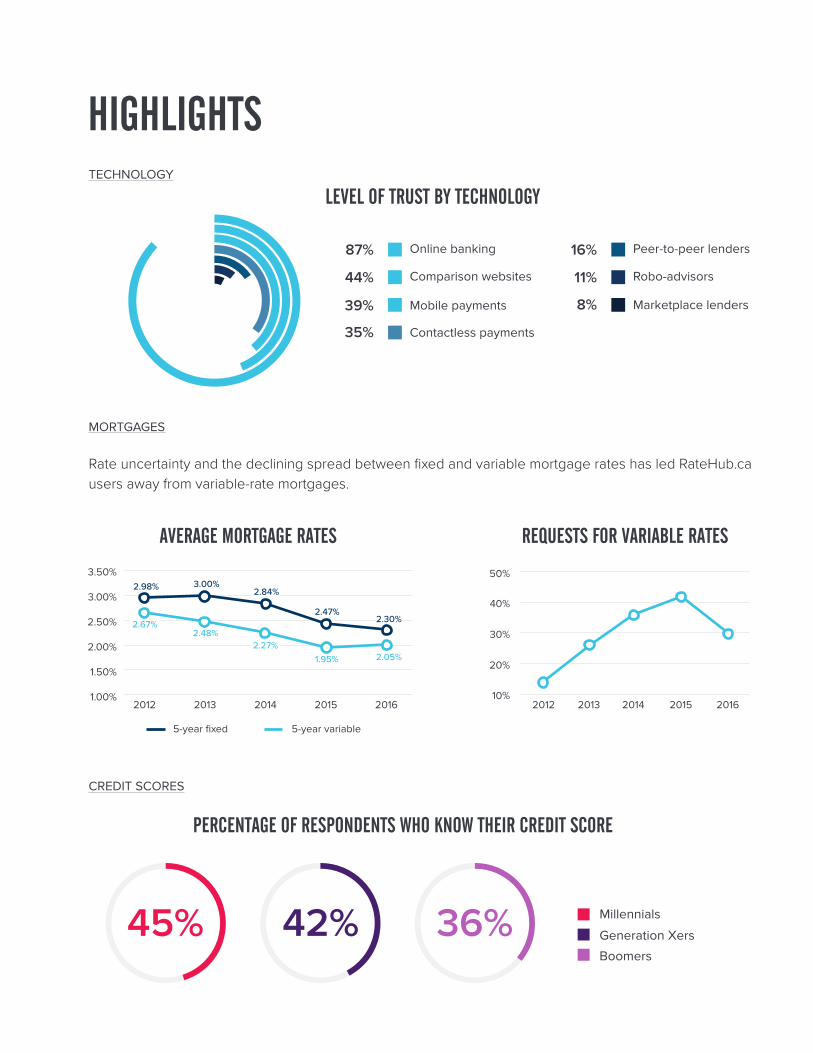
HIGHLIGHTS
Rate uncertainty and the declining spread between fixed and variable mortgage rates has led RateHub.ca users away from variable-rate mortgages.
20%
10%20162015201420132012
30%
40%
50%2.98% 3.00%
2.47%
1.00%
1.50%
2012 201620142013 2015
2.00%
2.50%
3.00%
3.50%
2.30%
2.05%
2.48%2.27%
1.95%
2.84%
2.67%
REQUESTS FOR VARIABLE RATESAVERAGE MORTGAGE RATES
Online banking
Comparison websites
Mobile payments
Robo-advisors
Contactless payments
Marketplace lenders
Peer-to-peer lenders 87%
44%
39%
11%
35%
8%
16%
LEVEL OF TRUST BY TECHNOLOGY
Boomers
Generation Xers
Millennials 36%42%45%
PERCENTAGE OF RESPONDENTS WHO KNOW THEIR CREDIT SCORE
5-year variable5-year fixed
TECHNOLOGY
MORTGAGES
CREDIT SCORES
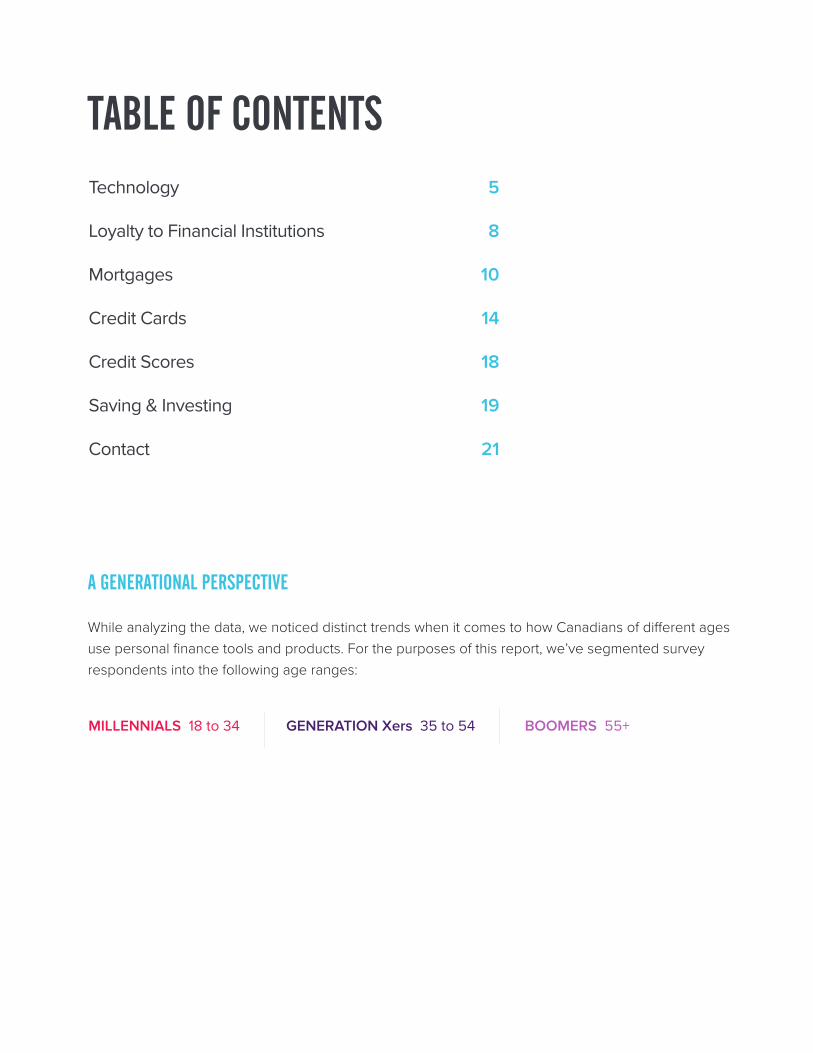
TABLE OF CONTENTS
A GENERATIONAL PERSPECTIVE
While analyzing the data, we noticed distinct trends when it comes to how Canadians of different agesuse personal finance tools and products. For the purposes of this report, we’ve segmented surveyrespondents into the following age ranges:
MILLENNIALS 18 to 34 GENERATION Xers 35 to 54 BOOMERS 55+
Technology
Loyalty to Financial Institutions
Mortgages
Credit Cards
Credit Scores
Saving & Investing
Contact
5
8
10
14
18
19
21
TECHNOLOGY 5
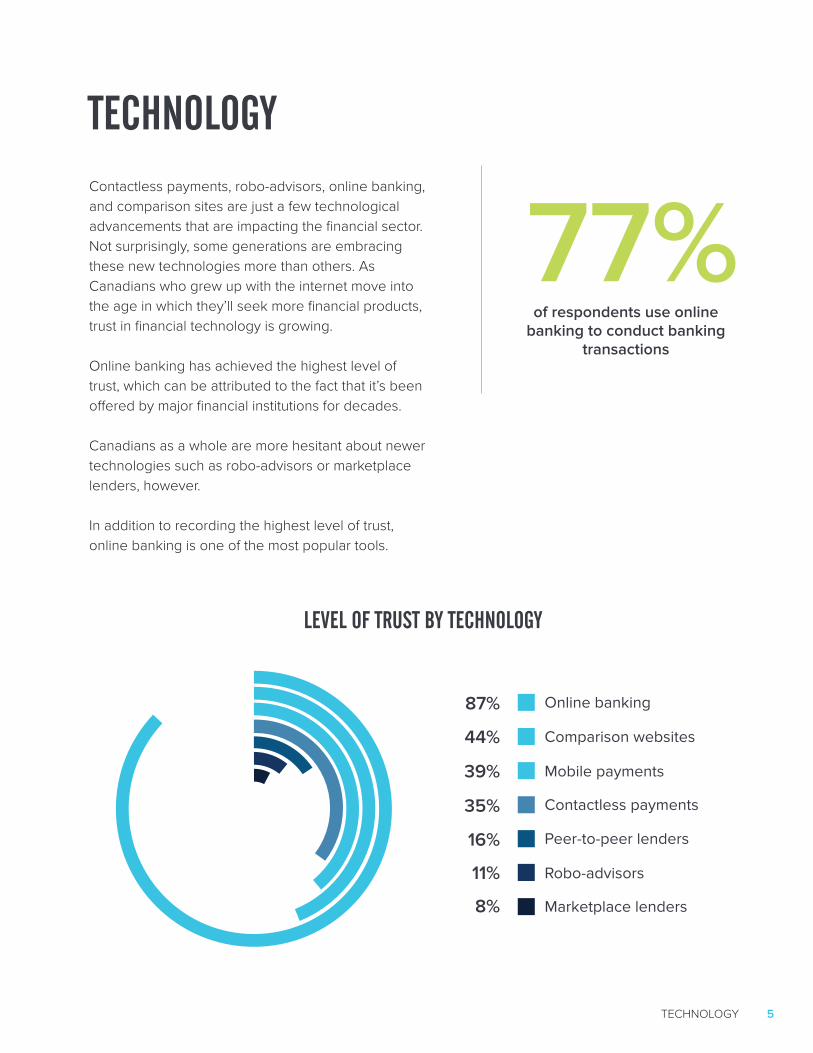
Contactless payments, robo-advisors, online banking, and comparison sites are just a few technological advancements that are impacting the financial sector. Not surprisingly, some generations are embracing these new technologies more than others. As Canadians who grew up with the internet move into the age in which they’ll seek more financial products, trust in financial technology is growing.
Online banking has achieved the highest level of trust, which can be attributed to the fact that it’s been offered by major financial institutions for decades.
Canadians as a whole are more hesitant about newer technologies such as robo-advisors or marketplace lenders, however.
In addition to recording the highest level of trust, online banking is one of the most popular tools.
Online banking
Comparison websites
Mobile payments
Robo-advisors
Contactless payments
Marketplace lenders
Peer-to-peer lenders
87%
44%
39%
11%
35%
8%
16%
of respondents use online banking to conduct banking
transactions
77%
LEVEL OF TRUST BY TECHNOLOGY
TECHNOLOGY
TECHNOLOGY 6
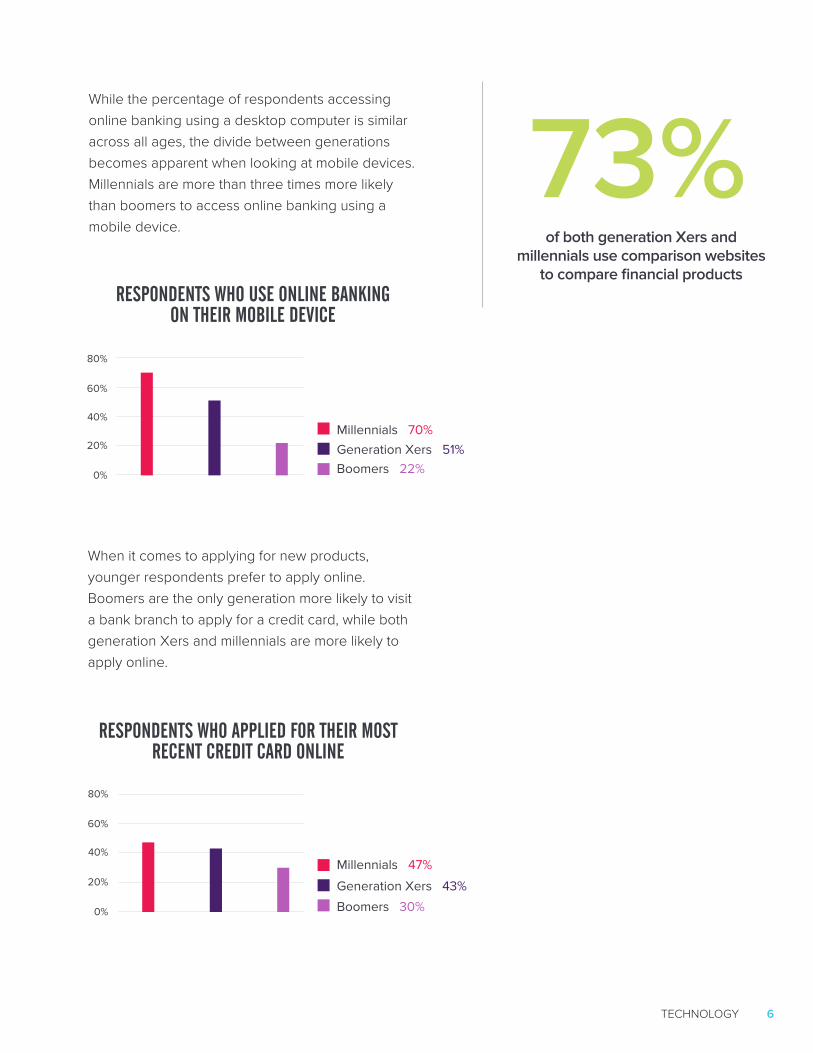
While the percentage of respondents accessing online banking using a desktop computer is similar across all ages, the divide between generations becomes apparent when looking at mobile devices. Millennials are more than three times more likely than boomers to access online banking using a mobile device.
When it comes to applying for new products, younger respondents prefer to apply online. Boomers are the only generation more likely to visit a bank branch to apply for a credit card, while both generation Xers and millennials are more likely to apply online.
20%
20%
0%
0%
40%
40%
60%
60%
80%
80%
Millennials 70%
Boomers 30%
Generation Xers 51%
Generation Xers 43%
Boomers 22%
Millennials 47%
RESPONDENTS WHO APPLIED FOR THEIR MOST RECENT CREDIT CARD ONLINE
RESPONDENTS WHO USE ONLINE BANKING ON THEIR MOBILE DEVICE
of both generation Xers and millennials use comparison websites
to compare financial products
73%
TECHNOLOGY 7
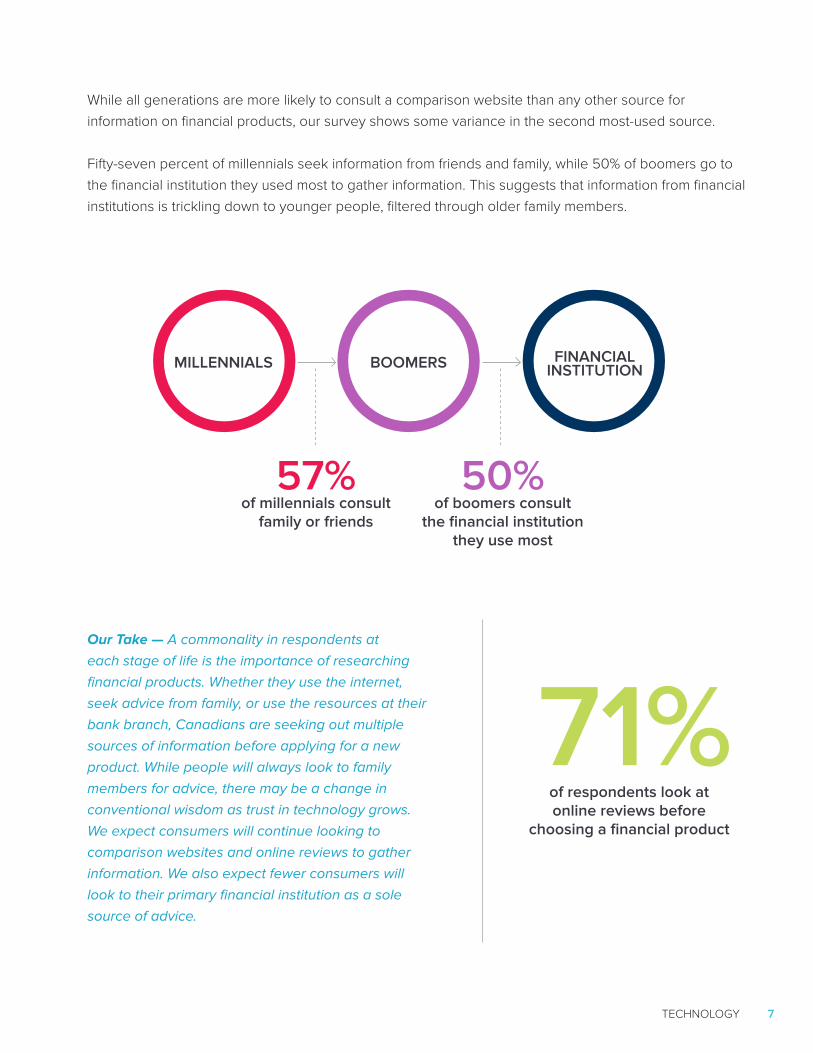
While all generations are more likely to consult a comparison website than any other source for information on financial products, our survey shows some variance in the second most-used source.
Fifty-seven percent of millennials seek information from friends and family, while 50% of boomers go to the financial institution they used most to gather information. This suggests that information from financial institutions is trickling down to younger people, filtered through older family members.
Our Take — A commonality in respondents at
each stage of life is the importance of researching
financial products. Whether they use the internet,
seek advice from family, or use the resources at their
bank branch, Canadians are seeking out multiple
sources of information before applying for a new
product. While people will always look to family
members for advice, there may be a change in
conventional wisdom as trust in technology grows.
We expect consumers will continue looking to
comparison websites and online reviews to gather
information. We also expect fewer consumers will
look to their primary financial institution as a sole
source of advice.
71%of respondents look at online reviews before
choosing a financial product
FINANCIALINSTITUTIONBOOMERSMILLENNIALS
57% of millennials consult
family or friends
50% of boomers consult
the financial institution they use most
LOYALTY TO FINANCIAL INSTITUTIONS 8
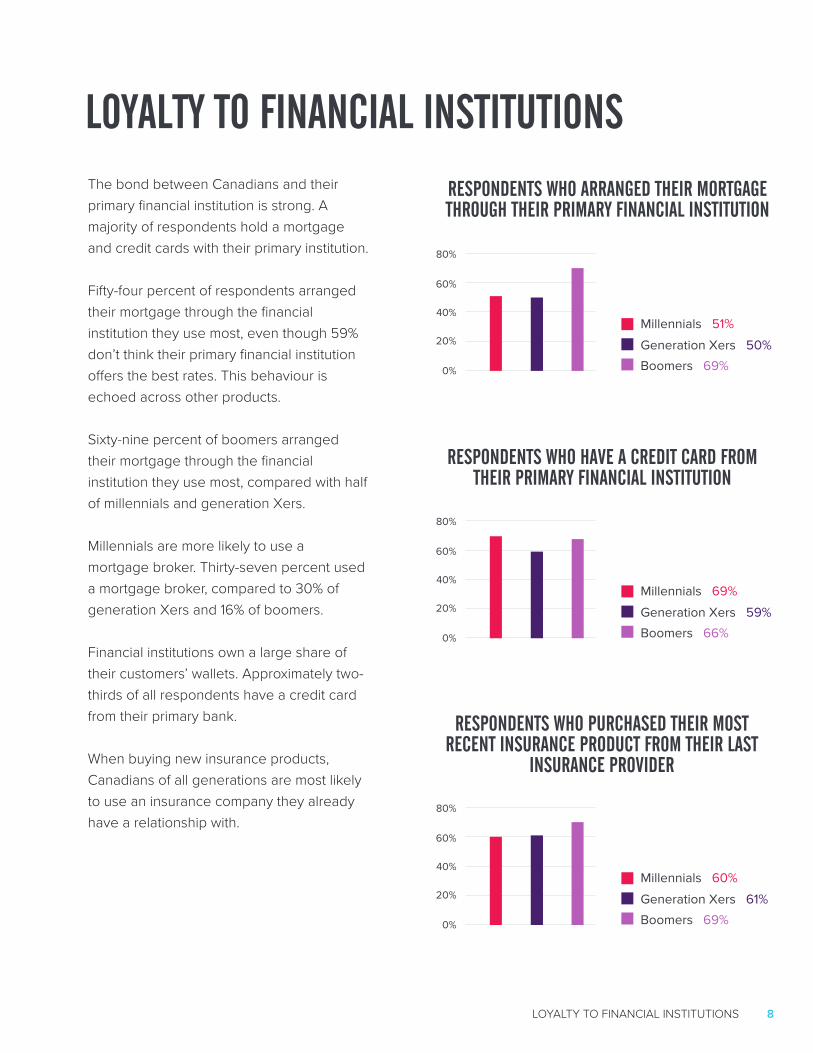
The bond between Canadians and their primary financial institution is strong. A majority of respondents hold a mortgage and credit cards with their primary institution.
Fifty-four percent of respondents arranged their mortgage through the financial institution they use most, even though 59% don’t think their primary financial institution offers the best rates. This behaviour is echoed across other products.
Sixty-nine percent of boomers arranged their mortgage through the financial institution they use most, compared with half of millennials and generation Xers.
Millennials are more likely to use a mortgage broker. Thirty-seven percent used a mortgage broker, compared to 30% of generation Xers and 16% of boomers.
Financial institutions own a large share of their customers’ wallets. Approximately two-thirds of all respondents have a credit card from their primary bank.
When buying new insurance products, Canadians of all generations are most likely to use an insurance company they already have a relationship with.
LOYALTY TO FINANCIAL INSTITUTIONSRESPONDENTS WHO ARRANGED THEIR MORTGAGE THROUGH THEIR PRIMARY FINANCIAL INSTITUTION
RESPONDENTS WHO HAVE A CREDIT CARD FROM THEIR PRIMARY FINANCIAL INSTITUTION
RESPONDENTS WHO PURCHASED THEIR MOST RECENT INSURANCE PRODUCT FROM THEIR LAST
INSURANCE PROVIDER
20%
20%
20%
0%
0%
0%
40%
40%
40%
60%
60%
60%
80%
80%
80%
Boomers 69%
Boomers 66%
Boomers 69%
Generation Xers 50%
Generation Xers 59%
Generation Xers 61%
Millennials 51%
Millennials 69%
Millennials 60%
LOYALTY TO FINANCIAL INSTITUTIONS 9
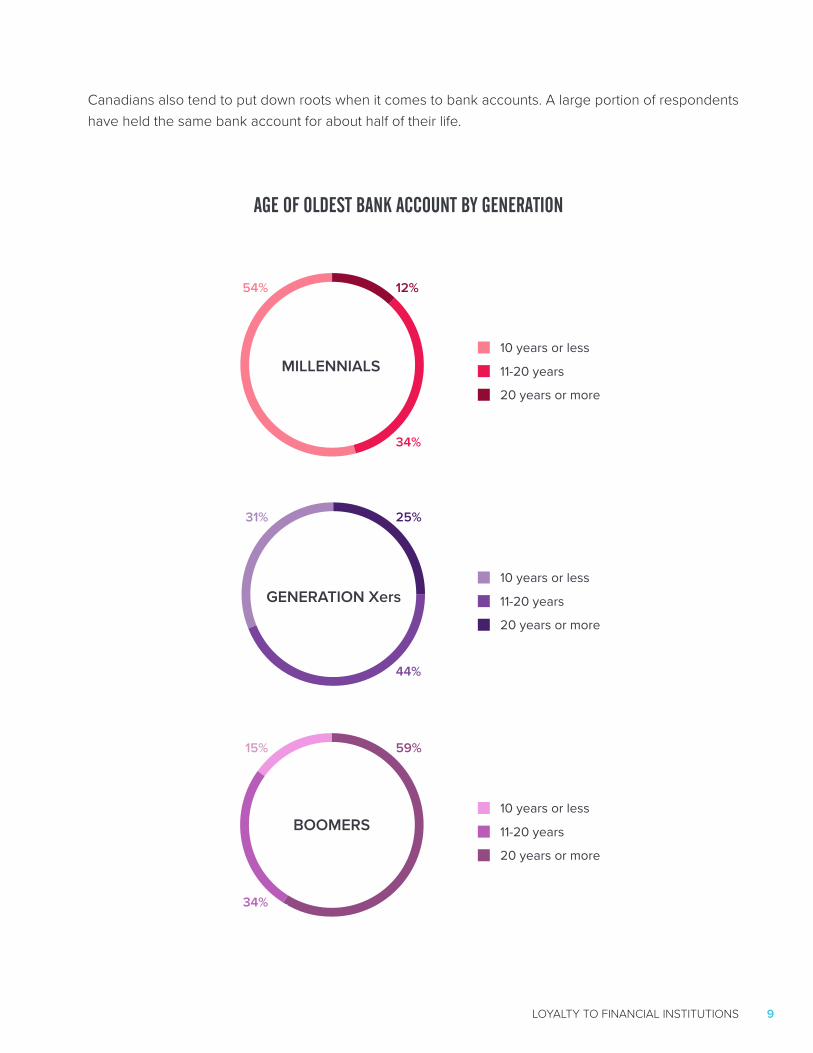
Canadians also tend to put down roots when it comes to bank accounts. A large portion of respondents have held the same bank account for about half of their life.
20 years or more
20 years or more
20 years or more
11-20 years
11-20 years
11-20 years
10 years or less
10 years or less
10 years or less
34%
44%
34%
25%
59%15%
31%
54% 12%
MILLENNIALS
GENERATION Xers
BOOMERS
AGE OF OLDEST BANK ACCOUNT BY GENERATION
MORTGAGES 10
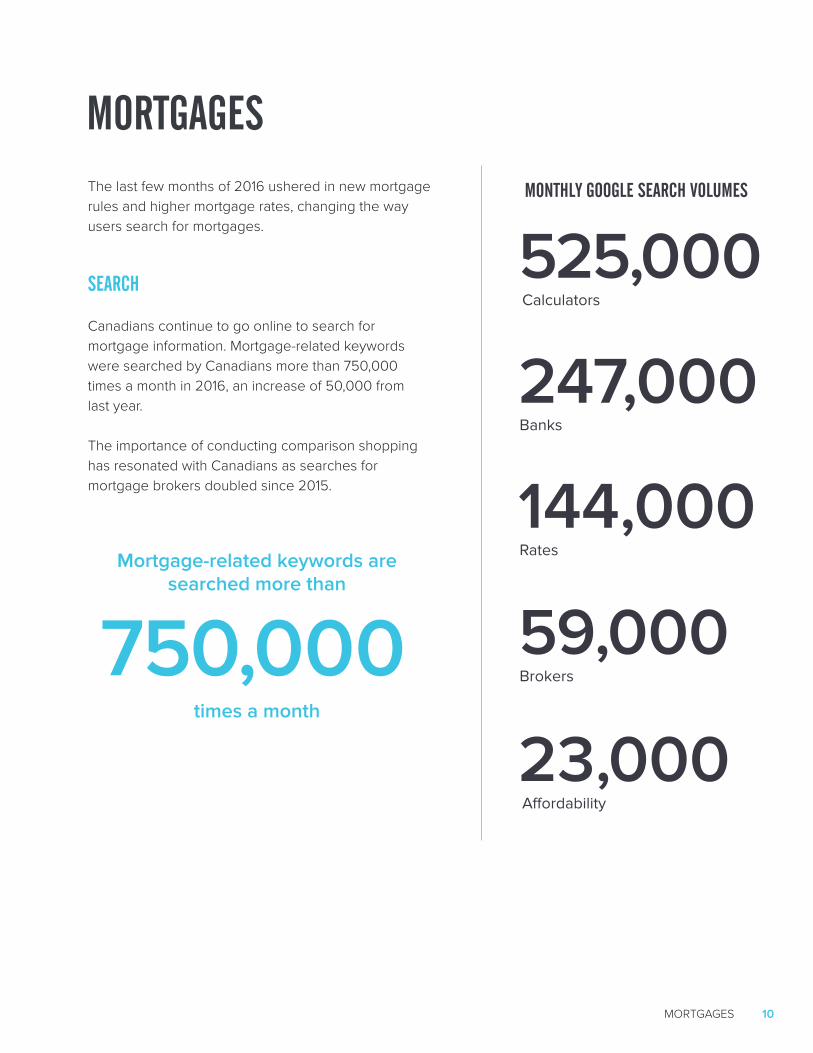
The last few months of 2016 ushered in new mortgage rules and higher mortgage rates, changing the way users search for mortgages.
SEARCH
Canadians continue to go online to search for mortgage information. Mortgage-related keywords were searched by Canadians more than 750,000 times a month in 2016, an increase of 50,000 fromlast year.
The importance of conducting comparison shopping has resonated with Canadians as searches for mortgage brokers doubled since 2015.
Mortgage-related keywords are searched more than
times a month
Banks
Brokers
Calculators
Rates
Affordability
750,000
247,000
59,000
525,000
144,000
23,000
MORTGAGESMONTHLY GOOGLE SEARCH VOLUMES
MORTGAGES 11
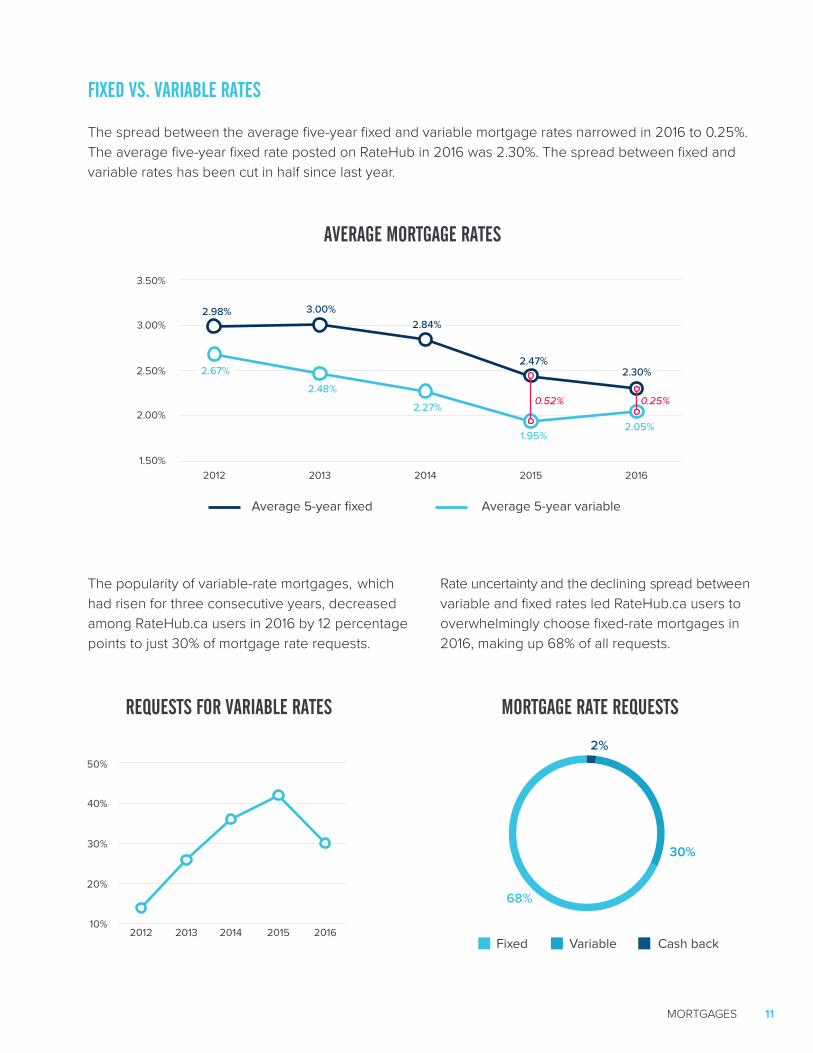
FIXED VS. VARIABLE RATES
The spread between the average five-year fixed and variable mortgage rates narrowed in 2016 to 0.25%.The average five-year fixed rate posted on RateHub in 2016 was 2.30%. The spread between fixed and variable rates has been cut in half since last year.
The popularity of variable-rate mortgages, which had risen for three consecutive years, decreased among RateHub.ca users in 2016 by 12 percentage points to just 30% of mortgage rate requests.
Rate uncertainty and the declining spread between variable and fixed rates led RateHub.ca users to overwhelmingly choose fixed-rate mortgages in 2016, making up 68% of all requests.
20%
10%20162015201420132012
30%
40%
50%
REQUESTS FOR VARIABLE RATES
AVERAGE MORTGAGE RATES
MORTGAGE RATE REQUESTS
Cash backVariable
Average 5-year variable
Fixed
Average 5-year fixed
2.98% 3.00%
2.47%
30%
68%
2%
1.50%2012 201620142013 2015
2.00%
2.50%
3.00%
3.50%
2.30%
2.05%
2.48%
2.27%
1.95%
0.52% 0.25%
2.84%
2.67%
MORTGAGES 12
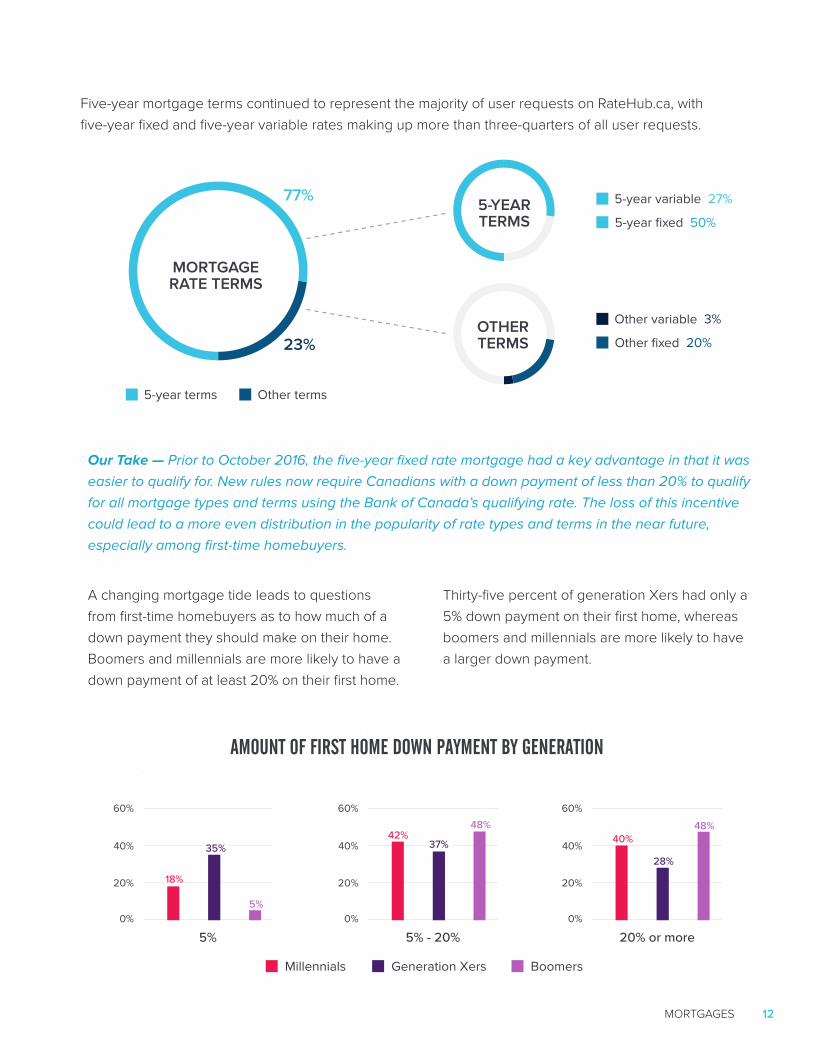
Five-year mortgage terms continued to represent the majority of user requests on RateHub.ca, with five-year fixed and five-year variable rates making up more than three-quarters of all user requests.
A changing mortgage tide leads to questions from first-time homebuyers as to how much of a down payment they should make on their home. Boomers and millennials are more likely to have a down payment of at least 20% on their first home.
Our Take — Prior to October 2016, the five-year fixed rate mortgage had a key advantage in that it was
easier to qualify for. New rules now require Canadians with a down payment of less than 20% to qualify
for all mortgage types and terms using the Bank of Canada’s qualifying rate. The loss of this incentive
could lead to a more even distribution in the popularity of rate types and terms in the near future,
especially among first-time homebuyers.
77%
23%
Other terms
Other fixed 20%
5-year fixed 50%
5-year terms
Other variable 3%
5-year variable 27%
OTHER TERMS
MORTGAGERATE TERMS
5-YEARTERMS
20% 20% 20%
0% 0% 0%
40% 40% 40%
60% 60% 60%
BoomersGeneration XersMillennials
5%
5%
48% 48%
35% 37%
28%
18%
42% 40%
5% - 20% 20% or more
AMOUNT OF FIRST HOME DOWN PAYMENT BY GENERATION
Thirty-five percent of generation Xers had only a 5% down payment on their first home, whereas boomers and millennials are more likely to have a larger down payment.
MORTGAGES 13
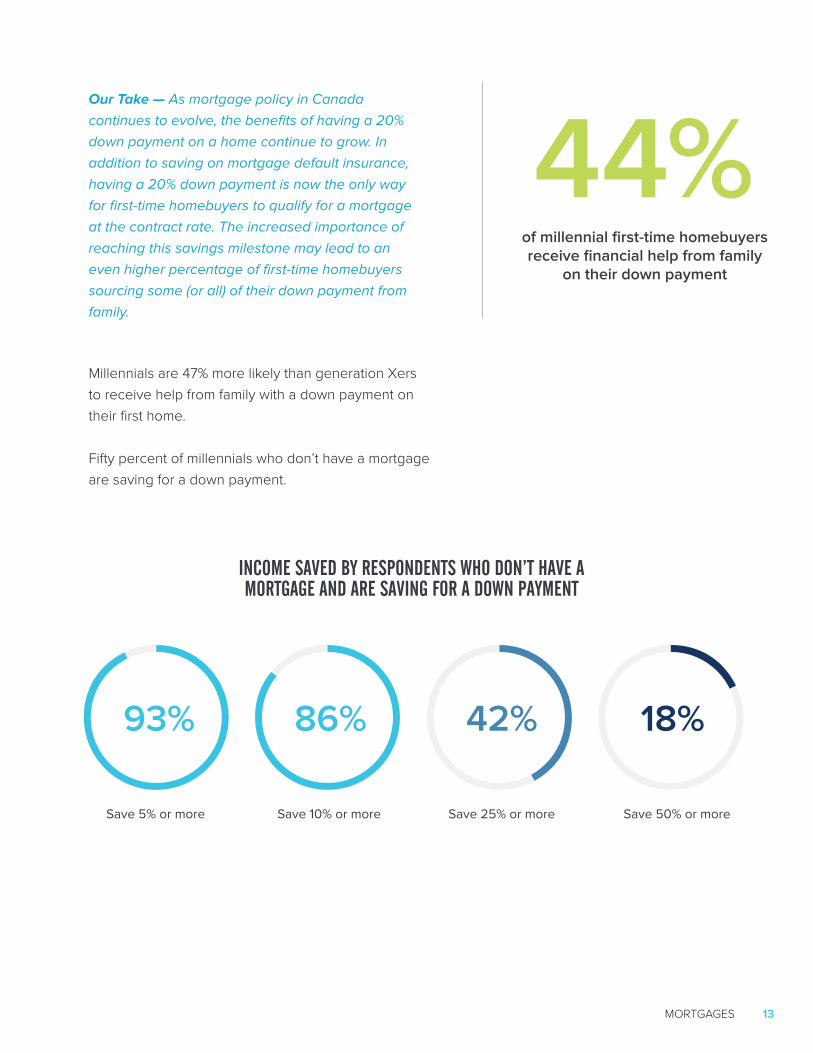
Our Take — As mortgage policy in Canada
continues to evolve, the benefits of having a 20%
down payment on a home continue to grow. In
addition to saving on mortgage default insurance,
having a 20% down payment is now the only way
for first-time homebuyers to qualify for a mortgage
at the contract rate. The increased importance of
reaching this savings milestone may lead to an
even higher percentage of first-time homebuyers
sourcing some (or all) of their down payment from
family.
Millennials are 47% more likely than generation Xers to receive help from family with a down payment on their first home.
Fifty percent of millennials who don’t have a mortgage are saving for a down payment.
of millennial first-time homebuyers receive financial help from family
on their down payment
44%
Save 5% or more Save 10% or more Save 25% or more Save 50% or more
93% 86% 42% 18%
INCOME SAVED BY RESPONDENTS WHO DON’T HAVE A MORTGAGE AND ARE SAVING FOR A DOWN PAYMENT
CREDIT CARDS 14
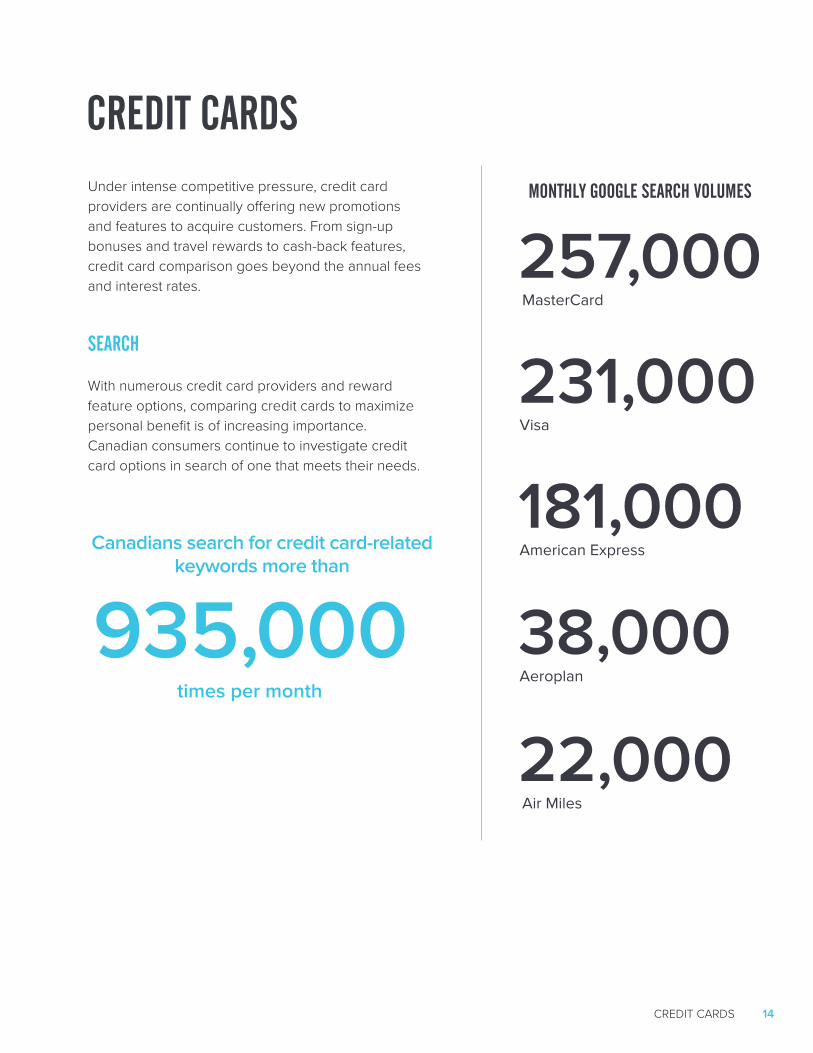
MONTHLY GOOGLE SEARCH VOLUMESUnder intense competitive pressure, credit card providers are continually offering new promotions and features to acquire customers. From sign-up bonuses and travel rewards to cash-back features, credit card comparison goes beyond the annual fees and interest rates.
SEARCH
With numerous credit card providers and reward feature options, comparing credit cards to maximize personal benefit is of increasing importance. Canadian consumers continue to investigate credit card options in search of one that meets their needs.
Canadians search for credit card-related keywords more than
times per month
Visa
Aeroplan
MasterCard
American Express
Air Miles
935,000
231,000
38,000
257,000
181,000
22,000
CREDIT CARDS
CREDIT CARDS 15
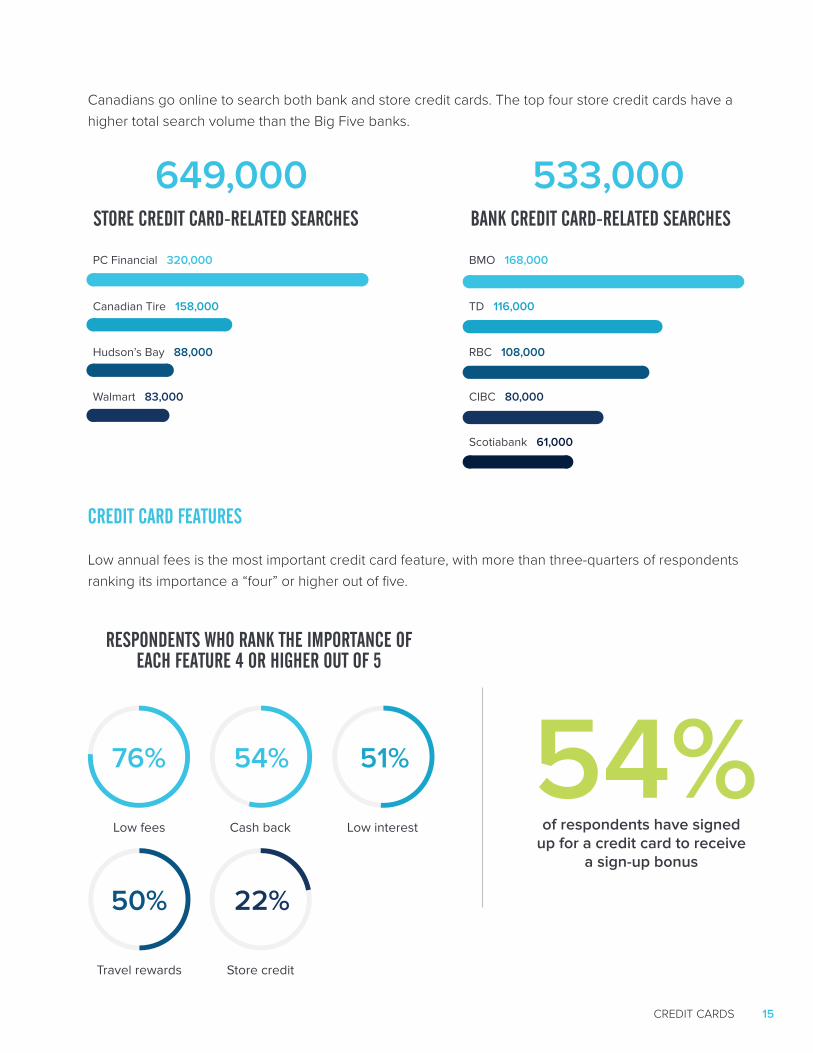
Canadian Tire 158,000 TD 116,000
Hudson’s Bay 88,000 RBC 108,000
Walmart 83,000 CIBC 80,000
Scotiabank 61,000
Canadians go online to search both bank and store credit cards. The top four store credit cards have ahigher total search volume than the Big Five banks.
649,000 533,000
PC Financial 320,000 BMO 168,000
CREDIT CARD FEATURES
Low annual fees is the most important credit card feature, with more than three-quarters of respondentsranking its importance a “four” or higher out of five.
Low fees Cash back Low interest
Travel rewards Store credit
76% 54% 51%
50% 22%
54%of respondents have signed
up for a credit card to receive a sign-up bonus
RESPONDENTS WHO RANK THE IMPORTANCE OF EACH FEATURE 4 OR HIGHER OUT OF 5
BANK CREDIT CARD-RELATED SEARCHESSTORE CREDIT CARD-RELATED SEARCHES
CREDIT CARDS 16
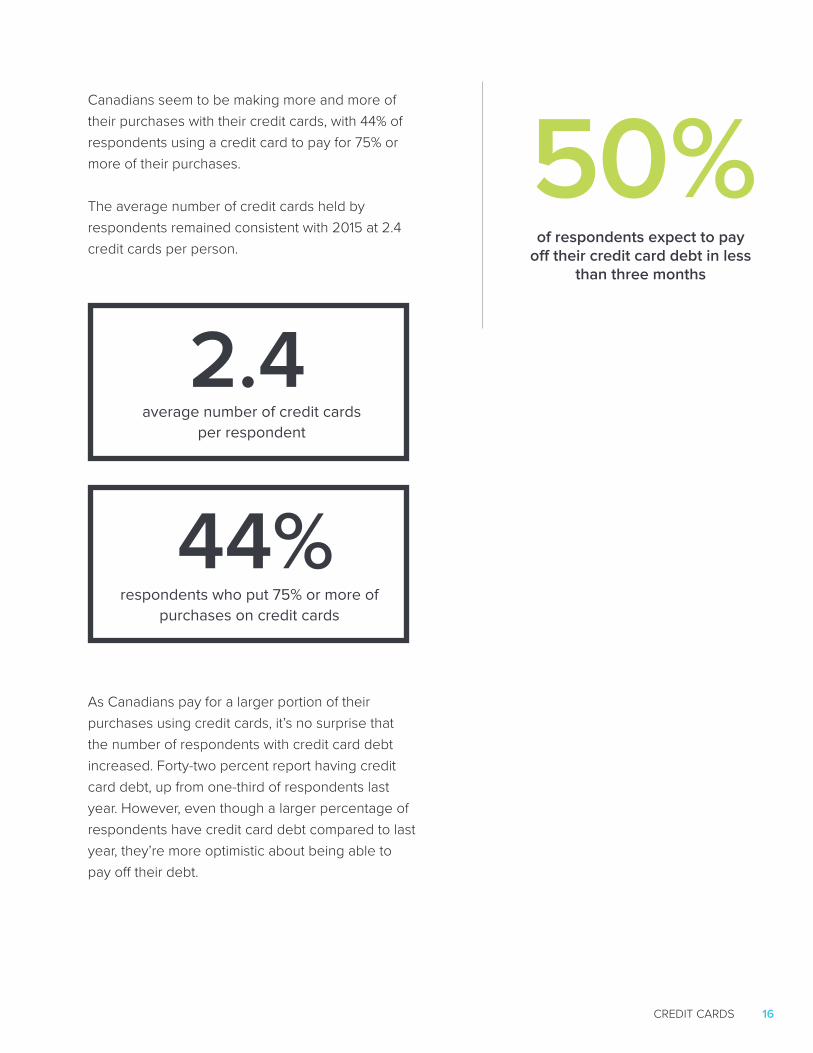
Canadians seem to be making more and more of their purchases with their credit cards, with 44% of respondents using a credit card to pay for 75% or more of their purchases.
The average number of credit cards held by respondents remained consistent with 2015 at 2.4 credit cards per person.
As Canadians pay for a larger portion of their purchases using credit cards, it’s no surprise that the number of respondents with credit card debt increased. Forty-two percent report having credit card debt, up from one-third of respondents last year. However, even though a larger percentage of respondents have credit card debt compared to last year, they’re more optimistic about being able to pay off their debt.
average number of credit cardsper respondent
respondents who put 75% or more of purchases on credit cards
2.4
44%
of respondents expect to pay off their credit card debt in less
than three months
50%
CREDIT CARDS 17
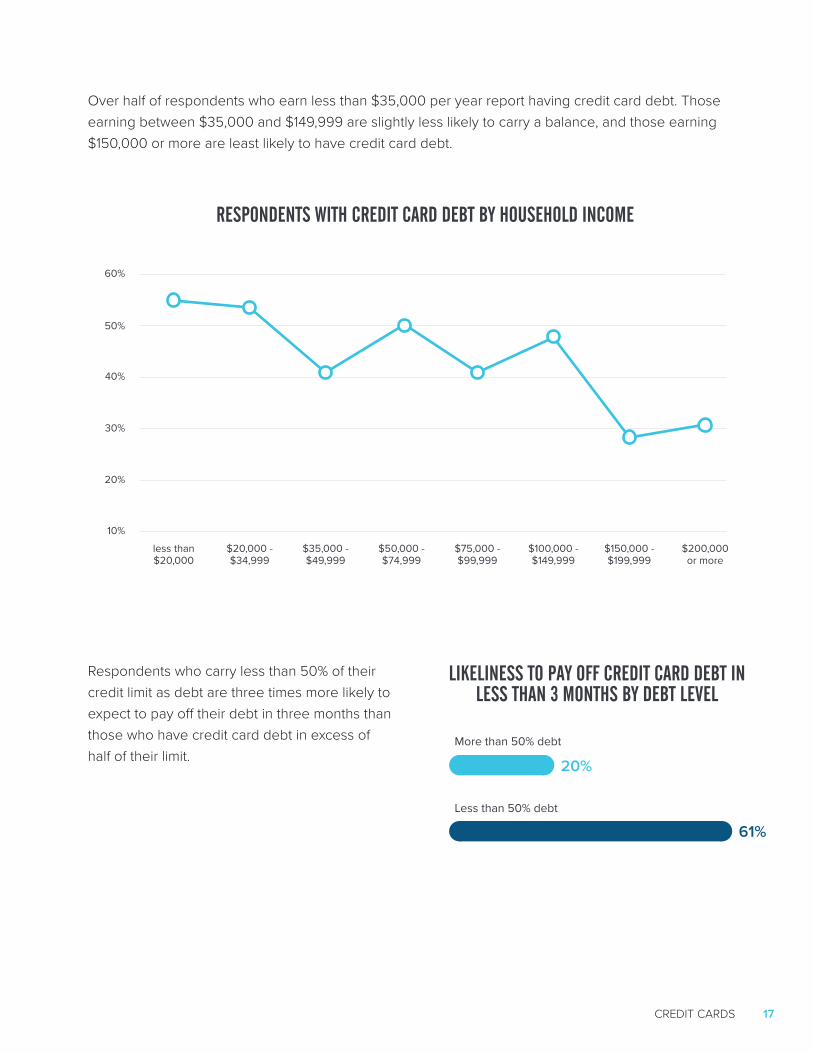
Over half of respondents who earn less than $35,000 per year report having credit card debt. Those earning between $35,000 and $149,999 are slightly less likely to carry a balance, and those earning $150,000 or more are least likely to have credit card debt.
Respondents who carry less than 50% of their credit limit as debt are three times more likely to expect to pay off their debt in three months than those who have credit card debt in excess of half of their limit.
RESPONDENTS WITH CREDIT CARD DEBT BY HOUSEHOLD INCOME
LIKELINESS TO PAY OFF CREDIT CARD DEBT IN LESS THAN 3 MONTHS BY DEBT LEVEL
20%
10%
less than$20,000
$75,000 - $99,999
$35,000 - $49,999
$150,000 -$199,999
$20,000 - $34,999
$100,000 -$149,999
$50,000 -$74,999
$200,000or more
30%
40%
50%
60%
More than 50% debt
Less than 50% debt
20%
61%
CREDIT SCORES 18
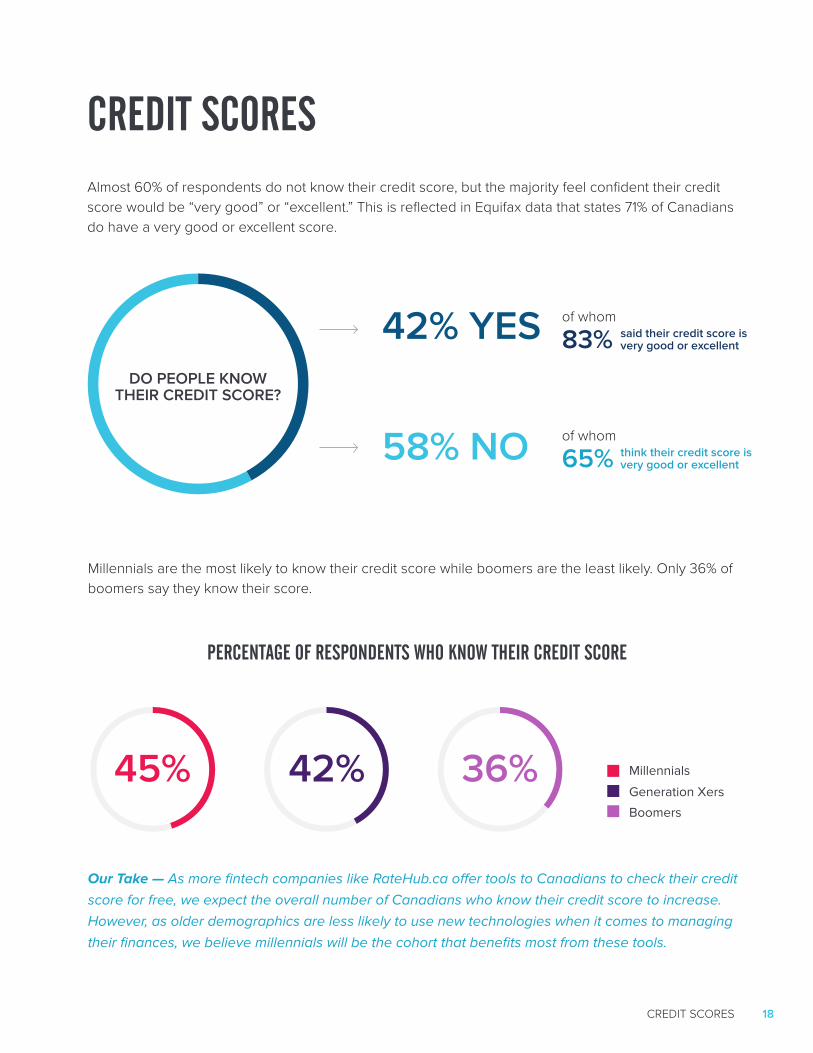
Boomers
Generation Xers
Millennials 36%42%45%
Almost 60% of respondents do not know their credit score, but the majority feel confident their credit score would be “very good” or “excellent.” This is reflected in Equifax data that states 71% of Canadians do have a very good or excellent score.
Millennials are the most likely to know their credit score while boomers are the least likely. Only 36% of boomers say they know their score.
CREDIT SCORES
65%
83% said their credit score is very good or excellent
think their credit score is very good or excellent
42% YES
58% NO
DO PEOPLE KNOW THEIR CREDIT SCORE?
of whom
of whom
Our Take — As more fintech companies like RateHub.ca offer tools to Canadians to check their credit
score for free, we expect the overall number of Canadians who know their credit score to increase.
However, as older demographics are less likely to use new technologies when it comes to managing
their finances, we believe millennials will be the cohort that benefits most from these tools.
PERCENTAGE OF RESPONDENTS WHO KNOW THEIR CREDIT SCORE
SAVING & INVESTING 19
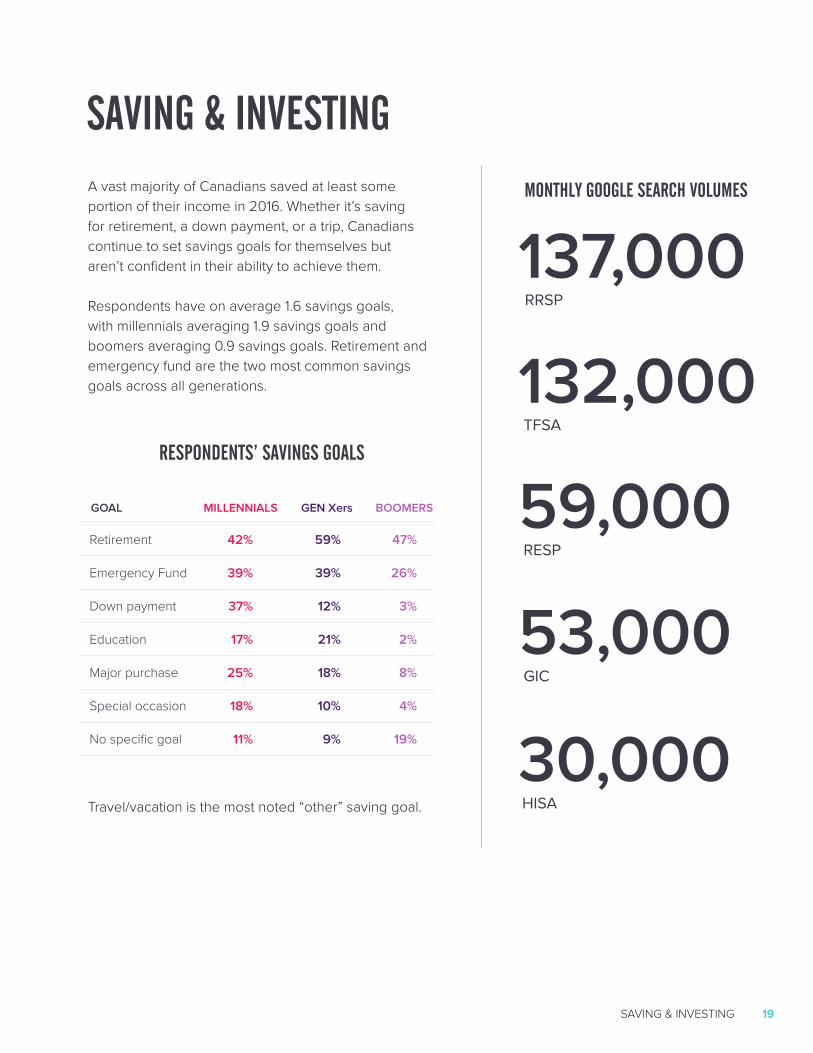
A vast majority of Canadians saved at least some portion of their income in 2016. Whether it’s saving for retirement, a down payment, or a trip, Canadians continue to set savings goals for themselves but aren’t confident in their ability to achieve them.
Respondents have on average 1.6 savings goals, with millennials averaging 1.9 savings goals and boomers averaging 0.9 savings goals. Retirement and emergency fund are the two most common savings goals across all generations.
Travel/vacation is the most noted “other” saving goal.
TFSA
GIC
RRSP
RESP
HISA
132,000
53,000
137,000
59,000
30,000
SAVING & INVESTINGMONTHLY GOOGLE SEARCH VOLUMES
BOOMERSGOAL GEN XersMILLENNIALS
Retirement
Emergency Fund
Down payment
Education
Major purchase
Special occasion
No specific goal
47%
26%
3%
2%
8%
4%
19%
59%
39%
12%
21%
18%
10%
9%
42%
39%
37%
17%
25%
18%
11%
RESPONDENTS’ SAVINGS GOALS
SAVING & INVESTING 20
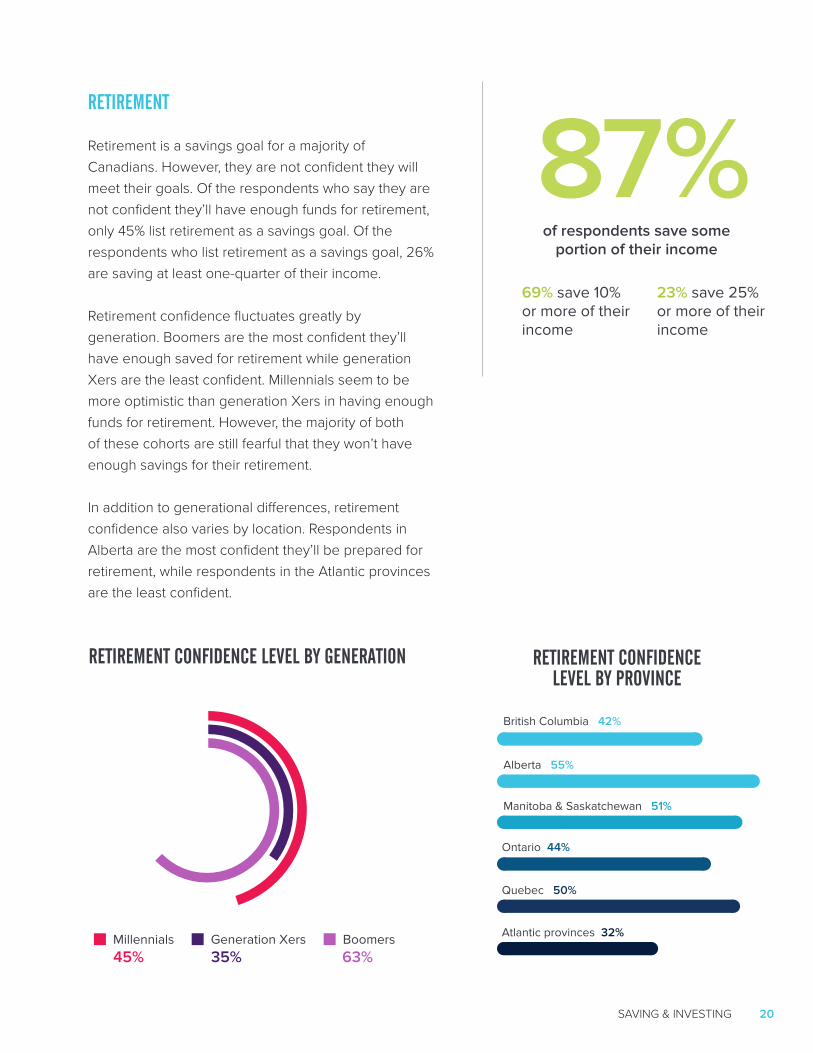
RETIREMENT
Retirement is a savings goal for a majority of Canadians. However, they are not confident they will meet their goals. Of the respondents who say they are not confident they’ll have enough funds for retirement, only 45% list retirement as a savings goal. Of the respondents who list retirement as a savings goal, 26% are saving at least one-quarter of their income.
Retirement confidence fluctuates greatly by generation. Boomers are the most confident they’ll have enough saved for retirement while generation Xers are the least confident. Millennials seem to be more optimistic than generation Xers in having enough funds for retirement. However, the majority of both of these cohorts are still fearful that they won’t have enough savings for their retirement.
In addition to generational differences, retirement confidence also varies by location. Respondents in Alberta are the most confident they’ll be prepared for retirement, while respondents in the Atlantic provinces are the least confident.
of respondents save some portion of their income
87%
63%35%45%
Alberta 55%
Manitoba & Saskatchewan 51%
Ontario 44%
Quebec 50%
Atlantic provinces 32%
British Columbia 42%
RETIREMENT CONFIDENCE LEVEL BY GENERATION RETIREMENT CONFIDENCELEVEL BY PROVINCE
Millennials Generation Xers Boomers
69% save 10% or more of their income
23% save 25% or more of their income
CONTACT 21
CONTACTKERRI-LYNN McALLISTERChief Marketing Officer
NICOLE LAOUTARISCommunications Manager
RATEHUB.CA1.800.679.9622
411 Richmond St. ESuite 208Toronto, ON M5A 3S5


