Page 1
Digital Transformation for Flexible Last Mile Distribution
by
Krishna V Kuppuswamy
B.E., Production Engineering, PSG College of Technology, India
SUBMITTED TO THE PROGRAM IN SUPPLY CHAIN MANAGEMENT
IN PARTIAL FULFILLMENT OF THE REQUIREMENTS FOR THE DEGREE OF
MASTER OF APPLIED SCIENCE IN SUPPLY CHAIN MANAGEMENT AT THE
MASSACHUSETTS INSTITUTE OF TECHNOLOGY
June 2021
© 2021 Krishna V Kuppuswamy. All rights reserved.
The authors hereby grant to MIT permission to reproduce and to distribute publicly paper and electronic
copies of this capstone document in whole or in part in any medium now known or hereafter created.
Signature of Author: ____________________________________________________________________
Krishna V Kuppuswamy Department of Supply Chain Management
May 14, 2021
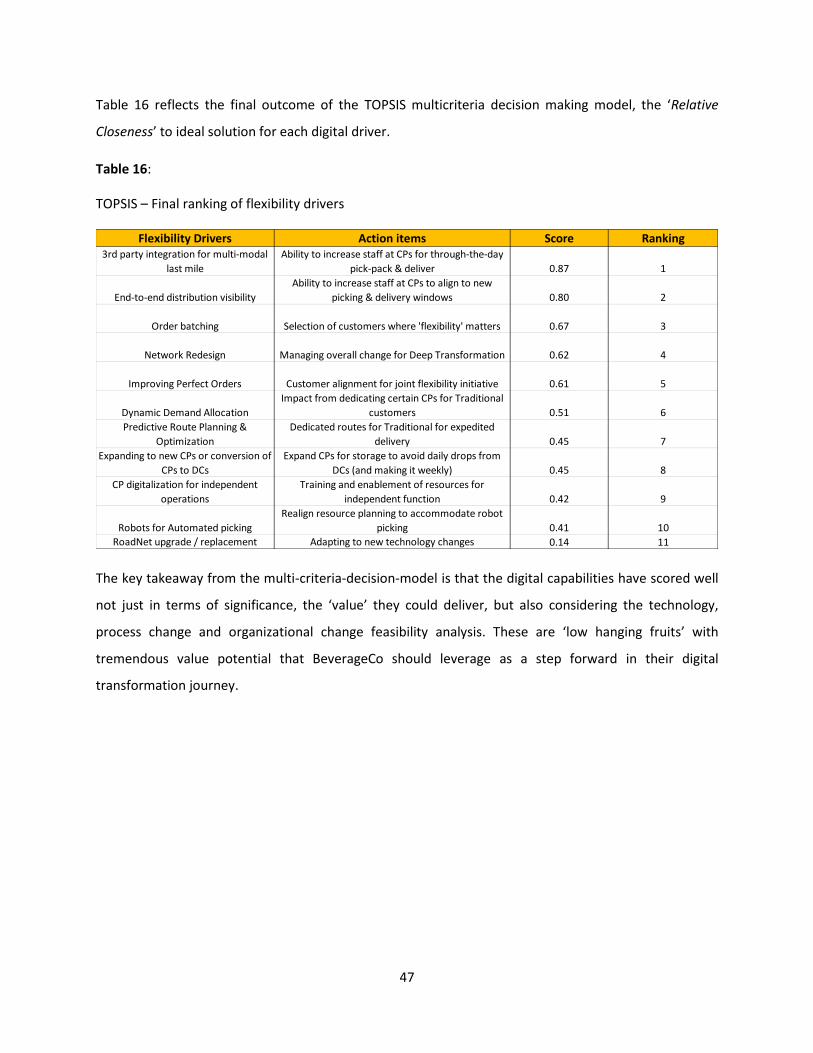
Certified by: __________________________________________________________________________
Dr. María Jesús Sáenz Executive Director, Supply Chain Management Blended Program
Capstone Advisor
Certified by: __________________________________________________________________________
Dr. Ozden Tozanli Postdoctoral Associate, Digital Supply Chain Transformation
Capstone Co-Advisor
Accepted by: __________________________________________________________________________ Prof. Yossi Sheffi
Director, Center for Transportation and Logistics Elisha Gray II Professor of Engineering Systems Professor, Civil and Environmental Engineering
Page 2
2
Digital Transformation for Flexible Last Mile Distribution
by
Krishna V Kuppuswamy
Submitted to the Program in Supply Chain Management
on May 14, 2021 in Partial Fulfillment of the
Requirements for the Degree of Master of Applied Science in Supply Chain Management
ABSTRACT
Flexibility in last-mile distribution has become a key differentiator for companies that are obsessed with driving up customer experience. For most fast-moving consumer goods (FMCG) companies like BeverageCo, it is crucial to succeed in fast-growing emerging economies which are dominated by the traditional retail channel, characterized by small stores. With this channel contributing to more than 90% of BeverageCo’s customer base, and its tremendous growth potential, digital transformation to drive flexibility in last-mile distribution is no longer a choice but a mandate. However, the path to digital transformation and the metrics to measure the ‘value’ behind flexible last-mile distribution remains a challenge for BeverageCo. With ‘value creation’ at the core of this transformation, this project implements a Value Stream Mapping (VSM) methodology to map the current and future state of distribution value stream. VSM helps identify the gaps, system inefficiencies, and the metrics impacted in the current state; leverages simulation-based future state design and a multi-criteria-decision-model to assess the digital capabilities required for the transformation. This approach resulted in the design of a 4 to 6-hour distribution model (as against the current 31-hour distribution), with minimal changes to the processes and investments required to run the operations. With clear definition of metrics to measure ‘value’ behind flexibility, the outcomes suggest that more than 90% of the customers will benefit from this flexible and expedited distribution, at a high value-to-cost ratio. This project unlocks the value of digitalization with a frugal investment of time and money versus conventional large scale business transformations.
Capstone Advisor: Dr. María Jesús Sáenz
Title: Executive Director, Supply Chain Management Blended Program
Capstone Co-Advisor: Dr. Ozden Tozanli
Title: Postdoctoral Associate, Digital Supply Chain Transformation
Page 3
3
ACKNOWLEDGMENTS
I would like express sincere gratitude to my MIT advisors Maria Jesús Sáenz and Ozden Tozanli for their
support and wisdom in guiding me through this interesting and challenging project. Thank you, Maria and
Ozden for your invaluable guidance throughout this project.
I would also like to thank BeverageCo SMEs for their incredible support and guidance throughout this
project. Their depth of knowledge about BeverageCo processes and their tireless efforts in providing
several data points was key in shaping the design and outcomes of this project.
Lastly, deepest gratitude to my wife Lakshmi and my son Ram, who backed me through several challenging
personal situations and encouraged me to see through the finish line.
Page 4
4
Table of Contents 1 INTRODUCTION ..................................................................................................................................... 8
BeverageCo’s background ............................................................................................................. 9
Motivation ................................................................................................................................... 11
2 Literature Review ................................................................................................................................ 13
Digital Transformation imperatives ............................................................................................ 13
Value Stream Mapping ............................................................................................................... 14
Simulation-based Future State Value Stream Design ................................................................. 14
Multi-criteria-decision-model (MCDM) ...................................................................................... 15
How is this framework relevant for BeverageCo? ...................................................................... 16
3 Methodology ....................................................................................................................................... 17
Current state Value Stream Mapping ......................................................................................... 18
3.1.1 Data Gathering .................................................................................................................... 18
3.1.2 Understanding As-is business processes & digital capabilities. .......................................... 19
3.1.3 Benchmarking KPIs .............................................................................................................. 20
3.1.4 Building VSM for the current Information and Product flow ............................................. 22
3.1.5 Identifying gaps in the current value stream and the reasons behind ............................... 23
Creating the Vision for future state ............................................................................................ 25
3.2.1 Vision for flexible last mile distribution .............................................................................. 25
3.2.2 Establishing target channels for flexible distribution ......................................................... 25
Realizing the vision for future state value stream ...................................................................... 27
3.3.1 Critical success factors and the key flexibility drivers to realize the vision ........................ 27
3.3.2 Drivers of flexibility – mapping and scoring ........................................................................ 28
Future state value stream design ............................................................................................... 29
3.4.1 Feasibility analysis of the flexibility in the current distribution model ............................... 30
3.4.2 Simulation-based future state value stream design ........................................................... 32
Page 5
5
3.4.3 What it takes to make a 4-hour distribution model work? ................................................ 33
3.4.4 Future state value stream design for flexible distribution model ...................................... 34
3.4.5 Measuring ‘value’ behind flexibility .................................................................................... 38
MCDM based Digital Transformation drivers’ prioritization. ..................................................... 40
4 Results and Analysis ............................................................................................................................ 41
Simulation input parameters and scenarios ............................................................................... 41
4.1.1 Simulation results ............................................................................................................... 42
Multi-criteria-decision-model (MCDM) – feasibility assessment & prioritization ...................... 44
4.2.1 Feasibility assessment – Technology, Process and Organizational change impact ............ 44
4.2.2 TOPSIS decision matrix for Multi-dimensional evaluation ................................................. 46
5 Managerial Insights and Recommendations....................................................................................... 48
Summary of the key project outcomes ....................................................................................... 48
What it takes to transform to the future state? ......................................................................... 48
What is the ‘value’ behind flexibility? ......................................................................................... 49
Roadmap for future - Implementation recommendations ......................................................... 49
6 CONCLUSION ....................................................................................................................................... 51
Future research opportunities .................................................................................................... 51
REFERENCES ........................................................................................................................................ 53
Appendix A. Multi-criteria-decision-model (MCDM) – feasibility assessment & prioritization ......... 55
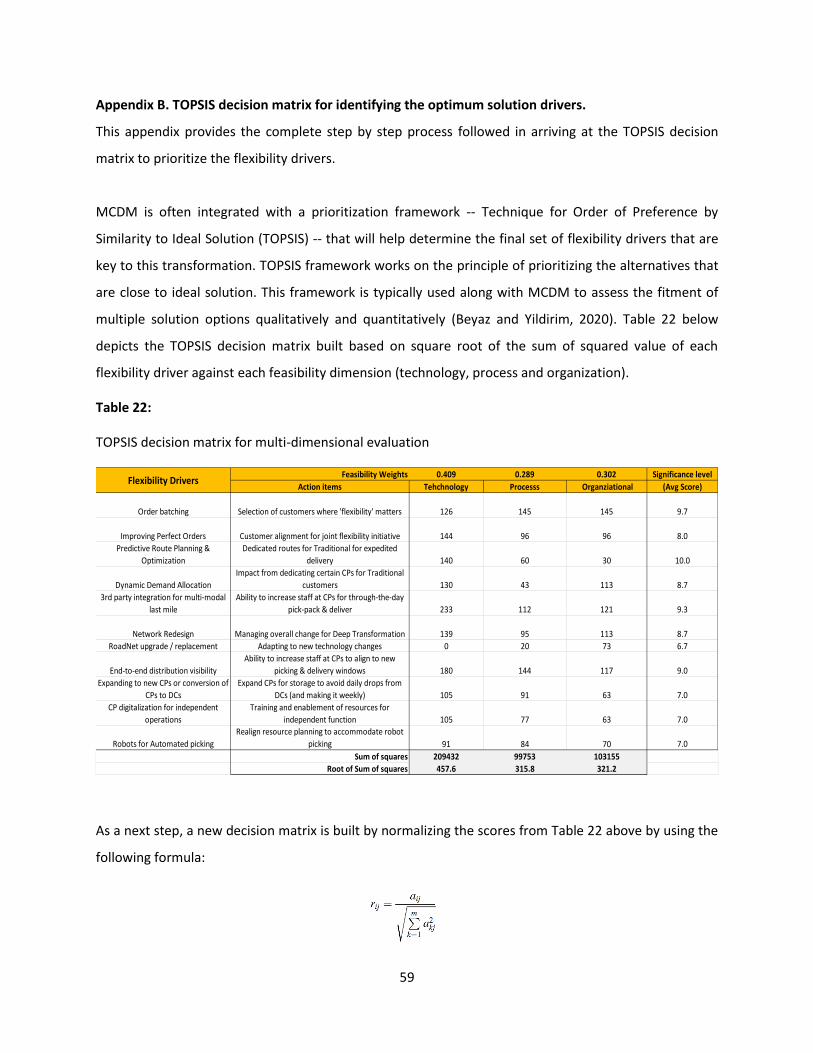
Appendix B. TOPSIS decision matrix for identifying the optimum solution drivers. .......................... 59
Page 6
6
LIST OF TABLES
Table 1: BeverageCo’s Last Mile Distribution – Key KPIs ............................................................................ 21
Table 2: Key takeaways for the product flow gap-analysis ........................................................................ 24
Table 3: BeverageCo’s customer categories (Strategic Directories) & its need for flexibility .................... 26
Table 4: Critical success factors and the key flexibility drivers ................................................................... 28
Table 5: Drivers of Flexibility – mapping and scoring ................................................................................. 29
Table 6: Feasibility analysis – critical observations and changes needed. ................................................. 31
Table 7: What does it take to make a flexible distribution model work? .................................................. 34
Table 8: Metrics to measure ‘Value’ ........................................................................................................... 39
Table 9: Simulation Input parameters ........................................................................................................ 41
Table 10: Simulation Scenarios ................................................................................................................... 41
Table 11: Simulation scenarios with 8-hour distribution ........................................................................... 42
Table 12: Simulation scenarios and Output parameters ............................................................................ 43
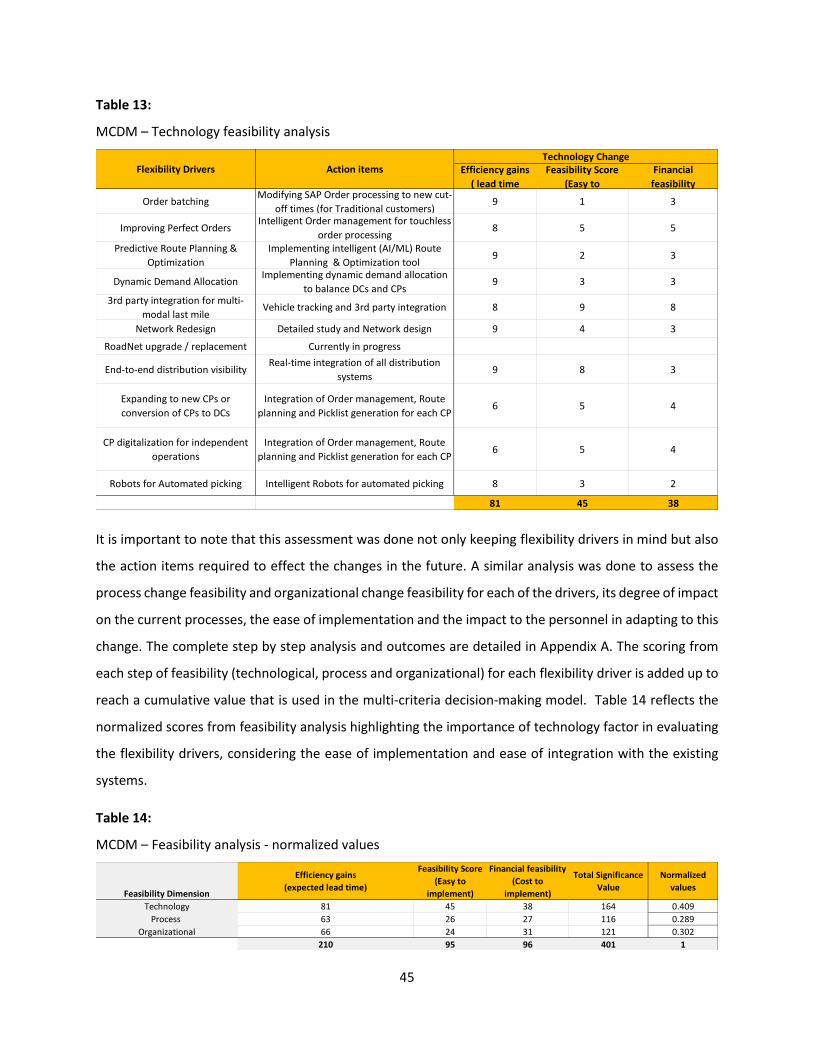
Table 13: MCDM – Technology feasibility analysis ..................................................................................... 45
Table 14: MCDM – Feasibility analysis - normalized values ....................................................................... 45
Table 15: TOPSIS decision matrix with normalized values ......................................................................... 46
Table 16: TOPSIS – Final ranking of flexibility drivers ................................................................................. 47
Table 17: Flexibility drivers – mapping and scoring .................................................................................... 55
Table 18: MCDM – Technology feasibility analysis ..................................................................................... 56
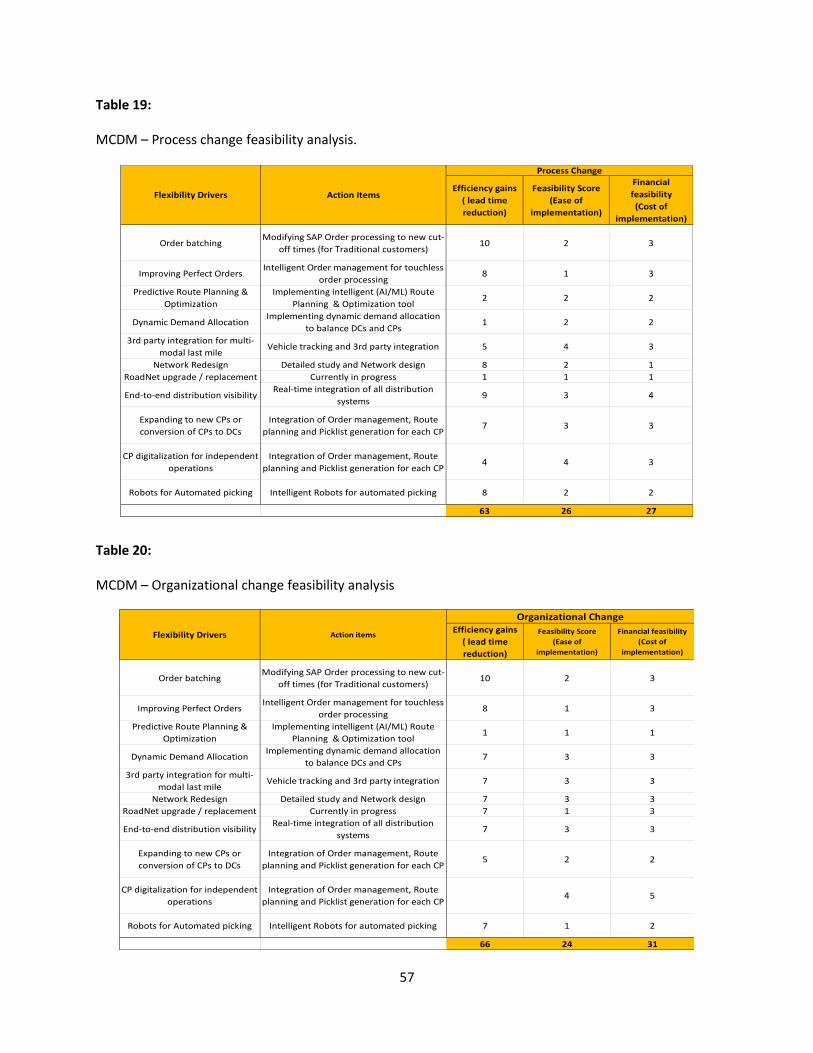
Table 19: MCDM – Process change feasibility analysis .............................................................................. 57
Table 20: MCDM – Organizational change feasibility analysis ................................................................... 57
Table 21: MCDM – Feasibility analysis - normalized values ....................................................................... 58
Table 22: TOPSIS decision matrix for multi-dimensional evaluation .......................................................... 59
Table 23: TOPSIS decision matrix with normalized values (rij matrix) ....................................................... 60
Table 24: TOPSIS decision matrix of positive & negative ideal values. ...................................................... 61
Table 25: TOPSIS – Positive Ideal Matrix .................................................................................................... 62
Table 26: TOPSIS – Negative Ideal Matrix ................................................................................................... 62
Table 27: TOPSIS – Final ranking of digital drivers ...................................................................................... 63
Page 7
7
LIST OF FIGURES
Figure 1: BeverageCo’s current & future state (vision) business model .................................................... 10
Figure 2: Detailed view of the Project Methodology .................................................................................. 17
Figure 3: Methodology for diagnosing the current state. .......................................................................... 18
Figure 4: BeverageCo’s distribution process flow ...................................................................................... 19
Figure 5: BeverageCo’s current last-mile distribution KPIs ........................................................................ 20
Figure 6: BeverageCo’s current last-mile distribution process flow ........................................................... 22
Figure 7: Gap analysis of the Information flow of distribution process ..................................................... 23
Figure 8: Gap analysis of the Product flow of distribution process ............................................................ 24
Figure 9: Feasibility analysis of flexibility in the current distribution model .............................................. 30
Figure 10: Simulation Input parameters and multiple scenario paths ....................................................... 33
Figure 11: Simulation Scenarios .................................................................................................................. 33
Figure 12: As-Is Order processing & Route planning. ................................................................................. 35
Figure 13: To-Be Order processing & Route planning ................................................................................ 35
Figure 14: As-is and To-be value streams in flexible distribution model.................................................... 36
Figure 15: End-to-end Order to Delivery flow in flexible distribution model ............................................. 38
Figure 16: Roadmap for future – Implementation recommendations ....................................................... 50
Page 8
8
1 INTRODUCTION
While fast-moving consumer goods (FMCG) companies around the world have been perpetually
challenged with change and disruption, today’s pandemic environment has put a giant spotlight on the
inflexible, often broken, supply chains due to siloed processes and disparate systems. There is an
expedited need for pursuing Digital Transformation to improve the flexibility and resilience of supply
chains (Saenz, 2020).
Elon Musk once said, “The supply chain stuff is really tricky,” and he was referring to the growing
complexity of global supply chains, making it difficult for large enterprises to anticipate risk, monitor
progress, and forecast trends that impact customer service (Flex.com, 2018). With growing uncertainties
and ever-changing market dynamics, companies across the globe need to rethink their value proposition
in order to continuously innovate, deliver superior products, services and experiences to their customers
and consumers. This new value proposition calls for a paradigm shift from a focus on pure cost-cutting
and operational efficiencies to visionary digital value propositions. This value proposition must reassess
how digital technologies and information can enhance an organization’s existing assets and capabilities to
create new customer value, to redefine business, and possibly even redefine the industry its operating in
(Ross, 2017).
Digital transformation is no longer a buzzword: it is fast becoming a mandate for organizations to thrive
in this pandemic environment. With an array of powerful game-changing technologies like social, mobile,
cloud, analytics, internet of things and cognitive computing available today, companies need to adapt and
learn quickly to take advantage of these technologies. Digital Transformation will lay the foundation for
reimagining business, defining new experiences for customers by identifying the right technologies to
deliver the new supply chain capabilities like flexibility, resilience, responsiveness, visibility, and
collaboration that have become the new order of the day.
Flexibility is a critical capability not just to navigate through supply chain disruptions but also to deliver
enhanced value to customers Especially in the era of instant gratification (led by Amazon and other
digitally native companies), there is a growing pressure for FMCG companies to deliver the same day or
within a few hours or at the time that is most convenient to their customers. In fast-growing emerging
economies, often characterized by small retail stores, flexible distribution has become a default
expectation. For most FMCG companies, it is crucial to succeed in fast-growing emerging economies as
this contributes to a significant portion of their revenues and future growth. Emerging economies are
Page 9
9
developing nations with an increasing middle class, driven by economic liberalization (Hoskisson et al.,
2000). Flexibility in distribution is key to capture the growing consumer goods market in emerging
economies effectively.
There is an added complexity in last-mile distribution in emerging economies due to the large presence
of traditional retail channel, characterized by small retail stores, often referred to as ‘nanostores’ (Fransoo
et al., 2017). With high degree of fragmentation and limited storage capacity, traditional channel retailers
tend to order lower quantities and more frequently, further increasing the distribution complexity
(Winkenbach, 2020).
Companies attempting to build flexible last-mile distribution deploy consolidation points (proximity
fulfillment centers) and multi-echelon distribution networks with a range of facility types (dark stores,
micro fulfillment centers among others), with multi-modal last-mile delivery. However, these initiatives
involve significant changes to network design and investments in fixed assets. The digital innovations
available today like predictive analytics, dynamic demand allocation and intelligent routing provide huge
scope for generating significant ‘value’ with minimal changes to the current network, systems, and
processes. The key here is to establish the vision, define ‘value’, identify the new supply chain capabilities,
and baseline the digital capabilities that will help realize the vision. Companies running successful digital
transformations start with a humble curiosity to explore, pilot new ideas in a fail-fast mode, and set the
foundation for continuous innovation and value creation.
BeverageCo’s background
BeverageCo is a multinational multi-category beverage leader enabled by its complex supply chain.
BeverageCo has grown through acquisitions, which has led to a lack of standardization of processes across
countries.
BeverageCo operates in a dynamic market that includes modern and traditional retail channels,
restaurants, among others, where there is a constant change in consumer demand. Additionally, more
than 90% of BeverageCo’s customers (~50,000) are from traditional retail channels (mom & pop stores,
referred as ‘nanostores’) with a small store footprint and large concentration in urban areas. The small
size and financial limitations faced by traditional retail channels force them to place frequent orders in
small quantity, resulting in significant complexity in last-mile distribution.
Page 10
10
Customer satisfaction is core to BeverageCo’s value system; hence the company continuously seeks
opportunities to raise its bar with service levels and customer delight. Flexibility in distribution is one of
the key strategic areas for BeverageCo to drive up customer satisfaction and growth. BeverageCo
understands that the flexibility in distribution would entail changing current business processes and
having different types of fulfillment centers to be able to deliver to its customers when it is most
convenient to them, be it same-day delivery or on the specific day and time they choose.
A market survey of the beverage industry indicates growth at around 8-12% in LATAM region (Statista
2021). Given the strategic nature of the traditional retail channel and its growth potential, it is important
for BeverageCo to bring in flexible last-mile distribution not only as a lever to raise customer satisfaction,
but also to set the foundation to build scale and to adopt a customer-centric and demand-driven supply
chain as shown in Figure 1.
Figure 1:
BeverageCo’s current & future state (vision) business model
Page 11
11
Motivation
BeverageCo’s vision is to become the best-in-class provider to its customers, and distribution is one of the
key strategic areas for BeverageCo to drive a customer-centric and demand-driven supply chain strategy.
Customer-centric supply chain strategy demands a high degree of flexibility in the distribution to be able
to deliver to customers when it is most convenient to them. Also, with 90+% of BeverageCo’s customers
in the traditional retail format (with a small footprint and large concentration in urban areas), flexible last-
mile distribution becomes a critical differentiator.
In the last few years, there has been a big drive at BeverageCo for transforming the distribution process
with the goal of improving customer-centricity and making it more demand-driven to improve flexibility.
However, these initiatives did not deliver the expected outcomes as they lacked an overarching strategy
and a clear path to transformation. Also, BeverageCo leaders have been challenged with a lot of questions
to justify the time and effort required for driving flexible last-mile distribution. This project is focused on
finding the answers to some of these key questions that concern BeverageCo:
• What is the ‘value’ behind flexibility in distribution and how could it be measured?
• What is the impact (of flexibility) on the current distribution network and processes?
• How would this transformation impact the people in the warehouses and delivery points?
• What are the new capabilities needed at the warehouses to drive flexibility in distribution?
• How easy or difficult it is to implement this change and how would it impact costs of distribution?
These are the key questions that motivate BeverageCo to define a digital transformation path, to
determine the impact on the current systems, processes and people involved, and most importantly to
develop key metrics to measure the ‘value’ behind flexibility.
Typically, transformation projects to enable flexible distribution consider network redesign and related
investments in fixed assets. However, digital maturity in the last-mile distribution has grown
tremendously in the last few years, providing huge scope for generating ‘value’ for organizations like
BeverageCo with minimal changes to the current systems and processes. Though this project recognizes
the need for network design and optimization as a long-term strategic solution, the primary focus of this
project is to identify the digital drivers to extract maximum flexibility within the current network design.
This digitalization would involve fine tuning the information flow and product flow with new digital
capabilities, thereby minimizing the impact on processes, people, and costs of distribution.
Page 12
12
With this motivation, this project implements a Value Stream analysis to map end-to-end connectivity in
distribution network, identify the gaps in information flow and product flow, determine the digital
capabilities needed to fill the gaps and baseline key performance indicators and priorities influencing the
value delivered to the organization and its customers.
In this regard, Value Stream Mapping (VSM) is leveraged to map the current state of interconnected value
streams and to identify the gaps, system inefficiencies and the business/value metrics impacted in the
current state. Drawing on this deep understanding of the current distribution model, Simulation-based
Future State Value Stream Design is built based on iterations of multiple (realistic) future scenarios, and
the key digital drivers to enable this transformation are identified. Also, a Multi-Criteria-Decision-Model
(MCDM) is used to assess the feasibility and fitness of these digital drivers to BeverageCo, based on their
impact to technology (ease of implementation and integration to current systems), process changes, and
organizational readiness to adapt to the new distribution model.
Considering the nature and complexity of BeverageCo operations in a diverse set of markets, this project
scope is limited to the Brazil market, one of the largest and the most complex markets that could provide
the opportunity to identify the key challenges and build a robust model that other markets can benefit
from.
Page 13
13
2 Literature Review This chapter reviews the existing literature on Digital Transformation, Value Stream Mapping (VSM),
Simulation-based future-state value stream design and Multi-Criteria-Decision-Model. This study will
introduce the concepts and terminologies that will be used throughout the project.
Digital Transformation imperatives
Digital Transformation could open a new paradigm for companies to redefine its business and possibly
even an industry. To become digital, companies must define a visionary value proposition to reimagine
new supply chain capabilities that leverages digital technologies, existing assets, and organizational
capabilities to create new customer value. (Ross, 2017).
Data connectivity is another critical component needed for successful digital transformations. This
includes building the data foundation, the plumbing needed for connecting enterprise systems, and
designing cognitive and predictive capabilities to provide insights throughout the value chain. Successful
transformations mandate organizations to have a well-defined digital strategy, courage to take calculated
risks and maniacal focus on creating value. Some of the key digital transformation imperatives are (Catlin
et. al, 2015):
• Crafting a vision to reimagine new capabilities.
• Establishing a clear value proposition – value to both internal and external stakeholders.
• Senior management commitment – to review, govern and bring in required investments.
• PMO for holistic change management that helps with cultural alignment, prioritization, risk
management, and conflict resolution.
• Cross-functional collaboration with an inclusive and participative ecosystem.
• Defining KPIs and KLIs (Key Learning Indicators) – that help in defining what success looks
like as an outcome of the transformation journey.
• Building the Data Foundation – that can provide the right real-time data.
• Digital Transformation Office – that helps in selecting the right technology and partners, to
achieve the value proposition.
• Creating a Data Science COE – that helps in shaping data-driven analytics.
• Setting up a fail-fast, learn-quick culture with the spirit of continuous innovation and value
creation.
Page 14
14
Digital transformation needs a paradigm shift in thinking of how an organization leverages technology,
people, and processes to reimagine their value propositions (Westermann, 2020).
BeverageCo’s vision is to transform its distribution as the source of competitive advantage, to drive
customer centricity and deliver value. Digital transformation is a key priority for BeverageCo to realize its
vision and set the foundation for continuous value creation.
This project will implement Value Stream Mapping (VSM) to map current and future state of
interconnected value streams. VSM will help identify the gaps, system inefficiencies and the business /
value metrics impacted in the current state and define the value-adding activities that will contribute to
Digital Transformation of the last-mile distribution.
Value Stream Mapping
Value steam refers to a collection of information and product flow sequences that is required to deliver
goods or services to a customer or an end consumer. Value stream mapping (VSM) is a powerful
organization transformation tool that helps in visualizing complex systems to identify gaps and
recommend changes to optimize information and product flow (Martin and Osterling, 2014).
VSM helps in breaking down a complex business process into simple stream of activities to better
understand the bottlenecks in the current state and to design a future state value stream that can result
in improved lead time and optimized product flow (Kayakutlu, et. al., 2004).
However, typical value stream maps provide only a static analysis of a system, without reflecting on the
system behavior for various realistic scenarios of future. Hence it is important to integrate VSM with
simulation-based analysis to visualize the future state under different constraints and assess the impact
to the performance metrics (Liu and Yang, 2020).
Simulation-based Future State Value Stream Design
Simulation is a powerful tool to stress test the future state behavior of a value stream in a short time
frame without having to make large investments in time and cost. Integrating VSM and simulation
provides a realistic view of the future state, to help understand the feasibility and impact to critical
performance metrics. Also, simulation of the VSM allows iteration of multiple real-time scenarios without
the constraints of process limitations or system limitations in the current state. VSM and simulation
Page 15
15
together provides a holistic view of the future state and its alignment to the overall vision of the
transformation initiative (Alzubi et al. 2019).
With this understanding, this project leveraged both VSM and simulation to map the current value stream
and design future state value stream based on the simulation outcomes for multiple real-time scenarios.
The simulation approach involves setting up a base scenario, replicating the current state value stream
with necessary constraints like distribution point locations, customer locations, number of orders to be
delivered by each distribution point, time to deliver, type of vehicles to use, vehicle capacity, among
others Once the base scenario is established and the results closely mimic the current state performance
outcomes, then it is easy to run multiple ‘what-if’ anlaysis for future state scenarios by fine tuning a
combination of input variables and comparing the outcomes with that of the base scenario to understand
the impact of each scenario to the performance metrics (Ivanov, 2019).
Multi-criteria-decision-model (MCDM)
With digital transformation as the foundation for value creation, and with multiple digital solutions
available to reach the destination, it is important to identify appropriate digital tools that are best fit for
purpose and can scale for more complex scenarios in future. This challenge requires multi-
dimensional/criteria, and decision-making models that integrates the aspirations of the subject matter
experts at BeverageCo and literature review of insights from the researchers and thought leaders in this
domain. In this regard, multi-criteria-decision-model will be leveraged to identify the technical, process
and organizational change levers that aligns with the digital transformation drivers in realizing the vision
(Beyaz and Yıldırım, 2020).
This framework leverages the future state value stream design and the simulation outcomes to define the
key digital drivers that are relevant for the transformation. The significance level of these drivers (impact
to the performance outcomes) is mapped and scored by BeverageCo subject matter experts (SMEs) for
evaluating the appropriateness of digital transformation tools for future state value design.
While performance outcomes are critical in assessing the digital drivers, there are other dimensions such
as technology (ease of implementation and integration to current system), process change and
organizational readiness that are critical in this fitment assessment. However, it is difficult establish a
quantitative assessment approach on these parameters and hence it is needed to utilize qualitative
evaluations based on the scores and ratings from BeverageCo SMEs.
Page 16
16
MCDM is integrated with a prioritization framework -- Technique for Order of Preference by Similarity to
Ideal Solution (TOPSIS) -- that will help determine the final set of flexibility drivers that are key to this
transformation. TOPSIS framework works on the principle of prioritizing the alternatives that are close to
ideal solution. This framework is typically used along with MCDM to assess the fitment of multiple solution
options qualitatively and quantitatively (Pagone, et al., 2020).
TOPSIS prioritization framework involves building decision matrix for each digital driver, against each
feasibility dimension by measuring the similarity to ideal solution. To measure the variation of each
decision point (digital driver) of each feasibility dimension (technology, process, and organization), from
the positive ideal (best fit) and negative ideal (least fit) solution set, Euclidian distance approach is used.
This approach helps in determining the ‘relative closeness’ to ideal solution for each digital driver and to
baseline the critical drivers to enable the transformation (Beyaz and Yıldırım, 2020).
How is this framework relevant for BeverageCo?
The primary focus of this project is to establish a digital transformation strategy for flexible last-mile
distribution. This involves understanding the current distribution value stream, identifying the gaps,
defining the digital drivers that are best fit for purpose and finally designing the future state value stream
that meets the objective of flexible last-mile distribution.
Value stream mapping helps in understanding the current information flow and the product flow, the
digital and process limitations, the gaps that need to be addressed to realize the vision. Given the dynamic
nature of the distribution model at BeverageCo, it is important to integrate simulation with VSM to design
the future state value stream for different realistic scenarios.
MCDM along with TOPSIS decision framework, helps in prioritizing the key digital drivers that are best fit
for purpose to realize the vision. This approach not only uses the performance outcomes of each digital
driver but also helps assess the feasibility and value of each digital driver based on its ease of integration
with current systems at BeverageCo, ease of implementation with minimal impact to processes and ease
of adoption for the people involved in the distribution function.
Page 17
17
3 Methodology
BeverageCo’s vision is to transform the supply chain as the source of competitive advantage, to drive
customer centricity and deliver value. Distribution is one of the key strategic areas for BeverageCo that is
critical to drive customer-centric and demand-driven supply chain strategy.
With ‘value creation’ at the core of this transformation, this project will implement a Value Stream
Mapping (VSM) methodology to map current and future state of interconnected value streams. VSM will
help identify the gaps, system inefficiencies and the metrics impacted in the current state and define the
value-adding activities that will contribute to Digital Transformation for flexible last mile distribution.
Considering the dynamic nature and complexity of BeverageCo distribution model, it is essential to extend
Value Stream Mapping with simulation-based future state design that addresses the operational nuances
and takes into account the current process limitations, digital maturity, and value to be realized. Figure 2
shows the stages of the methodology used in this project to define the future state value stream design
and the core set of digital transformation drivers that enable flexible last-mile distribution.
Figure 2:
Detailed view of the Project Methodology
Page 18
18
Considering the nature and complexity of BeverageCo operations in a diverse set of markets, it is essential
to identify a pilot market for Value Stream Mapping, which becomes a representative sample for
implementation across other markets. This project scope is limited to the Brazil market, one of the largest
and the most complex markets that could provide the opportunity to identify the key challenges and build
a robust model that other markets can benefit from.
Current state Value Stream Mapping
Diagnosis of the as-is state of BeverageCo is the foundation for the entire project. Understanding the
company’s current process and digital maturity will help identify opportunities and gaps in the last mile
execution with a focus on flexibility and the value associated. Figure 3 depicts the critical steps involved
in this analysis.
Figure 3:
Methodology for diagnosing the current state.
3.1.1 Data Gathering
To understand the current situation of BeverageCo, meetings were conducted with BeverageCo’s supply
chain executives, specifically in the distribution function. This provided insights into the company’s
priorities, digital capabilities, processes, actors, and technologies. Based on these meetings, the main
aspects for digital transformation of distribution were considered as follows:
• Order batching with a cut-off point for intake of orders, to streamline the product flow strategy.
• Predictive route planning and optimization to optimize vehicle utilization and occupancy.
• 3rd party integration to expand the multi-modal vehicle selection for last-mile delivery.
Apart from the data collected during the meetings, BeverageCo also provided a database of critical
distribution operational details that includes Order to delivery tracking data, Distribution Center shipment
volumes, Delivery tracking analysis, and Distribution network map. These are the critical data points
instrumental in building the current state value stream map with specifics on information flow and
product flows including delays and points of failure.
5.
Identifying
Gaps &
Whys
1.
Data
Gathering
2.
Understanding
As-Is business
process
3.
Benchmarking
KPIs
4.
Building VSM for
current Product
& Information
Page 19
19
3.1.2 Understanding As-is business processes & digital capabilities.
The last-mile distribution (outbound to customers) is a tightly controlled process at BeverageCo with more
than 90% of customer orders delivered within 31 hours (from the time of ordering). Figure 4 illustrates
the current distribution process flow, highlighting a 11-hour Information flow and 20-hour Product flow.
BeverageCo uses several order intake channels like call-centers, mobile ordering and whatsapp ordering
among others. The core order management system is SAP that processes the orders in multiple batches
during the day to create delivery notes and delivery groups for the Distribution Centers (DCs) and the
Consolidation Points (CPs) for delivering each order. BeverageCo uses RoadNet as the route planning and
optimization engine and Greenmile as the delivery tracking tool. Once the order processing and the route
generation is completed, the product flow journey starts. The DCs and CPs have a continuous picking and
loading from 6pm to 8am and followed by the last-mile delivery to customers between 8am and 2pm,
completing a 20-hour product flow journey.
Figure 4:
BeverageCo’s distribution process flow
Page 20
20
3.1.3 Benchmarking KPIs
BeverageCo has a robust tracking and monitoring capability of the entire distribution process with a deep
focus on Customer satisfaction, Cost of Operations, and Productivity. Figure 5 shows some of the
categories of key KPIs currently monitored, reflecting a high degree of operational maturity and
performance excellence benchmark set by BeverageCo.
Figure 5:
BeverageCo’s current last-mile distribution KPIs
Table 1 below shows the actuals of the most critical customer centric KPIs and Operational KPIs that
BeverageCo is tracking currently, highlighting vehicle utilization and vehicle occupancy as the lagging
indicators.
Client KPIs: Costs KPIs:
Order fulfillment Fill Rate Cost to serve
Delivery Effectiveness Cost to deliver
Delivery Efficiency (# of clients -
# clients with returns)
Cost per distribution model
(own fleet; third-party)
Delivery Service Metric
(Customer Engagement)
Cost per vehicle type
(van, truck, toco, etc)
Productivity KPIs: Digital Technologies KPIs:
Unit cases/ Head Count Adherence to digital distribution initiatives
Unit Cases /number of deliveries Real Time Routing
Client Dropsize RTR, Geo-efficiency
Operations KPIs: Asset & Legal KPIs:
Costs Load occupancy (in vehicle)
Productivity Fleet utilization
Asset (vehicle utilization) Workday (labor journey)
Adherence to technology
(Ex. Greenmile Pro monitoring software) Legal constraints (ex. Fines)
Page 21
21
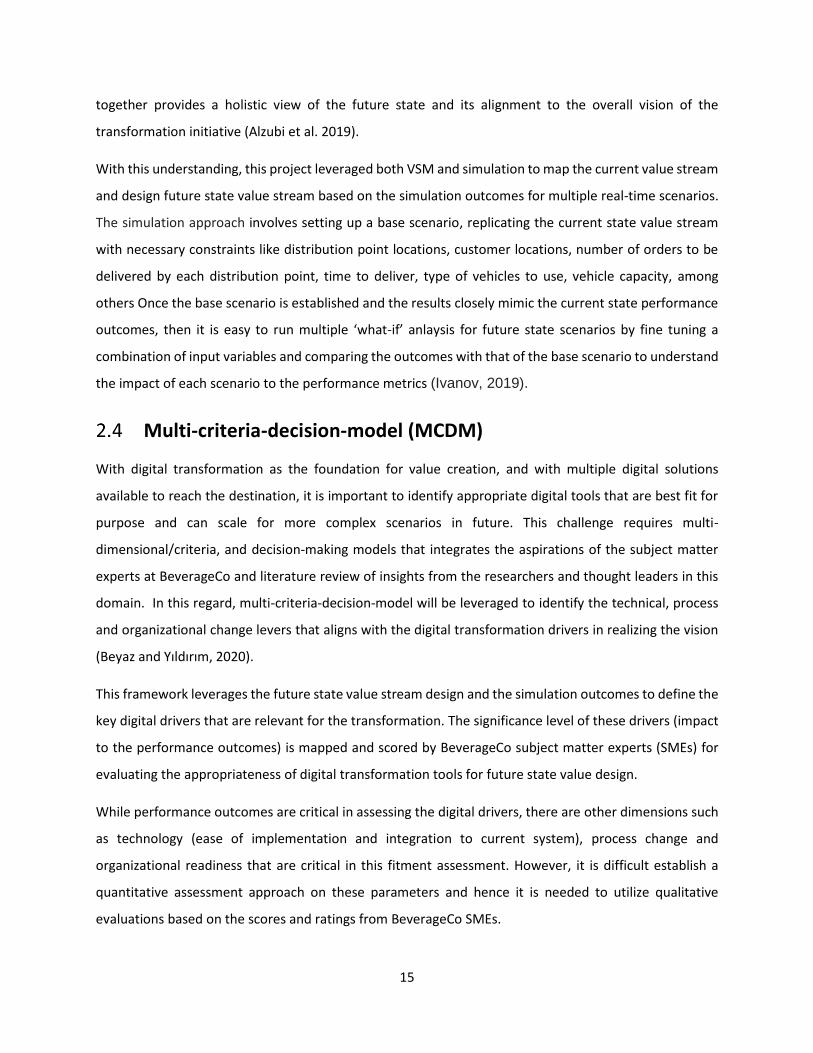
Table 1:
BeverageCo’s Last Mile Distribution – Key KPIs
Key observations on the critical metrics:
• Vehicle utilization rate at 76% reflects inflexible network design and distribution strategy resulting
in vehicles being under-utilized.
• Vehicle occupancy rate at 75% reflects planning inefficiency with a lot of LTL (Less than Truck
Load) that needs to be optimized.
The assessment of the current KPIs and the actuals reflects a high standard that BeverageCo has set for
its operations and the focus on continuously improving on its own benchmark. However, one of the
challenges that BeverageCo is facing today is the lack of clarity in defining ‘value’ of flexibility in last mile
execution and the ability to measure it. Hence there is need for a redefined focus on a new set of metrics.
The following are some of the potential metrics that needed to be defined and baselined collaboratively
with BeverageCo:
• Visibility of the value of each client category (bronze, silver, and gold)
• Adherence to delivery window at the convenience of the customers
• Order processing and route planning efficiency (target less than 5min)
• Picking and loading efficiency (target less than 60min)
• Compliance to shorter delivery lead times – 2-hour, 4-hour or same-day delivery
• Utilization of multi-modal distribution types
• Net Promoter Score
Most Important KPIs Unit of Measure FY '19 FY '20
Order Fulfillment Orders delivered / Orders received 86.6% 89%
Delivery Effectiveness Volume (in Unit cases) 97.97% 98.52%
Cost per unit case Currency BRL (R$) 0.98 0.99
Cost per unit case with inflation Currency BRL (R$) 1.00 0.98
Vehicle Occupancy Volume (unit cases) 73.42% 75.11%
On Time Delivery Actual Dly Dt / Requested Dly Dt 90.20% 91.10%
Case Fill Rate Cases delivered / Cases Ordered 96.80% 96.60%
OTIF On Time Delivery x Case Fill Rate 87.31% 88.00%
Total Availability of KOF + 3PL fleet # Vehicles (abs %) 96.18% 96.85%
Total vehicle utilization # of vehicles 80.20% 76.17%
Page 22
22
Some of the KPIs listed above are aspirational, and current benchmarks may not exist. However, the
critical requirement for this project is to analyze and understand how these metrics could be made
operational and as well to suggest a path for continuous improvement.
3.1.4 Building VSM for the current Information and Product flow
Figure 6 depicts BeverageCo’s current last mile distribution process highlighting the information flow and
product flow serving more than 55,000 clients (also referred as customers) each day, accounting for a
volume of 2-million unit-cases (UC). It is important to note that 90% of the clients are from traditional
retail channel that are small stores, spread across dense urban cities, adding to the complexity of last-mile
distribution. The Information flow (11 hours lead time) involves continuous flow of orders between 7am
and 5pm followed by route planning and optimization process scheduled to complete by 6pm. The
product flow (20 hours lead time) takes two distinct routes, one through the distribution centers (DCs)
and the other through the consolidation points (CPs). DCs (40+ sites) are large warehouses that serve the
customers and as well feed the CPs with its daily orders for fulfillment. Consolidation points (around 50
sites) are small fulfillment centers (some of them are cross docking locations) with limited storage
capacity. Hence, CPs need daily replenishment for the daily orders to be fulfilled, serving 25% of the
volume.
Figure 6:
BeverageCo’s current last-mile distribution process flow
Page 23
23
3.1.5 Identifying gaps in the current value stream and the reasons behind
BeverageCo runs an efficient distribution operation, delivering more than 2 million cases each day.
However, the current process and digital capabilities may not help scale for the huge aspirations of
transforming from the 31-hour distribution model to a same-day or 4-hour delivery model. Figure 7 shows
some of the key opportunities (gaps) in the information flow of highlighting the need for batching the
orders to reduce the 11-hour order intake lead time, predictive route planning and optimization capability
to improve the vehicle utilization and occupancy metrics.
Figure 7:
Gap analysis of the Information flow of distribution process
The product flow gap-analysis is even more critical as it involves a 20-hour lead time. Figure 8 depicts the
a detailed gap-analysis of the product flow of distribution process at BeverageCo, indicating the need for
flexible picking and loading at CPs to align with flexible delivery schedule and the need for third party
integration for multi-modal delivery options that are critical for urban last mile logistics.
Page 24
24
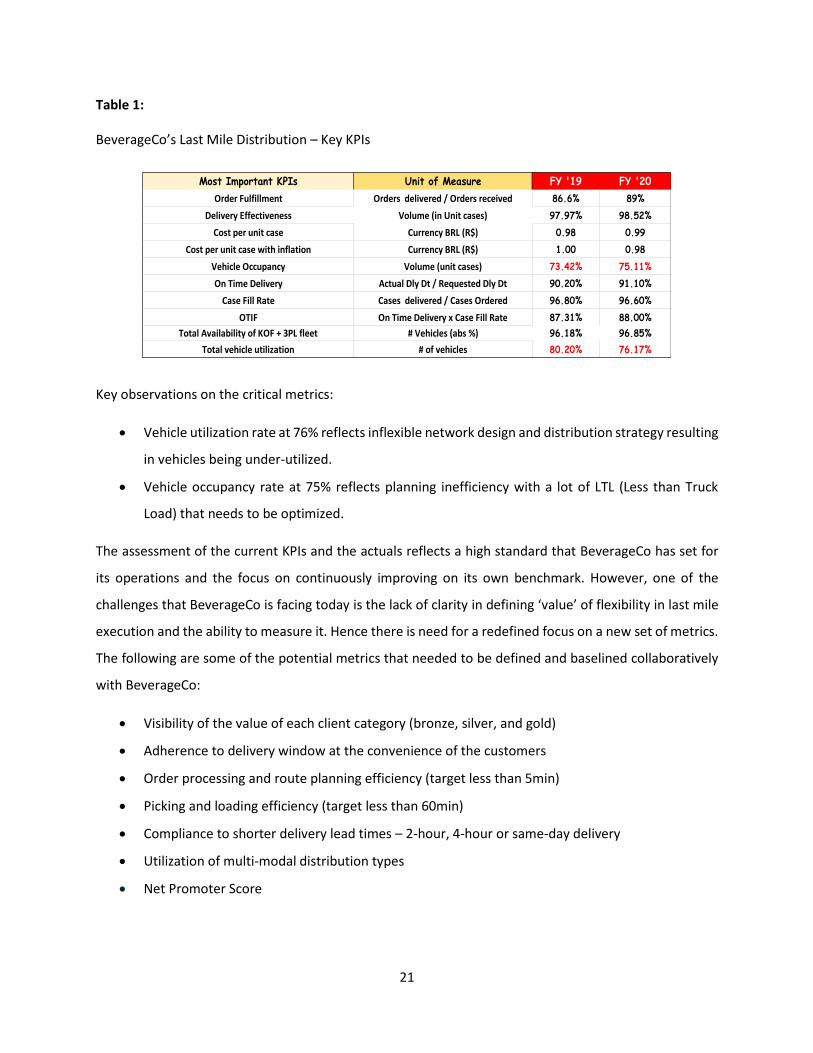
Figure 8:
Gap analysis of the Product flow of distribution process
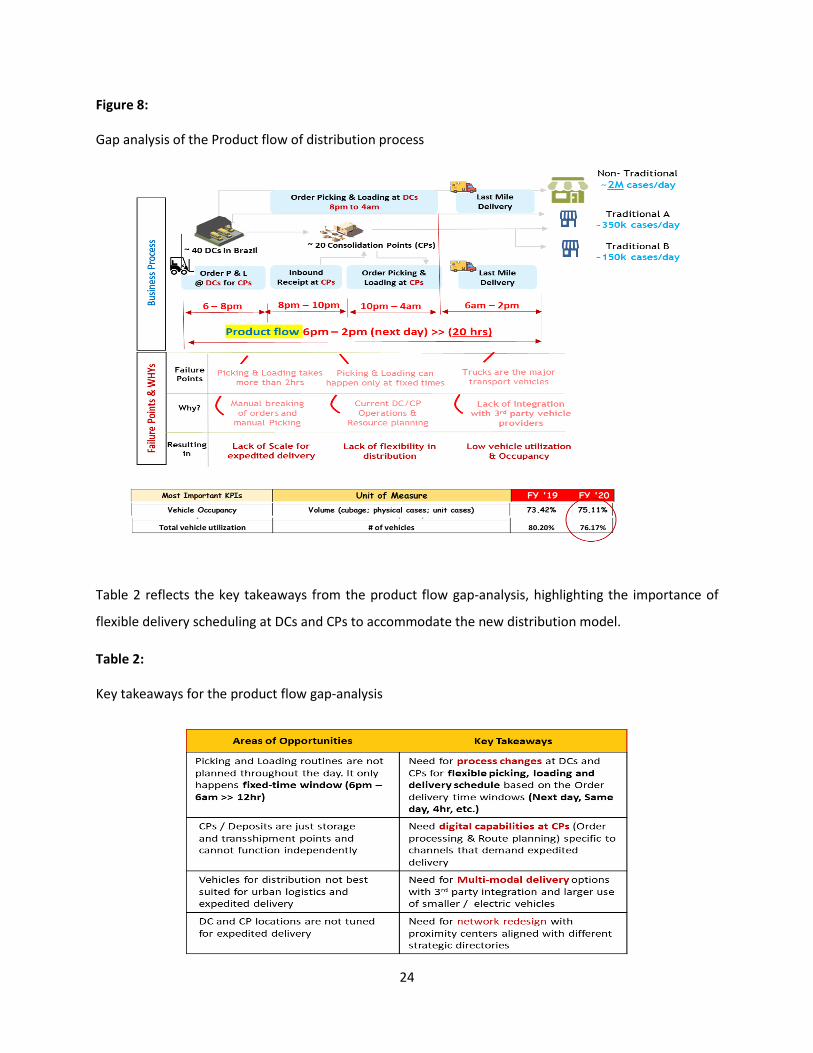
Table 2 reflects the key takeaways from the product flow gap-analysis, highlighting the importance of
flexible delivery scheduling at DCs and CPs to accommodate the new distribution model.
Table 2:
Key takeaways for the product flow gap-analysis
Page 25
25
Creating the Vision for future state
Distribution is one of the key strategic areas for BeverageCo that is critical to drive customer-centric and
demand-driven supply chain strategy. Customer obsession is core to BeverageCo value system and
flexibility in distribution is critical to improve customer satisfaction. To establish the vision for future state
distribution, it is important to understand BeverageCo’s definition of flexibility and aspirations of value,
increased flexibility could deliver. For BeverageCo, flexibility in distribution is having the capacity to deliver
when it is most convenient to the clients, be it same-day delivery or on the specific day and time clients
choose. BeverageCo understands that this would bring tremendous value to its clients. Flexibility would
entail changing the fixed sales-distribution process, which is selling and taking orders from the clients
between 7 am – 5 pm and delivering the following day in the current setup.
3.2.1 Vision for flexible last mile distribution
BeverageCo’s definition of ‘value’ is associated with consistency in service excellence and flexibility in
adapting to new customer requirements thereby driving up customer delight. While this is a powerful,
customer-centric value proposition, it needs to be refined to reimagine the business, to reimagine new
possibilities of creating value for all the partners in the network. The foundation to this transformation is
in setting the ‘vision’ and the ‘value’ proposition that flexibility could deliver, as described below:
• to transform BeverageCo to become the best-in-class provider to its customers.
• to redefine company’s value proposition to deliver enhanced services, and customer engagement.
• to clearly understand customer expectations and implement new technologies and best practices.
• to become a reference for outstanding service capability to customers
• to be extremely efficient with costs (resource optimization capacity, route planning capacity, among
others), while continuously delivering ‘value’ to customers
• to create new possibilities to redefine the business, going beyond beverage distribution as the core,
to create new value proposition and new business opportunities.
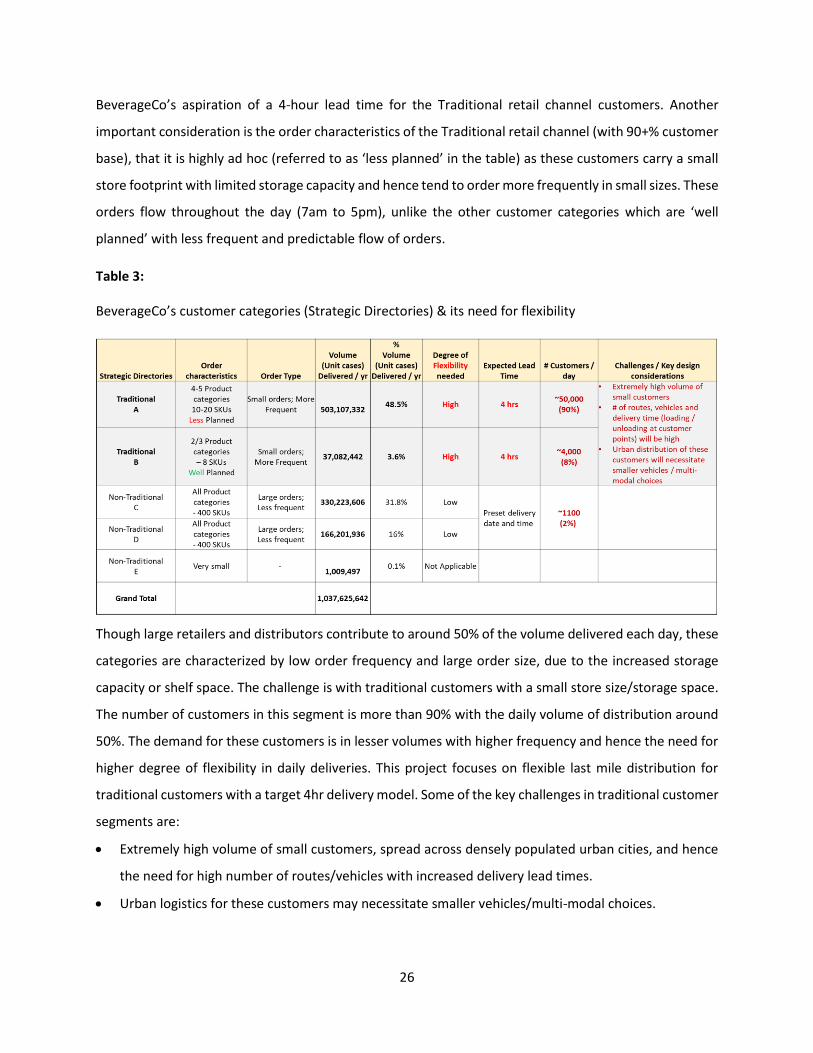
3.2.2 Establishing target channels for flexible distribution
Flexible last-mile distribution is a complex transformation journey; hence it is important to not to boil the
ocean but rather target specific channels of distribution where the flexibility makes most sense.
BeverageCo currently has 5 customer categories (Strategic Directories). Table 3 is a snapshot of
BeverageCo’s customer categories and their order and delivery characteristics. This table highlights
Page 26
26
BeverageCo’s aspiration of a 4-hour lead time for the Traditional retail channel customers. Another
important consideration is the order characteristics of the Traditional retail channel (with 90+% customer
base), that it is highly ad hoc (referred to as ‘less planned’ in the table) as these customers carry a small
store footprint with limited storage capacity and hence tend to order more frequently in small sizes. These
orders flow throughout the day (7am to 5pm), unlike the other customer categories which are ‘well
planned’ with less frequent and predictable flow of orders.
Table 3:
BeverageCo’s customer categories (Strategic Directories) & its need for flexibility
Though large retailers and distributors contribute to around 50% of the volume delivered each day, these
categories are characterized by low order frequency and large order size, due to the increased storage
capacity or shelf space. The challenge is with traditional customers with a small store size/storage space.
The number of customers in this segment is more than 90% with the daily volume of distribution around
50%. The demand for these customers is in lesser volumes with higher frequency and hence the need for
higher degree of flexibility in daily deliveries. This project focuses on flexible last mile distribution for
traditional customers with a target 4hr delivery model. Some of the key challenges in traditional customer
segments are:
• Extremely high volume of small customers, spread across densely populated urban cities, and hence
the need for high number of routes/vehicles with increased delivery lead times.
• Urban logistics for these customers may necessitate smaller vehicles/multi-modal choices.
Page 27
27
Realizing the vision for future state value stream
BeverageCo’s vision is to transform the distribution model for traditional customers, from the current 31-
hour lead time to less than 4 hours. This is aspirational and may demand significant changes to current
distribution process, bringing in new digital capabilities for seamless execution right from order capture
to last-mile execution. The key here is to establish the critical success factors, identify the flexibility drivers
and most importantly the ‘value’ it will deliver.
3.3.1 Critical success factors and the key flexibility drivers to realize the vision
To realize this vision, it is important to set the priorities, build the foundation, baseline the current metrics,
and identify new metrics to measure ‘value’. Identifying the critical success factors, the transformation
drivers, will help BeverageCo, accelerate the journey to realize its vision. Digital Transformation is a critical
component needed to meet the objective of extracting maximum value from within the current network
and minimizing the impact to current processes and people. Also, it is important to transform the fixed
sales-distribution process to align with the new flexible distribution model. Nevertheless, this change must
be driven with new digital capabilities than pure process changes to reduce impact to the current
operations and people. This includes integration with third party logistics providers for implementing
multi-modal distribution that will enable significant flexibility in last-mile distribution with different
choices of vehicles based on the delivery requirements. Finally, defining a clear set of metrics to measure
‘value’ in driving increased flexibility is critical as well to monitor, track, and course correct the progress
of the transformation.
While there are multiple options for BeverageCo to consider in driving this transformation, there are a
few that has the profound impact in realizing the vision of flexible distribution. Based on the discussions
with BeverageCo, some of the critical success factors jointly identified are: (1) changing the fixed sales-
distribution process to add more flexibility (in ordering process, delivery schedule, among others), (2)
increasing the flexibility and agility in fulfillment centers (DCs and CPs) with flexible picking and loading
schedule, (3) establishing new fulfillment channels at proximity to customers and (4) integration with third
party logistics for multi-modal delivery. For each of these critical success factors, it is important to identify
the flexibility drivers, the new digital and process capabilities that will enable this transformation. Table
4 summarizes the discussion outcomes with BeverageCo, in identifying the key flexibility drivers to enable
each critical success factor. Also, for each flexibility driver the expected performance outcomes are
outlined as a measure of ‘value’ each flexibility driver could deliver.
Page 28
28
Table 4:
Critical success factors and the key flexibility drivers
3.3.2 Drivers of flexibility – mapping and scoring
Flexibility drivers are the new digital and process capabilities that are key to this transformation and hence
it is important to understand the value each flexibility driver could bring to the entire distribution value
stream. Table 5 depicts the mapping of each flexibility driver against each life-cycle stage of the complete
distribution process and the scoring (significance level) provided by BeverageCo SMEs. The main idea
behind this mapping and scoring is to understand how BeverageCo SMEs weigh the transformation drivers
considering their process and systems limitations. This is a critical input for the future state value stream
design as it integrates the drivers with higher values to optimize the information and product flow.
Page 29
29
Table 5:
Drivers of Flexibility – mapping and scoring
Future state value stream design
The critical phase of this project is to define the path for transformation from the current state to the
future state vision for the flexible distribution model. BeverageCo’s vision is to transform from a 31-hour
delivery model to less than 4 hours for the traditional customers that accounts for 90+% of the deliveries.
The traditional channels are highly fragmented and unorganized, leading to a higher density and network
complexity. Furthermore, these customers are challenged by limited storage capacity and hence are
inclined to smaller order quantities and more frequent replenishments, which drives uncertainty of
demand, time and quantity thereby increasing last-mile distribution complexity.
The future state value stream design not only accounts for the distribution complexity, but also the
limitations of the current processes and digital maturity at the DCs and Consolidation points. Hence the
future state value stream is designed with the following key design principles:
• Feasibility analysis of the flexibility in the current distribution model to understand the degree of
complexity in effecting the change.
• Simulation based future state value stream analysis based on realistic future scenarios of last-mile
distribution
• Assessing what it takes to make a 4-hour distribution model work with focus on ease of
implementation and impact to the current people, processes, and tools.
Page 30
30
3.4.1 Feasibility analysis of the flexibility in the current distribution model
The current distribution at BeverageCo is a 31-hour model with digital flow lead time of 11 hours and
product flow lead time of 20 hours. The target state of 4-hour distribution is a significant shift from the
current state and hence it is important to understand how feasible it is to drive this change. The objective
of the feasibility check is to determine the degree of flexibility in the current distribution model and to
identify what it takes to transform. Figure 9 illustrates the outcome of the feasibility analysis conducted
across digital capabilities and process requirements in the current distribution model. It highlights the
ability to optimize the digital flow to a near real-time process by fine tuning the current systems (SAP and
RoadNet). Given that the current order processing happens in batches (though not in line with the
customer delivery requirements), this change can be implemented. However, optimizing the 20-hour
product flow journey in the current setup will be difficult and might involve network redesign or process
changes.
Figure 9:
Feasibility analysis of flexibility in the current distribution model
Table 6 below summarizes the feasibility analysis with critical observations and the changes needed to
design the future state value stream. Specifically, fine tuning the current order management and route
planning systems SAP and Roadnet to near real-time mode is feasible and will bring down the overall lead
time by 11 hours. However, the picking and loading would still incur 12 hours lead time due to the current
Page 31
31
process setup at the DCs and CPs and that CPs need daily replenishment from the DCs due to its size
limitations. This highlights the importance of reimagining the product flow in a way the process lead time
impact is minimized. Finally, the 8-hour last-mile delivery is another opportunity for optimization by
choosing the right balance of load between DCs and CPs, and as well the right vehicle types through
integration with third-party logistics providers with multi-modal distribution.
Table 6:
Feasibility analysis – critical observations and changes needed.
The key takeaways from the feasibility analysis are:
• Reducing the picking and loading is critical to this transformation and needs new perspective on how
digital capabilities can be leveraged to minimize this lead time.
• Need for fine tuning the DC and CP picking & loading schedule and as well the resource planning to
bring in flexibility that reduces the picking and loading lead time.
• Simulate multiple last-mile delivery scenarios to explore the possibility of 2-hour, 4-hour, 6-hour and
8-hour models to explore the possibility of lead time reduction with last-mile delivery.
Page 32
32
3.4.2 Simulation-based future state value stream design
Simulation is a powerful tool to stress test the future state behavior of a value stream in a very short time
frame without having to make large investments in time and cost. Integrating VSM and simulation
provides a realistic view of the future state, to help understand the feasibility and impact to critical
performance metrics. Also, simulation of the VSM allows iteration of multiple real-time scenarios without
the constraints of process limitations or system limitations in the current state. For BeverageCo, the
objective is to design a flexible distribution model with a target 4-hour distribution from the time of order
capture cut-off to the time of delivery. Based on the feasibility analysis, the two product flow areas that
induces the latency are, picking and loading and the last-mile delivery. Given that the picking and loading
is largely dependent on the process changes, the real opportunity is in last-mile delivery that can be
expedited by choosing the right balance of load between DCs and CPs, and as well the right vehicle types.
The key consideration here is in ensuring that the expedited deliveries do not incur high costs of
transportation to make this entire pursuit in flexibility, financially unviable.
3.4.2.1 Simulation approach and scenarios
The simulation approach involves setting up the base scenario, that mimics the current state value stream
with necessary constraints and running ‘what-if’ analysis for multiple future state scenarios by fine tuning
a combination of input variables. The following steps detail the simulation approach: (1) setting up the
distribution network with DCs, CPs and Customer locations; (2) setting up the capacity constraints at each
DC and CP; (3) mapping the demand requirement for each customer and the expected lead time
requirement; (4) setting up the type of vehicles, its capacity constraints and cost of transportation. With
this setup, the base scenario is run a few times to make sure the results closely mimic the current state
performance outcomes. Once the base scenario is established, the future state scenarios are run, and the
simulation outcomes are compared with that of the base scenario to understand the impact of each
scenario to the performance metrics.
Figure 10 and 11 below illustrates the key input parameters used in the simulation runs: and as well the
specific future state scenarios considered. The first scenario considers the product flow as it is in the
current setup with DCs and CPs delivering to customers. The second and the third scenarios consider the
delivery from only DCs or CPs. The main idea here is to identify if the lead time could be reduced by
choosing either of this distribution points instead of delivering from both locations. For each of these
scenarios, multiple scenario iterations are considered for each of the 2hour, 4-hour, 6-hour and 8-hour
lead time options.
Page 33
33
Figure 10:
Simulation Input parameters and multiple scenario paths
Figure 11:
Simulation Scenarios
3.4.3 What it takes to make a 4-hour distribution model work?
The feasibility analysis and simulation outcomes provide key insights on how both digital flow and the
product flow must be adapted to design a flexible distribution model be it 4-hour or a same-day delivery
model. The digital flow that takes about 11 hours currently, must be refined to be near real-time to get to
zero-latency. The product flow journey that takes about 20 hours currently must be refined to 4-hour or
less than 8-hours to make it a same-day delivery. Though the shift from a 31-hour distribution to a 4-hour
model appears to be a massive transformation initiative with significant changes to processes and
adoption of new tools, the primary objective of this project is to identify new digital capabilities that would
make this transformation feasible with limited changes to existing systems and current processes.
Table 7 articulates the changes needed in the Information flow and product flow to realize the future state
value stream for the traditional customers. The salient features of this design recommendations are with
digitalization of order processing and route planning with intelligent forecasting and predictive route
planning that will help DCs and CPs to plan ahead of time for the deliveries to be made the following day.
Also, this digitalization will keep the process change requirements to minimum as the current picking and
loading at DCs and CPs can continue with intelligent forecasting and planning of daily deliveries. The
process changes required are with order in-take from customers, happening between 7am and 8am (8am
Page 34
34
order intake cut-off) on the day of delivery, and with the resource planning at DCs and CPs to have delivery
personnel available for final loading and last-mile delivery at 8am.
Table 7:
What does it take to make a flexible distribution model work?
3.4.4 Future state value stream design for flexible distribution model
Digitalization is key for future state value stream design, to meet objective of flexible distribution while
keeping the process changes to minimum. This involves introducing an intelligent forecast driven delivery
planning and as well predictive route planning at DCs and CPs, to ensure majority of the picking and
loading required for the delivery next day, is already accomplished even before the daily orders are
received (7 – 8am, the next day). Figures 12 and 13 helps with the comparison of current digital flow with
that of the suggested digital flow for order processing and route planning:
Page 35
35
Figure 12:
As-Is Order processing & Route planning.
Figure 13:
To-Be Order processing & Route planning
Page 36
36
The next important design component of future state value stream is in shaping the picking, loading and
last-mile execution the following day, the day orders are received (by 8am) and delivered (by 12 – 2pm).
Figure 14 below provides a comparative view of the current value stream and future state value stream
highlighting the key changes needed in future. This involves introducing an order intake window between
7am and 8am to batch the orders (only for traditional customers – our target segment) for delivery in the
next 4 – 6 hours. This step requires near real-time order processing and route planning with fine tuning
of the existing systems. and minimal changes to resource planning to have personnel be available for final
loading and last-mile execution.
Figure 14:
As-is and To-be value streams in flexible distribution model.
The salient features of this future state value stream design are:
• Order intake window 7am – 8am on the same day of delivery
• Order intake cut-off at 8am, to allow for order batching and route planning for 4 – 6-hour delivery.
o This order batching stage can be extended for multiple order cut-off points and corresponding
delivery timing. For e.g., order intake cut-off at 10am can be delivered at 2 – 4pm same day and
order intake cut-off at 12noon can be delivered at 4 – 6pm, the same day.
o This order batching provides flexibility to not only expedite delivery but also the flexibility to
deliver when it is most convenient to customers.
Page 37
37
• For more than 80% of the deliveries to be made, the picking and loading is already completed as part
of the daily picking and loading process scheduled between 8pm (the previous day) and 4am.
o Picking and loading for the traditional orders is planned based on the intelligent forecasting and
predictive route planning models, built based on daily demand data for the past 3 years, from
each customer.
o The intelligent forecasting and predictive route planning steps in digital flow will also include
appropriate demand allocation across DCs and CPs that minimizes the last-mile delivery time.
o Also, as indicated earlier, BeverageCo’s current distribution process needs improvement on two
critical metrics – vehicle occupancy and vehicle utilization. These metrics average at around 75%
due to lack of visibility into availability of vehicles, heavy dependency on large truck-based
delivery and less leverage of multi-modal delivery options with third-party logistics providers.
o One of the key outcomes of this digital transformation is to not just bring in flexibility in
distribution for expedited delivery, but also to improve on some of the shortcomings in the
current distribution model thereby making this flexible distribution, a profitable execution model
at frugal investment.
o With this consideration, optimizing the digital flow will include seamless integration with third-
party logistics providers, better visibility into vehicle availability and efficient load planning, all
leading to higher vehicle utilization and vehicle occupancy.
The value stream map in Figure 15 depicts end-to-end order to delivery flow as designed for the future
state flexible distribution model. The key value proposition of this future state design is in not just reducing
the digital flow lead time from 11 hours to near real-time, but also in reducing the 20-hour product flow
lead time to 4 – 6 hours.
Page 38
38
Figure 15:
End-to-end Order to Delivery flow in flexible distribution model
With limited process change (resource planning required to get delivery personnel for last-mile delivery
at 8am), the adoption of this value stream design would mean, minimal organization change
management, process training and orientation needed for warehouse and delivery personnel, and most
importantly the short lead time required to implement this change.
3.4.5 Measuring ‘value’ behind flexibility
BeverageCo is convinced about the need for flexibility in distribution; however, the key challenge it has is
in measuring the ‘value’ to understand if it justifies the time and effort to drive the transformation. There
are three critical dimensions to measure ‘value’:
• the intangible benefits related to customer delight by exceeding service levels and delivering at the
time that is most convenient to customers.
• the monetary gains, a measure of ‘value’ exceeding the cost of implementation.
• the most critical is the ‘value beyond’ generated from reimagining the distribution model that could
create new business avenues for BeverageCo, by expanding its distribution capabilities beyond
beverage products and entre into new domains of other consumer goods, medical supplies, among
others and become the distributor of choice in the LATAM region.
Page 39
39
Table 8 articulates the key ‘value’ metrics addressing the dimensions mentioned above.
Table 8:
Metrics to measure ‘Value’
The interesting aspect to note in this value creation journey is the widespread coverage of customers
(with more than 90% customer base) benefitting with same-day or 4–6-hour delivery. This amplifies the
potential for value creation with increased volume of business within the current customer base or
through references to new customers.
Page 40
40
MCDM based Digital Transformation drivers’ prioritization.
With multiple digital and process capabilities available to realize the vision, it is important to identify
appropriate drivers that are best fit for purpose and can scale for more complex scenarios in future. This
challenge requires multi-dimensional criteria, and decision-making models that integrates the feasibility
and value assessment of each flexibility driver by the subject matter experts at BeverageCo along with the
limitations people, processes, and systems. In this regard, multi-criteria-decision-model (MCDM) is
implemented to identify the technical, process and organizational change levers that aligns with the digital
transformation drivers in realizing the vision.
MCDM leverages the future state value stream design and the simulation outcomes to define the
flexibility drivers that are relevant for the transformation. While performance outcomes measure is critical
in assessing the flexibility drivers, there are other dimensions such as technology (ease of implementation
and integration to current system), process change and organizational readiness that are critical in this
fitment assessment. MCDM is integrated with a prioritization framework - Technique for Order of
Preference by Similarity to Ideal Solution (TOPSIS), to help prioritize the flexibility drivers that are key to
this transformation.
Page 41
41
4 Results and Analysis
The future state value stream design and the prioritization of the digital drivers needed for digital
transformation involved outcomes from two critical components of analysis - simulation and multi-
criteria-decision-model (MCDM). This chapter details the input parameters for multiple scenarios, the
anlaysis, and the results from simulation and MCDM methods.
Simulation input parameters and scenarios
The need for simulation is to ensure that the expedited deliveries do not incur high costs of transportation
to make this entire pursuit of flexibility, financially unviable. For this simulation anlaysis a representative
region in Brazil was selected with exact DCs and CPs locations as in the current distribution network and
with 91 representative customer locations for delivery. Table 9 and 10 below illustrates the key input
parameters used in the simulation runs: and as well the specific future state scenarios considered.
Table 9:
Simulation Input parameters
Table 10:
Simulation Scenarios
Page 42
42
4.1.1 Simulation results
Based on the scenarios and input parameters illustrated above, multiple simulation runs were modeled,
and Table 11 reflects the summary of the 8-hour distribution for deliveries from only DCs, only CPs and
combination of DCs and CPs, clearly indicating that delivering only from CPs (due to proximity) or only
from DCs (due to scale) is not feasible as the number of routes and the net distance would need to increase
significantly to justify costs.
Table 11:
Simulation scenarios with 8-hour distribution
The key takeaway from this simulation run is, the as-is distribution model from DCs and CPs is critical for
flexible and expedited distribution. With this key consideration, the following additional scenarios were
constructed:
• Scenarios with different distribution lead times (8-hour, 6-hour, 4-hour, and 2-hour)
• Scenarios with improving vehicle occupancy and vehicle utilization – the performance metrics that is
on a low – moderate scale currently. The idea is to consider future scenarios of how predictive
analytics in route planning would positively impact these performance metrics and more importantly
if this digital driver would justify its leverage.
• Scenarios with the consideration that customers will be willing to pay a premium of 5% for expedited
or flexible delivery options.
Table 12 illustrates the simulation outcomes for each of these scenarios highlighting,
• 2-hour last-mile delivery is infeasible with the current network design (location of DCs & CPs).
• 4-hour last-mile delivery is feasible with the following considerations:
o Vehicle utilization and Vehicle occupancy must improve to 85% from its current ~75%
o Premium of 5-8% charged to customers for expedited delivery.
Page 43
43
Table 12:
Simulation scenarios and Output parameters
The key findings from the simulation outcomes that feeds into the future state value stream design are:
• same-day delivery model (6 – 8-hour) could be a provided for all traditional customers and this is
highly recommended as a starting point as this delivery model could generate significant cost savings
for BeverageCo and could potentially fund the larger transformation across all regions.
• though a 4-hour distribution is a feasible option, it is recommended that BeverageCo start with a 4-
hour delivery option only for its key traditional customers. This will help learn and optimize the model
further.
Page 44
44
Multi-criteria-decision-model (MCDM) – feasibility assessment & prioritization
With multiple digital and process capabilities available to realize the vision, it is important to identify
appropriate drivers that are best fit for purpose and can scale for more complex scenarios in future. In
this regard, multi-criteria-decision-model (MCDM) is implemented that integrates the feasibility and value
assessment of each flexibility driver by the subject matter experts at BeverageCo along with the
limitations people, processes, and systems. The implementation of MCDM involves the following steps:
1. Feasibility assessment for each of the drivers across technology, process, and organizational
change requirements for implementation
2. TOPSIS (Technique for Order Preference by Similarity to Ideal Solution) based flexibility driver
evaluation and prioritization.
4.2.1 Feasibility assessment – Technology, Process and Organizational change impact
While the significance level and the performance outcomes of each driver is key for this transformation,
it is also important to drive decisions based on the feasibility of each driver across other dimensions, such
as technology (ease of implementation and integration to current system), process change, and
organizational readiness (Beyaz and Yıldırim, 2020).
MCDM integrates these aspects along with the performance outcomes to assess the fitment and the
prioritization of each of the flexibility drivers. Table 13 summarizes the technology feasibility scores from
BeverageCo, for each of the flexibility drivers based on its efficiency gains (expected lead time reduction),
implementation feasibility (ease of implementation) and financial feasibility (cost of implementation).
Page 45
45
Table 13:
MCDM – Technology feasibility analysis
It is important to note that this assessment was done not only keeping flexibility drivers in mind but also
the action items required to effect the changes in the future. A similar analysis was done to assess the
process change feasibility and organizational change feasibility for each of the drivers, its degree of impact
on the current processes, the ease of implementation and the impact to the personnel in adapting to this
change. The complete step by step analysis and outcomes are detailed in Appendix A. The scoring from
each step of feasibility (technological, process and organizational) for each flexibility driver is added up to
reach a cumulative value that is used in the multi-criteria decision-making model. Table 14 reflects the
normalized scores from feasibility analysis highlighting the importance of technology factor in evaluating
the flexibility drivers, considering the ease of implementation and ease of integration with the existing
systems.
Table 14:
MCDM – Feasibility analysis - normalized values
Efficiency gains
( lead time
Feasibility Score
(Easy to
Financial
feasibility
Order batchingModifying SAP Order processing to new cut-
off times (for Traditional customers)9 1 3
Improving Perfect OrdersIntelligent Order management for touchless
order processing8 5 5
Predictive Route Planning &
Optimization
Implementing intelligent (AI/ML) Route
Planning & Optimization tool9 2 3
Dynamic Demand AllocationImplementing dynamic demand allocation
to balance DCs and CPs9 3 3
3rd party integration for multi-
modal last mileVehicle tracking and 3rd party integration 8 9 8
Network Redesign Detailed study and Network design 9 4 3
RoadNet upgrade / replacement Currently in progress
End-to-end distribution visibilityReal-time integration of all distribution
systems9 8 3
Expanding to new CPs or
conversion of CPs to DCs
Integration of Order management, Route
planning and Picklist generation for each CP6 5 4
CP digitalization for independent
operations
Integration of Order management, Route
planning and Picklist generation for each CP6 5 4
Robots for Automated picking Intelligent Robots for automated picking 8 3 2
81 45 38
Flexibility DriversTechnology Change
Action items
Feasibility Dimension
Efficiency gains
(expected lead time)
Feasibility Score
(Easy to
implement)
Financial feasibility
(Cost to
implement)
Total Significance
Value
Normalized
values
Technology 81 45 38 164 0.409
Process 63 26 27 116 0.289
Organizational 66 24 31 121 0.302
210 95 96 401 1
Page 46
46
4.2.2 TOPSIS decision matrix for Multi-dimensional evaluation
MCDM is often integrated with a prioritization framework -- Technique for Order of Preference by
Similarity to Ideal Solution (TOPSIS) -- that will help determine the final set of flexibility drivers that are
key to this transformation. TOPSIS framework works on the principle of prioritizing the alternatives that
are close to ideal solution. This framework is typically used along with MCDM to assess the fitment of
multiple solution options qualitatively and quantitatively (Beyaz and Yildirim, 2020).
Based on the feasibility scores, their weights, and significance level scores, TOPSIS decision matrix is built
for each flexibility driver, against each feasibility dimension. Table 15 reflects the normalized values for
each driver against the technology, process, and organizational dimensions, highlighting third party
integration for multi-modal last-mile, end-to-end distribution visibility and Order batching as the top three
flexibility drivers. The complete step by step process followed in arriving at the TOPSIS decision matrix to
prioritize the flexibility drivers is provided in Appendix B.
Table 15:
TOPSIS decision matrix with normalized values
Based on the weighted normalized decision matrix Positive (+) Ideal matrix (maximum values in each
dimension) and Negative (−) Ideal matrix (minimum values in each dimension) are built. Finally, to arrive
at the optimal solution set, a Euclidian distance approach is used to calculate the difference of each
decision variable (flexibility driver) from positive ideal and negative ideal solution set.
Feasibility Weights 0.409 0.289 0.302
Action items Tehchnology Processs Organziational
Order batching Selection of customers where 'flexibility' matters 0.27 0.46 0.45
Improving Perfect Orders Customer alignment for joint flexibility initiative 0.31 0.30 0.30
Predictive Route Planning & Optimization
Dedicated routes for Traditional for expedited
delivery 0.31 0.19 0.09
Dynamic Demand Allocation
Impact from dedicating certain CPs for Traditional
customers 0.28 0.14 0.35
3rd party integration for multi-modal last
mile
Ability to increase staff at CPs for through-the-day
pick-pack & deliver 0.51 0.35 0.38
Network Redesign Managing overall change for Deep Transformation 0.30 0.30 0.35
RoadNet upgrade / replacement Adapting to new technology changes 0.00 0.06 0.23
End-to-end distribution visibility
Ability to increase staff at CPs to align to new
picking & delivery windows 0.39 0.46 0.36
Expanding to new CPs or conversion of
CPs to DCs
Expand CPs for storage to avoid daily drops from
DCs (and making it weekly) 0.23 0.29 0.20
CP digitalization for independent
operations
Training and enablement of resources for
independent function 0.23 0.24 0.20
Robots for Automated picking
Realign resource planning to accommodate robot
picking 0.20 0.27 0.22
Flexibility Drivers
Page 47
47
Table 16 reflects the final outcome of the TOPSIS multicriteria decision making model, the ‘Relative
Closeness’ to ideal solution for each digital driver.
Table 16:
TOPSIS – Final ranking of flexibility drivers
The key takeaway from the multi-criteria-decision-model is that the digital capabilities have scored well
not just in terms of significance, the ‘value’ they could deliver, but also considering the technology,
process change and organizational change feasibility analysis. These are ‘low hanging fruits’ with
tremendous value potential that BeverageCo should leverage as a step forward in their digital
transformation journey.
Flexibility Drivers Action items Score Ranking3rd party integration for multi-modal
last mile
Ability to increase staff at CPs for through-the-day
pick-pack & deliver 0.87 1
End-to-end distribution visibility
Ability to increase staff at CPs to align to new
picking & delivery windows 0.80 2
Order batching Selection of customers where 'flexibility' matters 0.67 3
Network Redesign Managing overall change for Deep Transformation 0.62 4
Improving Perfect Orders Customer alignment for joint flexibility initiative 0.61 5
Dynamic Demand Allocation
Impact from dedicating certain CPs for Traditional
customers 0.51 6
Predictive Route Planning &
Optimization
Dedicated routes for Traditional for expedited
delivery 0.45 7
Expanding to new CPs or conversion of
CPs to DCs
Expand CPs for storage to avoid daily drops from
DCs (and making it weekly) 0.45 8
CP digitalization for independent
operations
Training and enablement of resources for
independent function 0.42 9
Robots for Automated picking
Realign resource planning to accommodate robot
picking 0.41 10
RoadNet upgrade / replacement Adapting to new technology changes 0.14 11
Page 48
48
5 Managerial Insights and Recommendations
BeverageCo’s vision is to become the best-in-class provider to its customers, and flexibility in distribution
is critical to achieving that. Especially with more than 90% of the customers from traditional retail format
(with a small footprint and large concentration in urban areas), flexible last-mile distribution becomes a
critical differentiator. This project aimed at designing a future state value stream that would enable a
same-day or a 4-hour distribution model and back this design with simulation based anlaysis. This project
also aimed at identifying the key flexibility drivers that will help in this transformation, prioritizing them
based on its value and feasibility.
Summary of the key project outcomes
BeverageCo currently serves more than 55,000 clients every day with an order to delivery lead time of 31
hours. The project’s purpose is to design a future state value stream (distribution model) that would
enable BeverageCo to deliver the same day for all customers and within 4 hours for key customers. This
project not only met this objective, but also demonstrated that BeverageCo could reduce the cost of
operations by more than 50%, by transitioning to an 8-hour distribution model with improved vehicle
utilization and occupancy (with new digital capabilities). This project also showed that a 4 to 6-hour
distribution is feasible for all customers (without increasing the cost of operations) with the following
considerations:
o Improved vehicle utilization and vehicle occupancy (to 85% from its current ~75%) leveraging
new digital capabilities like predictive analytics and enhanced visibility.
o Premium of 5-8% charged to customers for expedited delivery.
The future state value stream design built for the proposed distribution model shows that these results
can be achieved with no changes to the current network and minimal changes to the current processes
and people deployed at distribution centers and consolidation points.
What it takes to transform to the future state?
BeverageCo’s current value stream reflects a digital flow lead time of 11 hours and physical flow lead time
of 20 hours, a total distribution lead time of 31 hours. To reduce the 31-hour lead time to an 8 hour (same-
day delivery) or 4-hour distribution, it would typically take significant transformation effort. Nevertheless,
this project demonstrated that with key digital capabilities and product flow changes, this transformation
Page 49
49
could be achieved with minimal impact to the current operations. The key digital capabilities needed to
realize the value proposition of the future state value stream design are, i) order batching (on the day of
delivery with multiple cut-off points), ii) intelligent forecasting, iii) predictive route planning and iv)
dynamic demand allocation (between DCs and CPs), the previous day, to leverage the current product
flow to CPs, to overcome its capacity limitations. Also, to improve the performance metrics (vehicle
occupancy and vehicle utilization), this project recommends implementing end-to-end visibility and
predictive analytics capabilities. These capabilities will not only improve the performance outcomes but
also reduce the cost of operations significantly (as demonstrated by the simulation outcomes). Finally, to
optimize the last-mile delivery it is important to have integration with third-party logistics providers,
specifically with multi-modal capabilities, that are critical in the urban last-mile logistics.
What is the ‘value’ behind flexibility?
BeverageCo’s vision is to become the best-in-class distributor by continuously exceeding service levels
and customer satisfaction. Realizing this vision means, ability to measure value behind flexibility to justify
the time and effort required for this transformation. The outcomes of this project clearly articulate the
value to be realized from this transformation and below is the summary view:
• First, the intangible benefits related to customer delight derived from flexible delivery (same-day or
4 to 6-hour delivery) when it is most convenient to customers.
• Second, the monetary gains, from reduced cost of operations (in 8-hour distribution model) and
additional revenues potential from increased volume of business and new client references
• Third and the most critical is the ‘value beyond’ potential from reimagining the distribution model
that could create new business avenues for BeverageCo, by expanding its distribution capabilities
beyond beverage products and enter into new domains of other consumer goods, medical supplies,
among others and become the ‘distributor of choice’ in the LATAM region.
Roadmap for future - Implementation recommendations
Digital transformation mandates an integrated approach as it involves IT, business and even customers to
align with the new ways of working. While there is tremendous value to realize from Digital
transformation, the path to digitalization, must be integrated (across functions), holistic (across all
stakeholders) and strategic (with a long-term vision). With this consideration, the following
implementation recommendations are provided for BeverageCo:
Page 50
50
• Organizational change management committee to govern, monitor progress and resolve issues.
• Prioritization of key traditional customers that needs flexible distribution.
• Customer alignment for order intake cutoff points and delivery window alignment
• Digital COE to drive smart digitalization and integration with existing systems.
• Process change design at the DCs and CPs to adapt to the new flexible distribution model.
• Process harmonization to streamline processes for traditional vis-à-vis other customers.
• Establishing partnerships with 3rd party logistics providers for multi-modal delivery options
• Identifying a pilot region for initial launch.
• Deployment across Brazil based on the learnings and template from the pilot region.
Figure 16 below illustrates the implementation roadmap for BeverageCo, highlighting the importance of
a pilot and scale approach rather than a big bang approach.
Figure 16:
Roadmap for future – Implementation recommendations
Page 51
51
6 CONCLUSION
BeverageCo is a world-class distributor of beverage products serving across 10 countries in the LATAM
region. BeverageCo’s obsession with customer satisfaction and its continuous pursuit of excellence in
customers service created the need for flexibility in distribution. This flexibility means transforming from
a 31-hour distribution model to an 8-hour (same-day delivery) or a 4 to 6-hour delivery model, which is
apparently a large transformation initiative. With more than 90% of the customers served from traditional
retail channel format (with small store footprint, spread across dense urban cities), there is an added
complexity in the last-mile distribution. This project demonstrated digital transformation as the core
driver of flexibility in delivering ‘value’ for organizations like BeverageCo, with minimal changes to the
current systems and processes. While meeting the objective of designing a flexible distribution model, the
project also showed that the 8-hour distribution could drive down costs of operations while elevating
customer experience.
Typically, transformations to enable flexible distribution involves significant changes to network design
and investments in fixed assets. However, based on the outcomes from the project, it is highly
recommended that BeverageCo pilot with digitalization as the priority to drive this transformation. There
are multiple reasons for this recommendations: first, significantly reducing the cost and time involved in
driving a large transformation initiative; second, ability to pilot, fail-fast and learn quickly from the
experiences without making large scale network changes; third, the ability to customize and fine tune the
distribution model for different customer segments to achieve best results; fourth, the minimal impact to
the current processes and people involved in the distribution and lastly, the ‘value’ to cost ratio – ability
to create new value and set the foundation for new business opportunities as a distribution leader in the
LATAM region at a frugal investment for building the digital drivers.
Future research opportunities
While this project met the core objective of designing the future state value stream for flexible distribution
there are a few more areas that BeverageCo showed deep interest in exploring. First, evaluating a direct-
to-consumer (D2C) distribution model and its impact to the current operations, considering the large
consumer base and small order sizes. The D2C business model is fast growing with a lot of FMCG
companies aspiring to serve the end-consumers directly. This provides an opportunity for the FMCG
companies to understand the consumer tastes and preferences and improve the product design or launch
new products based on consumer expectations. Second, a deeper anlaysis of the current network design
Page 52
52
to understand opportunities for redesign and as well to explore avenues for implementing dark stores,
mini-fulfillment centers, and other flexible points of distribution at proximity to customers. Though this
would require a lot of investments in fixed assets, BeverageCo would like to understand the merit in
leveraging some of these options in anticipation of future demand and growth potential. Third, the mode
of transportation for last mile, leveraging a wider network of third-party vehicles, specifically smaller
electric vans or similar and understand that impact it would have on the time of delivery and cost of
operations. Lastly and most importantly the sustainability dimension of last-mile distribution. The growing
government regulations and consumer attention towards sustainable logistics is changing the way
network and distribution models are designed. This is a critical area of research not only for BeverageCo
but also for flexible last-mile distribution models in general as the quality of decisions made at the start
of the transformation with sustainability factor in mind will have a profound impact on the environment
and BeverageCo’s value system.
This project delivered a future state value stream design, provided a roadmap for future, recommending
the implementation approach to drive this transformation. While there is tremendous value to realize
from digital transformation, the path to digitalization must be strategic with a long-term vision and
integrated, binding all the stakeholders into a common unified vision. Specifically, a fail-fast and learn-
quick approach with the spirit of continuous innovation and value creation is key to a seamless digital
transformation journey.
Page 53
53
REFERENCES
Maria Jesus Saenz (2020). How the Pandemic Could Remake Supply Chain’s Digital Future.
Business News.
http://www.supplychain247.com/article/how_the_pandemic_could_remake_supply_chains_dig
ital_future
How we use real-time data analytics to manage complex supply chains (2018). Flex.com.
https://flex.com/resources/how-we-use-real-time-data-analytics-to-manage-complex-supply-
chains
Jeanne Ross (2017). Don’t Confuse Digital with Digitization. MIT Sloan Management Review.
https://sloanreview.mit.edu/article/dont-confuse-digital-with-digitization/
Hoskisson, R.E., Eden, L., Lau, C.M., Wright, M. (2000). Strategy in emerging economies. Acad. Manage.
J. 43 (3), 249–267.
Fransoo, J., Blanco, E., Mejia-Argueta, C. (2017). Reaching 50 million nanostores: Retail distribution in
emerging megacities. CreateSpace Independent Publishing Platform.
Matthias Winkenbach, André Snoeck (2020). The value of physical distribution flexibility in serving dense
and uncertain urban markets.
Food & Beverages Outlook, South America. (2021). Statista.
https://www.statista.com/outlook/dmo/ecommerce/food-personal-care/food-
beverages/south-america.
Tanguy Catlin, Jay Scanlan, and Paul Willmott (2015). Raising your Digital Quotient. McKinsey Quarterly.
https://www.mckinsey.com/business-functions/strategy-and-corporate-finance/our-
insights/raising-your-digital-quotient
Andrew McAfee, Didier Bonnet, and George Westerman (2020). Leading Digital: Turning Technology Into
Business Transformation.
Page 54
54
Karen Martin and Mike Osterling (2014). Value stream mapping : how to visualize work and align
leadership for organizational transformation.
Gülgün Kayakutlu, Şule Itır Şatoğlu, Bülent Durmuşoğlu (2004). Waste detection and optimization by
applying Bayesian causal map technique and value stream maps.
Qingqi Liu and Hualong Yang (2020). An Improved Value Stream Mapping to Prioritize Lean Optimization
Scenarios Using Simulation and Multiple-Attribute Decision-Making Method
Emad Alzubi, Anas M. Atieh, Khaleel Abu Shgair, John Damiani, Sima Sunna and Abdallah Madi (2019).
Hybrid Integrations of Value Stream Mapping, Theory of Constraints and Simulation.
Dmitry Ivanov. (2019). Decision-oriented teaching notes for model-based management decision making.
Supply Chain Simulation and Optimization with anyLogistix.
Hüseyin Furkan Beyaz and Nihan Yıldırım. (2020). A Multi-criteria Decision-Making Model for Digital
Transformation in Manufacturing
Emanuele Pagone, Konstantinos Salonitis and Mark Jolly. (2020). Automatically weighted high-resolution
mapping of multi-criteria decision analysis for sustainable manufacturing systems.
BeverageCo meetings and supply chain initiatives documents. (2021).
Page 55
55
Appendix A. Multi-criteria-decision-model (MCDM) – feasibility assessment & prioritization
This appendix provides the complete step by step view of the MCDM scoring and feasibility assessment.
Flexibility drivers are new digital and process capabilities that are key to this transformation and hence it
is important to understand the value each flexibility driver could bring to the entire distribution value
stream. Table 17 below depicts the mapping of each flexibility driver against each life-cycle stage of the
complete distribution process and the scoring (significance level) provided by BeverageCo SMEs. The main
idea behind this mapping and scoring is to understand how BeverageCo SMEs weigh the transformation
drivers considering their process and systems limitations. This is a critical input for the future state value
stream design as it integrates the drivers with highest value mapping to optimize the information and
product flow.
Table 17:
Flexibility drivers – mapping and scoring
While the significance level and the performance outcomes of each driver is key for this transformation,
it is also important to drive decisions based on the feasibility of each driver across other dimensions, such
as technology (ease of implementation and integration to current system), process change, and
organizational readiness, which are critical in this fitment assessment (Beyaz and Yıldırim, 2020).
MCDM integrates these aspects along with the performance outcomes to assess the fitment and the
prioritization of each of the flexibility drivers. Table 18 summarizes the technology feasibility scores from
BeverageCo, for each of the flexibility drivers based on its efficiency gains (expected lead time reduction),
implementation feasibility (ease of implementation) and financial feasibility (cost of implementation).
Page 56
56
Table 18:
MCDM – Technology feasibility analysis
A similar analysis was done to assess the process change feasibility and organizational change feasibility
for each of the drivers. Tables 19 and 20 below depicts the degree of impact on the current processes, the
ease of implementation and the impact to the personnel in adapting to this change based on the rating
provided by BeverageCo for both these dimensions (process and organization change):
Efficiency gains
( lead time
Feasibility Score
(Easy to
Financial
feasibility
Order batchingModifying SAP Order processing to new cut-
off times (for Traditional customers)9 1 3
Improving Perfect OrdersIntelligent Order management for touchless
order processing8 5 5
Predictive Route Planning &
Optimization
Implementing intelligent (AI/ML) Route
Planning & Optimization tool9 2 3
Dynamic Demand AllocationImplementing dynamic demand allocation
to balance DCs and CPs9 3 3
3rd party integration for multi-
modal last mileVehicle tracking and 3rd party integration 8 9 8
Network Redesign Detailed study and Network design 9 4 3
RoadNet upgrade / replacement Currently in progress
End-to-end distribution visibilityReal-time integration of all distribution
systems9 8 3
Expanding to new CPs or
conversion of CPs to DCs
Integration of Order management, Route
planning and Picklist generation for each CP6 5 4
CP digitalization for independent
operations
Integration of Order management, Route
planning and Picklist generation for each CP6 5 4
Robots for Automated picking Intelligent Robots for automated picking 8 3 2
81 45 38
Flexibility DriversTechnology Change
Action items
Page 57
57
Table 19:
MCDM – Process change feasibility analysis.
Table 20:
MCDM – Organizational change feasibility analysis
Efficiency gains
( lead time
reduction)
Feasibility Score
(Ease of
implementation)
Financial
feasibility
(Cost of
implementation)
Order batchingModifying SAP Order processing to new cut-
off times (for Traditional customers)10 2 3
Improving Perfect OrdersIntelligent Order management for touchless
order processing8 1 3
Predictive Route Planning &
Optimization
Implementing intelligent (AI/ML) Route
Planning & Optimization tool2 2 2
Dynamic Demand AllocationImplementing dynamic demand allocation
to balance DCs and CPs1 2 2
3rd party integration for multi-
modal last mileVehicle tracking and 3rd party integration 5 4 3
Network Redesign Detailed study and Network design 8 2 1
RoadNet upgrade / replacement Currently in progress 1 1 1
End-to-end distribution visibilityReal-time integration of all distribution
systems9 3 4
Expanding to new CPs or
conversion of CPs to DCs
Integration of Order management, Route
planning and Picklist generation for each CP7 3 3
CP digitalization for independent
operations
Integration of Order management, Route
planning and Picklist generation for each CP4 4 3
Robots for Automated picking Intelligent Robots for automated picking 8 2 2
63 26 27
Flexibility Drivers Action Items
Process Change
Efficiency gains
( lead time
reduction)
Feasibility Score
(Ease of
implementation)
Financial feasibility
(Cost of
implementation)
Order batchingModifying SAP Order processing to new cut-
off times (for Traditional customers)10 2 3
Improving Perfect OrdersIntelligent Order management for touchless
order processing8 1 3
Predictive Route Planning &
Optimization
Implementing intelligent (AI/ML) Route
Planning & Optimization tool1 1 1
Dynamic Demand AllocationImplementing dynamic demand allocation
to balance DCs and CPs7 3 3
3rd party integration for multi-
modal last mileVehicle tracking and 3rd party integration 7 3 3
Network Redesign Detailed study and Network design 7 3 3
RoadNet upgrade / replacement Currently in progress 7 1 3
End-to-end distribution visibilityReal-time integration of all distribution
systems7 3 3
Expanding to new CPs or
conversion of CPs to DCs
Integration of Order management, Route
planning and Picklist generation for each CP5 2 2
CP digitalization for independent
operations
Integration of Order management, Route
planning and Picklist generation for each CP4 5
Robots for Automated picking Intelligent Robots for automated picking 7 1 2
66 24 31
Flexibility Drivers Action items
Organizational Change
Page 58
58
The scoring from each step of feasibility (technological, process and organizational) for each flexibility
driver is added up to reach a cumulative value that will be used in the multi-criteria decision-making
model. Table 21 reflects the normalized scores from feasibility analysis highlighting the importance of
technology factor in evaluating the flexibility drivers, considering the ease of implementation and ease of
integration with the existing systems.
Table 21:
MCDM – Feasibility analysis - normalized values
Feasibility Dimension
Efficiency gains
(expected lead time)
Feasibility Score
(Easy to
implement)
Financial feasibility
(Cost to
implement)
Total Significance
Value
Normalized
values
Technology 81 45 38 164 0.409
Process 63 26 27 116 0.289
Organizational 66 24 31 121 0.302
210 95 96 401 1
Page 59
59
Appendix B. TOPSIS decision matrix for identifying the optimum solution drivers.
This appendix provides the complete step by step process followed in arriving at the TOPSIS decision
matrix to prioritize the flexibility drivers.
MCDM is often integrated with a prioritization framework -- Technique for Order of Preference by
Similarity to Ideal Solution (TOPSIS) -- that will help determine the final set of flexibility drivers that are
key to this transformation. TOPSIS framework works on the principle of prioritizing the alternatives that
are close to ideal solution. This framework is typically used along with MCDM to assess the fitment of
multiple solution options qualitatively and quantitatively (Beyaz and Yildirim, 2020). Table 22 below
depicts the TOPSIS decision matrix built based on square root of the sum of squared value of each
flexibility driver against each feasibility dimension (technology, process and organization).
Table 22:
TOPSIS decision matrix for multi-dimensional evaluation
As a next step, a new decision matrix is built by normalizing the scores from Table 22 above by using the
following formula:
Feasibility Weights 0.409 0.289 0.302 Significance level
Action items Tehchnology Processs Organziational (Avg Score)
Order batching Selection of customers where 'flexibility' matters 126 145 145 9.7
Improving Perfect Orders Customer alignment for joint flexibility initiative 144 96 96 8.0
Predictive Route Planning &
Optimization
Dedicated routes for Traditional for expedited
delivery 140 60 30 10.0
Dynamic Demand Allocation
Impact from dedicating certain CPs for Traditional
customers 130 43 113 8.7
3rd party integration for multi-modal
last mile
Ability to increase staff at CPs for through-the-day
pick-pack & deliver 233 112 121 9.3
Network Redesign Managing overall change for Deep Transformation 139 95 113 8.7
RoadNet upgrade / replacement Adapting to new technology changes 0 20 73 6.7
End-to-end distribution visibility
Ability to increase staff at CPs to align to new
picking & delivery windows 180 144 117 9.0
Expanding to new CPs or conversion of
CPs to DCs
Expand CPs for storage to avoid daily drops from
DCs (and making it weekly) 105 91 63 7.0
CP digitalization for independent
operations
Training and enablement of resources for
independent function 105 77 63 7.0
Robots for Automated picking
Realign resource planning to accommodate robot
picking 91 84 70 7.0
Sum of squares 209432 99753 103155
Root of Sum of squares 457.6 315.8 321.2
Flexibility Drivers
Page 60
60
Table 23 reflects the normalized values for each driver against the technology, process, and organizational
dimensions, highlighting third party integration for multi-modal last-mile, end-to-end distribution visibility
and Order batching as the top three flexibility drivers.
Table 23:
TOPSIS decision matrix with normalized values (rij matrix)
A weighted normalized decision matrix is built by multiplying each dimension (column) of the ‘rij’ matrix
(table-23 above), with its corresponding weights, ‘wj’. Table 24 below is the outcome of Positive (+) Ideal
values (maximum values in each dimension) and Negative (−) Ideal values (minimum values in each
dimension) are calculated by the below formula:
Feasibility Weights 0.409 0.289 0.302
Action items Tehchnology Processs Organziational
Order batching Selection of customers where 'flexibility' matters 0.27 0.46 0.45
Improving Perfect Orders Customer alignment for joint flexibility initiative 0.31 0.30 0.30
Predictive Route Planning &
Optimization
Dedicated routes for Traditional for expedited
delivery 0.31 0.19 0.09
Dynamic Demand Allocation
Impact from dedicating certain CPs for Traditional
customers 0.28 0.14 0.35
3rd party integration for multi-modal
last mile
Ability to increase staff at CPs for through-the-day
pick-pack & deliver 0.51 0.35 0.38
Network Redesign Managing overall change for Deep Transformation 0.30 0.30 0.35
RoadNet upgrade / replacement Adapting to new technology changes 0.00 0.06 0.23
End-to-end distribution visibility
Ability to increase staff at CPs to align to new
picking & delivery windows 0.39 0.46 0.36
Expanding to new CPs or conversion of
CPs to DCs
Expand CPs for storage to avoid daily drops from
DCs (and making it weekly) 0.23 0.29 0.20
CP digitalization for independent
operations
Training and enablement of resources for
independent function 0.23 0.24 0.20
Robots for Automated picking
Realign resource planning to accommodate robot
picking 0.20 0.27 0.22
Flexibility Drivers
Page 61
61
Table 24:
TOPSIS decision matrix of positive & negative ideal values.
For finding the optimal solution set, a Euclidian distance approach is used to calculate the difference of
each decision variable (flexibility driver) from positive ideal and negative ideal solution set. Tables 25 and
26 show the differences from the decision points referred as Positive Ideal Separation (+) and Negative
Ideal Separation (−) measures, calculated by the formulae given below.
Feasibility Weights 0.409 0.289 0.302
Action items Tehchnology Processs Organziational
Order batching Selection of customers where 'flexibility' matters 0.11 0.13 0.14
Improving Perfect Orders Customer alignment for joint flexibility initiative 0.13 0.09 0.09
Predictive Route Planning &
Optimization
Dedicated routes for Traditional for expedited
delivery 0.13 0.05 0.03
Dynamic Demand Allocation
Impact from dedicating certain CPs for Traditional
customers 0.12 0.04 0.11
3rd party integration for multi-modal
last mile
Ability to increase staff at CPs for through-the-day
pick-pack & deliver 0.21 0.10 0.11
Network Redesign Managing overall change for Deep Transformation 0.12 0.09 0.11
RoadNet upgrade / replacement Adapting to new technology changes 0.00 0.02 0.07
End-to-end distribution visibility
Ability to increase staff at CPs to align to new
picking & delivery windows 0.16 0.13 0.11
Expanding to new CPs or conversion of
CPs to DCs
Expand CPs for storage to avoid daily drops from
DCs (and making it weekly) 0.09 0.08 0.06
CP digitalization for independent
operations
Training and enablement of resources for
independent function 0.09 0.07 0.06
Robots for Automated picking
Realign resource planning to accommodate robot
picking 0.08 0.08 0.07
Positive Ideal + 0.21 0.13 0.14
Negative Ideal - 0.00 0.02 0.03
Flexibility Drivers
Page 62
62
Table 25:
TOPSIS – Positive Ideal Matrix
Table 26:
TOPSIS – Negative Ideal Matrix
Postive Ideal MatrixPositive Ideal * 0.209 0.133 0.136
Action items Tehchnology Processs Organziational
Order batching Selection of customers where 'flexibility' matters 0.01 0.00 0.00 0.01 0.096
Improving Perfect Orders Customer alignment for joint flexibility initiative 0.01 0.00 0.00 0.01 0.103
Predictive Route Planning &
Optimization
Dedicated routes for Traditional for expedited
delivery 0.01 0.01 0.01 0.02 0.157
Dynamic Demand Allocation
Impact from dedicating certain CPs for Traditional
customers 0.01 0.01 0.00 0.02 0.135
3rd party integration for multi-modal
last mile
Ability to increase staff at CPs for through-the-day
pick-pack & deliver 0.00 0.00 0.00 0.00 0.038
Network Redesign Managing overall change for Deep Transformation 0.01 0.00 0.00 0.01 0.101
RoadNet upgrade / replacement Adapting to new technology changes 0.04 0.01 0.00 0.06 0.247
End-to-end distribution visibility
Ability to increase staff at CPs to align to new
picking & delivery windows 0.00 0.00 0.00 0.00 0.054
Expanding to new CPs or conversion of
CPs to DCs
Expand CPs for storage to avoid daily drops from
DCs (and making it weekly) 0.01 0.00 0.01 0.02 0.147
CP digitalization for independent
operations
Training and enablement of resources for
independent function 0.01 0.00 0.01 0.02 0.152
Robots for Automated picking
Realign resource planning to accommodate robot
picking 0.02 0.00 0.00 0.02 0.156
SumRoot of Sum
S*Flexibility Drivers
Negative Ideal MatrixNegative Ideal - 0.000 0.018 0.028
Action items Tehchnology Processs Organziational
Order batching Selection of customers where 'flexibility' matters 0.01 0.01 0.01 0.04 0.193
Improving Perfect Orders Customer alignment for joint flexibility initiative 0.02 0.00 0.00 0.03 0.159
Predictive Route Planning &
Optimization
Dedicated routes for Traditional for expedited
delivery 0.02 0.00 0.00 0.02 0.130
Dynamic Demand Allocation
Impact from dedicating certain CPs for Traditional
customers 0.01 0.00 0.01 0.02 0.141
3rd party integration for multi-modal
last mile
Ability to increase staff at CPs for through-the-day
pick-pack & deliver 0.04 0.01 0.01 0.06 0.241
Network Redesign Managing overall change for Deep Transformation 0.02 0.00 0.01 0.03 0.162
RoadNet upgrade / replacement Adapting to new technology changes 0.00 0.00 0.00 0.00 0.041
End-to-end distribution visibility
Ability to increase staff at CPs to align to new
picking & delivery windows 0.03 0.01 0.01 0.05 0.213
Expanding to new CPs or conversion of
CPs to DCs
Expand CPs for storage to avoid daily drops from
DCs (and making it weekly) 0.01 0.00 0.00 0.01 0.118
CP digitalization for independent
operations
Training and enablement of resources for
independent function 0.01 0.00 0.00 0.01 0.112
Robots for Automated picking
Realign resource planning to accommodate robot
picking 0.01 0.00 0.00 0.01 0.107
SumRoot of Sum
S-Flexibility Drivers
Page 63
63
Table 27 reflects the final outcome of the TOPSIS multicriteria decision making model, the ‘Relative
Closeness’ to ideal solution for each digital driver, applied based on the below formula.
Table 27:
TOPSIS – Final ranking of digital drivers
The key takeaway from the multi-criteria-decision-model is that the digital capabilities have scored well
not just in terms of significance, the ‘value’ they could deliver, but also considering the technology,
process change and organizational change feasibility analysis.
Flexibility Drivers Action items Score Ranking3rd party integration for multi-modal
last mile
Ability to increase staff at CPs for through-the-day
pick-pack & deliver 0.87 1
End-to-end distribution visibility
Ability to increase staff at CPs to align to new
picking & delivery windows 0.80 2
Order batching Selection of customers where 'flexibility' matters 0.67 3
Network Redesign Managing overall change for Deep Transformation 0.62 4
Improving Perfect Orders Customer alignment for joint flexibility initiative 0.61 5
Dynamic Demand Allocation
Impact from dedicating certain CPs for Traditional
customers 0.51 6
Predictive Route Planning &
Optimization
Dedicated routes for Traditional for expedited
delivery 0.45 7
Expanding to new CPs or conversion of
CPs to DCs
Expand CPs for storage to avoid daily drops from
DCs (and making it weekly) 0.45 8
CP digitalization for independent
operations
Training and enablement of resources for
independent function 0.42 9
Robots for Automated picking
Realign resource planning to accommodate robot
picking 0.41 10
RoadNet upgrade / replacement Adapting to new technology changes 0.14 11