46
Attribution Modeling in a multi-device environment Digital Travel Summit Las Vegas, March 24, 2015
| Date post: | 30-Jul-2015 |
| Category: |
Documents |
| Upload: | jonathan-isernhagen |
| View: | 75 times |
| Download: | 0 times |

Attribution Modelingin a multi-device environment
Digital Travel SummitLas Vegas, March 24, 2015

2014 Budget Review
Presentation agenda
1) The importance of cross-device tracking2) Our mission as marketers3) ROI components
a) Spendb) Variable contribution
4) Algorithmic attributiona) DIYb) Evaluating vendors
5) Take-aways
[email protected] @jon_isernhagen
2014 Budget Review
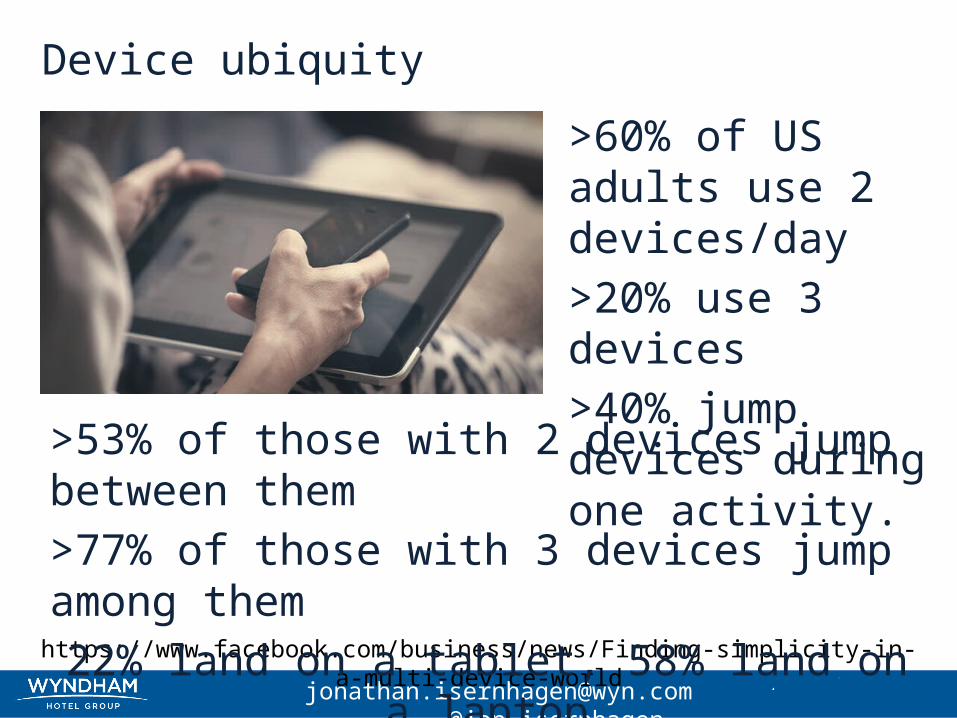
Device ubiquity
>60% of US adults use 2 devices/day>20% use 3 devices>40% jump devices during one activity.
[email protected] @jon_isernhagen
https://www.facebook.com/business/news/Finding-simplicity-in-a-multi-device-world
>53% of those with 2 devices jump between them>77% of those with 3 devices jump among them
22% land on a tablet, 58% land on a laptop

2014 Budget Review
Cross-device tracking (the importance of)
Definition: “…the myriad ways platforms, publishers and ad tech companies try to identify Internet users across smartphones, tablets and desktop computers.”
Important because: 1) Gives visibility to devices’ roles in purchase path2) “retargeting on mobile is impossible without it.”3) Algorithmic attribution is inaccurate “ “ “ “
[email protected] @jon_isernhagen
John McDermott, http://digiday.com/platforms/wtf-cross-device-tracking/

2014 Budget Review
Presentation agenda
1) The importance of cross-device tracking2) Our mission as marketers3) ROI components
a) Spendb) Variable contribution
4) Algorithmic attributiona) DIYb) Evaluating vendors
5) Take-aways
[email protected] @jon_isernhagen

2014 Budget Review
CEO’s/our duty to the (publicly-traded) company
• Brand awareness / sentiment?
• Client loyalty?• Employee satisfaction?• Traffic to the site?• Shopper movement
down the funnel?
• Transaction volumes?• Shareholder value?• Customer focus /
personalization?• Community
involvement through charitable actions?
[email protected] @jon_isernhagen
Maximize which one of the following metrics….

2014 Budget Review
Example: Apple, Inc.
“Apple's Board of Directors oversees the Chief Executive Officer and other senior management in the competent and ethical operation of Apple on a day-to-day basis and assures that the long-term interests of shareholders are being served.
Source: http://investor.apple.com/governance.cfm
[email protected] @jon_isernhagen

2014 Budget Review
Increase spending until $1 out brings $1 back…
….spend-spend-spend-spend-spend-stop
[email protected] @jon_isernhagen

2014 Budget Review
…which is the point at which incremental ROI = 0%
- 9 -
ROI = (VCM – Spend) Spend
Abbreviation Term Definition
ROI Return on Investment Indicator of investment profitability. Positive = good.
VCM Variable Contribution Margin The amount of profit driven by a given transaction.
Spend Channel Spend The amount spent driving traffic to the site during the period in question
Calculated over a specified time period of investment and return.
[email protected] @jon_isernhagen

2014 Budget Review
Our goal: an ROI DashboardChannel* Desktop Tablet Mobile
Brand 20%
Brand SEM 62% 51% 38%
Display -5% -12% -7%
Display - Retargeting 26% 25% 29%
Email 250%
Meta search 18% 22% 10%
Non-brand SEM -30% -18% -40%
SEO 500% 520% 390%
Social media -5% -15% 15%
- 10 -
*of impression/click, not necessarily of consumer conversion
[email protected] @jon_isernhagen

2014 Budget Review
Presentation agenda
1) The importance of cross-device tracking2) Our mission as marketers3) ROI components
a) Spendb) Variable contribution
4) Algorithmic attributiona) DIYb) Evaluating vendors
5) Take-aways
[email protected] @jon_isernhagen

2014 Budget Review
ROI = (VCM – Spend) Spend
Spend
- 12 -
Which spend do you include?
[email protected] @jon_isernhagen

2014 Budget Review
Marketing ≈ Farming
1)Seed = impressions
2)Transactions = fruit
- 13 -
…but
marketers plant
& harvest constantly.
[email protected] @jon_isernhagen

2014 Budget Review
spendspendspendspend
How changes in spend can mess up ROI
- 14 -
$
time
profit
impact impact
spend
impact
Jan Feb Mar
[email protected] @jon_isernhagen

2014 Budget Review
Variable Contribution Margin (“VCM”)
- 15 -
ROI = (VCM – Spend) Spend
1) What is the profit from each transaction?
2) Which channels deserve part/all of the credit for driving each transaction?
[email protected] @jon_isernhagen

2014 Budget Review
VCM: the profit on each transaction
= Transaction revenue - variable non-marketing expenses:• Revenue:
– Supplier Commissions; – GDS incentives; – Overrides (lumpy: average/booking must be assumed)– Media (not transaction-driven, but has to be modeled in
somewhere)– Attached bookings / Lifetime value: try to gauge value without
double-counting
• Expenses: – Website hosting/capacity costs– Data processing expenses– Other expenses which vary by transaction or site activity volume
- 16 - [email protected] @jon_isernhagen
2014 Budget Review
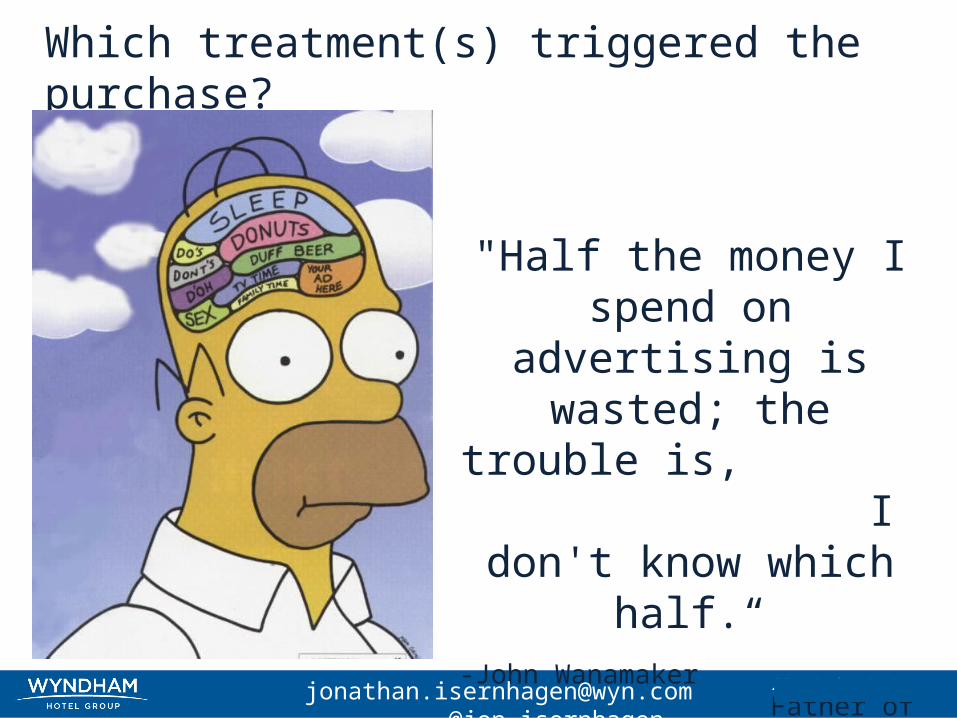
Which treatment(s) triggered the purchase?
"Half the money I spend on advertising is wasted;
the trouble is, I don't know which half.“
-John Wanamaker Father of Modern Advertising
[email protected] @jon_isernhagen

2014 Budget Review
Presentation agenda
1) The importance of cross-device tracking2) Our mission as marketers3) ROI components
a) Spendb) Variable contribution
4) Algorithmic attributiona) DIYb) Evaluating vendors
5) Take-aways
[email protected] @jon_isernhagen

2014 Budget Review
How badly do you want to know?
Raylan: You'll pay to find that out.Boyd: What are you packing?
[email protected] @jon_isernhagen

2014 Budget Review
Choosing your attribution strategy
Do you want/need true attribution*?
Do you havedata guys?
Do they havebandwidth for this?
Yes
No
No
Use your sitemetric solution’s
attribution
Yes
Yes Hire a vendor
Can you accessyour data?
Yes
No
*Do you have:1) Large enough budget?2) Multiple channels?3) Belief in ROI “knowability?”
DIY
No
[email protected] @jon_isernhagen

2014 Budget Review
• Sends• Opens
Collecting the necessary data
Analysis space
• Clicks• Visitors
• Transactions• VCM• Media impressions
Site metrics tool
Back office system
• Channel-specific phone #s
Email service provider
Call Center IVR
• Impressions• Clicks• Spend
Display ad server
e.g. SAS, Revolution Analytics,SPSS, Teradata Warehouse Miner
SEM bid management tool
• Impressions• Clicks• Spend
• GRPs• Spend
Television plan
• Impressions• Clicks• Spend
Meta search feeds
Spend
Manual spend entry table
[email protected] @jon_isernhagen

2014 Budget Review
Connecting the necessary data
Transactions Profiles Customers
Sessions
∞ 1∞ 1Clicks:TransactionsClicks ∞ 11 ∞
∞ 1∞ 1
Calls
Sends
Opens∞1
∞1
IVR
GRPsTV plan
ImpressionsAd server
Impressions
∞ 1
∞ 1
∞ 1
Back officeSite monitoring tool CRM system
1 ∞
[email protected] @jon_isernhagen

2014 Budget Review
Profile deduplication is crucial
Profiles Customers∞ 1
CRM system
1) App registration information tied to desktop profile2) Logged-in customer information on multiple devices3) E-mails sent to same address opened on multiple devices4) Third-party services with network visibility
[email protected] @jon_isernhagen

2014 Budget Review
Impressions are also important
This example overcredits impressions (excludes other channels) but it gives some idea of the sub-surface portion of the
impressions iceberg.
[email protected] @jon_isernhagen

2014 Budget Review
Forrester surveys of algorithmic attribution vendors
[email protected] @jon_isernhagen
2012 2014

2014 Budget Review
Criteria for attribution vendor evaluation
1) Independence / media neutrality2) Independent data collection3) Cross-device natively4) Brand search & affiliate conversion controls5) Programmatic capability6) Ad viewability7) Time to onboard8) Cost
[email protected] @jon_isernhagen

2014 Budget Review
Independence – Media agnosticVendor Independent Score
Abakus Yes 1
AOL/Convertro No 0
C3 Metrics Yes 1
eBay/Clearsaleing No 0
Adometry/Google No 0
Marketing Evolution Yes 1
Marketshare Yes 1
Rakuten DC Storm No 0
Visual IQ Yes 1
- 27 - [email protected] @jon_isernhagen
Vendors owned by Media companies are not considered neutral and scored with a value of 0. Independent vendors are scored with the value of 1.

2014 Budget Review
Independent data collectionVendor Collect own data Score
Abakus No 0
AOL/Convertro Yes 1
C3 Metrics Yes 1
eBay/Clearsaleing Yes 1
Adometry/Google Yes 1
Marketing Evolution No 0
Marketshare No 0
Rakuten DC Storm Yes 1
Visual IQ No 0
- 28 - [email protected] @jon_isernhagen
Vendors which collect their own data via tags are scored with the value of 1. Vendors which do not collect data are scored with a 0.

2014 Budget Review
Cross-device visibility native to the platformVendor Cross-device visibility Score
Abakus No 0
AOL/Convertro Yes 1
C3 Metrics Yes 1
eBay/Clearsaleing No 0
Adometry/Google No 1*
Marketing Evolution No 0
Marketshare No 0
Rakuten DC Storm No 0
Visual IQ No 0
- 29 - [email protected] @jon_isernhagen
Vendors which provide cross-device native to the platform for no additional fee are scored with a value of 1, other vendors who either do not provide the service or who require an additional vendor are scored with a value of 0. (*coming in mid-2015)

2014 Budget Review
Brand search & affiliate conversion controlsVendor Conversion controls Score
Abakus No 0
AOL/Convertro Yes 1
C3 Metrics Yes 1
eBay/Clearsaleing No 0
Adometry/Google Yes 1
Marketing Evolution No 0
Marketshare No 0
Rakuten DC Storm No 0
Visual IQ No 0
- 30 - [email protected] @jon_isernhagen
Brand search, Affiliates and other vendors dominate activity at the bottom of the funnel. Vendors which are able to control for this activity within the model are scored with a value of 1, vendors which have not addressed this issue are scored with a value of 0.

2014 Budget Review
Programmatic capabilityVendor Programmatic Score
Abakus No 0
AOL/Convertro Yes 1
C3 Metrics Yes 1
eBay/Clearsaleing No 0
Adometry/Google Yes 1
Marketing Evolution No 0
Marketshare No 0
Rakuten DC Storm No 0
Visual IQ No 0
- 31 - [email protected] @jon_isernhagen
Programmatic capability requires independent view tags and integration with trading desks and Ad Networks. Vendors which have this capability are scored with the value of 1, vendors which do not are scored with a value of 0.

2014 Budget Review
Display ad viewability auditVendor Display audit Score
Abakus No 0
AOL/Convertro No 0
C3 Metrics Yes 1
eBay/Clearsaleing No 0
Adometry/Google Yes 1*
Marketing Evolution No 0
Marketshare No 0
Rakuten DC Storm No 0
Visual IQ No 0
- 32 - [email protected] @jon_isernhagen
Greater than 50% of all display ads are never seen. Vendors which have integrated viewability which accounts for cross-domain iframe ads are scored with a value of 1, other vendors which cannot determine viewability are scored with a value of 0. (*4Q15)

2014 Budget Review
Time to onboardVendor Time to onboard Score
Abakus 1 month 1
AOL/Convertro 2 months 0
C3 Metrics 7 days 1
eBay/Clearsaleing 1.5 months 1
Adometry/Google 3 months 0
Marketing Evolution 1.5 months 1
Marketshare 1 month 1
Rakuten DC Storm 3 months 0
Visual IQ 3 months 0
- 33 - [email protected] @jon_isernhagen
Time to onboard is crucial as recommendations from any platform cannot be considered until the platform is fully live. Vendors which are able to onboard in less than 2 months are scored with a value 1. Vendors requiring 2 months or more are scored with a value of 0.

2014 Budget Review
CostVendor Cost/year Contract period Score
Abakus $50K - $150K Yearly 1
AOL/Convertro $60K - $1M Yearly 0
C3 Metrics $60K - $150K Monthly 1
eBay/Clearsaleing $60K - $850K Yearly 1
Adometry/Google $275K - $300K Yearly 0
Marketing Evolution $150K - $1M Yearly 1
Marketshare $200K - $1M Three-yearly 1
Rakuten DC Storm $170K Yearly 0
Visual IQ $325K - $1M Yearly 0
- 34 - [email protected] @jon_isernhagen
Vendors with a minimum yearly fee of less than $100,000 are scored with a value of 1. Vendors with minimum yearly fees exceeding $100,000 are scored with a value of 0.

2014 Budget Review
Final scoresVendor Score
Abakus 3
AOL/Convertro 5
C3 Metrics 8
eBay/Clearsaleing 3
Adometry/Google 5
Marketing Evolution 2
Marketshare 2
Rakuten DC Storm 1
Visual IQ 2
- 35 - [email protected] @jon_isernhagen

2014 Budget Review
Running the process
1) For each site visitora) Assemble visit historyb) Create variables to represent:
i. Channel impressionsii. Channel clicksiii.Past purchases
2) Regress or use machine learning algorithma) Ascertain which channel touches predict bookingb) Give VCM credit to causal channels
3) Calculate ROIa) Use each channel’s VCM and spendb) Where ROI is positive, spend upc) Where ROI is negative, cut spend or change tactics
[email protected] @jon_isernhagen

2014 Budget Review
ROI DashboardChannel* Desktop Tablet Mobile
Brand 20%
Brand SEM 62% 51% 38%
Display -5% -12% -7%
Display - Retargeting 26% 25% 29%
Email 250%
Meta search 18% 22% 10%
Non-brand SEM -30% -18% -40%
SEO 500% 520% 390%
Social media -5% -15% 15%
- 37 -
*of impression/click, not necessarily of consumer conversion
[email protected] @jon_isernhagen

2014 Budget Review
Presentation agenda
1) The importance of….a) Cross-device trackingb) Channel ROI calculation
2) ROI componentsa) Spendb) Variable contribution
3) Algorithmic attributiona) Marshalling the datab) Evaluating vendors
4) Take-aways
[email protected] @jon_isernhagen

2014 Budget Review
Take-aways
1) Cross-device shopping is here to stay (until/unless phablet experience massively improves).
2) ROI is the one true KPIa) Algorithmic attribution is the only way to calculate itb) “ “ is becoming
more affordablec) Each time you find yourself agonizing over a channel
marketing spend decision, revisit your choice not to do algorithmic attribution.
[email protected] @jon_isernhagen
2014 Budget Review
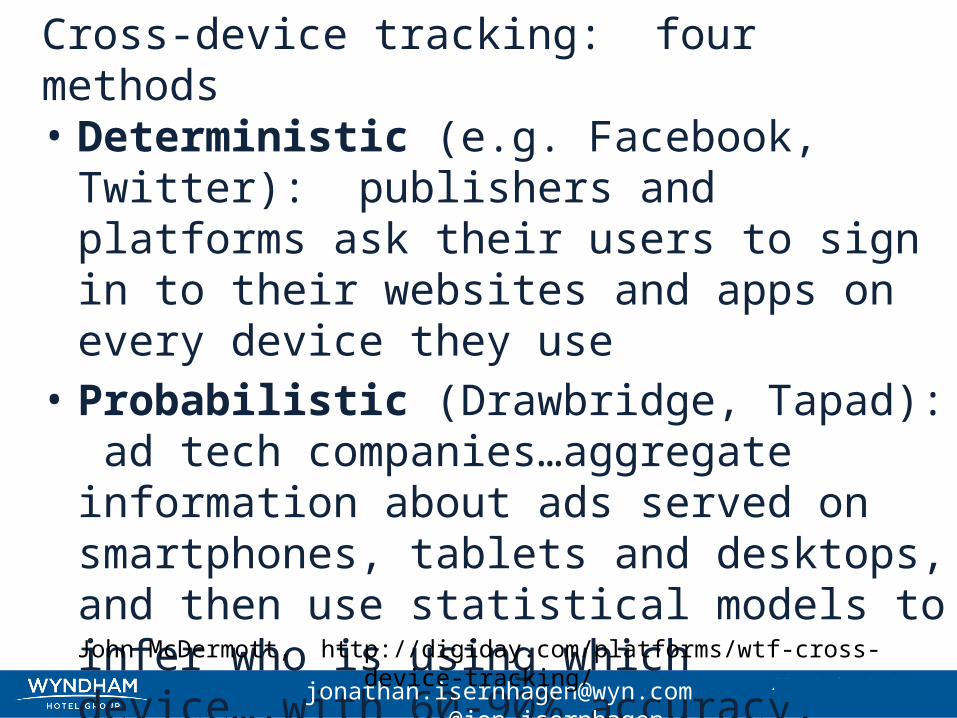
Cross-device tracking: four methods
• Deterministic (e.g. Facebook, Twitter): publishers and platforms ask their users to sign in to their websites and apps on every device they use
• Probabilistic (Drawbridge, Tapad): ad tech companies…aggregate information about ads served on smartphones, tablets and desktops, and then use statistical models to infer who is using which device….with 60-90% accuracy.
[email protected] @jon_isernhagen
John McDermott, http://digiday.com/platforms/wtf-cross-device-tracking/

2014 Budget Review
Cross-device tracking: four methods (cont’d)
• Householding: Where different devices can be seen on one IP range and are combined with home data, behavior and more, they can be inferred as the same user.
• Data links: Apps that can hear TV sounds, QR codes, NFC and more data links can join up devices to TV, print and outdoor for a cross-channel approach (more than cross-device).
[email protected] @jon_isernhagen
Robert Webster, http://crimtan.com/cross-device-tracking-dont-believe-the-hype/

2014 Budget Review42
Algorithmic attribution per Visual IQ:Top Down (MMO) & Bottom Up (Fractional Attribution)
SUMMARY LEVEL DATA USER LEVEL DATA
CHANNELS Offline + digital cross channel Digital media channels
ROLEStrategic: Optimize spend across
channelsTactical: Generates granular
media recommendations
OUTPUT Cross channel insight Full fractional attribution
CAPTURES Seasonality and external factors Interplay between digital touch point and channels
PREDICTABLE GRANULARITY Conversions at aggregate level Propensity to convert at user level
[email protected] @jon_isernhagen

2014 Budget Review
“Given all the history we know, how likely is this shopper to convert soon?”
Datasong answers with a 2-stage model: • -Are Brand shoppers (BSEM, BSEO, DTI) likely to book? Yes
• -Did your last TV spot cause their brand loyalty? Maybe
Algorithmic attribution per DataSong: Survival Modeling
Model 2Accuracy 81%
Model 1Accuracy 68%
0 0.1 0.2 0.3 0.4 0.5 0.6 0.7 0.8 0.9 10
0.5
1
NonConverters Converters
0 0.1 0.2 0.3 0.4 0.5 0.6 0.7 0.8 0.9 10
0.5
1
NonConverters Converters
[email protected] @jon_isernhagen

2014 Budget Review
Algorithmic attribution per DataSong: Survival Modeling
1) Axes show the time since last channel exposure2) Dots represent Converters vs. nonConverters3) Orange line represents the relationship between
2 variables, e.g.:a) time since last email andb) time since last affiliate visit
4) Responders: everyone above the line. We count the folks above the line and see what our accuracy is
5) Attribution: once satisfied with a model(s), we’d:a) take a given order, b) see the time since last email and affiliate and based on
the timing, and;c) where we are on the orange line, so;d) we have a means to allocate which was more causal.
0 0.1 0.2 0.3 0.4 0.5 0.6 0.7 0.8 0.9 10
0.5
1
NonConverters Converters
[email protected] @jon_isernhagen

2014 Budget Review
Survival Modeling: DIY
Recommended by one of our PhD statisticians.“SAS usage is not necessary.”
[email protected] @jon_isernhagen

2014 Budget Review- 46 -
Algorithmic attribution per Google: Interaction Method (“Shapley value”)
Brand SEM Email
2%
Conversion
Brand SEM Email
3%
Conversion
Every combination (“coalition”) of clicks is tested. “How important is each player to the overall cooperation?”http://en.wikipedia.org/wiki/Shapley_value
Display
[email protected] @jon_isernhagen


