30
DISCUSSION PAPER SERIES IZA DP No. 10689 Joel Blit Mikal Skuterud Jue Zhang Immigration and Innovation: Evidence from Canadian Cities APRIL 2017

Discussion PaPer series
IZA DP No. 10689
Joel BlitMikal SkuterudJue Zhang
Immigration and Innovation: Evidence from Canadian Cities
APrIl 2017

Any opinions expressed in this paper are those of the author(s) and not those of IZA. Research published in this series may include views on policy, but IZA takes no institutional policy positions. The IZA research network is committed to the IZA Guiding Principles of Research Integrity.The IZA Institute of Labor Economics is an independent economic research institute that conducts research in labor economics and offers evidence-based policy advice on labor market issues. Supported by the Deutsche Post Foundation, IZA runs the world’s largest network of economists, whose research aims to provide answers to the global labor market challenges of our time. Our key objective is to build bridges between academic research, policymakers and society.IZA Discussion Papers often represent preliminary work and are circulated to encourage discussion. Citation of such a paper should account for its provisional character. A revised version may be available directly from the author.
Schaumburg-Lippe-Straße 5–953113 Bonn, Germany
Phone: +49-228-3894-0Email: [email protected] www.iza.org
IZA – Institute of Labor Economics
Discussion PaPer series
IZA DP No. 10689
Immigration and Innovation: Evidence from Canadian Cities
APrIl 2017
Joel BlitUniversity of Waterloo
Mikal SkuterudUniversity of Waterloo and IZA
Jue ZhangUniversity of Waterloo

AbstrAct
APrIl 2017IZA DP No. 10689
Immigration and Innovation: Evidence from Canadian Cities*
We examine the effect of changes in skilled-immigrant population shares in 98 Canadian
cities between 1981 and 2006 on per capita patents. The Canadian case is of interest
because its ‘points system’ for selecting immigrants is viewed as a model of skilled
immigration policy. Our estimates suggest unambiguously smaller beneficial impacts of
increasing the university-educated immigrant population share than comparable U.S.
estimates, whereas our estimates of the contribution of Canadian-born university graduates
are virtually identical in magnitude to the U.S. estimates. The modest contribution of
Canadian immigrants to innovation is, in large part, explained by the low employment rates
of Canadian STEM-educated immigrants in STEM jobs. Our results point to the value of
providing employers with a role in the immigrant screening process.
JEL Classification: J61, J18, O31
Keywords: immigration, innovation, immigration policy
Corresponding author:Mikal SkuterudDepartment of EconomicsUniversity of Waterloo200 University Avenue WestWaterloo, ON, N2L 3G1Canada
E-mail: [email protected]
* We would like to thank David Green, Isaac Ehrlich, Jenny Hunt, Bill Kerr, Bill Lincoln, Garnett Picot, Chris Worswick, and seminar participants at the University of Melbourne, University of British Columbia, University at Buffalo, University of Waterloo, Immigration, Refugees, and Citizenship Canada (IRCC), and the 2015 and 2016 Canadian Economics Association Meetings for valuable comments. The authors acknowledge financial support from the Social Science and Humanities Research Council of Canada (SSHRC).

2
1 Introduction
Animportantconsequenceoftheeconomicturmoilbroughtaboutbythefinancialcrisisof2008
wasadecreaseinvoters’supportofimmigration.Thisdevelopment,whichhasbeenparticularlyevident
intheU.S.andtheU.K.,hasputincreasingpressureonpro-immigrationpoliticianstojustifytheeconomic
benefitsofcontinued large-scale immigration.Todoso, increasing referencehasbeenmade inpolicy
discussions to the burgeoning economics literature exploring the `wider’ benefits of immigration,
includingeffectson internationaltradeflows,entrepreneurship,and,perhapsmostsignificantly,given
the growing consensusof its importance to long-termeconomic growth, on innovation.Although the
precisetheoreticalmechanismsthroughwhichdiversityincreasesinnovationarelesswelldeveloped,the
empirical literatureprovides remarkablyconsistentevidenceof theproductivity-enhancingbenefitsof
increasingethnicdiversitywithinworkplaces,cities,andcountries.1
Forgovernmentpolicymakersresponsibleforimmigration,thecriticalquestionishowtoharness
thisgrowth-enhancingpotentialofethnicdiversity.Inthisrespect,theeconomicsliteraturelinkingskilled
immigration with higher patenting rates is arguably not only the most relevant, but also the most
compelling.BeginningwithU.S.studiesbyPeri(2007),Chellaraj,Maskus,andMattoo(2008),Huntand
Gauthier-Loiselle (2010), and Kerr and Lincoln (2010), but now also including a number of European
studies(Bosetti,Cattaneo,andVerdolini(2012);Ozgen,Nijkamp,andPoot(2012),Parrotta,Pozzoli,and
Pytlikova(2014),Nathan(2014a)),thisliteraturehasattractedconsiderableattentioninthepolicyworld.
The results from these studies consistently suggest that increasing skilled immigration, particularly of
immigrantseducatedinscience,technology,engineering,andmathematics(STEM)fields,hasasignificant
positive impacton thenumbersofpatents that are created. For example,Hunt andGauthier-Loiselle
(2010) findthataonepercentage-point increase in theshareofastate’spopulationwhoarecollege-
educatedimmigrantscanbeexpectedtoincreasestate-levelpatentspercapitaby9-18%.Comparingthe
magnitudeofthiseffecttowhatisimpliedbythedifferentialpatentingrateofimmigrantsobservedin
individual-leveldata,theyconcludethatanimportantpartofthiseffectreflectsapositiveexternalityof
immigrants on the patenting rates of native-born Americans. The potential of immigrants to raise
1Thenotionof`widereffects’ofimmigrationisduetoNathan(2014b).Theliteraturelinkingethnicdiversityand
innovationisinterdisciplinarywithpapersinpsychology(VanKnippenberg,DeDreu,andHoman2004),sociology
(Herring2009),managementstudies(ElyandThomas2001;Richard,McMillan,Chadwick,andDwyer2003),and
economics.
3
innovationlevelsnotonlydirectlythroughtheirownpatents,butalsobymakingnativesmoreinnovative,
makesastrongeconomiccaseforimmigration.
In this paper, we examine the Canadian case in order to inform the innovation-enhancing
potential of immigration in a setting inwhich a `points system’ is used to screen skilled immigrants.
Canada’s `points system’ is seen bymany as amodel of effective skilled immigration policy; theU.K.
adoptedapointssystemin2008anditisregularlypointedtoasanoptioninongoingU.S.immigration
reformdiscussions.TheCanadiancaseisalsoimportantbecauseCanadaconsistentlyranksamongthe
world’slargestimmigrant-receivingcountriesmeasuredasaproportionofitspopulation.Betweenthe
mid-1980sandmid-1990s,bothCanada’sannualinflowofnewpermanentresidentsandtheshareofthe
inflowadmittedunderthe`pointssystem’morethandoubled.Consequently,theshareoftheCanadian
working-agepopulationcomprisedofuniversity-educatedimmigrantsincreasedfrom2.1%intheearly
1980sto3.3%intheearly1990sand6.4%bythemid-2000s.
GivenCanada’ssuccessatattractingskilledimmigrants,thereisthepotentialforexceptionally
large effects of immigration on innovation in the Canadian case. However, there is also substantial
evidencepointingtosignificant labourmarketchallengesofCanadianuniversity-educated immigrants,
whichsuggestthatthe labourmarketskillsofCanadian immigrantshavenotkeptpacewiththe large
increaseintheireducationlevels(ClarkeandSkuterud2013,2016;Clark,Ferrer,andSkuterud2017).Itis
anopenquestionwhether thepoor earningsperformanceof Canadian immigrants, possibly resulting
fromthecrudenessofthecriteriausedbythe`pointssystem’toscreenhumancapital,ismirroredintheir
contributionstoinnovation.Inparticular,whiletheCanadian`pointssystem’givesconsiderableweight
toforeignsourcesofeducationandworkexperience,there isevidencethatforeignsourcesofhuman
capitalaredevaluedbyCanadianemployers(GreenandWorswick2012;SkuterudandSu2012).
TheprimarychallengeinexaminingtheCanadacaseisitsrelativelysmallpopulation,whichlimits
the geographic variation in immigrant population shares. Nonetheless, relating changes in university-
educated immigrantshareswithin98Canadiancitiesbetween1981and2006tochanges inpatenting
rates, we obtain estimates that are unambiguously smaller than those found by Hunt and Gauthier-
Loiselle (2010) (hereafterHGL) usingU.S. data. This remains true evenwhenwe restrict attention to
university-educatedimmigrantswhowereeducatedinaSTEMfield.Ontheotherhand,theestimated
effectofCanadian-bornuniversitygraduatesonpatentingratesisvirtuallyidenticalinmagnitudetothe
HGLestimateforU.S.natives,suggestingthatthesmallermagnitudeofourimmigrantestimatesdoesnot
reflect greater measurement error in our data or something intrinsic to the Canadian economy or
4
innovation sectors. Overall, our analysis suggests that increasing the university-educated immigrant
populationshareinCanadamayhavecontributedtoraisingpatentingrates,butonlymodestly,andany
spillovereffectsofimmigrantsonnativepatentingarelikelyminimal.
AnimportantpolicyquestionistowhatextenttheweakercontributionofCanadianimmigrants
toinnovationthatweidentifyisrelatedtothebroaderlabourmarketchallengesofCanadianimmigrants
identifiedelsewhere. Indeed,whenwe isolate theeffectofuniversity-educated immigrantswhowere
educatedinaSTEMfieldandarecurrentlyemployedinaSTEMoccupation,ourestimatesbecomemuch
largerandstatisticallysignificant.TherelativelysmallCanadianestimatesthereforeappearto, in large
part,reflecttherelativelylowemploymentratesofCanadianimmigrantsinSTEMjobs,includingamong
thoseeducatedinSTEMfields.WhileweprovidenodirectevidenceonwhyCanadianSTEM-educated
immigrantsfacegreateremploymentbarriersthantheirU.S.counterparts,thedifferenceisconsistent
withU.S.immigrantsbeingrelativelypositivelyselectedowingtoagreaterroleofemployersinimmigrant
selectionandhighereconomicreturnstoskillinU.S.labourmarkets.
The remainder of the paper is organized as follows. In the following section, we discuss the
relevanceoftheCanadiancontext.Insection3,wedescribeourmethodologicalapproach,includingthe
datathatweemploy.InSection4wediscussourresultsindetail.Inthefinalsection,wesummarizeour
mainfindingsanddiscusstheirpolicyrelevance.
2 TheCanadiancontext
TheCanadianImmigrationActof1962endedthehistoricalpracticeofselectingimmigrantsonthebasis
oftheircountryoforiginandreplaceditoverthefollowingdecadewitha pointssystem’thatemphasized
the human capital of migrants. The success of the Canadian `points system’ in raising the average
educationlevelsofitsimmigrantpopulationhasledanumberofcountries,includingAustraliaandthe
U.K.,tofollowitsapproach,andhasreceivedmuchattentioninrecentimmigrationreformdiscussionsin
theUnitedStates.ThekeyrationaleunderlyingtheCanadianapproachisthathumancapitalisastronger
predictor of long-run economic success than the extent towhich an immigrant’s skillsmatch current
labourmarketneeds.Moreover,currentlocallabourmarketneedsaredifficulttoidentifyempiricallyand,
areoftenshort-lived,and theapproach is inpractice impractical, since immigrantsare free tochoose
wheretheysettle.However,withinCanadatherehasbeengrowingcriticismofthisapproachinresponse
toevidenceofadeteriorationintheabilityofCanada’sskilledimmigrantstoobtainjobscommensurate

5
with their levels of education andexperienceobtained abroad (seePicot and Sweetman (2012) for a
reviewofthisliterature).2
ThelevelofinnovationinCanadahashistoricallybeenlowerthanthatoftheUnitedStates.The
economyinvestsasmallerfractionofGDPonresearchanddevelopment(2.0%inCanadaversus2.5%in
theU.S.in2006)andgeneratesfewerpatentspercapita(19.9patentsper100,000inCanadaversus48.0
patentsper100,000intheU.S. in2006).Prevailingexplanationsforthisgapincludedifferencesinthe
industrialmix(inparticular,Canada’shistoricalrelianceonnaturalresources),ahigherdegreeofforeign
ownershipinCanada,andtherelativelysmallersizeofCanadianfirms.However,thetwocountriesdonot
differinthefractionoftheirworkforcesemployedinSTEM.AsreportedbyBecksteadandGellatly(2006),
theshareofemploymentinscience,engineering,andrelatedoccupationswas,forCanadaandtheU.S.
respectively,9.8%and9.6%in1981/80,11.7%and11.3%in1991/90,and13.6%forbothin2001/00.
Given the lower level of patenting activity in Canada,wemight expect lower patenting rates
amongCanadianskilledimmigrantsandthattheygeneratelesspatentingspilloversonnatives.However,
thefocusofouranalysisiswhetherCanada’s pointssystem’forscreeningskilledimmigrants,inparticular
onthebasisoftheireducationalattainmentlevels,hasresultedinCanadianimmigrationhavingalarger
proportionalimpactonpatentingrates.Toprovidesomeinitialsenseofthemagnitudesofthesechanges,
inFigure1weplotbothnational-levelpatentspercapitainCanadaandtheU.S.between1980and2006
andthesharesoftheirpopulationsaged25andovercomprisedofuniversity-educatedimmigrants. In
bothcountries,theuniversity-educatedimmigrantshare increasedconsistentlyovertheentireperiod.
GiventheCanadiansystem’semphasisonskilledimmigration,theCanadiansharein1980wasmorethan
twicetheU.S.share(2%comparedto0.7%).Overthefollowing25years,Canadacontinuedtoattract
moreskilledimmigrantsasafractionofitspopulation,sothatbythemid-2000snearly6.4%ofitsworking-
ageCanadianpopulationwereuniversity-educatedimmigrants,comparedto4.2%intheUnitedStates.
GiventheevidenceinHGL,thisincreaseshouldhaveservedtoraisepatentingratesproportionally
moreinCanadathanintheUnitedStates.Interestingly,theCanadianpatentingratedid,infact,increase
2ThishasledtheCanadiangovernmenttomakesignificantpolicyshiftsinrecentyearstowardsgivingemployersa
greaterroleinimmigrantselection.Inparticular,asufficientconditionforobtaininganinvitationforpermanent
residencyunderthenewExpressEntrysystemforprocessingapplications,introducedinJanuary2015,isajob
offerfromaCanadianemployer.Joboffersforforeignworkersmust,however,clearalabourmarkettestintended
toensurethattheemployerwasunabletofillthejobdomestically.

6
moreoverthisperiodthantheU.S.rate.3Whereaspatentspercapita(x100,000)nearlytripledinCanada
(fromabout6.9in1980to19.9in2006),theyonlydoubledintheU.S.(25.9in1980to48.0in2006).Of
course,theincreaseinpatentingratesimpliedbyeventheupperboundestimateofHGL(an18logpoint
increaseinpatentspercapitafroma1percentage-pointincreaseintheuniversity-educatedimmigrant
share)aremuchsmallerthanthelogpointincreasesthateitherCanadaortheU.S.actuallyexperienced.
Ofcourse,therearemanyotherfactorsservingtoraisepatentingratesbesidesimmigration.Moreover,
thesenational-levelcorrelationscouldbeentirelymisleading.Toplausiblyidentifythecausalimpactof
Canada’sskilledimmigrationonitspatentingrate,weneedastrategytoisolateasourceofincreasesin
skilledimmigrantpopulationsharesthatareplausiblyindependentof increasesinpatentingratesthat
wouldhaveoccurredevenintheabsenceofanychangesinskilledimmigrantpopulationshares.
3 Methodology
WefocusoncomparisonstotheresultsofHGLforthreereasons.First,theirresultsarethemost
general, as they are focused on college-educated shares in the overall population, as opposed to
internationalstudentsorH-1Bvisaholders.Thismakesitpossibletoconductmoredirectcomparisons.
Second,HGLhasattractedthemostinterest.4Third,theyfindevidenceoflargedirectandspillovereffects
of immigrants on U.S. patenting rates.5 However, rather than examine state-level (or province-level)
immigrationshares,asHGLdo,werelateimmigrantsharestopatentratesatthecitylevel.6Specifically,
weconstructa1981-2006balancedpanelofCanadianCensusMetropolitanandAgglomerationAreas
(CMA/CAs)withobservationsonskilledimmigrantpopulationsharesin98citiesevery5years.7Ourcities
rangeinpopulation(age15-70)in2006fromalowof8,448toahighof3,684,821,with66citiesabove
25,000individuals,46above50,000,26above100,000,and7above500,000.
3Bothcountriesexhibitupwardtrendingpatentingratesuptothedot-combubbleburstingin2001.FortheU.S.,in
particular,thisincreasewasfollowedbyalargedecline,whichmayhavebeendue,inpart,toadropinthesuccess
rateofpatentapplicationsattheUSPTO,particularlyinthe“drugsandmedicalinstruments”and“computersand
communications”fields(Carley,Hedge,andMarco2003).Itisimportanttonotethat,becausewehavecollected
patentsgranteduptoNovember2014,andthatamongpatentsgrantedin2013only1.8%ofthemtook8yearsor
longertobegrantedfromthedateofapplication(whichweuseinthefigure),datatruncationlikelyexplainsonlya
smallfractionofthisdecrease.4CitationcountsforHGLinGoogleScholarare417and56inWebofScienceasofMay2016.Incomparison,the
secondmostcitedpaper,KerrandLincoln(2010),has291and48citations,respectively.5KerrandLincoln(2010)donotfindstrongevidenceofspillovereffects.
6Withonly10Canadianprovinces,twoofwhichaccountforroughly60%ofthenationalpopulation,ananalysisat
theprovincelevelisnotviable.7ACMAisdefinedasoneormoreadjacentmunicipalitiescenteredonapopulationcorewithatleast100,000.ACA
musthaveacorepopulationofatleast10,000.

7
Weestimatetheskilledimmigrantsharesofthepopulationusingthemasterfilesofthe1981,
1986, 1991, 1996, 2001, and 2006 Canadian Censuses, which provide 20% random samples of the
Canadianpopulation.Skilledimmigrantsaredefinedinfouralternativeways:(i)university-educated;(ii)
university-educatedinaSTEMfield;(iii)university-educatedandemployedinaSTEMoccupation;or(iv)
university-educatedinaSTEMfieldandemployedinaSTEMoccupation.Theappendixprovidesdetails
on howwedefine STEM fields of study andoccupations in the various Census years. In addition,we
distinguishbetweenSTEM-educatedimmigrantswithCanadianandforeigndegrees,whichweestimate
usinginformationonyearsofschoolingandageatimmigration.8Incaseswherethepopulationshares
aredefinedusingfieldofstudy,welosethefirstyearofdatainourpanelbecausefieldofstudywasnot
identifiedinthe1981Census.
Skilled immigrant population shares in Census years are related to the number of patent
applications(percapita)withincitiesoverthefollowing5years.Thefive-yearlagisnotonlyconvenient
for maximizing our sample size using the quinquennial Canadian Censuses, but is also justified by a
separate analysis we conducted suggesting that the impact of changes in the composition of the
populationonpatentapplicationcountspeaksfouryearsafterthechange.9Weconstructpatentcounts
atthelevelofthecityandyearusingUnitedStatesPatentandTrademarkOffice(USPTO)dataonpatents
grantedtoinventorsresidinginCanada.Alternatively,wecouldhaveexaminedpatentsgrantedbythe
CanadianIntellectualPropertyOffice(CIPO)toCanadianinventors.However,thiswouldhaveresultedin
usobservingonlyasmallsubsetofpatentedCanadianinventions,sinceCanadianinventorstendtopatent
intheU.S.andforegopatentinginCanadaaltogether,duetothemuchlargersizeoftheU.S.market.10
PatentsareassignedtocitiesbylinkingtheaddressofinventorstoCanadianCMA/CAs.Where
patents containedmultiple inventors, we assigned fractions of patents to cities, so that each patent
8Specifically,weassumeschoolingisstrictlycontinuous,sothatyearsofschoolingplus6identifiestheageof
schoolcompletion.Comparingthisagetotheageatimmigrationidentifieswhethertheterminaldegreewas
obtainedinCanadaorabroad.Theresultingvariablecontainssomemeasurementerrorwhereschoolingisnot
continuousandwhereinternationalstudentsobtainCanadianschoolingpriortolanding.SkuterudandSu(2012)
showthattheconsequencesofthismeasurementerrorarenegligibleinestimatingearningstoforeignand
Canadianschooling.9Werelatedchangesinacity’spopulationfromagivenethnicitywithchangesinthenumberoffuturepatent
applicationsbymembersofthatethnicityresidinginthatcity.WethankBillKerrforgenerouslyprovidinguswith
dataonthepredictedethnicityofpatentinventorsbasedontheirnames(seeKerrandLincoln2010).10WeconductedaseparatesearchonthewebsitesoftheCIPOandtheUSPTOforpatentsfiledintheyear2000
withatleastoneCanadianinventorandfound1,136CIPOand5,195USPTOpatentsmeetingthecriteria.To
furthertestthepremisethatCIPOpatentsarelargelyasubsetofUSPTOpatents,wemanuallysearchedtheUSPTO
databaseforthefirst100Canadian-inventorCIPOpatentsappliedforin2000andfound93unambiguousUSPTO
matchesand2additionalprobableones.Thesedataareavailablefromtheauthorsuponrequest.

8
receivedequalweight.Forexample,apatentwithtwoinventorsfromTorontoandonefromKitchener-
Waterlooiscountedastwo-thirdsofapatentforTorontoandone-thirdforKitchener-Waterloo.Patents
areassignedayearbasedontheapplicationdateofthepatent(notthegrantdate),sincethiscoincides
mostcloselytotheactualdatethattheinnovationtookplace.Becauseweonlyobservepatentsgranted
uptoNovember2014,ourpatentcountsforthefive-yearwindowfollowing2006(theyears2007-2011)
will be lower due to data truncation.However, among patents granted in 2013,we find that 58%of
patentsweregrantedwithin3yearsofapplication,75%within4years,86%within5years,93%within6
years,and96%within7years.Ourestimatedpatentcountswill,therefore,beroughly18%lowerinthis
windowthantheyshould,butthisvariationshouldbeabsorbedinthe2006yearfixedeffect.
Ourbaselineempiricalmodelestimatesaspecificationascloseaspossibletothefirst-difference
(FD)weightedleastsquares(WLS)specificationofHGL.Wethenextendthisspecification,byincludinga
richer set of controls intended to address the possible endogeneity of within-city changes in skilled
immigrantpopulationshares.Specifically,weestimatetheequation:
5
1
( )( ) ( )
log( ) ( ) ( )
( ) (1981) ( ) ( )
cj c c
m nc c c
c c c
patents t jsm t sn t
pop t pop t pop t
X t Z y t t
b b
q ed
=
æ ö+ç ÷ æ ö æ öç ÷D = D + D +ç ÷ ç ÷ç ÷ è ø è øç ÷è ø
D + + +
å (1)
wherepatentsc(t+j)isthetotalnumberofpatentsgrantedtoinventorsresidingincitycthatwerefiledin
yeart+j;popc(t)isthepopulationaged15andover;smc(t)and snc(t) arethenumberofskilledimmigrants
andnatives(age15andover),respectively;Xc(t)isavectoroftime-varyingcontrolvariables;Zc(1981) is
avectorofcontrolsmeasuredin1981,intendedtocapturetheinfluenceofinitialconditions;y(t)isaset
ofCensusyearfixedeffects;εc(t)isarandomerrorpotentiallycorrelatedacrossyearswithincities;andΔ
is the first-difference between Census years. The parameter βm identifies the proportional effect of
increasingtheskilledimmigrantpopulationsharebyonepercentagepointonpatentspercapita,both
directlyandthroughpossiblespilloversonthepatentsofnatives.
FollowingHGL,webeginbyestimatingequation(1)includinglogmeanageinXc(t)andbothlog
mean income and log population in Zc(1981). We then extend the model by adding to Xc(t): (i) the
employmentrateand(ii)theexpectednumberoflogpatentspercapitabasedonthedistributionofa

9
city’spatentsbetween1972-1980acrosspatentclassesandthenational-levelnumberofpatentswithin
thosepatentclassesacrossCensusyears.This lattercontrolvariable,whichweborrowfromKerrand
Lincoln(2010), is intendedtocapturespuriouscorrelationsbetweenhistoricalsectoraldistributionsof
innovationacrosscitiesandsubsequentimmigrationflows.Intheextendedversionofthemodel,wealso
include a set of region-year fixed effects,where regions include theMaritimes,Quebec,Ontario, the
Prairies,andBritishColumbia.Finally,weallowthelogmeanincomecontrolvariabletovaryacrossCensus
years.Giventheconsiderablevariationincitysizesinoursampleof98Canadiancities,thevarianceof
the error term across city observations will vary considerably. To improve the efficiency of the FD
estimatorwethereforeweightalltheregressionsbycitypopulationsize.11
Itis,ofcourse,possibletoestimateequation(1)usingafixed-effects(FE)estimatorinstead.With
more than two time periods, the FE estimator produces different estimates than the FD estimator,
althoughbothestimatorsareconsistentunderthestrictexogeneityassumptionthattheright-hand-side
variables in equation (1) are uncorrelated with εc(t) across all Census years. Obtaining substantially
differentpointestimatesusingFE,thatisnotduetosamplingerror,providesevidenceagainstthestrict
exogeneityassumption.WehaveestimatedallthespecificationswereportusingaFEestimatorandnone
ofourmainfindingsaresubstantivelyaltered.
Thekeychallengeinidentifyingthecausalimpactofimmigrationonpatentsusinganarea-level
analysis is that we would expect skilled migration flows to be higher to cities that are experiencing
relativelylargeincreasesininnovationactivityforreasonsthatareentirelyindependentofimmigration.
Forexample,skilledimmigrationintheU.S.isdriveninlargepartbytherecruitingactivitiesofemployers,
throughtheH-1Bvisaprogram.Ifunobservedtechnologyshockssimultaneouslyleadtoincreasesinboth
patentsandthedemandforH-1Bworkers,theestimatesofβmwilltendtobeupwardbiasedestimates
ofthecausalimpactofimmigrants.Employerlabourdemandhas,however,historicallyplayedlittlerole
intheCanadian`pointssystem’,whichisusedtoscreenthevastmajorityofeconomicclassapplicants.
Moreover,thesystemhashistoricallybeencharacterizedbysignificantprocessingbottlenecks,makingit
11Specifically,weweightthefirst-differencedobservationsby(popc(t+1)-1+popc(t)-1)-1.AconcernwiththeWLS
approachistheinfluenceofTorontoontheestimates,givenitsrelativelylargepopulation.Thisisalsoaconcernin
theIVestimationdescribedbelow,inwhichtheinstrumentsarebasedonhistoricaldistributionsofimmigrants
acrosscities.ToassureourselvesthatourfindingsarenotdrivenbytheTorontoobservationalone,wehavealso
estimatedallourmodelsexcludingToronto.AlthoughthesenaïveFD-WLSestimatesdosuggestsomewhatlarger
beneficialimpactsofuniversityeducatedimmigration,thesearestillunambiguouslysmallerthanthoseinHGL(see
TableA1intheappendix),andourIVestimatesarealmostidenticaltothosereportedinTable5.Alternatively,we
havealsoestimatedunweightedregressionsforthelargest53cities(thosewithapopulationofatleast40,000in
1981).Theestimatesarealsolarger(seetableA2intheappendix)butstillsignificantlysmallerthanthoseinHGL.

10
arguablylesslikelythatsupply-drivenchangesinimmigrationflowstoCanadiancitiesarecorrelatedwith
latentcity-levelchangesinpatentingactivity.Nonetheless,eveninCanada,immigrantsultimatelydecide
in which city they will reside. To the extent that skilled immigrants choose to settle in cities where
increasesinpatentingratesarealreadyhappening,thereisstillreasontobeconcernedthattheresults
fromthenaïveestimatesofequation(1)areupwardbiased.
Acommonsolutiontothisinferenceproblem,initiallyproposedbyCard(2001),istoisolatethe
supply-pushcomponentofimmigrationflowstoaparticularcityusingattributesofcitiesthatareplausibly
unrelated to latent innovation trends.Thestandardapproach,whichwe follow, is to instrument local
skilled immigrantpopulationsusingpredicted immigrantpopulationsbasedon thehistorical city-level
settlement patterns of immigrants from particular origin countries and national-level populations of
immigrantsfromthosecountries.Thatis,weinstrumenttheskilledimmigrantsharesmc(t)inequation(1)
usingtheconstructedvariable:
(1976( ) ( ))c cj jj
sm t sm tl=å (2)
whereλcj(1976)istheshareof1976Canadianimmigrantsbornincountryjlivingincitycandsmj(t)isthe
national-level population of skilled immigrants from country j living in Canada in year t.12 Using first-
differencesoftheskilledimmigrantshares,theintuitionbehindtheinstrumentalvariables(IV)strategyis
that, for example, if the increase in the skilled immigrant population originating from Germany is
exceptionallyhighatthenationallevelbetweentwoCensusyears,wewouldexpectthecityofKitchener-
Waterloo(KW)toreceiveadisproportionatelylargeshareofthisincrease,notbecausetheseimmigrants
wereattractedby theexpectationofheightened innovativeactivity inKW,butbecause thehistorical
populationofGermanmigrantsresidinginKWandtheassociatedculturalamenitiestheyofferattracts
them.
12Toobtain1976immigrantcitypopulationsbyorigincountryweusedmobilityinformationinthepreviousfive
yearscontainedinthe1981Census,butrestrictedthesampletoimmigrantswholandedin1976orearlier.Wedid
not,however,restrictthesampletoskilledimmigrants,sinceculturalamenitiesthatattractimmigrantsarelikely
tobesharedacrosseducationgroups.Wealsogroupedcountriesintoregionswithsharedcultures,inorderto
reducemeasurementerrorintheestimatesofλcj(1976).ThegroupsaretheCaribbeanandBermuda(Frenchand
non-Frenchareseparategroups),CentralAmerica,SouthAmerica(Frenchandnon-French),Germany,France,
WesternEurope(excludingGermanyandFrance),EasternEurope,Scandinavia,SouthernEurope,Australia/New
Zealand/U.K.andcolonies,Sub-SaharanAfrica(Frenchandnon-French),otherAfrica(Frenchandnon-French),
Oceania(Frenchandnon-French),WesternAsiaandMiddleEast,India/Bangladesh/Pakistan,China/Hong-
Kong/Taiwan,Singapore/Malaysia/Indonesia,Korea,SouthAsia(excludingIndia,Pakistan,andBangladesh),and
restoftheworld.

11
4 Results
Beforeexaminingtheresultsofourregressionanalysis,inTable1wereportsamplemeansofthevariables
usedintheregressionsseparatelybyCensusyear.Themeansareweightedbycitypopulations,sothat
theyarerepresentativeoftheCanadianpopulationresidingwithinoneofCanada’slargest98cities.Note
that thepatent rates inTable1are roughly five times larger than those inFigure1because theyare
cumulativesumsofpatentsinthe5yearsfollowingtheCensusyear(thedependentvariableinequation
1).Consistentwiththenational-levelCanadianpatentingrateinFigure1,thefirstrowofTable1indicates
thataveragepatentingratesinCanada’scitiesincreasedconsistentlybetweentheearly1980sand2000s,
resultinginanearthreefoldincrease.Thequestionis,towhatextentdidskilledimmigrationcontribute
tothisincrease?
InthefollowingrowsofTable1,wereportskilledpopulationsharesseparatelyforimmigrants
andnatives.TheoverallimmigrantsharewithinCanada’slargestcitiesincreasedby4.6percentagepoints
between 1981 and 2006, which is larger than the change in the national-level share, reflecting the
increasing concentrationof new immigrants inCanada’s three largest cities – Toronto,Montreal, and
Vancouver. More important, all of this increase appears to be accounted for by university-educated
immigrants,astheirsharealoneincreasedby5percentagepoints(from2.7%to7.6%).Giventhatthe
Canadian `points system’hasneverdiscriminatedon thebasisof fieldof study, it ispossible that this
increase isaccountedforprimarilyby immigrantswhowereeducatedandemployed insectorswhere
patentingactivityisrare.Inthatcase,theireffectonpatentratesmayhavebeenmuchsmallerthanthe
HGL estimateswould predict. However, not only did the STEM-university-educated share increase by
about2percentagepointsbetween1986and2006,accountingforclosetohalfoftheoverallincreasein
the university-educated share, but by the early 2000s the share of university-educated Canadian
immigrantswhowere educated in a STEM field exceeded the comparable share forU.S. immigrants.
DefiningSTEMfieldsofstudysimilarlyusingtheU.S.NationalSurveyofCollegeGraduates(NSCG),33.6%
ofU.S.college-educatedimmigrantsin2003wereeducatedinaSTEMfield,comparedto37.4%and38.7%
ofCanadianuniversity-educatedimmigrantsin2001and2006,respectively.TheCanadian`pointssystem’
appears, therefore, to have been successful in not only raising the education levels of Canada’s
immigrants,butalsoinselectingimmigrantseducatedinSTEMfields.
Nonetheless, the Canadian research on the labour market performance of new immigrants
revealssignificantjob-educationmismatch.Foreign-trainedengineersdrivingtaxisismorethanacliché
inCanada(Xu2012).Giventhatthevastmajorityofpatentinghappensthroughcorporateresearchand

12
developmentactivities,challengesofSTEM-educatedimmigrantsinobtainingjobsinSTEMoccupations
mayhavelimitedtheimpactofSTEM-educatedimmigrantsonCanadianpatenting.Thereis,infact,some
evidence of this possibility in Table 1, as the population share comprised of university-educated
immigrantsfromSTEMfields increasedby2percentagepointsbetween1986and2006,buttheshare
alsoemployedinaSTEMoccupationincreasedbylessthan1percentagepoint.
In Table 2, we examine this education-job mismatch more closely by reporting conditional
probabilitiesof employment in a STEMoccupation separately for immigrants andnatives. The results
revealthatnotonlyareCanadianimmigrantsmorelikelytoholdauniversitydegreethantheirnative-
borncounterparts,butthisadvantagehasgrownsignificantlyovertime.Moreover,university-educated
immigrantsinCanadahavealwaysbeenmorelikelytobeeducatedinaSTEMfieldthantheirnative-born
counterpartsandthisdifferencehasalsobecome largerover time.By2006,nearly4-in-10university-
educatedCanadianimmigrantsweretrainedinaSTEMfield,comparedto2-in-10natives.However,the
probabilityofaSTEM-university-educatedimmigrantbeingemployedinaSTEMoccupationhastended
todecreaseovertime,whereasithasincreasedfornatives.Consequently,by2006therewasnearlya5
percentagepointgap in theSTEM-employment rateofCanadianSTEM-educated immigrants (0.37 for
natives,comparedto0.32forimmigrants).Incomparison,datafromtheNSCGindicatethatone-halfof
STEM-educatedimmigrantsintheU.S.wereemployedinSTEMjobsinboth1993and2003.Incontrast,
thecomparable rate forCanadianand theU.S.natives is similar (roughly0.4 inbothcountries).13We
wouldclearlyexpectthisshortfallintheSTEM-employment-ratesofCanadianimmigrantstohavelimited,
inasignificantway,thepotentialofCanada’sgrowingSTEM-university-educatedimmigrantpopulation
toboostCanadianinnovation.
A possible explanation for the low STEM-employment rates of STEM-educated Canadian
immigrantsisthatforeignsourcesofeducation,whichtheCanadian`pointssystem’valueshighly,may
resultinbarrierstoemployment,perhapsbecausethequalityofschoolingisloweronaverageorbecause
employers have more difficulty evaluating foreign credentials. Distinguishing between immigrants
educatedinCanadianandforeignuniversitiesprovidessomelimitedsupportforthispossibility.Rows6
and 7 of Table 2 show that the probability of being employed in a STEM job among STEM-educated
immigrantswithCanadiandegreeshasconsistentlybeenabout3percentagepointshigherthanforSTEM-
13AlthoughthefieldofstudyandoccupationclassificationsystemsinourCensusdataandtheNSCGaredifferent,
thefactthattheestimatedSTEM-employment-rateofSTEM-educatednativesaresimilarsuggeststousthatthe
muchloweremploymentrateofCanadianSTEM-educatedimmigrantsisnotbeingdriveninhowSTEMfieldsand
occupationsarebeingclassifiedinthetwodatasourcesorbyadifferentindustrialmixacrossthetwocountries.

13
educatedimmigrantswithforeigndegrees(theonlyexceptionbeingtheendofthedotcombubblein
2001,whentherateswereidentical).However,theimpactofthisemploymentgaphasbecomemagnified
astheshareofSTEM-university-educatedimmigrantswhograduatedfromaforeignuniversityincreased
fromabout50% in1986to57%in2006,presumablyreflectingthegrowing importanceof the `points
system’inimmigrantselection.Onceagain,wewouldexpectthistrendtohavelimitedthepotentialof
Canadianskilledimmigrationtoraisepatentrates.
Finally, in the remaining rows of Table 1we report theweighted samplemeans of city-level
averageage,nominalincome,andemploymentrates,aswellastheexpectedpatentspercapitavariable
describedabove.SimplecorrelationswiththesamplemeansinTable1appeartosuggestthatpatenting
ratestendtobehigherinolderpopulationsandtendtoincreaseinrecessions(based,inparticular,on
the large increase in the patenting rate between 1991 and 1996when employment rates fell).More
compelling evidence of these effects is, however, provided by regression analyses that control for
unobservedperiodeffects.
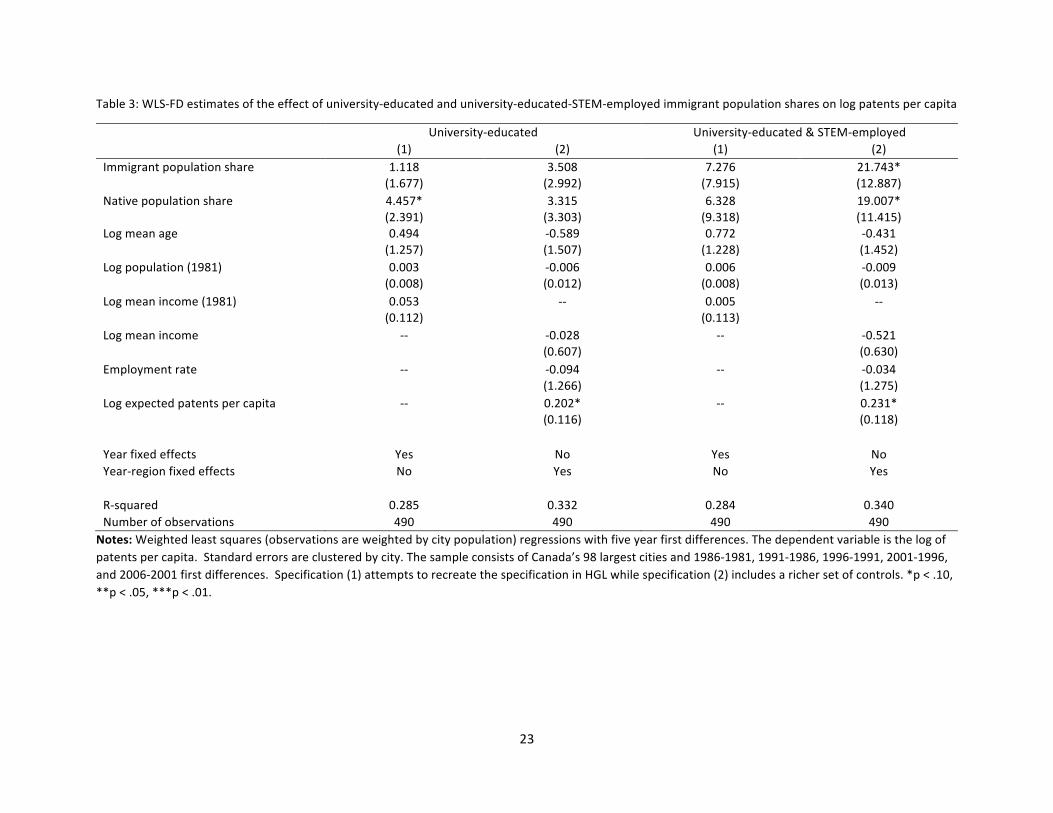
Theresultsfromestimatingequation(1)usingboththeHGLspecification(1)andarichersetof
controls(2)arereportedinTable3.ThefirstcolumnindicatesthatincreasingtheCanadianuniversity-
educatedimmigrantshareby1percentagepointisexpectedtoincreasepatentspercapitabyabout1.1
logpoints.ThecomparableU.S.estimate(seespecification(1)ofTable5inHGL)is14.7logpoints,which
fallsfaroutsidetheconfidenceintervalofourestimate.Thecoefficientonthenativeshareis,however,
almost identical to the HGL estimate (4.5 compared to the HGL estimate of 4.1) and is statistically
significantatthe10%level.Thissuggeststhatthelargedifferenceinourimmigrantshareestimatesdoes
notreflectgreatermeasurementerrorinourpopulationshares,structuraleconomicdifferencesbetween
thetwocountries,orotherdifferencesinourmethodologicaldifferences,suchasourfocusoncities,as
opposedtostates.Infact,ifweuseanalternativespecificationandvariabledefinitionsthatmostclosely
matchthatofHGL,thatis,using10-yearfirst-differences(insteadof5)andcountingpatentsonlyforthe
oneyearfollowingthecensusyearbasedontheresidenceofonlythefirstinventor,thedifferenceinthe
impactofuniversity-educatedimmigrantsacrossthetwocountriesbecomesevenlarger.Althoughthe
variancesoftheestimatedcoefficientsincreasesubstantially,presumablyduetothesmallersamplesize
andnoisierdependentvariable, thepointestimates suggesteven smallerbeneficial impactsof skilled
immigrationinCanada,andaslightlylargerimpactofskillednatives.14
14Theseresultsareavailablefromtheauthorsuponrequest.
14
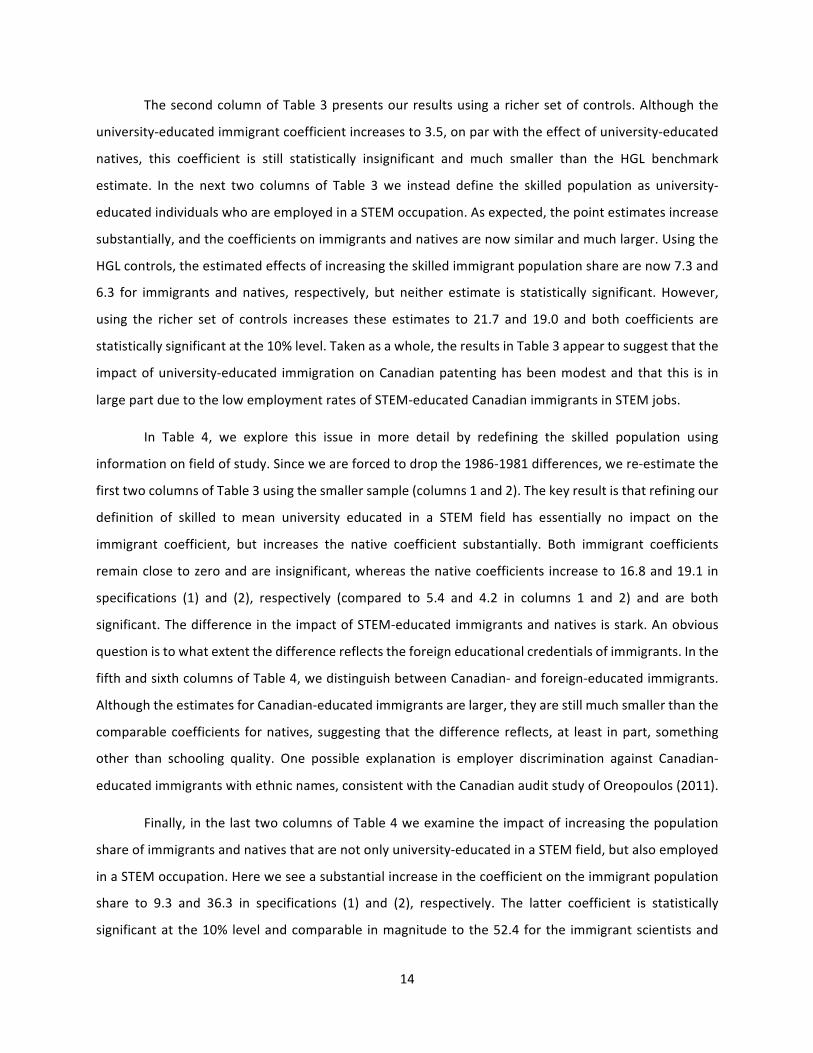
ThesecondcolumnofTable3presentsourresultsusingarichersetofcontrols.Althoughthe
university-educatedimmigrantcoefficientincreasesto3.5,onparwiththeeffectofuniversity-educated
natives, this coefficient is still statistically insignificant and much smaller than the HGL benchmark
estimate. In the next two columns of Table 3we instead define the skilled population as university-
educatedindividualswhoareemployedinaSTEMoccupation.Asexpected,thepointestimatesincrease
substantially,andthecoefficientsonimmigrantsandnativesarenowsimilarandmuchlarger.Usingthe
HGLcontrols,theestimatedeffectsofincreasingtheskilledimmigrantpopulationsharearenow7.3and
6.3 for immigrants and natives, respectively, but neither estimate is statistically significant. However,
using the richer set of controls increases these estimates to 21.7 and 19.0 and both coefficients are
statisticallysignificantatthe10%level.Takenasawhole,theresultsinTable3appeartosuggestthatthe
impactofuniversity-educated immigrationonCanadianpatentinghasbeenmodestandthat this is in
largepartduetothelowemploymentratesofSTEM-educatedCanadianimmigrantsinSTEMjobs.
In Table 4, we explore this issue in more detail by redefining the skilled population using
informationonfieldofstudy.Sinceweareforcedtodropthe1986-1981differences,were-estimatethe
firsttwocolumnsofTable3usingthesmallersample(columns1and2).Thekeyresultisthatrefiningour
definition of skilled to mean university educated in a STEM field has essentially no impact on the
immigrant coefficient, but increases the native coefficient substantially. Both immigrant coefficients
remainclosetozeroandareinsignificant,whereasthenativecoefficients increaseto16.8and19.1in
specifications (1) and (2), respectively (compared to 5.4 and 4.2 in columns 1 and 2) and are both
significant.ThedifferenceintheimpactofSTEM-educatedimmigrantsandnativesisstark.Anobvious
questionistowhatextentthedifferencereflectstheforeigneducationalcredentialsofimmigrants.Inthe
fifthandsixthcolumnsofTable4,wedistinguishbetweenCanadian-andforeign-educatedimmigrants.
AlthoughtheestimatesforCanadian-educatedimmigrantsarelarger,theyarestillmuchsmallerthanthe
comparablecoefficients fornatives, suggesting that thedifference reflects,at least inpart, something
other than schooling quality. One possible explanation is employer discrimination against Canadian-
educatedimmigrantswithethnicnames,consistentwiththeCanadianauditstudyofOreopoulos(2011).
Finally, inthelasttwocolumnsofTable4weexaminetheimpactofincreasingthepopulation
shareofimmigrantsandnativesthatarenotonlyuniversity-educatedinaSTEMfield,butalsoemployed
inaSTEMoccupation.Hereweseeasubstantialincreaseinthecoefficientontheimmigrantpopulation
share to 9.3 and 36.3 in specifications (1) and (2), respectively. The latter coefficient is statistically
significantat the10% levelandcomparable inmagnitudetothe52.4 for the immigrantscientistsand

15
engineersshare inHGL (Table6panelC).Takenasawhole, theestimatesappear tosuggest that the
relativelysmallcontributionofskilledimmigrantstoinnovationinCanadadoesnotreflecttheeducational
backgroundsofCanadianimmigrants,intermsofeithertheirrelativeconcentrationinSTEMfieldsorthe
qualityof their schooling.Rather, it seems thatbarriers toemployment inSTEM jobsare theprimary
sourceoftheirmodestcontributiontoinnovation.
It is, of course, possible that our naïve FD estimates are downward biased, perhaps as a
consequence of measurement error in the Canadian population shares. In Table 5, we examine the
robustnessofourestimatestoinstrumentingimmigrationtoCanadiancities.AsdescribedinSection3,
weinstrumentchangesinskilledimmigrantpopulationsusingstockpopulationsbasedonCensusdata.
Ourfirststageestimatesaresignificantatthe1%level.
Using our complete sample, we define skilled workers as: (i) the university educated; or (ii)
university-educatedandemployedinaSTEMjob.TheIVestimatesoftheeffectofraisingtheuniversity-
educated immigrant share change little and continue to suggest small positive and statistically
insignificanteffects. This is in sharp contrast toHGL,whoseestimatesbasedon the same instrument
nearlydoubleinmagnitude(seePanelAofTable8).Isolatingtheeffectofincreasingthepopulationshare
comprisedof university-educated immigrantswho are employed in a STEM job continues to produce
substantiallylargerestimates.Usingtherichercontrols(specification2)thepointestimategoesfrom1.1
to10.4andisstatisticallyinsignificant,althoughthelatterisnowhalfwhatitwasinTable3..15
5 Conclusions
WearguethatCanadaisanimportantcasestudybecauseits`pointssystem’forscreeningprospective
immigrantsisseenbymanyasamodelofhowtoraisetheaverageskilllevelsofimmigrationinflows.The
main finding from our analysis is that Canadian STEM-educated immigrants who are successful in
obtainingjobsinSTEMareasdoappeartoraisepatentingratesinasignificantway.However,withlittle
more than one-third of STEM-educated immigrants finding employment in STEM jobs, the impact of
Canadian skilled immigrationonpatent rateshasbeen relativelymodest in comparison to theUnited
States.ThefactthattheemploymentratesofCanadianSTEM-educatedimmigrantsinSTEMjobshas,if
anything, tended to decrease over time, while the comparable rate for Canadian natives has been
15Afurtherconcernisthattheinclusionofendogenouscontrolvariablescouldbiasourresults.WerantheIV
specificationsintable5withonlyfixedeffectsandobtainedsimilarcoefficientsfortheshareofuniversity-
educatedimmigrantsandsomewhatlargerbutstillinsignificantcoefficientsonuniversity-educatedstem-
employedimmigrantshares.

16
increasing,shouldbecauseforconcernamongpolicymakerscontemplatingintroducing‘pointssystems’
forimmigrantselection.Giventhemodestmagnitudeofourestimatedeffects,itappearsthat,forCanada,
anyspillovereffectsofimmigrantsonnativepatentingareminimal.
Whatisthepolicyrelevanceofthesefindings?Itwouldappearthatadoptinga`pointssystem’so
astoputmoreweightonSTEMeducationalbackgroundsisunlikelytohavethedesiredeffectofboosting
innovation.Rather,ourevidenceemphasizesthatselectingimmigrantswithSTEMskillsisnotsufficient,
giventhechallengesthatCanadianSTEM-educated immigrantsappeartoface inobtainingSTEMjobs.
The critical question for policy is whether the employment barriers that STEM-educated immigrants
appeartofacereflectdifferencesintheirskillsandabilitiesorlabourmarketinefficienciesarisingfrom
informationfrictionsinjobsearch,foreigncredentialassessment,orracialdiscrimination.Inthisregard,
itisnoteworthythatSTEM-educatedimmigrantsfindSTEMemploymentlessfrequentlythannativeseven
when they were educated in Canadian universities and that the contribution of STEM-educated
immigrantsfromCanadianuniversitiesappearstoalsofall farshortofthecomparablecontributionto
innovationofnative-bornCanadians.Thissuggeststousthatmorethaninformationfrictionsaroundthe
valueofimmigrants’educationalcredentialsisresponsible.
An alternative explanation is that the employment challenges of Canadian STEM-educated
immigrants primarily reflect differences in Canadian andU.S. skilled immigration policy. In particular,
whereasthevastmajorityofskilledimmigrantsintheU.S.areadmittedviatemporaryworkpermitsfrom
sponsoring employers, H-1B visas in particular, skilled-stream immigrants arriving in Canada as new
permanent residents typically do not have pre-arranged employment.16 Instead, theCanadian `points
system’hashistoricallygrantedpermanent residency to foreignapplicants solelyon thebasisof their
foreigneducational credentialsandyearsofworkexperience.To theextent thatU.S.employershave
richerinformationregardingtheproductivityofforeignworkers,STEM-educatedimmigrantsintheU.S.
arenotonlymorelikelyto“hitthegroundrunning”withajob,butmayalsobeofhigherlabourmarket
“quality”ondimensionsunobservabletothe`pointssystem.’Thissuggeststhatagreateremphasison
pre-arrangedemploymentinimmigrantselectioncouldbebeneficial.Indeed,thepastdecadehasseen
the introductionofanumberofnewskilled immigrationprogramseasingthetransitiontopermanent
16AdministrativedatafromtheU.S.OfficeofImmigrationStatisticsindicatethatsomewherebetween75%and
90%ofnewskill-streampermanentresidentsintheU.S.between2001and2011transitionedfromatemporary
workpermitorstudentvisa(seeYearbookofImmigrationStatistics,HomelandSecurity,variousyears).Incontrast,
overthesameperiod,between10%and25%ofCanadianskilled-streamimmigrantstransitionedfromaworkor
studentvisa(seeFactsandFigures,Immigration,Refugees,andCitizenshipCanada,variousyears).

17
residencyforindividualswithCanadianworkexperienceandjoboffersfromCanadianemployers.17Time
willtellwhethertheseprogramshavebeensuccessfulinraisingtheSTEM-employmentratesofCanada’s
STEM-educatedimmigrantsand,inturn,thecontributionofCanadianimmigrationtoinnovation.
17TheseprogramsincludetheCanadianExperienceClassprogramintroducedin2008,ProvincialNominee
Programs(Ontariowasthelastprovincetointroduceaprogramin2007),andtheExpressEntrySystemfor
processingapplicationsforpermanentresidency,whichwasintroducedin2015.

18
References
Beckstead,D,andG.Gellatly (2006), “Innovationcapabilities: scienceandengineeringemployment in
CanadaandtheUnitedStates,”StatisticsCanadaResearchPaper.
Card, D. (2001), “Immigrant Inflows, Native Outflows, and the Local Market Impacts of Higher
Immigration,”JournalofLaborEconomics19(1):22-64.
Carley,M.,D.Hegde,andA.Marco(2013),“WhatistheprobabilityofreceivingaU.S.patent?,”USPTO
EconomicWorkingPaper.
Chellaraj,G.,K.E.Maskus,andA.Mattoo(2008),“TheContributionofInternationalGraduateStudents
toUSInnovation,”ReviewofInternationalEconomics16(3):444–62.
Clarke,A.andM.Skuterud(2013),“WhyDoImmigrantWorkersinAustraliaPerformBetterThanThose
inCanada?IsittheImmigrantsorTheirLabourMarkets?”CanadianJournalofEconomics46(4):1431-1462.
Clarke,A.andM.Skuterud(2016),“AComparativeAnalysisof ImmigrantSkillsandTheirUtilization in
Australia,Canada,andtheUSA”JournalofPopulationEconomics29(3):849-882.
Ely,R.andD.Thomas(2001),“CulturalDiversityatWork:TheEffectsofDiversityPerspectivesonWork
GroupsProcessesandOutcomes,”AdministrativeScienceQuarterly46(2):229-273.
Green A. and D. Green (2004), “The Goals of Canada’s Immigration Policy: A Historical Perspective,”
CanadianJournalofUrbanResearch13(1):102-139.
Green,DavidandChrisWorswick(2012),“Immigrantearningsprofilesinthepresenceofhumancapital
investment:Measuringcohortandmacroeffects,”LabourEconomics19:241-259.
Herring,C. (2009), “DoesDiversityPay?Race,Gender,and theBusinessCase forDiversity,”AmericanSociologicalReview74(2):208-224.
Hunt, J. andM.Gauthier-Loiselle (2010), “HowMuchDoes ImmigrationBoost Innovation?”AmericanEconomicJournal:Macroeconomics2:31-56.
KerrW. andW. Lincoln (2010). “The Supply Side of Innovation: H – 1B Visa Reforms andU.S. Ethnic
Invention,”JournalofLaborEconomics28(3):473-508.
NathanM. (2014a),“SameDifference?MinorityEthnic Inventors,Diversityand Innovation in theUK,”
JournalofEconomicGeography15(1):129-168.
Nathan,M.(2014b),“TheWiderEconomicImpactsofHigh-SkilledMigrants:ASurveyoftheLiteraturefor
ReceivingCountries,”IZAJournalofMigration3(4):1-20.
Oreopoulos,P.(2011),“WhyDoSkilledImmigrantsStruggleintheLaborMarket?AFieldExperimentwith
ThirteenThousandResumes,”AmericanEconomicJournal:EconomicPolicy3:148-171.
Ozgen C., P. Nijkamp, and J. Poot, (2012), “Immigration and Innovation in European Regions,” in P.
Nijkamp, J. Poot, M. Sahin (eds.), Migration Impact Assessment: New Horizons, Edward Elgar,Cheltenham.

19
Parrotta, P., D. Pozzoli, and M. Pytlikova (2014), “The Nexus Between Labor Diversity and Firm’s
Innovation,”JournalofPopulationEconomics27:303-364.
Peri, G. (2007), “Higher Education, Innovation and Growth,” in Education and Training in Europe, G.Brunello,P.Garibaldi,andEtienneWasmer(eds.),Oxford:OxfordUniversityPress,56-70.
Picot,G.andA.Sweetman(2012),“MakingItinCanada:ImmigrationOutcomesandPolicies,”IRPPStudy,no.29.
Richard,O.,A.McMillan,K.Chadwick,andS.Dwyer(2003),“EmployinganInnovationStrategyinRacially
DiverseWorkforces,”GroupandOrganizationManagement28(1):107-126.
Skuterud,M.andM.Su(2012),““TheInfluenceofMeasurementErrorandUnobservedHeterogeneityin
Estimating Immigrant Returns to Foreign and Host-Country Sources of Human Capital,” EmpiricalEconomics43(3):1109-1141.
VanKnippenberg,D.,DeDreu,C.,andA.Homan(2004),“WorkGroupDiversityandGroupPerformance:
AnIntegrativeModelandResearchAgenda,”JournalofAppliedPsychology89(6):1008-1022.
Xu, Li (2012), “Who Drives a Taxi in Canada?” Research and Evaluation Branch, Citizenship and
ImmigrationCanada.

Figure1:University-educatedimmigrantpopulationsharesandpatentspercapita,CanadaandtheUSA,1980-2006
Notes:ForeachofCanadaandtheU.S.thefigurepresentstheshareofthepopulationaged25andoverthatiscomprisedofuniversity-educatedimmigrants
(lefthandsideaxis)andthenumberofUSPTOpatentsgrantedtoCanadianandU.S.inventorsper100,000population(righthandsideaxis).Forthelatter
series,theyearistheapplicationyearofthepatent.Fractionalpatentswereawardedtoeachcountrywhenthepatenthadmultipleinventorsfromdifferent
countries.OnlypatentsgranteduptoNovember2014weretabulated.Forbothcountries,boththeshareofUniversity-educatedimmigrantsandpatentsper
capitashowanoverallincrease.
010
2030
4050
Pate
nts
per c
apita
(x 1
00,0
00)
0.0
1.0
2.0
3.0
4.0
5.0
6.0
7U
nive
rsity
-edu
cate
d im
mm
igra
nt s
hare
1980 1986 1991 1996 2001 2006
CA immigrants US immigrants CA patents US patents

21
Table1:Population-weightedsamplemeansbyCensusyear
1981 1986 1991 1996 2001 2006 2006–1981/6
difference
Patents 489.7 744.2 1055.2 1553.1 1755.9 1668.7 1179.0***
Patentspercapita(x100,000) 42.2 58.5 74.0 105.8 113.2 103.0 60.8***
Population 971,384 1,074,428 1,169,049 1,277,834 1,383,794 1,504,691 533,307***
Immigrantpopulationshare 0.223 0.219 0.231 0.247 0.255 0.268 0.046**
- Universityeducated 0.027 0.030 0.037 0.047 0.060 0.076 0.050***
- UniversitySTEMeducated -- 0.010 0.012 0.016 0.022 0.030 0.020***
- Canadian-universitySTEMeducated -- 0.005 0.006 0.008 0.10 0.013 0.008***
- Foreign-universitySTEMeducated -- 0.005 0.006 0.008 0.012 0.017 0.012***
- Universityeducated&STEMemployed 0.004 0.004 0.005 0.006 0.009 0.011 0.007***
- UniversitySTEMeducated&STEMemployed 0.003 0.004 0.005 0.008 0.010 0.006***
Native-bornpopulationshare 0.777 0.781 0.769 0.753 0.745 0.732 -0.046**
- Universityeducated 0.073 0.087 0.102 0.115 0.128 0.142 0.069***
- UniversitySTEMeducated -- 0.019 0.021 0.022 0.025 0.027 0.008***
- Universityeducated&STEMemployed 0.007 0.008 0.009 0.010 0.013 0.014 0.007***
- UniversitySTEMeducated&STEMemployed 0.006 0.007 0.008 0.009 0.010 0.004***
Meanage 32.6 33.7 34.6 35.4 36.7 38.0 5.3***
Meanincome 9222 13,398 18,385 19,430 24,032 28,947 19,725***
Employmentrate 0.659 0.657 0.672 0.652 0.688 0.700 0.041***
Expectedpatentspercapita(x100,000) 42.2 58.4 73.9 105.7 113.1 102.9 60.7***
Observations 98 98 98 98 98 98 196
Notes:SamplemeansofvariablesusedintheregressionsbyCensusyear.Themeansareweightedbycitypopulationssothattheyarerepresentativeofthe
CanadianpopulationresidingwithinoneofCanada’slargest98cities.PatentsarethecumulativesumofannualpatentsinthefiveyearsfollowingeachCensus
year.Populationsharesarecalculatedasthefractionofindividualsaged15-70thatfallineachcategory.The1981CanadianCensusdoesnotreportfieldof
study.Incomesarenotdeflated.Expectedpatentspercapitacontrolsforthenumberofpatentsthateachcitywouldhavebasedonitsdistributionof1972-
1980patentsacrossdifferentpatentclassesandthesubsequentnational-levelgrowthinthenumberofpatentsforeachofthosepatentclassesacrossCensus
years.*p<.10,**p<.05,***p<.01.

22
Table2:ConditionalprobabilitiesofSTEMeducationandSTEMemploymentforimmigrantsandnatives
1986 1991 1996 2001 2006 2006–1981
difference
Immigrants
Pr[Universityeducated] 0.138 0.160 0.188 0.233 0.285 0.165
Pr[STEMeducated|universityeducated] 0.324 0.328 0.337 0.374 0.387 0.062
Pr[Canadianeducation|STEMuniversityeducated] 0.505 0.519 0.500 0.447 0.429 -0.076
Pr[Foreigneducation|STEMuniversityeducated] 0.495 0.481 0.500 0.553 0.571 0.076
Pr[STEMemployed|STEMuniversityeducated] 0.348 0.338 0.311 0.345 0.322 -0.026
Pr[STEMemployed|CanadianSTEMuniversityeducated] 0.363 0.355 0.322 0.343 0.343 -0.019
Pr[STEMemployed|ForeignSTEMuniversityeducated] 0.333 0.320 0.301 0.347 0.307 -0.027
Natives
Pr[Universityeducated] 0.112 0.132 0.153 0.172 0.194 0.101
Pr[STEMeducated|universityeducated] 0.214 0.202 0.193 0.195 0.191 -0.023
Pr[STEMemployed|STEMuniversityeducated] 0.342 0.355 0.355 0.370 0.370 0.028
Notes:Conditionalprobabilitiesconstructedusingthemeanpopulationshares(weightedbypopulationsize)forindividualsaged15-70acrossCanada’slargest
98cities.Canadianimmigrantsaremorelikelytoholdauniversitydegreethantheirnative-borncounterpartsandthisdifferencehasgrownovertime.
University-educatedimmigrantsarealsomorelikelytobeeducatedinaSTEMfieldthantheirnative-borncounterpartsandthisdifferencehasalsobecome
largerovertime.However,theprobabilityofaSTEM-university-educatedimmigrantbeingemployedinaSTEMoccupationhastendedtodecreaseovertime,
whereasithasincreasedfornatives.Thissuggestsaneducation-jobmismatchforimmigrants.
23
Table3:WLS-FDestimatesoftheeffectofuniversity-educatedanduniversity-educated-STEM-employedimmigrantpopulationsharesonlogpatentspercapita
University-educated University-educated&STEM-employed
(1) (2) (1) (2)
Immigrantpopulationshare 1.118
(1.677)
3.508
(2.992)
7.276
(7.915)
21.743*
(12.887)
Nativepopulationshare
4.457*
(2.391)
3.315
(3.303)
6.328
(9.318)
19.007*
(11.415)
Logmeanage 0.494
(1.257)
-0.589
(1.507)
0.772
(1.228)
-0.431
(1.452)
Logpopulation(1981) 0.003
(0.008)
-0.006
(0.012)
0.006
(0.008)
-0.009
(0.013)
Logmeanincome(1981) 0.053
(0.112)
-- 0.005
(0.113)
--
Logmeanincome -- -0.028
(0.607)
-- -0.521
(0.630)
Employmentrate -- -0.094
(1.266)
-- -0.034
(1.275)
Logexpectedpatentspercapita -- 0.202*
(0.116)
-- 0.231*
(0.118)
Yearfixedeffects Yes No Yes No
Year-regionfixedeffects No Yes No Yes
R-squared 0.285 0.332 0.284 0.340
Numberofobservations 490 490 490 490
Notes:Weightedleastsquares(observationsareweightedbycitypopulation)regressionswithfiveyearfirstdifferences.Thedependentvariableisthelogof
patentspercapita.Standarderrorsareclusteredbycity.ThesampleconsistsofCanada’s98largestcitiesand1986-1981,1991-1986,1996-1991,2001-1996,
and2006-2001firstdifferences.Specification(1)attemptstorecreatethespecificationinHGLwhilespecification(2)includesarichersetofcontrols.*p<.10,
**p<.05,***p<.01.

24
Table4:WLS-FDestimatesoftheeffectofuniversity-educated,university-STEM-educated,anduniversity-education-STEM-employedimmigrantpopulation
sharesonlogpatentspercapita
University-educated University-STEM-educated University-STEM-educated University-STEM-educated
&STEM-employed
(1) (2) (1) (2) (1) (2) (1) (2)
Immigrantpopulationshare -1.026
(1.800)
0.511
(3.417)
-3.342
(3.628)
1.093
(4.855)
-- -- 9.265
(13.658)
36.341*
(19.855)
ImmigrantCanadianuniversity -- -- -- -- 4.295
(29.814)
3.406
(42.164)
-- --
Immigrantforeignuniversity -- -- -- -- -5.686
(8.282)
0.309
(13.952)
-- --
Nativepopulationshare 5.389*
(3.096)
4.156
(4.210)
16.784*
(9.148)
19.109*
(10.661)
16.525*
(9.112)
19.013*
(10.340)
17.563
(16.666)
26.522
(20.611)
Logmeanage -.260
(1.476)
-1.814
(1.801)
-0.452
(1.397)
-1.825
(1.709)
-0.357
(1.349)
-1.817
(1.676)
0.456
(1.428)
-1.331
(1.714)
Logpopulation(1981) 0.020**
(0.010)
0.009
(0.014)
0.020*
(0.11)
0.007
(0.013)
0.018
(0.015)
0.007
(0.019)
0.016
(0.010)
-0.013
(0.016)
Logmeanincome(1981) 0.072
(0.119)
-- 0.072
(0.120)
-- 0.066
(0.122)
-- -0.034
(0.126)
--
Logmeanincome
-- -0.166
(0.649)
-- -0.258
0.608
-- -0.261
(0.597)
-- -0.874
(0.697)
Employmentrate --
-0.929
(1.314)
-- -1.045
(1.307)
-- -1.027
(1.251)
-- -0.632
(1.337)
Logexpectedpatentspercapita --
0.147
(0.117)
-- 0.154
(0.119)
-- 0.153
(0.116)
-- 0.181
(0.123)
Yearfixedeffects Yes No Yes No Yes No Yes No
Year-regionfixedeffects No Yes No Yes No Yes No Yes
R-squared 0.253 0.284 0.253 0.287 0.254 0.287 0.250 0.297
Numberofobservations
392 392 392 392 392 392 392 392
Notes:Weightedleastsquares(observationsareweightedbycitypopulation)regressionswithfive-yearfirstdifferences.Thedependentvariableisthelogof
patentspercapita.Standarderrorsareclusteredbycity.ThesampleconsistsofCanada’s98largestcitiesand1991-1986,1996-1991,2001-1996,and2006-
2001first-differences,sincefieldofstudyinformationisnotavailableinthe1981Census.Specifications(1)attempttorecreatethespecificationinHGLwhile
specifications(2)includearichersetofcontrols.*p<.10,**p<.05,***p<.01

25
Table5:IV(2SLS)estimatesoftheeffectofuniversity-educatedanduniversity-educated-STEM-employedimmigrantpopulationsharesonlogpatentsper
capita
University-educated University-educated&STEM-employed
(1) (2) (1) (2)
Immigrantpopulationshare 2.870
(4.393)
1.060
(5.656)
8.730
(11.347)
10.404
(13.912)
Nativepopulationshare
5.350
(3.650)
2.006
(4.288)
5.964
(8.981)
20.388*
(11.115)
Logmeanage 0.733
(1.409)
-0.725
(1.451)
0.828
(1.294)
-0.549
(1.400)
Logpopulation(1981) -0.002
(0.015)
0.004
(0.022)
0.006
(0.009)
-0.001
(0.011)
Logmeanincome(1981) 0.027
(0.107)
-- -0.001
(0.113)
--
Logmeanincome -- 0.121
(0.613)
-- -0.259
(0.580)
Employmentrate --
-0.235
(1.251)
-- -0.212
(1.257)
Logexpectedpatentspercapita --
0.202*
(0.111)
-- 0.221**
(0.109)
Yearfixedeffects Yes No Yes No
Year-regionfixedeffects No Yes No Yes
R-squared 0.285 0.331 0.284 0.338
Numberofobservations 490 490 490 490
Firststage:
Exp.ImmigrantShare
0.622***
(0.157)
0.588***
(0.144)
0.943***
(0.327)
0.908***
(0.194)
Fstatistic 64.90 345.39 32.01 189.69
Notes:Weinstrumentlocalskilledimmigrantpopulationsusingpredictedimmigrantpopulationsbasedonthehistoricalcity-levelsettlementpatternsof
immigrantsfromparticularorigincountriesandnational-levelpopulationsofimmigrantsfromthosecountries.Estimatesarefromtwo-stageleastsquare.
Observationsareweightedbycitypopulation.Standarderrorsareclusteredbycity.ThesampleconsistsofCanada’s98largestcitiesand1986-1981,1991-
1986,1996-1991,2001-1996,and2006-2001firstdifferences.Specifications(1)attempttorecreatethespecificationinHGLwhilespecifications(2)includea
richersetofcontrols.*p<.10,**p<.05,***p<.01.

26
Appendix
STEMfieldsofstudyintheCanadianCensusdataareidentifiedusinginformationonmajorfieldofstudy(MFS),whichisidentifiedforall
individualswhohavecompletedapost-secondaryprogramofstudy.MajorfieldofstudyiscodedusingaMFSclassificationsystemduringthe
censusyears1986,1991,1996and2001,whilein2006itiscodedaccordingClassificationofInstructionalProgram(CIP)Canada2000.
Therefore,weusetheMFSclassificationasthemastercodeandmaptheCIPtoMFS,andthenselectthestudyfieldsfromMFStoidentifySTEM
fields.
ToconstructaconcordancebetweenMFSandCIP,wemakeuseoftheempiricalconcordancesfromCIPtoMFSprovidedbyStatisticsofCanada
(http://www12.statcan.ca/census-recensement/2006/ref/dict/app-ann020-eng.cfm).Theempiricalconcordancesprovidemappingsofthe
distributionalrelationshipsbetweenthetwoclassifications.Thedetailsaredescribedonthewebsite.TherearethreelevelsofMFSandCIP
groupingsrespectively,correspondingly,threeconcordancesareprovidedforeachgrouplevel:CIPprimarygroupings-MFSmajorlevel(level1),
CIPsubseries(4digit)andMFSminorlevel(level2),andCIPinstructionalprograms(6digit)andMFSunitlevel(level3).Intheseconcordances,
asharevariableiscalculatedasthepercentageoftotalCIPthatisaccountedforbythespecificMFScode.ThusforeachCIP,thesharesaddup
to1.AhighersharevalueindicatesamorefrequentoccurringofaMFSinaCIP.
OurstrategyistotakethesharevariableforeachCIPandapplythemodemethod.Inparticular,westartfromthelevel3concordance(theleast
aggregatedcategories),andmapaCIPtoaMFSwhichreturnsahighestsharevaluegiventhatparticularCIP.IftherearesomeCIPcategories
notmappedtoMFSinlevel3concordances,wethenusethelevel2concordancesandapplythesamemethod,andthenlevel1(Atlast,there
arequitefewCIPcategoriesnotbeingmapped,wethenreadthedescriptionsonthoseCIPvariablesandmapthemtoMFSmanually.).Alistof
theconcordanceisprovidedinTable3.Consequently,theSTEMfieldismadeupbyfourmajorMFScategories:‘Agricultural,biological,
nutritionalandfoodsciences’,‘Engineeringandappliedsciences’,‘Appliedsciencestechnologiesandtrade;Mathematics’,and‘Computerand
physicalsciences’.
TheSTEMoccupationvariableisconstructedbasedontheoccupationinformationineachcensusfile.Tobespecific,1980standardoccupational
classification(occ81)systemisusedin1981and1986censusfilesrespectively,and1991standardoccupationalclassification(soc91)systemis
usedin1991,1996,2001and2006censusfilesrespectively.Accordingly,in1981and1986censusfiles,theSTEMoccupationisidentifiedifthe
variableocc81fallsintothecategory‘MajorGroup21–OccupationsinNaturalsciences,engineeringandmathematics’;whileintherestcensus
files,theSTEMoccupationisidentifiedifthevariablesoc91fallsintothecategory‘C-NaturalandAppliedSciencesandRelatedOccupations’.

27
TableA1:SamplewithoutToronto-FDestimatesoftheeffectofuniversity-educatedanduniversity-educated-STEM-employedimmigrantpopulationshares
onlogpatentspercapita
University-educated University-educated&STEM-employed
(1) (2) (1) (2)
Immigrantpopulationshare 2.838
(2.956)
7.733*
(4.518)
26.339*
(15.077)
42.861***
(15.573)
Nativepopulationshare
3.831
(2.789)
2.917
(3.281)
-5.397
(12.961)
10.906
(13.532)
Logmeanage 0.305
(1.222)
-0.212
(1.448)
0.665
(1.157)
-0.082
(1.391)
Logpopulation(1981) 0.008
(0.010)
-0.008
(0.014)
0.015
(0.010)
-0.006
(0.011)
Logmeanincome(1981) 0.031
(0.122)
-- -0.046
(0.121)
--
Logmeanincome -- -0.490
(0.688)
-- -1.130
(0.764)
Employmentrate -- 0.746
(1.313)
-- 1.094
(1.253)
Logexpectedpatentspercapita -- 0.167
(0.109)
-- 0.196*
(0.109)
Yearfixedeffects Yes No Yes No
Year-regionfixedeffects No Yes No Yes
R-squared 0.259 0.305 0.263 0.318
Numberofobservations 485 485 485 485
Notes:Weightedleastsquares(observationsareweightedbycitypopulation)regressionswithfiveyearfirstdifferences.Thedependentvariableisthelogof
patentspercapita.Standarderrorsareclusteredbycity.ThesampleconsistsofCanada’s97largestcitieswiththeexceptionofTorontoand1986-1981,1991-
1986,1996-1991,2001-1996,and2006-2001firstdifferences.Specifications(1)attempttorecreatethespecificationinHGLwhilespecifications(2)includea
richersetofcontrols.
*p<.10,**p<.05,***p<.01

28
TableA2:Sampleofcitieswithapopulationofatleast40,000in1981–UnweightedFDestimatesoftheeffectofuniversity-educatedanduniversity-educated-
STEM-employedimmigrantpopulationsharesonlogpatentspercapita
University-educated University-educated&STEM-employed
(1) (2) (1) (2)
Immigrantpopulationshare 7.146
(6.062)
8.788
(6.527)
38.742*
(19.393)
30.638
(20.571)
Nativepopulationshare
8.605**
(4.256)
5.191
(5.473)
20.399
(23.722)
29.476
(26.300)
Logmeanage -0.330
(1.898)
-1.782
(2.035)
0.113
(1.931)
-1.495
(2.119)
Logpopulation(1981) -0.004
(0.022)
-0.024
(0.023)
0.007
(0.017)
-0.013
(0.014)
Logmeanincome(1981) -0.260
(0.244)
-- -0.299
(0.237)
--
Logmeanincome -- 1.004
(0.825)
-- 0.760
(0.880)
Employmentrate -- -1.027
(2.300)
-- -0.995
(2.243)
Logexpectedpatentspercapita -- 0.116
(0.140)
-- 0.146
(0.144)
Yearfixedeffects Yes No Yes No
Year-regionfixedeffects No Yes No Yes
R-squared 0.241 0.346 0.243 0.352
Numberofobservations 265 265 265 265
Notes:OLSfirst-differenceregressions.Thedependentvariableisthelogofpatentspercapita.Standarderrorsareclusteredbycity.Thesampleconsistsof
the53citieswithapopulationofatleast40,000in1981and1986-1981,1991-1986,1996-1991,2001-1996,and2006-2001firstdifferences.Specifications(1)
attempttorecreatethespecificationinHGLwhilespecifications(2)includearichersetofcontrols.
*p<.10,**p<.05,***p<.01


