1 DIMA Quick Start USDA‐ARS Jornada Experimental Range Box 3003, MSC 3JER New Mexico State University Las Cruces, NM 88003‐0003 575‐646‐4147 http://jornada.nmsu.edu/monit‐assess/dima Using the Database for Inventory, Monitoring and Assessment for the BLM AIM Strategy
Transcript
1
DIMA Quick Start
USDA‐ARS Jornada Experimental Range
Box 3003, MSC 3JER
New Mexico State University
Las Cruces, NM 88003‐0003
575‐646‐4147
http://jornada.nmsu.edu/monit‐assess/dima
Using the Database for
Inventory, Monitoring
and Assessment for the
BLM AIM Strategy
2
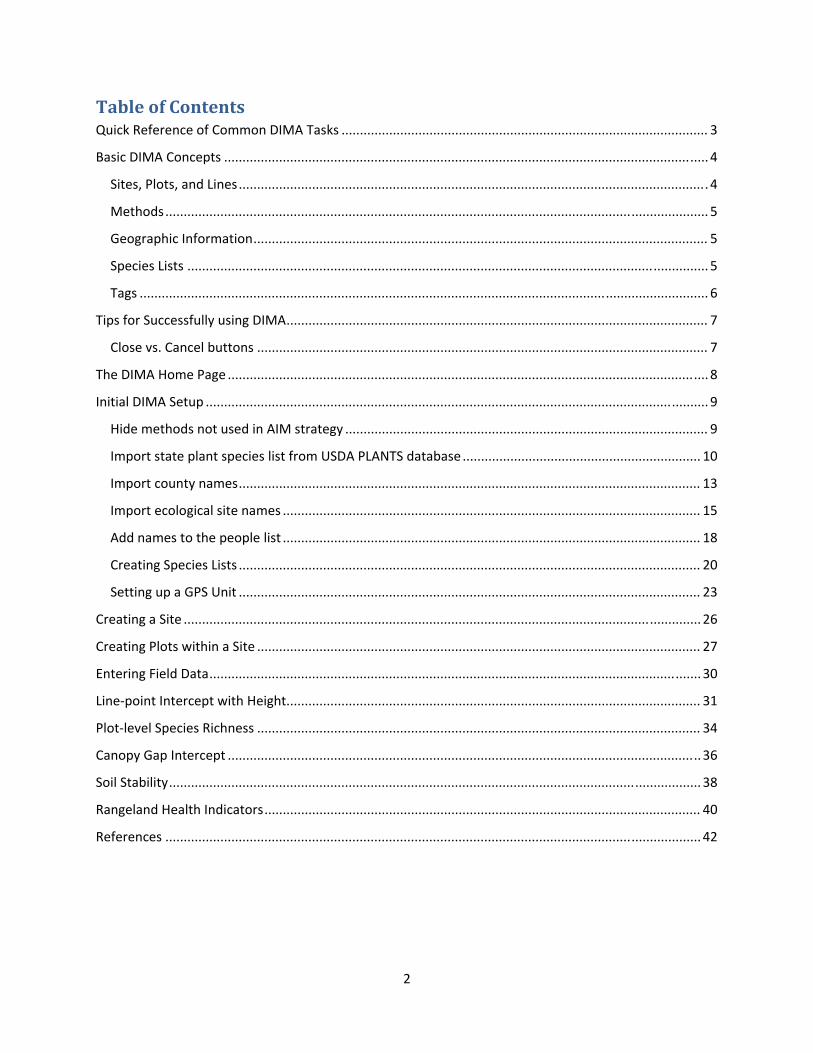
Table of Contents Quick Reference of Common DIMA Tasks .................................................................................................... 3
Geographic Information ............................................................................................................................ 5
Species Lists .............................................................................................................................................. 5
Tips for Successfully using DIMA ................................................................................................................... 7
Close vs. Cancel buttons ........................................................................................................................... 7
The DIMA Home Page ................................................................................................................................... 8
Hide methods not used in AIM strategy ................................................................................................... 9
Import state plant species list from USDA PLANTS database ................................................................. 10
Import county names .............................................................................................................................. 13
Import ecological site names .................................................................................................................. 15
Add names to the people list .................................................................................................................. 18
Creating Species Lists .............................................................................................................................. 20
Setting up a GPS Unit .............................................................................................................................. 23
Creating a Site ............................................................................................................................................. 26
Creating Plots within a Site ......................................................................................................................... 27
Entering Field Data ...................................................................................................................................... 30
Line‐point Intercept with Height................................................................................................................. 31
Plot‐level Species Richness ......................................................................................................................... 34
Canopy Gap Intercept ................................................................................................................................. 36
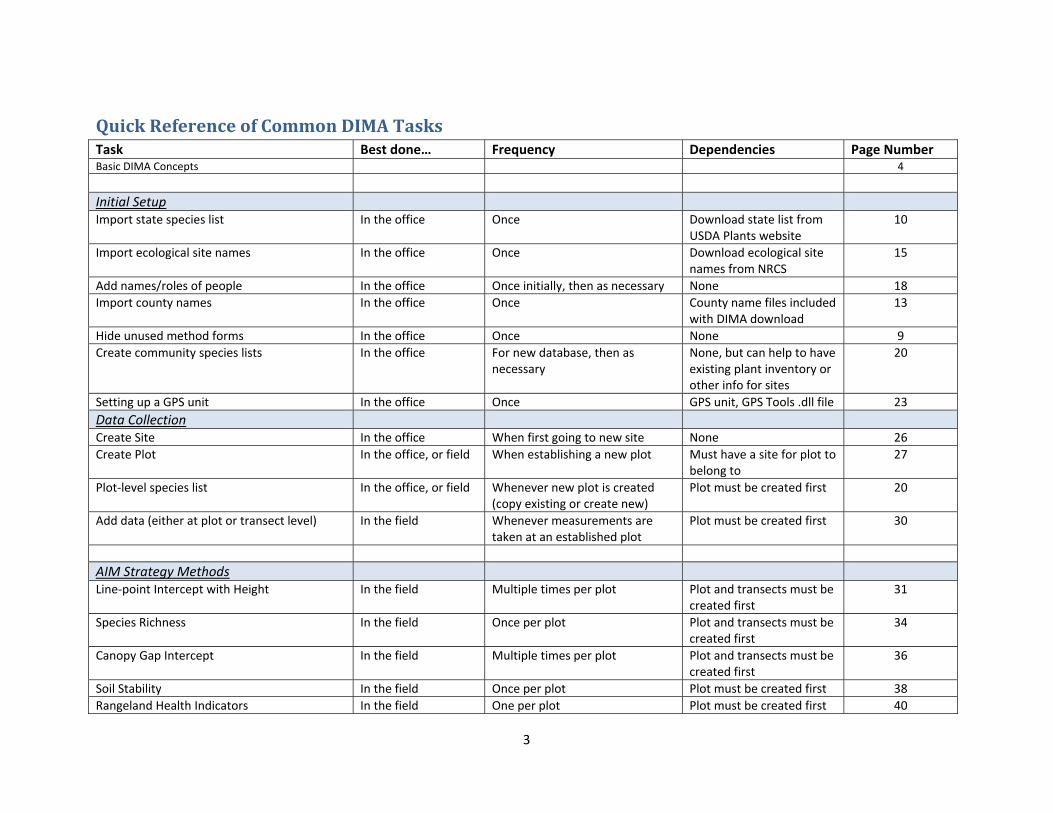
Initial DIMA Setup The steps below should be followed to set up a new DIMA database for use. An internet connection is
needed for some of these steps, so they are best done while in the office before going out to the field.
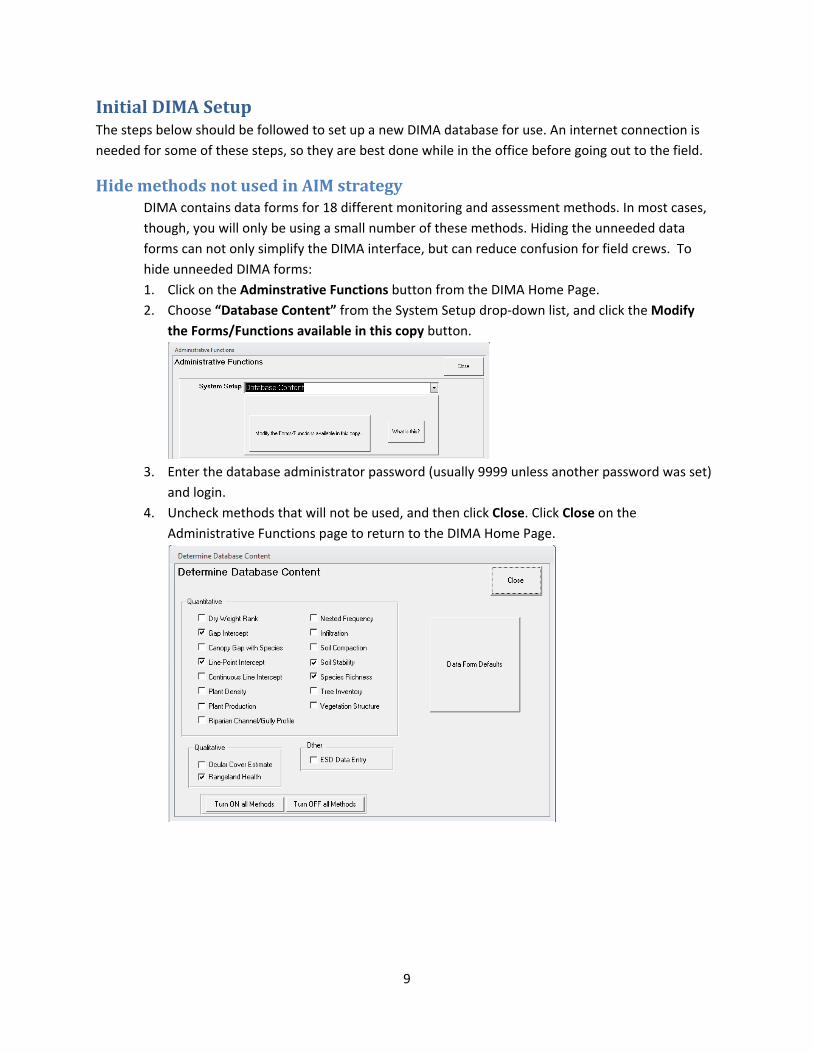
Hide methods not used in AIM strategy DIMA contains data forms for 18 different monitoring and assessment methods. In most cases,
though, you will only be using a small number of these methods. Hiding the unneeded data
forms can not only simplify the DIMA interface, but can reduce confusion for field crews. To
hide unneeded DIMA forms:
1. Click on the Adminstrative Functions button from the DIMA Home Page.
2. Choose “Database Content” from the System Setup drop‐down list, and click the Modify
the Forms/Functions available in this copy button.
3. Enter the database administrator password (usually 9999 unless another password was set)
and login.
4. Uncheck methods that will not be used, and then click Close. Click Close on the
Administrative Functions page to return to the DIMA Home Page.
10
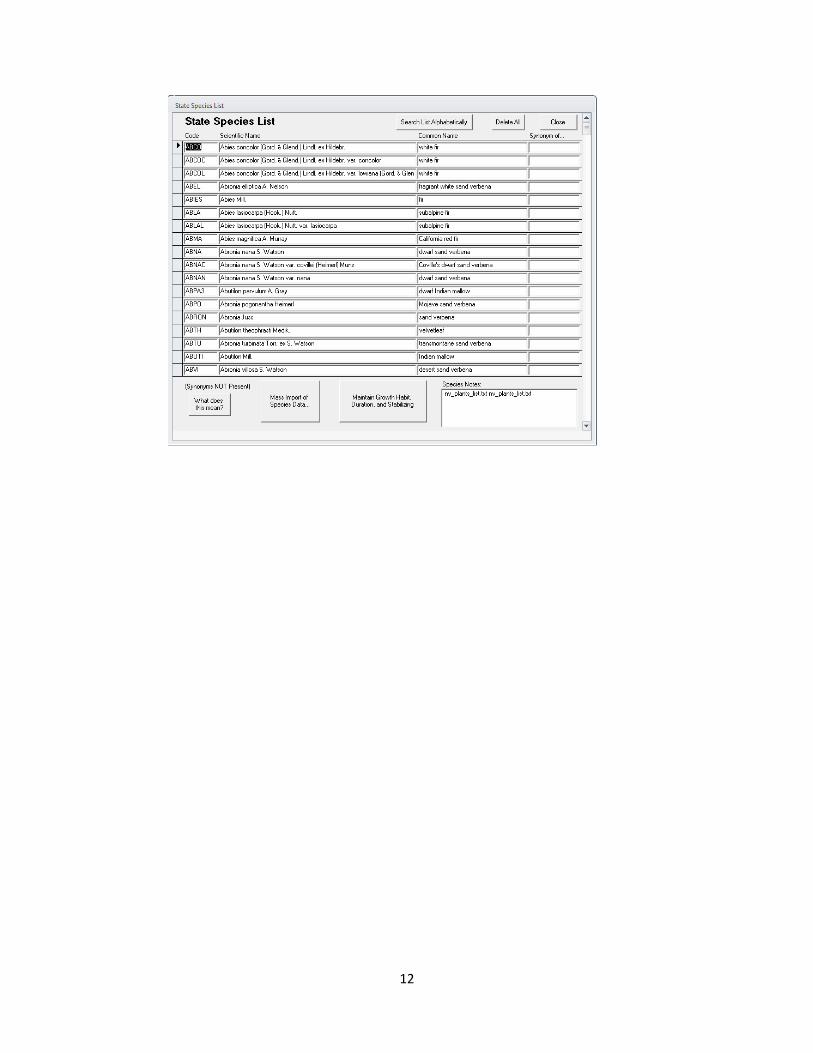
Import state plant species list from USDA PLANTS database In order to quickly create species lists and to maintain consistency and accuracy of plant codes,
DIMA uses the list of plants and codes for each state maintained by the USDA PLANTS database
(http://plants.usda.gov). Because these lists are large (thousands of plant species for each state)
and updated regularly, DIMA does not come pre‐loaded with a master plant species list. You will
need to download the species list for your state and load it into DIMA.
1. Click the Support Tables button from the DIMA Home Page
2. Click on the State Species List button in the center column of the Support Tables page.
3. Click on the Mass Import of Species Data… button at the bottom of the State Species List
page.
11
4. Open a web browser and go to the USDA PLANTS database state plant list page. Either click
on the “this site” link or enter in the URL shown in the Mass Import of Species Data page.
5. Right‐click in your web browser on the state you want a species list for and choose “Save
target as…” (Internet Explorer) or “Save link as…” (Firefox, Chrome) to save the state species
list to your computer. Note the directory where the file was saved.
6. Back in DIMA, click the Browse… button in the Mass Import of Species Data page and select
the state species list file you just downloaded. Click Open.
7. Click the Validate Plant list and import into this database… button.
8. Click Close on all the pages to return to the DIMA Home Page.
12
13
Import county names DIMA comes with a set of Excel files that contain the county names for each state, but these
must be loaded into DIMA before going out into the field.
1. Click on the Support Tables button on the DIMA Home Page
2. Click on the States/Counties button on the Support Tables page
3. Click on the Import Counties button on the States/Counties page
4. Click the Browse button. Navigate to the directory where DIMA is located and open the
Counties folder. Select the Excel file for the state you want and click Open.
14
5. Click the Do Import… button to import the counties
6. Click Close on all the pages to return to the DIMA Home Page.
15
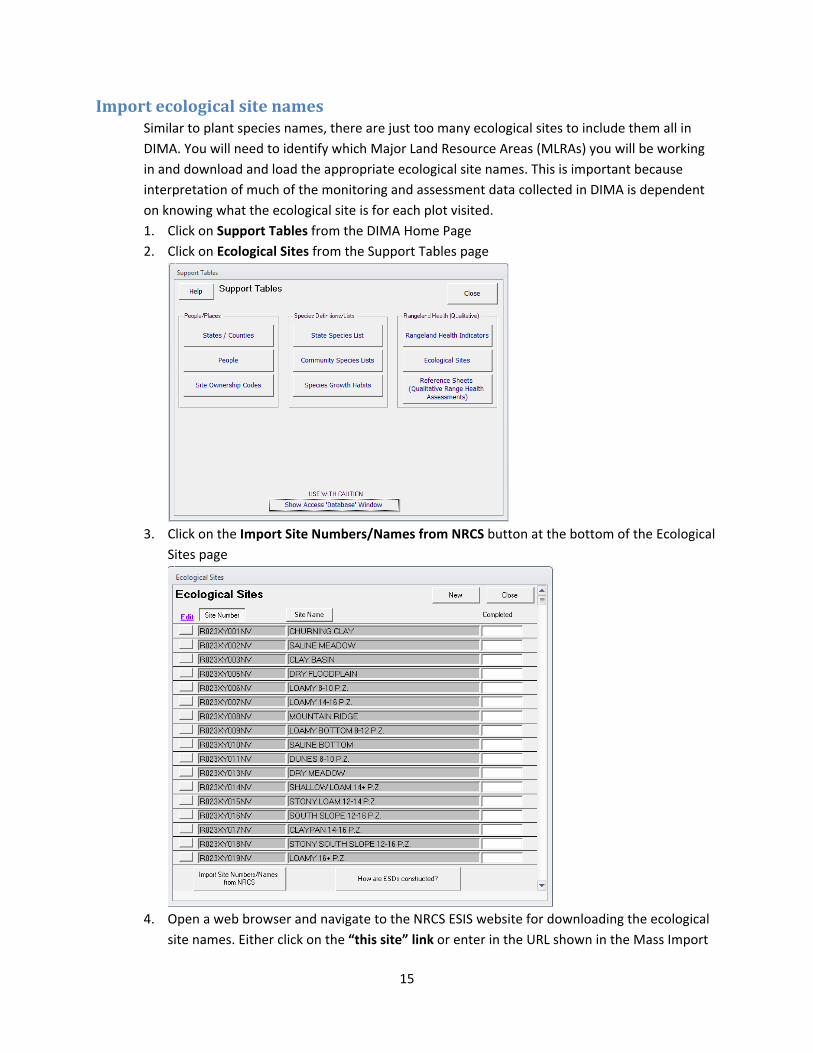
Import ecological site names Similar to plant species names, there are just too many ecological sites to include them all in
DIMA. You will need to identify which Major Land Resource Areas (MLRAs) you will be working
in and download and load the appropriate ecological site names. This is important because
interpretation of much of the monitoring and assessment data collected in DIMA is dependent
on knowing what the ecological site is for each plot visited.
1. Click on Support Tables from the DIMA Home Page
2. Click on Ecological Sites from the Support Tables page
3. Click on the Import Site Numbers/Names from NRCS button at the bottom of the Ecological
Sites page
4. Open a web browser and navigate to the NRCS ESIS website for downloading the ecological
site names. Either click on the “this site” link or enter in the URL shown in the Mass Import
16
of Species Data page.
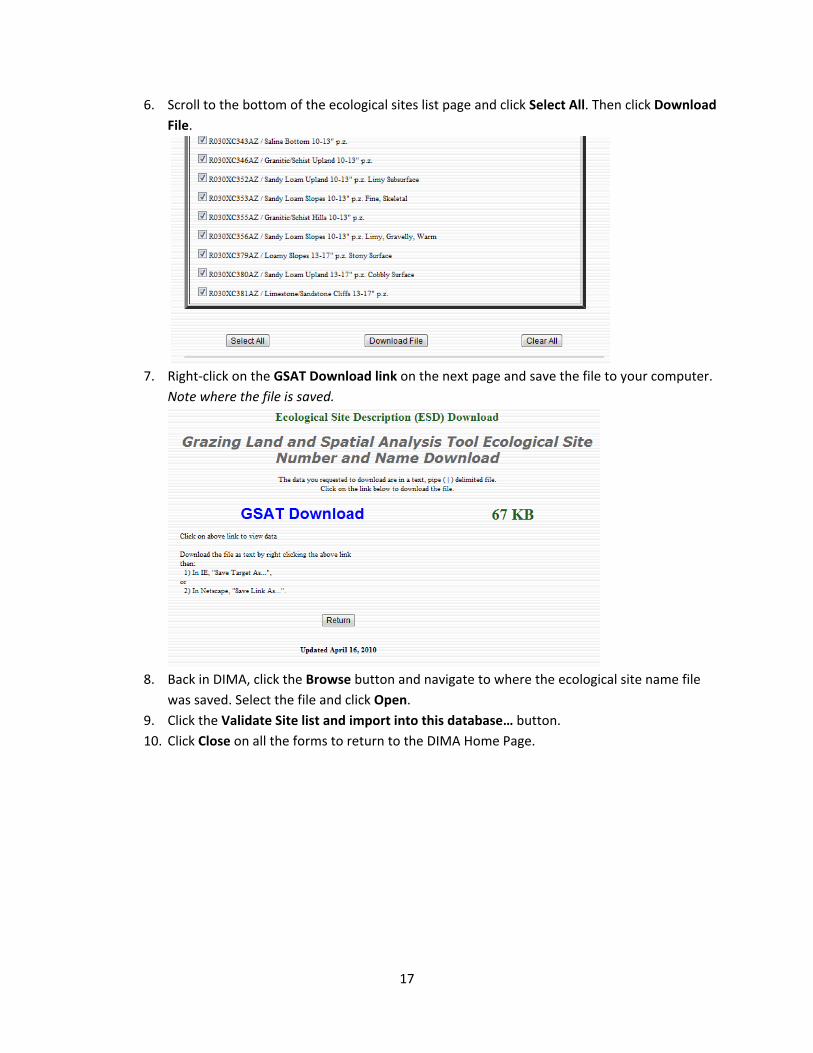
5. On the ESIS webpage, check Rangeland, select the MLRAs you need ecological sites for.
Check Ecological Site Number and Name as the download type, and then click Submit
17
6. Scroll to the bottom of the ecological sites list page and click Select All. Then click Download
File.
7. Right‐click on the GSAT Download link on the next page and save the file to your computer.
Note where the file is saved.
8. Back in DIMA, click the Browse button and navigate to where the ecological site name file
was saved. Select the file and click Open.
9. Click the Validate Site list and import into this database… button.
10. Click Close on all the forms to return to the DIMA Home Page.
18
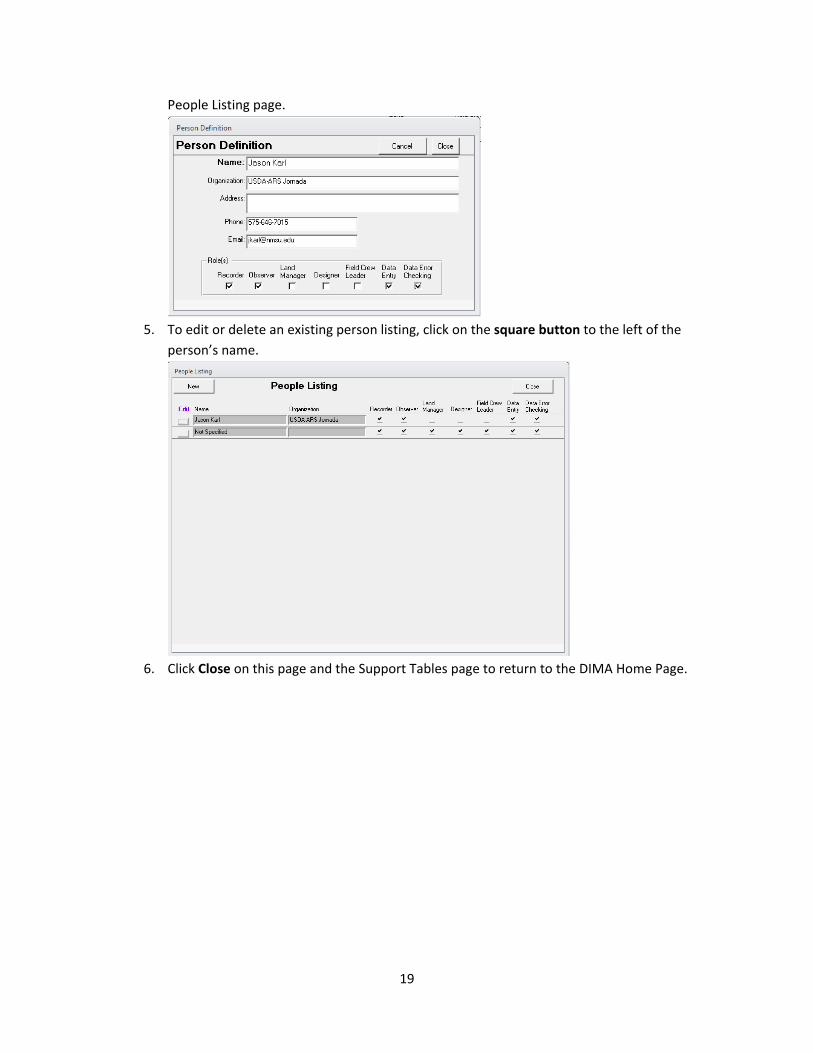
Add names to the people list DIMA records the names of people who have participated in data collection, review, and editing.
When using DIMA in the field, the data entry forms will be locked until the people who are
observing and recording the data are specified. The names and contact information of people
using DIMA should be entered before going out in the field.
1. Click Support Tables from the DIMA Home Page
2. Click the People button from the Support Tables page
3. Click New to add a person to the database.
4. Fill in information about the person who will be using DIMA and their roles. At a minimum, a
name must be provided. Click Close when finished to save the information and return to the
19
People Listing page.
5. To edit or delete an existing person listing, click on the square button to the left of the
person’s name.
6. Click Close on this page and the Support Tables page to return to the DIMA Home Page.
20
Creating Species Lists List of species found at particular sites or for plant communities are a central part of the DIMA
database. As you collect more and more data for plots in a site, the species lists for that site will
become more complete and you can just copy lists between similar plots (this saves a lot of
time). Initially, though, it pays to spend some time setting up a good species list to use for a plot.
This section covers creating a community species list, but the technique is the same if you are
creating a plot species list from scratch within the Plot Description page.
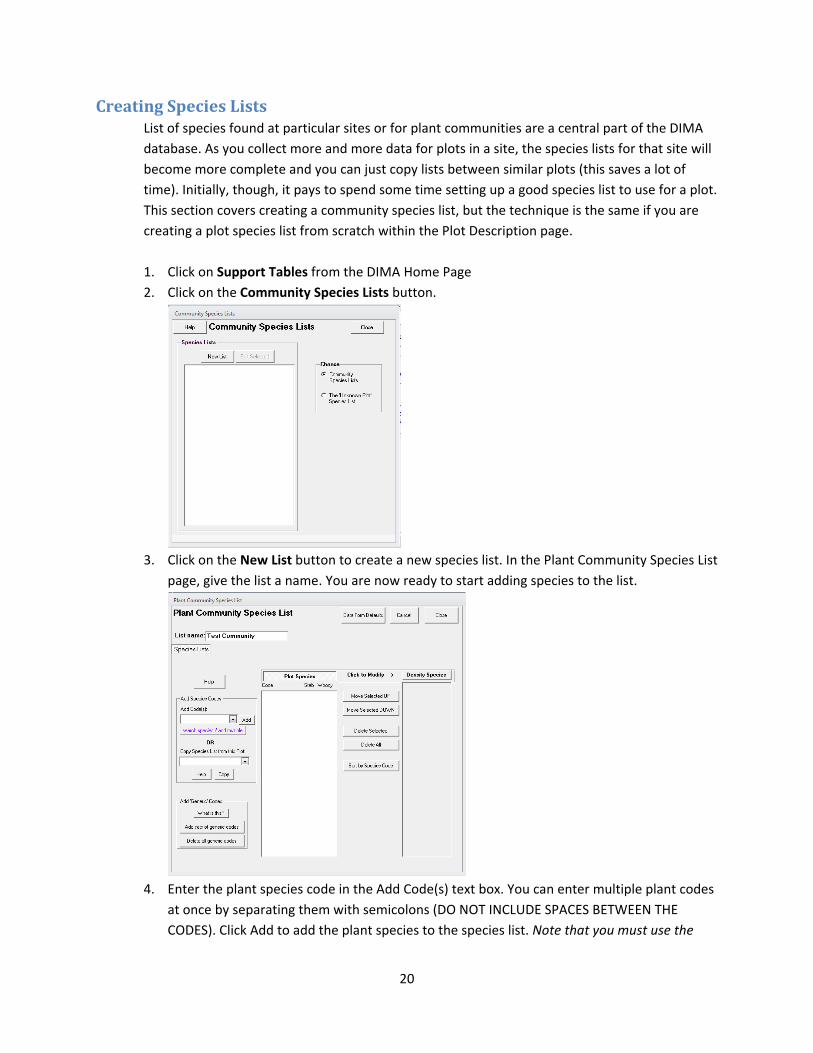
1. Click on Support Tables from the DIMA Home Page
2. Click on the Community Species Lists button.
3. Click on the New List button to create a new species list. In the Plant Community Species List
page, give the list a name. You are now ready to start adding species to the list.
4. Enter the plant species code in the Add Code(s) text box. You can enter multiple plant codes
at once by separating them with semicolons (DO NOT INCLUDE SPACES BETWEEN THE
CODES). Click Add to add the plant species to the species list. Note that you must use the
21
official plant codes recognized in the USDA PLANTS Database.
5. If you do not know the plant species codes or need to search for plant species, click the
search species/add multiple button. This will open a window where you can search by plant
code, scientific name, or common name.
6. Type the first letters of a name or plant code in the Beginning with: text box and click Go.
This will return a list of matching plants.
7. Find the species you’re looking for and click the square button to the left of its name to add
it to the Selected codes: list at the top.
8. Search for additional plants and click on their square buttons to add them to the selected
codes list.
22
9. When you are finished adding codes, click OK to add these species to your species list.
10. From the Plant Community Species List, you can do additional operations like copying a list
from an existing plot, sorting the species in the list to put common species at the top, or
delete species from the list.
11. Click Close when you are finished to save the list and return to the Support Tables page.
23
Setting up a GPS Unit One powerful feature of DIMA is that it can interface directly with a GPS unit that is either
built‐into a computer (i.e, tablet PC) or linked to the computer via a cable or wireless (e.g.,
Bluetooth) connection. The link between DIMA and a GPS unit is done by way of a third‐
party piece of software. This software does not require Windows installation, but it does
need to be registered to work with Access. The following steps will register the interface
software and set up the GPS unit in DIMA.
1. Click Administrative Functions from the DIMA Home Page.
2. Select GPS Device Management from the System Setup dropdown box and click the
Manage your GPS device button.
3. Select GPS is attached to this computer from the Mode dropdown box and then
click the Setup GPS tab.
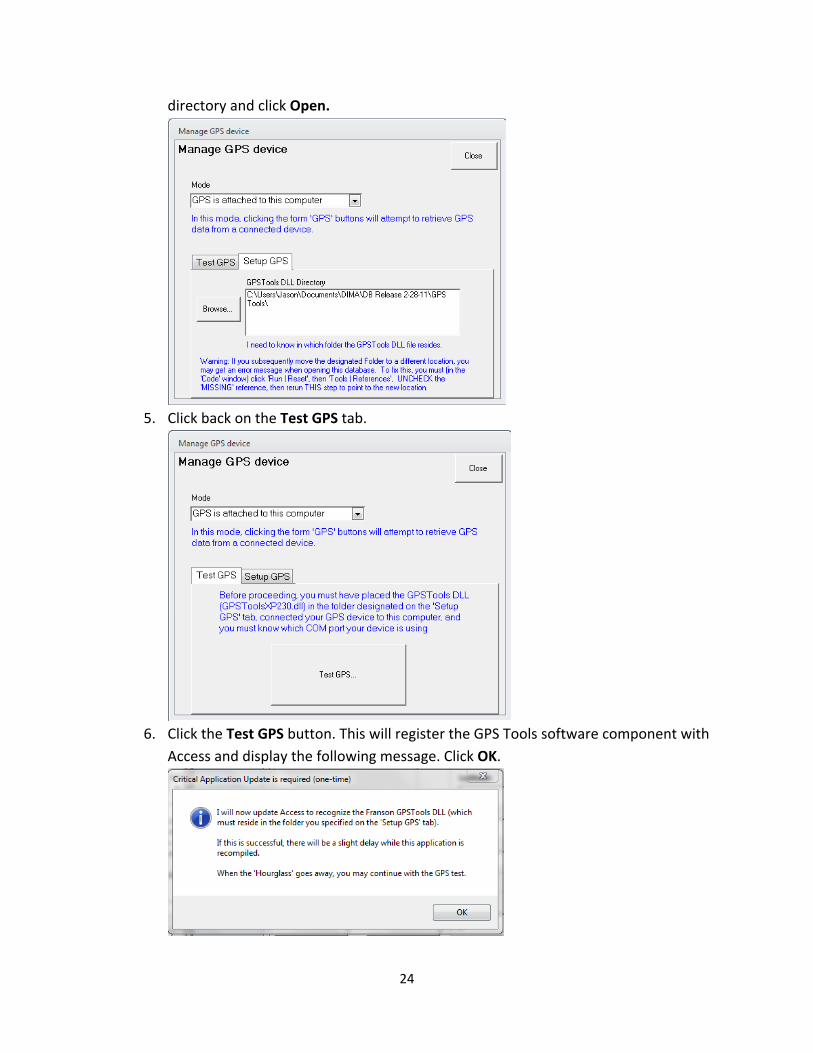
4. Click the Browse button on this page and navigate to the Directory where DIMA is
stored. In that location you should find a directory called GPS Tools. Select this
24
directory and click Open.
5. Click back on the Test GPS tab.
6. Click the Test GPS button. This will register the GPS Tools software component with
Access and display the following message. Click OK.
25
7. Click the Read GPS button to link to the GPS and acquire a coordinate reading. When
you are finished, click Accept.
With the GPS unit activated in DIMA, data forms that have fields for geographic
information (i.e., plots and lines/transects) will now display a GPS button that allows you
to acquire coordinate values directly from the GPS unit.
Clicking on the GPS button will open the Get GPS Info page. Click on Read GPS… to get
the current coordinate information, and click Accept to transfer the coordinate values
back to the data form.
26
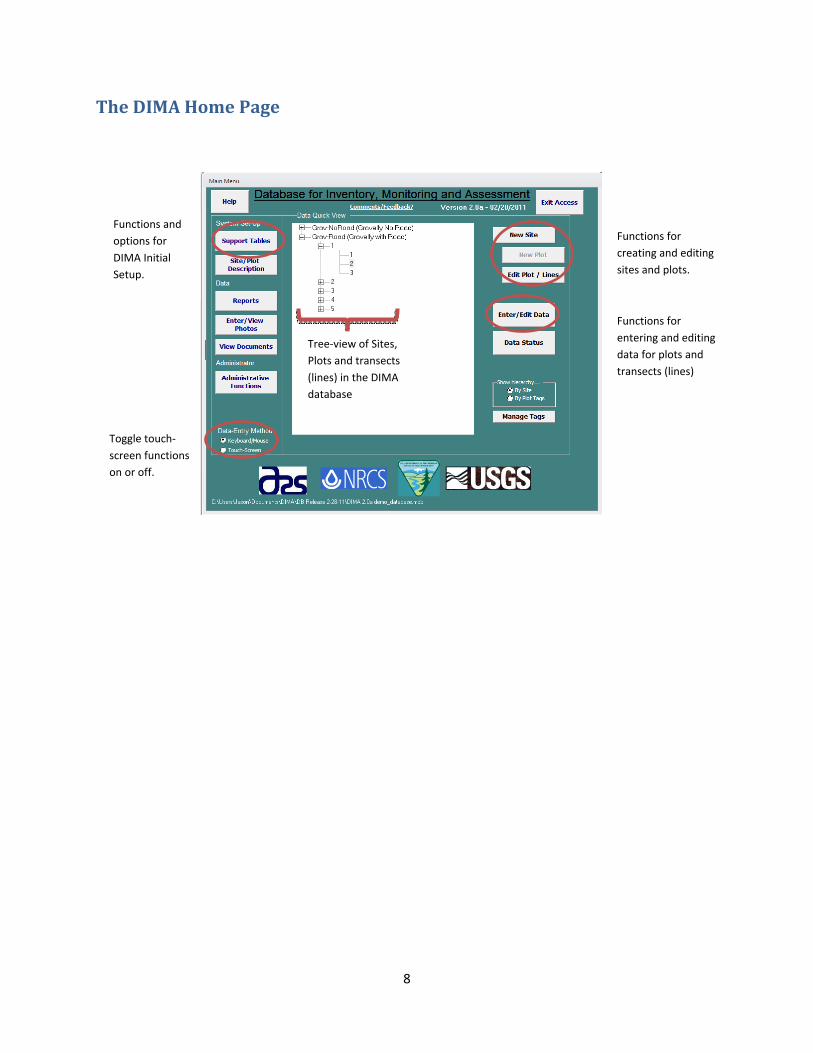
Creating a Site
In order to collect data on a plot or transect in DIMA, a site must first be created. This is a simple
process that can either be done in the office or in the field. A plot can only be associated with a
single site. Tags can be used in addition to the site if you need to categorize a plot multiple
ways. All the existing sites in a DIMA database are listed in the Quick Data View window of the
DIMA Home Page.
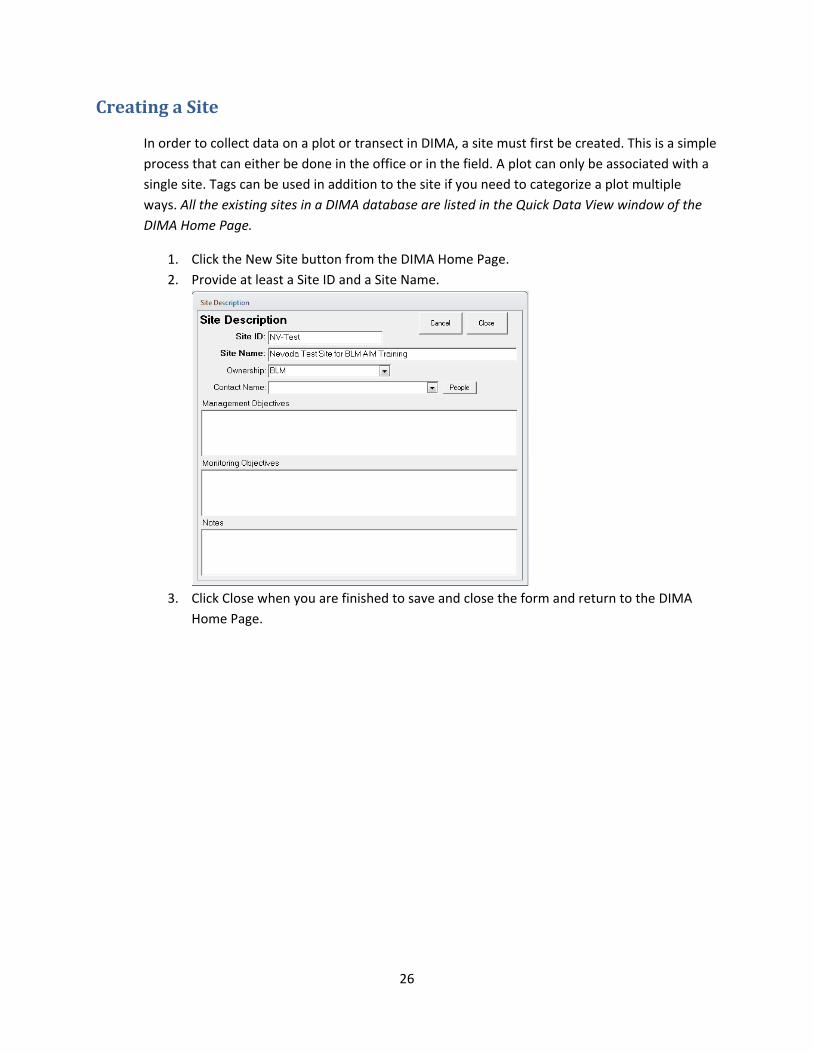
1. Click the New Site button from the DIMA Home Page.
2. Provide at least a Site ID and a Site Name.
3. Click Close when you are finished to save and close the form and return to the DIMA
Home Page.
27
Creating Plots within a Site Once sites have been created, you can then create plots and begin recording data in the field. The
New Plot button on the DIMA Home Page will only become active when you have selected a site in
the Data Quick View window.
1. Click the New Plot button in the DIMA Home Page
2. Specify the number of transects that will be associated with this plot (typically 3 or 4) and
click OK. This will automatically create transects and associate them with the plot you are
creating.
3. Give the plot an ID number in the Plot Description Page and fill in any other attributes in the
General fields (e.g., county, state, ecological site). It is important to verify in the field and
28
select the Ecological Site for the plot. Provide text directions to the plot also.
4. Click on the GPS/Lines button and record the GPS coordinates for the center of the plot.
a. Click on the Species Lists button to create a species list to use for data collection at
this site. You can either create a new list by selecting species from the state species
list or copy an existing list from another plot or one of the DIMA community species
lists you created previously. See the section above on creating species lists for more
29
information.
b. Click Close to save the plot information and return to the DIMA Home Page.
30
Entering Field Data The process for entering data for any of the methods starts the same way, by selecting a plot and
specifying the method for entering the data.
1. Click the Enter/Edit Data button to open the Enter/Edit Data page
2. Select the site and plot you want to enter data for and select the method being used to
collect the data. The list at the bottom of the page will be blank if there are no data already
collected for the method you selected. Once data have been collected at a plot, summaries
of the data will be displayed.
3. Click the New button to start collecting data for the selected method.
The following sections describe data entry for each method separately.
31
Linepoint Intercept with Height After clicking New on the Enter/Edit Data page, you must first specify the plot‐default values for
line‐point intercept and then start entering the data.
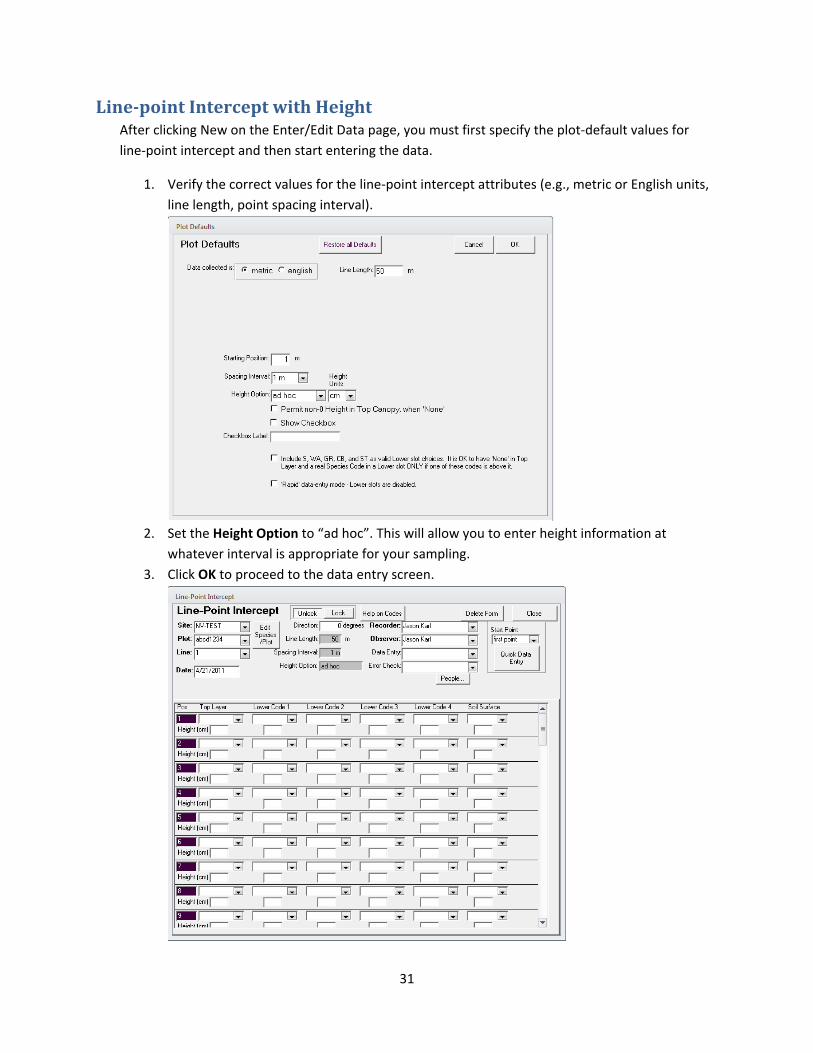
1. Verify the correct values for the line‐point intercept attributes (e.g., metric or English units,
line length, point spacing interval).
2. Set the Height Option to “ad hoc”. This will allow you to enter height information at
whatever interval is appropriate for your sampling.
3. Click OK to proceed to the data entry screen.
32
4. Specify the transect number, recorder, and observer. The data entry controls on this form
will be locked until these three attributes are filled in.
5. You can enter LPI data directly in this screen by using the drop‐down boxes that correspond
to the point along the transect (Pos) and the canopy layer (e.g., Top, Lower Code 1, Soil
Surface). Refer to the Monitoring Manual (Herrick et al. 2009) for details on how data
should be collected and recorded. Heights for each canopy layer may be recorded as well.
While this default form is convenient for viewing and quickly verifying LPI data, it is
cumbersome for actually entering the data. The Quick Data Entry form works much better
for entering LPI data in the field.
6. Click on the Quick Data Entry button to open the quick data editor. The quick data editor is
organized very differently from the standard LPI form. The page displayed on the Quick Data
Editor corresponds to a single point along the transect. The point (position) number is
displayed at the top‐left of the page.
7. Click on plant species codes to add them to the current point’s data record. At a minimum, a
soil surface must be specified. If plant canopies are encountered, a top canopy must be
specified and then additional canopy layers in order from one to four.
8. Clicking on a plant species code will add it to the Current Data box for that layer and
promote it to the top of the species list. Over time, the most common species will tend to be
toward the top of the lists.
9. Click Next to go to the next LPI point on the transect. You can use the Next, Previous, and
Go to position # controls to navigate to different points along the transect.
10. Record the height of the different canopy layers as specified in the AIM protocol.
11. Click on the Modify Plot’s Species List button if you encounter a species that is not in the
plant list. You can modify the plot species list and add new species encountered.
12. Click on Help on Codes for explanations of what the standard LPI codes (e.g., L, BR, S, R) are.
33
13. Click on the square button below each canopy layer data box to clear the data entry for that
canopy layer.
14. Click Close when you have recorded data for all points along the transect. This will return
you to the standard LPI form.
15. Click Close when you are done entering the LPI data for that transect to return to the
Enter/Edit Data page.
16. Repeat these steps for the additional transects.
34
Plotlevel Species Richness The total list of species occurring on a plot is one of the core indicators of the AIM strategy. This is
accomplished by a plot‐level inventory after the LPI data have been collected.
1. Select the Species Richness method and the appropriate site and plot in the Enter/Edit Data
page.
2. Click New to create a species richness record for the plot. This will open the richness Plot
Defaults page.
3. Choose “Custom 2” from the Method drop‐down list and set the # of Sub‐Plots to “1”.
Check the box under Container Sub‐Plot, change the shape to circular, and set the radius of
the plot according to your plot dimensions. These settings follow the AIM protocol
recommendations.
4. Click OK to open the Richness data page.
5. Enter the Recorder, Observer, and Transect. The data entry fields on the form will be locked
until these are filled in. In the case of the AIM protocol, richness is estimated at the plot
level, and not for individual transects. In this case, just choose line (transect) 1 for recording
35
the richness data, but actually count species over the entire plot.
6. Click on species in the plot species list (center column) that you observe in the plot. The
plant codes for these species will be recorded in the plot richness field at the left.
7. Click Close when you are done recording species that occur in the plot.
36
Canopy Gap Intercept Canopy gap intercept is also a core method of the AIM strategy. This method is implemented on the
same transects as LPI and can be done quickly following LPI by reading the transect backwards (i.e.,
LPI starts from 0 and reads along increasing distances, gap intercepts starts at the maximum
distance away from the origin and reads back down the tape toward the plot center).
1. Select the Gap Intercept method and the appropriate site and plot in the Enter/Edit Data
page.
2. Click New to create a gap intercept record for the plot. This will open the gap intercept Plot
Defaults page.
3. Set the Data to be Collected drop‐down box to “Canopy Gap only.”
37
4. Click OK to go to the gap intercept data collection page.
5. Enter the transect number, observer, and recorder to unlock the gap intercept form.
6. Check the Canopy Gap data direction settings. If reading the transect backwards after
reading LPI, set this to “High to Low.”
7. Record the start and stop locations (i.e., distance from the origin of the transect) of canopy
gaps in the form. Every time you enter values for a canopy gap a new row is added to the
form.
8. NOTE THAT THE CANOPY GAP FORM RECORDS GAPS IN CENTIMETERS OR INCHES.
9. Click Close to save your data and return to the Enter/Edit Data page when you have finished
recording canopy gaps for the transect.
38
Soil Stability The soil stability test is a contingent method for the AIM strategy and is only measured when there
is reason to believe that there are problems with soil stability at the plot. Refer to the Monitoring
Manual (Herrick et al. 2009) for detailed instructions on implementing this method.
1. Select the Soil Stability method and the appropriate site and plot in the Enter/Edit Data
page.
2. Click New to create a soil stability record for the plot. This will open the soil stability Plot
Defaults page.
3. Verify that the settings are for “Surface Only” with an interval of 15 seconds.
4. Click OK to proceed to the data collection page.
5. Specify the Recorder and Observer to unlock the form.
39
6. Prepare soil samples and record the position of each sample in the test kit and the type of
vegetation from each sample. The data form provides the times at which samples should be
submersed in water and dipped.
7. Begin the soil sampling and record the stability values for each sample in the # column drop‐
down boxes.
8. Click Close when you are finished to return to the Enter/Edit Data page.
40
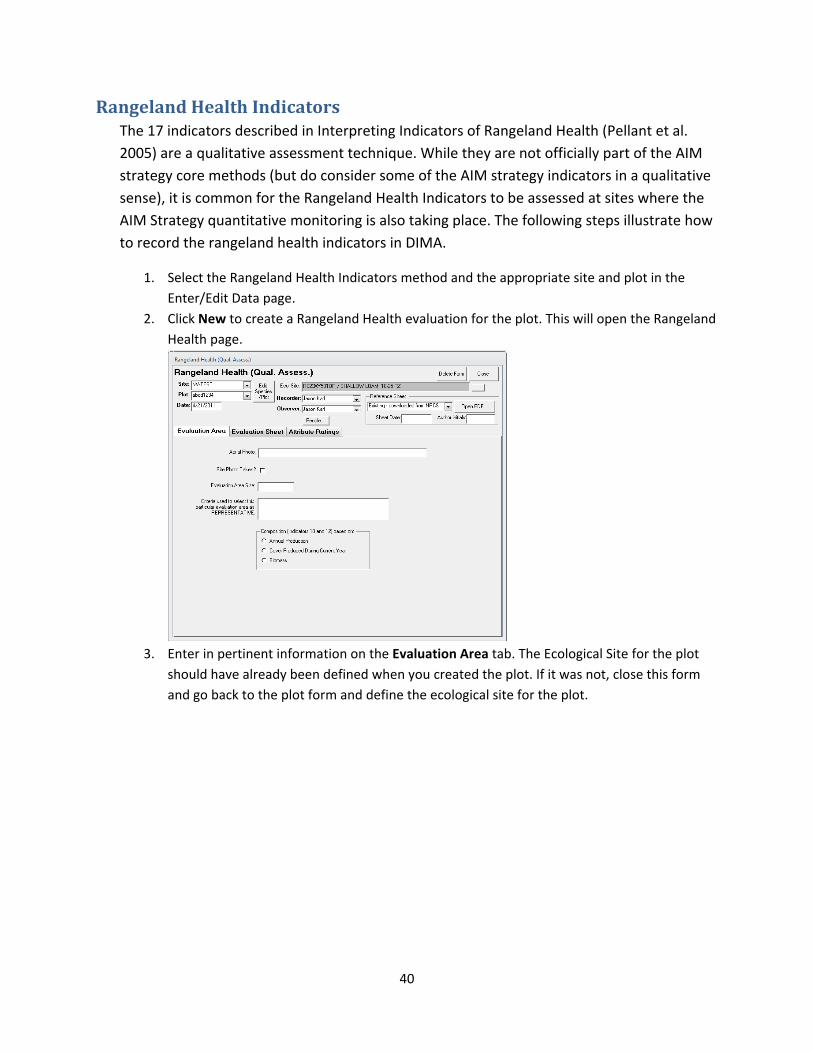
Rangeland Health Indicators The 17 indicators described in Interpreting Indicators of Rangeland Health (Pellant et al.
2005) are a qualitative assessment technique. While they are not officially part of the AIM
strategy core methods (but do consider some of the AIM strategy indicators in a qualitative
sense), it is common for the Rangeland Health Indicators to be assessed at sites where the
AIM Strategy quantitative monitoring is also taking place. The following steps illustrate how
to record the rangeland health indicators in DIMA.
1. Select the Rangeland Health Indicators method and the appropriate site and plot in the
Enter/Edit Data page.
2. Click New to create a Rangeland Health evaluation for the plot. This will open the Rangeland
Health page.
3. Enter in pertinent information on the Evaluation Area tab. The Ecological Site for the plot
should have already been defined when you created the plot. If it was not, close this form
and go back to the plot form and define the ecological site for the plot.
41
4. Click on the Evaluation Sheet tab.
5. Fill in the ratings for the 17 indicators using the drop‐down boxes. Provide adequate
comments to document your rationale for the ratings you chose.
6. Click on the Attribute Ratings tab when you are finished to see the overall site ratings.
7. Click Close when finished to return to the Enter/Edit Data page.
42
References Herrick, J. E., J. W. Van Zee, K. M. Havstad, L. M. Burkett, and W. G. Whitford. 2009. Monitoring manual
for grassland, shrubland, and savanna ecosystems. USDA‐ARS Jornada Experimental Range, Las
Cruces, New Mexico.
Pellant, M., P. Shaver, D. A. Pyke, and J. E. Herrick. 2005. Interpreting indicators of rangeland health,
version 4. BLM/WO/ST‐00/001+1734/REV05, U.S. Department of the Interior, Bureau of Land
Management, National Science and Technology Center, Denver, CO.