Dimensional Stability of Thin Ply Composites for Deployable Structures Joshua Edward Salazar Dissertation Proposal Committee: Dr. Walter Voit – Supervising Professor Dr. Hongbing Lu – Co-Chair Dr. Arif Malik Dr. Yonas Tadesse Dr. Juan M. Fernandez
Transcript
Dimensional Stability of Thin Ply Composites for Deployable Structures
Joshua Edward Salazar
Dissertation ProposalCommittee:Dr. Walter Voit – Supervising Professor Dr. Hongbing Lu – Co-ChairDr. Arif MalikDr. Yonas Tadesse Dr. Juan M. Fernandez
Outline
• Motivation
• Deployable composite booms
• Technology Risk
Introduction
• Aim 1 – Determination of the dimensional stability of thin-ply composites during manufacturing
• Aim 2 - Determination of the dimensional stability of thin-ply composites during stowage
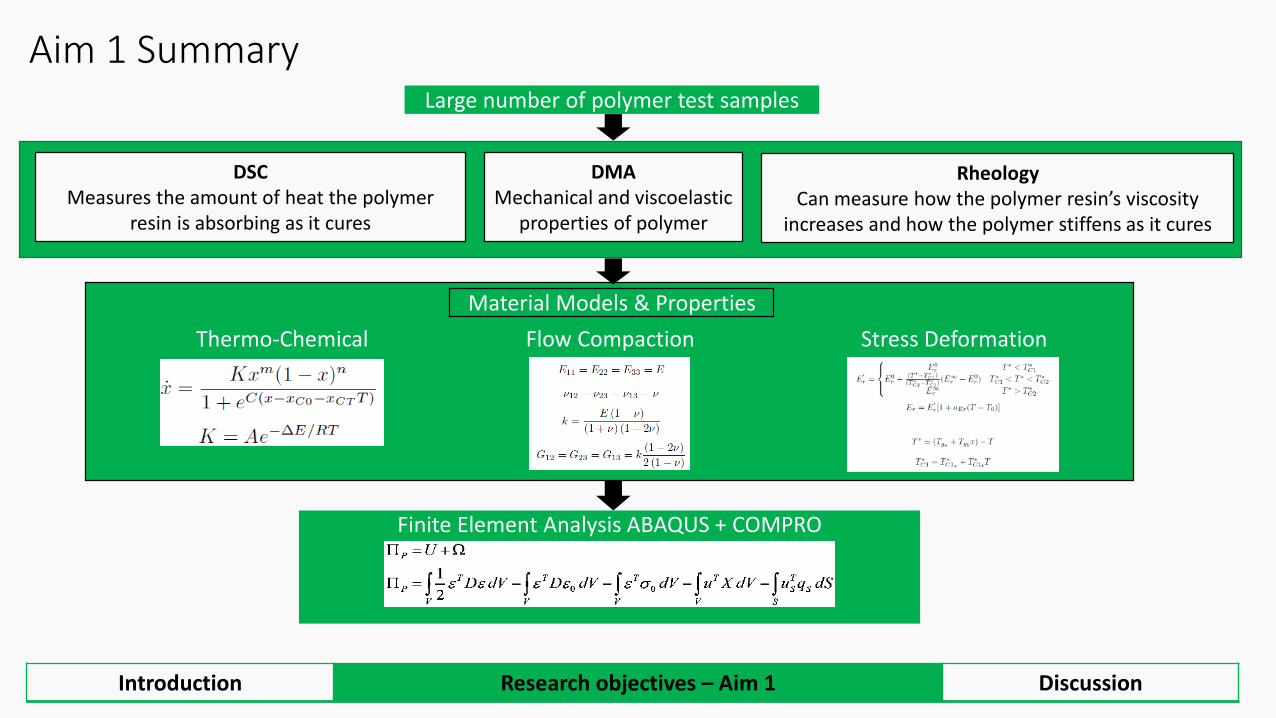
Aim 1. Determination of the dimensional stability of thin-ply composites during manufacturing
Introduction Research objectives – Aim 1.1 Thermo-Chemical Model Discussion
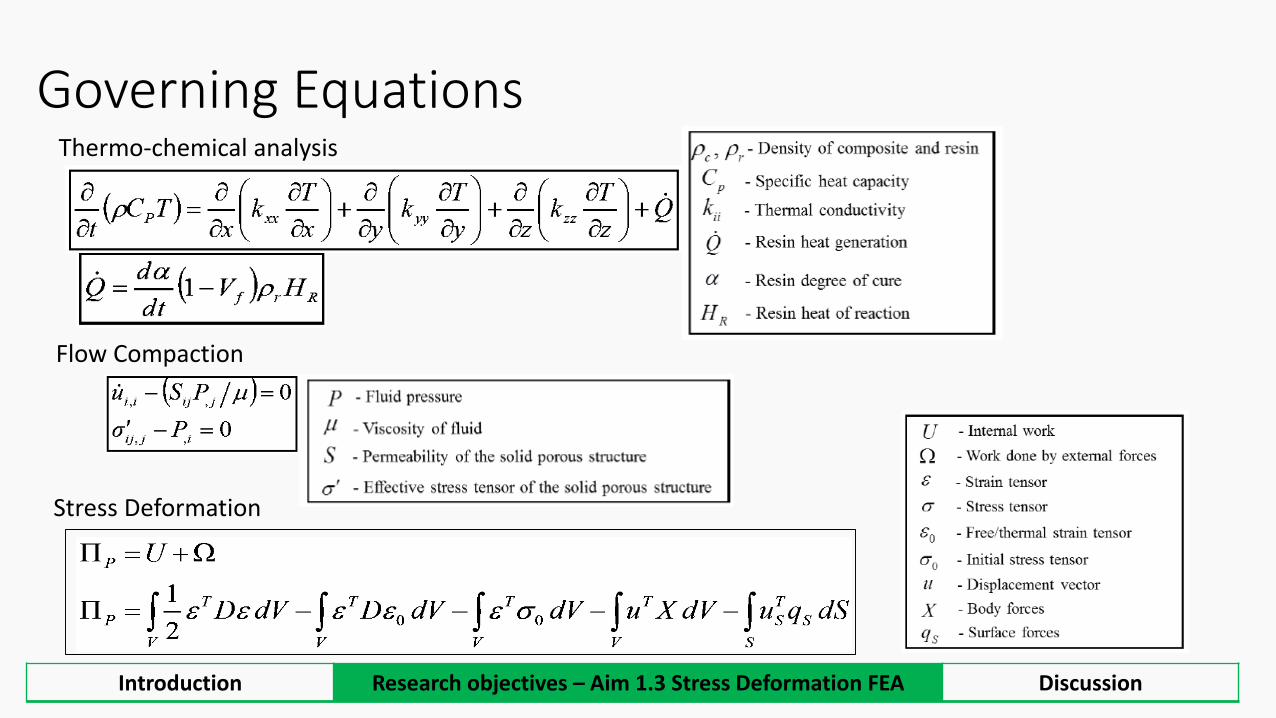
Cure Kinetics Model Development
• TGA + DSC for material characterization
• Cure Kinetics model development
Bosi, F., Et al, Cure-induced deformation of ultra-thin composite laminates, AIAA SciTech Forum, 8-12 (2018)
TGA
• Decomposition Temperature (1% mass loss)
• Limit for DSC to prevent contamination
DSC
• Sweep Test (3°C/min, -40°C→295°C)
• Identify temperatures during curing (exothermic heat flow)
• Time-limited Isothermal tests
• Measure degree of cure as function of time
Cure Kinetics Model
• Least Squares fit used to fit degree of cure model
• Degree of cure model verification
• Degree of cure model implementation in ABAQUS+COMPRO
Introduction Research objectives – Aim 1.1 Thermo-Chemical Model Discussion
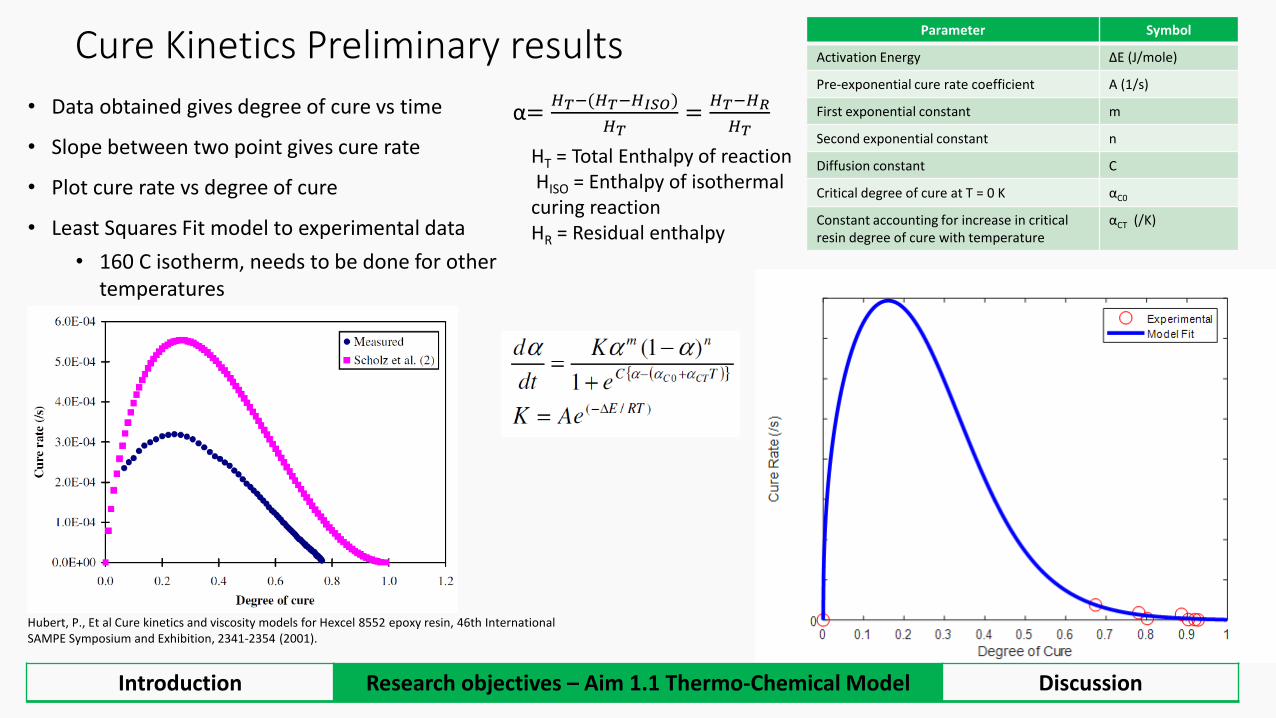
Cure Kinetics Preliminary results
• Data obtained gives degree of cure vs time
• Slope between two point gives cure rate
• Plot cure rate vs degree of cure
• Least Squares Fit model to experimental data
• 160 C isotherm, needs to be done for other temperatures
Parameter Symbol
Activation Energy ΔE (J/mole)
Pre-exponential cure rate coefficient A (1/s)
First exponential constant m
Second exponential constant n
Diffusion constant C
Critical degree of cure at T = 0 K αC0
Constant accounting for increase in critical resin degree of cure with temperature
αCT (/K)
Hubert, P., Et al Cure kinetics and viscosity models for Hexcel 8552 epoxy resin, 46th International SAMPE Symposium and Exhibition, 2341-2354 (2001).
Introduction Research objectives – Aim 1.1 Thermo-Chemical Model Discussion
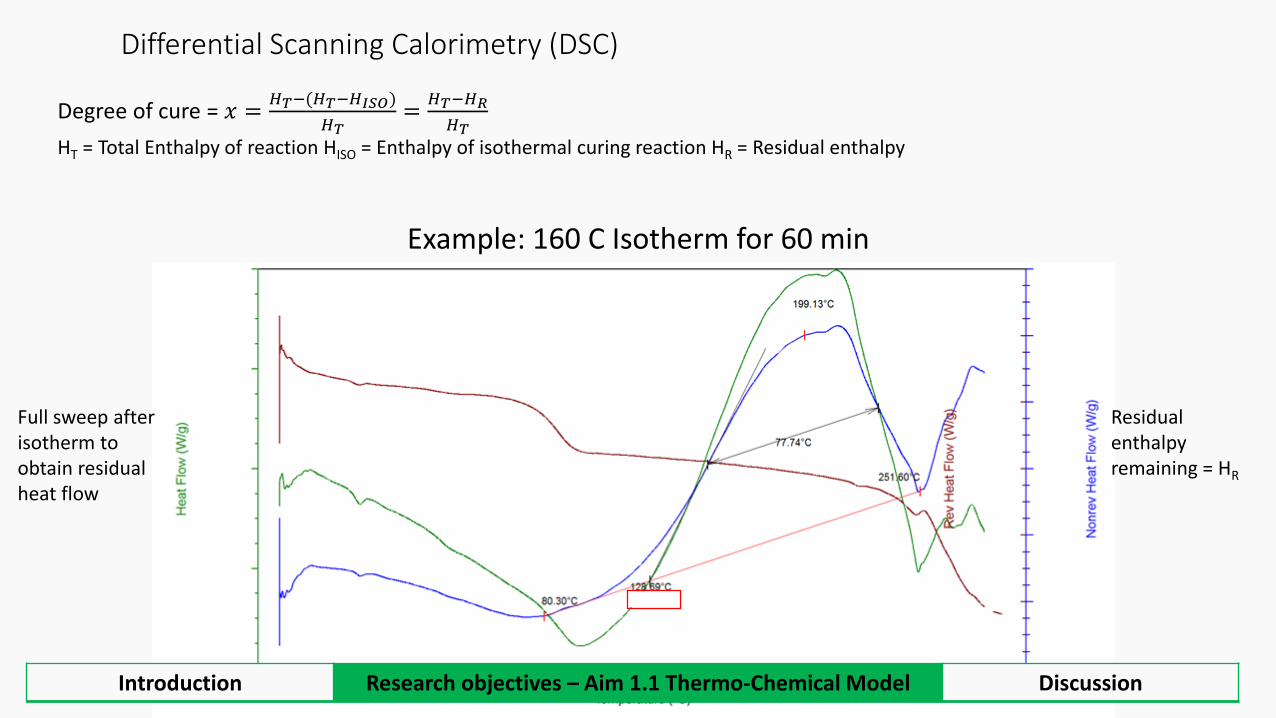
α=𝐻𝑇−(𝐻𝑇−𝐻𝐼𝑆𝑂)
𝐻𝑇=
𝐻𝑇−𝐻𝑅
𝐻𝑇
HT = Total Enthalpy of reactionHISO = Enthalpy of isothermal curing reaction HR = Residual enthalpy
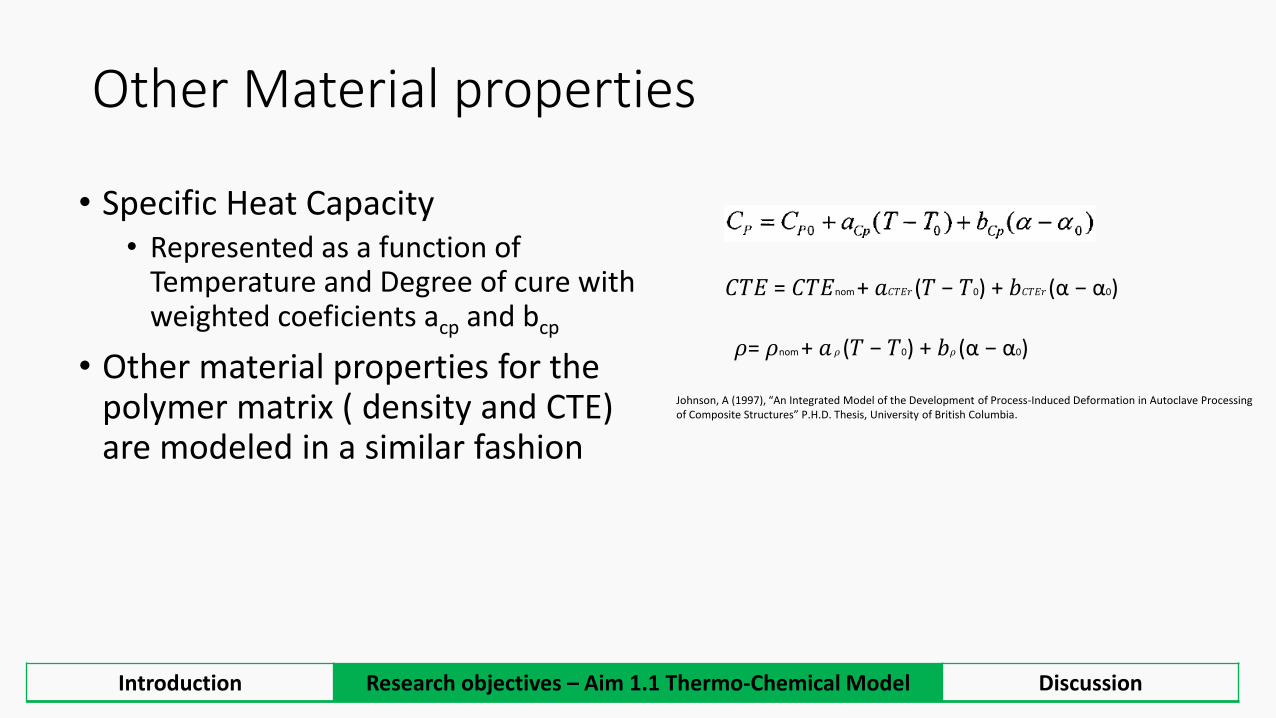
Other Material properties
• Specific Heat Capacity• Represented as a function of
Temperature and Degree of cure with weighted coeficients acp and bcp
• Other material properties for the polymer matrix ( density and CTE) are modeled in a similar fashion
Introduction Research objectives – Aim 1.1 Thermo-Chemical Model Discussion
Johnson, A (1997), “An Integrated Model of the Development of Process-Induced Deformation in Autoclave Processingof Composite Structures” P.H.D. Thesis, University of British Columbia.
𝐶𝑇𝐸 = 𝐶𝑇𝐸nom + 𝑎𝐶𝑇𝐸𝑟(𝑇 − 𝑇0) + 𝑏𝐶𝑇𝐸𝑟(α − α0)
𝜌= 𝜌nom + 𝑎 𝜌 (𝑇 − 𝑇0) + 𝑏𝜌 (α − α0)
Aim 1.1 – Themo-Chemical Model Development
Aim 1.2– Flow-Compaction Model Development
Aim 1.3 – Stress Deformation Model Development
Aim 1.4 – Stress Deformation Finite Element Analysis
Aim 1. Determination of the dimensional stability of thin-ply composites during manufacturing
Introduction Research objectives – Aim 1.2 Flow-Compaction Model Discussion
Flow Compaction• Initial Fiber Volume Fraction
• Can be determined via micrographs or with volume and mass measurements
• Fiber Bed Compaction• Fiber bed assumed to be homogenous
isotropic linear elastic material
• Bulk and shear modulus calculated fromYoung’s modulus and poison ratio
• Resin Viscosity• Same model used in the thermo-mechanical
model
Introduction Research objectives – Aim 1.2 Flow-Compaction Model Discussion
Fiber volume fraction from micrographs
Fiber bed mechanical properties
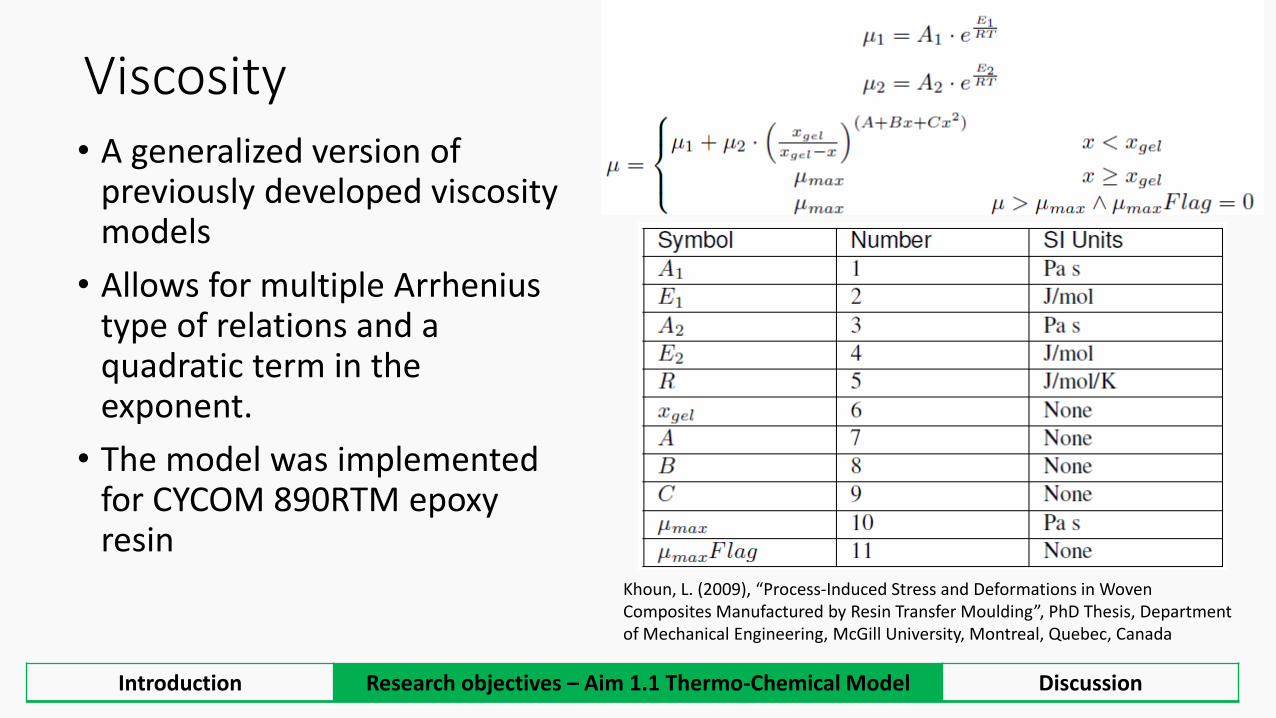
Viscosity• A generalized version of
previously developed viscositymodels
• Allows for multiple Arrhenius type of relations and a quadratic term in the exponent.
• The model was implemented for CYCOM 890RTM epoxy resin
Khoun, L. (2009), “Process-Induced Stress and Deformations in Woven Composites Manufactured by Resin Transfer Moulding”, PhD Thesis, Department of Mechanical Engineering, McGill University, Montreal, Quebec, Canada
Introduction Research objectives – Aim 1.1 Thermo-Chemical Model Discussion
Aim 1.1 – Themo-Chemical model development
Aim 1.2– Flow-Compaction model development
Aim 1.3 – Stress Deformation model development
Aim 1.4 – Finite Element Analysis
Aim 1.5 – Analysis Verification
Aim 1. Determination of the dimensional stability of thin-ply CFRP during manufacturing
Introduction Research objectives – Aim 1.3 Stress Deformation Model Discussion
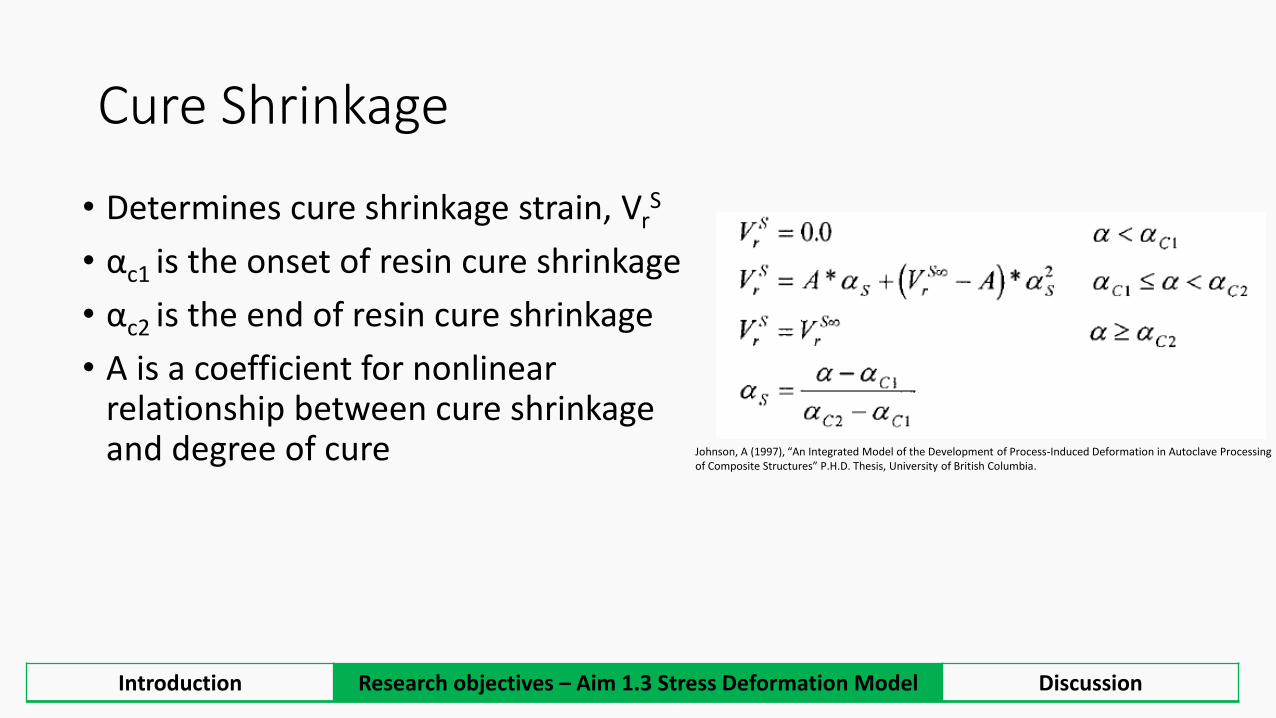
Cure Shrinkage
• Determines cure shrinkage strain, VrS
• αc1 is the onset of resin cure shrinkage
• αc2 is the end of resin cure shrinkage
• A is a coefficient for nonlinear relationship between cure shrinkage and degree of cure
Introduction Research objectives – Aim 1.3 Stress Deformation Model Discussion
Johnson, A (1997), “An Integrated Model of the Development of Process-Induced Deformation in Autoclave Processingof Composite Structures” P.H.D. Thesis, University of British Columbia.
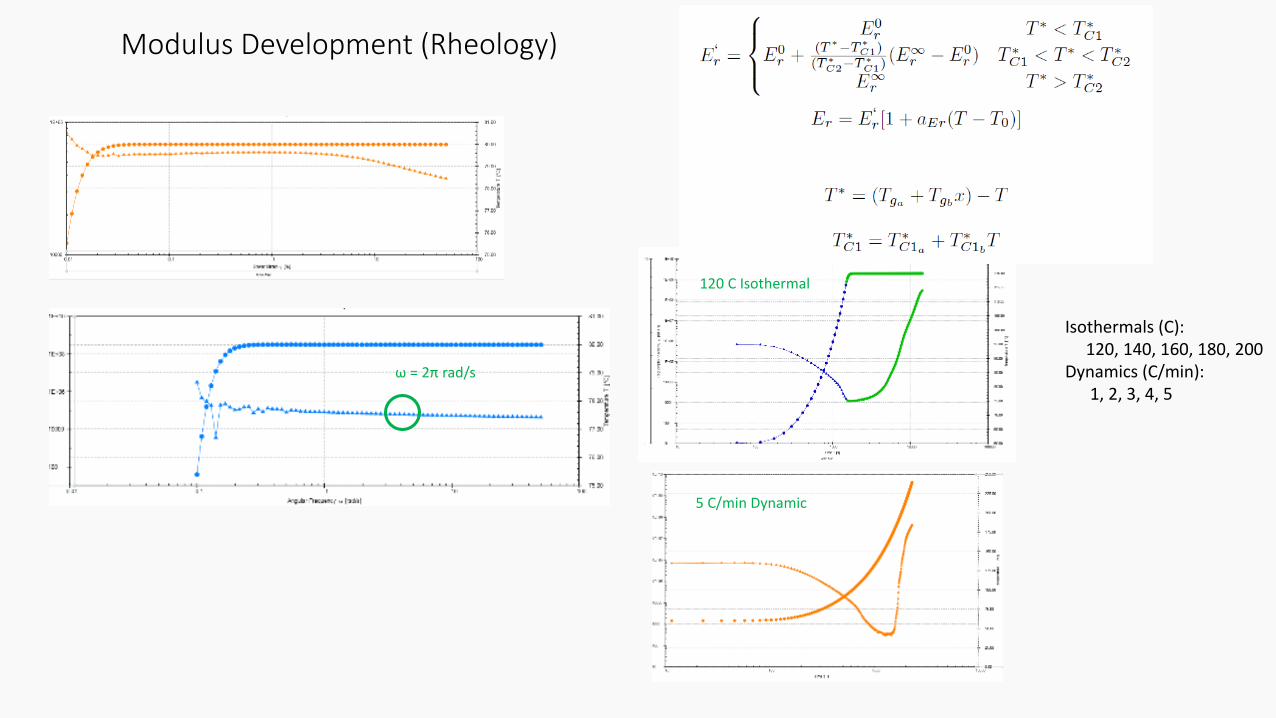
Modulus Development
• All parameters are determined from combination of
rheology and previously determined TGA+DSC
measurements
• Isothermals (C): 120, 140, 160, 180, 200
• Dynamics (C/min): 1, 2, 3, 4, 5
Strain Sweep
• Performed at 80 C (uncured, but viscous)
• Ramp strain, hold strain rate constant
• Select strain at which Viscosity vs strain slope is constant
Strain Rate Sweep
• Performed at 80 C (uncured, but viscous)
• Ramp strain rate, hold strain constant
• Select strain rate at which Viscosity vs Angular Freq. slope is constant
Isothermal Rheology
• Use strain and strain rate values determined above
• Constant temperature in curing range
• Hold for long time so resin will at least reach gel point
Dynamic Rheology
• Use strain and strain rate values determined above
• Ramp from 60 C to just before degradation temperature (from TGA)
• Perform at different heating rates
Introduction Research objectives – Aim 1.1 Thermo-Chemical Model Discussion
Johnston, Andrew, (1997), “An integrated Model of the Development of Process-Induced deformation in Autoclave Processing of Composite Structures”, PhD Thesis, The University of British Columbia
Aim 1.1 – Themo-Chemical Model Development
Aim 1.2– Flow-Compaction Model Development
Aim 1.3 – Stress Deformation Model Development
Aim 1.4 – Stress Deformation Finite Element Analysis
Aim 2. Determination of the dimensional stability of thin ply composites during stowage
Introduction Research objectives – Aim 2.3 Composite Coupon Discussion
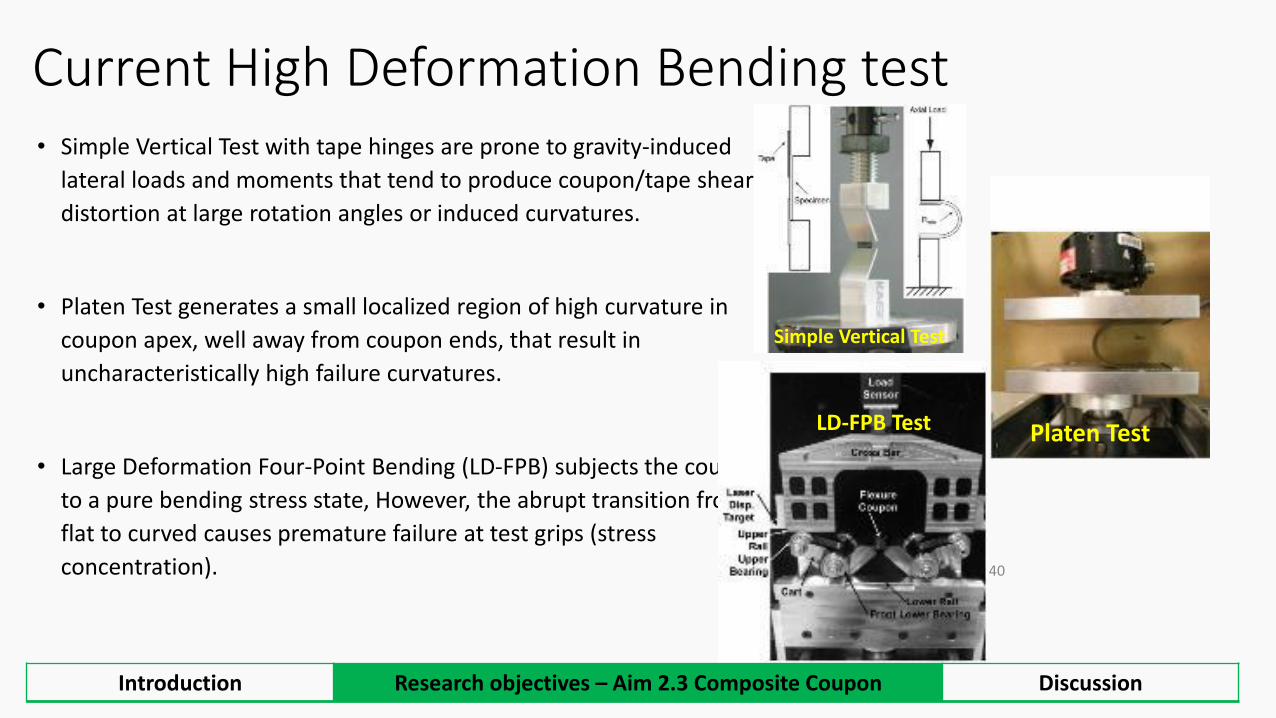
• Simple Vertical Test with tape hinges are prone to gravity-induced
lateral loads and moments that tend to produce coupon/tape shear
distortion at large rotation angles or induced curvatures.
• Platen Test generates a small localized region of high curvature in
coupon apex, well away from coupon ends, that result in
uncharacteristically high failure curvatures.
• Large Deformation Four-Point Bending (LD-FPB) subjects the coupon
to a pure bending stress state, However, the abrupt transition from
flat to curved causes premature failure at test grips (stress
concentration). 40
Platen TestLD-FPB Test
Simple Vertical Test
Current High Deformation Bending test
Introduction Research objectives – Aim 2.3 Composite Coupon Discussion
Column Bending Test (CBT)
41
• CBT method initially developed by Opterus R&D and LaRC: Fernandez, Murphey, AIAA 2018-0942.
• Test setup consists of double-symmetric weight-balanced rigid fixtures arms which firmly clamp the specimen.
• As the fixture move vertically towards each other applying a compression force, they rotate causing a bending moment in the coupon.
• Combines best features of previous tests:• Vertical setup compatible with uniaxial load frames.• Generates a max stress state at the coupon center• Because a larger volume of material is subjected to high stress, the
results are more representative of pure bending stress than in platen test.
• Stress state is mostly uniform, as in large deformation four point bending test (LD-FPB).
• Since curvature is slightly reduced at grips, failure likely to occur in coupon apex (as opposed to LD-FPB) for tests seeking bending strength and failure strain.
CBT Kinematics: numerically calculating 𝒓 and 𝝓
•𝛿
𝑠= 1 −
2
𝜙sin
𝜙
2+ 2
𝑙
scos𝜃 − cos 𝜃 +
𝜙
2
•𝑟
𝑠=
1
𝜙1 − cos
𝜙
2+
𝑙
𝑠sin 𝜃 +
𝜙
2
• 𝑀𝑚𝑎𝑥 = 𝑃𝑟
• 𝑀𝑚𝑖𝑛 = 𝑃𝑙 𝑠𝑖𝑛 𝜃 +𝜙
2
• κ =𝜙
𝑠
Testing machine extension
Coupon grips
Rigid upper arm
Rigid lower arm
Pinned joints
Bent flexible coupon
U shaped clevis
Output: Bending Stiffness D*11 =
𝑴𝒎𝒂𝒙
Introduction Research objectives – Aim 2.3 Composite Coupon Discussion
42
Test Coupon fabrication and painting
• Laminates laid by Kevin McLain in an autoclave at 14 psi and 350⁰F and cut via water jet
• Coupons were wiped down with Isopropyl alcohol and hung on the painting rack
• The samples were painted with up to two coats of a matte white commercial aerosol spray paint
• After at least 12 hours, the samples were painted with Aeroglaze Z306 Flat Black Polyurethane paint mixed with Aeroglaze 9958 thinner using a detailing airbrush
Composite Coupon Preparation
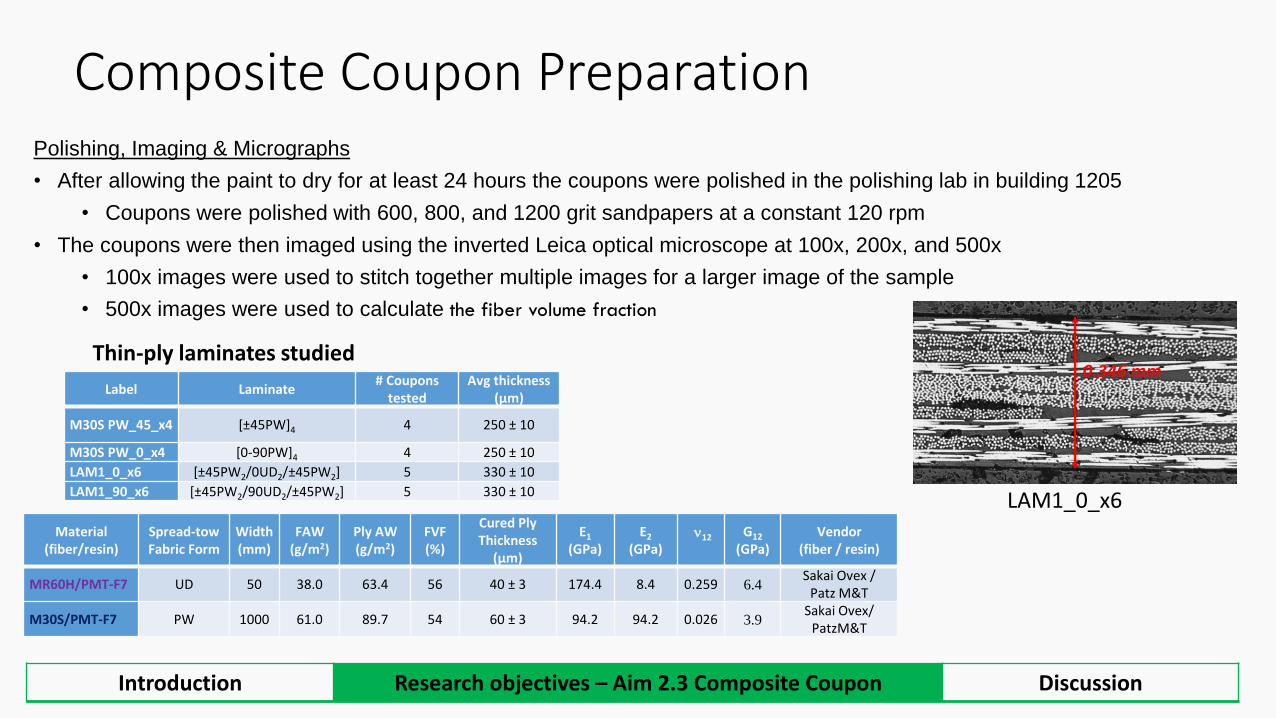
Introduction Research objectives – Aim 2.3 Composite Coupon Discussion
Polishing, Imaging & Micrographs
• After allowing the paint to dry for at least 24 hours the coupons were polished in the polishing lab in building 1205
• Coupons were polished with 600, 800, and 1200 grit sandpapers at a constant 120 rpm
• The coupons were then imaged using the inverted Leica optical microscope at 100x, 200x, and 500x
• 100x images were used to stitch together multiple images for a larger image of the sample
• 500x images were used to calculate the fiber volume fraction
Introduction Research objectives – Aim 2.3 Composite Coupon Discussion
LAM1_0_x6
Preparing Coupons for Testing
44
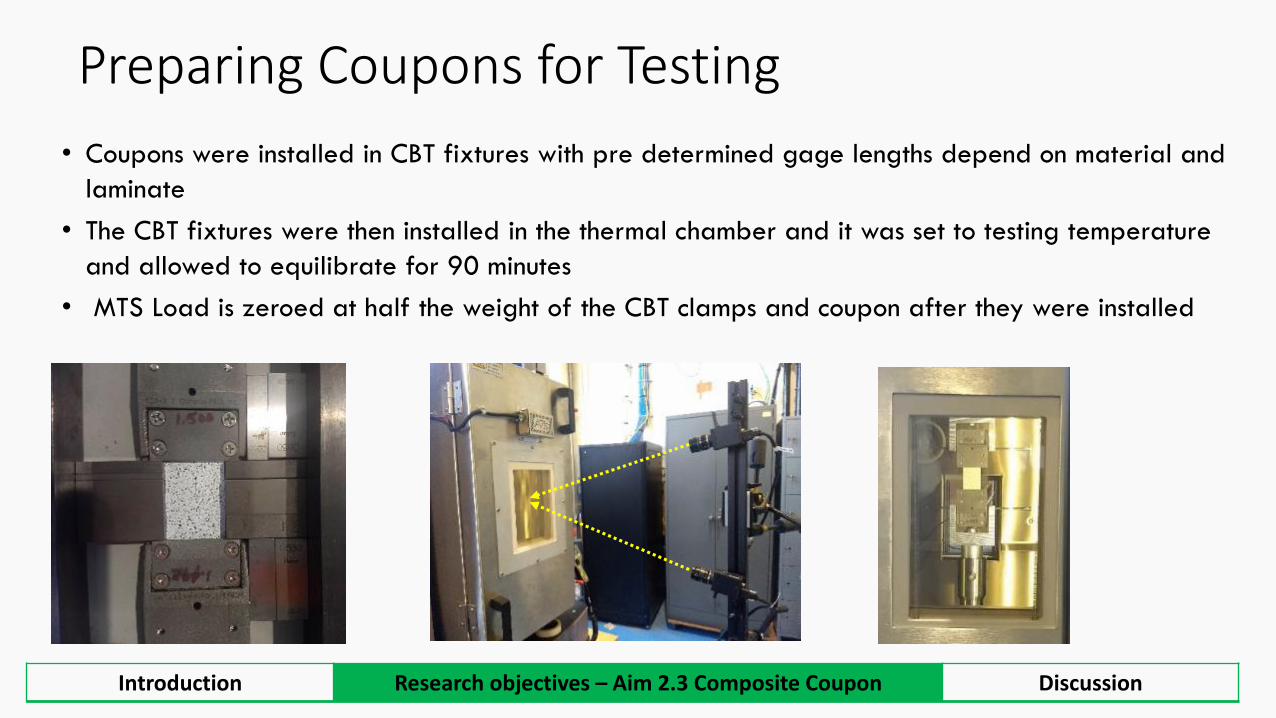
• Coupons were installed in CBT fixtures with pre determined gage lengths depend on material and
laminate
• The CBT fixtures were then installed in the thermal chamber and it was set to testing temperature
and allowed to equilibrate for 90 minutes
• MTS Load is zeroed at half the weight of the CBT clamps and coupon after they were installed
Introduction Research objectives – Aim 2.3 Composite Coupon Discussion
CBT Test Procedure for Viscoelastic Characterization
0
0.5
1
1.5
0 50 100
Stra
in [
%]
Time (s)
DIC tension-side strains during folding at temperatures 40°C - 120°C
40c ramp 60c ramp 80c ramp100c ramp 120c ramp
40° C 60° C 80° C 100° C 120° C
Fold
RelaxRecover
Unfold
Temperature 40, 60, 80 ,100, 120°C
Temp. steady state time 1.5 h
Fold/unfold rate 12 mm/min
Fold/unfold time 2 min
Estimated surface strain 1%
Relaxation time: 6 h
Recovery Time 2 h
Total test time 48 h
Test parameters adopted in this study
Folding strains are consistent at different temps after recovery
0
0.2
0.4
0.6
0.8
1
1.2
0 1000 2000 3000 4000 5000 6000St
rain
[%
]
Index (time)
DIC tension side strains at 40°C-120°C for 4-ply 45° M30S PW
Introduction Research objectives – Aim 2.3 Composite Coupon Discussion
Bending Relaxation Characterization Method
46
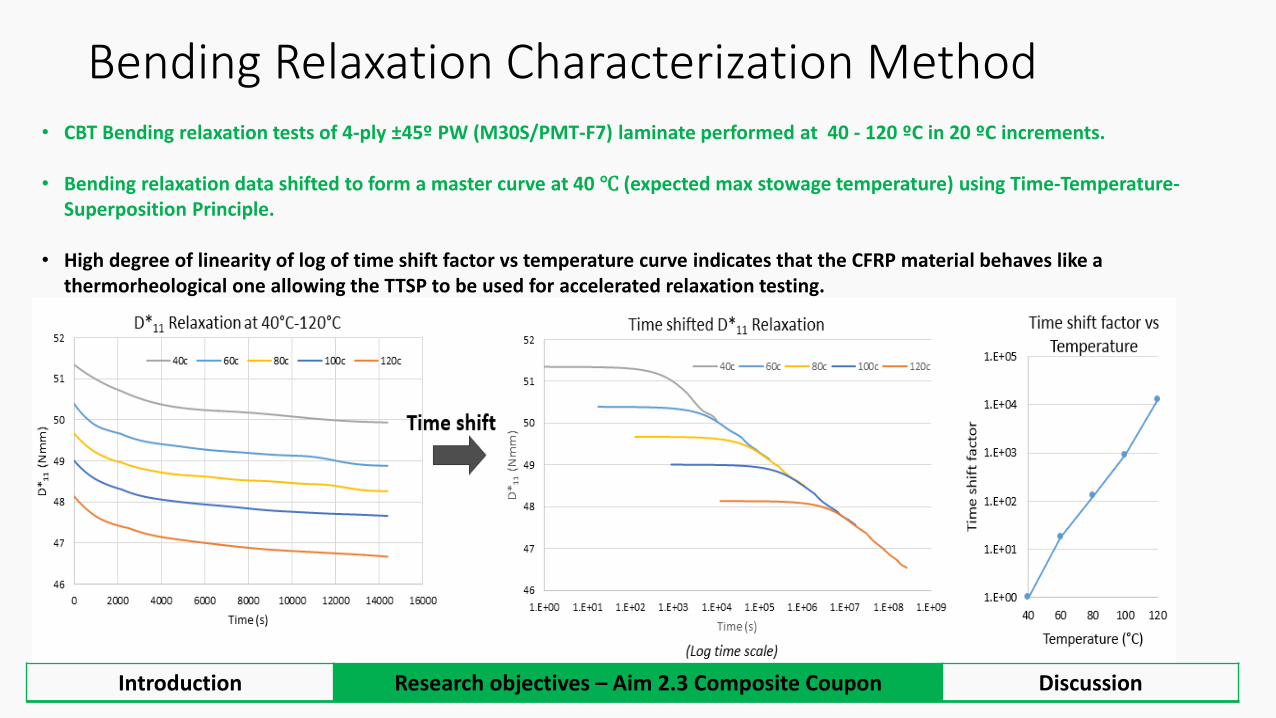
• CBT Bending relaxation tests of 4-ply ±45º PW (M30S/PMT-F7) laminate performed at 40 - 120 ºC in 20 ºC increments.
• Bending relaxation data shifted to form a master curve at 40 ℃ (expected max stowage temperature) using Time-Temperature-Superposition Principle.
• High degree of linearity of log of time shift factor vs temperature curve indicates that the CFRP material behaves like a thermorheological one allowing the TTSP to be used for accelerated relaxation testing.
Introduction Research objectives – Aim 2.3 Composite Coupon Discussion
• Prony Series Fitting to experimental and simulated bending relaxation master curves at 40 °C. Prony terms can be used to validate/update finite element model (FEM) under development.
• 9-term Prony fit of the pseudo stiffness (D*11 (t) =
𝑀1(𝑡)
1𝛥𝑙) terms shown for one ±45° PW sample.
• The long-term coefficient (D*11,∞) is similar (4% off) for the test and FEM fit.
• Shifted test data allows to evaluate material response 2 years (6.3+E7 sec) out, which is the maximum stowage time required for boom application. The FEM can predict past 2 year mark.
20
Prony series coefficients 𝐷∗11 = 𝐷∗
11,∞ +
𝑘=1
𝑛
𝐷∗11,𝑘 ∗ 𝑒
−𝑡𝜌𝑘
9-term Experimental data fit 9-term FEM Numerical model fit
𝑘 𝜌𝑘 (s) 𝐷∗11,𝑘 (Nmm) 𝑘 𝜌𝑘 (s) 𝐷
∗11,𝑘 (Nmm)
∞ --- 46.4701 ∞ -- 48.3955
1 0.04 0.1179 1 1.89E+01 0.6081
2 0.05 0.0032 2 1.00E+02 0.8042
3 49.40 4.4409E-14 3 1.00E+03 0.8195
4 441.02 3.8166E-08 4 2.00E+04 0.7250
5 2.58E+03 1.1046 5 1.00E+05 0.4394
6 4.64E+04 0.9509 6 1.95E+06 0.4431
7 7.67E+05 0.9736 7 1.77E+07 0.5439
8 9.09E+06 0.7079 8 1.74E+08 2.4962
9 1.0000E+08 1.1508 9 1.38E+09 0.0308
* *
Introduction Research objectives – Aim 2.3 Composite Coupon Discussion
Aim 2. Determination of the dimensional stability of thin ply composites during stowage
Introduction Research objectives – Aim 2.4 Composite Structure Discussion
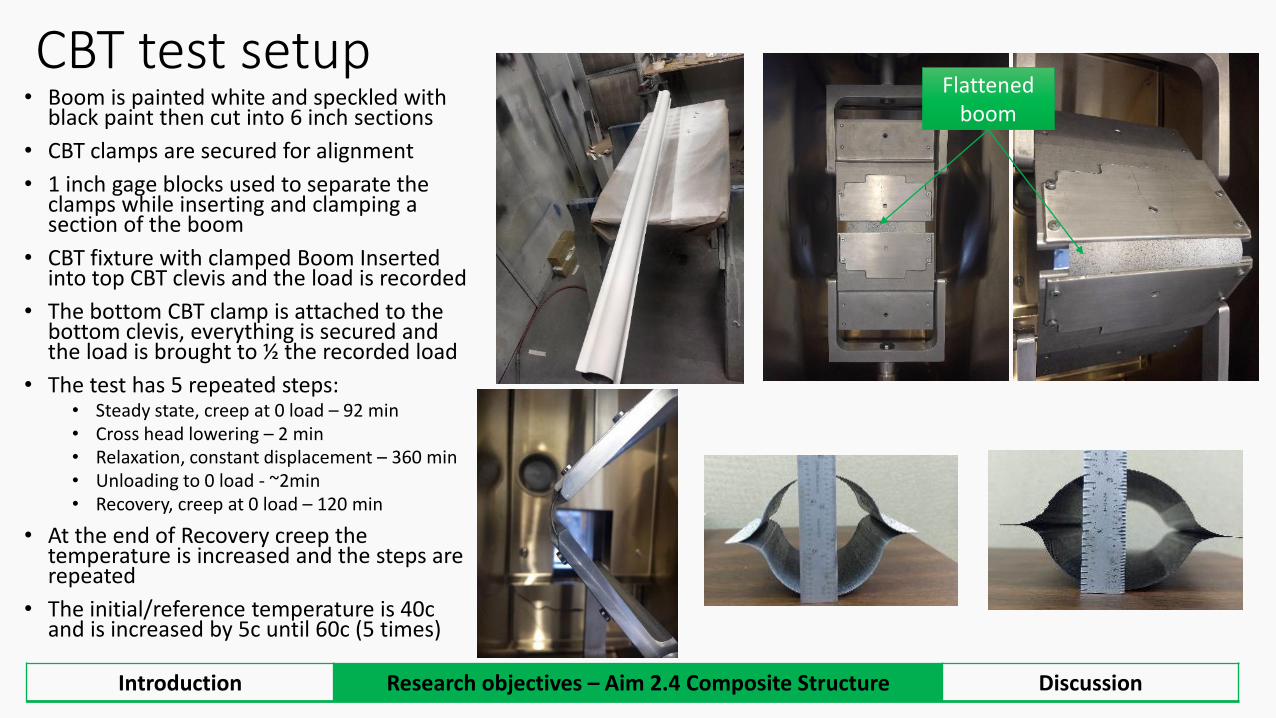
CBT test setup• Boom is painted white and speckled with
black paint then cut into 6 inch sections
• CBT clamps are secured for alignment
• 1 inch gage blocks used to separate the clamps while inserting and clamping a section of the boom
• CBT fixture with clamped Boom Inserted into top CBT clevis and the load is recorded
• The bottom CBT clamp is attached to the bottom clevis, everything is secured and the load is brought to ½ the recorded load
• The test has 5 repeated steps:• Steady state, creep at 0 load – 92 min• Cross head lowering – 2 min• Relaxation, constant displacement – 360 min• Unloading to 0 load - ~2min• Recovery, creep at 0 load – 120 min
• At the end of Recovery creep the temperature is increased and the steps are repeated
• The initial/reference temperature is 40c and is increased by 5c until 60c (5 times)
Introduction Research objectives – Aim 2.4 Composite Structure Discussion
Flattened boom
CBT Relaxation Test Results
20
21
22
23
24
25
26
27
28
29
0 5000 10000 15000 20000 25000
D1
1 [
N*M
M]
TIME [S]
D11 RELAXATION DCB S5 40C-120C
40c 45c 50c 55c 60c
1
10
100
1000
10000
0 20 40 60 80 100 120 140
Shift Factor (sec) vs temperature (C)
20
21
22
23
24
25
26
27
28
29
0 50000000 100000000 150000000
D1
1 [
N*m
m]
Time [s]
D11 Mater Curve 40c-120c M30S CPWx4 45 deg S15
• The bending relaxation results from the CBT are shown below• The data shown has been filtered due to noise in the testing process• The Relaxation curves were then shifted to 40c using the shift factors
on the right to produce the master curve • The Master curve shows a Reduction in D11 by 4.75 N*mm in about 4
years at a curvature of 0.04 mm-1
Introduction Research objectives – Aim 2.4 Composite Structure Discussion
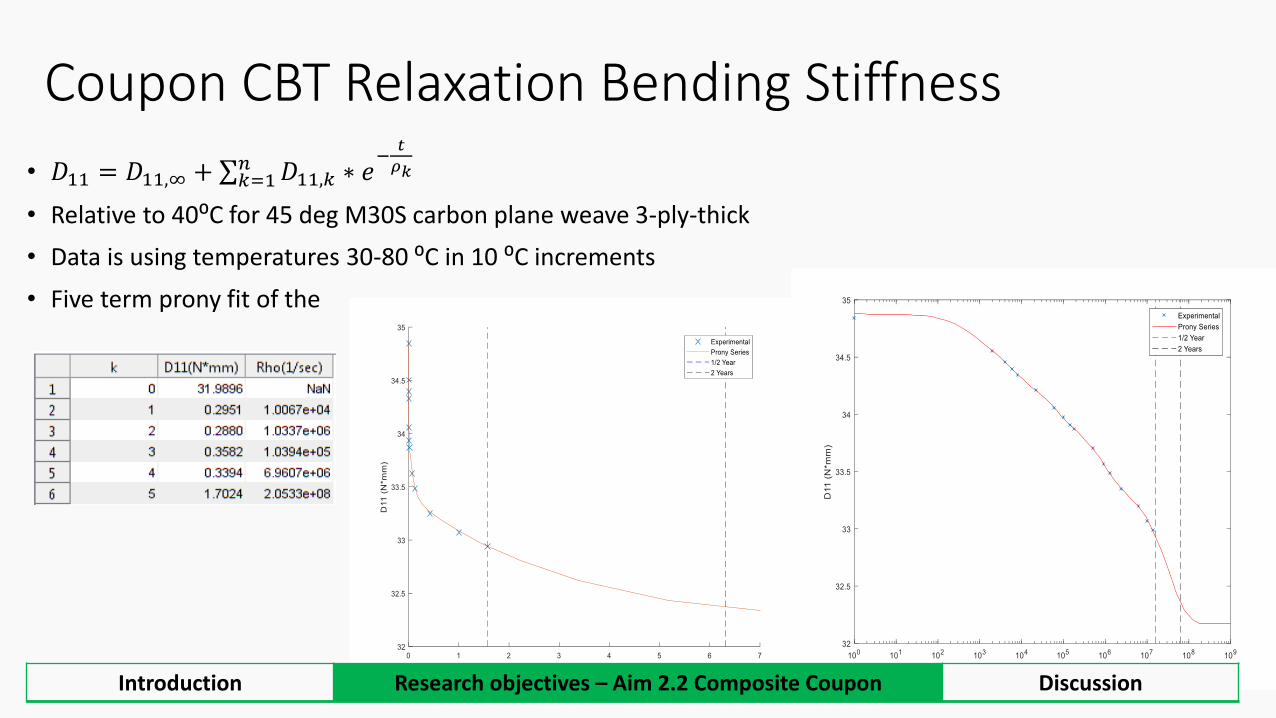
Introduction Research objectives – Aim 1.3 Stress Deformation FEA Discussion
• 𝐷11 = 𝐷11,∞ + σ𝑘=1𝑛 𝐷11,𝑘 ∗ 𝑒
−𝑡
𝜌𝑘
• Relative to 40⁰C for 45 deg M30S carbon plane weave 3-ply-thick
• Data is using temperatures 30-80 ⁰C in 10 ⁰C increments
• Five term prony fit of the
Coupon CBT Relaxation Bending Stiffness
Introduction Research objectives – Aim 2.2 Composite Coupon Discussion
• Bending relaxation data for all samples was normalized by the thickness of the thicker coupon in each batch.
• The sample-to-sample thickness variability is acceptable and results show low standard deviations with [±45PW/0/±45 PW]
laminate data having the largest spread given the large effect of the central 0° UD ply thickness on the laminate D*11 value and
its higher variability.
• Most relaxation on ±45° PW laminate (10%), followed by [±45PW/0/±45 PW] laminate (6%) due to the viscoelastic matrix of
the surface plies being highly loaded in shear as coupon gets bent axially.
• 0-90° PW relaxes the least (4.5%) due to elastic fibers oriented in the principal loading 1-direction.
• The ±45° PW laminate showed the largest shift factors resulting in higher relaxation times, while the others had similar time
predictions.
21
Composite coupon Viscoelastic Characterization: Test Data Summary
2x DCB Laminate
-10%-4.5% -6%
0
0.5
1
1.5
2
2.5
3
0 5000 10000 15000 20000 25000
REL
AX
ATI
ON
MO
DU
LUS
(GP
A)
TIME (SECONDS)
F7 RELAXATION MODULUS
S37 80C Er (Gpa) S38 80C Er (Gpa) S38-2 80C Er (Gpa) S19 80c Er (Gpa) S18 80C Er (Gpa) 90c Er (Gpa) 80c Er (Gpa)
100c S69 70c Er (Gpa) 30c Er (Gpa) 40c Er (Gpa) 50c Er (Gpa) 60c Er (Gpa)
Composite Variance
Sample 1 Sample 2
D11 82 N*mm 76 N*mm
Thickness 0.241 mm 0.234 mm
FVF 60.4% 62.4%
RVF 38.4% 38.5%
Voids 1.2% -0.9%
Fiber Volume Fraction - Jin Ho Kang and Brian Grimsley
Acid digestion method (ASTM 3171-15)
Procedure: (1) Heat in sulfuric acid at 280C for 3 hours
(2) Heat in hydrogen peroxide at 280C for 3 hours
(3) Vacuum filtering / rinse with DI water & Acetone
(4) Drying and measure weight the fiber
More voids and increased
thickness moves fibers away from neutral axis
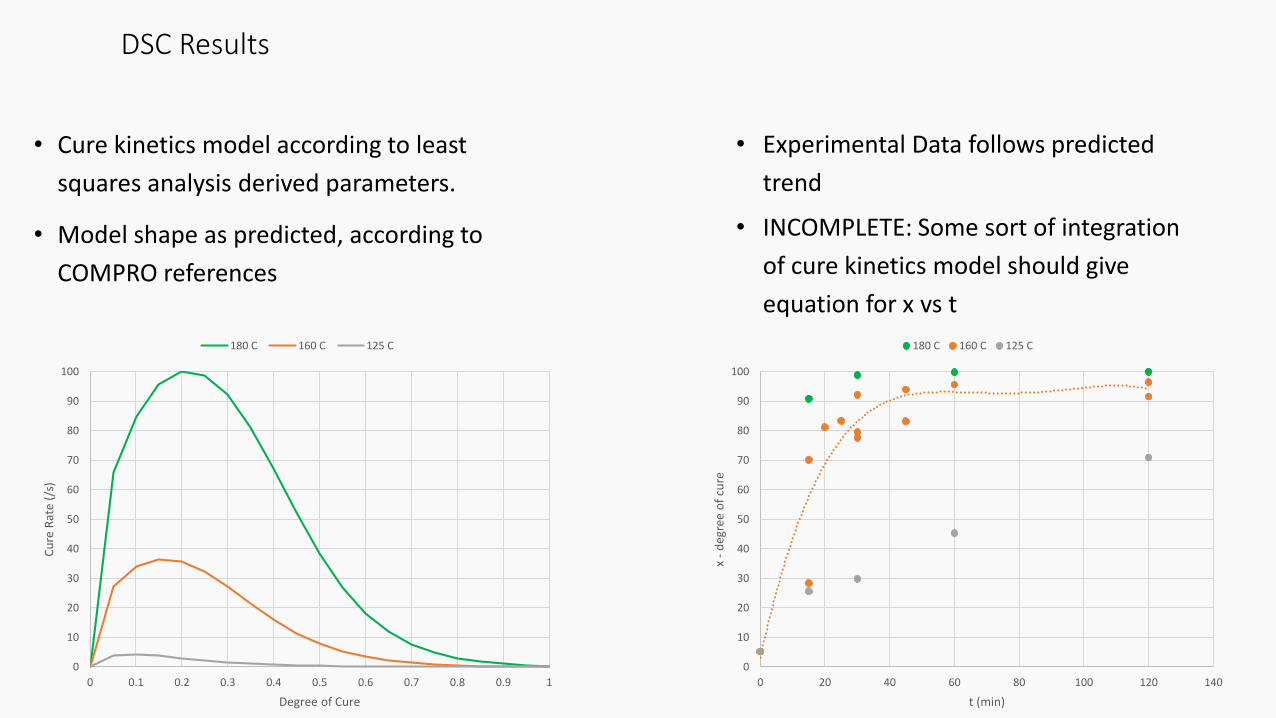
DSC Results
• Cure kinetics model according to least
squares analysis derived parameters.
• Model shape as predicted, according to
COMPRO references
• Experimental Data follows predicted
trend
• INCOMPLETE: Some sort of integration
of cure kinetics model should give
equation for x vs t
0
10
20
30
40
50
60
70
80
90
100
0 20 40 60 80 100 120 140
x -
deg
ree
of
cure
t (min)
180 C 160 C 125 C
0
10
20
30
40
50
60
70
80
90
100
0 0.1 0.2 0.3 0.4 0.5 0.6 0.7 0.8 0.9 1
Cu
re R
ate
(/s)
Degree of Cure
180 C 160 C 125 C
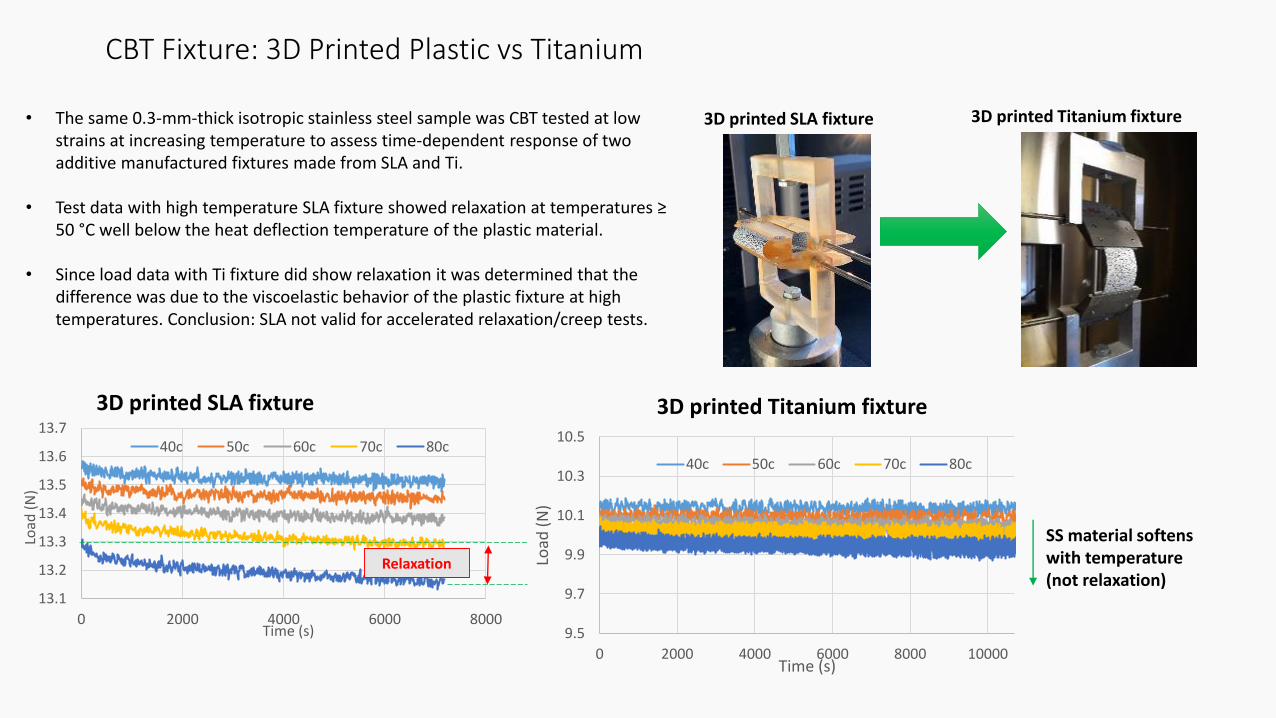
CBT Fixture: 3D Printed Plastic vs Titanium
3D printed Titanium fixture• The same 0.3-mm-thick isotropic stainless steel sample was CBT tested at low strains at increasing temperature to assess time-dependent response of two additive manufactured fixtures made from SLA and Ti.
• Test data with high temperature SLA fixture showed relaxation at temperatures ≥ 50 °C well below the heat deflection temperature of the plastic material.
• Since load data with Ti fixture did show relaxation it was determined that the difference was due to the viscoelastic behavior of the plastic fixture at high temperatures. Conclusion: SLA not valid for accelerated relaxation/creep tests.
13.1
13.2
13.3
13.4
13.5
13.6
13.7
0 2000 4000 6000 8000
Load
(N
)
Time (s)
40c 50c 60c 70c 80c
3D printed SLA fixture
Relaxation
9.5
9.7
9.9
10.1
10.3
10.5
0 2000 4000 6000 8000 10000
Load
(N
)
Time (s)
40c 50c 60c 70c 80c
SS material softens with temperature (not relaxation)
3D printed Titanium fixture
3D printed SLA fixture
-20
0
20
40
60
80
100
120
0 0.02 0.04 0.06 0.08 0.1 0.12 0.14
Mo
me
nt
[N-m
m]
Curvature [mm^-1]
Experimental Moment vs. Curvature
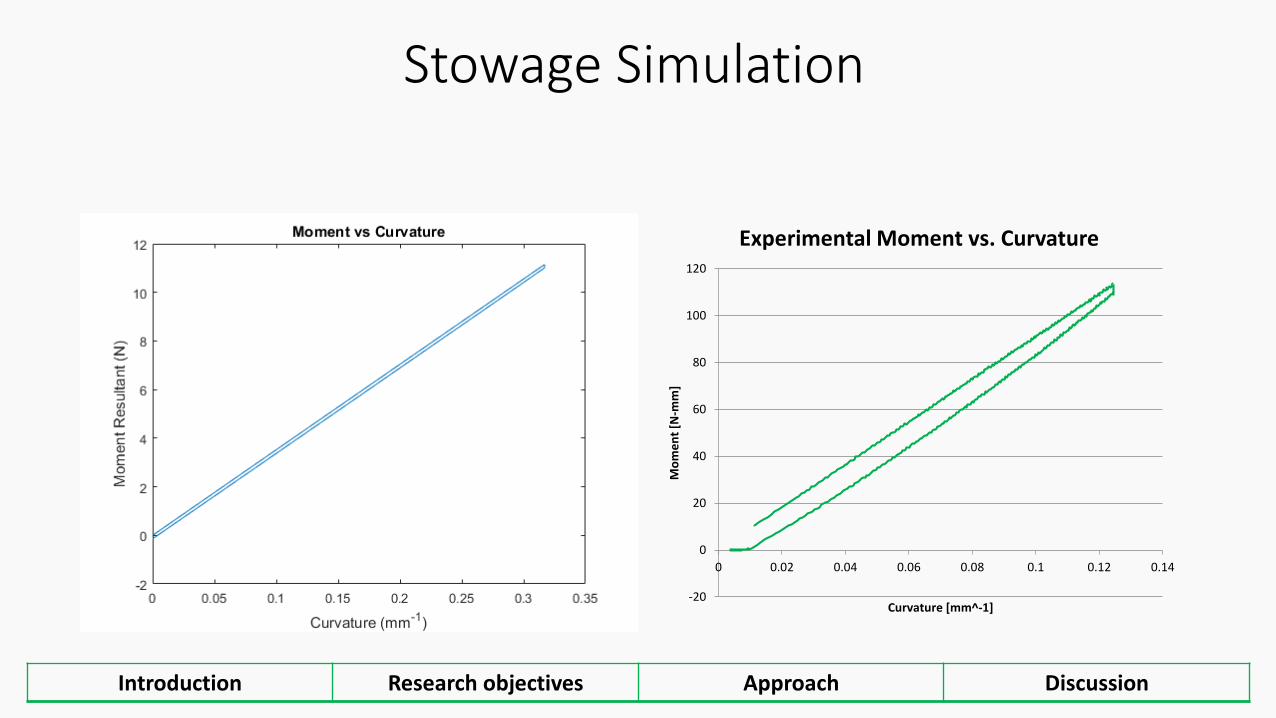
Stowage Simulation
Introduction Research objectives Approach Discussion
Stowage Simulation
-20
0
20
40
60
80
100
120
0 5000 10000 15000 20000 25000
Mo
me
nt
[N-m
m]
Time [s]
Moment vs. Time 4
Introduction Research objectives Approach Discussion
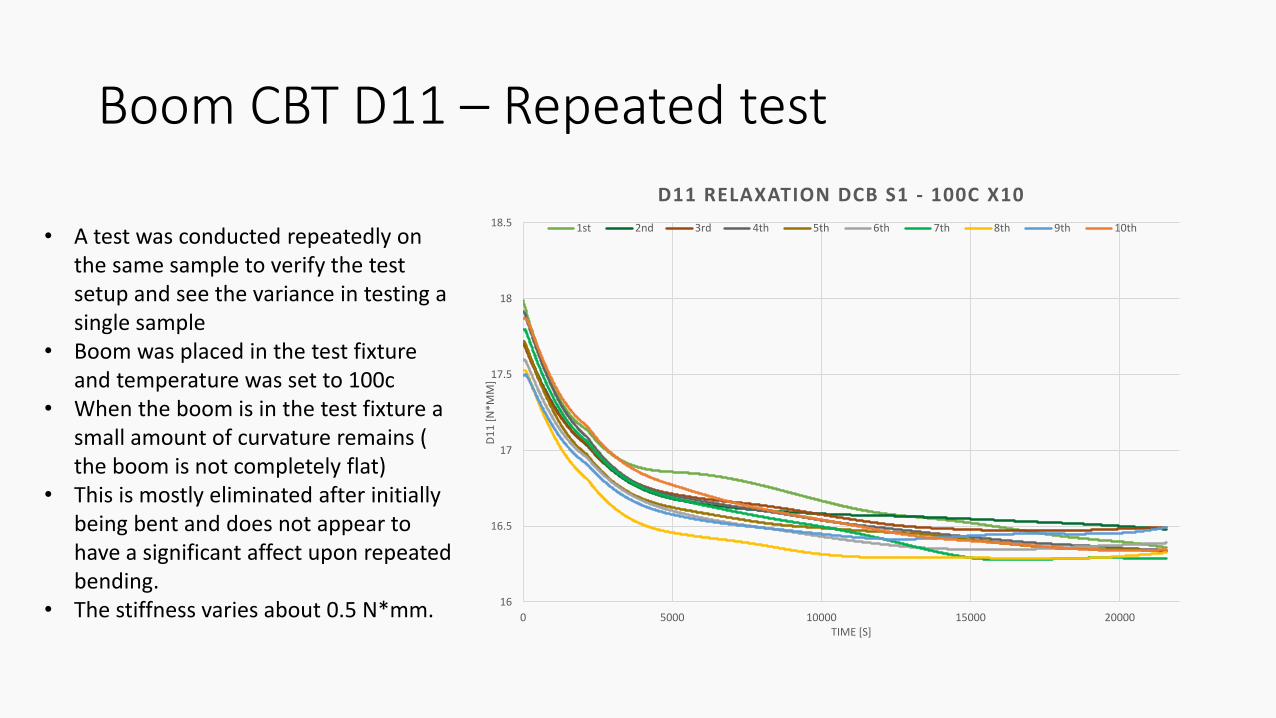
Boom CBT D11 – Repeated test
16
16.5
17
17.5
18
18.5
0 5000 10000 15000 20000
D1
1 [
N*M
M]
TIME [S]
D11 RELAXATION DCB S1 - 100C X10
1st 2nd 3rd 4th 5th 6th 7th 8th 9th 10th• A test was conducted repeatedly on
the same sample to verify the test setup and see the variance in testing a single sample
• Boom was placed in the test fixture and temperature was set to 100c
• When the boom is in the test fixture a small amount of curvature remains ( the boom is not completely flat)
• This is mostly eliminated after initially being bent and does not appear to have a significant affect upon repeated bending.
• The stiffness varies about 0.5 N*mm.
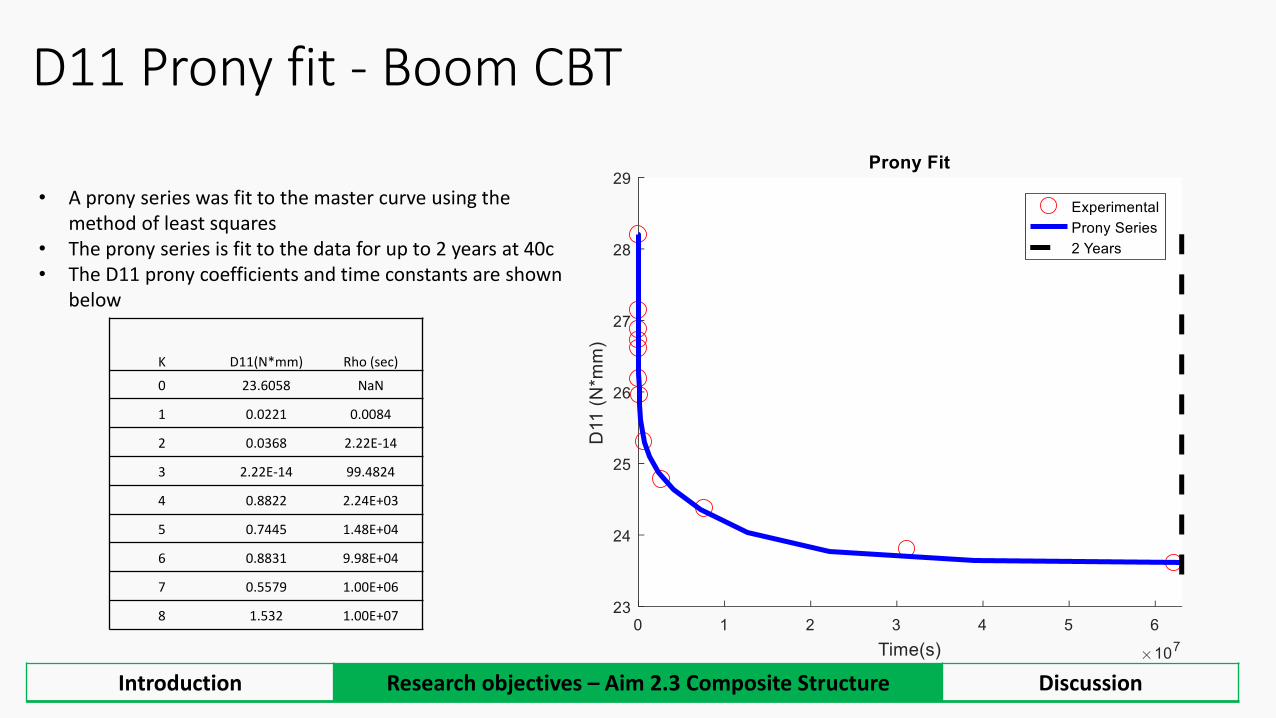
D11 Prony fit - Boom CBT
K D11(N*mm) Rho (sec)
0 23.6058 NaN
1 0.0221 0.0084
2 0.0368 2.22E-14
3 2.22E-14 99.4824
4 0.8822 2.24E+03
5 0.7445 1.48E+04
6 0.8831 9.98E+04
7 0.5579 1.00E+06
8 1.532 1.00E+07
• A prony series was fit to the master curve using the method of least squares
• The prony series is fit to the data for up to 2 years at 40c• The D11 prony coefficients and time constants are shown
below
Introduction Research objectives – Aim 2.3 Composite Structure Discussion
• A compilation of all the master curves from the relaxation test are shown below
• The strain recordings, captured by DIC is shown to the right• The Estimated strain is greater than the measured strain and the
curvature is slightly smaller.• The discrepancy in strain could be from having two bonded laminates
Introduction Research objectives – Aim 2.3 Composite Structure Discussion
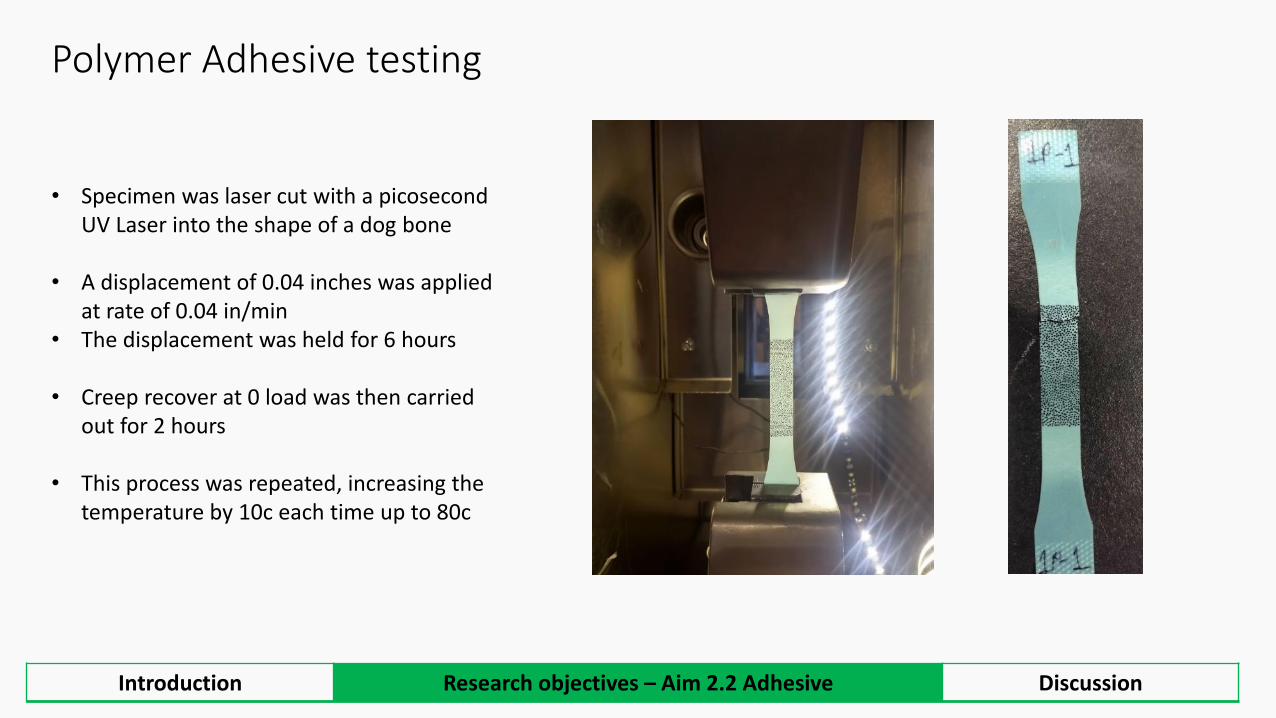
Adhesive Lapshear Test Method Establishment
0
1
2
3
4
5
6
7
8
0 0.1 0.2 0.3 0.4 0.5 0.6 0.7 0.8 0.9 1
LOA
D [
KN
]
DISPLACEMENT [MM]
LAPSHEAR 0.5IN LOAD VS TIME TO FAILURE
40c 80c 120c
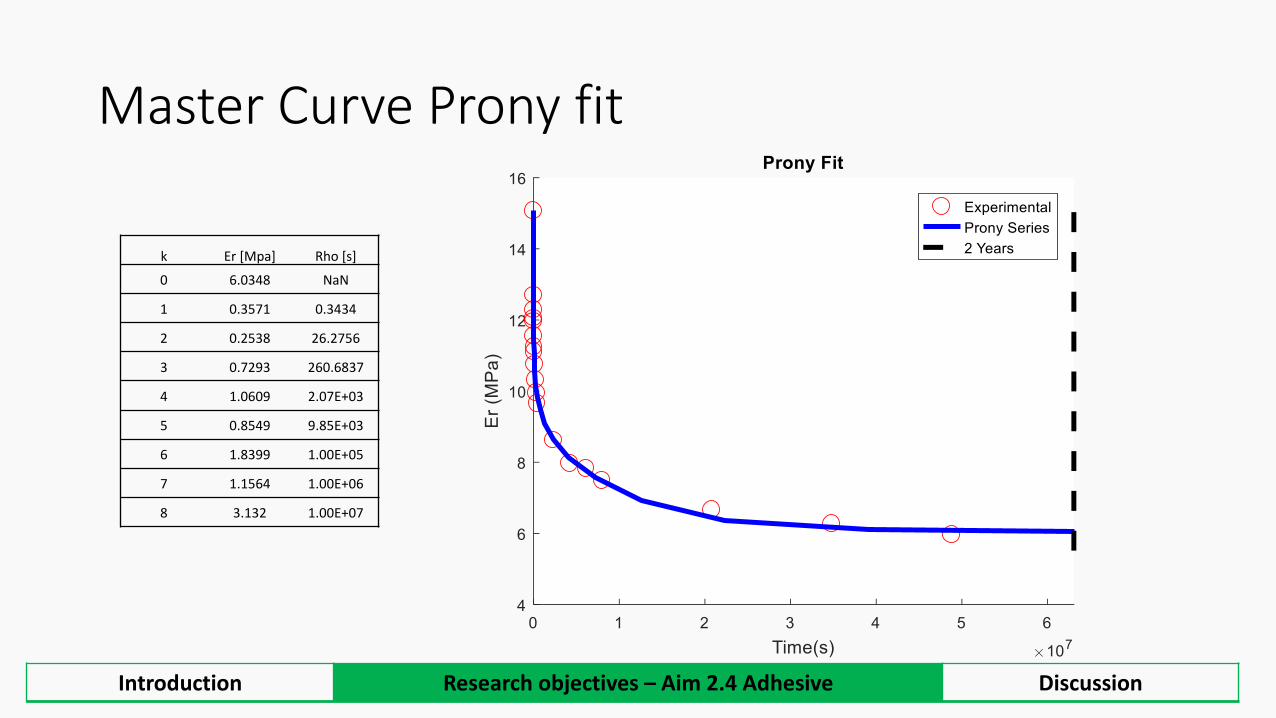
• Lapshear test method in the process of being established for the Adhesive (LOCTITE EA 9696 .03NW AERO) used on the Omega Booms
• Ti Lapshear specimens joined with a 1in by 0.5in patch of adhesive • Lapshear test fixtures had too much slack for recovery test (zero load creep)• Tension grips with spare Ti Specimens bolted to the test specimen is
currently being explored
Master Curve Prony fit
k Er [Mpa] Rho [s]
0 6.0348 NaN
1 0.3571 0.3434
2 0.2538 26.2756
3 0.7293 260.6837
4 1.0609 2.07E+03
5 0.8549 9.85E+03
6 1.8399 1.00E+05
7 1.1564 1.00E+06
8 3.132 1.00E+07
Introduction Research objectives – Aim 2.4 Adhesive Discussion
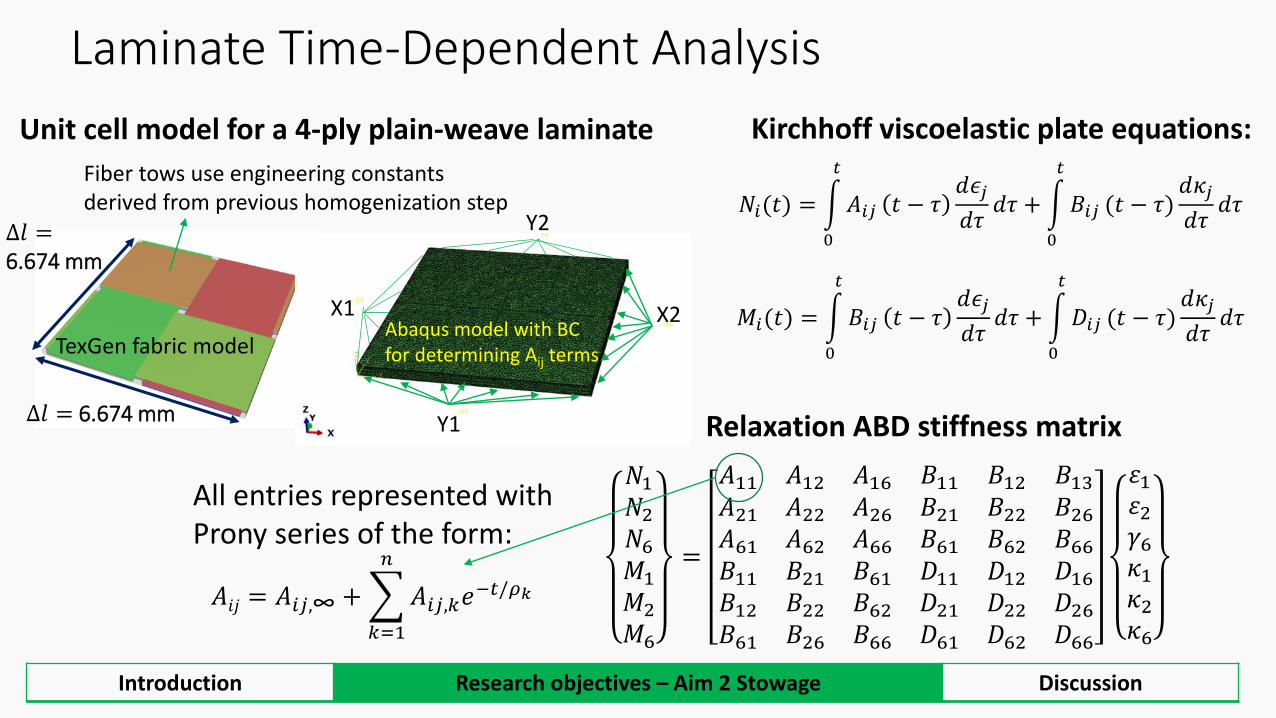
All entries modeled with Prony series of the form:
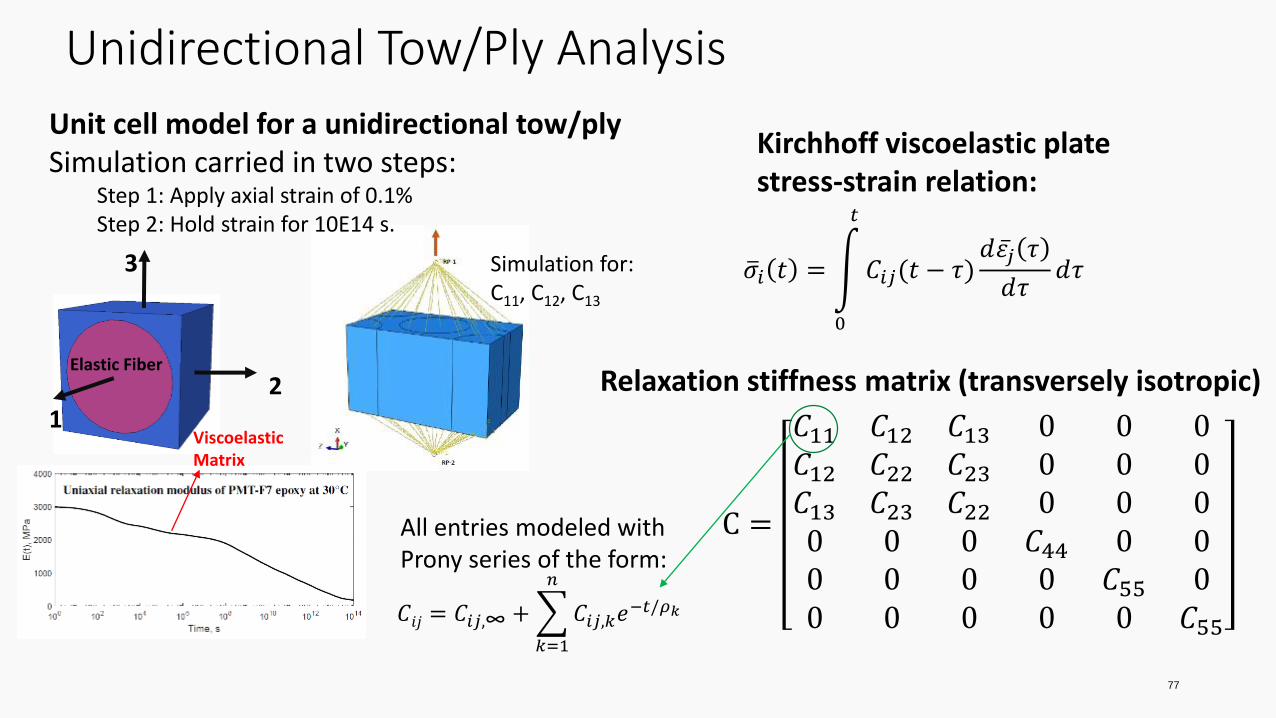
Unit cell model for a unidirectional tow/plySimulation carried in two steps:
Step 1: Apply axial strain of 0.1% Step 2: Hold strain for 10E14 s.
Elastic Fiber
Viscoelastic Matrix
Simulation for:C11, C12, C13
Unidirectional Tow/Ply Analysis• Time dependence of C11 term is insignificant due to elastic fibers are dominant in the 1-direction.
• The rest of the tensor modulus terms show a similar time-dependence behavior due to the viscoelastic matrix response.
• Non-linear curve fitting using the least square method of the relaxation data from the numerical analysis was employed to obtain the Prony series coefficients.
Prony coefficients and relaxation time of tow fiber model M30S fiber tow relaxation moduli
All entries represented with Prony series of the form:
𝑁𝑖(𝑡) = න
0
𝑡
𝐴𝑖𝑗 𝑡 − 𝜏𝑑𝜖𝑗
𝑑𝜏𝑑𝜏 + න
0
𝑡
𝐵𝑖𝑗 (𝑡 − 𝜏)𝑑𝜅𝑗
𝑑𝜏𝑑𝜏
𝑀𝑖(𝑡) = න
0
𝑡
𝐵𝑖𝑗 𝑡 − 𝜏𝑑𝜖𝑗
𝑑𝜏𝑑𝜏 + න
0
𝑡
𝐷𝑖𝑗 (𝑡 − 𝜏)𝑑𝜅𝑗
𝑑𝜏𝑑𝜏
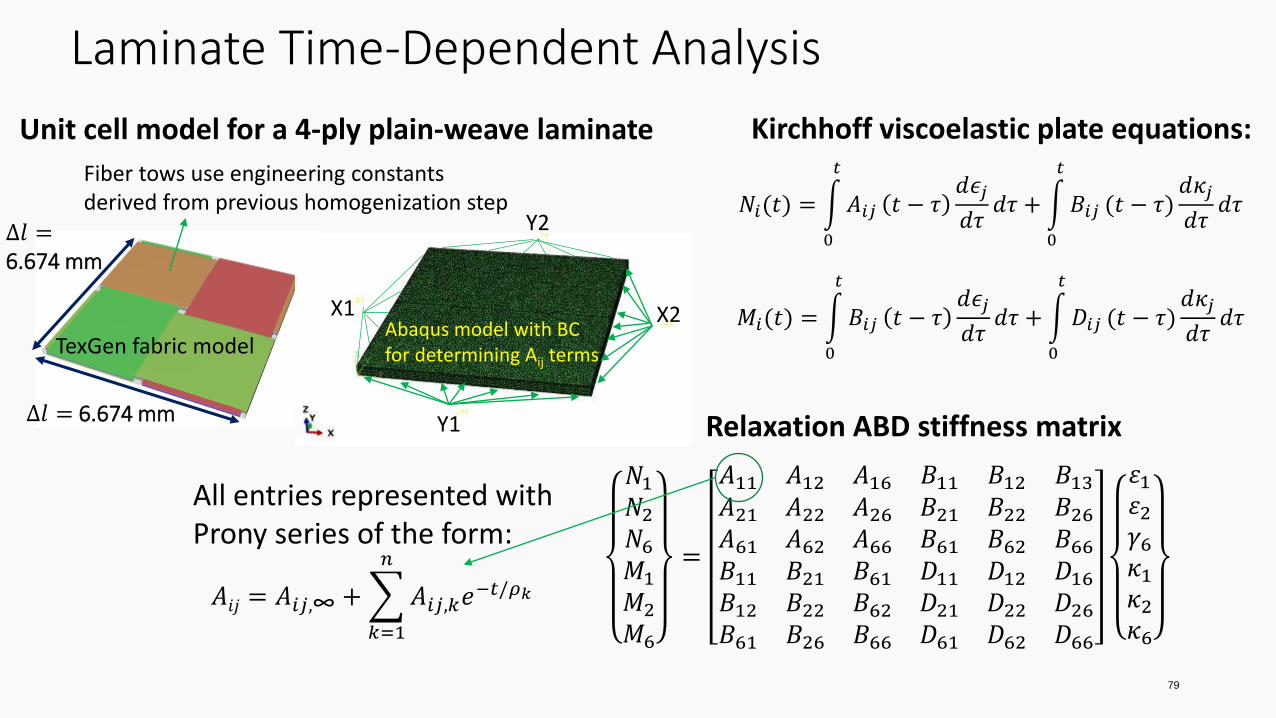
Y1
Y2
X1
TexGen fabric modelAbaqus model with BC for determining Aij terms
X2
Fiber tows use engineering constants derived from previous homogenization step
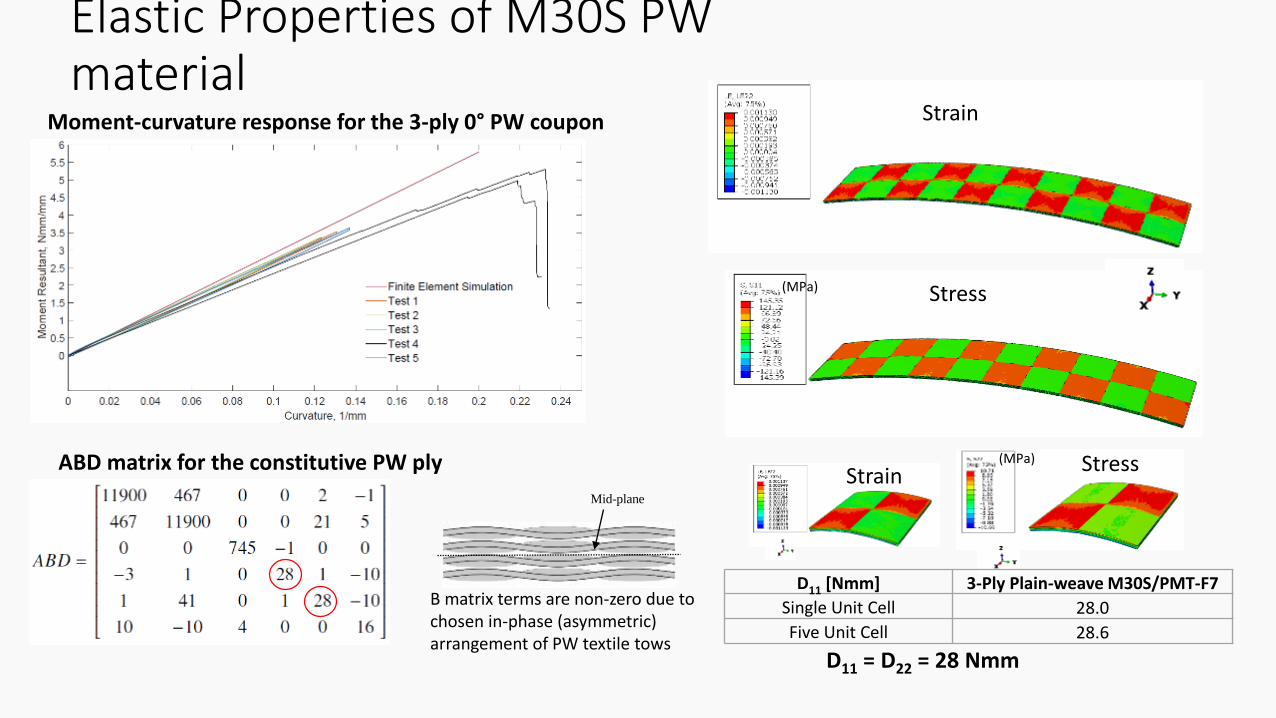
Elastic Properties of M30S PW material
(MPa)
D11 = D22 = 28 Nmm
Moment-curvature response for the 3-ply 0° PW coupon Strain
Stress
ABD matrix for the constitutive PW ply (MPa) Stress Strain
D11 [Nmm] 3-Ply Plain-weave M30S/PMT-F7
Single Unit Cell 28.0
Five Unit Cell 28.6
B matrix terms are non-zero due to chosen in-phase (asymmetric) arrangement of PW textile tows
Mid-plane
81
Computed Axial Relaxation of 4-Ply M30S PW
• Fiber-dominated directions (axial A11, transverse A22) are less prone to relaxation than resin-dominated directions (axial-transverse coupling A12, shear A33).
• All in-plane (A) relaxation moduli show small relaxation.
Terms of the Extensional Stiffness Matrix, A
0° oriented 45° oriented
82
• Fiber-dominated bending directions (D11, D22) are more prone to relaxation/creep than bending coupling loading terms (D12) or twist (D33).
Terms of the Bending Stiffness Matrix, D
• All out-of-plane (D) relaxation moduli show slightly larger relaxation in 45° PW coupons but not as much as anticipated.