Page 1
UNIVERSITÀ DEGLI STUDI DI CAGLIARI
DIPARTIMENTO DI CHIMICA INORGANICA ED ANALITICA
PhD thesis of
Anna Pintus
Design, Synthesis and Characterisation of Homoleptic and Heteroleptic 1,2-Dichalcogenolene Platinum and Gold Complexes with Potential ICT Applications: an Experimental and Theoretical
Study.
Supervisor: Coordinator:
Dr. Massimiliano Arca Prof. Mariano Casu
Scuola di Dottorato in Scienze e Tecnologie Chimiche e Farmaceutiche
XXIII Ciclo, 2008-2010
Page 5
Acknowledgments
I would like to express my gratitude to my supervisor, Dr. Massimiliano Arca, whose
expertise, understanding, and patience, enriched considerably my research experience.
I wish to thank all the other members of the research group I have been working with,
namely Prof. Francesco A. Devillanova, Prof. Vito Lippolis, Dr. M. Carla Aragoni, Prof.
Francesco Isaia, Prof. Gaetano Verani, Dr. Claudia Caltagirone, Dr. Alessandra Garau, and
Dr. Greta De Filippo, for the assistance and encouragement they provided at all levels of
the research project.
I would also like to acknowledge Prof. Dominique Lorcy from Rennes 1 University and
Prof. M. Agostina Cinellu from Sassari University for their crucial contribution to this
work, and Prof. Mike Ward, Dr. Mike J. Morris and Dr. Julia Weinstein, who gave me the
opportunity of spending a productive and stimulating research stay at the University of
Sheffield. I also wish to acknowledge Prof. Francesco Lelj for my useful and educational
stay at the University of Basilicata.
Prof. Mike Hursthouse, Dr. Susanne Huth, Dr. Samantha Callear, Dr. Simon J. Coles, Prof.
J. Derek Woollins, and Prof. Alexandra M. Z. Slawin are acknowledged for the structural
characterisations, and Prof. Marco Sampietro and Dr. Dario Natali for the photophysical
measurements.
My thanks to Mr. Antonio Sabeddu, who performed the elemental analysis measurements
reported in this work.
Finally I would like to thank Dr. Annalisa Mancini and Ms Lucia Ambrosio for their
contribution to this work, and all the students I worked with for providing a stimulating
and fun environment in which to learn and grow.
Page 7
Contents
I
Contents
Contents .............................................................................................................................................. I
List of Compounds ............................................................................................................................ V
1. Introduction ................................................................................................................................... 1
1.1. Synthesis of 1,2-dichalcogenolene ligands and precursors .................................................... 3
1.1.1. Synthesis of arene-1,2-dichalcogenolato ligands ............................................................. 4
1.1.2. Synthesis of alkene-1,2-dichalcogenolato ligands ........................................................... 5
1.1.3. Synthesis of mnt2–, dmit2–, and isologs ............................................................................ 6
1.1.4. Synthesis of R,Rʹ-timdt2– and R–dmet2– ........................................................................... 7
1.2. Homoleptic 1,2-dichalcogenolene metal complexes ............................................................... 8
1.2.1 Synthesis ..........................................................................................................................11
1.2.2. General structural features ..............................................................................................12
1.2.3. Electronic structure .........................................................................................................17
1.2.4. Properties and applications .............................................................................................22
1.2.4.1 Properties in solution .................................................................................................22
1.2.4.1.1. Electrochemical properties ...............................................................................22
1.2.4.1.2. Optical properties .............................................................................................24
1.2.4.1.3. Reactivity ...........................................................................................................31
1.2.4.2 Solid state properties .................................................................................................33
1.2.4.2.1. Electrical properties ..........................................................................................33
1.2.4.2.2. Magnetic properties ..........................................................................................35
1.3. Heteroleptic 1,2-dichalcogenolene metal complexes .............................................................36
1.3.1. Mixed-ligand bis(1,2-dithiolene) complexes ..................................................................36
1.3.2. M(diimine)(dichalcogenolate) complexes .......................................................................40
1.3.2.1. Synthesis ..................................................................................................................41
1.3.2.2. General structural features .......................................................................................42
1.3.2.3. Properties .................................................................................................................45
1.3.2.4. Applications .............................................................................................................47
1.3.3. Other systems containing 1,2-dichalcogenolene ligands. ...............................................51
1.3.3.1. Other mixed-ligand complexes featuring 1,2-dichalcogenolene ligands .................51
1.3.3.2. 1,2-Dithiolenes in nature ..........................................................................................54
2. Objectives ......................................................................................................................................57
3. Results and Discussion ................................................................................................................60
3.1. Synthesis and characterisation of [Au(Ar,H-edt)2]x– complexes (20x–-22x–) ..........................61
Page 8
Contents
II
3.1.1. Synthesis ......................................................................................................................... 61
3.1.2. Structural characterisation .............................................................................................. 63
3.1.3. Electrochemistry ............................................................................................................. 72
3.1.4. Absorption UV-Vis-NIR Spectroscopy .......................................................................... 76
3.1.5. Emission Spectroscopy ................................................................................................... 80
3.1.6. DFT calculations ............................................................................................................ 84
3.1.6.1. Geometry optimisation ............................................................................................ 85
3.1.6.2. Ground state (GS) .................................................................................................... 91
3.1.6.3. Mulliken charges ..................................................................................................... 96
3.1.6.4. Time dependent DFT (TD-DFT) calculations ......................................................... 97
3.1.6.5. Calculation of static first hyperpolarisability (β) ................................................... 109
3.2. Synthesis and characterisation of heteroleptic 1,2-dichalcogenolene complexes ............... 112
3.2.1. Synthesis and characterisation of [Pt(N^N)(E^E)] complexes (53-73) ........................ 112
3.2.1.1. Synthesis ................................................................................................................ 114
3.2.1.2. Structural characterisation ..................................................................................... 124
3.2.1.3. Electrochemistry .................................................................................................... 136
3.2.1.4. Absorption UV-Vis-NIR Spectroscopy ................................................................. 143
3.2.1.5. Spectroelectrochemical measurements .................................................................. 153
3.2.1.6. Emission Spectroscopy .......................................................................................... 154
3.2.1.7. DFT calculations ................................................................................................... 159
3.2.1.7.1. Geometry Optimisation ................................................................................... 160
3.2.1.7.2. Ground State (GS) .......................................................................................... 165
3.2.1.7.3. Charges ........................................................................................................... 173
3.2.1.7.4. Time-Dependent DFT (TD-DFT) calculations ............................................... 179
3.2.1.7.5. Calculation of static first hyperpolarisability (β) ........................................... 186
3.2.1.8. Photoconduction measurements ............................................................................ 190
3.2.2. Synthesis and characterisation of [Au(Py1)(mnt)] (76) ................................................ 193
3.2.2.1 Synthesis and Characterisation ............................................................................... 194
3.2.2.2. DFT calculations ................................................................................................... 197
4. Conclusions ................................................................................................................................ 205
5. Experimental .............................................................................................................................. 208
5.1. Instrumentation .................................................................................................................... 208
5.1.1. Microanalytical measurements ..................................................................................... 208
5.1.2. FT-IR Spectroscopy ...................................................................................................... 208
5.1.3. 1H NMR Spectroscopy ................................................................................................. 208
5.1.4. Mass spectroscopy ........................................................................................................ 208
Page 9
Contents
III
5.1.5. UV-Vis-NIR Spectroscopy ...........................................................................................209
5.1.6. Emission spectroscopy ..................................................................................................209
5.1.7. Electrochemistry ...........................................................................................................209
5.1.8. Spectroelectrochemistry ................................................................................................210
5.1.9. X-ray diffraction ...........................................................................................................210
5.1.10. Photoconduction measurements ..................................................................................211
5.2. Synthesis ...............................................................................................................................212
5.2.1. Synthesis and characterisation of ligands and precursors .............................................212
5.2.1.1. Synthesis of isopropyl xanthate .............................................................................213
5.2.1.2. Synthesis of O-Isopropyl S-Phenyl Dithiocarbonate (23) ......................................213
5.2.1.3. Synthesis of O-Isopropyl S-Naphthacyl Dithiocarbonate (24) ...............................214
5.2.1.4. Synthesis of O-Isopropyl S-Pyrenacyl Dithiocarbonate (25) .................................214
5.2.1.5. Synthesis of Phenyl-1,3-dithiol-2-one (26) ............................................................215
5.2.1.6. Synthesis of Naphthyl-1,3-dithiol-2-one (27) ........................................................215
5.2.1.7. Synthesis of 1-Pyrenyl-1,3-dithiol-2-one (28) .......................................................215
5.2.2. Synthesis and characterisation of the 1,2-dithiolene complexes ...................................216
5.2.2.1. Synthesis of (TBA+)[Au(Ar,H-edt)2]– complexes (Ar = Ph, 2-Naph, 1-Pyr) .........216
5.2.2.1.1. Synthesis and characterisation of (TBA+)[Au(Ph,H-edt)2]– (TBA+)(20–) .......216
5.2.3.1.2. Synthesis and characterisation of (TBA+)[Au(Naph,H-edt)2]– (TBA+)(21–) ...217
5.2.3.1.3. Synthesis and characterisation of (TBA+)[Au(Pyr,H-edt)2]– (TBA+)(22–) ......217
5.2.2.2. Synthesis of Platinum(diimine)(dithiolate) complexes [Pt(N^N)(S^S)] ................218
5.2.2.2.1. Synthesis and characterisation of [Pt(2,2ʹ-bipy)(Ph,H-edt)] (53) ..................218
5.2.2.2.2. Synthesis and characterisation of [Pt(2,2ʹ-bipy)(Naph,H-edt)] (54) ..............218
5.2.2.2.3. Synthesis and characterisation of [Pt(2,2ʹ-bipy)(Pyr,H-edt)] (55) .................219
5.2.2.2.4. Synthesis and characterisation of [Pt(2,2ʹ-bipy)(Me-dmet)] (56) ...................219
5.2.2.2.5. Synthesis and characterisation of [Pt(2,2ʹ-bipy)(Et-dmet)] (57) ....................220
5.2.2.2.6. Synthesis and characterisation of [Pt(2,2ʹ-bipy)(Ph-dmet)] (58) ...................221
5.2.2.2.7. Synthesis and characterisation of [Pt(2,2ʹ-bipy)(Me-dset)] (59) ....................221
5.2.2.2.8. Synthesis and characterisation of [Pt(1,10-phen)(Ph,H-edt)] (60) ................222
5.2.2.2.9. Synthesis and characterisation of [Pt(1,10-phen)(Naph,H-edt)] (61) ............223
5.2.2.2.10. Synthesis and characterisation of [Pt(1,10-phen)(Pyr,H-edt)] (62) .............223
5.2.2.2.11. Synthesis and characterisation of [Pt(1,10-phen)(Me-dmet)] (63) ...............224
5.2.2.2.12. Synthesis and characterisation of [Pt(1,10-phen)(Et-dmet)] (64) ................224
5.2.2.2.13. Synthesis and characterisation of [Pt(1,10-phen)(Ph-dmet)] (65) ...............225
5.2.2.2.14. Synthesis and characterisation of [Pt(1,10-phen)(Me-dset)] (66) ................226
5.2.2.2.15. Synthesis and characterisation of [Pt(5,5ʹ-Me2-bipy)(Me-dmet)] (67) .........226
Page 10
Contents
IV
5.2.2.2.16. Synthesis and characterisation of [Pt(4,4ʹ-Me2-bipy)(Me-dmet)] (68) ........ 226
5.2.2.2.17. Synthesis and characterisation of [Pt(4,4ʹ-tBu2-bipy)(Me-dmet)] (69) ........ 227
5.2.2.2.18. Synthesis and characterisation of [Pt(4,4ʹ-Ph2-bipy)(Me-dmet)] (70) ......... 227
5.2.2.2.19. Synthesis and characterisation of [Pt(3,7-Ph2-phen)(Me-dmet)] (71) ......... 228
5.2.2.2.20. Synthesis and characterisation of [Pt(3,4,7,8-Me4-phen)(Me-dmet)] (72) .. 228
5.2.2.2.21. Synthesis and characterisation of [Pt(4,4ʹ-tBu2-bipy)(Fc,H-edt)] (73) ........ 229
5.2.2.3. Synthesis and characterisation of [Au(Py1)(mnt)] (76) ......................................... 230
5.3. Theoretical Calculations ..................................................................................................... 230
5.3.1. Calculations on [Au(Ar,H-edt)2]x– complexes (20x–-22x–) (x = 0-2) ............................. 231
5.3.2. Calculations on [Pt(N^N)(S^S)] complexes (53-73, 75) and [Au(Py1)(mnt)] (76) ...... 231
Annex A ......................................................................................................................................... 233
A.1. Preliminary calculations performed on 56 ......................................................................... 233
A.2. Calculations performed on 59 with CRENBL+ECP on Se ................................................. 237
References and Notes .................................................................................................................... 239
Page 11
List ofCompounds
V
List of Compounds
1 [Ni(Ph2-edt)2] 2 [Ni(mnt)2] 3 [Ni(H2-edt)2] 4 [Pd(H2-edt)2] 5 [Pt(H2-edt)2] 6 [Ni(dfcdt)2] 7 [Ni(fcdt)2] 8 [Ni(dfcvt)2] 9 [Ni(Et-dmet)2] 10 [Pd(Et-dmet)2] 11 [Pt(Et-dmet)2] 12 [Ni(dmit)2] 13 [Ni(Et2-timdt)2] 14 [Pt(mnt)2] 15 [Au(mnt)2] 16 [Pt(2,2ʹ-bipy)(tds)] 17 [Pt(ppy)(mnt)] 18 [Pt(tpy)(mnt)] 19 [Au(ppy)(tdt)] 20 [Au(Ph,H-edt)2] 21 [Au(Naph,H-edt)2] 22 [Au(Pyr,H-edt)2] 23 O-Isopropyl S-Phenyl Dithiocarbonate 24 O-Isopropyl S-Nahthyl Dithiocarbonate 25 O-Isopropyl S-Pyrenyl Dithiocarbonate 26 Phenyl-1,3-dithiol-2-one 27 2-Naphthyl-1,3-dithiol-2-one 28 1-Pyrenyl-1,3-dithiol-2-one 29 [Au(2-Py,H-edt)2] 30 [Au(3-Py,H-edt)2] 31 [Au(4-Py,H-edt)2] 32 [Au(C6H4S2)2] 33 [Au(Ph2-edt)2] 34 2,5-Bis(naphthyl)-thiophene 35 [Zn(Me-dmet)2] 36 [Ni(Me-dmet)2] 37 [Pd(Me-dmet)2] 38 [Zn(Me-dset) 2] 39 [Ni(Me-dset)2] 40 [Pd(Me-dset)2] 41 [Pt(2,2ʹ-bipy)Cl2] 42 [Pt(1,10-phen)Cl2] 43 [Pt(5,5ʹ-Me2-bipy)Cl2]
Page 12
List of Compounds
VI
44 [Pt(4,4ʹ-Me2-bipy)Cl2] 45 [Pt(4,4ʹ-tBu2-bipy)Cl2] 46 [Pt(4,4ʹ-Ph2-bipy)Cl2] 47 [Pt(3,7-Ph2-phen)Cl2] 48 [Pt(3,4,7,8-Me4-bipy)Cl2] 49 N-Methyl-4,5-bis(2ʹ-cyanoethylthio)-1,3-thiazol-2-thione 50 N-Ethyl-4,5-bis(2ʹ-cyanoethylthio)-1,3-thiazol-2-thione 51 N-Phenyl-4,5-bis(2ʹ-cyanoethylthio)-1,3-thiazol-2-thione 52 N-Methyl-4,5-bis(2ʹ-cyanoethylseleno)-1,3-thiazol-2-thione 53 [Pt(2,2ʹ-bipy)(Ph,H-edt)] 54 [Pt(2,2ʹ-bipy)(Naph,H-edt)] 55 [Pt(2,2ʹ-bipy)(Pyr,H-edt)] 56 [Pt(2,2ʹ-bipy)(Me-dmet)] 57 [Pt(2,2ʹ-bipy)(Et-dmet)] 58 [Pt(2,2ʹ-bipy)(Ph-dmet)] 59 [Pt(2,2ʹ-bipy)(Me-dset)] 60 [Pt(1,10-phen)(Ph,H-edt)] 61 [Pt(1,10-phen)(Naph,H-edt)] 62 [Pt(1,10-phen)(Pyr,H-edt)] 63 [Pt(1,10-phen)(Me-dmet)] 64 [Pt(1,10-phen)(Et-dmet)] 65 [Pt(1,10-phen)(Ph-dmet)] 66 [Pt(1,10-phen)(Me-dset)] 67 [Pt(5,5ʹ-Me2-bipy)(Me-dmet)] 68 [Pt(4,4ʹ-Me2-bipy)(Me-dmet)] 69 [Pt(4,4ʹ-tBu2-bipy)(Me-dmet)] 70 [Pt(4,4ʹ-Ph2-bipy)(Me-dmet)] 71 [Pt(3,7-Ph2-phen)(Me-dmet)] 72 [Pt(3,4,7,8-Me4-phen)(Me-dmet)] 73 [Pt(4,4ʹ-tBu2-bipy)(Fc,H-edt)] 74 Ferrocenyl-1,3-dithiol-2-one 75 [Pt(phen)(tdt)] 76 [Au(Py1)(mnt)] 77 [Au(Py1)Cl2]
Page 15
Introduction
1
1. Introduction
Metal 1,2-dithiolenes are a well-studied class of coordination compounds, featuring 1,2-
dialkene- or 1,2-diaryl dithiolates ligands. The name of 1,2-dithiolene was originally
introduced by Mc Cleverty1
as a simple nomenclature to describe the metal complexes
bearing bidentate sulphur-donor ligands connected via an unsaturated carbon-carbon
bond (Scheme 1.1), and refer neither to a specific molecular charge nor to the oxidation
state of the central metal ion.
S
S S-
S-
cddtdddtS
S S-
S- S
S S-
S-
ddt
madtmantmnt
H2N
NC
S-
S-
O
H2N
H2NS-
S-
O
O
NC
NC S-
S-F3C
F3C S-
S-
tfd
dmt
SS
S-
S-
S
S
S
S-
S-
mdt
S
S
S-
S-O
dmio dmise
S
S
S-
S-Se
dtcs
S-
S-O
O
O
HN
S-
S-
O
Omidtα-tpdt
S
S-
S-
btdt
S
S
S
S
S-
S-
tds
NS
N
S-
S-
R-dmet
N
S
S-
S-S
R
R,R'-timdt
N
N S-
S-
qdt pdt
N
N S-
S-
medtS
S S-
S-
Me
phdt
S
S S-
S-
Ph
dphdt bdt
S-
S-
N
N
S-
S-S
R
R'
S-
S-Me
tdt
S
S S-
S-
Ph
Ph
S-
S-
S
Sddtdt ttdt
S-
S-S
S
S
S-
S-O
S
Sdiod F2pdt
S-
S-
S
SF
F
H
H S-
S-
edt
S-
S-
O
O
dtsq
S
S
S-
S-S
dmit
Scheme 1.1. Selected 1,2-dithiolene ligands and commonly used acronyms. All ligands have been drawn
in their 1,2-dithiolato form.
Page 16
Introduction
2
The chemistry of 1,2-dithiolene ligands has been finding increasing interest in the
scientific community over the past 40 years, although unsaturated 1,2-dithiolates, such
as toluene-3,4-dithiolate (tdt2–, Scheme 1.1), and their reactivity towards several metal
ions have been subject of study since the mid-1930s by Clarck and coworkers.2 In 1957,
Bähr and Schleitzer3 first reported a Pd complex deriving from the sodium salt of a
ligand they had prepared, Na2mnt (mnt2– = 1,2-maleonitrile-1,2-dithiolate, Scheme 1.1),
and observed that the complex could be oxidised to an unidentified product. Two years
later, Stevancevic and Drazic4 reported some dianionc metal complexes derived from
quinoxaline-2,3-dithiol (H2qdt, Scheme 1.1). Nevertheless, it was only in the mid-1960s
with the seminal works by Schrauzer and Mayweg5 on [Ni(Ph2-edt)2] (1, Ph2-edt2– =
1,2-diphenyl-ethylene-1,2-dithiolato), and by Gray on nickel maleonitrile-1,2-dithiolate
complexes6 (2) that the chemistry of 1,2-dithiolene complexes started to attract the
interest of researchers. Since then, a very large variety of different 1,2-dithiolene
ligands and their complexes with numerous metal ions has been reported, and the
interest in 1,2-dithiolene chemistry has been continuously increasing,7 also because of
the discovery of a large number of applications, in fields as varied as c3onductivity,
magnetism, linear and nonlinear optical properties, and due to the role of 1,2-dithiolene
systems in biology.8
In 1967, in view of interest focusing on the chemistry of 1,2-dithiolene complexes,
Davison and Shawl thought it was reasonable to prepare the corresponding selenium-
containing complexes, and synthesised several 1,2-diselenolene transition metal
complexes.
9 The number of scientific works addressing metal complexes bearing 1,2-
diselenolene ligands (Scheme 1.2) is much smaller than that regarding 1,2-dithiolene
complexes, both because of synthetic difficulties and because the properties of these
complexes are very similar to those of the fully sulphured congeners.10 Descending
Page 17
Introduction
3
along the chalcogen group, only very few publications have addressed the synthesis and
characterisation of 1,2-ditellurolene complexes.11
mns
NC
NC Se-
Se- F3C
F3C Se-
Se-
tds
S
S
Se-
Se-S
dsit dsitse
Se
S
Se-
Se-Se
dssq
Se-
Se-
O
O N
N Se-
Se-
pdse
S
S Se-
Se-
ddds
dsise
S
S
Se-
Se-Se
Se
Se
Se-
Se-Se
dsis
Scheme 1.2. Selected 1,2-diselenolene ligands and commonly used acronyms. All ligands have been
drawn in their 1,2-diselenolato form.
Due to the great variety of application fields, 1,2-dichalcogenolene ligands appear in a
huge number of both homoleptic and heteroleptic complexes. In this chapter, an
overview on the synthesis of different 1,2-dichalcogenolene ligands and the synthesis,
properties and applications of their metal homoleptic and heteroleptic complexes will be
briefly provided.
1.1. Synthesis of 1,2-dichalcogenolene ligands and precursors
The synthesis of metal complexes deriving from 1,2-dichalcogenolato ligands is
generally complicated by the tendency of these ligands to polymerise or decompose.12
A plethora of different and specific synthetic routes to 1,2-dichalcogenolene ligands has
been reported, but some general routes can be identified.13
Page 18
Introduction
4
1.1.1. Synthesis of arene-1,2-dichalcogenolato ligands
Arene-1,2-dichalcogenolene ligands are generally stable as 1,2-dichalcogenolato
sodium salts,14
and can be prepared by following two different synthetic approaches, as
shown in Scheme 1.3 for bdt2–.
SR
SR
S-
S-
reductive
dealkylation
X
X
SH
SH SH
(i) CuSR/NaSRX= Br, Cl -2H+(ii)
2) S8
3) H+
1) BuLi
Scheme 1.3. Strategies for the synthesis of 1,2-benzenedithiolate (bdt2–) and related ligands.
According to the former synthetic route, the desired dihalo-arene is reacted with
cuprous or sodium thiolates to give the corresponding vicinal thioether, which can be
reductively dealkylated to give the dithiol.15
The corresponding diselenolene ligand can be obtained by reacting the desired 1,2-
dibromoarene with Na2Se to give a poly(o-arylenediselenide), which can be reduced by
NaBH4, yielding a arene-1,2-diselenolate anion.
Alternatively, the appropriate arenethiol is
reacted with n-BuLi, and the resulting lithiated product is made to react with elemental
sulphur to give the corresponding 1,2-dithiolate salt.
16
Page 19
Introduction
5
1.1.2. Synthesis of alkene-1,2-dichalcogenolato ligands
Compared to arene-1,2-dithiols, alkene-1,2-dithiols and the corresponding dithiolates
are generally much less stable, and must be protected until reacted with the metal salt.
Also in this case, several synthetic routes are available, as summarised in Scheme 1.4.
XSR
X
SR
SR
SR
Cl
Cl
S-
S-
Br
OO
S
OS
OCHMe2
S
SO
S
SS
Z
Z
S
SS
S
OS
NR2
S
SNH
O S
S
OS
S
RO-/Me4NOH
(ii)reductive
dealkylation
(i)RSH/Cu+
RSH,Cu+
X2
Br2
R2NCS2-
Me2CHOCS2Na
H2SO4
H2SO4
(iii)
Hg(OAc)2
C
CAIBN
C2Z2
RSH,Cu+
Scheme 1.4. Strategies for the synthesis of ethylene-1,2-dithiolato ligands.
A first method [(i) in Scheme 1.4] is analogous to that described for arene-1,2-
dithiolates: an appropriate dithioether, such as a cis-1,2-bis(benzylthio)alkene (Rʹ =
CH2Ph in Scheme 1.4), is made to react with a strongly reducing agent to give the
corresponding cis-alkene-1,2-dithiolato. The dithioether can be obtained starting from
mono- or 1,2-dihaloalkenes.
In the second method, α-bromoketones, obtainable by direct halogenation of the desired
ketones, are reacted with alkylxanthate or N,Nʹ-dialkyldithiocarbamate salts [typically
Page 20
Introduction
6
iPrOCS2Na and (iPr)2NCS2Na, respectively]17
17
to give the corresponding α-ketoxanthate
or α-ketodithiocarbamate esters, which undergo cyclisation in strongly acid medium to
give the vinylene dithiocarbonate or iminiumdithiocarbonate. Both types of compounds
lead to the desired symmetrically or asymmetrically substituted alkene-1,2-dithiolate
when reacted with strong bases [reactions (ii) and (iii) in Scheme 1.4]. ,18
Alternatively, 1,3-dithiol-2-ones can be obtained by reacting diisopropylxanthogen
disulfide with unsaturated substrates, such as disubstituted alkynes R2C2, in the presence
of AIBN [azo bis (isobutyronitrile)], a radical initiator.
19
Finally, vinylene dithiocarbonates can be obtained by reacting mercury(II) acetate with
the corresponding trithiocarbonates, generated by reaction of electrophilic alkynes with
ethylene trithiocarbonate.
20 Analogously, disubstituted vinylene triselenocarbonates
have been obtained by reacting the corresponding ethylenetriselenocarbonates with
activated alkynes R2C2.21
1.1.3. Synthesis of mnt2–, dmit2–, and isologs
Specific procedures have been used for the synthesis of the two most commonly
adopted 1,2-dithiolene ligands, mnt2– and dmit2–, and their selenium isologs (Schemes
1.1 and 1.2). The disodium salt of mnt2– (Na2mnt) is synthesised by reacting NaCN with
CS2, which leads to the formation of [S2CCN]– as intermediate. This species undergoes
a coupling reaction accompanied by loss of sulphur to give the desired ligand.22
The dmit2– ligand and its selenated analogue dsis2– are obtained through the chemical or
electrochemical reduction of CS2 and CSe2 respectively, along with the corresponding
trichalcogenocarbonate (Scheme 1.5). Both anions can be isolated as air stable
quaternary ammonium salts of the corresponding Zn complexes, [Zn(dmit)2]2– and
[Zn(dsis)2]2–.
23
Page 21
Introduction
7
CS2
NaDMF
S
S
S-
S-S
Zn+2
R4N+
(R4N)2[Zn(dmit)2]
PhCOCl
S
S
S
S
S
C
O
Ph
C
O
Ph
S
S
S-
S-Se
S
S
S-
S-O
Hg(AcO)2/MeOH
NaOMe
1) Et3OBF4
2) NaHSe
Scheme 1.5. Strategies for the synthesis of dmit2–, dmid2–, and dmise2– ligands.
In addition, [Zn(dmit)2]2– and [Zn(dsis)2]2– can be reacted with PhCOCl to give the
thioesters dmit[C(O)Ph]2 and dsis[C(O)Ph]2, whose hydrolysis with NaOMe yields
Na2dmit and Na2dsis respectively.24 Replacement of the terminal sulphur of the dmit2–
ligand with oxygen or selenium has been performed to prepare the dmid2– and dmise2–
ligands.25
1.1.4. Synthesis of R,Rʹ-timdt2– and R–dmet2–
In recent years, another synthetic strategy for obtaining a new class of ligands related to
dmit2–, namely R,Rʹ-timdt2– (N,Nʹ-disubstituted 2-thioxoimidazoline-4,5-dithiolate,
Scheme 1.1), was developed.12,26 This route does not allow for isolating the ligand, but
consists in the preparation of the ligand and in the in situ formation of the complex in a
one-pot reaction. The corresponding complexes of Ni, Pd, and Pt were in fact
synthesised by sulphuration with Lawesson’s reagent [2,4-bis(4-methoxyphenyl)-
Page 22
Introduction
8
1,3,2,4-dithiadiphosphetane-2,4-disulfide] of N,Nʹ-disubstituted 2-thioxoimidazolidine-
4,5-diones [(i) in Scheme 1.6], in the presence of the desired metal introduced as
powder (M = Ni) or halide (M = Pd, Pt). This synthetic procedure was extended by our
research group to an ulterior related class of ligands with highly delocalised π-systems
(R-dmet2– or R-thiazdt2–, as recently reported; N-substituted 2-thioxo-thiazoline-4,5-
dithiolate; Scheme 1.1),27,28
28
and an alternative method for the preparation of these
ligands (and their selenated analogues, R-dset2–) has been recently reported, involving
the direct sulphuration/selenation of a thiazolidine-4,5-dione through a lithiating agent
[(ii) in Scheme 1.6].
X
N O
O
S
R
Lawesson's reagentX = N-R', S X = N-R' (R,R'-timdt2-),
S (R-dmet2-)
+
CH3O
PS
PS
S
S
OCH3
M or MCl2S
MS
S
S N
XN
XS
R
R
S
S
NS
R
LDA, E
(i)
(ii) S
NS
RE-
E- EM
E
E
E N
SN
SS
R
R
SMCl2
E = S, Se E = S (R-dmet2-), Se (R-dset2-)
Scheme 1.6. Strategies for the synthesis of R,Rʹ-timdt2– and R-dmet2– ligands and their metal complexes.
1.2. Homoleptic 1,2-dichalcogenolene metal complexes
1,2-Dichalcogenolene ligands form complexes with main group and d transition metal
ions. Bis(1,2-dithiolene) complexes have been obtained for metals such as Cr, Mn, Ni,
Page 23
Introduction
9
Cu, Zn for the first row, Pd, Ag, and Cd for the second row, and Pt, Au, and Hg for the
third row.13 On the other hand, homoleptic tris(1,2-dithiolene) complexes were obtained
for Ti, V, Cr, Zn, Mo, Tc, Ru, Ta, W, Re and Os. Fe and Co were found both in bis and
tris(1,2-dithiolene) complexes.
Bis(1,2-dichalcogenolene) complexes of d8 transition metals, exhibiting square-planar
structures, have been particularly investigated in the past. The simplest bis(1,2-
dithiolene) complex is [M(H2-edt)2] [M = Ni (3), Pd (4), Pt (5), H2-edt2– = ethylene-1,2-
dithiolate, Scheme 1.1], commonly called “parent dithiolene” (Figure 1.1).
SM
S
S
SH
H
H
H
Figure 1.1. Molecular scheme for [M(H2-edt)2] complexes of d8 metal ions.
All bis(1,2-dithiolene) complexes can be considered as formally derived from the parent
dithiolene by substitution of one or both of its hydrogen pendants with different alkyl or
aryl groups, except those containing the 1,2-dithiolene ligand condensed with a five- or
six-membered ring, such as the well known benzene-1,2-dithiolate (bdt2–) and 2-thioxo-
1,2-dithiole-4,5-dithiolate (dmit2–) ligands (Scheme 1.1).
One of the peculiar properties of this class of compounds is the ability of the molecular
entity to carry a charge which can vary considerably between anionic and neutral or
cationic states, the different molecular oxidation states being reversibly accessible by
chemical or electrochemical means (Scheme 1.7 for group 10 metal ions).
Page 24
Introduction
10
SM
S
S
SR
R R
R 2- -
SM
S
S
SR
R R
R
SM
S
S
SR
R R
R-1e- -1e-
+1e-+1e-
Scheme 1.7. Redox processes involving bis(1,2-dithiolene) complexes of group 10 metal ions.
This makes it difficult to assign clearly separated formal charges to the metal and to the
ligand, (Scheme 1.8 for a neutral diamagnetic complex), so that 1,2-dithiolene ligands
can be considered as ene-1,2-dithiolate dianions, neutral dithioketones, or mixed-
valence thioketone-radical thiolate monoanions. This behaviour led in the past to a vivid
debate on the nature of 1,2-dithiolene ligands, that have been regarded both as
“innocent” and “noninnocent” ligands.29 A ligand is considered innocent when it
allows to define unambiguously the oxidation state of the central metal ion in the
complex, according to the definition provided by Jørgeson.30 More recently Ward and
McCleverty pointed out that the term noninnocent is applied properly when referred to a
particular combination of the metal and the ligand rather than to redox-active ligands
alone.31 When the metal- and ligand-centred molecular orbitals of the complex lie at
different energies, their redox potentials are separated, and the related redox processes
can be clearly assigned to the metal or to the ligand; on the other hand, if a significant
mixing between the metal- and ligand-centred molecular orbitals occurs, ambiguity is
found in assigning the redox processes of the complex.32
Page 25
Introduction
11
SM
S
S
SR
R R
R
0
SM
S
S
SR
R R
RII
SM
S
S
SR
R R
RII
SM
S
S
SR
R RSM
S
S
SR
R R
RIV
R
Scheme 1.8. Lewis structures for neutral bis(1,2-dithiolene) complexes of d8 metal ions.
1.2.1 Synthesis
Bis and tris(1,2-dichalcogenolene) complexes are usually obtained as anionic species,
by adopting different synthetic routes, which vary depending upon the nature of the
starting 1,2-dichalcogenolene ligands or precursors, as summarised in Scheme 1.9.13
(i) Stable 1,2-dichalcogenolene salts, such as those of mnt2– or arene-1,2-dithiolates,
directly give the corresponding homoleptic bis or tris(1,2-dichalcogenolene) complexes
when reacted with the appropriate metal halides.33 (ii) As previously mentioned, the
isolation of dmit2– and isologs in the form of quaternary ammonium salts of the
corresponding Zn-complexes made it possible to obtain a large variety of different
anionic complexes through ligand exchange reactions.34
21
(iii) As already mentioned,
metal 1,2-dichalcogenolene complexes can also be obtained by hydrolysing precursors
of the 1,2-dichalcogenolene ligands such as vinylene dichalcogenocarbonates in alkaline
media in the presence of a suitable metal salt. ,35 (iv) As regards the tdf2– and tds2–
ligands, the corresponding bis(1,2-dichalcogenolene) complexes can be synthesised
starting from 1,2-dithietes or 1,2-diselenoletes, four-membered R2C2E2 rings formally
deriving from the oxidation of the corresponding alkene-1,2-dichalcogenolates36
13
(E = S,
Se). ,37 13 Correlated is the sulphuration of α-hydroxyketones (acyloins) ,38 and 1,2-
diketones with reagents such as P4S10 or Lawesson’s reagent39 in the presence of metal
Page 26
Introduction
12
salts or elemental metals.13,37,40
12
This method was used to prepare several diaryl
substituted 1,2-dichalcogenolene complexes, as well as to synthesise neutral complexes
belonging to the classes [M(R,Rʹ-timdt)2] and [M(R-dmet)2]27 (see above, M = Ni, Pd,
Pt). (v) The reaction of electrophilic alkynes, such as DMAD (dimethyl
acetylenedicarboxylate), with metal per- and poly-chalcogenido complexes was also
exploited for the synthesis of 1,2-dichalcogenolene complexes.13,41
NC S-Na+
S-Na+NC
S-Na+
S-Na+
Metal halide(i)
SM
S
SS
RR
R R
Metal salt
(ii)
M0 or metal salt(iv)
R O
OR
R O
OHRP4S10/
Lawesson's reagent/B2S3
S
S
R
R
O
(iii)
1) OH-
2) Metal salt
M
S SS
SS
S
R R
R
R
R
R
(v)
O
OCH3O
H3COS
ZnS
SS S
S
S
SSS(R4N)2
Perchalcogenidoor polychalcogenido
complex
R S
SR
S
SR
R
x-x-
Scheme 1.9. Strategies for the synthesis of homoleptic bis and tris(1,2-dithiolene) complexes.
Whatever the synthetic route adopted, the isolated bis or tris(1,2-dichalcogenolene)
complexes can be further exploited as starting materials for exchange reactions,
involving both redox and non-redox processes.23h,42
1.2.2. General structural features
Solid state diffraction techniques play a primary role in the understanding of the
structural features of metal 1,2-dichalcogenolene complexes, also in view of the
Page 27
Introduction
13
importance of solid-state properties of these compounds. In fact, as previously pointed
out, 1,2-dichalcogenolene ligands possess the ability to carry variable molecular
charges, and in this context interatomic distances within the chelate rings, along with
the frequencies of the related stretching vibrations, have been used as indicators to
elucidate the electronic configuration of the complexes, and to distinguish between the
1,2-dichalcogenolate and 1,2-dichalcogenone limit forms of the ligands. In particular,
for 1,2-dithiolene ligands, C-C distances in the range of 1.30–1.36 Å and C-S distances
in the range 1.71–1.75 Å are considered to be typical of C=C double and C-S single
bonds respectively, thus suggesting a ene-1,2-dithiolate form (–S-C=C-S–) for the
ligand, while longer C-C and shorter C-S distances indicate the presence of the 1,2-
dithioketone (S=C-C=S) form.43
Since the first structural reports on complexes 1 and 22– were published,
5,44
1
several
reviews have focused on the structural features and packing effects of 1,2-
dichalcogenolene complexes ,40,45 and an examination of the structural reports allows to
deduce some features common to the large variety of compounds examined.46
Figure 1.2. Examples of common coordination geometries in homoleptic bis(1,2-dithiolene) metal
complexes: a) square-planar; b) tetrahedral; c) distorted tetrahedral.
a b
c
Page 28
Introduction
14
(1) In bis(1,2-dichalcogenolene) complexes the central metal ion adopts square-planar,
tetrahedral or near tetrahedral coordination geometries (Figure 1.2).
Several structural parameters, such as the dihedral angle between the two E-M-E planes,
the angle c1-M-c2 (where c1 and c2 represent the midpoints between the two coordinating
chalcogen atoms of the two ligand units), and the bend angle between the E-M-E and E-
C-C-E planes, have been used to better define the coordination geometry of the metal
and qualify the distortions with respect to idealised geometries (Figure 1.3, for E = S).46
SM
S
S
Sc1c2
Figure 1.3. Definition of the c1-M-c2 angle in bis(1,2-dithiolene) complexes.
An examination of the Cambridge Crystallographic Database47 allows to evidence that
the nature of the central metal ion shows a great influence on the structural parameters
of the bis(1,2-dichalcogenolene) complexes, especially as regards M-E bond lengths.48
On the other hand, the other bond lengths are quite constant in bis(1,2-
dichalcogenolene) complexes. For example, in bis(1,2-dithiolene) complexes C-S
distances cover a range of 0.135 Å (1.642-1.777 Å), while C=C distances fall within a
0.236 Å range (1.284-1.520 Å).
46 As far as angles are concerned, S-M-S angles have
been found to range between 86.5 and 96.4°, and tend to be smaller for longer M-S
distances.46 Ranges for M-S-C and S-C-C angles are between 92.1 and 107.3° and
between 117.7 and 129.5° respectively, and larger M-S-C angles are offset by smaller S-
C-C angles (Figure 1.4).46
Page 29
Introduction
15
Figure 1.4. Smallest and largest bond distances (Å) and angles (°) for bis(1,2-dithiolene) transition metal
structures.
Depending on the central metal ion, and especially when the transition metal features a
formal configuration ranging between d5 and d8, bis(1,2-dithiolene) and bis(1,2-
diselenolene) complexes with a square-planar coordination may exhibit a tendency to
form dimeric33,35a,46 or trimeric46 structures. These aggregates are held together by
strong intermolecular M-E or M-M bonds, as shown in Figure 1.5 for E = S.
MS S
S SR
RRR
MS S
S SR
RRR
MS S
S SR
RRR
MS S
S SR
RRR
MS S
S SR
RRR
MS S
S SR
RRR
MS S
S SR
RRR
a
c
b
Figure 1.5. Examples of structural types of multimeric bis(1,2-dithiolene) units: a) M-M dimer; b) M-S
dimer; c) M-S trimer.
Page 30
Introduction
16
Within the dimers, the monomeric units maintain the structural characteristics of the
monomers.46 Different dimers or trimers can interact with each other,49 and the
difference between interacting dimers or trimers and stacked polymeric structures can
be uncertain. In the case of anionic complexes, the nature and size of the countercations
can play a crucial role in the formation of the stacks.50 The tendency to form stacks
increases with the extension the complex π-system, as observed in dmit2– bis(1,2-
dithiolene) complexes.51
(2) In tris(1,2-dichalcogenolene) complexes the central metal ion adopts an octahedral
or a distorted trigonal prismatic coordination geometry
52
52
(Figure 1.6). A number of
geometrical parameters have been proposed to discriminate between these two
possibilities: (i) the twist angle between chalcogen E atoms in the two dimensional
projection along the threefold axes, (ii) the dihedral angle between the ligand E-M-E
plane and the E-E-E plane formed by three coordinating chalcogen atoms from the three
units lying on the same side with respect to the metal centre, or (iii) the dihedral angle
between the two E-E-E planes defined as described above (E = S, Se). a,53
Figure 1.6. Examples of coordination geometries in tris(1,2-dithiolene) metal complexes: a) octahedral;
b) trigonal prismatic.
a b
Page 31
Introduction
17
Average bond lengths and angles for homoleptic tris(1,2-chalcogenolene) complexes
are less sensitive to the identity of the transition metal or 1,2-dichalcogenolene ligand
than those of bis(1,2-dichalcogenolene) complexes. As summarised in Figure 1.7 for
tris(1,2-dithiolene) complexes, M-S bond lengths span between 2.263 and 2.543 Å,
while the ranges for S-C and C-C distances are 1.665-1.785 and 1.304-1.524 Å
respectively.46 Concerning the angles describing the C2S2M metallacycle, ranges of
79.2-91.1, 100.7-111.1, and 118.5-123.9° have been reported for S-M-S, M-S-C and S-
C-C angles respectively.46
Figure 1.7. Smallest and largest bond distances (Å) and angles (°) for tris(1,2-dithiolene) transition
metal structures
(3) In general, the different ligands feature typical geometrical parameters over a wide
range of 1,2-dichalcogenolene complexes.46
1.2.3. Electronic structure
The understanding of the electronic structure of homoleptic metallo-dichalcogenolenes
has always been an important goal of theoretical research.54 Since the first theoretical
investigations, dating to 1964,55 there have been a considerable number of publications
Page 32
Introduction
18
reporting calculations [mainly performed on bis(1,2-dithiolene) complexes featuring the
metal ion in a square-planar coordination] at different levels of theory, ranging from
Extended Hückel Theory (EHT)56 to, in recent years, Density Functional Theory
(DFT).57
One of the first theoretical calculations in this field were performed by Hoffman and
collaborators at EHT level,
56 with the main goal of developing a satisfying bonding and
molecular orbital (MO) description for nickel bis(1,2-dithiolene) complexes. They
therefore provided an elegant, yet simple, description of the bonding in neutral [Ni(H2-
edt)2] (3, Figure 1.8).
This electronic structure description is exactly what one would expect for two dianionic
dithiolene ligands bound to a nickel ion in the IV oxidation state. The dxy (b1g) and dxz
(b2g) orbitals are both empty in this scheme, and six of the eight out-of-plane π-type
(only the six highest energy orbitals are shown) and all four of the in-plane σ-type
dithiolene ligand orbitals are occupied. Furthermore, the filled ligand orbitals lie at
energies below the five 3d orbitals of Ni, indicating that they are primarily acting as σ
and π-donor ligands. The dxy (b1g) orbital is raised considerably in energy due to a high
degree of mixing with a σ-type dithiolene orbital of the same symmetry. The severe
destabilisation of the dxy orbital precludes electron occupation of this orbital, and neither
NiI (d9) or Ni0 (d10) electron configurations are anticipated to be encountered for these
complexes.
Page 33
Introduction
19
The electronic structure of bis(1,2-dithiolene) complexes with a square-planar
coordination is however better described by ab-initio, post-SCF or DFT approaches, as
first shown in 1998.26d,58
12
As an example, the MO scheme of 3 calculated at hybrid DFT
level by our group is depicted in Figure 1.9, showing that the HOMO is a π orbital
deriving from the in-phase combination of 2pz atomic orbitals of C atoms, and the
antibonding combination of these with 3pz atomic orbitals of S atoms. On the other
hand, the LUMO, having a π-nature as well, is antibonding with respect to the metal,
and derives from the combination of the same atomic orbitals described above for the
HOMO (but with the C2S2 units assuming a opposite phase), with a participation of the
3dyz atomic orbital of the metal.
1 au 1 b3g
1 b2g 1 b1u
1 ag
1 b3g 2 ag
2 b2g
2 b3g 2 a2u
b1g
SNi
S S
S
X
Y
π lone pairs
π lone pairs
π (C-C)
σ (M-L)
d orbitals
σ lone pairs
Figure 1.8. MO scheme of 3 calculated at EHT level (Ref. 56).
Page 34
Introduction
20
50 54 58
49 53 57
48 52 56 LUMO
47 51 55 HOMO
Figure 1.9. Frontier MOs calculated for 3 at DFT level[B3LYP//LanL2DZ+ECP(Ni)/Ahlrichs (C, H, S);
cutoff = 0.05 e; Ref. 12].
More recently, theoretical calculations have been exploited to get an insight into other
aspects of 1,2-dithiolene chemistry. As an example, Holm and coworkers performed in
2001 a study on [Ni(S2C2Me2)]x–(x = 0, 1, 2) at DFT level,59 thus deducing a correlation
between the electronic and geometric structures of the entire electron-transfer-series.
This study provided the first theoretical interpretation of both electrochemical and
spectroscopic features of 1,2-dithiolene complexes (see below).
Page 35
Introduction
21
Theoretical calculations were also exploited to elucidate the intensely debated question
of whether dichalcogenolene ligands can exist as neutral dichalcogenoketones, radical
monoanions or dianionic dichalcogenolate. In this context, neutral nickel bis(1,2-
dithiolene) complexes have been particularly studied in the past, and two principal
models for the electronic structure of these complexes, resulting in an oxidation state of
II for the metal, were first discussed in the literature.60
5
Stiefel et al. proposed a diradical
singlet ground state (open-shell, Scheme 1.10), whereas Schrauzer and Mayweg and
Bach and Holm61 proposed a singlet closed shell ground state based on either a fully
delocalised structure or on two resonance hybrid structures (Scheme 1.8). The ability to
describe the diradical character of such complexes is clearly the most challenging task
for theoretical calculations, and the work performed by Bachler et al.62 using broken
symmetry DFT formalism,63 or more recently by other researchers,64 exemplifies the
difficulties to find the most appropriate theoretical method to describe these systems.
Very recently, persuasive considerations were deduced on this topic by Wieghardt and
coworkers, by means of an analysis of [M(bdt)2] complexes featuring different
transition metal ions (Cr, Fe, Co, Ni, Cu, Pd, Pt, and Au),65
31
through the combined
adoption of various spectroscopic methods (MCD, absorption, resonance Raman, EPR,
and sulphur K-edge XAS) and theoretical calculations at different levels of theory (DFT
or ab initio). The authors concluded that the noninnocent nature of the 1,2-dithiolene
ligand in these systems is strongly dependent on the nature of the transition metal ion
present in the complex, analogously to what hypotesised by Ward and McCleverty (see
above). Vibrational spectra of these systems have also been used for the interpretation
of their electronic structure.26d,46,66
Page 36
Introduction
22
Scheme 1.10. Diradical open-shell structure for the neutral form of 3.
1.2.4. Properties and applications
Homoleptic metal 1,2-dithiolene and 1,2-diselenolene complexes have been exploited
for a large variety of diverse applications, thanks to their unique molecular properties
exhibited both in solution and in the solid state.
1.2.4.1 Properties in solution
1.2.4.1.1. Electrochemical properties
As previously mentioned, one of the peculiar properties of metal bis(1,2-
dichalcogenolenes) is the ability to assume different molecular charges, the different
molecular oxidation states being reversibly accessible by chemical or electrochemical
means (Scheme 1.7 for metal ions of group 10).
The redox potentials, and in particular the half-wave potentials E1/2, can serve as a guide
for the synthesis of differently charged dithiolene complexes, and several
generalisations can be made about the electrochemical behaviour of homoleptic bis(1,2-
dithiolene) complexes (all potentials below are referenced to SCE): 67
(i) For couples with E1/2 < 0.00 V, the reduced species is susceptible to air oxidation in
solution, whereas if E1/2 > 0.00 V the reduced species is air-stable.
(ii) When E1/2 > 0.20 V, the oxidised species can be reduced by weakly basic solvents
(e.g. ketones or alcohols), but when -0.12 < E1/2 < +0.20 V, the oxidised form can be
reduced by stronger bases (e.g. aromatic amines).
Page 37
Introduction
23
(iii) When E1/2 < -0.12 V, the oxidised form is readily reduced by strong reducing
species such as hydrazine, sodium amalgam, and NaBH4.
(iv) The reduced form can be oxidised by molecular iodine when E1/2 < +0.40 V,
otherwise stronger oxidants are required.
However, it must be emphasised that the values listed above are only indicative, and in
the course of reactions where oxidation or reduction processes are involved, a proper
selection of the oxidising or reducing agents is crucial, along with the choice of
appropriate reaction conditions. Side reactions such as ligand exchange may indeed
occur, and reducing agents like amines can act themselves as coordinating ligands.
Moreover, the reduction of oxidised species in couples with E1/2 < -0.95 V or oxidation
of the reduced form in couples with E1/2 > +0.95 V is generally difficult by chemical
means, and hence electrochemical methods are more suitable.68
A particular behaviour is shown by some cobalt and iron complexes which exist as
partially reduced dimers, and dissociate into monomers upon full reduction (Equation
1.1).
61,69
[M(S^S)2]20 [M(S^S)2]2
- [M(S^S)2]22- 2 [M(S^S)2]2-+ e- + e- + e-
- e- - e- - e-
(1.1)
Furthermore, few bis(1,2-dithiolene) complexes bear redox-active substituents directly
bonded to the dithiolene core, or connected to it through a spacer, so that the
interpretation of their redox behaviour is particularly complicated. An example is given
by some nickel bis(1,2-dithiolene) complexes reported by Mueller-Westerhoff,70
Underhill,71 and Lee,72
bearing ferrocenyl groups as substituents at the 1,2-dithiolene
ligands (Figure 1.10).
(S^S = dithiolene ligand, M = Fe, Co)
Page 38
Introduction
24
NiS
S S
SFc Fc
Fc Fc
NiS
S S
S Fc
Fc
NiS
S S
S S
SS
SFc
Fc
Fc
Fc
Fe
Fc =a b
c
Figure 1.10. Redox-active substituted metal 1,2-dithiolenes: a) [Ni(dfcdt)2] (6); b) [Ni(fcdt)2] (7); c)
[Ni(dfcvt)2] (8, Refs. 70, 71, and 72, respectively).
For example, the tetrakis(ferrocenyl)-nickel dithiolene [Ni(dfctd)2] (6) shows up to six
monoelectronic redox processes, four of which are centred on the ferrocenyl units, while
the remaining two involve the dithiolene system (Equation 1.2).73
[Ni(dfcdt)2]4+ + e- + e- + e-
- e- - e- - e-[Ni(dfcdt)2]+[Ni(dfcdt)2]2+[Ni(dfcdt)2]3+
- e-
+ e-
- e-
+ e-
[Ni(dfcdt)2] [Ni(dfcdt)2]- + e-
- e-[Ni(dfcdt)2]2-
(1.2)
1.2.4.1.2. Optical properties
One of the most striking properties of 1,2-dithiolene and 1,2-diselenolene complexes,
and in particular of bis(1,2-dichalcogene) complexes of d8 metal ions, is their intense
molecular absorption in the Visible-Near Infrared (Vis-NIR) region.1,35b,37,40,54,74
This absorption has been extensively studied for metals belonging to group 10, and for
Ni in particular, while it has been only recently evidenced for bis(1,2-dithiolene)
Page 39
Introduction
25
complexes of AuIII.75
12
The absorption maximum (λmax) of this band falls between 700
and 1750 nm, depending on the nature of the substituents, on the central metal ion, on
the coordination geometry, on the global charge of the complex (electrochromism), and
on the solvent (solvatochromism). The absorption intensity, with extinction coefficients
ε ranging between 15000 and 120000 M–1 cm–1, is unmatched in most transition metal
compounds, whose low energy absorptions have been generally assigned to d-d
transitions.37 On the contrary, Vis-NIR absorption is well known to be due to a π−π*
electronic transition involving the frontier molecular orbitals, and, as previously
mentioned, its nature has been studied at different levels of theory.
As just mentioned, the nature of substituents on the 1,2-dichalcogenolene ligands plays
an important role in determining the position of the Vis-NIR absorption in these
systems. As regards neutral 1,2-dithiolene complexes, as compared to the nickel parent
dithiolene (3, λmax = 720 nm in hexane),76
40
donor substituents cause a bathochromic shift
in the λmax value, while acceptor substituents do not markedly affect the energy of the
Vis-NIR absorption band. According to the qualitative interpretation proposed by
Mueller-Westerhoff, acceptor substituents lower the energies of the HOMO and the
LUMO by similar amounts of energy, not resulting in drastic shifts in transition
energies, while donor substituents raise the energy of the former MO more than that of
the latter, thus reducing the HOMO-LUMO energy gap, and therefore causing the
bathochromic shift observed for the corresponding absorption. As a consequence, the
lowering of the LUMO energy induced by acceptor substituents causes a stabilisation of
bis(1,2-dithiolene) anionic forms, while donor substituents tend to stabilise neutral or, in
some cases, cationic forms.37,40 Due to the applicative interest in low energy
absorptions, one of researchers’ main goals has been that of lowering the energy of this
absorption as much as possible by systematically varying the substituents on the 1,2-
Page 40
Introduction
26
dithiolene ligands. Mueller-Westerhoff and co-workers found that this aim could be
achieved in nickel complexes by introducing aromatic substituents coplanar with the
dithiolene core, in order to enhance the extension of the π-system, and containing
amino-donor groups. Examples of this type of ligands are julolidinyl-ethylene-1,2-
dithiolate (JUL12–), 1,2-bis(julolidinyl)-ethylene-1,2-dithiolate (JUL22–), and bis(3-
N,Nʹ-diethyltetrahydroquinazolyl)-ethylene-1,2-dithiolate (DETHQ2–, Scheme 1.11),
whose nickel complexes were reported to feature low-energy NIR absorptions at 1180,
1270, and 1370 nm, respectively in CH2Cl2.40,74b
S-
S-
N
N
S-
S-
N
a
S-
S-
N
N
N
N
cb
Scheme 1.11. Examples of 1,2-dithiolene ligands featuring aromatic substituents and containing amino-
donor groups: a) JUL12–, b) JUL22–, c) DETHQ2– (Refs. 40 and 74b).
NIR absorptions around 1000 nm were also obtained in nickel complexes by adopting
the 1,2-dithiolene ligands dmit2–,26c medt2–,77 77 bddt2–, and cddt2–.35b
As already mentioned, our research group has been active too in this field since about
fifteen years, with the synthesis and the characterisation of more than sixty members
belonging to the class [M(R,Rʹ-timdt)2] (M = Ni, Pd, Pt),12 whose NIR absorptions fall
around 1000 nm and change upon varying R, Rʹ, and M (Table 1.1).78
Page 41
Introduction
27
Table 1.1. Experimental NIR absorption maxima λmax (nm) for neutral [M(R,Rʹ-timdt)2] complexes in
CHCl3 (Ref. 78).
M R Rʹ λmax
Ni m-CF3-Bz Me 992
Pd m-CF3-Bz Me 1017
Pt m-CF3-Bz Me 1010
Ni m-CF3-Ph Pri 1008
Pd m-CF3-Ph Pri 1033
Pt m-CF3-Ph Pri 1010
Ni p-CF3O-Ph Et 1010
Pd p-CF3O-Ph Et 1032
Pt p-CF3O-Ph Et 1010
Pd p-F-Ph p-F-Ph 1027
Pt p-F-Ph p-F-Ph 1012
Pd p-F-Ph p-NO2-Ph 1042
Pt p-F-Ph p-NO2-Ph 1021
Ni Ph Ph 1023
Pd Ph Ph 1043
Pt Ph Ph 1022
Ni Naph Et 1007
Pd Naph Et 1033
Pt Naph Et 1011
Pd p-F-Ph m,m,p-(CH3O)3-Ph 1052
Pt p-F-Ph m,m,p-(CH3O)3-Ph 1025
Ni p-F-Ph Naph 1019
Pd p-F-Ph Naph 1047
Pt p-F-Ph Naph 1021
Ni ClCH2CH2 Et 1001
Pd ClCH2CH2 Et 1027
Pt ClCH2CH2 Et 1006
Page 42
Introduction
28
An in depth investigation on the effects induced on the energy of this absorption by
changing M, R, and Rʹ has allowed for the recognition of the additive contributions of
the central metal ion and of the substituents to the λmax position of the NIR absorption
maximum.78
More recently, to further investigate the possibility of tuning the position of the NIR
absorption in systems with a highly delocalised π-system, the first three bis(1,2-
dithiolene) complexes belonging to the class [M(R-dmet)2] [R = Et; M = Ni (9), Pd (10),
Pt (11)] were prepared by our group,
The considerations derived from this analysis can be summarised as
follows: (i) in complexes featuring aryl substituents the NIR absorption is
bathochromically shifted with respect to alkyl substituted ones; (ii) among complexes
bearing aliphatic R and Rʹ groups, the λmax position tends to shift towards shortest
wavelengths as the length of the alkyl chain increases; (iii) the presence of electron-
withdrawing substituents at the aromatic ring of complexes bearing aryl pendants
induces a bathochromic effect on the position of the NIR absorption, while electron-
releasing groups show the opposite effect; (iv) complexes with M = Pd feature the NIR
absorption at lower energies with respect to nickel and platinum complexes (Figure
1.11).
27 and several ulterior members of this class have
been also obtained by Lorcy and collaborators (M = Pt, Zn, Au; R = Me, Et, Ph).28,79
27
As
predictable, the energies of the NIR absorptions in these complexes were found to be
intermediate between those of bis(1,2-dithiolenes) belonging to the classes [M(R,Rʹ-
timdt)2] and [M(dmit)2] [λmax = 1023, 1003, and 1010 nm in toluene for [Ni(dmit)2]
(12), [Ni(Et2-timdt)2] (13), and 9, respectively].
Page 43
Introduction
29
Figure 1.11. NIR absorption spectra of [M(Et2-timdt)2] in CHCl3 [M = Ni (black line), Pd (red),
Pt(blue)] (Ref. 12).
Absorption energies falling at even lower values were observed in nickel complexes
containing ferrocenyl substituents bonded to the 1,2-dithiolene ligands (Figure 1.10),80
or, more recently, in a bis-double-decker complex assembled from the nickel bis(1,2-
dithiolene) complex [Ni(S2C2Me2)2]–1/–2 and two [Cp*Fe]+ units (Cp* = C5Me5, Figure
1.12).81
Figure 1.12. ORTEP drawing of the cationic complex [η5-Cp*-Fe-µ−η5-η5-((S2C2Me2)2Ni)Fe-η5-Cp*]+
(Ref. 81). Ellipsoids are shown at the 50% probability level. Hydrogen atoms are omitted for clarity.
0
10000
20000
30000
40000
50000
60000
70000
80000
800 900 1000 1100 1200
ε(M
-1cm
-1)
Wavelength (nm)
Page 44
Introduction
30
Concerning the role of the oxidation state of the complex in tuning the energy of the
Vis-NIR absorption band, it was observed that electronic absorptions featured by
monoanionic bis(1,2-dithiolene) complexes of metal ions belonging to the 10 group are
generally bathochromically shifted as compared to those of corresponding neutral
species.77,82 These observations were also confirmed by our group in the case of the
[M(R,Rʹ-timdt)2]83 27 and [M(R-dmet)2], whose NIR absorption in the monoanionic form
is bathochromically shifted by about 400 and 200 nm respectively with respect to
neutral complexes.
The intense NIR absorption peculiar to neutral and monoanionic bis(1,2-dithiolene)
complexes of Ni, Pd and Pt has been exploited for several applications.
(a) Q-Switching. Laser emission consists of a continuous output of coherent radiation,
that can be turned into ultra-short pulses of extremely high energy84
40
by using “Q-
switching” dyes, provided that (1) the dye has a significant absorption close to the
same energy; (2) the dye has no significant absorption close to the laser emission
energy; (3) the excited state lifetime is long enough to allow for bleaching of the laser;
and (4) the dye is thermally and photochemically stable. Bis(1,2-dithiolene) complexes
are generally thermally and photochemically stable and their Vis-NIR absorption can be
tuned in order to reach the wavelength ranges of interest for NIR lasers, such as
Nd:YAG, Nd-YLF, and Er:Glass solid-state lasers (emission wavelengths = 1064, 1053,
and 1540 nm, respectively). In this context, many groups of researchers devoted their
efforts to synthesising 1,2-dithiolene complexes for this type of application, and indeed
some complexes were patented and are commercially available.74,85
(b) Nonlinear Optics. Metal 1,2-dithiolene complexes have been studied for
applications in the field of second- and third-order nonlinear optical (NLO) properties.
86
Since materials for second-order nonlinear optics (SONLO) must not be
Page 45
Introduction
31
centrosymmetric,87
74
heteroleptic bis(1,2-dithiolene) complexes are mainly involved in
this field, a although homoleptic bis(1,2-dithiolene) complexes featuring asymmetric
substituents in the cis conformation are good candidates as well (see below). On the
other hand, third-order NLO effects impose no symmetry constraints, though requiring
higher energy sources. Thus, studies on this type of nonlinearity have addressed both
homoleptic and heteroleptic bis(1,2-dithiolene) complexes.88
(c) Optical Technology. Several publications and patents have dealt with application of
1,2-dithiolene complexes to the various branches of optical information technology.
Thus, 1,2-dithiolene systems have been exploited in materials used for optical data
storage such as CD-ROM or LD-ROM media, as ink components for copiers,
89 or as
photodetectors.90 Recently, the applications of 1,2-dithiolene complexes to wavelength
sensitive NIR-photocondictivity have been investigated, and working prototypes
converting trains of impinging NIR-pulses into electrical signals have been created (see
below).91
1.2.4.1.3. Reactivity
Compared with the large body of electrochemical and spectroscopic data, there have
been fewer studies on the chemical reactivity of bis(1,2-dithiolene) complexes. In light
of the redox chemistry of bis(1,2-dithiolene) complexes and the redox-active nature of
the 1,2-dithiolene ligands, it is not surprising that the reactivity is largely related to the
redox properties. The observed reactions can be summarised as follows.67
(a) Ligand Exchange Reactions. Although most 1,2-dithiolene complexes are stable
compounds and many do not react with strong acids or bases, bis(1,2-dithiolene)
complexes featuring a square-planar coordination are nevertheless reactive enough to
undergo linear-exchange reactions with other bis-chelating ligands, according to
Equation 1.3.92
Page 46
Introduction
32
M1(S^S)2 + M2(L^L)2 M1(S^S)(L^L) + M2(L^L)(S^S) (1.3)
(S^S = 1,2-dithiolene ligand; L^L = bidentate ligand)
Reactions of these type can also occur between homoleptic complexes in different
oxidation states (e.g. 0 and -2), so that the dianionic compound acts as reducing agent
toward the neutral one, according to Equation 1.4.42c
[M(S^S)2]2– + [M(L^L)2] → 2 [M(S^S)(L^L)]– (1.4)
(S^S = 1,2-dithiolene ligand; L^L = bidentate ligand)
(b) Ligand Addition and Substitution Reactions. Bis(1,2-dithiolene) complexes of group
VIII and IX metals generally exist in their dimeric forms [M(S2C2R2)2]2x– (M = Fe, Co,
x = 0-2). By treating these species with Lewis bases L such as pyridine, phosphine,
stibline, CN–, or N3– results in dissociation of the dimer and formation of five-
coordinate adducts [M(L)(S2C2R2)2]x/2.93
(c) Alkylation. Reduction of bis(1,2-dithiolene) complexes to their dianions increases
the nucleophilicity of sulphur atoms, facilitating electrophilic attack by alkyl halides. As
an example, Schrauzer at al.
94
(d) Cycloaddition with Unsaturated Compounds. Schrauzer and Mayweg
described the formation of the neutral complex
[Ni(MeS2C2Ph2)2] when [Ni(sdt)2]2– (sdt2– = stilbene-1,2-dithiolato) is made to react
with methyl iodide. In this complex, the methyl groups are in trans position, and further
reaction with MeI results in fully methylation of all four sulphur atoms, yielding
[Ni(Me2S2C2Ph2)I2], in which the six-coordinate nickel atom is equatorially coordinated
by two iodide ligands.
38a first
reported that [M(sdt)2] (M = Ni, Pd, Pt) reacts with alkynes and alkenes to give
Page 47
Introduction
33
cycloaddition to the dithiolene ligand (Figure 1.13 for nickel). Wing et al.95 further
investigated the reaction of olefins with 1,2-dithiolene complexes, and found that
[Ni(tdf)2] not only reacts with dienes, but also reacts with highly strained mono-olefins,
such as norbornene, forming a 1:1 adduct. Addition of other unsaturated compounds,
such as SO296 and O2,97
has also been reported.
NiS
S S
SR
R
R
R
Me Me
Figure 1.13. Product of the reaction between a nickel 1,2-dithiolene complex and olefins (Ref. 38a).
1.2.4.2 Solid state properties
1.2.4.2.1. Electrical properties
The solid state conducting properties of 1,2-dithiolene and 1,2-diselenolene complexes
have been the subject of a vast number of publications and reviews.40,74a,98,99 In all
cases, conducting properties (insulating, semi-conducting, metal-like, or even
superconducting) have been rationalised in terms of their structural features, which in
turn are affected by temperature and applied pressure.100
74
For conducting molecular one-
dimensional (1D) systems, some criteria were proved to be necessarily satisfied in order
to make observation of solid state conductivity possible: a (i) the existence of stacking
structures, (ii) a spatial extension of the electronic system so as to allow for a significant
overlap between stacked units, and (iii) the partial filling of the conducting band,
achieved by means of non-integral oxidation or CT processes. Metal 1,2-
Page 48
Introduction
34
dichalcogenolene complexes are a very suitable source of open-shell stable systems and
are able to satisfy these criteria provided that a sufficient extended planar system is
present in the ligands. In particular, open-shell systems deriving from both bis(1,2-
dithiolene) and bis(1,2-diselenolene) systems of d8 metal ions feature a marked
tendency to form intermolecular stack-interactions with short metal-metal distances.
However, in the first 1,2-dicalcogenolene complex showing metal-like behaviour,
(Per)2[Pt(mnt)2] [(Per)2(14); Per = perylene],101 the stacking of perylene units was
responsible for the conducting properties, while the first compound containing a 1,2-
dichalcogenolene complex responsible for the metal-like conductivity was
(H3O)0.33Li0.82(14)·1.67H2O.102
100
In order to avoid Peierls instability, predicted in 1962 by
McConnell and collaboratotrs, and first reported in (TTF)[M(tfd)2] complexes (M =
Cu, Au; TTF = tetrathiafulvalene),74a,103
98
much effort has been devoted to enhancing the
structural dimensionality beyond 1D. BEDT-TTF [bis(ethylenedithio)tetrathiafulvalene]
indeed provided a variety of 2D-metallic systems, thanks to the possibility of
intermolecular interactions guaranteed by the peripheral sulphur atoms. ,104 Several 1,2-
dichalcogenolene complexes can behave as molecular acceptors in charge-transfer (CT)
complexes with donors such as TTF and related species, or originate Non Integral
Oxidation State (NIOS) compounds, and the possibility of forming transverse short
E···E (E = S, Se) contacts between different stacks could avoid the mono-
dimensionality of the stacking structure.105 Moreover, due to the greater orbital spatial
extension of Se compared to S, the replacement of sulphur with selenium has been
proposed as a tool for achieving greater interanionic interactions.106
The complex TBA2(12)7·2MeCN was the first reported conducting dmit2– salt,
107 while
(TFF)(12)108 was the first superconductor containing a dithiolene system. Several other
compounds based on 1,2-dithiolene complexes and exhibiting superconducting
Page 49
Introduction
35
properties have been further identified, and notably all of them contain the dmit2–
ligand.109,110
More common are 1,2-dichalcogenolene-based compounds showing metal-like
behaviour. These systems are generally either NIOS salts or CT-complexes, which
contain donors of various type, such as Per or TTF, and also in this case the majority of
complexes are based on dmit2– ligand.
74a Recent literature also reports many examples
of bis(1,2-dithiolene) complexes deriving from mnt2–, tdf2–, dddt2–, dmise2–, dcit2–, and
dmbit2– (Scheme 1.1) showing metal-like conductivity properties.74a,98,111
106
Some
examples of CT-salts containing 1,2-diselenolene complexes with metal-like
conductivity have also been reported. b,112
1.2.4.2.2. Magnetic properties
Solid-state magnetic properties of 1,2-dithiolene and 1,2-diselenolene complexes have
been dealt with in several reviews.1,37,74a,98,111b,113
35
The most common magnetic
behaviour is antiferromagnetism. a,49a,74a,114
SP transitions are temperature-dependent magnetoelastic transitions involving quasi 1D
insulating systems, and were reported for (TTF)[M(tfd)2]
More unusual are the systems featuring
spin-Peierls (SP) transitions, spin-ladder (SL) transitions, or ferromagnetic properties.
103a (M = Cu, Au) and
(TTF)[Cu(tfs)2]115
74
complexes. The definition of SL systems is related to crystalline
frameworks resulting from the interaction between a finite number of S = 1/2 strongly
magnetically coupled chains arranged each next to the other. a Among the most
important systems, it is worth recalling (p-EPYNN)(12)116 (p-EPYNN = p-N-
pyrimidine α-nitronyl nitroxide) and (DT-TTF)2[Au(mnt)2]117
Short-range order ferromagnetic interactions were reported for several compounds
containing 1,2-dichalcogenolene complexes,
[(DT-TTF)2(15); DT-
TTF = dithiophenetetrathiafulvalene).
74a,118 while long-range ferromagnetic
Page 50
Introduction
36
behaviour was reported for (NH4)(12)·H2O111c,119 and (Cp2*Mn)(12) (Cp* =
pentamethylcyclopentadienyl).120
1.3. Heteroleptic 1,2-dichalcogenolene metal complexes
Different mixed-ligand 1,2-dithiolene complexes have been synthesised in the past with
the aim of obtaining new materials suitable for NLO applications, given the lack of
inversion centre proper of these compounds. The majority of these complexes belongs
to two classes: the mixed-ligand bis(1,2-dithiolene) metal complexes and the diimine-
dichalcogenolate metal complexes.
1.3.1. Mixed-ligand bis(1,2-dithiolene) complexes
In these complexes, two different 1,2-dithiolene ligands, featuring different substituents,
coordinate the central metal ion to give a non-centrosymmetric complex. When the two
ligands feature remarkably different electron-donor properties, the resulting complexes
are considered as push/pull systems, where the ligand with more electron-donor
character acts as a push ligand, while the other one represents the pull ligand. In neutral
complexes, the different behaviour of the two ligands gives rise to a charge separation
between the two units, usually reflected in a not negligible dipole moment. The entity of
this separation depends on the difference in the push/pull character of the ligands: the
largest the differences in the electron-donor properties of the ligands’ substituents, the
highest the charge separation.
Accordingly, if the differences in the push/pull character of the two ligands are small,
the resulting mixed-ligand complex will show, in the neutral form, a ground state
Page 51
Introduction
37
similar to that of corresponding homoleptic bis(1,2-dithiolene) complexes, and
describable with the limit form b in Scheme 1.12; otherwise, one ligand will tend to
coordinate the central metal ion in the neutral dithioketone form, while the other one
acts as a ene-1,2-dithiolate dianion (forms a and c in Scheme 1.12). In this case, a
redistribution of frontier molecular orbitals is also observed, with the HOMO mainly
centred on the pull ligand and the LUMO localised on the push ligand.121
Scheme 1.12. Lewis limit structures for neutral heteroleptic bis(1,2-dithiolene) complexes of d8 metal
ions.
As a consequence, the peculiar monoelectronic HOMO-LUMO transition can be
considered as an interligand charge-transfer process with some metal mixing, and this is
reflected in the solvatochromic behaviour of the corresponding absorption band.122
Several well-documented mixed-ligand 1,2-dithiolene complexes have been reported,
the majority of which featuring nickel as central metal ion,
42c,92a,122,123 while complexes
based on different group 10 metals are far rarer.124 Beside NLO applications,125
98
these
complexes have been exploited as components of molecular materials with optical or
electrical properties, ,111c,126
Different synthetic routes have been exploited to obtain these complexes, and, as
mentioned above, some of these methods involve scrambling reactions between
symmetrical bis(1,2-dithiolene) complexes bearing different substituents, as reported in
Equation 1.5:
similarly to homoleptic bis(dithiolene) complexes.
Page 52
Introduction
38
[M(S^S1)2]x1 + [M(S^S2)2]x2 → 2[M(S^S1)(S^S2)]x3 (1.5)
(x = 0, –1, –2)
The reactions between homoleptic bis(dithiolene) complexes in different oxidation
states (e.g. x1 = 0 and x2 =–2) have been also exploited, so that the dianionic compound
acts as reducing agent toward the neutral one, leading to the formation of symmetrical
monoanionic intermediates which react to produce the mixed-ligand complex as a
monoanion (x3 = –1, Equation 1.5).42c
Another method consists in cross-coupling reactions summarised in Equation 1.6:123g-
i,124a
S^S1 + S^S2 + MCl2 → [M(S^S1)(S^S2)] + [M(S^S1)2] + [M(S^S2)2] (1.6)
where S^S1 and S^S2 represent stable 1,2-dithiolates or their precursors.
An alternative synthetic pathway consists in the reaction between a mono(dithiolene) of
the type [M(S^S)(NH3)2] and a stable 1,2-dithiolene ligand, leading to the substitution
of the NH3 ligand of the complex (Equation 1.7):123c
[M(S^S1)(NH3)2] + S^S2 → [M(S^S1)(S^S2)] (1.7)
Arca and co-workers also reported a method based on a substitution reaction, in which
the starting complex bears two bromide substituents (Equation 1.8).124c Through this
method, the first palladium mixed-ligand bis(1,2-dithiolene) complex was obtained
(S^S1 = Et2-timdt2–; S^S2 = mnt2–).
Page 53
Introduction
39
[M(S^S1)Br2] + S^S2 → [M(S^S1)(S^S2)] (1.8)
Mixed-ligand 1,2-dithiolene complexes of group 10 metals usually show a square-
planar coordination, and in the case of nickel complexes, four similar M-S distances are
generally found. On the contrary, in [Pd(Et2-timdt)(mnt)]124c significantly different Pd-S
distances were observed for the two ligands. The analysis of bond distances in the 1,2-
dithiolene core shows that, as expected, in complexes bearing ligands with similar
push/pull character the C-C and C-S bond lengths are very similar in the two ligands,
according to the Lewis structure b proposed in Scheme 1.12, while significantly
different bond lengths are observed in complexes with ligands showing different
push/pull character (better described with the Lewis structures a and c of Scheme
1.12).121
As mentioned above, absorption spectra of mixed-ligand 1,2-dithiolene complexes are
characterised by an absorption band in the Vis-NIR region showing negative
solvatochromism. The position of this band depends, again, on the push/pull character
of the two ligands: if the push/pull character of the two ligands is similar, the absorption
band falls in the NIR region, similarly to what observed for homoleptic bis(1,2-
ditiholene) complexes of group 10 metals, while if the ligands bear substituents with
significantly different electron-withdrawing character, the band shifts to shorter
wavelengths, and shows a larger solvatochromism.121
Similarly to homoleptic bis(1,2-dithiolene) complexes, mixed-ligand complexes are
redox-active species, and their redox properties are usually intermediate between those
of symmetrical precursors.121
Page 54
Introduction
40
1.3.2. M(diimine)(dichalcogenolate) complexes
In diimine-dichalcogenolate metal complexes, the central metal ion is coordinated by
two different types of ligands, a 1,2-dichalcogenolene ligand and a chelating diimine
ligand, usually aromatic in nature, such as 2,2ʹ-bipyridine, 1,10-phenanthroline and
derivatives.127
Several complexes of this class have been synthesised in the past, mostly with group 10
metal ions, but diimine-dichalcogenolene complexes were also obtained for metals such
as Co,
128 Au,129 Zn,130 130 Cd, f,131 Ru,132 and Cu.133
128
The majority of these complexes
show the central metal ion in a four-coordinated fashion, with one 1,2-dichalcogenolene
ligand and one diimine ligand, and are often schematised as [Pt(N^N)(E^E)] (where
N^N is the diimine ligand, while E^E represent the 1,2-dichalcogenolate one), but six-
coordinated complexes, with one 1,2-dichalcogenolene ligand and two diimine ones or
vice versa are not unusual and were reported for Co, Zn,130g,f Cd,130f Ru,132 and Ni.134
To date, all diimine-dichalcogenolate complexes characterised structurally show 1,2-
dithiolene ligands, beside [Pt(2,2ʹ-bipy)(bds)] (16, bipy = 2,2ʹ-bipyridine; bds2– =
benzene-1,2-diselenolate).135
In contrast to what specified above for homoleptic and heteroleptic bis(1,2-dithiolene)
complexes, in this class of compounds it is possible to identify unambiguously the state
of the 1,2-dithiolene ligand, which is in all cases in the 1,2-dithiolato form, as reflected
in the name of the complexes. Therefore, diimine-dithiolate complexes of d8 metal ions
can always be conventionally described with the limit form shown in Figure 1.14.
Page 55
Introduction
41
NM
N
S
SR
R
R'
R'
Figure 1.14. Lewis structure for diimine-dithiolate complexes of d8 metal dications.
Platinum(II) diimine-dithiolate complexes have particularly attracted researchers’
attention in the past few years, due to their wide range of possible applications.
In the following section, the features of metal [M(N^N)(S^S)] complexes bearing
aromatic diimine ligands will be summarised.
1.3.2.1. Synthesis
[M(S^S)(N^N)] complexes are usually synthesised as neutral species starting from the
corresponding metal diimine-dichloro-complex, by displacement of the two chlorides
with the desired 1,2-dithiolate ligand, as first reported by Vogler and coworkers
(Equation 1.9).136
In order to adopt this synthetic pathway, 1,2-dithiolene ligands or
precursors existing in a stable form are required.
[M(N^N)Cl2] + S^S → [M(N^N)(S^S)] (1.9)
An alternative method consists of the reaction of the homoleptic bis(1,2-dithiolene)
complex of the desired ligand with the appropriate diimine ligand (Equation 1.10). 137
[M(S^S)2] + N^N → [M(N^N)(S^S)] (1.10)
Page 56
Introduction
42
1.3.2.2. General structural features
Up to now less than fifty structures of [M(N^N)(S^S)], [M(N^N)(S^S)2] and
[M(N^N)2(S^S)] complexes have been reported, as revealed by a search in the
Cambridge Crystallographic Database, approximately half of which regarding
platinum(II) complexes. An examination of these structural reports allows to deduce
some general features for this class of compounds.
(i) In diimine-dithiolate complexes of the type [M(N^N)(S^S)], featuring one 1,2-
dithiolene ligand a one diimine ligand, the central metal ion adopts a square-planar or
distorted square-planar coordination, except for Zn complexes, where a tetrahedral or
near-tetrahedral coordination is observed.130a,b,f
Analogously to what observed for homoleptic bis(1,2-dichalcogenolene) complexes (see
above), the central metal ion has a great influence on the structural parameters of the
complexes.138,139
C-S distances within the 1,2-dithiolene ligands fit in a 0.113 Å range
(1.687-1.800 Å), and tend to be longer than in homoleptic complexes, while the C-C
bond lengths fall within a 0.177 Å range (1.283-1.460 Å), and their average lengths are
shorter than in homoleptic complexes (Figure 1.15). This is in agreement with the fact
that, as mentioned above, 1,2-dithiolene ligands in these complexes always behave as
1,2-dithiolates (–S-C=C-S–), while in bis(1,2-dithiolene) complexes they can assume a
partial character of 1,2-dithioketones (Figure 1.14).
Page 57
Introduction
43
Focusing on the most studied and promising platinum diimine-dithiolate complexes, Pt-
S distances in the range 2.236-2.288 Å (average 2.256 Å)140,141 and Pt-N distances in
the range 2.010-2.065 Å (average 2.046 Å)142,143
143
were reported, while C-S bond lengths
and C-C distances fit in a 0.110 (1.690-1.800 Å, average 1.744 Å) ,144 and 0.177 Å
(1.283-1.460 Å, average 1.373 Å)145,146
140
range, respectively. S-Pt-S and N-Pt-N angles
range between 87.44-90.59 (average 89.38°) ,143 and 77.54-80.65° (average
79.22°),142,143 respectively (Figure 1.16).
Figura 1.16. Ranges of bond distances (Å) and angles (°) for platinum diimine-dithiolate complexes.
Diimine-dithiolate complexes featuring both square-planar and tetrahedric coordination
geometries at the metal ions exhibit a tendency to form dimeric structures, analogously
to what observed for bis(1,2-dithiolene) complexes, and these aggregates are usually
Figure 1.15. Ranges of bond distances (Å) and angles (°) for diimine-dithiolate complexes of transition
metals.
Page 58
Introduction
44
held together by intermolecular M-S bonds between layered complexes in a head-to-tail
orientation (Figure 1.17).130d-e,131,140,147
MN S
N SR'
R'RR
MS N
S NR
RR'R'
Figure 1.17. Example of [M(N^N)(S^S)] dimeric structure.
The complex units in the solid state are otherwise connected through stacking
interactions, and also in this case for cationic and anionic complexes, the nature and size
of the countercations can play a crucial role in the formation of the stacks.129,148
(ii) In the few structural reports on complexes of the type [M(N^N)2(S^S)] or
[M(N^N)(S^S)2], the central metal ion is coordinated in an octahedral or distorted
octahedral fashion. Bond lengths and angles have been found in the ranges summarised
in Figure 1.18.
149
Figure 1.18. Ranges of bond distances (Å) and angles (°) for octahedral diimine-dithiolate complexes of
transition metals.
Page 59
Introduction
45
1.3.2.3. Properties
The most striking feature of [M(diimine)(dithiolate)] complexes with square-planar
coordination is the presence of an absorption band in the visible region showing a
solvatochromic behavior, similar to that observed for heteroleptic bis(1,2-dithiolene)
complexes (see above), but featuring a much larger range of energies.121
The assignment of this absorption band, deriving from a monoelectronic HOMO-
LUMO vertical transition, has been extensively debated in the past. In the early works
by Vogler,136 the solvatochromic absorption band was assigned to a ligand-to-ligand
charge-transfer (LLʹCT) electronic transition, on the base of the assumption that the
HOMO was mainly localised on the 1,2-dithiolene ligand, while the LUMO was centred
on the diimine. More recently, the absorption band has been assigned by Eisenberg and
coworkers127,150 to a mixed metal-ligand-to-ligand charge-transfer (MMLLʹCT, or
MLCT/LLCT as recently abbreviated).151 According to this interpretation, the HOMO
in this complexes shows a not negligible metal character, as confirmed by the
theoretical works performed by Mitsopoulou et al., and recently reviewed by the same
authors.152
121
In any case, the negative solvatochromism of this absorption band is due to
the fact that the charge-transfer axis is collinear but antiparallel to the ground state of
the dipole of the molecule, and thus excited state is less polar than the ground state.
Since the energy of the absorption band does not depend linearly on the polarity of the
solvent, Eisenberg and coworkers developed an empirical solvent scale for platinum(II)
diimine-dithiolate complexes.127 Systematic variation in the nature of both the diimine
and the dithiolate ligands can be used to tune the energy of this absorption band.127,150
Eisenberg and coworkers, by testing the effects of several diimines and of a restricted
number of well-known 1,2-dithiolene (namely edt2–, mnt2–, tdt2–, and dmqdt2–, Scheme
1.1) and other dithiolate ligands on the resulting complexes, concluded that the energy
Page 60
Introduction
46
of the absorption maximum in the visible region depends on both the dithiolate and
diimine ligand. In particular diimines that possess electron-donating substituents were
found to raise the energy of the LUMO (without affecting that of the HOMO), and
consequently the HOMO-LUMO energy gap, while diimines featuring electron-
withdrawing groups lower the energy of the LUMO and hence the energy gap between
the frontier orbitals, while less accurate conclusions were formulated on the effect of the
dithiolate, because of the limited number of 1,2-dithiolene ligands considered in the
study.
The nature of the metal ion also affects the energy of the transition, as rationalised also
by means of DFT calculations which showed that the energy of the transition decreases
in the order Pd > Ni > Pt.153
Another important feature of diimine-dithiolate complexes featuring the metal ion in a
square-planar coordination is their luminescence in solution, solid state, and frozen
solvent glasses.
127 This emission occurs in the visible region, and has been assigned to a
charge-transfer-to-diimine state, and accordingly its energy is solvent-dependent.
Moreover, also in this case, a dependence of the emission features on the nature of the
ligands was observed for platinum(II) complexes.127 In particular, both the diimines and
dithiolates influence the energy, emission lifetime and quantum yield of the
Pt(diimine)(dithiolate) chromophore.127 The analysis of the luminescence properties of
these complexes also allowed to discover that they undergo both oxidative and
reductive electron-transfer quenching, and, again, the excited-state redox potentials
were found to depend on the nature of the ligands.127 Moreover, it was observed that,
depending on the concentration of the solutions, these complexes undergo self-
quenching, attributed to the formation of stacks in solution.154
Similarly to homoleptic and heteroleptic bis(1,2-dithiolene) complexes, [M(N^N)(S^S)]
complexes are redox-active species, and they usually feature two redox processes.
127
Page 61
Introduction
47
The reversibility and the half-wave potentials of these processes depend, also in this
case, on the nature of both the diimine and the dithiolato ligands. In particular, the
nature of the N^N ligand affects the reduction potential (according to the localisation of
the LUMO on this ligand), while the oxidation one depends on the S^S ligand (because
of the localisation of the HOMO on this part of the complex),127 though the tunability of
this variable has not been investigated as thoroughly as those of absorption
spectroscopic features.
Finally, another peculiar property of these systems is their photoreactivity. It is in fact
well known that group 10 metals diimine-dithiolate complexes undergo photolysis in
the presence of molecular oxygen, as illustrated for PtII complexes in Scheme 1.13.155
Scheme 1.13. Photoreactivity of [Pt(N^N)(S^S)] complexes (adapted from Ref. 155).
1.3.2.4. Applications
Due to their peculiar properties, diimine-dithiolate complexes, and in particular PtII
ones, have been exploited for a wide range of applications, in fields ranging from
material chemistry to biology.
(1) Nonlinear Optics. Given their lack of inversion centre, the molecular first
hyperpolarisability (β) of diimine-dithiolate complexes is nonzero, so that they can be
exploited for SONLO applications. Molecular first hyperpolarisabilities of a restricted
number of PtII and NiII diimine-dithiolate complexes were evaluated from electric field
induced second harmonic generation (EFISH) measurements, using the two-state
Page 62
Introduction
48
approximation.87a,130,137a,156
130
The values of β determined for these complexes were found
to reach as much as –37·10–30 esu, c a value comparable to that of other NLO-active
materials, so that these complexes represent one of the most promising class of
complexes containing 1,2-dithiolene ligands for NLO applications. Also in this case, an
influence of the nature of both the diimine and the dithiolate on the entity of β was
found,130c and, interestingly, the PtII complexes were identified as the most promising
candidates for these applications, both experimentally130c and at a theoretical level.153
(2) Applications in dye-sensitised solar cells. In recent years the synthesis of transition-
metal dye molecules for use as solar cells sensitisers has received much interest.157 Dye
molecules anchored to the surface of nanocrystalline TiO2 absorb visible light and in
their excited state they inject an electron into the conduction band of the TiO2.158
158
[Pt(N^N)(S^S)] compounds were investigated for their use in solar cells as they were
shown to possess a number of key features that render them of interest as sensitisers.
These features include their intense absorption band in the visible region, and their
luminescent properties in solution, the tunability of which is particularly important in
this context, since the electrochemical and photophysical properties of the dye generally
affect the overall performance of the solar cell. In order to be exploitable in this field,
the dyes must contain a functional group to anchor them to the TiO2 surface, such as a
carboxyl group bound at the diimine ligand. The diimine-dithiolate complexes tested so
far in a solar cell arrangement were found to efficiently convert light into electricity
over the entire visible region, with overall efficiencies (η) up to 3%.159
(3) Photogeneration of H2.The development of a molecular-based system for light-to-
chemical energy conversion remains a key research objective for molecular scientists
focused on energy production and utilisation. These studies employed multiple
component systems that involved electron-transfer quenching of the chromophore,
subsequent electron-transfer from the quencher to the dark catalyst, proton reduction to
Page 63
Introduction
49
yield H2, and irreversible reaction of a sacrificial electron-donor.160 [Pt(N^N)(S^S)]
complexes were exploited for the design of molecular-based systems for light-driven,
energy-storing reactions. In these systems, the diimine-dithiolate complexes are
envisioned as the chromophores, having a directional charge-transfer excited state for
electron-hole creation and substituent flexibility for tuning the excited state and
connection to donor and acceptor groups. Eisenberg and collaborators successfully
prepared some molecular photochemical devices (MPDs) based on [Pt(N^N)(S^S)]
systems.161
(4) Applications as conductive and magnetic materials. Analogously to homoleptic and
heteroleptic bis(1,2-dithiolene) complexes, the magnetic and electric properties of
diimine-dithiolate complexes in the solid state have been tested. In particular,
Matsubayashi and co-workers demonstrated that planar sulphur-rich dithiolate metal
complexes of the [Pt(N^N)(S^S)] type (an example is drawn in Figure 1.19) can form,
in their cationic form, columnar molecular stackings and/or layered interactions in the
solid state through metal-metal and/or sulphur-sulphur contacts, giving rise to high
electrical conductivities.
148b,162
SPt
S
N
N
S
SS
SS
S
Figure 1.19. Example of sulphur-rich 1,2-dithiolene metal complex with conductive properties:
[Pt(bipy)(C8H4S8)] (Ref. 162).
On the other hand, Omary recently reported on some charge-transfer products of
[M(tBu2-bipy)(dmid)] (M = Pd, Pt; tBu2-bipy = 4,4ʹ-tert-Bu2-2,2ʹ-bipyridine) complexes
with organic acceptors such as TCNQ, TCNQF and TCNE (Figure 1.20, a, b, and c,
Page 64
Introduction
50
respectively), and demonstrated their magnetic susceptibilities and conductivities are
nonzero, suggesting that these systems could be exploited as multifunctional molecular
materials.143
CN
CN
NC
NC
CN
CN
NC
NC
F F
F FNC
CN
CN
NC
a b c
Figure 1.20. Organic acceptors used for the formation of charge-transfer products with [M(tBu2-
bipy)(dmid)]: a) TCNQ; b) TCNQF; c) TCNE (Ref. 143).
(5) Applications as Sensors. [M(diimine)(dithiolate)] complexes have been recently
exploited as optical/electrochemical sensors for alkali metals. In particular Zuo142,163
and co-workers reported some [Pt(N^N)(S^S)] complexes bearing crown-ether
annelated dithiolene systems (Figure 1.21), and underlined that these systems undergo a
potential shift of their redox processes and a colour change in the presence of Na+
cations, demonstrating that these complexes represent highly selective sensors for the
naked-eye detection of these metal ions.
N
NPt
S
S
SO
O
SO
tBu
tBu
Figure 1.21. Example of a [Pt(N^N)(S^S)] complex a bearing crown-ether annelated dithiolene system
and used as Na+ sensor: [Pt(dbbpy)(3O-C2S4)] (3O-C2S4 = 1,4,7-trioxa-10,13-dithiacyclopentadec-11-
ene-11,12-dithiolate; dbbpy = 4,4’-di-tert-butyl-2,2’-bipyridine; Ref. 163).
Page 65
Introduction
51
(6) Biological applications. Finally, a PtII diimine-dithiolate complex containing a
quinoxaline ligand (Figure 1.22) was recently exploited as antiproliferative agent
toward human tumour cells, given its ability to undergo DNA binding and photo-
induced cleavage.164
N
N
N
PtS
S
Figure 1.22. Molecular drawing of the complex [Pt(pq)(bdt)] [pq = 2-(2ʹ-pyridyl)quinoxaline and bdt2–
=benzene-1,2-dithiolato] (Ref. 164).
1.3.3. Other systems containing 1,2-dichalcogenolene ligands.
1.3.3.1. Other mixed-ligand complexes featuring 1,2-dichalcogenolene ligands
1,2-Dichalcogenolene ligands have been also exploited for the synthesis of the
following classes of compounds.
(1) Cyclometalated complexes. Some complexes schematised as [M(C^N)(S^S)] and
related to M(diimine)(dithiolate) were synthesised in the past, bearing an arylpyridine
chelating ligand in place of the diimine one, with several metal ions, such as Ni,92d
Pd,92d Pt165 129 and Au, (See few examples in Figure 1.23), and they showed absorption
and emission spectroscopic features very similar to those of [M(N^N)(S^S)] complexes.
Page 66
Introduction
52
N
PtS
S CN
CN
N
PtS
S CN
CNS S
S
Me
N
Au
a cb
- -
Figure 1.23. Examples of cyclometalate complexes featuring arylpyridine chelating ligands along with
1,2-dithiolenes: a) (Bu4N)[Pt(ppy)(mnt)] (17), b) (Bu4N)([Pt(tpy)(mnt)] (18), c) [Au(ppy)(tdt)] (19). Refs.
129 and 165.
(2) Carbonyl complexes. Ultraviolet or visible light irradiation of a mixture of group 6
metal hexacarbonyl complexes M(CO)6 (M = Cr, Mo, W) and Ni(S2C2Z2)2 (Z = alkyl or
aryl) affords carbonyl complexes [M(CO)4(S2C2Z2)] and [M(CO)2(S2C2Z2)2] (Figure
1.24).107 The carbonyl groups in the bis(carbonyl)-bis(1,2-dithiolene) complexes are
sufficiently labile to be displaced by a variety of other ligands, such as chalcogenides,166
phosphines, 1,2-dithiolenes or halides.167
MS SS S R
RR
R
OC COMS
SRR
OC CO
COCO
Figure 1.24. Mono- and bis-(1,2-dithiolene) carbonyl metal complexes.
(3) Nitrosyl complexes. McCleverty and co-workers found that dimeric dianions of the
type [Fe(S^S)2]22– are useful intermediates in the synthesis of iron mono-nitrosyl
complexes. In fact, by treating the dimers with NO in nonpolar or weakly coordinating
solvents, the corresponding complexes [Fe(NO)(S^S)2]– were obtained (Figure 1.25).168
168
Similar complexes were obtained with Co and Mo.169
Page 67
Introduction
53
Fe SSSS
R
RR
R
NO
Figure 1.25. Molecular drawing of a [Fe(NO)(S^S)] – complex (Ref. 168).
(4) Cyclopentadienyl complexes. A large number of mixed-ligand 1,2-dithiolene
complexes including cyclopentadienyl (Cp) ligands have been prepared, both in their
neutral or anionic state.170 Extensive work on these systems was performed and recently
reviewed by Sugimori.171 The coexistence of aromaticity and unsaturation in the
metalladithiolene ring confers unique reactivity to this class of complexes, which
undergo electrophilic or radical substitution reactions, typical of aromatic rings.
Recently, a bis(cyclopentadienyl) Ti complex featuring N-methyl-2-thioxo-1,3-
thiazoline-4,5-diselenolate (Me-dset2–) was also reported (Figure 1.26).172
Figure 1.26. ORTEP drawing of [Ti(Cp)2(Me-dset)]. Ellipsoids are shown at the 50% probability level.
Hydrogen atoms were omitted for clarity (Ref. 172).
(5) Phosphine-dithiolene complexes. Pilato and co-workers synthesised a series of
platinum(II) complexes of dppe (diphenylphosphinoethane) with 1,2-dithiolene ligands
Page 68
Introduction
54
(Figure 1.27).173 These complexes present several interesting properties, such as
solvatochromic absorption bands and luminescence in solution at room temperature,
which make them candidates for applications as molecular probes and sensors.174 The
lowest energy excited state was characterised in these systems as a ene-1,2-dithiolate
π→heterocycle π* ILCT, based on the solvatochromic absorption band that is
independent of substituting Pt with Pd or Ni, but sensitive to changes on the heterocycle
ring. The luminescence could be quenched by oxygen and organic electron-donors or
acceptors, as well as by weak organic acids.175
SPt
S
N
N
P
P
Ph Ph
PhPh
Figure 1.27. Example of phosphine-dithiolene complex: Pt(dppe)[S2C2(2-quinoxaline)(H)] (Ref. 174).
1.3.3.2. 1,2-Dithiolenes in nature
1,2-Dithiolenes play an important role in natural systems, since they are included in
several metalloenzymes as integral components of their cofactors, and the role of
dithiolenes in biological systems has been the subject of a vast number of publications
and reviews.8,176
In particular, dithiolene groups are present in molybdenum- and tungsten-containing
enzymes, which play an important role in the biochemical cycles of carbon, nitrogen
and sulphur, and are present in all living systems.
176b In particular, the molybdenum-
and tungsten-containing enzymes featuring dithiolene systems are oxotranferases that
Page 69
Introduction
55
catalyse the transfer of an oxygen atom to a substrate X, or from a substrate XO,
according to Equation 1.11:8
XO + 2H+ + 2e– ↔ X + H2O (1.11)
The reactions catalysed involve a wide variety of substrates, including: (i) the oxidation
of sulfite to sulfate, xanthine to uric acids, and an aldehyde to the corresponding
carboxylic acid; (ii) the reduction of nitrate to nitrite and DMSO to DMS.177 Several of
these enzymes were structurally characterised,178 and each catalytic centre showed to
involve a single metal ion bound to one or two molecules of a special moiety,
molybdopterin (MPT), that is unique to these enzymes (Figure 1.28).179
HN
N
N
N OH2N
O S-
S-
OPO3H(R)
H
H H
H
H
Figure 1.28. Molecular structure of molybdopterin (MTP), the ligand that coordinates molybdenum or
tungsten at the catalytic centre of the oxotransferase enzymes (R = H or nucleotide, Ref. 178 ).
MTP is a triclinic pyranopterin, the pyran ring of which embeds the 1,2-dithiolene
group and a phosphate side chain. The remainder of the coordination sphere of the
metal is represented by a selection of ligands, including oxo-, dioxo-, hydroxo-, water-,
or sulphide-groups and aminoacid side chains, and the molybdenum- and tungsten-
containing enzymes structurally characterised so far have been classified on the basis
of the number and nature of these ligands.176b
Page 70
Introduction
56
Spectroscopic informations indicate that the oxygen atom transfer reaction takes place
at the metal centre, the oxidation state of which changes from MVI to MIV or vice-
versa.176d
This chemistry has been mimicked by low molecular weight analogues of these centres,
which were used as structural and reactivity models;8,180 however, challenges remain in
understanding the coordination chemistry of these centres, not the least of these is the
role of the pterin and pyran ring that, together with the dithiolene, form MPT. In this
context, theoretical calculations could play a crucial role, as testified by the recent
publication of several works on this topic.181
Page 71
Objectives
57
2. Objectives
Since many years, the research group I have been working with has been focusing its
attention on the chemistry of metal (1,2-dithiolene) complexes, and, in particular on the
synthesis of complexes with square-planar coordination containing 1,2-dithiolene
ligands, and the study of their chemical-physical properties, with particular regard to the
linear and nonlinear optical features of these systems.
As already mentioned, during the past years, bis(1,2-dithiolene) complexes of the type
[M(R,Rʹ-timdt)2] (M = Ni, Pd, Pt; R,Rʹ-timdt2– = N,Nʹ-disubstituted 2-
thioxoimidazoline-4,5-dithiolate)12,26d,78,83,91 have been particularly studied. These
complexes show interesting features, and in particular a NIR absorption whose energy
suggested a possible use of these systems in Nd-based lasers, and NLO properties such
as saturable absorption.78,182,183
91
Moreover, these complexes feature a wavelength-
selective photoconductivity coupled to the near-IR absorption, which allowed for the
fabrication of solid-state photodetectors operating between the first and third optical-
fiber windows.
In the past few years, the research has been focusing on asymmetrically substituted 1,2-
dithiolene ligands, whose complexes in their cis conformation, as already mentioned,
are candidates for SONLO application. This was first achieved by modifying the R,Rʹ-
timdt2– ligands through the introduction of R and Rʹ substituents remarkably different in
nature.78 Subsequently, as mentioned in Chapter 1 (Sections 1.1.4 and 1.2.4.1.2),
homoleptic bis(1,2-dithiolene) complexes based on a class of ligands intermediate
between R,Rʹ-timdt2– and dmit2–, namely R-dmet2– (N-substituted 2-thioxo-thiazoline-
4,5-dithiolate), were obtained and characterised.27 [M(R-dmet)2] complexes (M = Ni,
Pd, Pt), analogously to related [M(R,Rʹ-timdt)2] ones, were found to be good candidates
for near-IR-laser applications and for near-IR-photoconductivity.91d
Page 72
Objectives
58
More recently, a study on mono-arylsubstituted 1,2-dithiolene ligands of the class Ar,H-
edt2– (aryl-substituted ethylene-1,2-dithiolate) has also been started,184
In this context, the present doctorate has been aimed at continuing the research on the
topic of asymmetrically substituted 1,2-dichalcogenolene ligands, with the main aim of
designing new SONLO-active materials. In particular, the work has been focused on the
following goals:
with particular
focus on the possibility of combining in the resulting metal complex the properties of
the dithiolene system with those peculiar to the ligand substituents.
a) Synthesis and characterisation of new homoleptic bis(1,2-dithiolene) complexes
featuring monosubstituted 1,2-dithiolene ligands, and, in particular, monoarylsubstituted
ligands of the type Ar,H-edt2– capable of combining in a single molecular compound the
luminescence of the substituents with the linear and nonlinear optical properties of the
dithiolene core.
b) Synthesis and characterisation of a series of new mixed-ligand complexes containing
both Ar,H-edt2– and R-dmet2– ligands (including selenated analogues), and in particular
of platinum(II) diimine-dichalcogenolate complexes, in order to investigate the
structure-properties relationships within the series of complexes obtained.
[Pt(N^N)(S^S)] complexes were chosen as the focus of the investigation because,
among all the mixed-ligand complexes featuring 1,2-dichalcogenolene ligands obtained
so far, they represent the most promising candidates for NLO applications.
c) Study of the electronic structure of the synthesised complexes by means of DFT
calculations. In this context, our goal is to evaluate the static first hyperpolarisability (β)
of the synthesised compounds, in order to identify the best candidates for experimental
NLO measurements and study, also in this case, the structure-properties relationships of
these systems.
Page 73
Objectives
59
d) Study of other possible applications of the obtained compounds in the field of
Information and Communication Technology (ICT), through the analysis of properties
previously encountered for complexes based on 1,2-dichalcogenolene ligands, such as
photoconduction.
Page 74
Results and Discussion
60
3. Results and Discussion
The present work has been focused on the synthesis and characterisation of
noncentrosymmetric complexes bearing 1,2-dichalcogenolene ligands for NLO
applications, mainly employing asymmetrically substituted ligands belonging to the
classes Ar,H-edt2– (edt2– = ethylene-1,2-dithiolato; Ar = aryl group) and R-dmet2– (N-
substituted 2-thioxo-thiazoline-4,5-dithiolate) or the isolog R-dset2– (N-substituted 2-
thioxo-thiazoline-4,5-diselenolate).
As far as homoleptic bis(1,2-dithiolene) complexes are concerned, those deriving from
R-dmet2– ligands have been extensively investigated by our research group and by
Prof. Lorcy and coworkers in Rennes.27,28,79,91c,172
Homoleptic bis-dithiolenes of the type [M(Ar,H-edt)2]x– were investigated in depth for
M = Ni.184 During the present work we have therefore extended this work to M = Au, a
metal ion that in bis(1,2-dithiolene) complexes exhibits many common structural,
electrochemical and spectroscopic aspects with the corresponding ones of group 10
metals.
Passing to heteroleptic complexes, in view of our interest for NLO potential
applications and on the ground of the state of the art on this topic, we have turned to
combining asymmetrical 1,2-dichalcogenolene ligands with symmetric aromatic
diimines, to form the corresponding noncentrosymmetric Pt(diimine)(dichalcogenolate)
complexes. For this purpose, 1,2-dichalcogenolene ligands belonging to both classes
mentioned above were adopted, to give [Pt(N^N)(E^E)] complexes (E = S, Se).
In addition, few other complexes, not belonging to the classes of products just
mentioned, have been prepared, and will be discussed in the following Sections.
Page 75
Results and Discussion
61
3.1. Synthesis and characterisation of [Au(Ar,H-edt)2]x– complexes (20x–-
22x–)
Notwithstanding the large number of both experimental and theoretical studies on 1,2-
dithiolene complexes, luminescence has been only occasionally tapped,173 although
such investigations are invaluable in understanding the electronic structure of both
ground and excited states. Weak emission processes (Φ = 1·10–5) have been reported for
some bis(1,2-dithiolene) complexes,150b but more commonly studies have concerned
either mixed-ligand monodithiolene complexes,173,185 as previously mentioned, or
negatively charged bis(1,2-dithiolene) complexes counterbalanced by fluorogenic
cations.186
Consequently, impelled by the low-energy electronic NIR absorption of neutral d8 metal
complexes, and by the capability of asymmetrically substituted 1,2-dithiolene ligands to
form noncentrosymmetric systems, the possibility of attaching a single fluorogenic
substituent to each 1,2-dithiolene ligand has been investigated, so as to include in a
single molecular compound the peculiar properties of the luminescent substituents along
with the linear and NLO properties of the dithiolene core.
During the research described in this thesis, attention has been focused on the AuIII
complexes 20, 21, and 22, featuring monoaryl substituted ethylene-1,2-dithiolates with
aromatic substituents of increasing complexity, namely phenyl, 2-napthyl, and 1-
pyrenyl, respectively.
3.1.1. Synthesis
As mentioned in section 1.1.2., one of the most commonly adopted methods for the
synthesis of stable open-ring 1,2-dithiolene ligands consists of the reaction of α-
Page 76
Results and Discussion
62
haloketones with alkylxanthate anions to give the corresponding α-ketoxanthate
esthers.17 In a subsequent reaction, these esthers can undergo cyclisation in strongly
acidic media to give the corresponding vinylene dithiocarbonates. The heterocycles are
then reacted with strong bases, leading to the ethylene-1,2-dithiolates, that can be
reacted with the desired metal ion to give the desired 1,2-dithiolene complexes.
According to this synthetic strategy, adopted previously to synthesise the salt
(PPh4+)(20–),18b a three-step synthetic route has been exploited for the synthesis of the
complexes (Scheme 3.1). In this work, our interest has been focused on three aryl
substituents of increasing extension, namely phenyl, 2-naphthyl, and 1-pyrenyl.
In the first step (i in Scheme 3.1), potassium isopropyl xanthate was reacted with the
desired bromoacetylarene in acetone solution, to give the corresponding O-isopropyl-S-
aryldithiocarbonate [Aryl = Ph (23), Naph (24), Pyr (25)].
This step is followed by the cyclisation of the obtained O-isopropyl-S-arylcarbonates
23-25 (ii in Scheme 3.1), performed in a 1:2 diethyl ether/chloroform mixture in the
presence of HClO4, leading to the formation of the corresponding aryl-1,3-dithiol-2-
ones [aryl = Ph (26), Naph (27), Pyr (28)]. These heterocycles were subsequently
suspended in ethyl alcohol in the presence of an excess of KOH, to give the
corresponding monoaryl ethylene-1,2-dithiolates, which were readily reacted in situ
with KAuCl4 in the presence of tetrabutylammonium iodide. This led to the formation
of the desired gold(III) bis(1,2-dithiolene) complexes 20-22 as monoanions,
counterbalanced by tetrabutylammonium (TBA+) cations (step iii in Scheme 3.1).
Page 77
Results and Discussion
63
O
S S- Ar
O
Br
OAr
S O
S
Acetone- KBr
K+
OAr
S O
S S
SAr
H
OHClO4
S
SAr
H
O
1) EtO-/EtOH2) KAuCl4
SAu
S
S
SAr
H
Ar
H
Diethyl ether/chloroform
Ar = Ph (23), Naph (24), Pyr (25)
Ar = Ph (26), Naph (27), Pyr (28)
-
(TBA)+
Ar = Ph (20), Naph (21), Pyr (22).
i)
iii)
ii)
3) TBAI
Scheme 3.1. Synthesis of (TBA+)[Au(Ar,H-edt)2]– compounds.
The complexes, obtained in yields ranging between 18 and 36%, were found to be
thermally stable, with melting points above 110° C.
3.1.2. Structural characterisation
X-ray diffraction-quality crystals were obtained for one of the aryl-1,3-dithiol-2-one
precursors, namely 26 (Figure 3.1, Table 3.1).
Page 78
Results and Discussion
64
Figure 3.1. ORTEP drawing and atom labelling scheme for 26. Thermal ellipsoids are shown at the 50%
probability level.
Table 3.1. Crystal data for 26.a
Empirical Formula C9H6OS2
Formula weight 194.26
Crystal size (mm) 0.36 x 0.12 x 0.02
Crystal system Orthorhombic
Space group Pbca
a (Å) 10.3779(6)
b (Å) 7.8316(3)
c (Å) 20.3844(12)
Volume (Å3) 1656.75(15)
Z 8
Calculated density (Mg m–3) 1.558
Reflections unique 1900
Rint 0.0594
Parameters 109
Final R indices [I >2σ (I)] 0.0400
wR2 (all data) 0.0966
a T = 120(2) K. MoKα radiation (λ = 0.71073 Å).
C3 C4 C5 C7
C6
C2
C8 C1
S2
S1
O C9
Page 79
Results and Discussion
65
The diffractometric analysis shows that the compound features the expected structure,
with the phenyl substituent slightly twisted with respect to the plane of the heterocycle
[9.18(12)°; Table 3.2] Concerning the bond lengths in the heterocycle, a C-C distance of
1.344(3) Å was observed, while the average C(1,9)-S(1,2) and C8-S(1,2) bond distances
were found to be 1.742 and 1.771 Å, respectively (Table 3.2).
Table 3.2. Selected bond lengths (Å), angles and dihedrals (°) for 26.a
S1-C8 1.770(2)
S2-C8 1.773(2)
C8-O 1.213(3)
C1-C9 1.344(3)
S1-C1 1.756(2)
S2-C9 1.729(2)
C1-C2 1.400(3)
C9-C1-S1 115.37(17)
C1-C9-S2 119.21(17)
C1-S1-C8
96.99(11)
C9-S2-C8 96.11(11)
S1-C8-S2 112.30(13)
C3-C2-C1-C9 9.18(12) a Atom labeling scheme as in Figure 3.1.
Such metric parameters are in good agreement with the average experimental distances
reported so far for differently substituted 1,3-dithiol-2-ones [1.346 (14), 1.739 (23), and
1.766 (7) Å for C1-C9, C(1,9)-S(1,2), and C8-S(1,2) bond lengths, respectively].187
Page 80
Results and Discussion
66
Among the gold complexes deriving from the precursors 26-28, crystals suitable for X-
ray diffraction were obtained for the complex (TBA+)(21–). The crystal structure (Figure
3.2, Table 3.3) shows that the compound contains discrete complexes featuring the
central metal ion coordinated in a square-planar fashion, with the ligands assuming a cis
conformation.
Figure 3.2. ORTEP drawing and atom labelling scheme for the dithiolene unit in (TBA+)(21–). Thermal
ellipsoids are shown at the 50% probability level. Hydrogen atoms have been omitted for clarity.
Although several examples of monoanionic homoleptic nickel bis(1,2-dithiolene)
complexes derived from asymmetrically substituted ligands have been characterised
structurally,188
18
only two examples of gold 1,2-ditholenes with a cis [Ar = phenyl (20–),
pyridin-2-yl (29–)] and two with a trans configuration [Ar = pyridin-3- (30–) and 4-yl
(31–)] have been described to date (Figure 3.3). b,189
Au
S1 S3
S4 S2 C3
C12
C4
C5
C6
C7
C8
C9
C10
C2
C1
C11
C14
C13
C24
C15
C16 C17
C18 C20 C19
C23
C22
C21
Page 81
Results and Discussion
67
a
dc
b
AuS
S S
SH H
AuS
S S
SH H
NN
AuS
S S
S H
H
N
N
AuS
S S
S H
H
N
N
Figure 3.3. Structures of monoanionic gold bis(1,2-dithiolene) complexes featuring monosubstituted
ligands characterised structurally: a) [Au(Ph,H-edt)2]– (20); b) [Au(2-Py,H-edt)2]– (29–); c) [Au(3-Py,H-
edt)2]– (30–); d) [Au(4-Py,H-edt)2]– (31–, Refs. 18b and 189).
Table 3.3. Crystal data for (TBA+)(21–).a
Empirical Formula C40H52AuNS4
Formula weight 872.03
Crystal size (mm) 0.46 x 0.06 x 0.02
Crystal system Orthorhombic
Space group P212121
a (Å) 12.1719(8)
b (Å) 16.2337(10)
c (Å) 19.4449(8)
Volume (Å3) 3842.2(4)
Z 4
Calculated density (Mg m–3) 1.508
Total number of data 38594
Reflections unique 8772
Rint 0.1182
Parameters 419
Final R indices [I >2σ (I)] 0.0506
wR2 (all data) 0.0979
a T = 120(2) K. MoKα radiation (λ = 0.71073 Å).
Page 82
Results and Discussion
68
Table 3.4. Selected bond lengths (Å), angles and dihedrals (°) for (TBA+)(21–).a
Au-S1 2.314 (2)
Au-S2 2.306 (2)
Au-S3 2.318 (2)
Au-S4 2.312 (2)
C1-C2 1.327 (12)
C13-C14 1.358 (12)
S1-C1 1.747 (9)
S2-C2 1.765 (8)
S3-C13 1.721 (9)
S4-C14 1.775 (8)
S1-Au-S2 89.93(8)
S3-Au-S4 89.98(8)
S1-Au-S3 91.78(8)
S2-Au-S4 88.42(8)
Au-S1-C1 100.8(3)
Au-S3-C13 100.7(3)
Au-S2-C2 102.6(3)
Au-S4-C14 102.3(3)
S1-C1-C2 127.3(7)
S2-C2-C1 119.3(7)
S3-C13-C14 125.9(8)
S4-C14-C13 121.2(7)
C1-C2-C3-C4 26.5(12)
C13-C14-C15-C24 25.7(12) a Atom labeling scheme as in Figure 3.3.
Page 83
Results and Discussion
69
The two naphthyl substituents are twisted with respect to the ethylene-1,2-dithiolato
core by 25.7(12) and 26.5(12)°, analogously to what found for all the other homoleptic
monoanionic or neutral gold bis(1,2-dithiolene) complexes that feature aromatic
substituents structurally characterised so far, in which the aromatic rings show torsion
angles ranging between 11.69(4)18b and 60.2(2)°.75a
A closer examination of the Au(C2S2)2 core shows that the two units are remarkably
different to each other as far as C-C and C-S bonds are concerned (Table 3.4). However,
the average C-C and C-S bond lengths (1.342 and 1.752 Å, respectively) in 21– are
indeed close to the corresponding mean values [1.344(38) and 1.743(23) Å,
respectively] found for the other monoanionic gold complexes of 1,2-dithiolene ligands
found in the Cambridge Structural Database. These distances are also very close to
those determined for compound 26, discussed above. As previously pointed out, C-C
and C-S bond lengths have been indicated as a criterion for discriminating between the
ene-1,2-dithiolate (–S-C=C-S–) and the 1,2-dithioketone (S=C-C=S) possible limit forms
of a 1,2-dithiolene ligand, and hence to estimate the oxidation state of the central metal.
The bond lengths found in the crystal structure of 21– indicate the presence of C=C
double and C-S single bonds, respectively, suggesting that monoanionic gold bis(1,2-
dithiolene) complexes should be formulated as AuIII bis(ene-1,2-dithiolato) complexes,
in agreement with what was proposed by Wieghardt and co-workers for [Au(C6H4S2)2]–
(32–)190 75 and [Au(Ph2-edt)2]– (33–) derivatives, a by Tunney et al.18b for 20–, and [Au(n-
Py,H-edt)2]– [n = 2 (29–), 4 (31–); Py = n-pyridyl), and, more recently, by Rabaça et al.
for 31–.189
In the crystal packing, weak S···H (2.928–2.983 Å) and C···H (2.880–2.885 Å) contacts
are responsible for the interactions between organic cations and the complex anions.
Although the complex molecules are aligned along the cell axis directions, no
significant stacking interactions between the complex units are present, the shortest
Page 84
Results and Discussion
70
Au···Au distances of the complex molecules corresponding just to the cell axis
dimensions.
Finally, during an attempt of crystallising (TBA+)(21–), single crystals of an unknown
product were isolated. X-ray diffraction analysis established this to be 2,5-
bis(naphthyl)-thiophene (34), a reaction by-product deriving from the condensation of
two ligand units (Figure 3.4 and Table 3.5), previously synthesised from 2,5-
dibromothiophene.191
Figure 3.4. ORTEP drawing and atom labelling scheme for 34. Thermal ellipsoids are shown at the 50%
probability level.
C1 C5
C6
C14
C7
C13
C8 C9
C10
C11
C12
C23 C22
C20
C19 C17
C21
C18
C4
C3
S
C2
C15
C24
C16
Page 85
Results and Discussion
71
Table 3.5. Crystal data for 34.a
Empirical Formula C24H16S
Formula weight 336.43
Crystal size (mm) 0.06 x 0.06 x 0.02
Crystal system Monoclinic
Space group P21
a (Å) 7.7369(7)
b (Å) 5.8173(5)
c (Å) 36.365(3)
Volume (Å3) 1627.7(2)
Z 4
Calculated density (Mg m–3) 1.373
Reflections unique 4844
Rint 0.0930
Parameters 452
Final R indices [I >2σ (I)] 0.0764
wR2 (all data) 0.1848
a T = 120(2) K. MoKα radiation (λ = 0.71073 Å).
The molecule is almost completely planar, with dihedral angles C2-C1-C5-C14 and C3-
C4-C15-C16 of 3.11(10) and 0.58 (12)°, respectively. Selected structural parameters are
listed in Table 3.6.
Notably, the isolation of 34 may be considered as a proof of the instability of aryl-
ethylene-1,2-dithiolates, and its formation might be at least partially responsible for the
rather modest reaction yields of the synthesis of complexes 20–-22–.
Page 86
Results and Discussion
72
Table 3.6. Selected bond lengths (Å), angles and dihedrals (°) for 34.a
C1-C2 1.385(11)
C2-C3 1.427(11)
C3-C4 1.350(12)
C1-S 1.729(8)
C4-S 1.736(8)
C1-C5 1.459(12)
C4-C15 1.444(11)
C1-C2-C3 111.87(8)
C2-C3-C4 115.00(8)
C3-C4-S
109.82(6)
C4-S-C1 93.02(4)
S-C1-C2 110.3(7)
C2-C1-C5-C14 3.11(10)
C3-C4-C15-C16 0.58(12) a Atom labeling scheme as in Figure 3.4.
3.1.3. Electrochemistry
As already mentioned, gold(III) bis(1,2-dithiolene) complexes, like all complexes of d8
metals of the same type, are members of an electron-transfer series, which allows them
to assume molecular charges x ranging between –2 and 1,75a the relative stability of each
species being largely determined by the nature the of substituents at the 1,2-dithiolene
ligand. Cyclic voltammetry (CV) and differential pulse voltammetry (DPV)
measurements were performed in CH2Cl2 on (TBA+)(20–), (TBA+)(21–), and
(TBA+)(22–). Each of the compounds exhibits two one-electron DPV-tested redox
Page 87
Results and Discussion
73
waves, at about -2.0 and -0.13 V versus the Fc+/Fc couple [Table 3.7; Figure 3.5 for
(TBA+)(22–)].
Figure 3.5. Cyclic voltammogram recorded for a solution of (TBA+)(22–) at a platinum electrode in
anhydrous CH2Cl2 [298 K; scan rate 100 mV s–1; supporting electrolyte (TBA+)(PF6–) 0.1 M].
Following the interpretation provided by Wieghardt,75a these waves should be ascribed
to the processes shown in Equation 3.1:
[AuIII(L)(L )]. [AuIII(L)2]- [AuII(L)2]2-
(3.1)
in which L represents the dianionic ene-1,2-dithiolate form (–S-C=C-S–) and L˙ the
corresponding monoanionic radical form of the ligand. Notably, in the explored
potential range no waves indicating a further oxidation to cationic species [AuIII(L˙)2]+
were found.
Page 88
Results and Discussion
74
Table 3.7. Half-wave potentials E1/2 (V vs Fc+/Fc) recorded by CV for complexes (TBA+)(20–-22–).
E1/2 (–1/–2) E1/2 (0/–1) ipc/ipa (–1/–2) ipc/ipa
(0/–1) |Epc–Epa|(–1/–2) |Epc–Epa|(0/–1)
(TBA+)(20–) -2.04 -0.13 1.2 1.0 0.135 0.093
(TBA+)(21–) -2.01 -0.12 1.1 1.0 0.129 0.083
(TBA+)(22–) -2.01 -0.14 0.8 1.0 0.100 0.078
An examination of ipc/ipa and peak separation values clearly indicates that oxidation of
monoanionic species to the corresponding neutral ones is a fully reversible process
(ipc/ipa = 0.8-1.2; |Epc–Epa| about 100 mV at 100 mV s–1), and it occurs without
decomposition of the complexes. It should be noted that the redox behavior observed
for (TBA+)(20–) is different to that previously reported for (PPh4+)(20–),18b which, in
DMF solution, showed an irreversible nature for both processes. CV data allowed to
evaluate192
18
the HOMO and the LUMO energies of the monoanionic species (HOMO: -
4.89, -4.87, -5.25 eV; LUMO: -3.02, -2.91, -3.02 eV for 20–, 21–, and 22–, respectively)
and hence their HOMO–LUMO energy gaps (∆EHOMO–LUMO = 1.87, 1.96, and 2.24 eV
for 20–, 21–, and 22–, respectively), showing that the complex with the lowest HOMO-
LUMO energy gap is 20–. In Table 3.8, a comparison between the half-wave potentials
determined for 20-22 and those reported for other [Au(R1,R2-edt)2]
complexes b,75,192a,193 is provided, and shows that on passing from electron-
withdrawing (CN, CF3) to electron-releasing substituents the potentials of the three
redox processes in the series become progressively more negative, in agreement with
what commonly observed for bis(1,2-dithiolene) complexes of d8 metals (Section
1.2.4.1.1). Therefore, while for the gold bis(1,2-dithiolene) complexes that feature
strongly or moderately electron-withdrawing R1 and R2 groups the redox process that
leads to the monocation is not observed, for those that have electron-realising
substituents, the redox step leading to the dianion falls outside the explorable
Page 89
Results and Discussion
75
electrochemical window. Not surprisingly, an inspection of the Cambridge Structural
Database shows that to date most of the crystal structures of gold bis(1,2-dithiolene)
complexes concern monoanionic species, whereas only very few concern neutral
species (8 out of 103).
Table 3.8. Half-wave potentials E1/2 (V vs Fc+/Fc)a for 20–22 and some related [Au(R1,R2-edt)2] complexes.
R1 R2 E1/2(–1/–2) E1/2
(0/–1) E1/2(+1/0) Solventb Ref.
CF3 CF3 -1.36a 0.93a - CH2Cl2 75a
CN CF3 -1.35 0.75 - CH2Cl2 193c
15 CN CN -1.32a 0.71a - CH2Cl2 193b
29 2-Py c H -1.920 0.120d - DMF 18b
30 3-Py c H -1.880 0.180d - DMF 18b
31 4-Py c H -1.840 0.200 - DMF 18b
20 Ph c H -1.970 0.050 - DMF 18b
20 Ph c H -2.013 -0.127 - CH2Cl2 This work
21 2-Naph c H -2.011 -0.120 - CH2Cl2 This work
22 1-Pyr c H -2.038 -0.134 - CH2Cl2 This work
Ph-C6H4 Ph-C6H4 -2.03 -0.07 0.51 CH2Cl2 75a
33 Ph b Ph -2.061 -0.085 0.510 CH2Cl2 192a
4-tBu-C6H4 4-tBu-C6H4 -2.09 -0.11 0.45 CH2Cl2 75a
n-C4H9-O-C6H4 n-C4H9-O-C6H4 - -1.390a 0.363a CH2Cl2 75b
n-C8H17-O-C6H4 n-C8H17-O-C6H4 - -1.500a 0.375a CH2Cl2 75b
n-C12H25-O-C6H4 n-C12H25-O-C6H4 - -1.460a 0.368a CH2Cl2 75b
a For comparison purposes, data reported versus SCE were converted to versus Fc+/Fc by subtracting 0.39 V. b DMF = dimethylformammide; c Py=pyridyl; Ph = phenyl; Naph = naphthyl; Pyr = pyrenyl. d Anodic peak potential.
Page 90
Results and Discussion
76
3.1.4. Absorption UV-Vis-NIR Spectroscopy
As already pointed out, one of the most striking property of bis(1,2-dithiolene)
complexes of d8 metals in a square-planar coordination is their intense absorption in the
NIR region (Section 1.2.4.1.2.). This absorption has been particularly studied in bis(1,2-
dithiolene) complexes of group 10 metals. In these systems, the NIR-absorption occurs
both in their neutral form, where is mainly due to a monoelectronic HOMO-LUMO
vertical transition, and in the monoanions. In the latter case, being the molecular orbital
corresponding to the LUMO of the neutral form singly occupied, the electronic
transition is HOMO-SOMO in nature, and is always found at lower energies than in
neutral complexes, because of the stabilisation of the SOMO, and the subsequent
lowering of the energy gap between the frontier molecular orbitals, determined by the
partial filling of the former orbital (Figure 3.6). On the other hand, bis(1,2-dithiolene)
complexes of group 11 metals, and in particular gold(III) ones featuring a square-planar
coordination, due to their different electronic structure, show this band in their neutral
state, corresponding, from an electronic point of view, to the monoanionic form of
related bis(1,2-dithiolene) complexes of group 10 metals, and in the monocations,
corresponding to neutral group 10 metal complexes (Figure 3.6). Therefore, the
absorption is not present in the UV-Vis-NIR spectra of corresponding monoanionic
complexes, where the orbital corresponding to the SOMO in the monoanion is
completely occupied.
Page 91
Results and Discussion
77
HOMO HOMO
LUMO SOMO
HOMOSOMO
HOMO -1HOMO
Group 10 metal bis(1,2-dithiolene) complexes
Group 11 metal bis(1,2-dithiolene) complexes
0
0
-1
-1
LUMO
HOMO
+1
HOMO -1
HOMO
-2
Figure 3.6. Frontier molecular orbitals occupation diagram for differently charged bis(1,2-dithiolene)
complexes of group 10 and 11 transition metals.
The absorption band falls at energies remarkably lower than those of corresponding Ni,
Pd and Pt complexes, and the maximum absorption wavelength λmax depends on the
electronic features of the substituents. Thus, whereas 15 features a NIR absorption band
at 1110 nm,75a neutral gold bis(1,2-dithiolene) complexes that contain electron-releasing
groups feature bands centered at almost 1600 nm.75b As predictable, the corresponding
monocations feature very intense NIR bands with higher energies, at about 1100 nm
(1066 and 1142 nm for [Au(4-tBu-C6H4)2-edt2]+ and [Au(4-C6H5-C6H4)2-edt2]+,
respectively, in CH2Cl2).75a
The UV-Vis-NIR electronic absorption spectra (200–2000 nm) in CH2Cl2 of the TBA+
salts of complexes 20–-22– all feature absorptions in the UV-Vis region, the maxima of
which fall below 450 nm, with the band at the lowest energy featuring a maximum in all
cases at about 350 nm (Figure 3.7 for 22–).
Page 92
Results and Discussion
78
Figure 3.7. UV-Vis-NIR absorption spectrum recorded in CH2Cl2 for (TBA+)(22–).
As expected, the corresponding neutral species, readily formed in solution by oxidation
with I2, feature intense NIR absorption bands falling at 1408, 1464, and 1432 nm in
CH2Cl2 for 20–, 21–, and 22–, respectively, with molar extinction coefficients ε up to
about 20000 M–1 cm–1 (Table 3.9 and Figure 3.8 for 21–).
0
20000
40000
60000
80000
100000
120000
140000
230 430 630 830 1030 1230 1430 1630
ε (M
-1cm
-1)
Wavelength (nm)
Page 93
Results and Discussion
79
Figure 3.8. Dilution corrected UV-Vis-NIR spectra recorded during the spectrophotometric titration of
(TBA+)(21–) with I2 in CH2Cl2 solution.
The presence of well-defined isosbestic points in the titration spectra of the three
complexes supports their stabilities in the neutral state, already proved in the CV
timescale.
Table 3.9. NIR absorption maxima (nm) and molar extinction coefficients (M–1 cm–1) for complexes 20–-
22– in CH2Cl2.
λmax ε
(TBA+)(20–) 1408 12400
(TBA+)(21–) 1464 19500
(TBA+)(22–) 1432 7950
0
20000
40000
60000
80000
100000
120000
230 430 630 830 1030 1230 1430 1630
Wavelength (nm)
ε(M
-1cm
-1)
Page 94
Results and Discussion
80
3.1.5. Emission Spectroscopy
To the best of our knowledge, no investigations on the luminescence of gold 1,2-
dithiolene complexes have been reported to date, whereas, as far as nickel 1,2-dithiolene
complexes are concerned, the complex core is not luminescent itself and fluorescence
was reported only when negatively charged 1,2-dithiolene complexes were
counterbalanced by fluorescent cations.186
Fluorescence measurements carried out on (TBA+)(20–-22–) in the range λexc = 220–400
nm showed in all cases a complex emission profile in the visible region (380–550 nm),
with quantum yields (Φ) of about 1·10–3 (2.4·10–3, 9.4·10–4, and 1.0·10–3 for 20–, 21–,
and 22–, respectively).
Table 3.10. Excitation and emission wavelengths [λexc and λem (nm), respectively] for 20x––22x– (x = 0, 1)
in CH2Cl2 at room temperature.
Monoanion Neutral form
λexc λem λexc λem
20 333 390 300 390
21 360 426 360 424
22 343 410 343 473
As an example, in Figure 3.9 the UV-Vis absorption and the fluorescence emission
spectra recorded for 21– in CH2Cl2 are compared.
Page 95
Results and Discussion
81
Figure 3.9. Superimposed normalised UV-Vis (250-650 nm) absorption (continuous line) and emission
(dotted line; λexc = 360 nm) spectra recorded for (TBA+)(21–) in CH2Cl2 solution.
A spectral decomposition allowed us to evaluate the energy differences between the
emission maxima of the single component peaks, which were found to be within the
range 0.2–0.3 eV (Table 3.11; Figure 3.10 for 21–), so that the emission spectra should
result from a vibronic progression194
that derives from a single electronic relaxation
path.
Page 96
Results and Discussion
82
Figure 3.10. Normalised emission spectrum recorded for (TBA+)(21–) in CH2Cl2 solution (dotted line)
decomposed into the constituent Gaussian curves. C = 3.2·10–5 M. λexc = 360 nm. Gaussian curves:
maximum wavelengths λ = 400, 403, 424, 445, 480, 519 nm; full width at half maximum w = 20.3, 10.7,
10.9, 21.0, 20.2, 10.8 nm; relative intensity h = 0.09, 1.00, 1.00, 0.82, 0.20, 0.02.
Table 3.11. Results from the decomposition of the CH2Cl2 solution fluorescence spectra (350-500 nm)
recorded for (TBA+)(20–)-(22–) in four constituent Gaussian components. Each curve is described in
terms of wavelength position (λ, nm), full width at half maximum (w, nm) and relative intensity (h).
λ 1 λ 2 λ 3 λ 4 w1 w2 w3 w4 h1 h2 h3 h4
20– 370.0 388.1 407.5 408.1 5.5 12.6 22.9 99.3 0.7 0.8 0.8 0.3
21– 370.7 399.1 404.4 424.0 8.8 11.5 74.9 10.6 0.3 0.3 0.4 0.3
22– 386.4 400.6 447.6 501.8 2.7 20.5 53.9 142.0 0.4 0.6 0.4 0.1
Fluorimetric I2 titrations showed that neutral complexes 20–22 (λexc = 300, 360, and 343
nm, respectively) feature emission spectra in the same region as the corresponding
monoanionic species, as summarised in Table 3.10 (molar extinction coefficients ε
0.0
0.2
0.4
0.6
0.8
1.0
370 400 430 460 490 520 550λ (nm)
Nor
mal
ized
I f
Wavelength (nm)
Page 97
Results and Discussion
83
calculated at the excitation wavelengths remain almost unaltered on passing from the
monoanions to the corresponding neutral species (Figure 3.8 for 21– and 21). In the case
of (TBA+)(20–) and (TBA+)(21–), an increase in the fluorescence intensity (If), linearly
correlated to the increase in the NIR absorption, was observed during the titrations, with
the Φ values roughly doubling on passing from 20–/21– to 20/21 [If(neutral
species)/If(monoanion) = 1.92 and 1.90, corresponding to the emission maxima 𝜆𝑒𝑚𝑚𝑎𝑥
that fall at 390 and 424 nm for 20– and 21–, respectively, Table 3.10].
More promising are the emission spectra of 22, since on oxidation of (TBA+)(22–) an
increase in the emission at 473 nm and a decrease in the region around 410 nm were
observed (Table 3.10, Figure 3.11), thus resulting in a variation of the Stokes shift on
passing from the monoanion to the neutral species.
Figure 3.11. Normalised corrected emission spectra (λexc = 343 nm) recorded during the titration of
(TBA+)(22–) with I2 in CH2Cl2.
Thus, since spectroscopic and electrochemical measurements agree in the indication that
no decomposition leading to fluorescent byproducts occurs upon oxidation of the
Page 98
Results and Discussion
84
monoanionic complexes, in the case of (TBA+)(22–) the energy of the maximum in the
emission spectrum is controlled by the applied redox potential.
3.1.6. DFT calculations
Theoretical calculations represent an imparallelable tool for the inspection of electronic
features and the interpretation of physical-chemical properties of inorganic systems.
For this reason, with the aim of getting an insight into the structural, spectroscopic, and
electrochemical features of the title complexes, quantum chemical calculations have
been carried out at the density functional theory (DFT)195 level. Following the results of
previous studies, in which various functionals and basis sets were compared for 1,2-
dithiolene196 and different gold complexes,197 Barone’s and Adamo’s mPW1PW
functional198 was adopted. For light atomic species (H, C, and S) the all-electron
double-ζ basis sets (BSs) with polarisation functions from Schäfer, Horn, and
Ahlrichs199 were exploited, whereas for gold the LanL2DZ (d,p) BS with effective core
potentials200
To give an interpretation of the different features shown by complexes 20x–-22x– in their
different oxidation states, theoretical analysis has been performed on the former
complexes considering different molecular charges x ranging between -2 and 0. Since,
as previously pointed out, crystallographic reports on different [Au(R,Rʹ-edt)2]x–
complexes show these systems can exhibit cis/trans isomerism, both conformations
were optimised for the nine model complexes considered.
was preferred so as to account for relativistic effects.
Page 99
Results and Discussion
85
3.1.6.1. Geometry optimisation
The optimised cis and trans isomers of complexes 20x–-22x– (x = 0-2) were found to
show negligible differences in their total electronic energies (less than 0.2 kcal mol–1,
Table 3.12), in agreement with what has been recently reported.193c
Table 3.12. Energy difference ∆E (kcal mol–1) between cis/trans isomers of 20x–-22x– calculated at their
optimised geometries.
x –2 –1 0
20 1.67·10–1 2.87·10–2 7.01·10–2
21 8.72·10–2 1.04·10–2 1.19·10–1
22 0.59·10–4 1.36·10–1 4.70·10–5
As an example, the optimised structure of the cis isomer of 22 is depicted in Figure
3.12.
Figure 3.12. Molecular drawing and atom labelling scheme for the cis isomer of 22 at the optimised
geometry (C2 point group).
Selected optimised bond lengths and angles for the eighteen model compounds are
listed in Table 3.13.
Page 100
Results and Discussion
86
Table 3.13. Selected optim
ised bond lengths (Å) and angles (°) for the cis and trans isomers of 20
x–-22x– (x =
0-2). a
a Num
bering scheme as in Figure 3.12.
Page 101
Results and Discussion
87
A comparison of optimised parameters (Table 3.13) with the corresponding structural
data of the cis isomers of 20– and 21–,18b discussed above (Table 3.4), shows a very good
agreement between the two sets of data, only the Au-S distances being slightly
overestimated (by less than 0.08 Å, Table 3.14).
Table 3.14. Comparison between optimised and experimental bond lengths (Å) and angles (°) for the cis
isomers of 20– and 21–.
Calculated Experimentala
20– 21– 20– b 21– c
C1-C2 1.352 1.350 1.336 1.342
S1-Au 2.379 2.379 2.314 2.317
S2-Au 2.375 2.374 2.313 2.309
C1-S1 1.737 1.734 1.737 1.734
C2-S2 1.771 1.771 1.777 1.770
S1-Au-S2 88.71 88.66 89.66 89.96
S1-C1-C2 126.46 126.58 126.2 126.60
S2-C2-C1 121.97 121.72 120.3 120.25
Au-S1-C1 100.94 100.99 101.15 100.75
Au-S2-C2 101.90 102.03 102.32 102.45
C1-C2-C3-C4 30.12 25.01 24.01 26.10
a Numbering scheme as in Figure 3.12. b Ref.18b. c Average values (Table 3.4).
Given this very good agreement between the parameters optimised for the cis isomers of
20– and 21– and the corresponding structural data, the optimised data obtained for 22–
can be considered good estimates of the structural parameters as well.
Page 102
Results and Discussion
88
Moreover, the average C-C, C-S, and Au-S bond lengths optimised for 22x– are very
close to the corresponding mean values found for the bis(1,2-dithiolene) gold
complexes found on the Cambridge Crystallographic Database (Table 3.15).
Table 3.15. Selected experimental and optimised structural bond distances (Å) of bis(1,2-dithiolene) gold
complexes.
Complex C-C C-S Au-S
[AuIII(R,Rʹ-edt)2] a 1.366(8) 1.736(5) 2.300(4)
[AuIII(R,Rʹ-edt)2]– b 1.361(4) 1.745(2) 2.310(2)
[AuII(R,Rʹ-edt)2]2– c 1.374(4) 1.731(3) 2.425(7)
22 d 1.365 1.728 2.362
22– d 1.350 1.756 2.379
222– d 1.377 1.738 2.500
a Mean value calculated on 9 crystal structures deposited at CCDC. b Mean value calculated on 82 crystal structures deposited at CCDC. c Taken from ref. 201
for L = mnt2–. d Mean values of the optimised parameters calculated for the cis and trans isomers (Table 3.13).
It is worth noting that, for each oxidation state, both the isomerism of the complexes
and the nature of the substituent at the carbon atom of the ethylene-1,2-dithiolate do not
induce significant modifications in the optimised bond lengths and angles.
An examination of the calculated structural parameters for the different oxidation states
of 20-22 can give an insight on the electronic structure of these complexes, and in
particular on the form assumed by the 1,2-dithiolene ligands (ene-1,2-dithiolate, –S-
C=C-S–, or 1,2-dithioketone, S=C-C=S). The C-S and C-C bond lengths calculated for
Page 103
Results and Discussion
89
20–-22– (Table 3.14) suggest that monoanionic gold bis(1,2-dithiolene) complexes
should be formally considered as AuIII complexes of ene-1,2-dithiolato ligands, which,
as a consequence, would behave as innocent ligands, in agreement with structural data.
This is further supported by the very close values of the C-C distances found in
monoanionic [Au(R,Rʹ-edt)2]– complexes and in the corresponding 1,3-dithiol-2-ones,
as discussed in Section 3.1.2 for 26 and 21–. On the other hand, as expected, neutral
complexes feature C-C and C-S optimised distances that are systematically longer and
shorter, respectively, than those of the corresponding monoanions. This testifies that the
ligands feature a more pronounced 1,2-dithioketone character in the neutral species than
do the monoanions. These data support the hypothesis that oxidation of the monoanions
should be ligand centered (Equation 3.1), without affecting the formal oxidation state of
the central metal ion.
Concerning the features of the complexes in their oxidation state –2, the trends observed
in the calculated C-S and C-C distances for 202–-222– have been found to be in perfect
agreement with the experimental ones determined for the only authentic dianionic
bis(1,2-dithiolene) gold complex reported to date, (TBA+)2(152–),201 and suggest that
reduction of monoanionic to dianionic forms of gold bis(1,2-dithiolenes) should not be
considered simply as metal centered (Equation 3.1), but should significantly involve the
ligands as well. Indeed, notwithstanding the authors’ claims, the reported values
calculated for [Au(Ph2-edt)2]x– (33x–, x = 0, 1, 2) reflect exactly the same trend (C-C =
1.383, 1.359, and 1.362 Å; C-S = 1.756, 1.788, and 1.780 Å; Au-S = 2.360, 2.362, and
2.410 Å, for x = 0, 1, and 2, respectively).75a This is in agreement with the conclusions
drawn by Schlupp and Maki, who, on the grounds of electron paramagnetic resonance
(EPR) measurements, considered (TBA+)2(152–) as better described as a AuIII complex
featuring a radical anion ligand,202
75
and subsequently by Kokatam et al. in the case of
332–, a which was considered as an intermediate AuII/AuIII complex.
Page 104
Results and Discussion
90
It is interesting to note that the torsion angle θ of the aryl substituent (C1-C2-C3-C4
dihedral angle in Figure 3.12) is also affected by the overall charge of the complexes,
with the neutral species featuring θ values larger by 6-9° with respect to the
corresponding monoanionic ones, which in turn feature torsion values larger by 6-16°
with respect to dianionic species (Table 3.13). To further investigate this feature, a scan
of the potential-energy surface (PES) was performed on 20x– (x = 0, 1) both in its neutral
and monoanionic form (Figure 3.13), by calculating the variations ∆E in the total
electronic energy of the complex optimised at various frozen θ values (-90 < θ < 90°).
Figure 3.13. Relative total electronic energy variation (ΔE) calculated as a function of the phenyl
rotation (θ) for the cis and trans isomers of 20– (squares and circles, respectively) and 20 (filled squares
and circles, respectively).
Page 105
Results and Discussion
91
This analysis shows that values of about 35 and 30° for neutral and monoanionic
species, respectively, represent absolute energy minima, the rotational barrier being in
any case small (about 3.5 kcal mol–1).203
3.1.6.2. Ground state (GS)
The description of the ground-state (GS) bonding scheme of 20-22 (2A and 2B for cis
and trans isomers, respectively) based on DFT calculations is in agreement with the
results of previous calculations carried out on 33.75a
Figure 3.14. KS-MO scheme and isosurface drawings calculated for 21 (cis isomer) at DFT mPW1PW
level (C2 point group). Contour value = 0.05 e.
Page 106
Results and Discussion
92
The examined complexes exhibit very similar Kohn–Sham molecular orbital (KS-MO)
compositions, and it is remarkable that the order and the composition of KS-MOs does
not significantly depend on the nature of the isomers. The frontier KS-MO scheme
calculated for 21 in its cis form is depicted in Figure 3.14, and a correlation diagram
showing the variation of the KS eigenvalues calculated for the frontier orbitals of the cis
and trans isomers of 22, 22– and 222– is shown in Figure 3.15.
Figure 3.15. Correlation diagram between the KS eigenvalues of selected MOs calculated for 22, 22–,
and 222– (cis and trans isomers) in their ground states. Symmetry labels are referred to the C2 point
group.
22 22- 222-
Page 107
Results and Discussion
93
In addition, for each MO, the contributions from the central gold species, the C2S2
moiety, and the H and aryl substituents at the 1,2-dithiolene system have been
calculated (Figures 3.16 and 3.17 for the cis isomers of 21 and 22, respectively).
Figure 3.16. Frontier molecular orbital (KS-MOs 117-130; SOMO = 122, LUMO = 123) composition
calculated for 21 [cis isomer; fragments: gold atom (yellow), 2-naphthyl (red) and hydrogen (blue)
substituents, ethylene-1,2-dithiolato (green)].
130
129
128
127
126
125
124
123
122
121
120
119
118
117
0% 20% 40% 60% 80% 100%
ALPHA
Orbital Composition %
Orbi
tal N
umbe
r
130
129
128
127
126
125
124
123
122
121
120
119
118
117
0% 20% 40% 60% 80% 100%
BETA
Orbital Composition %
Orbi
tal N
umbe
r
Orbital composition % Orbital composition %
Orb
ital n
umbe
r
Orb
ital n
umbe
r
ALPHA BETA
Page 108
Results and Discussion
94
Figure 3.17. Frontier molecular orbital (KS-MOs 151-165; SOMO = 159, LUMO = 160) composition
calculated for 22 [cis isomer; fragments: gold atom (yellow), 1-pyrenyl (red) and hydrogen (blue)
substituents, ethylene-1,2-dithiolato (green)].
The energy separation between gold 5d orbitals and the π system of the ligands prevents
the superexchange interaction reported for analogous bis(1,2-dithiolene) complexes of
group 10 metals.190b As a consequence, in 20-22 the singly occupied molecular orbital
(SOMO; orbitals 122 and 159 for 20 and 22, respectively) is a π MO predominantly
localised on the ethylene-1,2-dithiolato moiety (57-82%) with only minor participation
of Au d character (2-3%; Figures 3.16 and 3.17). The LUMO (orbital 123 in Figure 3.14
for 21) is an antibonding MO built up by the combination of the in-plane sulphur 2p
atomic orbitals (74%) with the 5d atomic orbital (22%) of the metal species. The one-
electron reduction, which leads to the corresponding monoanions (GS 1A in the C2 point
group), corresponds to the introduction of a β electron in the SOMO. Notably, the small
5
4
3
2
0
9
8
7
6
5
4
3
2
Orb
ital
num
ber
ALPHA BETA165
164
163
162
161
160
159
158
157
156
155
154
153
152
151
165
164
163
162
161
160
159
158
157
156
155
154
153
152
151
0% 20% 40% 60% 80% 100% 0% 20% 40% 60% 80% 100%
5
4
3
2
0
9
8
7
6
5
4
3
2
Orb
ital
num
ber
ALPHA BETA165
164
163
162
161
160
159
158
157
156
155
154
153
152
151
165
164
163
162
161
160
159
158
157
156
155
154
153
152
151
0% 20% 40% 60% 80% 100% 0% 20% 40% 60% 80% 100%
ALPHA BETA
Orbital composition % Orbital composition %
Orb
ital n
umbe
r
Orb
ital n
umbe
r
Page 109
Results and Discussion
95
contribution of gold atomic orbitals to this MO is responsible for the very moderate
change in the Au-S distances observed on passing from 20-22 to 20–-22–. This further
confirms that the gold electron population is not remarkably altered with respect to the
corresponding neutral species. On the contrary, since this MO is bonding with respect to
the C-C bond and antibonding with respect to the C-S ones, the corresponding bond
lengths undergo the remarkable structural variations discussed above.
Figure 3.15 shows that, on passing from monoanionic to dianionic species, the
eigenvalues of the frontier MOs are progressively raised, and the mixing between the
gold AOs and the ligand orbitals is increased in the dianion. This can be rationalised by
considering that the progressively added charges stabilise the combinations of
molecular orbitals on the ligands that are symmetry-allowed to interact with the gold 5d
AOs, which results in a progressive lowering of the energy gap between the two groups
of interacting orbitals. This gives rise to an increased overlap, which is reflected in the
destabilisation of their antibonding combinations, represented by the frontier KS-MOs
discussed above, and an increased participation of the gold AOs. Considering for
example the case of 22, on passing from the neutral species to the dianion, the
contribution of the metal species to the singly occupied KS-MO 161 (α-SOMO for 222–)
is remarkably increased (22%), which leads to a lengthening of the Au-S bonds
calculated for this species. This is in agreement with the structural data for dianionic
bis(1,2-dithiolene) gold complexes (Table 3.14). The mixing of the gold 5d AOs with
the MOs mostly localised on the dithiolene ligand justifies the uncertainty, discussed
above, about the oxidation state of gold in dianionic complexes, and this suggests that
the innocent/noninnocent behavior of 1,2-dithiolene ligands depends not only on the
nature of the central metal ion, but also on the charge of the resulting complexes.
Page 110
Results and Discussion
96
3.1.6.3. Mulliken charges
In Table 3.16, the results from a Mulliken population analysis are summarised for 20x–-
22x– (x = 0-2) in their cis and trans conformations.
Table 3.16. Mulliken charges Q (e) calculated on Au, C1, S1, the hydrogen atom H bonded to C1, the
substituents Ar, and each ligand L for the cis and trans isomers of complexes 20x–, 21x– and 22x– [L =
Ar,H-edt2–; Ar = phenyl (20), 2-naphthyl (21), 1-pyrenyl (22); x = 0, 1, 2].a
Isomer Q(Au) Q(S1) Q(S2) Q(C1) Q(C2) Q(H) Q(Ar) Q(L) ΔQ(L)b ΔQ(Au)b
20 cis -0.163 0.008 0.007 -0.052 -0.029 0.080 0.068 0.082 - -
trans -0.162 0.008 0.005 -0.051 -0.029 0.080 0.068 0.081 - -
20– cis -0.222 -0.109 -0.110 -0.089 -0.016 0.035 -0.100 -0.389 -0.471 -0.059
trans -0.221 -0.107 -0.113 -0.088 -0.017 0.035 -0.100 -0.390 -0.471 -0.059
202– cis -0.304 -0.210 -0.220 -0.116 -0.021 -0.001 -0.280 -0.848 -0.459 -0.082
trans -0.304 -0.204 -0.225 -0.115 -0.022 0.000 -0.282 -0.848 -0.458 -0.083
21 cis -0.161 0.007 0.002 -0.056 -0.023 0.080 0.071 0.081 - -
trans -0.161 0.007 0.002 -0.055 -0.025 0.080 0.072 0.081 - -
21– cis -0.210 -0.102 -0.109 -0.094 -0.006 0.039 -0.123 -0.395 -0.476 -0.049
trans -0.207 -0.113 -0.098 -0.094 -0.005 0.039 -0.126 -0.397 -0.477 -0.046
212– cis -0.286 -0.190 -0.205 -0.117 -0.010 0.008 -0.327 -0.857 -0.462 -0.076
trans -0.286 -0.182 -0.212 -0.116 -0.012 0.009 -0.326 -0.857 -0.460 -0.079
22 cis -0.197 0.008 0.035 -0.012 -0.128 0.079 0.116 0.098 - -
trans -0.199 0.011 0.036 -0.007 -0.135 -0.027 0.116 0.099 - -
22– cis -0.244 -1.104 -0.087 -0.0503 -0.106 0.037 -0.065 -0.378 -0.476 0.047
trans -0.243 -0.100 -0.090 -0.054 -0.103 0.038 -0.069 -0.378 -0.476 0.046
222– cis -0.289 -0.176 -0.180 -0.086 -0.083 0.016 -0.345 -0.855 -0.477 0.045
trans -0.286 -0.166 -0.188 -0.087 -0.080 0.018 -0.354 -0.857 -0.479 0.043
a Numbering scheme as in Figure 3.12. b Charge variation calculated on passing from the neutral species to
the corresponding monoanions, and from the monoanions to the dianionic forms.
Page 111
Results and Discussion
97
The charge on the central gold atom is scarcely affected by the nature of the substituents
and by the conformation of the complex. As expected on the basis of the KS-MO
analysis, the charge on the central Au ion does not undergo a large variation on passing
from the neutral to the monoanionic species (about 0.05 e); the charge variation is
instead assumed by the ligands (about 0.47 e for each ligand), thereby further
confirming that the electron-transfer processes are largely ligand-based for this class of
compounds.
Notably, calculated Mulliken charges indicate that the increased charges on passing
from neutral to dianionic species are progressively distributed over the ligands.
3.1.6.4. Time dependent DFT (TD-DFT) calculations
With the aim of better understanding the spectroscopic absorption and emission
properties of the title compounds, time-dependent DFT (TD-DFT) calculations were
carried out on the cis and trans isomers of 21x– and 22x– (x = 0, 1)204
at the optimised
geometries (C2 point group) in their GSs [singlet 1A (S0) and doublet 2A (D0) for x = 1
and 0, respectively]. TD-DFT calculations were carried out at the same theoretical level
discussed previously.
Page 112
Results and Discussion
98
Table 3.17. Principal computed electronic transitions (f > 0.05) calculated for the cis and trans isomers
of 21. For each transition, the excitation energy E (eV), the oscillator strength f and molecular orbital
composition of the excited-state functions, along with with the fragments where the involved KS-MO are
mainly localised, are reported.
Exc. State E f Spin Compositiona % Molecular Fragmentsb
21 cis D1 0.792 0.135 β 121 → 122 88 edt (70%) → edt (87%)
D14 2.587 0.110 α 120 → 123 56 naph (89%) → edt (74%)
D31 3.610 0.169 α 122 → 124 36 edt (82%) → naph (80%)
β 121 → 125 54 edt (70%) → naph (86%)
D44 4.107 0.253 α 121 → 125 23 naph (49%) +edt (47%) → naph (81%)
β 121 → l27 27 edt (70%) → naph (81%)
D51 4.312 0.164 α 120 → 125 11 naph (89%) → naph (81%)
β 119 → 124 17 naph (86%) → naph (86%)
β 120 → 125 16 naph (91%) → naph (86%)
D52 4.331 0.616 α 116 → 123 22 edt (87%) → edt (74%)
β 114 → 123 22 edt (79%) → edt (74%)
β 108 → 122 15 naph (76%) → edt (87%)
21 trans D1 0.794 0.145 β 121 → 122 88 edt (71%) → edt (87%)
D13 2.539 0.084 α 120 → 123 58 naph (88%) → edt (74%)
β 120 → 123 22 naph (90%) → edt (74%)
D18 2.739 0.110 α 116 → 123 12 edt (89%) → edt (74%)
β 117 → 122 45 naph (71%) → edt (87%)
D30 3.571 0.278 α 122 → 125 32 edt (81%) → naph (81%)
β 121 → 125 48 edt (71%) → naph (85%)
D48 4.218 0.170 α 118 → 125 8 naph (81%) → naph (81%)
β 118 → 124 9 naph (73%) → naph (87%)
D50 4.244 0.805 β 114 → 123 16 edt (81%) → edt (74%) a The molecular orbitals are labelled according to Figure 3.16. b edt = ethylene-1,2-dithiolato; naph = 2-
naphthyl substituent at the edt core.
Page 113
Results and Discussion
99
Table 3.18. Principal computed singlet-singlet electronic transitions (f > 0.05) calculated for the cis and
trans isomers of 21–. For each transition, the excitation energy E (eV), the oscillator strength f and
composition of the excited-state functions, along with the fragments where the involved KS-MO are
mainly localised, are reported.
Exc. State E f Compositiona % Molecular Fragmentsb
21– cis S3 2.487 0.154 122 → 124 93 edt (87%) → naph (93%)
S4 2.525 0.057 122 → 125 92 edt (87%) → naph (93%)
S7 3.053 0.090 122 → 127 87 edt (87%) → naph (84%)
S9 3.264 0.067 121 → 124 87 edt (77%) → naph (93%)
S10 3.272 0.153 121 → 125 88 edt (77%) → naph (93%)
S12 3.812 0.371 118 → 123 13 edt (89%) → edt (73%)
121 → 126 66 edt (77%) → naph (86%)
S15 4.082 0.069 120 → 125 49 edt (64%) → naph (93%)
119 → 124 33 naph (57%) → naph (93%)
S17 4.125 0.143 115 → 123 36 edt (80%) → edt (73%)
S18 4.200 0.409 116 → 123 32 naph (52%) + edt (47%) → edt (73%)
118 → 123 28 edt (89%) → edt (73%)
122 → 134 10 edt (87%) → Au (84%)
21– trans S3 2.491 0.249 122 → 124 93 edt (87%) → naph (93%)
S6 3.042 0.121 122 → 127 88 edt (87%) → naph (85%)
S9 3.267 0.204 121 → 124 89 edt (77%) → naph (93%)
S12 3.789 0.399 118 → 123 24 edt (71%) → edt (74%)
121 → 126 50 edt (77%) → naph (85%)
S15 4.052 0.095 120 → 124 69 naph (40%) + edt (54%) → naph (93%)
S16 4.073 0.382 115 → 123 31 edt (83%) → edt (74%)
117 → 123 22 naph (44%)+edt (52%) → edt (74%)
118 → 123 11 edt (71%) → edt (74%)
S18 4.246 0.335 115 → 123 31 edt (83%) → edt (74%)
117 → 123 22 naph (44%) + edt (52%) → edt (74%)
118 → 123 11 edt (71%) → edt (74%)
122 → 129 15 edt (87%) → naph (93%) a The molecular orbitals are labelled according to Figure 3.16. b edt = ethylene-1,2-dithiolato; naph = 2-
naphthyl substituent at the edt core.
Page 114
Results and Discussion
100
In Tables 3.17 and 3.18, the main vertical electronic transitions calculated for the
neutral and monoanionic forms, respectively, of 20 are summarised along with the most
relevant MO contributions to each one-electron excitation. The same data are listed in
Tables 3.19 and 3.20 for 22 and 22–.
Table 3.19. Principal computed electronic transitions (f > 0.05) calculated for the cis and trans isomers
of 22. The vertical excitation energies E (eV), the oscillator strengths f and molecular orbital
compositions of the excited-state functions, along with the description of the fragments where the
involved KS-MO are mainly localised, are reported.
Excited State E f Spin Compositiona % Molecular fragmentsb
22 cis D1 0.826 0.121 β 159 → 160 85 Pyr (44%) + edt (51%) → edt (92%)
D12 2.072 0.058 β 158 → 161 76 Pyr (96%) → edt (73%)
D33 3.284 0.051 β 147 → 160 45 Pyr (36%) + edt (55%) → edt (92%)
β 149 → 160 46 Pyr (67%) → edt (92%)
D34 3.310 0.118 β 159 → 162 50 Pyr (44%) + edt (51%) → Pyr (95%)
α 160 → 163 29 Pyr (38%) +edt (60%) → Pyr (94%)
D42 3.617 0.978 α 159 → 162 44 Pyr (93%) → Pyr (94%)
D48 3.684 0.189 β 158 → 162 42 Pyr (96%) → Pyr (95%)
D49 3.693 0.122 β 153 → 161 42 Pyr (95%) → edt (73%)
D50 3.708 0.082 β 153 → 161 32 Pyr (95%) → edt (73%)
β 158 → 163 14 Pyr (96%) → Pyr (95%)
D66 4.097 0.231 α 152 → 161 36 Pyr (52%) + edt (45%) → edt (73%)
β 150 → 161 21 Pyr (41%) + edt (55%) → edt (73%)
D76 4.331 0.148 α 158 → 165 10 Pyr (63%) + edt (35%) → Pyr (99%)
α 160 → 165 30 Pyr (38%) +edt (60%) → Pyr (99%)
β 159 → 164 32 Pyr (44%) + edt (51%) → Pyr (99%)
D78 4.400 0.516 α 149 → 161 10 Pyr (30%) + edt (68%) → edt (73%)
β 135 → 160 12 Pyr (34%) + edt (63%) → edt (92%)
β 148 → 161 20 Pyr (59%) + edt (39%) → edt (73%)
α 147 → 161 9 Pyr (33%) + edt (67%) → edt (73%)
22 trans D1 0.845 0.119 β 159 → 160 83 Pyr (40%) + edt (54%) → edt (93%)
D9 2.015 0.084 α 158 → 161 40 Pyr (60%) + edt (38%) → edt (73%)
α 160 → 161 17 Pyr (41%) + edt (57%) → edt (73%)
Page 115
Results and Discussion
101
Excited State E f Spin Compositiona % Molecular fragmentsb
β 155 → 160 13 Pyr (98%) → edt (93%)
D11 2.064 0.063 β 158 → 161 67 Pyr (96%) → edt (73%)
D34 3.347 0.089 α 160 → 162 24 Pyr (41%) + edt (57%) → Pyr (94%)
β 159 → 162 58 Pyr (40%) + edt (54%) → Pyr (96%)
D41 3.614 0.156 α 154 → 161 54 Pyr (96%) → edt (73%)
D43 3.634 0.317 α 155 → 163 9 Pyr (99%) → Pyr (95%)
α 156 → 162 9 Pyr (99%) → Pyr (96%)
α 158 → 162 9 Pyr (60%) + edt (38%) → Pyr (96%)
β 155 → 162 8 Pyr (98%) → Pyr (96%)
β 156 → 163 8 Pyr (97%) → Pyr (94%)
β 158 → 163 8 Pyr (96%) → Pyr (94%)
D49 3.705 0.057 α 160 → 163 11 Pyr (41%) + edt (57%)→ Pyr (95%)
β 153 → 161 22 Pyr (94%) → edt (73%)
β 158 → 162 16 Pyr (96%) → Pyr (92%)
D51 3.714 0.123 β 153 → 161 40 Pyr (94%) → edt (73%)
β 158 → 162 20 Pyr (96%) → Pyr (92%)
D64 4.032 0.172 α 152 → 161 35 Pyr (57%) + edt (40%) → edt (73%)
β 150 → 161 23 edt (91%) → edt (73%)
D69 4.180 0.083 β 138 → 160 20 Pyr (35%) + edt (59%) → edt (97%)
β 142 → 160 22 Pyr (50%) + edt (31%) → edt (97%)
β 144 → 160 17 Pyr (50%) + edt (31%) → edt (97%)
D76 4.326 0.139 β 157 → 161 17 Pyr (60%) + edt (35%) → edt (73%)
β 159 → 164 59 Pyr (40%) + edt (54%) → Pyr (99%)
D78 4.399 0.467 α 149 → 161 11 edt (75%) → edt (73%)
β 135 → 160 15 Pyr (30%) + edt (67%) → edt (93%)
β 140 → 160 11 Pyr (84%) → edt (93%)
β 148 → 161 11 edt (74%) → edt (73%) a The molecular orbitals are labeled according to Figure 3.17. b edt = ethylene-1,2-dithiolato; Pyr = pyrenyl substituent at the edt core.
Page 116
Results and Discussion
102
Table 3.20. Principal computed electronic transitions (f > 0.05) calculated for the cis and trans isomers
of 22–. The vertical excitation energies E (eV), the oscillator strengths f and molecular orbital
compositions of the excited-state functions, along with the description of the fragments where the
involved KS-MO are mainly localised, are reported.
Excited State E f Compositiona % Molecular Fragmentsb
22– cis S3 1.868 0.052 160 → 163 80 edt (91%) → Pyr (75%)
S5 2.6703 0.059 159 → 162 94 edt (81%) → Pyr (96%)
S10 3.127 0.064 158 → 161 62 Pyr (87%) → Pyr (27%) + edt (56%)
S12 3.310 0.065 160 → 167 95 edt (91%) → Pyr (97%)
S14 3.480 0.444 155 → 161 23 edt (88%)→ Pyr (27%) + edt (56%)
157 → 162 14 Pyr (72%) → Pyr (96%)
158 → 161 24 Pyr (87%)→ Pyr (27%) + edt (56%)
S15 3.510 0.171 154 → 161 13 Pyr (84%)→ Pyr (27%) + edt (56%)
157 → 162 36 Pyr (72%)→ Pyr (96%)
158 → 163 15 Pyr (87%)→ Pyr (75%)
S16 3.553 0.134 157 → 163 21 Pyr (72%)→ Pyr (75%)
158 → 162 15 Pyr (87%)→ Pyr (96%)
159 → 165 33 edt (81%) → Pyr (97%)
S18 3.594 0.129 159 → 165 54 edt (81%)→ Pyr (97%)
S28 4.041 0.097 154 → 161 23 Pyr (84%)→ Pyr (27%) + edt (56%)
155 → 161 33 edt (88%)→ Pyr (27%) + edt (56%)
155 → 163 22 edt (88%)→ Pyr (75%)
S30 4.136 0.257 155 → 163 32 edt (88%)→ Pyr (75%)
159 → 166 34 edt (81%) → Pyr (99%)
S32 4.166 0.133 159 → 166 49 edt (81%)→ Pyr (97%)
S34 4.354 0.053 151 → 161 39 Pyr (91%)→ Pyr (27%) + edt (56%)
153 → 162 23 edt (78%)→ Pyr (96%)
22– trans S2 1.855 0.082 160 → 163 78 edt (90%) → Pyr (72%)
S5 2.681 0.083 159 → 162 94 edt (80%) → Pyr (96%)
S11 3.363 0.064 160 → 167 95 edt (90%) → Pyr (98%)
S13 3.383 0.382 156 → 161 34 edt (74%) → Pyr (29%) + edt (54%)
158 → 161 49 Pyr (79%) → Pyr (29%) + edt (54%)
S14 3.502 0.427 158 → 163 53 Pyr (79%)→ Pyr (72%)
S16 3.556 0.125 155 → 161 14 edt (81%) → Pyr (29%) + edt (54%)
157 → 161 18 Pyr (82%) → Pyr (29%) + edt (54%)
158 → 162 36 Pyr (79%) → Pyr (96%)
Page 117
Results and Discussion
103
Excited State E f Compositiona % Molecular Fragmentsb
S17 3.557 0.074 159 → 164 85 edt (80%) → Pyr (99%)
S19 3.718 0.060 157 → 162 71 Pyr (82%) → Pyr (96%)
S27 4.025 0.089 153 → 161 37 edt (77%) → Pyr (29%) + edt (54%)
160 → 168 25 edt (90%) → Pyr (89%)
S28 4.049 0.228 154 → 161 57 edt (87%) → Pyr (29%) + edt (54%)
S30 4.139 0.101 159 → 166 60 edt (80%) → Pyr (99%)
S32 4.194 0.239 154 → 163 45 edt (87%) → Pyr (72%)
S37 4.363 0.058 153 → 163 72 edt (77%) → Pyr (72%) a The molecular orbitals are labeled according to Figure 3.17. b edt = ethylene-1,2-dithiolato; Pyr = pyrenyl substituent at the edt core.
These contributions allow to classify each excitation depending on the nature of the
involved KS-MOs, as mainly localised on the aromatic substituents, on the C2S2 core
(edt), or as consisting of an interligand charge-transfer (ILCT) process between the two
moieties of the ligand. In the case of the closed-shell species 20 and 22, in addition to
singlet–singlet one-electron excitations, triplet–triplet excitations have been calculated.
TD-DFT calculations have been exploited to simulate the UV-Vis-NIR absorption
spectra for the eight model complexes (Figure 3.18 for 21 and 21–). An inspection of the
absorption spectra (250–2000 nm) simulated for the cis and trans isomers of both
complexes clearly shows that the spectroscopic features depend on the global charge of
the complex, as shown by experimental UV-Vis-NIR spectroscopy, but are only very
marginally affected by cis/trans isomerism.
Page 118
Results and Discussion
104
Figure 3.18. Simulated UV-Vis-NIR spectra (250-2000 nm) based on TD-DFT calculations (Tables 3.17
and 3.18) calculated for the cis and trans isomers of 21 [(a) and (b), respectively] and 21– [(c) and (d),
respectively].
A comparison of the simulated spectra with those recorded during the diiodine titration
of (TBA+)(21–-22–) (Figure 3.8 for 21–) evidences that, although transition energies are
slightly underestimated, a very good agreement between experimental and simulated
spectra holds. In particular, the D0→D1 vertical transition, responsible for the intense (f
= 0.135 and 0.121 for 21 and 22, respectively) NIR absorption in neutral species, should
be attributed to an almost pure (85-88%) one-β-electron excitation involving the frontier
molecular orbitals. In particular, KS-MOs 121 and 122, mainly localised on the
Page 119
Results and Discussion
105
ethylene-1,2-dithiolato moiety, are involved in the case of 21 (Figure 3.16), while for 22
the transition occurs from KS-MO 159, which is mainly localised on the pyrenyl
substituents, to 160 (Figure 3.17), which is mainly localised on the ethylene-1,2-
dithiolato moiety.
For both monoanionic and neutral species of 21, the electron absorptions in the visible
region (bands in the range 350–440 nm) can be assigned to the intense transitions
S0→S3 and D0→D13/D14 (cis/trans isomers, respectively) respectively, thereby
resulting in a π-electron transfer process from the ethylene-1,2-dithiolate to the naphthyl
substituents for the neutral species (corresponding to the 122→124 one-electron
excitation) and vice versa for the monoanionic form (120→123, corresponding to a α-
electron SOMO-2→LUMO excitation), falling at very similar energies. A second group
of bands (S0→S9–S12/S6–S9 for the cis/trans isomers of 21–; transitions D0→
D31/D30 for the cis/trans isomers of 21) are calculated at higher energies (in the range
3.0–3.3 eV for 21 and 3.5–4.3 eV for 21–). These absorptions also involve electron
excitations from filled KS–MOs localised on the ethylene-1,2-dithiolate and empty KS-
MOs localised on the naphthyl substituents. Therefore, excitation at 360 nm, which
results in the emission processes described above for both 21 and 21–, should mainly
involve transitions that have the same character of photoinduced electron-transfer
processes edt→naphthyl. Only at higher energies can π–π* electron transitions
involving KS-MOs exclusively localised on the edt moiety or the aryl substituents be
found [21–: S0→S18 (4.200 eV, f = 0.409), S0→S30, not included in Table 3.18 (4.758
eV, f = 0.435); 21, cis isomer: D0→D51 (4.312 eV, f = 0.164), D0→D52 (4.331 eV, f =
0.616); 21, trans isomer: D0→D48 (4.218 eV, f = 0.170), D0→D50 (4.244 eV, f =
0.805)].
Concerning 22, the series of relatively minor absorptions calculated in the visible region
(2.1–3.3 eV) for both 22 and 22– feature in the majority of cases a significant charge-
Page 120
Results and Discussion
106
transfer character from the pyrenyl substituents to the edt core or vice versa (Tables
3.19 and 3.20), as observed for 21. On the other hand, the very intense absorptions
calculated at about 3.5 eV for both neutral and monoanionic species involve exclusively
the π system of the pyrenyl pendant (S0→S14 and D0→D42/43–44 for 22– and 22,
respectively), which corresponds to monoelectronic excitations from KS-MOs 155–158
and 156–159 to 161–163 and 162–163, respectively. Therefore, excitation at 343 nm,
which results in the emission processes described above, in the case of 22 and 22–
should mainly involve transitions localised on the pyrenyl fragment.
Figure 3.19. Jablonsky diagram (0.0-4.0 eV) calculated for the cis isomer of 21– at TD-DFT level (Table
3.18). The singlet transitions having oscillator strength values f < 0.05 are represented as dotted lines.
f = 0
.154
f = 0
.090
f = 0
.153
f = 0
.371
Page 121
Results and Discussion
107
Figure 3.20. Jablonsky diagram (0.0-4.0 eV) calculated for the cis isomer of 22– at TD-DFT level (Table
3.20). The singlet excited states with oscillator strength values f < 0.05 are represented as dotted lines.
As mentioned above, in the case of 21– and 22–, the pattern of triplet–triplet excitations
have been calculated as well for both cis and trans isomers (Figures 3.19 and 3.20, for
the cis isomers of 21– and 22–, respectively). A comparison of the energies of singlet
and triplet excited states (ESs), shows that the singlet ESs accessible from the GS with
the largest values of oscillator strengths (21–, cis isomer: S3, S7, S10, and S12; 21–,
trans isomer: S3, S6, S9, and S12; 22–, cis isomer: S3, S5, S10, S12, and S14; 22– trans
isomer: S2, S5, S11, and S13, Tables 3.18 and 3.20) feature triplet ESs very close in
energy, directly accessible through intersystem crossing (ISC) processes mediated by
Singlet states Triplet states
Ener
gy (E
v)
Page 122
Results and Discussion
108
spin–orbit coupling. Therefore, although monoanionic and neutral species feature very
similar excitation energies, only the ESs of the former species can feature ISC
relaxation paths, in agreement with the higher fluorescence quantum yields of the latter
species evidenced experimentally and discussed above. In particular, the lowest singlet
ES accessible from the GS S0 with a large oscillator strength (S3 for 20–, and S3 and S2
for cis and trans isomers of 22–, respectively) is close in energy to the triplet ESs T2
and T3 (∆ES3-T3 = 0.536 and 0.548 eV for the cis and trans isomers of 20–, respectively;
∆ES3-T3 = 0.108 eV and ∆ES2-T3 = 0.093 eV for cis and trans isomers of 22–,
respectively), which could therefore play a role in the ISC processes of both the isomers
of both complexes 21– and 22–. As far as radiative paths are instead involved, after an
internal conversion (IC) from the ESs accessible though UV excitation (21–, cis isomer:
S10–S12; 21, cis isomer: D31; 21–, trans isomer: S9–S12; 21, trans isomer: D30; 22–,
cis isomer: S14; 22, cis isomer: D42; 22–, trans isomer: S13–S14; 22, trans isomer:
D43–D44), relaxation processes responsible for fluorescence should occur from S3 and
D14/D13 (cis/trans isomers) for 21– and 21, and from S2/S3 (cis/trans isomers) and D6
for 22– and 22, respectively. With regard to 22, the vertical transition D0→D6 is
calculated to occur with an almost negligible oscillator strength (f = 0.003). It could be
tentatively hypotesised that both the geometry relaxation that occurred during IC
processes and the libration of the pyrenyl substituents in solution, which lowers the
symmetry of 22, might increase the probability of the transition D6→D0.
In the case of 21, the IC processes from D14 and D13 for the cis and trans isomers,
respectively, could be prevented by the large energy difference between the two
adjacent states D13 and D12, respectively (0.104 and 0.076 eV, respectively), thus
justifying the apparent violation of Kasha’s rule.205 The same conclusions can be made
for 22, where the IC processes from D6 (0.980 and 0.988 eV, for the cis and trans
isomers, respectively) could be prevented by the large energy difference between D6
Page 123
Results and Discussion
109
and the doublet state D5 lying immediately below in energy (∆ED6-D5 = 0.595 and 0.599
eV for the cis and trans isomers, respectively).
The very similar energies of the ESs S3 and D14/D13 for 20, and S3/S2 and D6 for 22
with respect to the GSs S0 and D0 could account for the very close emission energies
for both neutral and monoanionic species evidenced experimentally.
3.1.6.5. Calculation of static first hyperpolarisability (β)
As previously pointed out, the lack of an inversion center in the cis isomers of the title
complexes suggests a possible application as second-order nonlinear optical (SONLO)
materials. In this context, prompted by the results obtained by TD-DFT calculations, we
calculated static dipole moments (µ) and static first (quadratic) hyperpolarisabilities (β)
at the same level of theory described above.
In fact, as already mentioned, SONLO properties appear when the polarisability of a
chemical species exposed to an intense electromagnetic field, is not simply proportional
to the intensity of this field, so that it shows an additional second order polarisability
proportional to the square of the field intensity (Equation 3.2), commonly called first or
quadratic hyperpolarisability and indicated as β,206
(3.2)
which is nonzero just in
noncentrosymmetric systems.
From a mathematical point of view, β is a third order tensor, summarisable as in Figure
3.21.
∑+=ij
jij Eαµµ 0 ...++ ∑≤ ji
kjijk EEβ
Page 124
Results and Discussion
110
Figure 3.21. Matrix representation of the βijk components of the β tensor.
According to Kleinman’s symmetry rules207 (β𝑥𝑦𝑦 = β𝑦𝑥𝑦 = β𝑦𝑦𝑥 , β𝑦𝑦𝑧 = β𝑦𝑧𝑦 =
β𝑧𝑦𝑦 , …), some of the terms of the tensor are equivalent, so that the matrix is reduced
to just 10 terms. The total value of β (βtot) can be calculated from the 10 remaining
terms according to equation 3.3:208
222zyxtot ββββ ++= (3.3)
where ikkijjiiii ββββ ++= .
The static dipole moments (µ) and static first hyperpolarisabilities (βtot) were calculated
in the gas phase at the optimised geometries for the cis and trans isomers of 20x–-22x–
(Table 3.21) in their neutral and monoanionic forms (x = 0 and 1 , respectively), easily
obtained in CH2Cl2 (Sections 3.1.3 and 3.1.4).
Page 125
Results and Discussion
111
Table 3.21. Static dipole moment µ (D) and first hyperpolarisabilities βtot (a.u. and esu) calculated for
the cis and trans isomers of 20x–-22x– (x = 0, 1).
| µ | (D) βtot·103 (a.u.) βtot·10–30 (esu)
20 cis 1.68 24.45 212
trans 0.85 9.07 78
20– cis 4.37 9.68 84
trans 1.78 3.54 31
21 cis 0.61 13.19 114
trans 0.21 3.74 32
21– cis 0.94 9.66 83
trans 0.15 1.40 12
22 cis 0.94 3.21 28
trans 0.15 0.09 1
22– cis 1.16 2.94 25
trans 0.20 0.22 2
As expected, the trans isomers feature small βtot values, although they are not zero
because of the rotation of the aromatic substituents, which lower the molecular
symmetry form D2h to C2. The cis isomers feature significantly larger βtot values, in the
range 25–210·10–30 esu, which are comparable to those of various NLO-active gold
complexes.209 On passing from 20 to 22, the decrease in the extension of the aryl
substituents is computed to be reflected in a remarkable decrease in both µ and βtot
values. An examination of the static hyperpolarisability components βx, βy, and βz
shows that, for both the monoanionic and neutral species, βtot is determined by a single
individual static component, the direction of which is aligned with that of the dipole
Page 126
Results and Discussion
112
moment µ and is coincident with the C2 symmetry axis (which lies on or perpendicular
to the plane of the 1,2-dithiolene for cis and trans isomers, respectively). Note that, on
passing from the neutral species to the corresponding monoanions, the increased charge
is reflected in an increase in the |µ| values, whereas the first hyperpolarisabilities βtot
are decreased.
3.2. Synthesis and characterisation of heteroleptic 1,2-dichalcogenolene-
complexes
As already pointed out, two different kinds of mixed-ligand 1,2-dichalcogenolene
complexes have been obtained and fully characterised during the present research
project: [Pt(N^N)(E^E)] complexes (E = S, Se) and a [Au(C^N)(S^S)] complex. The
two kinds of systems will be treated separately in the two following sections.
3.2.1. Synthesis and characterisation of [Pt(N^N)(E^E)] complexes (53-73)
The 1,2-dithiolene ligands belonging to the classes Ar,H-edt2– and R-dmet2–/R-dset2–
were exploited for the synthesis of new diimine-dithiolate mixed-ligand complexes.
Platinum(II) diimine-dichalcogenolate complexes were obtained from the combination
of seven 1,2-dichalcogenolene ligands and eight aromatic diimine donors, listed in
Tables 3.22 and 3.23, respectively.
Page 127
Results and Discussion
113
Table 3.22. 1,2-dichalcogenolene ligands exploited in the present study for the synthesis of new
[Pt(N^N)(E^E)] complexes.
H S-
S-
Ph,H-edt2–
H S-
S-
Naph,H-edt2–
H S-
S-
Pyr,H-edt2–
N
S
H3C
S
S-
S-
Me-dmet2–
N
S
Et
S
S-
S-
Et-dmet2–
N
S
Ph
S
S-
S-
Ph-dmet2–
N
S
H3C
S
Se-
Se-
Me-dset2–
Page 128
Results and Discussion
114
Table 3.23. Aromatic diimine ligands exploited in the present study for the synthesis of new
[Pt(N^N)(E^E)] complexes.
N
N
2,2ʹ-bipy N
N
tBu
tBu
4,4ʹ-tBu2-bipy
N
N
1,10-phen N
N
Ph
Ph
4,4ʹ-Ph2-bipy
N
N
Me
Me
5,5ʹ-Me2-bipy N
N
Ph
Ph
4,7-Ph2-phen
N
N
Me
Me
4,4ʹ-Me2-bipy N
N
Me
Me
Me
Me
3,4,7,8-Me4-phen
3.2.1.1. Synthesis
As already mentioned (Section 1.1.4), the ligands belonging to the classes R-dmet2– and
R-dset2– (also known as R-thiazdt2– and R-thiazds2–, respectively)28 were already
exploited in the past for the synthesis of corresponding homoleptic bis(1,2-dithiolene)
complexes [M(R-dmet)2]x– and [M(R-dset)2]x–. In particular, the first complexes of this
class were reported by our group in 2005 [R = Et, M = Ni (9), Pd (10), Pt (11), x = 0, 1,
2].27 In that work, the complexes were synthesised by sulphuration of ethyl-2-
thioxothiazolidine-4,5-dione with Lawesson’s reagent in the presence of the metal as a
Page 129
Results and Discussion
115
powder (M = Ni) or as chloride (M = Pd, Pt). By means of this synthetic pathway, the
complexes were obtained in their neutral form (Scheme 1.6).
Recently, an alternative route was reported by Prof. Dominique Lorcy from Rennes 1
University, involving the direct sulphuration/selenation of a 1,3-thiazoline-2-thione,
through a lithiating agent, followed by the addition of the metal as halide, and leading to
the monoanionic form of the corresponding [M(R-dmet)2] [R = Me, M = Zn (35), Ni
(36), Pd (37)], and [M(R-dset)2] [R = Me, M = Zn (38), Ni (39), Pd (40)] complexes
(Scheme 3.2).28
S/Se N
SS
R+Li-E
+Li-ELDA
MX2
EM
EN
SS
RE
E N
SS
R
N
SS
R
E = S, SeR = Me
M = Zn, Ni, Pd
C+C+
-
Scheme 3.2. Synthetic route for the synthesis of [M(R-dmet)2]– (E = S) and [M(R-dset)2]– (E = Se)
complexes (Ref. 28).
From the zinc complexes 35 and 38, the same authors obtained a stable form of the Me-
dmet2– and Me-dset2– ligands, bearing cyanoethyl groups to protect the dichalcogenolate
functions, by refluxing the complexes with 3-bromopropionitrile, and the method was
recently extended to differently substituted R-dmet2– ligands (R = Et, Ph). This stable
form of the dithiolate ligand can be deprotected in basic medium and used to synthesise
homoleptic or mixed-ligand complexes (Scheme 3.3).28,79
Page 130
Results and Discussion
116
(NEt4)2Br(CH2)2CN
N
SS
R
ECH2CH2CN
ECH2CH2CNN
SS
R
E
E
N
SS
RE
EZn
E = S, SeR = Me, Et, Ph
Scheme 3.3. Synthesis of stable R-dmet2– and R-dset2– ligands from corresponding homoleptic zinc
complexes (Refs. 28 and 79).
This synthetic strategy was adopted to synthesise four R-dmet2–/ R-dset2– ligands (Table
3.22), obtained thanks to a collaboration from Prof. Lorcy.
Twenty new [Pt(N^N)(E^E)] complexes were obtained, synthesised according to the
following steps:
1) Diimine donors (Table 3.23) were refluxed with K2PtCl4 to give the corresponding
(N^N)PtCl2 complexes210
[N^N = 2,2ʹ-bipyridine (41), 1,10-phenatroline (42), 5,5ʹ-Me2-
bipyridine (43), 4,4ʹ-Me2-bipyridine (44), 4,4ʹ-tBu2-bipyridine (45), 4,4ʹ-Ph2-bipyridine
(46), 3,7-Ph2-phenanthroline (47), 3,4,7,8-Me4-phenanthroline (48)], with yields
ranging from 39 to 88% (Scheme 3.4 and Table 3.24).
N
N
K2PtCl4H2O
∆N
NPt
Cl
Cl
Scheme 3.4. Synthesis of [Pt(N^N)Cl2] complexes 41-48.
Page 131
Results and Discussion
117
Table3.24. Yields (%) of [Pt(N^N)Cl2] complexes 41-48, synthesised according to Scheme 3.4.
N^N Yield
41 2,2ʹ-bipy 75%
42 1,10-phen 88%
44 4,4ʹ-Me2-bipy 88%
43 5,5ʹ-Me2-bipy 52%
45 4,4ʹ,-tBu2-bipy 78%
46 4,4ʹ-Ph2-bipy 39%
47 4,7- Ph2-phen 63%
48 3,4,7,8-Me4-phen 53%
2) After the deprotection of the desired 1,2-dichalcogenolene precursor [arene-1,3-
dithiol-2-one, Ar = Ph (26), Naph (27), Pyr (28); N-substituted-4,5-bis(2ʹ-
cyanoethylthio)-1,3-thiazol-2-thione, R = Me (49), Et (50), Ph (51); or N-substituted-
4,5-bis(2ʹ-cyanoethylseleno)-1,3-thiazol-2-thione, R = Me (52)] in basic medium, the
obtained 1,2-dithiolato ligands were reacted with the platinum(II) dichloro diimine
complexes. The corresponding [Pt(diimine)(dichalcogenolate)] complexes are formed
by displacement of the two chlorides of the PtII precursor with the dichalcogenolate
chelating ligand.
Scheme 3.5. General procedure for the synthesis of [Pt(N^N)(E^E)] complexes.
S
S A r
H
O / N
S S
R
E C H 2 C H 2 C N
E C H 2 C H 2 C N
1 ) E t O H / E t O N a
2 )
P t N
N
C l
C l
P t N
N
E
E
L
L L’
Page 132
Results and Discussion
118
These complexes can be grouped into three different series. A first series of complexes
was obtained by combining the seven different 1,2-dichalcogenolene ligands included in
this study with 2,2ʹ-bipyridine (Scheme 3.6). Therefore, in this series the complexes 53-
59 differ only for the nature of the E^E ligand and all show N^N = 2,2ʹ-bipyridine.
Scheme 3.6. Complexes 53-59 belonging to Series 1 of neutral [Pt(2,2ʹ-bipy)(E^E)] complexes.
In a second series of complexes (60-66), the seven 1,2-dichalcogenolene ligands were
combined with 1,10-phenanthroline (Scheme 3.7).
PtN
N
S
SLʹ
-Se
-Se S
NS
Me -S
-S S
NS
Ph-S
-S S
NS
Et-S
-S S
NS
Me
-S H
-S Naph
-S H
-S Ph
-S H
-S Pyr
53 54
56 57 58 59
55
Lʹ
E
E
-S
-S
-Se
-Se
Page 133
Results and Discussion
119
Scheme 3.7. Complexes 60-66, belonging to Series 2 of neutral [Pt(1,10-phen)(E^E)] complexes.
Finally, a third series of complexes was obtained by exploiting a single 1,2-dithiolate,
namely Me-dmet2–, and by systematically varying the diimine, in order to analyse the
effect of differently substituted nitrogen ligands on the features of the corresponding
complexes (Scheme 3.8; this series also comprises complexes 56 and 63, included in the
previous series).
PtN
N
S
SLʹ
-Se
-Se S
NS
Me -S
-S S
NS
Ph-S
-S S
NS
Et-S
-S S
NS
Me
-S H
-S Naph
-S H
-S Ph
-S H
-S Pyr
60 61
63 64 65 66
62
Lʹ
E
E
-S
-S
-Se
-Se
Page 134
Results and Discussion
120
Scheme 3.8. Complexes 56, 63, and 67-72, belonging to Series 3 of neutral [Pt(N^N)(Me-dmet)]
complexes.
In addition, as already mentioned, to further investigate the effect of varying the 1,2-
dichalcogenolene ligand on the properties of [Pt(N^N)(E^E)] complexes, an additional
compound (73) was synthesised during a research visit at the University of Sheffield
within the groups of Prof. M. Ward and Dr. M. Morris, by employing the Fc,H-edt2–
ligand (Fc = ferrocenyl).
This ligand was first reported by Underhill for the synthesis of the corresponding NiII
complex (see above).71 In the work reported by this author, the precursor of Fc,H-edt2–
ligand (ferrocenyl-1,3-dithiol-2-one, 74) was synthesised through the classical synthetic
route adopted for 1,3-dithiol-2-ones,18 by reacting a α-bromoketone of ferrocene with
N
N
N
N
Me
Me
Me
Me
N
N
Ph
Ph
N
N
Ph
Ph
N
N
tBu
tBu
N
N
Me
Me
N
N
N
N
Me
Me
56 67 63 68
69 70 71 72
L =
S
SPt
N
SS
N
N
Me
L
Page 135
Results and Discussion
121
potassium ethylxanthate to give the corresponding α-ketoxanthate ester, which undergo
cyclisation in strongly acid mediums to give the desired heterocyclic precursor (Scheme
3.9).
O
Br
Fe O S-K+
S
O
S OEt
S
Fe
O
S OEt
S
FeOH
O
Cl
O
,
S
SO
H
Fe
Scheme 3.9. Synthetic route for the preparation of ferrocenyl-1,3-dithiol-2-one (74) according to the
method reported by Underhill and co-workers (Ref. 71).
For the present research project, an alternative synthetic method was employed, starting
from ethynylferrocene, prepared according to the route by Wang (Scheme 3.10):211
triphenylphosphine and iodoform were reacted in the presence of potassium tert-
butoxide to give the corresponding diiodomethyltriphenylphosphine ylide;
formylferrocene [obtained according to Tang et al.212 by reacting ferrocene with
triethylorthoformate in the presence of AlCl3, (i) in Scheme 3.10] was then added, and a
Wittig-type condensation occurred, to give 1,1ʹ-diiodoferrocenylene; the addition of an
excess of n-BuLi at -15° C eventually leads to the formation of ethynylferrocene [(ii) in
Scheme 3.10].
Page 136
Results and Discussion
122
FeO
H
O O
COH
Fe
COH
Fe PPh3I
CH CI2
Fet-BuOK n-BuLi
C CH
Fe
AlCl3(i)
(ii)
N2, Toluene
t-BuOKPPh3 + CHI3
Scheme 3.10. Synthesis of ethynylferrocene according to Wang (Ref. 211).
Ethynylferrocene was then employed for the synthesis of the corresponding 1,3-dithiol-
2-one 74, following the general procedure reported by Gareau19 (Section 1.1.2. and
Scheme 3.11).
C CH
FeO S
S
S O
S
N NCN
CN
S
SO
H
FeToluene, ∆
Scheme 3.11. Synthesis of ferrocenyl-1,3-dithiol-2-one (74).
According to this method, ethynylferrocene is reacted with diisopropyl xanthogen
disulfide in the presence of AIBN (Scheme 3.11), which acts as a radical initiator,
following the mechanism depicted in Scheme 3.12.19,213
Page 137
Results and Discussion
123
N N
CN
NCCN
CN
O S
S
S O
S
O S
SCN
S
OS
O S
S
R C C R'O S
SR'
R S
SO
R'
R
O S
S
S O
S
S O
S S
OS
Thermal decomposition
2
(Byproduct)
(Byproduct)
Termination
S
OS S O
S
O S
S CN
O S
SCN
Scheme 3.12. Radical reactions initiated by AIBN during the synthesis of ferrocenyl-1,3-dithiol-2-one
(74), and relative termination (Refs. 19 and 213).
From ferrocenyl-1,3-dithiol-2-one, the corresponding [Pt(4,4ʹ-tBu2-bipy)(Fc,H-edt)]
(73) complex was obtained according to a modification of the general procedure
summarised in Scheme 3.5, starting from [Pt(4,4ʹ-tBu2-bipy)Cl2] (Scheme 3.13).
Notably, 73 represents the first example of a platinum(II) complex bearing this
ferrocenyl-substituted ligand.
Page 138
Results and Discussion
124
Scheme 3.13. Synthesis of [Pt(4,4ʹ-tBu2-bipy)(Fc,H-edt)] (73).
.
S
SO
H
Fe
N
N
Pt
tBu
tBu
Cl
Cl
1) MeOH/MeONa
2)
N
N
Pt
tBu
tBu
S
S H
Fe
All the twenty-one complexes were found to have satisfying elemental analyses, except
for 55 and 62, which could not be obtained in a pure form notwithstanding the
numerous attempts of purification. All complexes were obtained in yields ranging
between 9 and 90%, and were found to be thermally stable, with melting points above
240° C. In all cases, a complete spectroscopic and electrochemical characterisation,
summarised in the Experimental Section (Paragraph 5.2.2.2), was carried out.
3.2.1.2. Structural characterisation
Crystals suitable for X-ray diffraction measurements were collected for compounds 57-
59, 64, 67, and 69 (Figure 3.22, Tables 3.25 and 3.26). The quality of the structures,
testified by the R indeces (Table 3.25), is in some cases not excellent, due to either
disordered atoms unsuitable for splitting in the complex molecules (64, 67) or solvent
molecules encapsuled in the cavities (57, 59).
Page 139
Results and Discussion
125
Figure 3.22 ORTEP drawing and atom labelling scheme for the complex units in the crystal structures of
57·1/2THF, 58, 59·1/2CH2Cl2, 64, 67, and 69. Thermal ellipsoids are shown at the 50% probability level.
Hydrogen atoms were omitted for clarity.
In two cases, namely for complexes 57 and 59, the structure determination estabilished
the crystallised compound as 57·1/2 THF and 59·1/2 CH2Cl2, respectively, due to the
presence of co-crystallised solvent (Table 3.25). As an example, in the crystals of the
57 58
67 69
Pt
S1
S2
C3
C4
N1
N2
C1
C2
Pt
S1
S2
C3
C4
N1
N2
C1
C2
Pt
Se1 C3
C4
N1
N2
C1
C2 Se2
59
Pt
S1 C3
C4
N1 N2
C1
C2 S2
64
Pt
S1 C3
C4
N1 N2
C1
C2 S2
Pt
S1 C3
C4
N1 N2
C1
C2 S2
Page 140
Results and Discussion
126
complex 57, grown by slow evaporation of THF solutions, the unit cell consists of two
independent specular [Pt(2,2ʹ-bipy)(Et-dmet)] molecular units lying on parallel planes
and slipped to each other, and a solvent molecule. Since the pattern of bond angles and
distances within each complex unit shows significant differences, especially as far as
the Et-dmet2– ligand is regarded, in Table 3.26 the values for each molecular unit
(labelled as A and B) are reported. Moreover, it is worth underlining that the structure
of 67 features the simultaneous presence of two kinds of complex units (occupancies =
65% and 35%), differing for the parameters regarding the Me-dmet2– ligand, and flipped
by 180° with respect to the other.
An examination of the complex units in all the crystal structures (Figure 3.22, Table
3.26) shows the central metal ion coordinated in a square-planar fashion, and complexes
are almost completely planar but for the substituents, with dihedral angles C3-N1-Pt-E1
ranging between 169.39 and 177.81° (Table. 3.26, numbering scheme as in Figure 3.22).
For complexes 57, 58, 67, and 69 bond lengths and angles describing PtII coordination
are in good agreement with those reported for the [Pt(N^N)(S^S)] complexes
structurally characterised so far [average experimental Pt-S, Pt-N, C-S and C-C
distances = 2.256(14), 2.046(10), 1.744(23), and 1.373(41) Å, respectively; average
experimental S-Pt-S and N-Pt-N angles = 89.38(8) and 79.22(8)°, respectively; Section
1.3.2.2]. In the case of 64, Pt-S/Pt-N distances and S-Pt-S/N-Pt-N angles are shorter and
larger, respectively, than those usually found for the other complexes structurally
characterised. In particular, the comparison between bond lengths and angles in 57 and
64 (differing just for the identity of the diimine ligand), shows that the introduction of a
1,10-phenanthroline in place of a 2,2ʹ -bipyridine determines significant differences in
the structural features of [Pt(N^N)(S^S)] complexes. It is worth noting that, to best of
our knowledge, only another [Pt(N^N)(S^S)] complex bearing a 1,10-phenanthroline
ligand, namely [Pt(Ph2-phen)(tBu2-tdt)] (Ph2-phen: 4,7-diphenyl-phenanthroline, tBu2-
Page 141
Results and Discussion
127
tdt: 3,5-di-tert-butyl-1,2-benzenedithiolato), was structurally characterised so far.214
135
On
the other hand, a comparison between 57, 58, 67, and 69 shows that the addition of
alkyl substituents to the 2,2 -bipyridine ligand does not induce significant changes into
the crystal structure of the complex. Among the complexes characterised by X-ray
diffraction, a particular mention is deserved by 59, which represents the second example
of a diimine-diselenolate ever characterised structurally. As expected, due to the
bigger radius of selenium as compared to sulphur, in the case of 59 the chalcogen-
platinum distances are significantly longer than those determined for the corresponding
sulphured compounds (as clearly appears from a comparison between the structural
features of 59 and 57).
Concerning the 1,2-dichalcogenolato system, C-C and C-S distances in the ranges
1.340-1.366 and 1.723-1.763 Å, respectively, were found for complexes 57, 58, 64, 67,
and 69, suggesting, as expected, a ene-1,2-dithiolato form (–S-C=C-S–) for the 1,2-
dithiolene ligand. The same conclusions can been drawn for 59, where C-Se bond
lengths are remarkably longer (1.905 Å on average), due to the larger Van der Waals
radius of Se compared to S.
Page 142
Results and Discussion
128
.
Table 3.25. C
rystallographic data for 57·1/2THF, 58, 59·1/2C
H2 C
l2 , 64, 67 and 69. a
a T = 93(2) (57), 125(2) (58, 59, and 64), or 150(2) (67-69) K; M
oK
α radiation (λ = 0.7107 Å)
Page 143
Results and Discussion
129
Table 3.26. Selected bond lengths (Å) and angles (°) of com
plex units in the crystal structures of 57·1/2THF (units A and B), 58, 59·1/2CH
2 Cl2 , 64, 67,
and 69. a,b
a E = S (57, 58, 64, 67, 69), Se (59). b Atom
labelling scheme as in Figure 3.22.
Page 144
Results and Discussion
130
Although the quality of some of the structures, as already mentioned, is not excellent,
the interactions driving the crystals packing could be evaluated in all cases. An
examination of the structures shows in all cases interactions between the electron π
system of the diimine and the 1,2-dichalcogenolate.
In the case of 57·1/2THF, the crystal packing originates from face-to-face π-π
interactions between the 2,2ʹ-bipyridine ligands of symmetry-related complex units
disposed head-to-tail (1–x, 1–y, 1–z; intercentroid distance 3.70 Å) and between the
2,2ʹ-bipyridine ligands and the C2S2Pt pentaatomic dithiolene rings (intercentroid
distance 3.57 Å) that result in the formation of tetrameric aggregates (Figure 3.23).
Slightly weaker interactions of the same type generate a complex network, leaving
cavities that host the THF solvent molecules.
Figure 3.23. ORTEP drawing of a portion of the crystal packing of 57·1/2THF, showing the ring
centroids in red. Hydrogen atoms have been omitted for clarity. Thermal ellipsoids have been drawn at
50% probability. ʹ = 1–x, 1–y, 1–z.
PtA
PtB
PtA'
PtB'
3.69Å
3.57Å3.57Å
3.69Å
Page 145
Results and Discussion
131
The crystal structure of 58 shows that also in this case weak π-π interactions lead to the
formation of discrete aggregates. In fact, although the rotation of the phenyl substituent
at the 1,3-thiazoline ring (65.73° between the average planes defined by the thiazoline
and phenyl rings) prevents stacking interactions similar to those described for 57,
couples of interactions between the π system of the heterocyclic ring of the Ph-dmet2–
ligand and the Pt atom of a symmetry related molecule (1–x, 1–y, 1–z) lead to the
formation of pairs (Pt-centroid distances 3.644 and 3.678 Å, Figure 3.24).
Figure 3.24. ORTEP drawing of interacting symmetry related molecular units in the crystal structure of 58.
Ring centroids are drawn in red. Hydrogen atoms have been omitted for clarity. Thermal ellipsoids have
been drawn at 50% probability. ʹ = 1–x, 1–y, 1–z.
Two types of π-π supramolecular contacts extend the interactions between the units of 58:
(i) a slipped edge-to-edge interaction between the bipyridines results in the formation of
ribbons running along the a vector (Figure 3.25). (ii) face-to-face π-π interactions between
eclipsed couples of the phenyl substituents (distance between the planes described by the
Page 146
Results and Discussion
132
phenyl rings 3.26 Å) keep together the ribbons to form stacks oriented along the a vector
determining the overall three-dimensional structure.
Figure 3.25. Spacefill view along the c vector of the ribbons formed between symmetry related molecular
units of 58 by means of the slipped edge-to-edge π-π interaction between the 2,2ʹ-bipyridine ligands.
The crystal packing of 59·1/2CH2Cl2 is originated from two main different types of
interactions involving the diimine ligand, which features (i) face-to-face interactions
with the C3NS heterocycle of the Me-dset2– ligand (intercentroid distance 3.50 Å), and,
on the other side of the molecular plane, (ii) slipped π-π stacking interactions with the
2,2ʹ-bipyridine of a symmetry related molecule (intercentroid distance 3.60 Å, Figure
3.26).
Page 147
Results and Discussion
133
Figure 3.26. ORTEP drawing of interacting symmetry related molecular units of 59 in the crystal
structure of 59·1/2CH2Cl2. Hydrogen atoms have been omitted for clarity. Thermal ellipsoids have been
drawn at 50% probability. C5-C9ʹ =3.34, C4-C9ʹ = 3.44, C4-C4ʹ = 3.37, C9-C3ʹ = 3.44, C9-C5ʹ = 3.34,
C6-C1" = 3.50, C5-C2" = 3.46, C8-C13" = 3.48 Å. ʹ = 1–x, 1–y, 2–z; " = x, –1+y, z.
The overall packing leaves cavities occupied by CH2Cl2 disordered solvent molecules,
in molar ratio 1:2 with respect to 59.
Although the crystals of 67 are of poor quality, it is possible to evaluate the connectivity
within the molecule and confirm the hypothesised structure of the PtII complex.
Monomeric units in the crystal are stacked along the a vector with a zig-zag motif by
means of contacts closely related to those discussed above for 59, i.e. slipped π-π
stacking interactions between the 5,5ʹ-Me2-bipyridine ligands (intercentroid distance
between pyridine units 3.62 Å) and face-to-face interactions with the C3NS heterocycle
of the Me-dmet2– ligand (intercentroid distance 3.52 Å). Although such interactions
result in Pt···Pt distances (4.18 Å) shorter than in the cases discussed above, these are
largely above the sum of van der Waals radii (3.44 Å).215 Weak contacts involving the
Page 148
Results and Discussion
134
methyl substituents of the 1,2-dithiolates and the 2,2ʹ-bipyridine units pack the stacks
along the b and c axis.
The crystal structure of 64 shows that the same type of π−π interactions between the
benzenoid ring of the 1,10-phenanthroline and the Et-dmet2– ligands result in the
formation of weakly bonded pairs of molecules (Figure 3.27).
Figure 3.27. ORTEP drawing of a portion of the crystal packing of 64, showing the ring centroids in red.
Only the atoms mentioned in the discussion are labelled. Hydrogen atoms have been omitted for clarity.
Thermal ellipsoids have been drawn at 50% probability. ʹ = 2–x, –y, –z.
The endocyclic and the terminal sulphur atoms of the Et-dmet2– ligand (S4 and S5,
respectively, in Figure 3.27) are involved in weak contacts with hydrogen atoms of
1,10-phenanthroline ligands of different pairs of molecules disposed almost
orthogonally (86.01°; S4···H7" = 2.97, S4···H8" = 2.86, S5···H9ʹʹʹ = 2.97 Å; " = 1/2+x,
y, 1/2–z, ʹʹʹ = 5/2–x, –y, 1/2+z).
Finally, in the crystal packing of 69 parallel molecular units can be envisaged with π-π
face to face interactions between C2N2Pt metallacycles of couples of complex units
Pt
N1
N2
S2
S1C1
C2
C4
C33.72 Å 3.80 Å
Pt'
C1'
C2'
S1'
S2'
N2'N1'
S4
S5
S5'S4'
N3'C4'
C3'
C5C6
C7C8
C9C10
C11
C12
C13C14
Page 149
Results and Discussion
135
disposed head-to-tail (intercentroid distance 3.76 Å; symmetry operation –x,–y,–z).
Couples of weak intermolecular contacts involving the coordinating sulphur atoms and
the endocyclic chalcogen species of each Me-dmet2– ligand (S2···S4" = 3.50 Å,
labelling scheme as in Figure 3.27 for 64; " = –1–x, –y, –z), slightly shorter than the sum
of van der Waals radii (3.60 Å),215 generate the ribbon depicted in Figure 3.28. Weak
minor hydrophobic contacts between parallel ribbons originate the crystal packing.
Figure 3.28. ORTEP drawing of a portion of the ribbons, running along the a vector, formed by complex 69
by means of π−π interactions and S···S contacts seen along the c axis. Hydrogen atoms have been omitted for
clarity. Thermal ellipsoids have been drawn at 50% probability.ʹ = –x, –y, –z; " = –1–x, –y, –z.
Pt
Pt'
S4"
S2 S4
S2"
Page 150
Results and Discussion
136
3.2.1.3. Electrochemistry
Cyclic Voltammetry (CV) measurements performed in DMSO on 53-72 show that,
beside 72, all the complexes feature two one-electron redox processes, at about -1.6 and
0.1 V versus the Fc+/Fc couple (Table 3.27; Figure 3.29 for 54).
Figure 3.29. Cyclic voltammetry recorded for a solution of 54 at a platinum electrode in anhydrous
DMSO [298 K; scan rate 100 mV s–1; supporting electrolyte (TBA+)(PF6–) 0.1 M].
-2,2E+00 -1,7E+00 -1,2E+00 -7,0E-01 -2,0E-01 3,0E-01
I(A
)
E (V vs Fc+/Fc)
10 µA
-2.2 -1.7 -1.2 -0.7 -0.2 0.3
Page 151
Results and Discussion
137
Table 3.27. Half-wave potentials E1/2 (V vs Fc+/Fc) recorded by CV for complexes 53-73 (scan rate 50
mV s–1).
E1/2
(–1/–2) E1/2 (0/–1) E1/2
(+1/0)
53 / -1.741 -0.135
54 / -1.727 -0.135
55 / -1.618 -0.076
56 -2.270 -1.608 -0.004
57 -2.256 -1.609 0.008
58 -2.269 -1.622 0.046
59 -2.245 -1.607 0.044
60 / -1.715 -0.147
61 / -1.728 -0.161
62 / -1.620 -0.076
63 / -1.620 -0.017
64 / -1.620 -0.027
65 / -1.634 0.020
66 / -1.620 -0.027
67 / -1.730 -0.027
68 / -1.740 -0.017
69 / -1.692 -0.015
70 -2.112 -1.563 -0.040
71 / -1.561 -0.002
72 / -1.789 /
73a / -1.470 0.216 a Complex 73 features further redox processes not reported in this table.
Page 152
Results and Discussion
138
Five of the complexes show an additional reduction process below -2.0 V (Table 3.27;
Figure 3.30 for 56).
Figure 3.30. Cyclic voltammetry recorded for a solution of 56 at a platinum electrode in anhydrous
DMSO [298 K; scan rate 100 mV s–1; supporting electrolyte (TBA+)(PF6–) 0.1 M].
An examination of ipc/ipa and peak separation values (Table 3.28) clearly indicates that
reduction of neutral species to the corresponding monoanionic ones, common to all
complexes, is a monoelectronic reversible process falling at about -1.6 V vs Fc+/Fc, with
ipc/ipa close to unity and |Epc–Epa| = 49-79 mV at 50 mV s–1 for all complexes. The
reduction process leading from the monoanionic to the dianionic form of complexes 56-
59 and 70 occurs at about -2.1 V vs Fc+/Fc, and is fully reversible as well (ipc/ipa ≈ 1 and
|Epc–Epa| = 48-53 mV at 50 mV s–1), thus suggesting both reduction processes occur
without decomposition of the complexes. The oxidation occurring for all complexes
beside 72 at about 0.1 V vs Fc+/Fc, is also a reversible process, with ipc/ipa and |Epc–Epa|
ranging between 0.7 and 1.4, and 44 and 72 mV at 50 mV s–1, respectively; only for 59
and 63 the ipc/ipa values fall out of the described ranges, so that, as concerns these
complexes, the process should be considered as quasi-reversible.
-3,0 -2,5 -2,0 -1,5 -1,0 -0,5 0,0 0,5 1,0
I(A
)
E (V vs Fc+/Fc)
10 µA
-3.0 -2.5 -2.0 -1.5 -1.0 -0.5 0.0 0.5 1.0
Page 153
Results and Discussion
139
Table 3.28. Electrochemical data (V vs Fc+/Fc) recorded by CV for complexes 53-73 (scan rate 50 mV s–
1).
E1/2
(–1/–2) E1/2 (0/–1) E1/2
(+1/0)
|Epc–Epa| ipc/ipa |Epc–Epa| ipc/ipa |Epc–Epa| ipc/ipa
53 / / 0.072 1.1 0.072 1.0
54 / / 0.065 1.0 0.064 1.0
55 / / 0.060 1.1 0.062 0.8
56 0.052 0.7 0.049 1.0 0.049 1.1
57 0.052 1.0 0.050 1.1 0.044 0.9
58 0.053 0.8 0.054 1.1 0.048 0.7
59 0.048 0.8 0.049 1.2 0.054 0.5
60 / / 0.058 1.0 0.047 1.1
61 / / 0.064 1.1 0.062 1.0
62 / / 0.079 0.8 0.048 1.4
63 / / 0.055 1.3 0.047 2.0
64 / / 0.060 1.3 0.048 1.0
65 / / 0.058 1.1 0.062 0.9
66 / / 0.056 1.1 0.052 0.9
67 / / 0.068 0.9 0.065 1.2
68 / / 0.079 0.6 0.056 1.2
69 / / 0.058 0.8 0.051 0.9
70 0.052 0.8 0.066 1.3 0.057 1.0
71 / / 0.049 0.8 0.051 1.2
72 / / 0.078 1.1 / /
73a / / 0.075 1.0 0.048 1.0 a Complex 73 features further redox processes not reported in this table.
Concerning the features of the two redox processes common to all twenty complexes
beside 72, they can be rationalised by analysing separately the three series of complexes
depicted in Schemes 3.6-3.8. In the first series, where all the complexes feature the
same diimine ligand (2,2ʹ-bipyridine), and differ for the identity of the 1,2-
dichalcogenolene one, a dependence of the oxidation potential on the nature of the E^E
ligand is observed, while the reduction potential is similar for all the complexes. This is
Page 154
Results and Discussion
140
in agreement with the localisation of the HOMO on the 1,2-dichalcogenolene ligand
hypotesised for [Pt(N^N)(E^E)] complexes (section 1.3.2.3).152 In particular, in
complexes 56-59, bearing a R-dmet2–/R-dset2– ligand, the oxidation potential is
systematically more positive than in 53-55, where a Ar,H-edt2– ligand is present, the
latest complexes being therefore more easily oxidised (Figure 3.31, Table 3.27). These
observations suggest that complexes 56-59 feature the HOMO at lowest energies with
respect to 53-55, while the variation of the substituent at the 1,2-dithiolene core within
each class of ligands induce minor variations into the redox features of the
corresponding complexes.
Figure 3.31. Half-wave potentials (V vs Fc+/Fc) of the oxidation process (Table 3.27) for complexes 53-
59 (Series 1, Scheme 3.6). N^N = 2,2ʹ-bipyridine; E^E = Ar,H-edt2–(rhombs), R-dmet2–(circles), Me-dset2–
(triangle).
Similar observations can be drawn for Series 2, where 1,10-phenanthroline is present in
place of 2,2ʹ-bipyridine.
On the other hand, in Series 3, where Me-dmet2– is combined with different diimine
ligands, a dependence of the reduction potential on the nature of the N^N ligand is
54 53
55
56 57
58 59
0,30
0,35
0,40
0,45
0,50
0,55
0,60
E1/
2(+
1/0)
(V v
sFc+ /F
c)
0.10
0.05
0.00
-0.05
-0.10
-0.15
-0.20
Page 155
Results and Discussion
141
observed, which can be related to the localisation of the LUMO on this fragment of the
molecule assumed for these systems (Section 1.3.2.3).152 In particular, the comparison
between redox potentials of 56 and 63 suggest that, on passing from bipyridine to
phenanthroline systems, no significant changes can be observed in the value of the
reduction potential (Figure 3.32, Table 3.27).
Figure 3.32. Half-wave potentials (V vs Fc+/Fc, Table 3.27) of the reduction process for complexes 56,
63, and 67-72 of Series 3 (Scheme 3.8). S^S = Me-dmet2–; N^N = unsubstituted (rhombs) 2,2ʹ-bipyridine
(blue) or 1,10-phenanthroline (red) and alkyl (circles) or phenyl (triangles) derivatives.
An examination of the reduction potentials of complexes bearing differently substituted
2,2ʹ-bipyridine and 1,10-phenanthroline ligands (blue and red symbols, respectively in
Figure 3.32) shows that systems bearing phenyl substituents feature the reduction at less
negative potentials with respect to the unsubstituted systems, while the alkyl pendants
induce the opposite effect.
Cyclic voltammetry measurements were also performed in CH2Cl2 for 73 (Figure 3.33).
This complex features a monoelectronic reversible reduction wave at about -1.470 V vs
71 70
56 63
69
6768
72
-1,40
-1,35
-1,30
-1,25
-1,20
-1,15
-1,10
-1,05
-1,00
E1/
2(0
/-1)(V
vsF
c+ /Fc)
-1.50
-1.55
-1.60
-1.65
-1.70
-1.75
-1.80
-1.85
-1.90
Page 156
Results and Discussion
142
Fc+/Fc (ipc/ipa = 1, |Epc–Epa| = 75 mV at 50 mV s–1) and several oxidation waves. The
number of processes should be due to the presence of the redox-active ferrocenyl
substituent at the 1,2-dithiolene core. A first reversible process occurs at about 0.216 V
vs Fc+/Fc (ipc/ipa = 1, |Epc-Epa| = 48 mV at 50 mV s–1), while at more positive potentials
two more oxidations can apparently be found, at 0.613 and 0.773 V, respectively. A
comparison of the voltammogram of 73 with those of the other related complexes
discussed above, induces to hypothesise that the processes at -1.470 and 0.216 V vs
Fc+/Fc may be related to the formation of monoanionic and monocationic species
respectively, and should be centred on the diimine-dithiolate core.
The two signals at more positive potentials could be tentatively assigned to a single
oxidation process referable to the ferrocenyl substituent, whose wave would result split
in two, possibly because of a deposition process at the electrode occurring during the
measurements.
Figure 3.33. Cyclic voltammetry recorded for a solution of 73 at a platinum electrode in anhydrous
CH2Cl2 [298 K; scan rate 100 mV s–1; supporting electrolyte (TBA+)(PF6–) 0.1 M].
Page 157
Results and Discussion
143
3.2.1.4. Absorption UV-Vis-NIR Spectroscopy
The UV-Vis-NIR absorption spectra (250-1100 nm) of complexes 53-73 recorded in
DMSO feature a series of absorptions in the UV region, with λmax ranging between 257
and 392 nm. In all cases, the band falling at highest energies and showing the highest
extinction coefficient ε (15000-50000 M–1 cm–1) is found at about 260 nm (Figures 3.34
and 3.35), both for the complexes bearing 2,2ʹ-bipyridine and 1,10-phenanthroline
ligands. Moreover, complexes bearing a substituted or unsubstituted 2,2ʹ-bipyridine (53-
59, and 67-70) feature an absorption at about 300 nm, with ε = 16000-40000 M–1 cm–1
(Figures 3.34 for 53 and 3.35 for 56).
In the absorption spectra of complexes featuring Ar,H-edt2– ligands (53-55 and 60-62),
further absorptions with ε = 8000-14000 M–1 cm–1 can be found in the region 320-380
nm (Figure 3.34 for 53)
Figure 3.34. UV-Vis-NIR absorption spectrum recorded for 53 in DMSO.
0
0,5
1
1,5
2
2,5
3
3,5
4
250 450 650 850 1050
Abs
orba
nce
Wavelength (nm)
4.0
3.5
3.0
2.5
2.0
1.5
1.0
0.5
0.0
Page 158
Results and Discussion
144
On the other hand, all complexes featuring a R-dmet2–/R-dset2– ligand (56-59, 63-66,
and 67-72) feature a relatively intense (ε = 6000-16000 M–1 cm–1) absorption at about
370 nm (Figure 3.35 for 56), and the complexes featuring the same ligands in
combination with a substituted or unsubstituted 2,2ʹ-bipyridine (56-59, 63-66, and 67-
70) show two further narrow absorption bands at about 305 and 325 nm (ε = 6000-
15000 M–1 cm–1).
Figure 3.35. UV-Vis-NIR absorption spectrum recorded for 56 in DMSO.
As described in Section 1.3.2.3, a peculiar feature of [M(N^N)(E^E)] complexes is the
presence of a solvatochromic absorption band in the visible region, assigned to a mixed
metal-ligand-to-ligand charge-transfer (MMLLʹCT, or MLCT/LLCT as recently
abbreviated) occurring from the HOMO, which has a mixture of metal and dithiolate
character, to the LUMO, centred on the diimine.127 This absorption band is present in all
0
0,2
0,4
0,6
0,8
1
1,2
1,4
1,6
1,8
2
250 350 450 550 650 750 850
Abs
orba
nce
Wavelength (nm)
2.0
1.8
1.6
1.4
1.2
1.0
0.8
0.6
0.4
0.2
0.0
Page 159
Results and Discussion
145
complexes of d8 metals in a square-planar coordination belonging to this class, and the
lowest energy and highest molar absorption coefficients are shown by PtII complexes.
Accordingly, a broad absorption band in DMSO with ε = 3500-6700 M–1 cm–1 can be
found in spectra of complexes 53-73 in the visible region, with absorption maxima
between 550 and 610 nm (Table 3.29 and Figures 3.34 and 3.35 for 53 and 56,
respectively). The absorption spectra of all complexes exhibit a remarkable negative
solvatochromism, as proved by recording the absorption spectra in eight different
solvents (dichloromethane, chloroform, acetonitrile, acetone, tetrahydrofurane,
dimethylformammide, dimethylsulfoxide, and toluene; Table 3.29 and Figure 3.36 for
53; due to solubility problems, the spectrum in toluene could not be recorded for some
complexes). For each complex, the λmax of the absorption band fits in a range of about
150 nm in the eight solvents considered, with the shortest wavelength shown in all cases
in acetonitrile, and the longest one in toluene (Table 3.29 and Figure 3.36 for 53). The
molar extinction coefficient of the absorption is solvent-dependent as well (Table 3.29),
reaching about 8000 M–1 cm–1 in toluene for 53.
Page 160
Results and Discussion
146
Table 3.29. Visible absorption maxima λmax (nm) and molar extinction coefficients ε (M–1 cm–1, in
parenthesis) for complexes 53-73 in different solvents.
CH2Cl2 CHCl3 CH3CN Acetone THF DMF DMSO Toluene
53 636 (6100)
654 (4900)
598 (5500)
630 (6900)
672 (7800)
615 (6200)
604 (6700)
686, 743 (7200-8000)
54 637 (6200)
667 (5500)
601 (3900)
629 (5100)
675 (7100)
615 (6300)
603 (5900)
698, 760 (/)
55a 628 (/)
644 (/)
594 (/)
612 (/)
640 (/)
/ 592 (/)
/
56 633 (5000)
660 (5200)
584 (3600)
610 (4100)
645 (3600)
591 (4300)
581 (4300)
740 (/)
57 635 (4800)
670 (4600)
577 (5900)
604 (4600)
652 (4800)
586 (3000)
582 (4500)
740 (4300)
58 630 (4400)
652 (4200)
579 (3200)
604 (3800)
651 (4600)
589 (3800)
580 (4000)
731 (4600)
59 622 (5100)
647 (5400)
578 (3200)
590 (3500)
635 (4200)
575 (4600)
569 (3500)
732 (/)
60 634 (6300)
653 (3600)
598 (3800)
632 (5400)
675 (6300)
618 (4300)
606 (5400)
677, 736 (5700, 7000)
61 632 (3300)
652 (5200)
598 (4000)
628 (4100)
675 (4100)
616 (5800)
603 (3600)
684, 732 (6100, 6800)
62a 620 (/)
/ / 606 (/)
/ 596 (/)
/ /
63 631 (3600)
656 (2400)
589 (3100)
619 (5000)
654 (2700)
591 (4900)
581 (5000)
/
64 634 (4100)
660 (4500)
579 (3800)
606 (3500)
655 (3600)
589 (3800)
579 (4000)
757 (/)
65 628 (4900)
635 (4000)
577 (3700)
603 (4700)
652 (5300)
591 (4600)
581 (4600)
730 (4400)
66b 618 (4300)
644 (3600)
570 (3400)
601 (/)
637 (2800)
577 (5200)
570 (5000)
/
67 603 (5000)
623 (5300)
565 (3600)
585 (4700)
629 (6300)
570 (4900)
567 (4700)
687, 740 (/)
68 603 (5000)
623 (5300)
565 (3600)
585 (4700)
629 (6300)
570 (4900)
567 (4800)
/
69 607 (6200)
627 (4800)
564 (3500)
588 (4600)
564 (5000)
570 (5200)
631 (5300)
694, 755 (3900, 3700)
70 657 (5900)
675 (5500)
611 (3700)
637 (4500)
682 (5500)
615 (4600)
608 (5600)
/
71 642 (5700)
662 (5800)
600 (4200)
616 (4900)
672 (6200)
615 (5600)
602 (5700)
/
72b 633 (5000)
586 (4300)
543 (3700)
563 (/)
621 (/)
561 (3100)
549 (3800)
/
73 638 (5800)
659 (6100)
604 (6100)
637 (5900)
682 (5600)
623 (5700)
621 (5800)
/
a Molar extinction coefficients could not be determined for complexes 55 and 62 due to the presence of byproducts. bMolar extinction coefficients could not be determined in some solvents due to solubility reasons.
Page 161
Results and Discussion
147
In the absorption spectra recorded in toluene, the solvatochromic absorption band is
broadened or split into two bands, as already observed for other [Pt(N^N)(E^E)]
complexes.127
Figure 3.36. Normalised absorption spectra in the Vis region (500-900 nm) recorded for 53 in selected
solvents (Table 3.29).
The trend of the position of λmax in various solvents for a given compound is in perfect
agreement with the empirical scale formulated by Eisenberg for [Pt(N^N)(E^E)]
complexes,127,216
as shown in Figure 3.37.
0
0,2
0,4
0,6
0,8
1
500 550 600 650 700 750 800 850 900
Nor
mal
ised
abs
orba
nce
Wavelength (nm)
CH2Cl2CHCl3CH3CN acetoneDMFDMSOTHF
1.0
0.8
0.6
0.4
0.2
0.0
CH2Cl2
CHCl3
CH3CN
Page 162
Results and Discussion
148
Figure 3.37. Correlation between absorption wavelengths λmax in different solvents for complex 53 and
the empirical scale formulated by Eisenberg for [Pt(N^N)(S^S)] complexes (R2 = 0.99; Ref. 127; Table
3.29).
Moreover, the analysis of the absorption spectra of complexes 53-72 in a single solvent
shows that the λmax value of the absorption in the visible region depends on the nature of
the ligands. In particular, the examination of λmax in the absorption spectra registered in
DMSO for the complexes belonging to Series 1, differing in the nature of the
dichalcogenolate (Scheme 3.6), can give an insight into the dependence of this value on
the nature of the E^E ligand (Figure 3.38). Complexes bearing a Ar,H-edt2– ligand (53-
55) feature the solvatochromic absorption band at wavelength values systematically
longer than corresponding complexes featuring a R-dmet2–/R-dset2– ligand (56-59),
suggesting that the HOMO-LUMO energy gap is smaller for the complexes featuring
the former type of E^E ligands as compared to those featuring the latter. Within the
complexes bearing a Ar,H-edt2– ligand, 55 (Ar = Pyr) shows the shorter λmax, while no
remarkable differences in the position of the absorption band can be found between 53
and 54 (Ar = Ph and Naph, respectively). In the series 56-59, the complex bearing Me-
CH3CNDMSO
DMF
Acetone
CH2Cl2
CHCl3
THF
Toluene
0
0,2
0,4
0,6
0,8
1
1,2
580 630 680 730
Eis
enbe
rg sc
ale
λmax (nm)
1.2
1.0
0.8
0.6
0.4
0.2
0.0
Page 163
Results and Discussion
149
dset2– shows a lower value of λmax with respect to all the complexes featuring R-dmet2–
ligands (Figure 3.38, Table 3.29).
Figure 3.38. Wavelength of the solvatochromic absorption band (nm, Table 3.29) in DMSO for
complexes 53-59 (Series 1, Scheme 3.6). N^N = 2,2ʹ-bipy; E^E = Ar,H-edt2– (rhombs), R-dmet2– (circles),
Me-dset2– (triangle).
Similar considerations can be drawn for Series 2 (Scheme 3.7), while an examination of
absorption spectra of the complexes belonging to Series 3 (Scheme 3.8) in DMSO,
shows that the replacement of a 2,2ʹ-bipyridine ligand with a 1,10-phenanthroline does
not induce significant changes in the position of the solvatochromic absorption band
(complexes 56-63 in Figure 3.39). A comparison of the λmax value in complexes bearing
differently substituted 2,2ʹ-bipyridine and 1,10-phenanthroline ligands (blue and red
symbols, respectively in Figure 3.39) suggests that the introduction of alkyl substituents
in the diimine ligand causes a shift of the absorption band to higher energies, while the
presence of a phenyl group induces the opposite effect, thus lowering the energy of the
HOMO-LUMO energy gap (Figure 3.39, Table 3.29).
59
58 56 57
55
54 53
565
570
575
580
585
590
595
600
605
610λ m
ax(n
m)
Page 164
Results and Discussion
150
Figure 3.39. Wavelength of the solvatochromic absorption band (nm) in DMSO (Table 3.29) for
complexes 56, 63 and 67-72 (Series 3, Table 3.8). S^S = Me-dmet2–; N^N = unsubstituted (rhombs) 2,2ʹ-
bipyridine (blue) or 1,10-phenanthroline (red) and alkyl (circles) or phenyl (triangles) derivatives.
Since both the electrochemical data and the energy of the solvatochromic absorption
band depend upon the HOMO and LUMO eigenvalues, the two sets of data have been
compared.
Interestingly, a linear correlation holds between the position of the solvatochromic
absorption band and the redox potentials for complexes 53-72.
In particular, considering Series 1 (Scheme 3.6), a linear correlation (R2 = 0.93) was
found between the λmax of the absorption and the oxidation potential E1/2(+1/0) (Tables
3.27 and 3.29; Figure 3.40). Complexes bearing a R-dmet2–/R-dset2– ligand (56-59)
feature the oxidation potentials and the λmax value at more positive potentials and lower
wavelengths, respectively, with respect to complexes featuring a Ar,H-edt2– ligand (53-
55), as shown in Figure 3.40. This suggests that the introduction of a R-dmet2–/R-dset2–
ligand in place of a Ar,H-edt2– dithiolene has the effect of lowering the energy of the
72
69 68 67
56 63
7170
540
550
560
570
580
590
600
610
620λ m
ax(n
m)
Page 165
Results and Discussion
151
HOMO, and thus increasing the entity of the HOMO-LUMO energy gap. Concerning
complexes 53-55, the ligand bearing a pyrenyl substituent (featured by complex 55)
lowers the energy of the HOMO with respect to corresponding phenyl- and naphthyl-
substituted systems (53 and 54, respectively). The replacement of S with Se as chelating
atom in the 1,2-dichalcogenolene ligand has the same effect of lowering the energy of
the HOMO, as shown by a comparison between 56 and 59 (Figure 3.40).
Figure 3.40. Correlation between the E1/2(+1/0) oxidation potentials (V vs Fc+/Fc) and the λmax of the
solvatochromic absorption (nm) in complexes 53-59 (Scheme 3.6), belonging to Series 1 (R2 =0.93;
Tables 3.27 and 3.29). N^N = 2,2ʹ-bipyridine; E^E = Ar,H-edt2– (rhombs), R-dmet2– (circles), and Me-
dset2– (triangle).
On passing to Series 3 (Scheme 3.8), a linear correlation (R2 = 0.91) can be found
between the λmax values of the solvatochromic absorption and the reduction potentials
E1/2(0/–1). In particular, considering the complexes bearing differently substituted 2,2ʹ-
bipyridine or 1,10-phenanthroline ligands (blue and red symbols, respectively, in Figure
3.41), the introduction of phenyl substituents in the diimine induces a lowering in the
-0.15 -0.10 -0.05 0.00 0.05
Page 166
Results and Discussion
152
energy of the solvatochromic absorption band and shifts the reduction potentials E1/2(0/–
1) to more negative values with respect to unsubstituted system, while alkyl substituents
show the opposite effect. This suggests that the presence of phenyl, or more generally
aryl, substituents at the diimine lowers the energy of the LUMO and thus of the
HOMO-LUMO energy gap with respect to complexes bearing the corresponding
unsubstituted nitrogen ligands, while the presence of alkyl groups increases the energy
gap.
Figure 3.41. Correlation between λmax value of the solvatochromic absorption band (nm) and the
reduction potentials E1/2(0/–1) (V vs Fc+/Fc) for complexes 56, 63, and 67-72 (Scheme 3.8), belonging to
Series 3 (R2 = 0.91; Tables 3.27 and 3.29). S^S = Me-dmet2–; N^N = unsubstituted (rhombs) 2,2ʹ-
bipyridine (blue) or 1,10-phenanthroline (red) and alkyl (circles) or phenyl (triangles) derivatives.
Finally, compound 73, not included in Series 1-3, features the expected solvatochromic
Vis absorption in the range 600-680 nm (Table 3.29), depending on the solvent. This
notwithstanding, the spectral shape of the UV-Vis-NIR spectrum shows features quite
71
70
6356
696768
72
535
545
555
565
575
585
595
605
615
-1,30 -1,25 -1,20 -1,15 -1,10 -1,05
λ max
(nm
)
E 1/2(0/-1) vs Fc+/Fc (V)
-1.80 -1.75 -1.70 -1.65 -1.60 -1.55
Page 167
Results and Discussion
153
different from those of the other complexes, inducing to deepen the investigation by
means of spectroelectrochemical measurements.
3.2.1.5. Spectroelectrochemical measurements
In order to get an insight into the nature of redox processes in complex 73,
spectroelectrochemical measurements were performed at the University of Sheffield,
where the complex was synthesised, using an optically transparent thin-layer electrode
(OTTLE) cell. In particular, in order to determine which of the two oxidation processes
featured by 73 (Figure 3.33) is due to the ferrocenyl substituent, spectroelectrochemical
measurements were performed on 73 and, for the sake of comparison, 53 (Ar = Ph). For
these measurements, solutions of the two complexes and (TBA+)(PF6–) 0.1 M in CH2Cl2
were prepared, and the potentials corresponding to the first oxidation waves (Table
3.27) were applied (Figure 3.42 for 73).
During the oxidation, both complexes underwent an increase in the absorption at about
380 nm accompanied by a progressive disappearing of the band at 600 nm, thus
suggesting that the investigated redox process has the same nature for both complexes.
Thus, for 73 this oxidation can be assigned to the [Pt(diimine)(dithiolate)] system as
previously proposed, while the second one is due to the ferrocenyl pendant.
Page 168
Results and Discussion
154
Figure 3.42. Absorption spectra of the neutral (red) and cationic (blue) form of 73, obtained at the
beginning and the end, respectively, of a OTTLE spectroelectrochemical measurement recorded in
CH2Cl2 at 0.216 V vs Fc+/Fc [298 K; scan rate 100 mV s–1; supporting electrolyte (TBA+)(PF6–) 0.1 M].
3.2.1.6. Emission Spectroscopy
As mentioned in Section 1.3.2.3, [Pt(N^N)(S^S)] complexes are fluorescent in solution,
as reported by Eisenberg and collaborators.127,150a,217
Thus, fluorescence measurements were carried out at room temperature in DMSO on
53-54, 56-61 and 63-73, at concentrations ranging between 3·10–7 and 3·10–5 M.
Measurements could not be performed on 55 and 62, due to the scarce purity of the
complexes.
In particular, these authors
reported that excitation in the range 350-500 nm resulted in a complex emission profile
in the Vis region, with emission maxima in the range 500-800 nm. The energy and
intensity of this emission could be tuned by varying the ligands, the temperature, or the
solvent, and the process was attributed to a MMLLʹCT.
All complexes were investigated by recording emission spectra obtained at excitation
wavelengths corresponding to the absorption maxima observed from UV-Vis
-0,022
-0,002
0,018
0,038
0,058
0,078
0,098
300 400 500 600 700
Abs
orba
nce
Wavelength (nm)
0.140
0.120
0.100
0.080
0.040
0.020
0.000
Page 169
Results and Discussion
155
spectroscopy measurements (Section 3.2.1.4), and thus in the range λexc = 260-600 nm,
but emissive processes were observed just upon excitation in the UV region. Very
similar emission features were observed for all complexes, and in particular excitation
in the range λexc = 260-350 nm resulted in an emission profile in the UV-Vis region
(350-450 nm), with quantum yields Φ ranging between 6·10–3 and 3·10–2 (Table 3.30).
As an example, the absorption and the fluorescence spectra recorded for 53 are
compared in Figure 3.43.
Figure 3.43. Superimposed normalised UV-Vis (260-520 nm) absorption (blue line) and emission (red
line; λexc = 327 nm) spectra recorded for 53 in DMSO solution.
A dependence of the fluorescence intensity If on the concentration C of the solution was
observed, the value of If decreasing when C > 1·10–6 M (Figure 3.44 for 53), possibly
due to self-quenching processes similar to those previously observed for different
[Pt(N^N)(S^S)] complexes.154
0
0,2
0,4
0,6
0,8
1
260 310 360 410 460 510
Nor
mal
ised
abs
orba
nce
Wavelength (nm)
1.0
0.8
0.6
0.4
0.2
0.0
-
-
-
-
-
- N
orm
alis
ed fl
uore
scen
cec
inte
nsity
Page 170
Results and Discussion
156
Figure 3.44. Emission spectra recorded for 53 in DMSO solutions with different concentrations (3·10–7-
3·10–5 M; λexc = 299 m).
The emission spectra show approximately the same profile for all complexes, with two
emission maxima at about 370 and 390 nm, respectively, suggesting the processes
leading to the emission should have the same nature for all the compounds.218
Interestingly, the emission energy is not affected by the nature of the ligand, while the
fluorescence intensity varies upon changing both the diimine and the 1,2-
dichalcogenolene ligand.
0
20
40
60
80
100
120
140
160
180
200
350 400 450 500 550
Fluo
resc
ence
Inte
nsity
(a.u
.)
Wavelength (nm)
3x10-51.5x10-50.7x10-53x10-61.5x10-63x10-7
C = 3.0·10-5 M
C = 1.5·10-5 M
C = 0.7·10-5 M
C = 3.0·10-6 M
C = 1.5·10-6 M
C = 3.0·10-7 M
Page 171
Results and Discussion
157
Figure 3.45. Emission spectrum recorded for 70 in DMSO solution (dotted line) decomposed into five
constituent Gaussian curves (Table 3.30; C = 3·10–6 M, λexc = 350 nm.).
In fact, an examination of fluorescence quantum yields Φ, determined for all complexes
relative to anthracene in ethyl alcohol (C = 1-5·10–6; λexc = 334-359 nm) by calculating
the integrated emission intensity of both the sample and the reference through a
decomposition of the spectra in their constituents Gaussian curves (Table 3.30; Figure
3.45 for 70), shows that for complexes 60, 61 and 63-66 (Series 2, Scheme 3.7),
featuring a 1,10-phenanthroline ligand, the fluorescence intensity is systematically
larger than in corresponding complexes bearing a 2,2-bipyridine (53, 54 and 56-59,
Series 1; Scheme 3.6).219
0
10
20
30
40
50
350 400 450 500 550 600
Fluo
resc
ence
Inte
nsity
(a.u
.)
Wavelength (nm)
Page 172
Results and Discussion
158
Tab
le 3
.30.
Res
ults
fro
m t
he d
ecom
posi
tion
of t
he D
MSO
sol
utio
n flu
ores
cenc
e sp
ectr
a (3
00-6
00 n
m)
reco
rded
for
53-
73 i
n fiv
e co
nstit
uent
Gau
ssia
n
com
pone
nts,
and
rela
tive
quan
tum
yie
lds
( Φ).
Each
cur
ve is
des
crib
ed in
term
s of
wav
elen
gth
posi
tion
(λ, n
m),
full
wid
th a
t hal
f max
ima
(w, n
m) a
nd r
elat
ive
inte
nsity
(h).
Page 173
Results and Discussion
159
3.2.1.7. DFT calculations
As mentioned in Section 1.3.2.3, the use of DFT as a tool for investigating the
electronic structure of diimine-dithiolate complexes and identifying charge-transfer
transitions was recently reviewed.152 This notwithstanding, the availability of a
complete set of structural, spectroscopic and electrochemical data for twenty-one
completely new [Pt(N^N)(E^E)] complexes synthesised and characterised in this work
represented a challenging opportunity to investigate in-depth the electronic features of
this class of compounds at DFT195 level.
In order to determine an appropriate computational setup for this class of complexes,
preliminary calculations were performed on 56, by adopting different functionals (both
pure and hybrid) and various basis sets for the platinum atom (all featuring effective
core potentials to account for relativistic effects),200 while the all-electron double-ζ basis
sets (BSs) with polarisation functions from Schäfer, Horn, and Ahlrichs199 were
exploited for light atomic species (C, H, N, S, Se, and Fe). The comparison between the
optimised geometries obtained with different combinations of functionals and basis sets
on the Pt atom, and the crystal structure of complex 57 (differing from 56 just for the
presence of an ethyl in place of a methyl at the 1,2-dithiolene fragment), and between
the simulated and experimental electronic spectra of 56, allowed for identifying the best
computational setup for these systems. Neglecting here the details of this setup,
summarised in Annex A, the calculated data in best agreement with the experimental
ones were obtained by adopting the hybrid PBE0 (PBE1PBE) functional by Adamo and
Barone,220 and the CRENBL+ECP basis set,221 and therefore this computational setup
was adopted for all the complexes included in this theoretical study. Moreover, given
the solvent-dependence of some features of these complexes (see above), implicit
solvation calculations were also carried out at the same level of theory, by using the
Page 174
Results and Discussion
160
pure integral equation formalism of the polarisable continuous model (IEF-PCM) within
the Self Consistent Reaction Field (SCRF) approach.222
3.2.1.7.1. Geometry Optimisation
The geometry of complexes 53-73 were optimised both in the gas phase and under the
effect of the electric field of dichloromethane, modelled by using the IEF-PCM model
of SCRF theory. As an example, the optimised geometry of 53 in the gas phase is
depicted in Figure 3.46.
Figure 3.46. Molecular drawing and atom labeling scheme of 53 at the optimised geometry in the gas
phase.
Selected optimised bond lengths and angles for the twenty-one model compounds in the
gas phase and in CH2Cl2 are listed in Table 3.31, and show that, in the presence of the
solvent, the structural parameters are affected by small variations (usually smaller than
0.02 Å and 1° for distances and angles, respectively) with respect to the ones optimised
in the gas phase. In particular, in the presence of the solvent a lengthening of Pt-E, Pt-N,
Pt
S2
S1 C1
C4
C3
C2
N1
N2
C5
C6 C7 C8
C9
C10 C11 C12
C13 C14
C15
C16 C17
C18
Page 175
Results and Discussion
161
and E-C distances occurs (E = S, Se). A comparison of the gas-phase optimised
parameters with the corresponding structural data determined by single crystal X-ray
diffraction for 57-59, 64, 67 and 69, discussed in Section 3.2.1.2, shows a very good
agreement between the two sets of data, only the Pt-E (E = S, Se) distances being
slightly overestimated (by less than 0.08 Å, Table 3.31). Moreover, a very good
agreement was found between the average optimised bond lengths and angles for the
sulphured model complexes (54-58, 60-65, and 67-73) and corresponding experimental
mean values found for the crystal structures of the [Pt(N^N)(S^S)] complexes reported
so far (Section 1.3.2.2), as summarised in Table 3.32.
Page 176
Results and Discussion
162
Table 3.31. Selected optim
ised bond lengths (Å) and angles (°) for complexes 53-73
a in the gas phase and in CH2 C
l2 (in parentheses). b
Num
bering scheme as in Figure 3.22.
a E = S (53-58, 60-65, 67-73), Se (59, 66). b IEF-PCM
SCR
F model.
Page 177
Results and Discussion
163
Table 3.32. Selected experimental and optimised average bond distances (Å) and angles (°) for
[Pt(N^N)(S^S)] complexes.
Pt-E Pt-N E-C C-C S-Pt-S N-Pt-N
Experimentala 2.256 (14) 2.046(10) 1.744(23) 1.373(41) 89.38(8) 79.22(8)
Optimisedb 2.275 2.046 1.739 1.360 89.64 79.65 a Mean values on 26 crystal structures deposited at the CCDC; b Mean values of the optimised parameters calculated for complexes 53-58, 60-65, and 67-73.
As found experimentally, the optimised geometries of complexes 53-73 show the metal
coordinated in a square-planar fashion, with the complexes completely planar but for
the substituents (Figure 3.46 and Table 3.31). For complexes 53-55 and 60-62, the
torsion angles of the aromatic substituents at the 1,2-dithiolene ligand (dihedral angle
C1-C2-C13-C14 in Figure 3.46) range between 28 and 57° depending on the nature of
the aryl group [in agreement with what found for gold bis(1,2-dithiolene) complexes 20-
22, bearing the same ligands, Section 3.1.6.1], and undergo a reduction of about 2°
when calculations are performed under the electrostatic field of CH2Cl2 (Table 3.31).
Complexes 59 and 66, featuring the Me-dset2– ligand, show Pt-E and C-E distances
longer (by about 0.1 and 0.12 Å, respectively, both in the gas phase and in CH2Cl2) with
respect to corresponding sulphured complexes 56 and 63, in agreement with structural
data, due to the larger size of Se compared to S (Table 3.31). According to what found
experimentally for complexes 57 and 64, all the compounds featuring a 2,2ʹ-bipyridine
ligand show optimised Pt-S and Pt-N bond lengths systematically longer and shorter,
respectively, than those of complexes bearing a 1,10-phenanthroline, both in the gas
phase and in CH2Cl2 (Table 3.31). Moreover, focusing on Series 3 (Scheme 3.8), in
complexes with aryl- and alkyl-substituted N^N ligands, the Pt-N distances are shorter
and longer, respectively, than in unsubstituted systems.
Page 178
Results and Discussion
164
As far as complexes 53-58 are regarded, a dependence of the bond lengths at the
coordination core on the nature of the 1,2-dithiolene ligand can be observed, being Pt-S
and Pt-N distances systematically longer and shorter, respectively, for complexes
featuring a Ar,H-edt2– ligand than for the ones with a R-dmet2– system (Table 3.31 and
Figure 3.47 for calculations performed in the gas phase).
Figure 3.47. Optimised Pt-S (blue) and Pt-N (red) distances (Å) for complexes 53-58 in the gas phase
(Table 3.31). N^N = 2,2ʹ-bipyridine; S^S = Ar,H-edt2– (rhombs) or R-dmet2– (circles).
Complex 73 features optimised parameters very similar to those of 53-55 (Table 3.31).
In order to get a deeper insight into the dependence of the complexes’ features on the
nature of the solvent, solvation DFT calculations were performed on 56 at the same
level of theory discussed above, simulating the seven other solvents adopted for
absorption spectroscopy measurements (Table 3.29), namely CHCl3, CH3CN, acetone,
THF, DMF, DMSO, and toluene. As summarised in Table 3.33, optimised parameters
vary only slightly upon changing the solvent, the Pt-S distances being the most affected
(by only 0.01 Å), and showing the largest values in DMSO and DMF.
53 54 5558 56 57
2,00
2,05
2,10
2,15
2,20
2,25
2,30
Bon
d le
ngth
(Å)
2.30
2.25
2.20
2.15
2.10
2.05
2.00
Page 179
Results and Discussion
165
Table 3.33. Selected optimised bond lengths (Å) and angles (°) for complex 56 in different solvents.a,b
CH2Cl2 CHCl3 CH3CN Acetone THF DMF DMSO Toluene
Pt-S1 2.299 2.297 2.301 2.301 2.299 2.301 2.302 2.292
Pt-S2 2.298 2.296 2.300 2.300 2.298 2.300 2.301 2.292
Pt-N1 2.051 2.050 2.052 2.052 2.051 2.052 2.052 2.048
Pt-N2 2.049 2.048 2.050 2.050 2.049 2.050 2.049 2.045
S1-C1 1.744 1.744 1.744 1.744 1.744 1.745 1.745 1.742
S2-C2 1.740 1.739 1.740 1.740 1.739 1.740 1.740 1.737
C1-C2 1.361 1.360 1.361 1.361 1.361 1.361 1.361 1.360
S1-Pt-S2 90.38 90.38 90.38 90.37 90.38 90.38 90.39 90.31
N1-Pt-N2 79.56 79.56 79.57 79.58 79.57 79.57 79.59 79.55
N1-Pt-S1-C2 180.00 180.00 180.00 180.00 180.00 180.00 180.00 180.00 a IEF-PCM SCRF model. b Atom labeling scheme as in Figure 3.46.
3.2.1.7.2. Ground State (GS)
The description of the ground-state (GS) bonding scheme of 53-73 based on DFT
calculations is in agreement with results of previous calculations carried out on
[Pt(N^N)(S^S)] complexes.152 In Figure 3.48, the frontier KS-MO scheme calculated in
the gas phase for 56 is depicted, while in Figure 3.49 the contributions from the central
platinum atom and the two ligands to the composition of each MO are summarised.
Page 180
Results and Discussion
166
Figure 3.48. KS-MO scheme and isosurface drawings calculated for 56 in the gas phase (Cs point group).
Contour value = 0.05 e.
Accordingly to what reported in the literature,152 the highest occupied molecular orbital
(orbital 99 in Figures 3.48 and 3.49), is a π MO predominantly localised on the S^S
ligand, with only a minor participation of Pt 5d character (3%), while the LUMO
(orbital 100 in Figures 3.48 and 3.49) is calculated to be almost exclusively located on
the diimine, with a contribution of the metal similar to that observed for the HOMO
(6%).
-7
-6
-5
-4
-3
-2
-1
0K
ohn-
Sham
eig
enva
lues
(eV
)
99 a2
100 a2
97 a2
98 a1
101 a2
102 a2
103 a1
Page 181
Results and Discussion
167
Figure 3.49. Frontier molecular orbital (KS-MOs 90-105; HOMO = 99, LUMO = 100) composition
calculated for 56 in the gas phase [fragments: platinum atom (yellow); S^S ligand (red); N^N ligand
(blue)].
As summarised in Table 3.34 for calculations performed in the gas phase, no significant
differences can be found in the composition of frontier MOs for the twenty-one
complexes studied. As concerns Series 1 (complexes 53-59, Scheme 3.6), including
complexes all featuring the same N^N ligand and differing in the nature of the E^E one,
the LUMO composition is roughly the same for all complexes, while the HOMO
undergoes slight changes upon varying the 1,2-dichalcogenolene ligand.
Page 182
Results and Discussion
168
Table 3.34. Calculated eigenvalues E (eV) and composition (%) of frontier KS-MOs for complexes 53-73
in the gas phase in terms of the central Pt atom and of the N^N and E^E ligands.
E N^N E^E Pt
53 HOMO -4.47 14 79 6 LUMO -2.64 83 10 6
54 HOMO -4.86 14 80 6 LUMO -2.54 84 10 6
55 HOMO -4.57 14 79 7 LUMO -2.69 84 10 6
56 HOMO -4.49 11 86 3 LUMO -2.98 84 11 6
57 HOMO -4.48 11 86 3 LUMO -2.98 84 11 6
58 HOMO -4.49 11 86 3 LUMO -2.96 84 10 6
59 HOMO -4.57 10 88 3 LUMO -3.02 85 9 6
60 HOMO -4.44 14 80 6 LUMO -2.61 84 10 7
61 HOMO -4.47 13 80 6 LUMO -2.64 84 9 6
62 HOMO -4.53 13 80 7 LUMO -2.64 84 9 6
63 HOMO -4.43 11 87 3 LUMO -2.93 84 10 6
64 HOMO -4.44 10 87 3 LUMO -2.94 84 10 6
65 HOMO -4.45 10 87 3 LUMO -2.91 85 9 6
66 HOMO -4.53 9 88 3 LUMO -2.97 86 9 6
67 HOMO -4.37 10 87 3 LUMO -2.80 85 9 6
68 HOMO -4.33 10 87 3 LUMO -2.78 86 9 5
69 HOMO -4.49 11 86 3 LUMO -2.98 84 11 6
70 HOMO -4.39 12 86 3 LUMO -2.92 83 11 6
71 HOMO -4.34 10 87 3 LUMO -2.84 85 9 6
72 HOMO -4.20 8 89 3 LUMO -2.66 99 0 1
73 HOMO -4.24 12 82 6 LUMO -2.38 86 8 5
Page 183
Results and Discussion
169
Table 3.35. Calculated eigenvalues E (eV) and composition (%) of frontier MOs for complexes 53-73 in
CH2Cl2 in terms of the central Pt atom and of the N^N and E^E ligands.
E N^N E^E Pt 53 HOMO -4.87 7 84 9
LUMO -2.54 91 4 5 54 HOMO -4.50 7 84 9
LUMO -2.68 91 4 5 55 HOMO -4.91 7 83 10
LUMO -2.54 91 4 5 56 HOMO -4.90 5 90 5
LUMO -2.68 92 3 4 57 HOMO -4.89 5 90 5
LUMO -2.68 92 3 4 58 HOMO -4.90 5 90 5
LUMO -2.67 92 3 4 59 HOMO -5.00 4 91 5
LUMO -2.69 93 3 4 60 HOMO -4.86 7 84 9
LUMO -2.50 92 4 5 61 HOMO -4.87 7 84 9
LUMO -2.54 92 4 5 62 HOMO -4.53 13 80 7
LUMO -2.64 84 9 6 63 HOMO -4.88 4 91 5
LUMO -2.64 93 3 4 64 HOMO -4.89 4 91 5
LUMO -2.64 93 3 4 65 HOMO -4.90 4 90 5
LUMO -2.64 93 3 4 66 HOMO -4.99 4 91 5
LUMO -2.65 93 3 4 67 HOMO -4.87 4 90 5
LUMO -2.56 93 3 4 68 HOMO -4.85 4 90 6
LUMO -2.50 94 3 4 69 HOMO -4.84 4 90 5
LUMO -2.98 94 3 4 70 HOMO -4.87 5 90 5
LUMO -2.75 92 3 5 71 HOMO -4.86 5 90 5
LUMO -2.69 92 3 4 72 HOMO -4.81 4 91 6
LUMO -2.37 99 0 0 73 HOMO -4.74 6 85 9
LUMO -2.34 93 3 4
Page 184
Results and Discussion
170
Calculations carried out in the presence of the reaction field due to different solvents for
56 show that both the composition and the eigenvalues of the frontier MOs are very
scarcely affected by the nature of the solvent (Table 3.36).
Table 3.36. Calculated eigenvalues E (eV) and composition (%) of frontier MOs for complexes 56 in
different solvents,a in terms of the central Pt atom and of the N^N and E^E ligand.
E N^N S^S Pt CH2Cl2 HOMO -4.90 5 90 5
LUMO -2.68 92 3 4 CHCl3 HOMO -4.81 5 90 5
LUMO -2.73 92 4 5 CH3CN HOMO -4.99 4 90 6
LUMO -2.63 93 3 4 Acetone HOMO -4.97 5 90 5
LUMO -2.65 93 3 4 DMF HOMO -4.99 4 90 6
LUMO -2.63 93 3 4 DMSO HOMO -5.00 4 90 6
LUMO -2.63 93 3 4 THF HOMO -4.88 5 90 5
LUMO -2.69 92 3 4 Toluene HOMO -4.66 7 90 4
LUMO -2.83 89 6 5 a IEF-PCM SCRF model.
In Table 3.37 the HOMO-LUMO energy gaps calculated in the gas phase and in CH2Cl2
for the twenty-one model complexes are reported.
Page 185
Results and Discussion
171
Table 3.37. HOMO-LUMO energy gaps (eV) calculated for complexes 53-73 in the gas phase and in
CH2Cl2.a
Gas phase CH2Cl2 53 1.83 2.33 54 1.82 2.32 55 1.88 2.37 56 1.51 2.22 57 1.50 2.21 58 1.53 2.23 59 1.55 2.31 60 1.83 2.36 61 1.83 2.33 62 1.89 2.39 63 1.50 2.24 64 1.50 2.25 65 1.54 2.26 66 1.56 2.34 67 1.57 2.31 68 1.55 2.35 69 1.51 2.36 70 1.47 2.12 71 1.50 2.17 72 1.54 2.44 73 1.86 2.40
a IEF-PCM SCRF model.
In this context, it is worth recalling that, although Koopman’s theorem does not apply to
DFT, it is widely accepted that the energy difference ΔE between the HOMO and the
LUMO can be considered as a valuable parameter, provided that similar systems are
considered.223 Among complexes featuring Ar,H-edt2– ligands, 55 and 62 (where Ar =
Pyr) show larger HOMO-LUMO energy gaps with respect to their phenyl- and
naphthyl-substituted analogues. As regards the complexes containing Me-dmet2– and
Me-dset2– ligands, the latter confers to complexes 59 and 66 a larger ΔE between the
HOMO and the LUMO with respect to the corresponding sulphured complexes (Table
3.37). In both cases, these features are due to the stabilisation of the HOMO, and these
considerations are in perfect agreement with experimental electrochemical data,
Page 186
Results and Discussion
172
showing that, among complexes 53-55 and 60-62, the ones featuring pyrenyl
substituents are the most hardly oxidisable, suggesting their HOMO lies at lower
energies (Table 3.27 and Figure 3.31), while complexes 56-58 and 63-65 undergo the
oxidation process at less positive potentials with respect to 59 and 66 (Figure 3.31 and
Table 3.27). Within Series 3 (Scheme 3.8), complexes 70 and 71 (featuring phenyl-
substituted diimines) show smaller HOMO-LUMO energy gaps with respect to the
corresponding complexes featuring unsubstituted N^N ligands, because of the
stabilisation of the LUMO, and accordingly, experimental reduction potentials are less
negative (Figure 3.32 and Table 3.27). Opposite considerations can be drawn for
complexes with alkyl-substituted diimines, also in this case in agreement with
electrochemical measurements (Figure 3.32 and Table 3.27). It is worth noting that
when the presence of CH2Cl2 is taken into account, the HOMO-LUMO energy gap is
systematically increased by about 0.8 eV with respect to the value calculated in the gas
phase (Table 3.37). As predictable, a dependence of the ΔE between the HOMO and the
LUMO on the nature of the solvent field applied can also be found, the HOMO-LUMO
energy gap being larger in relatively polar solvents (∆E = 2.22, 2.08, 2.36, 2.32, 2.19,
2.36, 2.37, and 1.83 eV in CH2Cl2, CHCl3, CH3CN, acetone, THF, DMF, DMSO, and
toluene, respectively for 56).
Page 187
Results and Discussion
173
3.2.1.7.3. Charges
In Table 3.38, the results of a Mulliken charge analysis224 are summarised for 53-73. In
particular, the charges Q on the central platinum ion, the coordinating N and E atoms (E
= S, Se), and the whole ligands are reported. Although it is well known that Mulliken
analysis overemphasises the charge separation,225
an examination of the calculated
charges allows to draw some general considerations. The 1,2-dichalcogenolato ligands,
in agreement with their character of dichalcogenolates, feature for all complexes
negative charges of about -0.6 e, while the diimines bear a positive charge of about 0.1-
0.2 e, the remaining positive charge (0.3-0.4 e) being carried by the metal. Thus, all
complexes feature a large charge separation between the two ligands of 0.6-0.8 e (Table
3.38). As concerns Series 1 (Scheme 3.6), the complexes featuring a R-dmet2– ligand
show negative charges on the S^S fragment slightly more negative than those calculated
for complexes 53-55, and accordingly, a larger charge separation can be found for these
systems. Among complexes 56-59, the selenated complex 59 features the smallest
charge separation (Table 3.38). On the other hand, in complexes of Series 3 (Scheme
3.8), the substituted diimines are found to be more positively charged than unsubstituted
ones, and subsequently the charge separation in the corresponding complexes is larger.
Page 188
Results and Discussion
174
Table 3.38. Mulliken charges Q (e) calculated on Pt, E1, E2, N1, N2, the dichalcogenolate (E^E), and the
diimine (N^N) for 53-73 in the gas phase.a
Q(Pt) Q(N1) Q(N2) Q(E1) Q(E2) Q(N^N) Q(E^E)
53 0.376 -0.370 -0.371 -0.201 -0.208 0.124 -0.500
54 0.377 -0.370 -0.371 -0.201 -0.207 0.129 -0.506
55 0.371 -0.369 -0.369 -0.178 -0.216 0.135 -0.505
56 0.399 -0.371 -0.371 -0.180 -0.208 0.166 -0.565
57 0.398 -0.371 -0.371 -0.181 -0.205 0.166 -0.564
58 0.391 -0.370 -0.371 -0.182 -0.182 0.169 -0.560
59 0.332 -0.356 -0.355 -0.076 -0.128 0.179 -0.512
60 0.372 -0.355 -0.356 -0.207 -0.200 0.132 -0.504
61 0.372 -0.355 -0.356 -0.200 -0.206 0.138 -0.510
62 0.366 -0.354 -0.355 -0.177 -0.214 0.144 -0.510
63 0.393 -0.357 -0.358 -0.203 -0.246 0.175 -0.568
64 0.393 -0.356 -0.357 -0.179 -0.202 0.177 -0.570
65 0.387 -0.355 -0.356 -0.179 -0.179 0.179 -0.566
66 0.329 -0.342 -0.343 -0.129 -0.077 0.190 -0.519
67 0.396 -0.364 -0.363 -0.190 -0.258 0.198 -0.593
68 0.393 -0.369 -0.369 -0.216 -0.259 0.205 -0.598
69 0.392 -0.365 -0.365 -0.192 -0.262 0.217 -0.610
70 0.400 -0.375 -0.374 -0.182 -0.254 0.173 -0.573
71 0.396 -0.360 -0.361 -0.182 -0.209 0.190 -0.586
72 0.387 -0.347 -0.348 -0.196 -0.218 0.237 -0.624
73 0.370 -0.365 -0.365 -0.212 -0.225 0.165 -0.536 a Numbering Scheme as in Figure 3.46.
Page 189
Results and Discussion
175
Table 3.39. Mulliken charges Q (e) calculated on Pt, E1, E2, N1, N2, the dichalcogenolate ligand (E^E),
and the diimine one (N^N) for 53-73 in CH2Cl2.a
Q(Pt) Q(N1) Q(N2) Q(S1) Q(S2) Q(N^N) Q(E^E)
53 0.355 -0.359 -0.359 -0.271 -0.271 0.333 -0.689
54 0.377 -0.360 -0.359 -0.270 -0.269 0.336 -0.713
55 0.351 -0.359 -0.359 -0.246 -0.281 0.334 -0.685
56 0.389 -0.360 -0.360 -0.240 -0.252 0.394 -0.783
57 0.389 -0.360 -0.360 -0.240 -0.249 0.394 -0.784
58 0.387 -0.360 -0.360 -0.239 -0.336 0.392 -0.779
59 0.333 -0.348 -0.347 -0.148 -0.183 0.401 -0.734
60 0.351 -0.346 -0.346 -0.268 -0.268 0.337 -0.688
61 0.351 -0.346 -0.346 -0.267 -0.266 0.340 -0.691
62 0.347 -0.346 -0.346 -0.277 -0.243 0.338 -0.685
63 0.383 -0.347 -0.347 -0.246 -0.349 0.397 -0.780
64 0.385 -0.347 -0.347 -0.245 -0.236 0.396 -0.782
65 0.384 -0.347 -0.347 -0.235 -0.237 0.394 -0.778
66 0.330 -0.336 -0.336 -0.181 -0.146 0.402 -0.732
67 0.384 -0.353 -0.354 -0.246 -0.257 0.412 -0.796
68 0.382 -0.361 -0.361 -0.246 -0.258 0.422 -0.804
69 0.379 -0.358 -0.358 -0.258 -0.246 0.424 -0.804
70 0.389 -0.365 -0.365 -0.240 -0.250 0.394 -0.783
71 0.387 -0.352 -0.353 -0.248 -0.238 0.398 -0.784
72 0.373 -0.343 -0.343 -0.246 -0.256 0.435 -0.809
73 0.342 -0.357 -0.357 -0.266 -0.289 0.413 -0.755 a Numbering Scheme as in Figure 3.46.
Page 190
Results and Discussion
176
Calculations performed in CH2Cl2 show an increase of about 0.4 e in the charge
separation between the ligands (Table 3.39).
The charge separation shows a solvent-dependence as well, as testified by calculations
performed under the reaction field of different solvents for 56 (Table 3.40).
Table 3.40. Mulliken charges Q (e) calculated on Pt, the dithiolate ligand (S^S), and the diimine one
(N^N) for 56 in different solvents.a
Q(Pt) Q(N^N) Q(S^S)
CH2Cl2 0.389 0.394 -0.783
CHCl3 0.392 0.363 -0.755
CH3CN 0.385 0.421 -0.806
Acetone 0.386 0.415 -0.801
DMF 0.385 0.421 -0.807
DMSO 0.385 0.424 -0.809
THF 0.390 0.387 -0.777
Toluene 0.395 0.302 -0.697 a IEF-PCM SCRF model.
It is worth underlining that the trends of the atomic charges calculated through a Natural
Population Analysis (NPA)226
are in agreement with those found for the Mulliken
analysis, both in the gas phase and in CH2Cl2 (Tables 3.41 and 3.42, respectively).
Page 191
Results and Discussion
177
Table 3.41. NPA charges Q (e) calculated on Pt, E1, E2, N1, N2, the dichalcogenolate (E^E), and the
diimine (N^N) for 53-73 in the gas phase.a
Q(Pt) Q(N1) Q(N2) Q(S1) Q(S2) Q(N^N) Q(E^E)
53 0.083 -0.452 -0.452 -0.003 0.024 0.267 -0.350
54 0.084 -0.452 -0.452 -0.005 0.025 0.272 -0.356
55 0.080 -0.451 -0.452 0.005 0.013 0.278 -0.358
56 0.118 -0.450 -0.448 -0.021 0.030 0.304 -0.423
57 0.117 -0.445 -0.450 0.030 -0.019 0.304 -0.422
58 0.111 -0.450 -0.449 0.029 0.004 0.306 -0.418
59 0.051 -0.452 -0.454 0.074 0.133 0.305 -0.357
60 0.081 -0.449 -0.449 0.023 -0.004 0.274 -0.355
61 0.082 -0.449 -0.449 -0.005 0.025 0.279 -0.361
62 0.078 -0.448 -0.448 0.012 0.004 0.285 -0.363
63 0.114 -0.445 -0.448 0.030 -0.014 0.311 -0.425
64 0.115 -0.445 -0.448 -0.019 0.030 0.314 -0.429
65 0.109 -0.446 -0.447 0.028 -0.153 0.315 -0.425
66 0.049 -0.448 -0.451 0.074 0.132 0.314 -0.363
67 0.119 -0.444 -0.441 0.021 -0.029 0.334 -0.453
68 0.115 -0.453 -0.451 0.019 -0.031 0.344 -0.459
69 0.114 -0.449 -0.451 -0.035 0.015 0.357 -0.471
70 0.119 -0.454 -0.451 0.029 -0.023 0.311 -0.431
71 0.116 -0.447 -0.449 -0.026 0.025 0.329 -0.445
72 0.110 -0.442 -0.444 0.010 -0.032 0.375 -0.485
73 0.081 -0.452 -0.453 -0.028 0.002 0.311 -0.391 a Numbering Scheme as in Figure 3.46.
Page 192
Results and Discussion
178
Table 3.42. NPA charges Q (e) calculated on Pt, E1, E2, N1, N2, the dichalcogenolate (E^E), and the
diimine (N^N) for 53-73 in CH2Cl2.a,b
Q(Pt) Q(N1) Q(N2) Q(S1) Q(S2) Q(N^N) Q(E^E)
53 0.081 -0.450 -0.450 -0.082 -0.048 0.459 -0.540
54 0.081 -0.450 -0.450 -0.046 -0.082 0.461 -0.543
55 0.079 -0.450 -0.449 -0.072 -0.061 0.460 -0.539
56 0.128 -0.446 -0.445 -0.042 -0.075 0.514 -0.642
57 0.128 -0.446 -0.445 -0.042 -0.074 0.515 -0.642
58 0.124 -0.446 -0.445 -0.042 -0.057 0.512 -0.636
59 0.061 -0.451 -0.450 0.057 0.019 0.506 -0.567
60 0.079 -0.447 -0.447 -0.047 -0.047 0.460 -0.539
61 0.080 -0.447 -0.447 -0.081 -0.045 0.462 -0.542
62 0.077 -0.447 -0.447 -0.058 -0.071 0.461 -0.539
63 0.123 -0.442 -0.443 -0.039 -0.066 0.514 -0.637
64 0.125 -0.442 -0.443 -0.071 -0.039 0.515 -0.640
65 0.123 -0.443 -0.443 -0.040 -0.055 0.512 -0.634
66 0.059 -0.447 -0.448 0.022 0.060 0.505 -0.564
67 0.127 -0.441 -0.439 -0.046 -0.079 0.528 -0.654
68 0.123 -0.452 -0.451 -0.049 -0.082 0.541 -0.663
69 0.120 -0.449 -0.450 -0.082 -0.049 0.543 -0.663
70 0.125 -0.450 -0.449 -0.041 -0.068 0.515 -0.640
71 0.123 -0.444 -0.446 -0.068 -0.041 0.520 -0.642
72 0.116 -0.443 -0.444 -0.049 -0.076 0.551 -0.666
73 0.072 -0.453 -0.453 -0.093 -0.070 0.486 -0.558 a Numbering Scheme as in Figure 3.46. b IEF-PCM SCRF model.
Page 193
Results and Discussion
179
3.2.1.7.4. Time-Dependent DFT (TD-DFT) calculations
Time dependent DFT (TD-DFT) calculations were carried out on complexes 53-73 at
their optimised geometries in their GSs, both in the gas phase and in CH2Cl2, at the
same level of theory discussed above. As expected based on the UV-Vis-NIR
spectroscopic measurements (Section 3.2.1.4), a comparison between simulated and
experimental spectra shows a much better agreement for solvation calculations than for
the ones performed in the gas phase, and thus just the results obtained by adopting the
continuum SCRF approach will be discussed in this case.
As an example, in Table 3.43 the main vertical electronic transitions calculated for 56 in
CH2Cl2 are summarised, along with the most relevant MO contributions to each one-
electron excitation.
Page 194
Results and Discussion
180
Table 3.43. Principal electronic transitions (f > 0.015) calculated for 56 in CH2Cl2 at (IEF-PCM SCRF)
TD-DFT level. For each transition, the excitation energy E (eV) the absorption wavelength λ (nm), the
oscillator strenght f, and the molecular orbital composition of the excited-state functions, along with the
fragments where the involved KS-MOs are mainly localised, are reported.
Exc. State E λ f Compositiona % Molecular fragmentsb
S1 1.675 740.0 0.144 99→100 99 S^S(90%)→N^N(92%)
S5 2.765 448.4 0.015 97→100 12 S^S(67%)+Pt(30%) →N^N(92%)
99→102 86 S^S(90%)→N^N(98%)
S8 3.205 386.8 0.046 96→100 96 S^S(80%)→N^N(92%)
S10 3.664 338.8 0.227 99→104 95 S^S(90%)→S^S(99%)
S14 4.012 309.0 0.065 97→102 91 S^S(67%)+Pt(30%) → N^N(98%)
96→101 5 S^S(80%)→N^N(89%)
S17 4.212 294.4 0.023 96→101 91 S^S(80%)→N^N(89%)
S20 4.302 288.2 0.055 94→100 36 N^N(92%)→ N^N(92%)
96→102 58 S^S(80%)→ N^N(98%)
S23 4.465 277.6 0.186 93→100 57 Pt(50%)+S^S(37%)→ N^N(92%)
94→100 13 N^N(92%)→ N^N(92%)
S24 4.479 276.8 0.265 93→100 18 Pt(50%)+S^S(37%)→ N^N(92%)
94→100 37 N^N(92%)→ N^N(92%)
96→102 24 S^S(80%)→ N^N(98%)
S26 4.532 273.6 0.213 93 →100 15 Pt(50%)+S^S(37%)→ N^N(92%)
98→103 76 N^N(99%)→S^S(39%)+Pt(42%)
S27 4.547 272.7 0.142 92→100 80 S^S(47%)+Pt(34%)→ N^N(92%)
a The molecular orbitals are labelled according to Figure 3.49; b N^N = diimine ligand; S^S = 1,2-
dithiolate ligand.
Page 195
Results and Discussion
181
Electronic transitions calculated at TD-DFT level have been exploited to simulate the
UV-Vis absorption spectra (Figure 3.50 for 56 in CH2Cl2). A comparison between the
simulated and experimental spectra evidences that a very good agreement can be found.
Figure 3.50. Simulated UV-Vis-NIR spectrum (250-900 nm) of 56 in CH2Cl2 (IEF-PCM SCRF) based on
TD-DFT calculations (Table 3.43).
In particular, for all complexes the S0→S1 vertical transition, responsible for the
solvatochromic absorption band evidenced experimentally in the visible region, should
be attributed to an almost pure (92% for 56, Table 3.43) one-electron excitation
involving the frontier molecular-orbitals (KS-MOs 99 and 100 for 56, Table 3.43), in
agreement with what found in the literature. Thus, being the HOMO and the LUMO
mostly localised on the S^S and N^N ligands, respectively, with similar contributions
from the metal, this transition should be considered as an interligand charge-transfer
(ILCT) process from the negatively charged 1,2-dichalcogenolato ligand to the diimine,
featuring a positive partial charge (Section 3.2.1.7.3). Thus, the HOMO-LUMO
0
0,1
0,2
0,3
0,4
0,5
0,6
0,7
0,8
250 350 450 550 650 750 850
Osc
illat
or st
reng
th f
Wavelength (nm)
S1
S10
S23-S24-S26-S27
0.8
0.7
0.6
0.5
0.4
0.3
0.2
0.1
0.0
Page 196
Results and Discussion
182
transition should result in a lowering of the charge separation in the first excited state as
compared to the GS, in agreement with the negative solvatochromism observed
experimentally discussed in Section 3.2.1.4. In Table 3.44, the wavelength of this
transition calculated in CH2Cl2 for complexes 53-73 is reported, and a very good
agreement between the trend of this value and that of the HOMO-LUMO energy gap
calculated at the same level of theory (Table 3.37) can be observed (R2 = 0.97).
Table 3.44. TD-DFT λmax values (nm) of the electronic transition S0→S1 calculated for 53-73 in CH2Cl2
(IEF-PCM SCRF model).
53 703.06
54 705.53
55 690.92
56 739.98
57 742.60
58 736.25
59 708.10
60 696.96
61 699.17
62 685.44
63 734.79
64 732.68
65 727.20
66 700.04
67 706.49
68 694.30
69 688.74
70 775.91
71 754.46
72 667.10
73 701.20
Page 197
Results and Discussion
183
For complexes featuring the same class of E^E ligands, a good agreement can be found
between the experimental and calculated trends of the absorption wavelengths (Tables
3.29 and 3.44). In particular, as regards complexes 53-55 and 60-62, the pyrenyl-
substituted compounds feature the S0→S1 transition at shorter wavelengths with
respect to complexes with Ar = Ph and Naph (Table 3.44), in agreement with the
highest calculated HOMO-LUMO energy gaps (Table 3.37). Within complexes
featuring a R-dmet2–/R-dset2– ligand, both experimental and calculated absorption bands
fall at shorter wavelengths for complexes 59 and 66 with respect to sulphured analogues
(Tables 3.29 and 3.44).
A linear correlation can also be found between the experimental and calculated trends of
the absorption wavelengths within Series 3 (Scheme 3.8). In particular, complexes
bearing 2,2ʹ-bipyridine and 1,10-phenanthroline systems (blue and red symbols,
respectively, in Figure 3.51) with phenyl substituents (70 and 71) feature both the
experimental and calculated absorptions at longer wavelengths with respect to
unsubstituted systems (56 and 63), due to their lower HOMO-LUMO energy gap (Table
3.37), while, on the contrary, λmax is shorter for complexes bearing alkyl-substituted
diimines (67-69, and 72).
Page 198
Results and Discussion
184
Figure 3.51. Experimental and IEF-PCM TD-DFT calculated λmax (nm) of the solvatochromic absorption
band in the visible region for complexes 56, 63, and 67-72, belonging to Series 3 (R2 = 0.94; Tables 3.29
and 3.44). S^S = Me-dmet2–; N^N = unsubstituted (rhombs) 2,2ʹ-bipyridine (blue) or 1,10-phenanthroline
(red) and alkyl (circles) and phenyl (triangles) derivatives.
Moreover, calculations performed in different solvents for 56 (Table 3.45) show, as
predictable, a dependence of the λmax of this absorption on the nature of the solvent,
according to the different values of the calculated HOMO-LUMO energy gaps
discussed above (Table 3.37), and in agreement with the solvatochromism observed
experimentally.
Table 3.45. TD-DFT calculated λmax (nm) of the solvatochromic absorption band for 56 in different
solvents.a
CH2Cl2 CHCl3 CH3CN Acetone THF DMF DMSO Toluene 740 798 689 702 753 690 686 908
a IEF-PCM SCRF model.
5663
686769
70
71
72
560
580
600
620
640
660
680
660 680 700 720 740 760 780 800
Exp
erim
enta
l wav
elen
gth
(nm
)
Calculated wavelength (nm)
Page 199
Results and Discussion
185
In particular, it is worth noting that a linear correlation (R2 = 0.98) holds between the
experimental and calculated trends of λmax for 56 in different solvents (Figure 3.52;
Tables 3.29 and 3.45).
Figure 3.52. Experimental and SCRF TD-DFT calculated λmax (nm) of the solvatochromic absorption
band in the visible region for 56 in different solvents (Tables 3.29 and 3.45).
Concerning the experimental electronic absorptions featured by all complexes in the
region 300-400 nm (Figures 3.34 and 3.35 for 53 and 56, respectively) and calculated at
TD-DFT level in the same spectral region (Figure 3.50 for 56), they should be assigned
to transitions due to monoelectronic excitations occurring between MOs mainly
localised on the E^E ligands. In particular, for 56, the most intense electronic transition
calculated in this spectral region is S0→S10, mainly resulting from a one-electron
excitation between KS-MOs 99 and 104 (HOMO→LUMO+4 excitation), both mainly
localised on the S^S ligand (90 and 99%, respectively; Table 3.43 and Figure 3.50).
DMSO
CH3CN
DMFAcetone
CH2Cl2THF
CHCl3
Toluene
640
690
740
790
840
890
940
990
550 600 650 700 750
Cal
cula
ted
wav
elen
gth
(nm
)
Experimental wavelength (nm)
Page 200
Results and Discussion
186
Finally, the absorptions found in the UV region falling in the range 250-300 nm in both
UV-Vis-NIR experimental and TD-DFT calculated spectra are assigned to electronic
transitions involving MOs mainly localised on the diimine (S1→S23/24/26/27 for 56,
Table 3.43 and Figure 3.50).
Thus, in the spectral region 250-300 nm, an overlap of absorptions due to excitations
involving MOs localised both on the E^E and N^N ligands can be found. Nevertheless,
the emissive processes occurring when the complexes are excited in this wavelength
range (Section 3.2.1.6), should regard exclusively the excitations involving MOs
localised on the N^N ligand, given the very similar emission profiles observed for all
53-73 complexes, which do not seem to be affected by the nature of the E^E ligand, at
least as far as the emission energy is concerned.
3.2.1.7.5. Calculation of static first hyperpolarisability (β)
Static first hyperpolarisabilities (βtot) and static dipole moments (µ) were calculated, at
the same level of theory discussed above, for complexes 53-73, both in the gas phase
and in CH2Cl2, following the same procedure described for complexes 20-22 in Section
3.1.6.5. In order to have an absolute reference to evaluate the order of magnitude of the
βtot values, the same calculations were also undertaken, at the same level of theory, on
[Pt(1,10-phen)(tdt)] (75) at the optimised geometry. In fact, this complex, to the best of
our knowledge, among those whose β have been determined experimentally from
EFISH measurements, showed the largest hyperpolarisability value reported so far (-
37·10–30 esu, Section 1.3.2.4).130c The results are summarised in Table 3.46.
Page 201
Results and Discussion
187
Table 3.46. Static first hyperpolarisabilities βtot (a.u. and esu) and static dipole moments µ (D) calculated
for 53-73 and 75 in the gas phase and in CH2Cl2.
Gas phase CH2Cl2
a
βtot·104 (a.u.)
βtot·10–30 (esu) | µ | (D) βtot·104 (a.u.)
βtot·10–30 (esu) | µ | (D)
53 2.01 174 2.85 3.46 299 4.43
54 1.71 147 4.98 3.45 298 7.63
55 1.76 152 2.29 3.09 267 3.07
56 4.16 360 7.46 4.68 404 11.31
57 4.25 367 7.41 4.74 409 11.22
58 4.29 370 7.98 4.61 398 4.93
59 4.26 368 7.45 3.97 343 11.08
60 2.40 208 4.77 3.74 323 7.37
61 2.06 178 5.16 3.73 322 7.77
62 2.13 184 2.62 3.36 290 3.50
63 4.89 423 5.67 4.83 418 8.59
64 4.94 427 7.59 4.79 414 11.32
65 4.95 428 8.15 4.68 404 12.34
66 4.81 416 7.95 4.06 351 11.66
67 4.30 371 8.01 3.88 335 11.79
68 4.65 402 9.25 3.82 330 13.51
69 5.31 459 6.98 3.94 340 9.95
70 7.68 664 7.85 8.00 691 11.58
71 7.68 664 6.65 6.99 604 9.62
72 5.34 461 6.57 3.38 292 9.29
73 2.65 229 6.22 3.60 311 9.12
75 2.33 201 1.80 3.42 296 3.10 a IEF-PCM SCRF model.
On passing from the gas phase to CH2Cl2, an increase in βtot values is found for most
complexes (βtot = 147-664 and 267-690·10–30 esu in gas phase and CH2Cl2,
respectively).
Page 202
Results and Discussion
188
Both in the gas phase and when the presence of the solvent is implicitly taken into
account, complexes featuring R-dmet2– and R-dset2– ligands show larger
hyperpolarisabilities with respect to the complexes containing the Ar,H-edt2– ligands
(Table 3.46). Within complexes featuring E^E ligands belonging to the same class, no
significant changes can be observed in the value of βtot upon changing the substituent at
the 1,2-dichalcogenoelene core (Figure 3.53 for calculations performed in the gas phase
on 53-59).
Figure 3.53. Static first hyperpolarisabilities βtot (esu) calculated for complexes 53-59 in the gas phase
(Table 3.46): N^N = 2,2ʹ-bipyridine; E^E = Ar,H-edt2– (rhombs), R-dmet2– (circles), Me-dset2– (triangle).
Larger differences are calculated in βtot values when the N^N ligand is varied. In
particular, complexes featuring 1,10-phenanthrolines show static hyperpolarisabilities
systematically larger than corresponding complexes with 2,2ʹ-bipyridines (Figure 3.54
for calculations performed in the gas phase on 56-59 and 63-66).
53 55
54
56 57 59 58
130
180
230
280
330
380
β tot
(x
10-3
0es
u)
Page 203
Results and Discussion
189
Figure 3.54. Static first hyperpolarisabilities βtot (esu) calculated for complexes 56-59 and 63-66 in the
gas phase (Table 3.46). N^N = 2,2ʹ-bipyridine (blue), 1,10-phenanthroline (red); S^S = R-dmet2–
(circles), Me-dset2– (triangles).
Moreover, complexes bearing substituted 2,2ʹ-bipyridine and 1,10-phenanthroline
ligands (blue and red symbols, respectively for gas phase calculations in Figure 3.55)
feature larger values of βtot with respect to unsubstituted ones, in particular as concerns
aryl-substituted complexes 70 and 71 (Table 3.46).
5657 59 58
6364
66 65
350
360
370
380
390
400
410
420
430
440
β tot
(x 1
0-30
esu)
Page 204
Results and Discussion
190
Figure 3.55. Static first hyperpolarisabilities βtot (esu) calculated for complexes 56, 63 and 67-72
belonging to Series 3 in the gas phase (Table 3.46). S^S = Me-dmet2–; N^N = unsubstituted (rhombs) 2,2ʹ-
bipyridine (blue) and 1,10-phenanthroline (red) and alkyl (circles) or phenyl (triangles) derivatives.
Moreover, complexes 70 and 71 feature the largest values of calculated βtot among the
twenty-one complexes under study, thus suggesting these should be the best candidates
for NLO applications. In this context, it is worth noting that the values of βtot calculated
for 53-73 are generally remarkably larger than that computed for 75 (by up to 450·10–30
esu, Table 3.46), further suggesting the complexes considered in the present research
project represent good candidates for applications in the field of NLO.
3.2.1.8. Photoconduction measurements
Given the wavelength-selective photoconductivity coupled to the near-IR absorption
showed in the past by complexes belonging to the classes [M(R,Rʹ-timdt)2]x– and [M(R-
dmet)2]x–, which allowed for the fabrication of solid-state photodetectors operating
between the first and third optical-fibre windows,91 preliminary photoconduction
56 6768
63
69 72
71 70
300
350
400
450
500
550
600
650
700
β tot
(x 1
0-30
esu)
Page 205
Results and Discussion
191
measurements were conducted on one of the twenty-one [Pt(N^N)(E^E)] complexes
synthesised, namely 54, by the group of Prof. Sampietro, at the Politecnico di Milano.
For these measurements, a prototype planar device similar to that depicted in Figure
3.56 was used.
Figure 3.56. Sketch of the typical planar detector prototype used for photoconduction measurements. The
device is connected to a transimpedance amplifier.
In this device, the active material is casted on a quartz substrate with lithographed
gold/chromium electrodes, thus obtaining a metal-semiconductor-metal surface
structure. Complex 54 was casted as a sonicated DMSO solution on a hot quartz
substrate with interelectrode spacings of 6 µm. A detailed view of the sample casted on
the electrodes’ area is represented in Figure 3.57.
Page 206
Results and Discussion
192
Figure 3.57. Optical microscope picture (1000x magnification) of the prototype device obtained by
casting 54 on the quartz substrate with lithographed gold/chromium electrodes, showing the
interelectrode spacings.
The device was irradiated with light pulses lasting 500 µs produced by a set of light
emitting diodes (LEDs) differing in their wavelength (350-800 nm), and the resulting
photocurrents were measured by biasing the device with a voltage source and
connecting it to a transimpedance amplifier. In Figure 3.58, the efficiency η of
photocurrent measurements as a function of incident wavelength λLED is reported,
showing a wavelength selectivity of the photocurrent intensity, so that the device acts as
an intrinsic wavelength-selective photodetector. Interestingly, in the visible region the
highest photocurrent is recorded at about 600 nm, a wavelength corresponding to the
λmax of the solvatochromic absorption band in the visible region featured by 54 (Table
3.29).
Page 207
Results and Discussion
193
Figure 3.58. Efficiency η (%) from photocurrent measurements as a function of the incident wavelength
λLED (nm) for 54.
3.2.2. Synthesis and characterisation of [Au(Py1)(mnt)] (76)
As already mentioned, the heteroleptic noncentrosymmetric complex [Au(Py1)(mnt)]
(76, Py1– = 2-benzylpyridine, mnt2– = maleonitrile-1,2-dithiolato) was synthesised
during the present study, in order to explore further synthetic strategies for the
preparation of NLO-active materials featuring 1,2-dithiolene ligands.
Very few reports on complexes of the type [Au(C^N)(S^S)] can be found in the
literature, and in all cases the C^N ligand is a phenylpyridine (Figure 1.23).129,148,227
129
As
a consequence, the resulting complexes are completely planar but for the substituents,
and, as already mentioned in Section 1.3.3, their spectroscopic features are generally
analogous to those of corresponding [Au(N^N)(S^S)] complexes.
Page 208
Results and Discussion
194
3.2.2.1 Synthesis and Characterisation
The neutral complex was synthesised starting from the corresponding dichloro-complex
[Au(Py1)Cl2] (77, previously reported by Prof. M. A. Cinellu)228
by reaction with
disodium maleonitrile-1,2-dithiolate, according to Scheme 3.15.
Na+S- CN
CNNa+S-H2C Au
N Cl
ClH2C Au
N
S
S CN
CN
CH2Cl2/CH3CN
∆
Scheme 3.15. Synthetic route for the preparation of 76.
The reaction was carried out in CH2Cl2/CH3CN at 130° C by adopting a pressure tube
(Figure 3.59), and the product was obtained as a microcrystalline solid without further
purification steps. Unfortunately, the crystals resulted not suitable for X-ray diffraction,
and notwithstanding numerous attempts of crystallisation, no X-ray quality crystals
were obtained.
Figure 3.59. Pressure tube used for the synthesis of 76.
Page 209
Results and Discussion
195
Cyclic voltammetry (CV) measurements performed in DMSO on 76 show a single
irreversible reduction at -1.20 V vs the Fc+/Fc couple (Figure 3.60).
Figure 3.60. Cyclic voltammetry recorded for a anhydrous DMSO solution of 76 at a platinum electrode
[298 K; scan rate 20 mV s–1; supporting electrolyte (TBA+)(BF4–) 0.1 M)].
A similar electrochemical behavior is shown by the precursor 77, with the irreversible
reduction occurring at an almost identical potential (-1.19 V vs the Fc+/Fc couple). This
suggests that the reduction process is centred on the 2-benzylpyridine system.
The UV-Vis-NIR absorption spectrum (260-1100 nm) recorded for 76 in DMF shows
two main absorption bands with λmax at 268 and 349 nm (ε = 35000 and 8000 M–1 cm–1,
respectively, Figure 3.61), and no absorptions in the visible region, in contrast with
what previously reported for other [Au(N^C)(S^S)] and [Au(N^N)(S^S)] reported so
far, such as 19 and [Au(2,2ʹ-bipy)(tdt)].129
-1,5 -1,0 -0,5 0,0
I(A
)
E (V vs Fc+/Fc)
10 µA
-1.5 -1.0 -0.5 0.0
Page 210
Results and Discussion
196
Figure 3.61. UV-Vis absorption spectrum (260-720 nm) recorded for 76 in DMF.
Fluorescence measurements carried out in DMSO, in the range λexc = 260-350 nm,
showed an emission profile in the visible region, with maxima at λem = 372 and 390 nm.
(Quantum yield Φ = 9.9·10–3; Figure 3.62). Emission processes in the same spectral
region were reported for the related complex 19, but in the case of this system
fluorescence was reported to occur in the solid state only, and was not observed in
solution.129 On the other hand, the luminescence features of 76 are very similar to those
of [Pt(N^N)(E^E)] complexes described above (Section 3.2.1.6).
0,0
0,2
0,4
0,6
0,8
1,0
1,2
260 360 460 560 660
Abs
orba
nce
Wavelenght (nm)
1.2
1.0
0.8
0.6
0.4
0.2
0.0
Page 211
Results and Discussion
197
Figure 3.62. Emission spectrum recorded for 76 in DMSO solution (λexc = 299 m).
3.2.2.2. DFT calculations
An examination of the literature shows that, to the best of our knowledge, no
computational investigation has been reported to date on complexes belonging to the
general class [Au(C^N)(S^S)].
Theoretical DFT calculations were performed in the gas phase on 76 at the same level
of theory adopted for complexes 53-73 (PBE0 functional; Ahlrichs BSs for C, N, S, H
and CRENBL+ECP BSs for gold). The optimised geometry is depicted in Figure 3.63,
showing that the central metal ion is coordinated by the (C^N)(S^S) system in a square–
planar fashion. As predictable, the optimised structure is not completely planar, due to a
torsion of the 2-benzylpyridine rings with respect to the coordination core of about 45°
(dihedral angles S1-Au-N1-C10 and S2-Au-C3-C8 in Figure 3.63, Table 3.47), allowed
by the presence of the methylene bridging group.
0
50
100
150
200
250
300
350
400
450
500
340 390 440 490 540 590
Fluo
resc
ence
Inte
nsity
(a.u
.)
Wavelenght (nm)
Page 212
Results and Discussion
198
Selected optimised bond lengths and angles are listed in Table 3.47, along with
corresponding average experimental values extracted from the few structural reports
found in the CCDC for similar systems.229
Figure 3.63. Molecular drawing and atom labeling scheme of 76 at the optimised geometry.
Table 3.47. Selected optimised bond lengths (Å), angles and dihedrals (°) for 76 and relative average
experimental values for analogue [Au(C^N)(S^S)] systems reported in the literature.
Optimised Experimentala
Au-S1 2.366 2.333
Au-S2 2.279 2.288
Au-N1 2.106 2.072
Au-C3 2.056 2.072
S1- C1 1.756 1.748
S2-C2 1.744 1.738
C1-C2 1.368 1.363
ES-Au-S2 90.42 90.96
N1-Au-C3 87.93 81.34
S1-Au-N1-C10 136.63 /
S2-Au-C1-C8 138.56 / a Mean values on six crystal structures deposited at the CCDC (Ref. 229).
Au
S1
S2
N1
C3
C1
C2
C9
C10
C11 C12 C13
C14
C6
C8
C4 C5
C7
C15
C16
N3
N2
Page 213
Results and Discussion
199
Optimised metric parameters are in very good agreement with the experimental ones
used for the comparison, and show that the two Au-S distances in the complex are in
every case remarkably different. In particular, the Au-S distance trans to the Au-C bond
(Au-S1 in Figure 3.63) is longer than the other one by about 0.1 Å. As expected, C-S
and C-C bond lengths at the maleonitrile-1,2-dithiolate ligand are consistent with a ene-
1,2-dithiolato limit form for this ligand.
In Figure 3.64 the KS-MO scheme calculated fo 76 in its ground state (A) is depicted,
while in Figure 3.65 the contributions from the central gold atom and the two ligands to
the composition of selected frontier MOs are summarised.
Figure 3.64. KS-MO scheme and isosurface drawings calculated for 76. Contour value = 0.05 e.
-9
-8
-7
-6
-5
-4
-3
-2
-1
0
Koh
-Sha
m e
igen
valu
es (e
V)
87 88
89
90
91
92
93
Page 214
Results and Discussion
200
In this complex, the HOMO (orbital 89 in Figures 3.64 and 3.65) is a π MO mainly
localised on the S^S ligand, with only a minor participation of Au 5d character (7%),
while the LUMO (orbital 90 in Figures 3.64 and 3.65) is almost exclusively located on
the pyridine ring of the C^N ligand, and a contribution by the metal similar to that
observed for the HOMO (7%) was calculated. Notably, the localisation of these
molecular orbitals, as well as the entity of the contribution from the atomic orbitals of
the metal, closely resemble those calculated for [Pt(N^N)(S^S)] complexes. The nature
of the LUMO is consistent with the conclusions drawn from experimental cyclic
voltammetry measurements (see above).
Figure 3.65. Frontier molecular orbital (KS-MOs 85-95; HOMO = 89, LUMO = 90) composition
calculated for 76 [fragments: gold atom (yellow); C^N ligand (blue); S^S ligand (red)].
0 20 40 60 80 100
Orbital composition (%)
Orb
ital n
umbe
r
85
86
87
88
89
90
91
92
93
94
95
Page 215
Results and Discussion
201
In Table 3.48, the results from a Mulliken population analysis are summarised for 76. In
particular, the charges Q carried by the central gold ion, the coordinating N, C, and S
atoms and the ligands are reported. According to the results described for diimine-
dithiolate complexes (Section 3.1.6.3), the mnt2– ligand features a negative charge of
about -0.4 e, while the C^N has a positive charge of 0.137 e, the remaining charge
(0.290 e) being carried by the metal. Thus, similarly to what observed for
[Pt(N^N)(S^S)] complexes, a charge separation of about 0.55 e is present between the
two ligands (Table 3.48).
Table 3.48. Mulliken charges Q (e) calculated on Au, S1, S2, N1, C3, the dithiolate ligand (N^N), and the
2-benzylpyridine (C^N) for 76.a
Q(Au) 0.290
Q(S1) -0.019
Q(S2) 0.145
Q(N1) -0.470
Q(C3) -0.183
Q(C^N) 0.137
Q(S^S) -0.427 a Numbering scheme as in Figure 3.63.
Time-dependent DFT (TD-DFT) calculations were also performed on complex 76 at its
optimised geometry in its GS (A) at the same level of theory discussed above, and the
main calculated vertical transitions are listed in Table 3.49, while in Figure 3.66 is
depicted the simulated spectrum based on these calculations.
Page 216
Results and Discussion
202
Table 3.49. Principal electronic transitions (f > 0.05) calculated for 76 at TD-DFT level. For each
transition, the excitation energy E (eV), the absortion wavelength (nm), the oscillator strenght f, and the
molecular orbital composition of the excited-state functions, along with the fragments where the involved
KS-MOs are mainly localised, are reported.
Exc. State E λ f Compositiona % Molecular fragmentsb
S5 3.844 322.7 0.068 89→93 78 S^S(89%)→S^S(97%)
S12 4.564 271.6 0.052 85→91 38 S^S(55%)+C^N(38%)→C^N(42%)+S^S(33%)
89→94 55 S^S(89%)→C^N(91%)
S13 4.722 262.6 0.068 89→95 53 S^S(89%)→C^N(96%)
89→94 18 S^S(89%)→C^N(91%)
85→91 13 S^S(55%)+C^N(38%) →C^N(42%)+S^S(33%)
S15 4.828 256.8 0.246 88→92 66 C^N(48%)+S^S(45%)→C^N(98%)
S21 5.109 242.7 0.180 85→93 29 S^S(55%)+C^N(38%) →S^S(97%)
87→93 13 C^N(63%)→ C^N(35%) →S^S(97%)
88→93 41 C^N(48%)+S^S(45%)→ S^S(97%)
S25 5.394 229.8 0.086 82→90 50 C^C(43%)+S^S(45%)→ C^N(87%)
83→90 12 C^N(66%)+S^S(27%)→ C^N(87%)
S33 5.915 209.6 0.077 79→90 37 Au(42%)+C^N(32%)→ C^N(87%)
81→90 21 S^S(91%)→ C^N(87%)
82→91 10 C^C(43%)+S^S(45%)→ C^N(42%)+S^S(33%)
S35 6.002 206.6 0.075 79 →91 19 Au(42%)+C^N(32%)→ C^N(42%)+S^S(33%)
84→93 21 S^S(90%)→ S^S(97%)
81→91 9 S^S(91%)→ C^N(42%)+S^S(33%)
a The molecular orbitals are labelled according to Figure 3.65; b C^N = 2-benzylpyridine; S^S = maleonitrile-1,2-dithiolate.
Page 217
Results and Discussion
203
The simulated spectrum shows two main absorption bands in the spectral region 200-
350 nm, in agreement with experimental data of 76 (Figure 3.61), although the
transitions energies are slightly overestimated.
Figure 3.66. Simulated UV-Vis spectrum (200-600 nm) based on TD-DFT calculations performed on 76
(Table 3.49).
The absorption band at the lowest energy shown by 76 is assigned to the vertical
electronic transition S0→S5, predominantly (78%) HOMO→ LUMO+3 in character,
and thus occurring between MOs mainly localised on the maleonitrile-1,2-dithiolate
ligand (89→93 excitation; Figure 3.65 and Table 3.49). The absorption at about 250 nm
is calculated to derive from the overlap of several electronic transitions occurring in the
range 4.5-6.0 eV.
Finally, also for this complex the first static hyperpolarisability (βtot) was calculated at
DFT level, and a value of 10·10–30 esu was found. Thus, as compared to [Pt(N^N)(S^S)]
0
0,1
0,2
0,3
0,4
0,5
0,6
200 250 300 350 400 450 500 550 600
Osc
ilato
r st
reng
th
Wavelength (nm)
0.6
0.5
0.4
0.3
0.2
0.1
0.0
Page 218
Results and Discussion
204
complexes 53-73 (Table 3.46), 76 seems to be a less promising candidate for NLO
applications.
Page 219
Conclusions
205
4. Conclusions
This PhD thesis has been focused on the synthesis and characterisation of new
noncentrosymmetric complexes featuring 1,2-dichalcogenolene ligands, in order to
investigate their potential NLO applications.
Bis-complexes of d8 metals belonging to different classes were prepared and studied
separately, in order to explore their structure-property relationships. The results
obtained can be summarised as follows.
(i) Three new AuIII complexes featuring the asymmetrically substituted arylethylene-
1,2-dithiolato ligands Ar,H-edt2– (Ar = Ph, Naph, Pyr) were synthesised, and the effect
of varying both the substituent Ar at the 1,2-dithiolene ligands and the total charge of
the complex on the electrochemical and absorption and emission spectroscopic features
of these systems was studied. Remarkably, an unprecedented investigation on the
fluorescence features of gold(III) bis(1,2-dithiolene) complexes was performed,
revealing interesting potential controlled emission features, and demonstrating that both
the low energy NIR-absorption and emission properties of [Au(Ar,H-edt)2]x– complexes
are tunable by varying their oxidation state. These features were investigated by means
of DFT and TD-DFT calculations, and the potential NLO features of the complexes
were evaluated through the theoretical calculation of the first static hyperpolarisability
β. The values obtained are comparable to those calculated for other NLO-active
materials, and also in this case a dependence of the β value on the ligands’ substituents
and the total charge of the complex was observed and rationalised.
As a result, the [Au(Ar,H-edt)2]x– complexes combine in a single molecular material the
linear and nonlinear optical properties of the dithiolene core with the fluorescent
features of the aryl substituents, and both properties can be tuned by varying Ar and x.
Page 220
Conclusions
206
(ii) Twenty new diimine-dithiolate complexes [Pt(N^N)(E^E)] (E = S, Se) were
synthesised by systematically varying both the diimine N^N and the 1,2-
dichalcogenolate E^E, leading to the preparation of an homogeneous series of
complexes whose properties were extensively studied by both experimental and
theoretical means. Remarkably, two complexes featuring 1,2-diselenolene ligands were
synthesised, only another [Pt(N^N)(Se^Se)] system having been reported so far in the
literature. The electrochemical and spectroscopic characterisation of the complexes
allowed to rationalise the effects induced by the different ligands on their chemical-
physical features, and to correlate the redox potentials and the position of the
characteristic solvatochromic absorption featured by these complexes. An in-depth DFT
study allowed for the rationalisation of their optical properties, and a dependence of the
first static hyperpolarisability value on the nature of the ligands was found, so that the
structural features conferring the best SONLO properties were individuated. Further
properties exploitable for ICT applications, such as photoconductivity, were also
studied, resulting in very promising preliminary results.
iii) Two very original complexes were obtained: an unusual cyclometalated compound
of the type [Au(C^N)(S^S)], and a [Pt(N^N)(S^S)] complex containing a ferrocenyl-
substituted 1,2-dithiolene ligand, which represents the first platinum(II) complex
featuring this ligand, whose peculiar redox behavior, due to the presence of the redox-
active ferrocenyl substituent, was explained by means of spectroelectrochemical
measurements. DFT calculations allowed also in this case for the study of the optical
nonlinearities of the complexes, further contributing to the understanding of the effect
induced by the variation of the ligands on heteroleptic mono-(1,2-dithiolene)
complexes.
Page 221
Conclusions
207
Summarily, a wide range of noncentrosymmetric complexes featuring 1,2-dichalcogene
ligands with promising NLO applications were obtained, and the experimental and
theoretical study of their structural, spectroscopic, and electrochemical properties
deepened the knowledge on these complexes and outlined useful guidelines for further
studies in this field.
Page 222
Experimental
208
5. Experimental
5.1. Instrumentation
5.1.1. Microanalytical measurements
Melting point measurements were carried in capillaries. Elemental analyses were
performed with an EA1108 CHNS-O Fisons instrument (T = 1000 °C) for all of the
products but for 73, which was analysed by the Microanalytical Service of the
Department of Chemistry of the University of Sheffield (U.K.).
5.1.2. FT-IR Spectroscopy
Infrared spectra were recorded with a Thermo-Nicolet 5700 spectrometer at room
temperature: KBr pellets with a KBr beam-splitter and KBr windows (4000–400 cm–1,
resolution 4 cm-1) were used.
5.1.3. 1H NMR Spectroscopy
1H NMR measurements were recorded on a Varian INOVA 400 MHz spectrometer at
298 K and referenced to Si(CH3)4.
5.1.4. Mass spectroscopy
The mass spectrum of 73 was recorded at the University of Sheffield (U.K.) on a
Fisons/BG Prospec 3000 instrument operating in fast atom bombardment mode with m-
nitrobenzyl alcohol as matrix.
Page 223
Experimental
209
5.1.5. UV-Vis-NIR Spectroscopy
Absorption spectra were recorded at 298 K in a quartz cell of 10.00 mm optical path
with a Varian Cary 500 (200–2000 nm) or a Thermo Evolution 300 (190–1100 nm)
spectrophotometer.
5.1.6. Emission spectroscopy
Uncorrected emission spectra were collected at 298 K with a Varian Cary Eclipse
spectrophotometer equipped with a Xenon lamp. Quantum yields were determined
relative to 2-aminopyridine in sulphuric acid 0.5 M aqueous solution and anthracene in
ethyl alcohol for complexes 20-22 and 53-73/76, respectively, by using Equation 5.1:230
Φ𝑆 = Φ𝑅𝐼𝑆𝐼𝑅
η𝑆2
η𝑅2 (5.1)
where Φ = sample or reference fluorescence quantum yield; I = integrated fluorescence
of the sample or reference; η = refractive index of the sample of reference solvent.
The integrated fluorescence of both the samples and the references were evaluated
through the software Fytik231
5.1.7. Electrochemistry
by decomposing the emission spectra in their Gaussian
components.
Cyclic (scan rate 25–1000 mV s–1) and differential pulsed voltammetry measurements
were performed in anhydrous solvents in a Metrohm voltammetric cell, with a
combined working and counter platinum electrode and a standard Ag/AgCl reference
electrode with a Metrohm Autolab PGSTAT 10 potentiostat (supporting electrolyte
(TBA+)(PF6–) 0.10 M): reported data are referred to the Fc+/Fc reversible couple.
HOMO and LUMO energy levels, referred to ferrocene were calculated, for reversible
Page 224
Experimental
210
processes, from the reduction and oxidation onsets ( rdonsetE and ox
onsetE , respectively) for
the one-electron processes through the equations –EHOMO = 4.80 + oxonsetE and –ELUMO =
4.80 + rdonsetE , respectively.192
5.1.8. Spectroelectrochemistry
UV-Vis-NIR spectroelectrochemical measurements were performed at the University of
Sheffield in dry CH2Cl2 [supporting electrolyte (TBA+)(PF6–) 0.10 M], using an
optically transparent thin-layer electrode (OTTLE) cell fitted with platinum gauze,
platinum wire, and Ag/AgCl working, counter, and reference electrodes, respectively,
and mounted in a Cary 5000 spectrometer. The temperature was maintained at 273 K
throughout data collection. Potentials were applied using an EG&G model 273A
potentiostat linked to a computer with EG&G model 273 research electrochemistry
software.
5.1.9. X-ray diffraction
X-ray structure determinations for (TBA+)(21–), 26, and 34 were carried out at the
EPSRC UK National Crystallography service, University of Southampton (U.K).
Measurements were collected at 120(2) K by means of combined Φ and Ω scans with a
Bruker Nonius KappaCCD area detector situated at the window of a rotating anode
(graphite MoKα radiation, λ = 0.71073 Å). The structures were solved by direct methods
with SHELXS-97 and refined on F2 by using SHELXL-97.232 X-ray single-crystal
diffraction data for 57, 58, 59, and 64 were collected at the University of St. Andrews
(U.K.). Data collections were performed on a SMART CCD area detector
diffractometer with graphite-monochromated MoKα radiation. Data collection was
Page 225
Experimental
211
performed at 93(2) K for 57, and at 125(2) K for 58, 59 and 64. The structures were
solved by direct methods with SHELXS-97 and refined on F2 by using SHELXL-97.232
X-ray structure determinations for 67 and 69 were carried out at the University of
Rennes 1. Measurements were collected at 150(2) K with a Bruker-AXS diffractometer
(MoKα radiation). The structures were solved by direct methods using the SIR97
program,233
232
and then refined with full-matrix least-square methods based on F2
(SHELXL-97) with the aid of the WINGX program.234 All the structures were
validated by using the programs CheckCIF235 and enCIFer.236
5.1.10. Photoconduction measurements
Photoconduction measurements were performed by Prof. M. Sampietro at the
Politecnico di Milano (Milan, Italy). Prototype planar devices were prepared by casting
a sonicated solution of the active material on a quartz substrate with previously
lithographed gold/chromium electrodes, thus obtaining a metal-semiconductor-metal
surface structure with interelectrode spacings of 6 µm. The devices were irradiated with
light pulses lasting 500 µs produced by a set of light emitting diodes (LEDs), and the
resulting photocurrents were measured by biasing the device with a voltage source and
connecting it to a transimpedance amplifier. Output voltage was recorded by means of
an Tektronix DPO4054 oscilloscope, from which the device photocurrent was
numerically obtained on the basis of the feedback impedance of the amplifier. All
measurements were performed in vacuum at a pressure below 10–5 mbar. The light
intensity of each LED was measured by means of a silicon photodiode.
Page 226
Experimental
212
5.2. Synthesis
All operations were carried out under inert atmosphere. All the solvents were purchased
from Aldrich and Merck, and when necessary, they were purified according to standard
techniques. The degree of purity of each synthesised compound was checked by CHNS ,
1H NMR,237
2-Bromo-2ʹ-acetophenone, 2-bromo-2ʹ-acetonaphthone, 1-(bromoacetyl)pyrene,
K2PtCl4, KAuCl4, disodium 1,2-maleonitrile-1,2-dithiolate (Na2mnt) and the diimines
2,2ʹ-bipyridine (bipy), 1,10-phenanthroline (phen), 4,4ʹ-dimethyl-2,2ʹ-bipyridine (4,4ʹ-
Me2-bipy), 5,5ʹ-dimethyl-2,2ʹ-bipyridine (5,5ʹ-Me2-bipy), 4,4ʹ-di-tert-butyl-2,2ʹ-
bipyridine (4,4ʹ-tBu2-bipy), 4,4ʹ-diphenyl-2,2ʹ-bipyridine (4,4ʹ-Ph2-bipy), 4,7-diphenyl-
1,10-phenanthroline (4,7-Ph2-phen), and 3,4,7,8-tetramethyl-1,10-phenanthroline
(3,4,7,8-Me4-phen), were used as received from Aldrich without further purification.
and TLC analysis.
5.2.1. Synthesis and characterisation of ligands and precursors
The precursors of the ligands belonging to the class R-dmet2–/R-dset2– [N-methyl-4,5-
bis(2ʹ-cyanoethylthio)-1,3-thiazol-2-thione (49), N-ethyl-4,5-bis(2ʹ-cyanoethylthio)-1,3-
thiazol-2-thione (50), N-phenyl-4,5-bis(2ʹ-cyanoethylthio)-1,3-thiazol-2-thione (51) and
N-methyl-4,5-bis(2ʹ-cyanoethylseleno)-1,3-thiazol-2-thione (52)] were synthesised
according to literature procedures.28,79,172 The diimine-dichloro platinum complexes
[Pt(2,2ʹ-bipy)Cl2] (41), [Pt(1,10-phen)Cl2] (42), [Pt(4,4ʹ-Me2-bipy)Cl2] (44), [Pt(5,5ʹ-
Me2-bipy)Cl2] (43), [Pt(4,4ʹ-tBu2-bipy)Cl2] (45), [Pt(4,4ʹ-Ph2-bipy)Cl2] (46), [Pt(4,7-
Ph2-phen)Cl2] (47) and [Pt(3,4,7,8-Me4-phen)Cl2] (48) were prepared by the method of
Morgan, by heating a mixture of the diimine suspended in a solution of 1 equivalent of
K2PtCl4 in H2O with an excess of HCl until the water solution was colorless (2-48 h), as
also reported by Eisenberg and by Gillard.127,210 The precursor of the ligand Fc,H-edt2–
Page 227
Experimental
213
(Ferrocenyl-1,3-dithiol-2-one, 74) was obtained following the general method reported
by Gareau for the synthesis of 1,3-dithiol-2-ones,19 by reacting ethynylferrocene
(synthesised as reported by Wang)211 with diisopropyl xanthogen disulfide in the
presence of AIBN as radical initiator.238
197
The complex [Au(Py1)(Cl2)] (77; Hpy1 = 2-
benzylpyridine) was synthesised as reported in the literature. The precursors of the
ligands Ar,H-edt2– [Ar = Ph (26), 2-Naph (27), 1-Pyr (28)] were obtained by reacting α-
haloketones bearing the desidered aryl substituent with isopropylxanthate, leading to the
corresponding α-ketoxanthate esters, which undergo cyclisation in strongly acidic
media to give a 1,3-dithiol-2-one.
5.2.1.1. Synthesis of isopropyl Xanthate
1.00 g of KOH (17.9 mmol) were refluxed for 60 minutes in 200 mL of isopropyl
alcohol. After filtration on celite, 5 mL of CS2 (83.10 mmol, d = 1.266 g/cm3) in 15 mL
of the same solvent at 0 °C were added dropwise. The reaction was cooled in ice for 30
minutes, then 30 mL of diethyl ether were added. The reaction mixture was left under
stirring for 60 minutes, and the resulting precipitate recovered by filtration and dried
under reduced pressure. Yield: 2.91 g (91.7%); m.p. > 240 °C; FTIR: ṽ = 1052 (vs),
1085 (vs), 1130 (s), 1148 (s), 1183 (s), 1371 (w), 2970 cm–1 (w); 1H NMR (CDCl3): δ =
5.456, 1.160 ppm; elemental analysis calcd (%) for C4H7S2O: C 27.25, H 4.05, S 36.79;
found: C 27.25, H 4.19, S 30.82.
5.2.1.2. Synthesis of O-Isopropyl S-Phenyl Dithiocarbonate (23)
A solution of 2-bromo-2ʹ-acetophenone (4.15 g, 20.86 mmol) in acetone (40 mL) was
added dropwise to potassium isopropyl xanthate (3.64 g, 20.86 mmol) dissolved in the
same solvent (200 mL). After one hour of stirring, the solution was filtered through
celite. After concentration under reduced pressure, an equivalent volume of water was
Page 228
Experimental
214
added. The product was filtered, washed with water and subsequently with hexane, and
dried under reduced pressure. Yield: 4.50 g (84%); m.p. 65 °C; FTIR: ṽ = 750 (s), 872
(m), 904 (m), 984 (m), 1047 (m), 1093 (m), 1228 (s), 1325 (m), 1352 (m), 1373 (m),
1447 (s), 1578 (m), 1594 (m), 1692 (vs), 2930 (vw), 2987 (w), 3061 cm–1 (w); 1H NMR
(CDCl3): δ = 8.005, 7.986, 7.582, 7.475, 5.658, 4.608, 1.342, 1.326 ppm; elemental
analysis calcd (%) for C12H14O2S2 : C 56.67, H 5.55, S 25.21; found: C 56.60, H 5.65, S
24.39.
5.2.1.3. Synthesis of O-Isopropyl S-Naphthacyl Dithiocarbonate (24)
The synthesis was carried out as described for O-isopropyl-S-phenyldithiocarbonate
(23) starting from 2-bromo-2ʹ-acetonaphthone (2.04 g, 8.20 mmol). Yield: 2.24 g
(92%); m.p. 99 °C; FTIR: ṽ = 823 (w), 1026 (w), 1050 (s), 1094 (s), 1128 (vw), 1146
(w), 1224 (vs), 1347 (w), 1624 (w), 1692 (s), 2919 (vw), 2980 cm–1 (vw); 1H NMR
(CDCl3): δ = 8.449, 8.249, 8.161, 8.055, 4.855, 4.687 ,1.385, 1.364 ppm; elemental
analysis calcd (%) for C16H16O2S2: C 63.13, H 5.30, S 21.06; found: C 63.06, H 5.77, S
21.57.
5.2.1.4. Synthesis of O-Isopropyl S-Pyrenacyl Dithiocarbonate (25)
The synthesis was carried out as described for O-isopropyl-S-phenyldithiocarbonate
(23) starting from 1-(bromoacetyl)pyrene (2.01 g, 3.10 mmol). Yield: 0.81 g (68%);
m.p. 116–118 °C; FTIR: ṽ = 842 (vs), 959 (vw), 991 (w), 1045 (vs), 1087 (s), 1177 (w),
1216 (vw), 1234 (m), 1258 (vw), 1371 (vw), 1383 (w), 1371 (vw), 1592 (w), 1676 (m),
2987 cm–1 (vw); 1H NMR (CDCl3): δ = 8.939, 8.908, 8.440, 8.238, 8.179, 8.059, 5.739,
4.850, 1.386, 1.365 ppm; elemental analysis calcd (%) for C22H18S2O2: C 69.81, H 4.79,
S 16.94; found: C 69.02, H 5.12, S 17.33.
Page 229
Experimental
215
5.2.1.5. Synthesis of Phenyl-1,3-dithiol-2-one (26)
Perchloric acid (3.0 mL, 65% w/w) was slowly added to a solution of O-isopropyl S-
phenyl dithiocarbonate (23, 2.53 g, 9.96 mmol) in a 1:2 diethyl ether/chloroform
mixture (18 mL). The reaction mixture was heated at reflux for one hour and then
poured into ice. The organic phase, extracted with chloroform, was dried over Na2SO4.
After filtration, the solvent was removed under reduced pressure. Crystals suitable for
X-ray diffraction were obtained by slowly cooling a water/MeCN (1:1 v/v) saturated
solution of the product. Yield: 1.66 g (86%); m.p. 90 °C; FTIR: ṽ = 743 (vs), 874 (s),
1074 (m), 1099 (m), 1443 (m), 1487 (m), 1578 (vw), 1647 (s), 1697 (vw), 1749 (w),
1958 (vw), 3089 cm–1 (vw); 1H NMR (CDCl3): δ = 7.393, 7.366, 6.807 ppm; elemental
analysis calcd (%) for C9H6S2O: C 55.64, H 3.11, S 33.01; found: C 55.69, H 3.19, S
32.60.
5.2.1.6. Synthesis of Naphthyl-1,3-dithiol-2-one (27)
The synthesis was carried out as described for phenyl-1,3-dithiol-2-one (26) starting
from O-isopropyl S-naphthacyl dithiocarbonate (24, 2.51 g, 8.24 mmol). Yield: 1.72 g
(86%); m.p. 145 °C; FTIR: ṽ = 754 (m), 776 (m), 860 (m), 888 (m), 1204 (w), 1361
(vw), 1633 (vs), 1503 (vw), 1708 (vw), 1741 (vw), 3051 (vw), 3089 cm-1 (vw); 1H
NMR (CDCl3): δ = 8.253, 8.222, 7.944, 7.920, 7.350 ppm; elemental analysis calcd (%)
for C13H8S2O: C 63.91, H 3.30, S 26.24; found: C 63.56, H 3.55, S 25.49.
5.2.1.7. Synthesis of 1-Pyrenyl-1,3-dithiol-2-one (28)
The synthesis was carried out as described for phenyl-1,3-dithiol-2-one (26) starting
from O-isopropyl S-pyrenacyl dithiocarbonate (25, 0.70 g, 1.86 mmol). Yield: 0.55 g
(93%); m.p. 130 °C; FTIR: ṽ = 711 (s), 748 (w), 816 (w), 844 (vs), 1644 (s), 1685 (m),
2962 (w), 3038 cm–1 (w); 1H NMR (CDCl3): δ = 8.054, 8.056, 7.950, 7.890, 7.826,
Page 230
Experimental
216
7.729, 6.568 ppm; elemental analysis calcd (%) for C19H10S2O: C 71.67, H 3.17, S
20.14; found: C 69.39, H 3.36, S 19.61.
5.2.2. Synthesis and characterisation of the 1,2-dithiolene complexes
5.2.2.1. Synthesis of (TBA+)[Au(Ar,H-edt)2]– complexes (Ar = Ph, 2-Naph, 1-Pyr)
The complexes were synthesised by reacting the 1,3-dithiol-2-one, obtained as
previously reported (Sections 5.2.1.5-5.2.1.7), treated with strong bases to give the
corresponding ethylene-1,2-dithiolates, with potassium tetrachloroaurate in the presence
of tetrabutylammonium iodide. This leads to the formation of the desired gold bis(1,2-
dithiolene) complexes as monoanions counterbalanced by tetrabutylammonium (TBA+)
cations.
5.2.2.1.1. Synthesis and characterisation of (TBA+)[Au(Ph,H-edt)2]– (TBA+)(20–)
An ethyl alcohol solution of KOH (40 mL; 0.17 g, 3.1 mmol) was added dropwise to 4-
phenyl-1,3-dithiol-2-one (26, 30 mL EtOH; 0.25 g, 1.30 mmol) under an inert N2
atmosphere. After addition of solutions of KAuCl4 (15 mL; 0.25 g, 0.67 mmol) and
(TBA+)(I–) (15 mL; 0.25 g, 0.69 mmol) in ethyl alcohol, the volume of the reaction
mixture was reduced and the precipitate collected by filtration. Yield 0.12 g (24%); m.p.
128 °C; FTIR: ṽ = 691 (s), 746 (s), 1140 (vs), 1375 (vw), 1440 (w), 1484 (s), 1538 (s),
1571 (w), 1590 (w), 1718 (s), 2870 (vw), 2958 cm–1 (vw); UV-Vis-NIR (CH2Cl2): λ (ε)
= 269 (35000), 296 sh (32000), 346 nm (12800 M–1 cm–1); Fluorescence (CH2Cl2; λexc =
299 nm; slit = 10x10): λem = 390 nm, Φ = 2.4·10–3; elemental analysis calcd (%) for
C32H48NS4Au: C 49.79, H 6.27, N 1.81, S 16.61; found: C 49.66, H 5.51, N 1.51, S
15.15; CV (CH2Cl2): E1/2 vs Fc+/Fc (scan rate 100 mV s–1) = -2.013, -0.127 V.
Page 231
Experimental
217
5.2.3.1.2. Synthesis and characterisation of (TBA+)[Au(Naph,H-edt)2]– (TBA+)(21–)
The complex was synthesised as described for (TBA+)(20–) starting from naphthyl-1,3-
dithiol-2-one (27, 0.25 g, 1.03 mmol). Crystals suitable for X-ray diffraction were
obtained by slow evaporation of a CH2Cl2 solution of the complex. Yield: 0.16 g (36%);
m.p. 186 °C; FTIR: ṽ = 748 (m), 780 (m), 815 (m), 855 (vw), 1123 (vw), 1379 (w),
1479 (w), 1456 (w), 1498 (m), 1531 (m), 1571 (w), 1592 (m), 2869 (vw), 2957 (w),
3050 cm–1 (vw); UV-Vis-NIR (CH2Cl2): λ (ε) = 247 (65500), 295 sh (36000), 365 nm
(13000 M–1 cm–1); Fluorescence (CH2Cl2; λexc = 290 nm; slit = 10x10): λem = 426 nm,
Φ = 9.4·10–4; elemental analysis calcd (%) for C40H52NS4Au: C 55.09, H 6.01, N 1.61, S
14.71; found: C 54.57, H 6.33, N 1.67, S 14.38; CV (CH2Cl2): E1/2 vs Fc+/Fc (scan rate
100 mV s–1) = -2.011, -0.120 V.
5.2.3.1.3. Synthesis and characterisation of (TBA+)[Au(Pyr,H-edt)2]– (TBA+)(22–)
The complex was synthesised as described for (TBA+)(20–) starting from 1-pyrenyl-1,3-
dithiol-2-one (28, 0.25g, 0.78 mmol). Yield: 0.14 g (18%); m.p. 121 °C; FTIR: ṽ = 816
(m), 841 (m), 1020 (w), 1097 (w), 1134 (w), 1260 (m), 1454 (vw), 1695 (vw), 2870
(vw), 2960 (vw), 3037 cm–1 (vw); UV-Vis-NIR (CH2Cl2): λ (ε) = 245 (99000), 282
(67500), 352 (43500), 435 sh nm (7400 M–1 cm–1); Fluorescence (CH2Cl2; λexc = 343
nm; slit = 10x10): λem = 465 nm, Φ = 1.0·10–3; elemental analysis calcd (%) for
C52H20NS4Au: C 61.22, H 5.53, N 1.37, S 12.57; found: C 61.01, H 5.40, N 1.14, S
12.30; CV (CH2Cl2): E1/2 vs Fc+/Fc (scan rate 100 mV s–1) = -2.038, -0.134 V.
Page 232
Experimental
218
5.2.2.2. Synthesis of Platinum(diimine)(dithiolate) complexes [Pt(N^N)(S^S)]
The Pt(diimine)(dithiolate) complexes were prepared by displacement of the two
chlorides in the corresponding Pt(diimine)Cl2 precursors with the desired dithiolate
chelating ligand.
5.2.2.2.1. Synthesis and characterisation of [Pt(2,2ʹ-bipy)(Ph,H-edt)] (53)
To a solution of 4-phenyl-1,3-dithiol-2-one (26, 0.06 g, 0.31 mmol) in 15 mL of dry
ethyl alcohol a solution of KOH in the same solvent (15 mL; 0.07 g, 1.25 mmol) was
added dropwise under a N2 inert atmosphere. A suspension of [Pt(2,2ʹ-bipy)Cl2] (41,
0.13 g, 0.31 mmol) in 20 mL of dry THF was then added dropwise, and the reaction
mixture was left under magnetic stirring for one week, resulting in the formation of a
dark precipitate, which was collected by filtration and washed with ethyl alcohol and
water. Yield: 0.10 g (52%); m.p. >240 °C; FTIR: ṽ = 415 (s), 445 (w), 454 (w), 553 (w),
612 (w), 619 (w), 645 (w), 671 (w), 684 (m), 716 (m), 742 (vs), 793 (m), 831 (w), 922
(m), 1032 (w), 1070 (w), 1124 (w), 1163 (m), 1260 (w), 1276 (w), 1315 (m), 1429 (w),
1446 (m), 1469 (s), 1486 (m), 1530(s), 1571 (w), 1591 (m), 3049 cm–1 (vw); UV-Vis-
NIR (DMSO): λ (ε) = 257 (24000), 299 (34000), 327 (14000), 344 (11000), 604 nm
(7000 M–1 cm–1); Fluorescence (DMSO): λexc = 360 nm; slit = 5x5): λem = 374, 395 nm,
Φ = 8.39·10–3; 1H NMR (DMSO-d6): δ = 9.368, 9.245, 8.767, 8.480, 7.892, 7.716,
7.384, 7.248, 7.013 ppm; elemental analysis calcd (%) for C18H14N2S2Pt: C 41.77, H
2.73, N 5.41, S 12.39; found: C 41.23, H 2.85, N 5.04, S 11.99; CV (DMF): E1/2 vs
Fc+/Fc (scan rate 100 mV s–1) = -1.739, -0.135 V.
5.2.2.2.2. Synthesis and characterisation of [Pt(2,2ʹ-bipy)(Naph,H-edt)] (54)
The complex was synthesised as described for [Pt(2,2ʹ-bipy)(Ph,H-edt)] (53) starting
from naphthyl-1,3-dithiol-2-one (27, 0.09 g, 0.35 mmol). Yield: 0.13 g (67%); m.p.
Page 233
Experimental
219
>240 °C; FTIR: ṽ = 475 (s), 718 (m), 748 (s), 761 (m), 811 (m), 1098 (vs), 1260 (m),
1384 (m), 1430 (w), 1446 (m), 1468 (m), 1508 (w), 1523 (m), 1561 (w), 1571 (w), 1594
(m), 1603 (m), 1619 (m), 1624 (m), 1638 (w), 1648 (w), 1655 (w), 1686 (w), 1719 (w),
1735 (w), 2345 (m), 2364 (m), 2926 (w), 2962 (w), 3057 cm–1 (vw); UV-Vis-NIR
(DMSO): λ (ε) = 261 (27000), 301 (30000), 344 (11000), 381 (8000), 603 nm (6000 M–
1 cm–1); Fluorescence (DMSO; λexc = 359 nm; slit = 5x5): λem = 374, 395 nm, Φ =
1.08·10–2; 1H NMR (DMSO-d6): δ = 9.426, 9.265, 8.785, 8.500, 8.315, 8.001, 7.941,
7.894, 7.588, 7.533, 7.250 ppm; elemental analysis calcd (%) for C22H16N2S2Pt: C
46.56, H 2.84, N 4.94, S 11.30; found: C 45.43, H 2.93, N 4.77, S 11.14; CV (DMF):
E1/2 vs Fc+/Fc (scan rate 100 mV s–1) = -1.727, -0.135 V.
5.2.2.2.3. Synthesis and characterisation of [Pt(2,2ʹ-bipy)(Pyr,H-edt)] (55)
The complex was synthesised as described for [Pt(2,2ʹ-bipy)(Ph,H-edt)] (53) starting
from 1-pyrenyl-1,3-dithiol-2-one (28, 0.11 g, 0.35 mmol). Notwithstanding the
numerous attempts to purify the complex, it was not possible to obtain the product in a
pure solid with a satisfying elemental analysis. Yield: 0.15 g ; m.p. >240 °C; FTIR: ṽ =
413 (s), 156 (w), 645 (w), 655 (w), 681 (w), 717 (s), 737 (w), 760 (vs), 799 (w), 818
(w), 844 (s), 882 (w), 932 (w), 964 (w), 1026 (m), 1045 (m), 1072 (m), 1112 (m), 1127
(m), 1165 (s), 1243 (m), 1271 (w), 1450 (s), 1470 (s), 1498 (w), 1560 (w), 1605 (s),
3045 cm–1 (vw); UV-Vis-NIR (DMSO): λ = 270, 280, 320, 336, 351, 379, 592 nm; CV
(DMF): E1/2 vs Fc+/Fc (scan rate 100 mV s–1) = -1.620, -0.075 V.
5.2.2.2.4. Synthesis and characterisation of [Pt(2,2ʹ-bipy)(Me-dmet)] (56)
A dry ethyl alcohol solution of NaOEt (15 mL, 2.80 mmol) was added dropwise to a
solution of N-methyl-4,5-bis(2ʹ-cyanoethylthio)-1,3-thiazol-2-thione in the same solvent
(49, 15 mL; 0.11 g, 0.35 mmol) under a N2 inert atmosphere. A suspension of [Pt(2,2ʹ-
Page 234
Experimental
220
bipy)Cl2] (41, 0.11 g, 0.35 mmol) in 20 mL of dry THF was then added dropwise, and
the reaction mixture was left under stirring for one week, resulting in the formation of a
dark precipitate, which was collected by filtration and washed with EtOH and H2O.
Yield: 0.11 g (66%); m.p. >240 °C; FTIR: ṽ = 534 (s), 713 (s), 748 (s), 936 (m), 1073
(m), 1085 (m), 1143 (s), 1316 (m), 1347 (s), 1432 (w), 1148 (s), 1472 (s), 1508 (s),
1605 (vs), 2346 (vw), 2817 (w), 3029 (vw), 3073 (vw), 3111 cm–1 (vw); UV-Vis-NIR
(DMSO): λ (ε) = 260 (24000), 288 (20000), 315 (9000), 328 (10000), 378 (12000), 581
nm (4300 M–1 cm–1); Fluorescence (DMSO; λexc = 335 nm; slit = 5x5): λem = 374, 395
nm, Φ = 1.85·10–2; 1H NMR (DMSO-d6): δ = 9.065, 8.980, 8.774, 8.495, 7.883, 3.650
ppm; elemental analysis calcd (%) for C14H11S4N3Pt: C 30.88, H 2.04, N 7.72, S 23.55;
found: C 29.80, H 1.92, N 7.36, S 21.67; CV (DMF): E1/2 vs Fc+/Fc (scan rate 100 mV
s–1) = -2.267, -1.608, -0.003 V.
5.2.2.2.5. Synthesis and characterisation of [Pt(2,2ʹ-bipy)(Et-dmet)] (57)
The complex was synthesised as described for [Pt(2,2ʹ-bipy)(Me-dmet)] (56) starting
from N-ethyl-4,5-bis(2ʹ-cyanoethylthio)-1,3-thiazol-2-thione (50, 0.15 g, 0.36 mmol).
X-ray-quality crystals were obtained by slow infusion of diethyl ether into a THF
solution of the complex. Yield: 0.09 g (44%); m.p. >240 °C; FTIR: ṽ = 715 (s), 749
(vs), 758 (s), 791 (m), 826 (w), 894 (s), 989 (w), 1016 (m), 1106 (m), 1143 (vs), 1243
(s), 1293 (m), 1316 (w), 1377 (s), 1432 (w), 1448 (s), 1471 (s), 1504 (s), 1606 (s), 2932
(w), 2974 (w), 3070 cm–1 (m); UV-Vis-NIR (DMSO): λ (ε) = 260 (24000), 291 (22000),
315 (10000), 327 (11000), 379 (13000), 582 nm (4500 M–1 cm–1); Fluorescence
(DMSO; λexc = 341 nm; slit = 5x5): λem = 375, 405 nm, Φ = 7.21·10–3; 1H NMR
(DMSO-d6): δ = 9.066, 9.990, 8.504, 7.894, 4.337, 1.408 ppm; elemental analysis calcd
(%) for C15H13S4N3Pt: C 32.25, H 2.35, N 7.52, S 22.96; found: C 31.36, H 1.92, N
Page 235
Experimental
221
7.14, S 21.50; CV (DMF): E1/2 vs Fc+/Fc (scan rate 100 mV s–1) = -2.255, -1.608, 0.008
V.
5.2.2.2.6. Synthesis and characterisation of [Pt(2,2ʹ-bipy)(Ph-dmet)] (58)
The complex was synthesised as described for [Pt(2,2ʹ-bipy)(Me-dmet)] (56) starting
from N-phenyl-4,5-bis(2ʹ-cyanoethylthio)-1,3-thiazol-2-thione (51, 0.14 g, 0.33 mmol).
X-ray-quality crystals were obtained by slow infusion of n-hexane into an acetone
solution of the complex. Yield: 0.13 g (66%); m.p. >240 °C; FTIR: ṽ = 411 (m), 455
(w), 501 (w), 629 (s), 702 (vs), 715 (m), 753 (s), 804 (w), 877 (s), 1019 (m), 1066 (s),
1124 (w), 1159 (m), 1264 (s), 1322 (s), 1384 (w), 1431 (m), 1446 (s), 1471 (s), 1506
(m), 1591 (m), 1604 cm–1 (m); UV-Vis-NIR (DMSO): λ (ε) = 259 (22000), 288
(22000), 316 (10000), 327 (10000), 392 (10000), 580 nm (4000 M–1 cm–1);
Fluorescence (DMSO; λexc = 334 nm; slit = 5x5): λem = 375, 405 nm, Φ = 1.21·10–2; 1H
NMR (DMSO-d6): δ = 9.021, 9.007, 8.756, 8.478, 7.890, 7.781, 7.272, 7.666, 7.474
ppm; elemental analysis calcd (%) for C19H13S4N3Pt: C 37.61, H 2.16, N 6.93, S 21.14;
found: C 38.17, H 2.35, N 6.53, S 20.41; CV (DMF): E1/2 vs Fc+/Fc (scan rate 100 mV
s–1) = -2.267, -1.620, 0.044 V.
5.2.2.2.7. Synthesis and characterisation of [Pt(2,2ʹ-bipy)(Me-dset)] (59)
A dry ethyl alcohol solution of NaOEt (15 mL; 3.64 mmol) was added dropwise to a
solution of N-methyl-4,5-bis(2ʹ-cyanoethylseleno)-1,3-thiazol-2-thione in the same
solvent (52, 15 mL; 0.18 g, 0.45 mmol) under a N2 inert atmosphere. A suspension of
[Pt(2,2ʹ-bipy)Cl2] (41, 0.19 g, 0.45 mmol) in 20 mL of dry THF was then added
dropwise, and the reaction mixture was left under stirring for one week, after which the
solvent was removed under reduced pressure. The crude product obtained was then
dissolved in 600 mL of CH2Cl2, filtered, and 100 mL of n-hexane were added dropwise,
Page 236
Experimental
222
resulting in the precipitation of a dark solid, which was collected by filtration. X-ray-
quality crystals were obtained by slow infusion of petroleum ether into a CH2Cl2
solution of the complex. Yield: 0.02g (9%); m.p. >240 °C; FTIR: ṽ = 411 (w), 481 (w),
517 (s), 638 (w), 712 (s), 747 (vs), 761 (m), 789 (w), 906 (w), 925 (w), 990 (m), 1068
(m), 1124 (vs), 1158 (w), 1246 (w), 1316 (m), 1336 (m), 1384 (w), 1432 (w), 1446 (s),
1471 (s), 1498 (m), 1604 (m), 3068 cm–1 (vw); UV-Vis-NIR (DMSO): λ (ε) = 257
(17000), 277 (16000), 302 (16000), 331 (6000), 371 (11000), 569 nm (3500 M–1 cm–1);
Fluorescence (DMSO; λexc = 341 nm; slit = 5x5): λem = 373, 393 nm, Φ = 8.21·10–3;
elemental analysis calcd (%) for C14H11N3S2Se2Pt: C 26.34, H 1.74, N 6.58, S 10.05;
found: C 25.76, H 1.63, N 6.02, S 9.04; CV (DMF): E1/2 vs Fc+/Fc (scan rate 100 mV s–
1) = -2.243, -1.608, 0.044 V.
5.2.2.2.8. Synthesis and characterisation of [Pt(1,10-phen)(Ph,H-edt)] (60)
To a solution of 4-phenyl-1,3-dithiol-2-one (26, 0.06 g, 0.29 mmol) in 15 mL of dry
EtOH an ethyl alcohol solution of KOH (15 mL; 0.06 g, 1.18 mmol) was added
dropwise under a N2 inert atmosphere. A suspension of [Pt(1,10-phen)Cl2] (42, 0.13 g,
0.30 mmol) in 20 mL of dry THF was then added dropwise, and the reaction mixture
was left under stirring for one week, resulting in the formation of a dark precipitate,
which was collected by filtration and washed with EtOH and H2O. Yield: 0.10 g (61%);
m.p. >240 °C; FTIR: ṽ = 420 (m), 506 (m), 613 (w), 620 (w), 650 (w), 669 (w), 693 (s),
709 (vs), 726 (w), 746 (vs), 783 (w), 834 (vs), 903 (w), 922 (m), 1032 (w), 1073 (w),
1092 (w), 1151 (w), 1202 (m), 1219 (m), 1296 (m), 1316 (w), 1346 (w), 1414 (m), 1428
(s), 1449 (w), 1485 (m), 1525 (s), 1571 (w), 1589 (m), 1627 (w), 3058 cm–1 (vw); UV-
Vis-NIR (DMSO): λ (ε) = 271 (38000), 347 (10000), 606 nm (5400 M–1 cm–1);
Fluorescence (DMSO; λexc = 359 nm; slit = 5x5): λem = 374, 400 nm, Φ = 1.34·10–2; 1H
NMR (DMSO-d6): δ = 9.798, 9.654, 9.537, 9.146, 9.085, 8.737, 8.281, 8.261, 7.852,
Page 237
Experimental
223
7.402, 7.261, 7.004 ppm; elemental analysis calcd (%) for C20H14N2S2Pt: C 44.36, H
2.61, N 5.17, S 11.84; found: C 43.26, H 2.61, N 5.82, S 10.68; CV (DMF): E1/2 vs
Fc+/Fc (scan rate 100 mV s–1) = -1.716, -0.147 V.
5.2.2.2.9. Synthesis and characterisation of [Pt(1,10-phen)(Naph,H-edt)] (61)
To a solution of naphthyl-1,3-dithiol-2-one (27, 0.07 g, 0.29 mmol) in 15 mL of dry
EtOH an ethyl alcohol solution of KOH (15 mL; 0.06 g, 1.16 mmol) was added
dropwise under a N2 inert atmosphere. A suspension of [Pt(1,10-phen)Cl2] (42, 0.13 g,
0.29 mmol) in 20 mL of dry THF was then added dropwise, and the reaction mixture
was left stirring for one week, after which the solvent was removed under reduced
pressure. The solid obtained was then dissolved in 200 mL of CH2Cl2, filtered, and 350
mL of n-hexane were added dropwise, resulting in the precipitation of a dark solid,
which was collected by filtration. Yield: 0.04 g (24%); m.p. >240 °C; FTIR: ṽ = 464
(m), 560(w), 553 (w), 523 (w), 651 (w), 707 (vs), 725 (w), 745 (m), 780 (m), 809 (m),
824 (s), 849 (m), 872 (w), 915 (w), 1093 (w), 1144 (w), 1202 (m), 1258 (w), 1292 (w),
1343 (w), 1385 (w), 1429 (s), 1450 (w), 1501 (w), 1521 (m), 1569 (w), 1593 (m), 1619
cm–1 (w); UV–Vis-NIR (DMSO): λ (ε) = 271 (43000), 353 (9000), 378 (9000), 603 nm
(3600 M–1 cm–1); Fluorescence (DMSO; λexc = 349 nm; slit = 5x5): λem = 374, 400 nm,
Φ = 1.52·10–2; 1H NMR (DMSO-d6): δ = 9.707, 9.661, 9.557, 9.167, 9.097, 98.375,
8.243, 8.038, 7.956, 7.891, 7.594, 7.537, 7.231 ppm; elemental analysis calcd (%) for
C24H16N2S2Pt: C 48.73, H 2.71, N 4.74, S 10.85; found: C 47.23, H 2.41, N 4.90, S
11.51; CV (DMF): E1/2 vs Fc+/Fc (scan rate 100 mV s–1) = -1.728, -0.159 V.
5.2.2.2.10. Synthesis and characterisation of [Pt(1,10-phen)(Pyr,H-edt)] (62)
The complex was synthesised as described for [Pt(1,10-phen)(Ph,H-edt)] (60) starting
from 1-pyrenyl-1,3-dithiol-2-one (28, 0.14 g, 0.33 mmol). Notwithstanding the
Page 238
Experimental
224
numerous attempts to purify the complex, it was not possible to obtain the product as a
pure solid with a satisfying elemental analysis. Yield: 0.12g; m.p. >240 °C; FTIR: ṽ =
707 (vs), 725 (m), 777 (m), 839 (vs), 884 (w), 995 (w), 1035 (w), 1092 (w), 113 (w),
1153 (m), 1028 (w), 1220 (w), 1039 (w), 1347 (w), 1409 (w), 1427 (s), 1456 (w), 1494
(w), 1515 (m), 1558 (w), 1578 (m), 1605 (m), 1627 (w), 3082 cm–1 (w); UV-Vis-NIR
(DMSO): λ = 270, 330, 348, 389, 596 nm; CV (DMF): E1/2 vs Fc+/Fc (scan rate 100 mV
s–1) = -1.620, -0.075 V.
5.2.2.2.11. Synthesis and characterisation of [Pt(1,10-phen)(Me-dmet)] (63)
An ethyl alcohol solution of NaOEt (15 mL; 2.48 mmol) was added dropwise to N-
methyl-4,5-bis(2ʹ-cyanoethylthio)-1,3-thiazol-2-thione (49, 15 mL dry EtOH; 0.09 g,
0.31 mmol) under a N2 inert atmosphere. A suspention of [Pt(1,10-phen)Cl2] (42, 0.14
g, 0.31 mmol) in 20 mL of dry THF was then added dropwise, and the reaction mixture
was left stirring for one week, resulting in the formation of a dark precipitate, which
was collected by filtration and washed with EtOH and H2O. Yield: 0.12g (70%); m.p.
>240 °C; FTIR: ṽ = 412 (m), 504 (m), 535 (s), 666 (w), 706 (vs), 725 (m), 756 (m), 833
(vs), 919 (m), 942 (s), 1016 (m), 1074 (m), 1140 (s), 1217 (w), 1203 (w), 1301 (w),
1345 (s), 1431 (s), 1432 (w), 1057 cm–1 (s); UV-Vis-NIR (DMSO): λ (ε) = 267 (51000),
379 (14000), 581 nm (5000 M–1 cm–1); Fluorescence (DMSO; λexc = 337 nm; slit = 5x5;
M): λem = 372, 405 nm, Φ = 8.21·10–3; 1H NMR (DMSO-d6): δ = 9.818, 9.445, 9.361,
9.153, 8.403, 8.235, 3.624 ppm; elemental analysis calcd (%) for C16H11N3S4Pt: C
33.80, H 1.95, N 7.39, S 22.56; found: C 34.20, H 1.82, N 7.38, S 21.85; CV (DMF):
E1/2 vs Fc+/Fc (scan rate 100 mV s–1) = -1.620, -0.015 V.
5.2.2.2.12. Synthesis and characterisation of [Pt(1,10-phen)(Et-dmet)] (64)
Page 239
Experimental
225
The complex was synthesised as described for [Pt(1,10-phen)(Me-dmet)] (63) starting
from N-ethyl-4,5-bis(2ʹ-cyanoethylthio)-1,3-thiazol-2-thione (50, 0.15 g, 0.33 mmol).
X-ray-quality crystals were obtained by slow infusion of diethyl ether into a CH2Cl2
solution of the complex. Yield: 0.16 g (82%); m.p. >240 °C; FTIR: ṽ = 505 (w), 527
(m), 548 (m), 654 (m), 708 (s), 768 (w), 793 (w), 837 (vs), (s), 1014 (m), 1065 (m),
1106 (w), 1143 (s), 1221 (w), 1246 (m), 1292 (m), 1379 (s), 1430 (s), 1503 (w), 1633
(w), 2968 cm–1 (w); UV-Vis-NIR (DMSO): λ (ε) = 264 (34000), 378 (12000), 579 nm
(4000 M–1 cm–1); Fluorescence (DMSO; λexc = 350 nm; slit = 5x5): λem = 375, 391, 404,
433 nm, Φ = 9.15·10–3; 1H NMR (DMSO-d6): δ = 9.800, 9.338, 9.271, 9.119, 8.388,
8.276, 8.196, 4.34, 1.420 ppm; elemental analysis calcd (%) for C17H13S4N3Pt: C 35.04,
H 2.24, N 7.21, S 22.01; found: C 35.25, H 2.63, N 6.59, S 20.75; CV (DMF): E1/2 vs
Fc+/Fc (scan rate 100 mV s–1) = -1.620, -0.027 V.
5.2.2.2.13. Synthesis and characterisation of [Pt(1,10-phen)(Ph-dmet)] (65)
The complex was synthesised as described for [Pt(1,10-phen)(Me-dmet)] (63) starting
from N-phenyl-4,5-bis(2ʹ-cyanoethylthio)-1,3-thiazol-2-thione (51, 0.14 g, 0.32 mmol).
Yield: 0.18 g (88%); m.p. >240 °C; FTIR: ṽ = 419 (w), 453 (w), 501 (m), 532 (w), 628
(s), 702 (vs), 725 (m), 767 (m), 835 (s), 877 (s), 1016 (m), 1066 (s), 1095 (w), 1165 (w),
1222 (w), 1268 (s), 1324 (m), 1413 (w), 1429 (s), 1452 (w), 1494 (s), 1592 (w), 1618
cm–1 (w); UV-Vis-NIR (DMSO): λ (ε) = 265 (36000), 391 (11000), 581 nm (4600 M–1
cm–1); Fluorescence (DMSO; λexc = 337 nm; slit = 5x5): λem = 373, 403, 419 nm, Φ =
2.76·10–2; 1H NMR (DMSO-d6): δ = 9.290, 9.090, 9.039, 8.351, 8.190, 8.086, 7.749,
7.684, 7.504 ppm; elemental analysis calcd (%) for C21H13N3S4Pt: C 39.99, H 2.07, N
6.66, S 20.34; found: C 38.97, H 2.20, N 6.44, S 20.80; CV (DMF): E1/2 vs Fc+/Fc (scan
rate 100 mV s–1) = -1.632, 0.020 V.
Page 240
Experimental
226
5.2.2.2.14. Synthesis and characterisation of [Pt(1,10-phen)(Me-dset)] (66)
The complex was synthesised as described for [Pt(1,10-phen)(Me-dmet)] (63) starting
from N-methyl-4,5-bis(2ʹ-cyanoethylseleno)-1,3-thiazol-2-thione (52, 0.14 g, 0.30
mmol). Yield: 0.11 g (55%); m.p. >240 °C; FTIR: ṽ = 502 (w), 517 (s), 650 (w), 705
(vs), 724 (m), 754 (w), 787 (w), 831 (s), 916 (m), 990 (s), 1063 (m), 1126 (s), 1151 (w),
1217 (w), 1294 (w), 1340 (m), 1430 (m), 1502 (m), 1578 cm–1 (w); UV-Vis-NIR
(DMSO): λ (ε) = 271 (41000), 374 (16000), 570 nm (5000 M–1 cm–1); Fluorescence
(DMSO; λexc = 279 nm; slit = 5x5): λem = 375, 395 nm, Φ = 1.18·10–2; elemental
analysis calcd (%) for C16H11N3S2Se2Pt: C 29.01, H 1.67, N 6.34, S 9.68; found: C
30.93, H 2.38, N 7.21, S 8.40; CV (DMF): E1/2 vs Fc+/Fc (scan rate 100 mV s–1) = -
1.620, -0.027 V.
5.2.2.2.15. Synthesis and characterisation of [Pt(5,5ʹ-Me2-bipy)(Me-dmet)] (67)
The complex was synthesised as described for [Pt(2,2ʹ-bipy)(Me-dmet)] (56) starting
from [Pt(5,5ʹ-Me2-bipy)Cl2] (43, 0.11 g, 0.25 mmol). X-ray-quality crystals were
obtained by slow infusion of diethyl ether into a CH2Cl2 solution of the complex. Yield:
0.06 g (42%); m.p. >240 °C; FTIR: ṽ = 665 (w), 713 (m), 809 (vs), 830 (w), 938 (s),
1015 (w), 1086 (m), 1143 (s), 1255 (m), 1300 (w), 1336 (s), 1382 (m), 1475 (s), 1507
(s), 1577 (w), 1607 (w), 1655 cm–1 (w); UV-Vis-NIR (DMSO): λ (ε) = 259 (28000),
292 (21000), 323 (12000), 334 (15000), 378 (12000), 567 nm (4700 M–1 cm–1);
Fluorescence (DMSO; λexc = 337 nm; slit = 5x5): λem = 372, 391 nm, Φ = 8.84·10–3; 1H
NMR (DMSO-d6): δ = 8.798, 8.744, 8.629, 8.325, 3.700. 2.619 ppm; elemental analysis
calcd (%) for C16H15S4N3Pt: C 33.57, H 2.64, N 7.34, S 22.40; found: C 32.36, H 2.39,
N 7.01, S 21.02; CV (DMF): E1/2 vs Fc+/Fc (scan rate 100 mV s–1) = -1.727, -0.027 V.
5.2.2.2.16. Synthesis and characterisation of [Pt(4,4ʹ-Me2-bipy)(Me-dmet)] (68)
Page 241
Experimental
227
The complex was synthesised as described for [Pt(2,2ʹ-bipy)(Me-dmet)] (56) starting
from [Pt(4,4ʹ-Me2-bipy)Cl2] (44, 0.15 g, 0.34 mmol). Yield: 0.18 g (90%); m.p. >240
°C; FTIR: ṽ = 515 (s), 537 (s), 668 (w), 827 (s), 872 (w), 934 (m), 1033 (w), 1088 (m),
1145 (vs), 1222 (w), 1251 (w), 1304 (w), 1339 (m), 1378 (w), 1427 (m), 1489 (w), 1513
(m), 1618 (s), 3028 cm–1 (vw); UV-Vis-NIR (DMSO): λ (ε) = 261 (24000), 281
(24000), 311 (9000), 324 (9000), 379 (12000), 563 nm (4500 M–1 cm–1); Fluorescence
(DMSO; λexc = 339 nm; slit = 5x5): λem = 375, 399 nm, Φ = 1.12·10–2; elemental
analysis calcd (%) for C16H15N3S4Pt: C 33.66, H 2.64, N 7.34, S 22.39; found: C 34.53,
H 1.64, N 7.45, S 23.98; CV (DMF): E1/2 vs Fc+/Fc (scan rate 100 mV s–1) = -1.740, -
0.015 V.
5.2.2.2.17. Synthesis and characterisation of [Pt(4,4ʹ-tBu2-bipy)(Me-dmet)] (69)
The complex was synthesised as described for [Pt(2,2ʹ-bipy)(Me-dmet)] (56) starting
from [Pt(4,4ʹ-tBu2-bipy)Cl2] (45, 0.14 g, 0.23 mmol). X-ray-quality crystals were
obtained by slow infusion of petroleum ether into a CH2Cl2 solution of the
complex.Yield: 0.10 g (65%); m.p. >240 °C; FTIR: ṽ =668 (w), 735 (w), 837 (s), 877
(m), 902 (w), 941 (s), 1014 (w), 1086 (m), 1143 (vs), 1203 (w), 1253 (m), 1309 (w),
1343 (s), 1364 (w), 1417 (s), 1458 (w), 1490 (w), 1512 (m), 1541 (w), 1560 (w), 1616
(s), 2960 (m) cm–1 ; UV-Vis-NIR (DMSO): λ (ε) = 258 (24000), 291 (24000), 313
(9000), 325 (10000), 379 (13000), 564 nm (5000 M–1 cm–1); Fluorescence (DMSO; λexc
= 341 nm; slit = 5x5): λem = 375, 399 nm, Φ = 1.55·10–2; 1H NMR (DMSO-d6): δ =
8.970, 8.891, 8.772, 7.917, 3.392, 1.547 ppm; elemental analysis calcd (%) for
C22H27S4N3Pt: C 40.23, H 4.14, N 6.40, S 19.53; found: C 41.46, H 4.60, N 6.73, S
18.80; CV (DMF): E1/2 vs Fc+/Fc (scan rate 100 mV s–1) = -1.692, -0.015 V.
5.2.2.2.18. Synthesis and characterisation of [Pt(4,4ʹ-Ph2-bipy)(Me-dmet)] (70)
Page 242
Experimental
228
The complex was synthesised as described for [Pt(2,2ʹ-bipy)(Me-dmet)] (56) starting
from [Pt(4,4ʹ-Ph2-bipy)Cl2] (46, 0.12 g, 0.20 mmol). Yield: 0.08 g (56%); m.p. >240 °C;
FTIR: ṽ = 412 (m), 473 (w), 535 (m), 629 (w), 638 (w), 691 (s), 723 (w), 756 (s), 835
(m), 878 (m), 938 (m), 1014 (w), 1078 (m), 1142 (vs), 1257 (w), 1341 (s), 1412 (s),
1505 (m), 1541 (m), 1613 cm–1 (s); UV-Vis-NIR (DMSO): λ (ε) = 264 (38000), 300
(34000), 341 (15000), 381 (15000), 608 nm (5600 M–1 cm–1); Fluorescence (DMSO;
λexc = 350 nm; slit = 5x5): λem = 372, 391 nm, Φ = 1.84·10–2; 1H NMR (DMSO-d6): δ =
9.241, 9.013, 8.943, 8.196, 8.061, 7.749, 3.648 ppm; elemental analysis calcd (%) for
C24H19S4N3Pt: C 42.85, H 2.85, N 6.24, S 19.06; found: C 43.69, H 2.73, N 6.37, S
20.12; CV (DMF): E1/2 vs Fc+/Fc (scan rate 100 mV s–1) = -2.112, -1.561, -0.040 V.
5.2.2.2.19. Synthesis and characterisation of [Pt(3,7-Ph2-phen)(Me-dmet)] (71)
The complex was synthesised as described for [Pt(2,2ʹ-bipy)(Me-dmet)] (56) starting
from [Pt(4,7-Ph2-phen)Cl2] (47, 0.11 g, 0.19 mmol). Yield: 0.10 g (72%); m.p. >240 °C;
FTIR: ṽ = 489 (w), 533 (m), 577 (w), 637 (m), 666 (m), 701 (s), 729 (m), 763 (s), 833
(m), 934 (m), 1018 (w), 1084 (m), 1144 (vs), 1228 (m), 1339 (s), 1400 (w), 1423 (s),
1443 (w), 1508 (m), 1558 (w), 1600 (w), 1621 cm–1 (w); UV-Vis-NIR (DMSO): λ (ε) =
274 (39000), 298 (39000), 341 (16000), 377 (18000), 794 nm (5700 M–1 cm–1);
Fluorescence (DMSO; λexc = 338 nm; slit = 5x5): λem = 373, 394 nm, Φ = 1.83·10–2;
elemental analysis calcd (%) for C26H19S4N3Pt: C 44.82, H 2.75, N 6.03, S 18.41;
found: C 46.34, H 3.14, N 6.50, S 17.82; CV (DMF): E1/2 vs Fc+/Fc (scan rate 100 mV
s–1) = -1.561, -0.002 V.
5.2.2.2.20. Synthesis and characterisation of [Pt(3,4,7,8-Me4-phen)(Me-dmet)] (72)
The complex was synthesised as described for [Pt(2,2ʹ-bipy)(Me-dmet)] (56) starting
from [Pt(3,4,7,8-Me4-phen)Cl2] (48, 0.11 g, 0.22 mmol). Yield: 0.08 g (58%); m.p.
Page 243
Experimental
229
>240 °C; FTIR: ṽ = 472 (w), 533 (m), 580 (w), 708 (s), 800 (m), 901 (w), 935 (m), 1011
(w), 1084 (m), 1143 (vs), 1336 (s), 1385 (m), 1431 (m), 1508 (s), 1541 (w), 1560 (w),
1577 (w), 1625 (m), 1647 (s), 1654 (w), 1701 (w), 1718 (w), 1735 cm–1 (w); UV-Vis-
NIR (DMSO): λ (ε) = 265 (15000), 285 (16000), 378 (6000), 549 nm (3700 M–1 cm–1);
Fluorescence (DMSO; λexc 345 = nm; slit = 5x5): λem = 384, 402 nm, Φ = 6.45·10–3;
elemental analysis calcd (%) for C20H19N3S4Pt: C 38.45, H 3.06, N 6.73, S 20.53;
found: C 38.65, H 3.13, N 6.61, S 18.24; CV (DMF): E1/2 vs Fc+/Fc (scan rate 100 mV
s–1) = -1.789 V.
5.2.2.2.21. Synthesis and characterisation of [Pt(4,4ʹ-tBu2-bipy)(Fc,H-edt)] (73)
The complex was synthesised as described for [Pt(4,4ʹ-tBu2-bipy)(Me-dmet)] (69)
starting from ferrocenyl-1,3-dithiol-2-one (74, 65 mg, 0.21 mmol). Yield: g 0.09 (60%);
m.p. >240 °C; FTIR: ṽ = 419 (w), 465 (m), 491 (s), 515 (w), 564 (w), 599 (s), 643 (m),
736 (m), 767 (s), 798 (m), 815 (w), 834 (vs), 850 (w), 865 (w), 876 (w), 903 (w), 951
(m), 999 (m), 1022 (m), 1034 (vw), 1049 (m), 1129 (w), 1205 (s), 1265 (w), 1313 (w),
1358 (m), 1370(w), 1395 (w), 1416 (vs), 1463 (m), 1479 (m), 1535 (w), 1555 (w), 1589
(w), 1614 (vs), 1655 (w), 2869 (w), 2955 (m), 3089 cm–1 (w); UV-Vis-NIR (DMSO):
λ (ε) = 256 (21000), 296 (29000), 413 (1800), 611 nm (5400 M–1 cm–1); Fluorescence
(DMSO; λexc = 351 nm; slit = 5x5): λem = 372, 392, 409 nm, Φ = 1.37·10–2; elemental
analysis calcd (%) for C30H34N2S2PtFe: C 48.84, H 4.65, N 3.80, S 8.69; found: C
48.44, H 4.53, N 3.67, S 8.61; CV (CH2Cl2): E1/2 vs Fc+/Fc (scan rate 100 mV s–1) = -
1.472, 0.216, 0.613, 0.773 V; Mass spectrum: m/z 737 (M+).
Page 244
Experimental
230
5.2.2.3. Synthesis and characterisation of [Au(Py1)(mnt)] (76)
11 mg (2.52·10–5 mol) of [Au(Py1)(Cl2)] (77) were reacted with 1 equivalent (4.7 mg) of
disodium 1,2-maleonitrile-1,2-dithiolate in 30 mL of a CH2Cl2/MeCN mixture (1:2 v/v)
for 10 minutes in an Aldrich pressure tube at 130 °C. After cooling, the resulting yellow
precipitate was filtered off and washed with H2O. Yield: 1 mg (8%); m.p. >240 °C;
FTIR: ṽ = 497 (m), 552 (m), 622 (s), 669 (w), 710 (w), 752 (vs), 959 (w), 1022 (w),
1035 (w), 1155 (w), 1169 (w), 1226 (w), 1384 (m), 1430 (w), 1438 (w), 1459 (w), 1489
(w), 1508 (s), 1541 (w), 1560 (w), 1610 (w), 1637 (w), 1648 (w), 1654 (w), 1717 (w),
2211 cm–1 (m); UV-Vis-NIR (DMF): λ (ε) = 268 (35000), 334 sh (6000), 349 nm (8000
M–1 cm–1); Fluorescence (DMSO; λexc = 339 nm; slit = 5x5): λem = 377, 406 nm, Φ =
9.88·10–3; elemental analysis calcd (%) for C16H10N3SAu: C 38.03, H 1.99, N 8.31, S
12.69; found: C 37.52, H 1.36, N 8.16, S 11.16; CV (DMSO): Epa vs Fc+/Fc (scan rate
100 mV s–1) = -1.20 V.
5.3. Theoretical Calculations
Theoretical calculations were performed at the DFT level with the Gaussian suite of
programs (in the editions G03, Rev. E.01, or G09, Rev. A.02)239,240 on a 64-bit E4
workstation equipped with four quad-core AMD Opteron processors and 16 Gb of
RAM and running the OpenSuSE 10.2 Linux operating system. As a general procedure,
geometry were optimised starting from structural data, when available. The nature of the
minima of each optimised structure was verified by harmonic frequency calculations
(freq=raman keyword). Natural and Mulliken atomic charges were calculated at the
optimised geometries. When required, electronic transition energies and oscillator
strength values were calculated at TD-DFT level. The electronic spectra were simulated
Page 245
Experimental
231
by a convolution of Gaussian functions centred at the calculated excitation energies.
The programs Gaussview 5.0,241 Gabedit 2.1.0242 and Molden 4.7-4.9243 were used to
investigate the charge distributions and molecular orbital shapes. The software
GaussSum 2.1244
5.3.1. Calculations on [Au(Ar,H-edt)2]x– complexes (20x–-22x–) (x = 0-2)
was used to calculate the molecular orbital contributions (MOC) from
groups of atoms, along with the contribution of singly excited configurations to each
electronic transition, and to generate all the necessary data to simulate absorption
spectra.
Theoretical calculations were performed on the cis and trans isomers of complexes 20x–,
21x– and 22x– adopting the mPW1PW198 hybrid functional. Schäfer, Horn, and Ahlrichs
double-ζ plus polarisation all-electron basis sets199 were used for C, H, and S, whereas
the LanL2DZ (d,p)200 basis set with relativistic effective core potentials200 was adopted
for the heavier Au species. Geometry optimisations were performed on the cis and trans
isomers, and were regularised by letting the model complexes belong to an ideal C2
point group, with the Au(C2S2)2 planar core lying on the xy plane and the y axis crossing
the C-C bond middle points. PES scanning was performed for the three complexes (cis
and trans isomers) by imposing the rotation of the phenyl ring (between -90 and 90°,
steps of 10°) and optimising the resulting geometry at each rotational step
(opt=modredundant keyword).
5.3.2. Calculations on [Pt(N^N)(S^S)] complexes (53-73, 75) and [Au(Py1)(mnt)]
(76)
Theoretical calculations were performed adopting the PBE0 (PBE1PBE)220 hybrid
functional. Schäfer, Horn, and Ahlrichs double-ζ plus polarisation all-electron basis
Page 246
Experimental
232
sets199 were used for C, H, N, S, Se and Fe, whereas the CRENBL221 basis set with
relativistic effective core potentials200 was adopted for the heavier Pt and Au species.245
The choice of this computational setup derives from a series of preliminary calculations
performed on 56 and 59, the results of which are summarised in Annex A. Geometry
optimisations were regularised by letting the model complexes belong to an ideal Cs (for
56-59, 63-72 and 75) or C1 (for 53-55, 60-62, 73, and 76) point group. For the geometry
optimisation of the complexes, tight SCF convergence criterion (SCF=tight keyword)
and fine numerical integration grids [Integral(FineGrid) keyword] were used. In order
to determine the influence of the solvent on the properties of the complexes, solvation
calculations were also carried out at the same level of theory, by using the IEF-PCM
model of SCRF theory
222 [SCRF=(solvent=) keyword]. The programs Gabedit 2.1.0242
and Molden 4.7243 were used to investigate the charge distributions and molecular
orbital shapes. The software GaussSum 2.1244 was used to calculate the molecular
orbital contributions (MOC) from groups of atoms, along with the contribution of singly
excited configurations to each electronic transition, and to generate all the necessary
data to simulate absorption spectra.
Page 247
Annex
233
Annex A
A.1. Preliminary calculations performed on 56
As mentioned in Sections 3.2.1.7 and 5.3.1, the theoretical investigation performed on
[Pt(N^N)(S^S)] complexes 53-73 was preceded by a series of preliminary calculations
aimed at identifying a proper computational setup for these systems. Complex 56 was
chosen as a benchmark compound, and both the functional and the basis set (BS) for the
metal atom were systematically varied, while Ahlrichʹs double-ζ basis set with
polarisation functions199 was adopted for light atomic species in all calculations. The
functionals tested include: (i) pure functionals such as PW91PW91,246 PBEPBE,247
wPBEhPBE,248 and PBEhPBE;249 (ii) the hybrid functionals B3LYP,250
220
PBE0
(PBE1PBE), PBEh1PBE,249 and mPW1PW;198 (iii) pure functionals implemented
with the long-range correction by Hirao and coworkers,251
251
namely LC-PBEhPBE, LC-
PBEPBE, and LC-PW91PW91; (iv) and long-range corrected functionals such as LC-
wPBE, CAM-B3LYP,252 and wB97X.253 221 As regards BSs, CRENBL, LanL2DZ,200
LanL2TZ,254 SBKJC VDZ,255 and Stuttgardt RSC 1997256
200
BSs, all with Effective Core
Potentials (ECPs), were tested.
In the first part of this study, the geometry of 56 was optimised employing the
CRENBL+ECP257 and Ahlrichs pVDZ BSs on Pt and light atomic species, respectively,
and by systematically varying the functional. These calculations were performed both in
the gas phase and by simulating the presence of CH2Cl2 by means of the IEF-PCM
approach of SCRF theory. In Table A.1, selected average optimised bond lengths
obtained in the gas phase with the fifteen functional adopted are listed. An examination
of the results clearly shows that DFT provides very reliable estimates of the selected
bond distances, with average bond lengths values of 2.29(2), 2.05(2), 1.74(1), and
Page 248
Annex
234
1.36(2) Å for Pt-S, Pt-N, C-S, and C-C distances, respectively. In order to evaluate the
closeness between calculated and experimental metric parameters, both absolute and
relative differences were evaluated. In Table A.1 the sum of the relative deviations
(SRD) over the four selected distances is reported (the crystal data of 57, differing from
56 just for the presence of an ethyl in place of a methyl substitutent at the 1,2-dithiolene
ligand, were exploited for this purpose). These data show that the optimised geometries
in best agreement with experimental ones were obtained by adopting the long-range
corrected functionals and the mPW1PW, PBE0, and PBEh1PBE ones, the Pt-S
distances being particularly affected by the functional.
Table A.1. Selected average experimental bond lengths (Å) for 57, corresponding optimised distances (Å)
obtained with different functionals on 56, and sum of relative deviations (SRD).a,b
Pt-S Pt-N C-S C-C SRD·10–2
wB97X 2.297 2.082 1.747 1.350 3.79
LC-wPBE 2.276 2.055 1.726 1.338 2.29
CAM-B3LYP 2.296 2.067 1.748 1.351 3.03
PW91PW91 2.296 2.067 1.748 1.351 5.17
LC-PW91PW91 2.254 2.025 1.726 1.338 3.50
PBEPBE 2.300 2.045 1.740 1.384 5.19
LC- PBEPBE 2.253 2.023 1.727 1.339 3.51
PBEhPBE 2.306 2.05 1.741 1.384 5.50
LC- PBEhPBE 2.254 2.024 1.727 1.339 3.42
wPBEhPBE 2.306 2.050 1.741 1.384 5.50
mPW1PW 2.285 2.043 1.736 1.362 3.22
PBE0 2.282 2.040 1.735 1.363 3.36
PBEh1PBE 2.286 2.043 1.735 1.363 3.39
B3LYP 2.310 2.068 1.747 1.367 4.94
Experimental values 2.2715 2.0465 1.7515 1.341 / a Atom labelling scheme as in Figure 3.22. b CRENBL+ECP BS for Pt.
Page 249
Annex
235
Furthermore, time-dependent DFT (TD-DFT) calculations were carried out on 56 at the
geometries optimised with the different functionals, and the results obtained by
adopting the IEF-PCM model of the SCRF approach were compared with the
experimental spectroscopic features of 56 in CH2Cl2. In particular, the energy of the
S0→S1 transition (mainly deriving from the HOMO→LUMO excitation), responsible
for the experimental solvatochromic absorption (Section 3.2.1.7.3), was analysed, and
the results are listed in Table A.2.
Table A.2. Absorption maxima λmax (nm) for the electronic transition S0→S1 calculated at IEF-PCM
SCRF TD-DFT level for 56 with different functionals, corresponding experimental value, and difference
between experimental and calculated data ∆λmax (nm).a
λmax ∆λmax Experimental 633 / wB97X 381 -252 LC-wPBE 359 -274 CAM-B3LYP 489 -144 PW91PW91 1077 444 LC-PW91PW91 343 -290 PBEPBE 1076 443 LC- PBEPBE 344 -289 PBEhPBE 1085 452 LC- PBEhPBE 344 -289 wPBEhPBE 1085 452 mPW1PW 359 -244 PBE0 739 106 PBEh1PBE 740 107 B3LYP 826 193 a CRENBL+ECP BS for Pt
The data clearly show that the energy of this transition is over- or under-stimated by all
calculations (-290 nm < ∆λmax < 452 nm), but the lowest absolute values of ∆λmax (106-
107 nm) are found for calculations performed with PBE0 and PBEh1PBE functionals.
Thus, given the combined results of geometry optimisation and TD-DFT calculations,
Page 250
Annex
236
the functional PBE0 was chosen to perform the DFT calculations on all [Pt(N^N)(E^E)]
complexes included in the present study.
Calculations were then performed on 56 by adopting the PBE0 functional, in
combination with four different BSs, all featuring ECPs, in order to compare the results
of these calculations with the ones obtained by employing the CRENBL+ECP basis set.
Also in this case, a geometry optimisation was performed for each BS both in the gas
phase and by adopting the IEF-PCM approach (CH2Cl2), followed by TD-DFT
calculations. The results were evaluated by comparing selected optimised bond lengths
with corresponding experimental values of 57, and S0→S1 transition energies with
experimental λmax of the solvatochromic absorption band. The results are listed in
Tables A.3 and A.4.
Table A.3. Selected average experimental bond lengths (Å) for 57, corresponding optimised distances (Å)
obtained with different basis sets (all featuring ECPs) on 56, and sum of relative deviations (SRD).a,b
Pt-S Pt-N C-S C-C SRD·10–2
Experimental 2.271 2.046 1.751 1.341 /
CRENBL 2.282 2.040 1.735 1.363 3.36
LANL2DZ 2.300 2.050 1.733 1.363 4.14
LANLDTZ 2.277 2.031 1.732 1.363 3.79
SBKJC VDZ 2.292 2.054 1.733 1.363 4.00
Stuttgardt RSC 1997 2.290 2.051 1.734 1.362 3.63 a Atom labelling scheme as in Figure 3.22. b PBE0 functional.
The results obtained from the geometry optimisations indicate that calculations
performed by adopting the CRENBL+ECP basis set feature the best agreement between
experimental and calculated data, thus confirming the previous results.257 On the other
hand, regarding TD-DFT calculations, no significant differences can be observed in the
Page 251
Annex
237
energy of the S0→S1 electronic transition calculated with the five BSs under exam (less
than 15 nm, ∆λmax = 100-112 nm), thus suggesting that excited state calculations are not
particularly affected by the identity of the BS employed. Thus, given the very good
agreement between experimental and optimised geometries obtained by employing the
CRENBL+ECP BS, it was chosen to perform DFT calculations on all [Pt(N^N)(E^E)].
Table A.4. Absorption maxima λmax (nm) of the electronic transition S0→S1 calculated for 56 at IEF-
SCRF TD-DFT level with different BSs (all with ECPs) in CH2Cl2, corresponding experimental value,
and difference between experimental and calculated data ∆λmax (nm).a
λmax ∆λmax Experimental 633 / CRENBL 739 106 LANL2DZ 733 100 LANL2TZ 733 100 SBKJC VDZ 736 103 Stuttgardt RSC 1997 745 112 a PBE0 functional.
A.2. Calculations performed on 59 with CRENBL+ECP on Se
As already mentioned in Section 5.3.1, the geometry of 59 was optimised also by
adopting the CRENBL+ECP BS instead of the full-electron Ahlrichs pVDZ BS for Se,
in order to account for the relativistic effects for this heavy atomic species. In Table A.5
selected optimised bond lengths obtained in the gas phase with the two basis sets are
listed, along with corresponding experimental values and the sum of relative deviations
(SRD). Given the very small difference between the two values of SRD obtained (less
than 1x10⁻³), the improvement conferred by ECPs to the agreement between
experimental and calculated data was considered negligible, and thus the Ahlrichs BS
Page 252
Annex
238
was employed on all atomic species but the metals to perform the DFT calculations on
59, analogously to all other [Pt(N^N)(E^E)] complexes included in this study.
Table A.5. Selected average experimental bond lengths (Å) for 59, corresponding optimised distances (Å)
obtained with full electron Ahlrichs pVDZ and CRENBL basis sets, and sum of relative deviations
(SRD).a,b
Experimental Ahlrichs pVDZ CRENBL+ECP
Pt-Se 2.387 2.386 2.403
Pt-N 2.068 2.058 2.053
C-Se 1.902 1.875 1.887
C-C 1.319 1.359 1.356
SRD / 4.94·10–2 4.90·10–2 a Atom labelling scheme as in Figure 3.22. b PBE0 functional.
Page 253
References and Notes
239
References and Notes
1J. A. McCleverty, Prog. Inorg. Chem., 1968, 10, 49. 2 (a) W. H. Mills, R. E. D. Clarck, J. Chem. Soc., 1963, 175; (b) R. E. D. Clarck, Analyst, 1936, 60, 242; (c)
R. E. D. Clarck, Analyst, 1937, 62, 661. 3 G. Bähr, H. Schleitzer, Chem. Ber., 1957, 90, 438. 4 D. B. Stevancevic, V. C. Drazic, Bull. Inst. Nucl. Sci. “Boris Kidrich”, 1959, 9, 69. 5 G. N. Schrauzer, V. P. Mayweg, J. Am. Chem. Soc., 1962, 84, 3221. 6 H. B. Gray, R. Willimas, I. Bernal, E. Billig, J. Am. Chem. Soc., 1962, 84, 3596. 7 This is testified, as an example, by the recent publication of the volume “Dithiolene Chemistry-Synthesis,
Properties, and Applications” (E. I. Stiefel ed., Progr. Inorg. Chem., 2004, 52) and the Special Issue
“Dithiolenes and non-innocent redox-active ligands” in Coord. Chem. Rev., 2010, 254. 8 F. J. Hine, A. J. Taylor, C. D. Garner, Coord. Chem. Rev., 2010, 254, 1570. 9 (a) A. Davison, E. T. Shawl, Chem. Commun., 1967, 670; (b) A. Davison, E. T. Shawl, Inorg. Chem., 1970,
9, 1820. 10 See for example: (a) G. Matsubayashi, S. Tanaka, A. Yokozawa, J. Chem. Soc., Dalton Trans., 1992, 1827;
(b) S. Ford, C. P. Morley, M. Di Vaira, Inorg. Chem., 2004, 43, 7101; (c) M. Nomura, T. Cauchy, M.
Geoffroy, P. Adkine, M. Formiguè, Inorg. Chem., 2006, 45, 8194; (d) C. C. McLauchlan, S. D. Robowski,
J. A. Ibers, Inorg. Chem., 2001, 40, 1372; (e) R.-M. Olk, B. Olk, J. Rohloff, J. Reinhold, J. Sieler, K.
Trübenbach, R. Kimrse, E. Hoyer, Z. Anorg. Allg. Chem., 1992, 609, 103. 11 (a) T. Klapötke, H. Köpf, P. Gowik, Polyhedron, 1987, 6, 1923; (b) R. D. McCullough, J. A. Belot, J. Seth,
A. L. Rheingold, G. P. A. Yap, D. O. Cowan, J. Mater. Chem., 1995, 5, 1581; (c) W. A. Flomer, J. W.
Kolis, Inorg. Chem., 1989, 28, 2513; (d) D. M. Giolando, T. B. Rauchfuss, A. L. Rheingold, Inorg. Chem.,
1987, 26, 1636. 12 M.C. Aragoni, M. Arca, F. Demartin, F. A. Devillanova, A. Garau, F. Isaia, F. Lelj, V. Lippolis, G. Verani,
J. Am. Chem. Soc., 1999, 121, 7098. 13 T. B. Rauchfuss, Progr. Inorg. Chem., 2004, 52, 1. 14 G. C. Papavassiliou, S. Y. Yiannoupoulos, J. S. Zambounis, Chem. Scr., 1987, 27, 265. 15 N. D. Lowe, C. D. Garner, J. Chem. Soc., Dalton Trans., 1993, 2197. 16 D. J. Sandman, G. W. Allen, L. A. Acampora, J. C. Stark, S. Jansen, M. T. Jones, G. J. Ashwell, B. M.
Foxman, Inorg. Chem., 1987, 26, 1664. 17 E. S. Davies, R. L. Beddoes, D. Collinson, A. Dinsmore, A. Docrat, J.A. Joule, C. R. Wilson, C. D. Garner,
J. Chem. Soc., Dalton Trans., 1997, 3985. 18 (a) H. Sugimoto, M. Harihara, M. Shiro, K. Sugimoto, K. Tanaka, H. Miyake, H. Tsukube, Inorg. Chem.,
2005, 44, 6386; (b) J. M. Tunney, A. J. Blake, E. S. Davies, J. McMaster, C. Wilson, C. D. Garner,
Polyhedron, 2006, 25, 591. 19 Y. Gareau, A. Beuchemin, Heterocycles, 1998, 48, 2003. 20 R. K. Brown, T. J. Bergendahl, J .S. Wood, J. H. Waters, Inorg. Chim. Acta, 1983, 68, 79. 21 F. Wudl, E. T. Zellers, S. D. Cox, Inorg. Chem., 1985, 24, 2864. 22 A. Davison, R. H. Holm, Inorg. Synth., 1967, 10, 8.
Page 254
References and Notes
240
23 (a) G. Steimecke, H. J. Sieler, R. Kirmse, E. Hoyer, Phosphorus and Sulphur, 1979, 7, 49; (b) R.-M. Olk,
W. Dietzsch, E. Hoyer, Synth. React. Inorg. Met.-Org. Chem., 1984, 14, 915; (c) G. Matsubayashi, A.
Yokozawa, J. Chem. Soc., Dalton Trans., 1990, 3535; (d) G. Matsubayashi, A. Yokozawa, J. Chem. Soc.,
Dalton Trans., 1990, 3013; (e) G. Matsubayashi, K. Akiba, J. Chem. Soc., Dalton Trans., 1990, 115; (f) R.-
M. Olk, W. Dietzsch, E. Hoyer, G. Steimecke, Patent DD236100, 1986; (g) M. Kodani, K. Takimiya, Y.
Aso, T. Otsubo, T. Nakayashiki, Y. Misaki, Synthesis, 2001, 1614; (h) E. Cerrada, M. Laguna, Can. J.
Chem., 1998, 76, 1033. 24 R.-M. Olk, W. Dietzsch, R. Kirmse, J. Stack, E. Hoyer, Inorg. Chim. Acta, 1987, 128, 251. 25 (a) K. Hartke, T. Kissel, J. Quante, and R. Matusa, Chem. Ber., 1980, 113, 1898; (b) J. P. Cornelissen, B.
Pomarede, A. L. Spek, D. Reefman, J. P. Haasnoot, J. Reedijk, Inorg. Chem., 1993, 32, 3720. 26 (a) F. Bigoli, P. Deplano, F.A. Devillanova, V. Lippolis, P. J. Lukes, M. L. Mercuri, M. A. Pellinghelli, E.
F. Trogu, J. Chem. Soc., Chem. Commun., 1995, 371; (b) F. Bigoli, P. Deplano, F.A. Devillanova, V.
Lippolis, P. J. Lukes, M. L. Mercuri, M. A. Pellinghelli, E. F. Trogu, J. M. Williams, Inorg. Chem., 1997,
36, 1218; (c); F. Bigoli, P. Deplano, M. L. Mercuri, M. A. Pellinghelli, G. Pintus, E. F. Trogu,, G.
Zonnedda, H. H. Wang, J. M. Williams, Inorg. Chim. Acta, 1998, 273, 175; (d) M. Arca, F. Demartin, F. A.
Devillanova, A. Garau, F. Isaia, F. Lelj, V. Lippolis, S. Pedraglio, G. Verani, J. Chem. Soc., Dalton Trans.,
1998, 3731; (e) F. Bigoli, S. Curreli, P. Deplano, L. Leoni, M. L. Mercuri, M. A. Pellinghelli, A. Serpe, E.
F. Trogu, J. Chem. Soc., Dalton Trans., 2002, 1985. 27 M. C. Aragoni, M. Arca, F. A. Devillanova, F. Isaia, V. Lippolis, A. Mancini, L. Pala, A. M. Z. Slawin, J.
D. Woollins, Inorg. Chem., 2005, 44, 9610. 28 (a) S. Eid, M. Formigué, T. Roisnel, D. Lorcy, Inorg. Chem., 2007, 46, 10647; (b) S. Eid, M. Guerro, D.
Lorcy, Tetrahedron Lett., 2006, 47, 8333. 29 G. Periyasamy, N. A. Burton, I. H. Hillier, M. A. Vicent, H. Disley, J. McMaster, C. D. Garner, Faraday
Discuss., 2007, 135, 469. 30 K. Jørgeson, Coord. Chem. Rev., 1966, 1, 164. 31 M. D. Ward, J. A. McCleverty, J. Chem. Soc., Dalton Trans., 2002, 275. 32 G. Bruno, M. Almeida, F. Artizzu, J. C. Dias, M. L. Mercuri, L. Pilia, C. Rovira, X. Ribas, A. Serpe, P.
Deplano, Dalton. Trans., 2010, 39, 4566. 33 H. Alves, D. Simão, I. C. Santos, V. Gama, R. Y. Henriques, H. Novais, M. Almeida, Eur. J. Inorg. Chem.,
2004, 1318. 34 H. Sugimoto, M. Tarumizu, K. Tanaka, H. Miyake, H. Tsukube, Dalton Trans., 2005, 3558. 35 (a) H. Fujiwara. E. Ojima, H. Kobayashi, T. Courcet, I. Malfant, P. Cassoux, Eur. J. Inorg. Chem., 1998,
1631; (b) Y. Ji, J.-L. Zuo, L. Chen, Y.-Q. Tian, Y. Song, Y.-Z. Li, X.-Z- You, J. Phys. Chem. Sol., 2005,
66, 207; (c) J. Morgado, L. C. Santos, M. T. Duarte, L. Alcacer, M. Almeida, Chem. Commun., 1996, 1837. 36 U. Zoller, Compr. Heterocycl. Chem. II, 1996, 1B, 1113. 37 U. T. Mueller-Westerhoff, B. Vance, Compr. Coord. Chem., 1987, 2, 597. 38 (a) G. N. Schrauzer, V. P. Mayweg, J. Am. Chem. Soc., 1965, 87, 1483; (b) G. N. Schrauzer, V. P.
Mayweg, W. Heinrich, Inorg. Chem., 1965, 4, 1615. 39 S. Sheibe, B. J. Pedersen, S.-O. Lawesson, Bull. Soc. Chim. Belg., 1978, 87, 229. 40 U. T. Mueller-Westerhoff, B. Vance, D. I. Yoon, Tetrahedron, 1991, 110, 115.
Page 255
References and Notes
241
41 (a) C. M. Bolinger, T. B. Rauchfuss, S. R. Wilson, J. Am. Chem. Soc., 1981, 103, 5620; (b) T. B.
Rauchfuss, Inorg. Chem., 2004, 43, 14. 42 (a) C. M. Bolinger, T. B. Rauchfuss, Inorg. Chem., 1982, 21, 3947; (b) R.-M. Olk, W. Dietzsch, J.
Kahlmeier, P. Jörchel, R. Kirmse, J. Sieler, Inorg. Chim. Acta, 1997, 254, 375; (c) F. Bigoli, P. Cassoux, P.
Deplano, M. L. Mercuri, M. A. Pellinghelli, G. Pintus, A. Serpe, E. F. Trogu, J. Chem. Soc., Dalton Trans.,
2000, 4639. 43 (a) L. Ambrosio, M. C. Aragoni, M. Arca, F. A. Devillanova, M. B. Hursthouse, S. L. Huth, F. Isaia, V.
Lippolis, A. Mancini, A. Pintus, Chem. Asian J., 2010, 5, 1395; (b) M. C. Aragoni, M. Arca, F. A.
Devillanova, F. Isaia, V. Lippolis, A. Pintus, Chem. Asian J., 2011, 6, 198. 44 (a) R. Eisenberg, J. A. Ibers, R. J. H. Clark, H. B. Gray, J. Am. Chem. Soc., 1964, 86, 113; (b) R.
Eisenberg, J. A. Ibers, Inorg. Chem., 1965, 4, 605. 45 (a) R. Eisenberg, Progr. Inorg. Chem., 1970, 12, 295; (b) S. A. Baudron, N. Avarvari, P. Batail, Inorg.
Chem., 2005, 44, 3380; (c) T. Arliguie, P. Thuéry, M. Formigué, M. Ephritikhine, Eur. J. Inorg. Chem.,
2004, 4502; (d) R. P. Burns, C. A. McAuliffe, Adv. Inorg. Chem. Radiochem., 1979, 22, 303; (e) F.-Y.
Dong, J.-M. Dou, D.-C. Li, X.-K. Gao, D.-Q. Wang, J. Mol. Struct., 2005, 738, 79. 46 C. L. Beswick, J. Schulman, E. I. Stiefel, Progr. Inorg. Chem., 2004, 52, 55. 47 CCDC ConQuest version v. 5.31 updated to Feb. 2010. 48 In bis(1,2-dithiolene) complexes, the M-S distances range between 2.101 and 2.563 Å. Ni complexes show
the shortest average M-S bond distances recorded, while the complexes based on Mn, Hg, Cd, and Ag
feature the longest ones (Figure 1.4). Within the series containing the complexes of a single element, a
correlation can be generally found between the average M-S bond length and the charge of the complex,
negatively charged complexes typically featuring longer M-S distances.46 49 (a) X. Ribas, J. C. Dias, J. Morgado, K. Wurst, I. C. Santos, M. Almeida, J. Vidal-Gancedo, J. Veciana, C.
Rovira, Inorg. Chem., 2004, 43, 3631; (b) X. M. Ren, T. Akutagawa, S. Nishihara, T. Nakamura, Synth.
Met., 2005, 150, 57. 50 (a) P. I. Clemenson, Coord. Chem. Rev., 1990, 106, 171; (b) X. Ribas, J. C. Dias, J. Morgado, K. Wurst, E.
Molins, E. Ruiz, M. Almeida, J. Veciana, C. Rovira, Chem. Eur. J., 2004, 10, 1691. 51 Y.-K. Han, D.-K. Seo, H. Kang, W. Kang, D.-Y. Noh, Inorg. Chem., 2004, 43, 7294. 52 (a) M. A. Ansari, C. H. Mahler, J. A. Ibers, Inorg. Chem., 1989, 28, 2669; (b) R. B. King, J. Organomet.
Chem., 2001, 623, 95; (c) X. Ribas, J. C. Dias, J. Morgado, K. Wurst, M. Almeida, T. Parella, J. Veciana,
and C. Rovira, Angew. Chem. Int. Ed., 2004, 13, 4049. 53 (a) E. I. Stiefel, G. F. Brown, Inorg. Chem., 1972, 11, 434; (b) G. F. Brown, E. I. Stiefel, Inorg. Chem.,
1973, 12, 2140. 54 M. L. Kirk, R. L. McNaughton, M. E. Helton, Progr. Inorg. Chem., 2004, 52, 111. 55 S. I. Shupack, E. Billig, R. J. H. Clark, R. Williams, H. B. Gray, J. Am. Chem. Soc., 1964, 86, 4594. 56 S. Alvarez, R. Vicente, R. Hoffman, J. Am. Chem. Soc., 1985, 107, 6253. 57 See for example the following recent reviews: (a) S. Sproules, K. Wieghardt, Coord. Chem. Rev., 2010,
254, 1358; (b) S. Zàliš, R. F. Winter, W. Kaim, Coord. Chem. Rev., 2010, 254, 1383; (c) A. B. P. Lever,
Coord. Chem. Rev., 2010, 254, 1397.
Page 256
References and Notes
242
58 (a) I. Malfant, N. Cordente, P. G. Lacroix, C. Lepetit, Chem. Mater., 1998, 10, 4079; (b) P. Rosa, L.
Ricard, P. Le Floch, F. Mathey, G. Sini, O. Eisenstein, Inorg. Chem., 1998, 37, 3154. 59 B. S. Lim, D. V. Fomitchev, R. H. Holm, Inorg. Chem., 2001, 40, 4257. 60 B. Garreau-de Bonneval, K. I. Moineau-Chane Ching, F. Alary, T.-T. Bui, L. Valade, Coord. Chem. Rev.,
2010, 254, 1457. 61 A. L. Bach, R. H. Holm, J. Am. Chem. Soc., 1966, 88, 5201. 62 V. Bachler, G. Olbrich, F. Neese, K. Wieghardt, Inorg. Chem., 2002, 41, 4179. 63 L. Noodelman, J. Chem. Phys., 1981, 74, 5737. 64 (a) L. Serrano-Andres, A. Avramopoulos, J. B. Li, P. Labeguerie, D. Begue, V. Kello, M. G.
Papadopoulos, J. Chem. Phys., 2009, 131, 134312; (b) F. Alary, J.-L. Heully, A. Scemama, B. Garreau de
Bonneval, K. I. Chane-Ching, M. Caffarel, Theor. Chem. Acc., 2010, 126, 275. 65 K. Ray, T. Petrenko, K. Wieghardt, F. Neese, Dalton Trans., 2007, 1552. 66 G. Bruno, M. Almeida, D. Simao, M. L. Mercuri, L. Pilia, A. Serpe, P. Deplano, Dalton Trans., 2009, 495. 67 K. Wang, Progr. Inorg. Chem., 2004, 52, 267. 68 W. E. Geiger Jr., F. Barriere, R. J. LeSuer, S. Trupia, Inorg. Chem., 2001, 40, 2472. 69 G. N. Schrauzer, V. P. Mayweg, H. W. Finck, W. Heinrich, J. Am. Chem. Soc., 1966, 88, 4604. 70 (a) U. T. Mueller-Westerhoff, B. Vance, D. I. Yoon, Tetrahedron, 1991, 47, 909; (b) U. T. Mueller-
Westerhoff, D. I. Yoon, K. P. Lourde, Mol. Cryst. Liq. Cryst., 1990, 183, 29. 71 S. B. Wilkes, I. R. Butler, A. E. Underhill, A. Kobayashi, H. Kobayashi, Chem. Commun., 1994, 53. 72 H.-J. Lee, D.-Y. Noh, Synth. Met., 1999, 102, 1696. 73 F. Barriere, N. Camire, W. E. Geiger, U. T. Mueller-Westerhoff, R. Sanders, J. Am. Chem. Soc., 2002, 124,
7262. 74 (a) C. Faulmann, P. Cassoux, Progr. Inorg. Chem., 2004, 52, 399; (b) U. T. Mueller Westerhoff, R. W.
Sanders, Patent US 2003225296, 2003. 75 (a) S. Kokatam, K. Ray, J. Pap, E. Bill, W. E. Geiger, R. J. LeSuer, P. H. Rieger, T. Weyhermüller, F.
Neese, K. Wieghardt, Inorg. Chem., 2007, 46, 1100; (b) R. Perochon, L. Piekara-Sady, W. Junga, R.
Clérac, M. Formigué, Dalton Trans., 2009, 3052. 76 Z. S. Herman, R. F. Kirchner, G. H. Loew, U. T. Mueller-Westerhoff, A. Nazzal, M. C. Zerner, Inorg.
Chem.,1982, 21, 36. 77 J.-L. Zuo, T.-M. Yao, F. You, X.-Z. You, H.-K. Fun, B.-C. Yip, J. Mater. Chem., 1996, 6, 1633. 78 M. C. Aragoni, M. Arca, T. Cassano, C. Denotti, F. A. Devillanova, R. Frau, F. Isaia, F. Lelj, V. Lippolis,
L. Nitti, P. Romaniello, R. Tommasi, G. Verani, Eur. J. Inorg. Chem., 2003, 1939. 79 N. Tenn, N. Bellec, O. Jeannin, L. Piekara-Sady, P. Auban-Senzier, J. Iniguez, E. Canadell, D. Lorcy, J.
Am. Chem. Soc., 2009, 46, 16961. 80 U. T. Mueller-Westerhoff, R. W. Sanders, Organomet., 2003, 22, 4778. 81 D. J. Harrison, A. G. De Crisci, A. J. Lough, M. J. Kerr, U. Fekl, Inorg. Chem., 2008, 47, 10199. 82 T. M. Yao, J.-L. Zuo, X.-Z. You, X.-Y. Huang, Polyhedron, 1995, 14, 1487. 83 M. C. Aragoni, M. Arca, M. Caironi, C. Denotti, F. A. Devillanova, E. Grigiotti, F. Isaia, F. Laschi, V.
Lippolis, D. Natali, L. Pala, M. Sampietro, P. Zanello, Chem. Commun., 2004, 1882. 84 A. J. Scroggie, G. D’Alessandro, N. Langford, G.-L. Oppo, Opt. Commun., 1999, 160, 119.
Page 257
References and Notes
243
85 (a) K. H. Drexhage, U. T. Mueller-Westerhoff, IEEE J. Quant. Electr., 1972, QE-8, 759; (b) K. H.
Drexhage, U. T. Mueller-Westerhoff, US Patent 3743964, 1973. 86 Y. R. Shen, The Principles of Nonlinear Optics, Wiley, New York, 1984. 87 (a) K. Base, M. T. Tierney, A. Fort, J. Muller, M. W. Grinstaff, Inorg. Chem., 1999, 338, 287; (b) H. Le
Bolzec, T. Renouard, Eur. J. Inorg. Chem., 200, 229. 88 (a) S. N. Oliver, C. S. Winter, R. J. Manning, J. D. Rush, C. A. S. Hill, A. E. Underhill, in Nonlinear
Optical Properties of Inorganic Materials V, vol. 110, D. J. Williams (ed), 1992; (b) G. J. Gall, T. A. King,
S. N. Oliver, C. A. Capozzi, A. B. Seddon, C. A. S. Hill, A. E. Underhill, Proc. SPIE Int. Soc. Opt. Eng.,
1994, 2288, 372. 89 See for example Fuji photofilm co., ltd., European Patent EP1057622A2, 2000. 90 Proceeding of SPIE Photonics, 2004, 5464, 165. 91 (a) M. C. Aragoni, M. Arca, T. Cassano, C. Denotti, F. A. Devillanova, F. isaia, V. Lippolis, D. Natali, L.
Nitti, M. Sampietro, R. Tommasi, G. Verani, Inorg. Chem. Commun., 2002, 5, 869; (b) D. Natali, M.
Sampietro, M. Arca, C. Denotti, F. A. Devillanova, Synth. Met., 2003, 137, 1489; (c) M. Caironi, D. Natali,
M. Sampietro, M. Ward, A. Meacham, F. A. Devillanova, M. Arca, C. Denotti, L. Pala, Synth. Met., 2005,
153, 273; (d) M. C. Aragoni, M. Arca, F. A. Devillanova, F. Isaia, V. Lippolis, A. Mancini, L. Pala, G.
Verani, T. Agostinelli, M. Caironi, D. Natali, M. Sampietro, Inorg. Chem. Comm., 2007, 10, 191. 92 (a) A. Davison, J. A. McCleverty, E. T. Shawl, E. J. Whartom, J. Am. Chem. Soc., 1967, 89, 830; (b) J. G.
M. Van Der Linden, H. G. J. Van de Roer, Inorg. Chim. Acta, 1971, 5, 254; (c) J. G. M. Van Der Linden, J.
Inorg. Nucl. Chem., 1972, 34, 1645; (d) T. R. Miller, I. G. Dance, J. Am. Chem. Soc., 1973, 95, 6970; (e) A.
L. Balch, Inorg. Chem., 1971, 10, 388. 93 (a) N. G. Connelly, J. A. McCleverty, C. J. Winscom, Nature, 1967, 216, 999; (b) J. A. McCleverty, N. M.
Atherton, N. G. Connelly, C. J. Winscom, J. Chem. Soc. A, 1969, 2242; (c) J. A. McCleverty, B. Ratcliff, J.
Chem. Soc. A, 1970, 1631. 94 (a) G. N. Schrauzer, H. N. Rabinowitz, J. Am. Chem. Soc., 1968, 90, 4297; (b) G. N. Schrauzer, R. K. Y.
Ho, R. P. Mourillo, J. Am. Chem. Soc., 1970, 92, 3508; (c) G. N. Schrauzer, C. Zhang, E. O. Schlemper,
Inorg. Chem., 1990, 29, 3371. 95 R. M. Wing, G. C. Tustin, W. H. Okamura, J. Am. Chem. Soc., 1970, 92, 1935. 96 M. A. Mazid, M. T. Razi, P. J. Sadler, Inorg. Chem., 1981, 20, 2872. 97 G. N. Schrauzer, C. Zhang, R. Chadha, Inorg. Chem., 1990, 29, 4140. 98 R. Kato, Chem. Rev., 2004, 104, 5319. 99 (a) R. Llusar, C. Vicent, Coord. Chem. Rev., 2010, 254, 1534; (b) S. Dagleish, N. Robertson, Coord.
Chem. Rev., 2010, 254, 1549. 100 H. M. McConnell, R. Lynden-Nell, J. Chem. Phys., 1962, 36, 2393. 101 (a) L. Alcacer, H. Novais, F. Pedroso, S. Flandrois, C. Coulon, D. Chasseau, J. Gaultier, Solid State
Commun., 1980, 35, 945; (b) R. D. McDonald, N. Harrison, J. Singleton, A. Bangura, P. A. Goddard, A. P.
Ramirez, X. Chi, Phys. Rev. Lett., 2005, 94, 106404. 102 M. M. Ahmad, D. J. Turner, A. E. Underhill, C. S. Jacobsen, K. Mortensen, K. Carneiro, Phys. Rev. B,
1984, 29, 4796.
Page 258
References and Notes
244
103 (a) J. W. Bray, H. R. Hart Jr., L. V. Interrante, I. S. Jacobs, J. S. Kasper, G. D. Watkins, S. H. Wee, J. C.
Bonner, Phys. Rev. Lett., 1975, 35, 744; (b) I. S. Jacobs, J. W. Bray, H. R. Hart Jr, L. V. Interrante, J. S.
Kasper, G. D. Watkins, D. E. Prober, J. C. Bonner, Phys. Rev. B, 1976, 14, 3036. 104 J. M. Williams, J. R. Ferrero, R. J. Thorn, K. D. Carlson, U. Geiser, H. H. Wang, A. M. Kini, M.-H.
Wangbo, Organic Superconductors (Including Fullerenes), Prentice-Hall, Englewood Cliffs, NJ, 1992. 105 J. C. Dias, X. Ribas, J. Morgado, J. Seiça, E. B. Lopes, I. C. Santos, R. T. Henriques, M. Almeida, K.
Wurst, P. Floury-Leylekian, E. Canadell, J. Vidal-Gancedo, J. Veciana, C. Rovira, J. Mater. Chem., 2005,
15, 3187. 106 (a) N. J. Harris, A. E. Underhill, J. Chem. Soc., Dalton Trans., 1987, 1683; (b) W. B. Heuer, P. J.
Squattrito, B. M. Hoffman, J. A. Ibers, J. Am. Chem. Soc., 1988, 110, 792. 107 L. Valade, M. Bousseau, A. Gleizes, P. Cassoux, J. Chem. Soc., Chem. Commun., 1983, 110. 108 L. Brossard, M. Ribault, M. Bousseau, L. Valade, P. Cassoux, C. R. Acad. Sci., Ser. II, 1986, 302, 205. 109 In particular, beside (TTF)[Ni(dmit)2], twelve more bis(1,2-dithiolene) complexes exhibiting
superconducting properties have been reported to date, namely α-(EDT-TTF)[Ni(dmit)2],
(Me4N)[Ni(dmit)2]2, α’-(TTF)[Pd(dmit)2]2, α-(TTF)[Pd(dmit)2]2, β-(Me4N)[Pd(dmit)2]2,
(Et2Me2N)[Pd(dmit)2]2, β’-(Et2Me2P)[Pd(dmit)2]2, β’-(Me4Sb)[Pd(dmit)2]2, β’-(Me4As)[Pd(dmit)2]2, β’-
(Et2Me2As)[Pd(dmit)2]2, β’-(Et2Me3As)[Pd(dmit)2]2, β’-(Et4P)[Pd(dmit)2]2, Ref. 110. 110 (a) H. Tajima, M. Inokuchi, A. Kobayashi, T. Otha, R. Kato, H. Kobayashi, H. Kuroda, Chem. Lett., 1993,
1235; (b) A. Kobayashi, H. Kim, Y. Sasaki, R. Kato, H. Kobayashi, S. Moriyama, Y. Nishio, K. Kajita, W.
Sasaki, Chem. Lett., 1987, 1819; (c) L. Brossard, H. Hurdequint, M. Ribault, L. Valade, L.-P. Legros, P.
Cassoux, Synth. Met., 1988, 27, B157; (d) L. Brossard, M. Ribault, L. Valade, P. Cassoux, J. Phys. (Paris),
1989, 50, 1521; (e) A. Kobayashi, H. Kobayashi, A. Miyamoto, R. Kato, R. A. Clark, A. E. Underhill,
Chem. Lett., 1991, 2163; (f) H. Kobayashi, K. Bun, T. Naito, R. Kato, A. Kobayashi, Chem. Lett., 1992,
1909; (g) R. Kato, Y. Kashimura, S. Aonuma, N. Hanasaki, H. Tajima, Solid State Commun., 1998, 105,
561; (h) R. Kato, N. Tajima, M. Tamura, J.-I. Yamaura, Phys. Rev. B, 2002, 66, 020508; (i) A. Tajima, A.
Nakao, R. Kato, J. Phys. Soc. Jpn., 2005, 74, 412; (j) R. Kato, A. Tajima, A. Nakao, J. Am. Chem. Soc.,
2006, 128, 10016. 111 (a) A. E. Pullen, R.-M. Olk, Coord. Chem. Rev., 1999, 188, 211; (b) P. Cassoux, Coord. Chem. Rev.,
1999, 185; (c) N. Robertson, L. Cronin, Coord. Chem. Rev., 2002, 227, 93; (d) J. Morgado, L. Alcacer, R.
T. Henriques, M. Almeida, Synth. Met., 1999, 103, 2123. 112 W. B. Heuer, B. M. Hoffman, J. Chem. Soc., Chem. Commun., 1986, 174. 113 (a) P. Cassoux, L. Valade, H. Kobayashi, A. Kobayashi, R. A. Clark, A. E. Underhill, Coord. Chem. Rev.,
1991, 9, 1909; (b) L. Ouahab, Chem. Mater., 1997, 9, 1909; (c) E. Canadell, Coord. Chem. Rev., 1999, 186,
629; (d) P. Basu, J. F. Stolz, M. T. Smith, Curr. Sci., 2003, 84, 1412; (d) D. Belo, M. Almeida, Coord.
Chem. Rev., 2010, 254, 1479; (e) S. Rabaça, M. Almeida, Coord. Chem. Rev., 2010, 254, 1493; (f) H.-B.
Duan, X.-M. Ren, Q.-J. Meng, Coord. Chem. Rev., 2010, 254, 1509; 114 (a) T. Akutagawa, K. Matsuura, A. Hashimoto, T. Nakamura, Inorg. Chem., 2005, 44, 4454; (b) X. M.
Ren, H. Okudera, J. L. Xie, Q. J. Meng, J. Mol. Struct., 2005, 733, 119; (c) H.-R. Wen, J.-L. Zuo, T. A.
Scott, H.-C. Zhou, X.-Z. You, Polyhedron, 2005, 24, 671; (d) S. S. Stanisland, W. Fujita, Y. Umezono, K.
Awaga, P. J. Camp, S. J. Clark, N. Robertson, Inorg. Chem., 2005, 44, 546.
Page 259
References and Notes
245
115 L. V. Interrante, J. W. Bray, H. R. Hart Jr, L. S. Jacobs, J. S. Kasper, P. A. Piacente, J. C. Bonner, Lect.
Notes Phys., 1979, 96, 55. 116 H. Imai, T. Inabe, T. Otsuka, T. Okuno, K. Agawa, Synth. Met., 1997, 85, 1705. 117 (a) D. Arcon, A. Lappas, S. Margadonna, K. Prassides, E. Ribera, J. Veciana, C. Rovira, R. T. Henriques,
M. Almeida, Phys. Rev. B, 1999, 60, 4191; (b) X. Ribas, A. Sironi, N. Masciocchi, E. B. Lopes, M.
Almeida, J. Veciana, C. Rovira, Inorg. Chem., 2005, 44, 2358; (c) R. Wesolowski, J. T. Haraldsen, J. L.
Musfeldt, T. Barnes, M. Mas-Torrent, C. Rovira, R. T. Henriques, M. Almeida, Pyhs. Rev. B, 2003, 68,
134405; (d) R. Wesolowski, J. T. Haraldsen, J. L. Musfeldt, T. Barnes, M. Mas-Torrent, c. Rovira, R. T.
Henriques, M. Almeida, Pyhs. Rev. B, 2000, 70, 059901. 118 (a) H. Nakajima, M. Katshara, M. Ashizawa, T. Kawamoto, T. Mori, Inorg. Chem., 2004, 43, 6075; (b) N.
C. Schiødt, R. Sessoli, F. C. Krebs, Inorg. Chem., 2004, 43, 1986; (c) X. M. Ren, H. Okudera, R. K.
Kremer, Y. Song, C. He, Q. J. Meng, P. H. Wu, Inorg. Chem., 2004, 43, 2569; (d) W. E. Broderick, J. A.
Thompson, M. R. Godfrey, M. Sabat, B. M. Hoffman, E. P. Day, J. Am. Chem. Soc., 1989, 111, 7656; (e)
S. Rabaça, R. Meira, L. C. J. Pereira, M. T. Duarte, J. J. Novoa, V. Gama, Inorg. Chim. Acta, 2001, 326,
89. 119 (a) M. L. Allan, A. T. Coomber, I. R. Marsden, J. H. F. Martens, R. H. Friend, A. Charlton, A. E.
Underhill, Synth. Met., 1993, 56, 3317; (b) A. T. Coomber, D. Beljonne, R. H. Friend, J. L. Bredas, A.
Charlton, N. Robertson, A. E. Underhill, M. Kurmoo, P. Day, Nature, 1996, 380, 144. 120 C. Faulamnn, A. E. Pullen, E. Riviere, S. Dorbes, F. Senoca, E. Coronado, P. Cassoux, Eur. J. Inorg.
Chem., 2003, 2880. 121 P. Deplano, L. Pilia, D. Espa, M. L. Mercuri, A. Serpe, Coord. Chem. Rev., 2010, 254, 1434. 122 F. Bigoli, C.-T. Chen, W.-C. Wu, P. Deplano, M. L. Mercuri, M. A. Pellinghelli, L. Pilia, G. Pintus, A.
Serpe, E. F. Trogu, Chem. Commun., 2001, 2246. 123 (a) F. Bigoli, P. Deplano, M. L. Mercuri, M. A. Pellinghelli, L. Pilia, G. Pintus, A. Serpe, E. F. Trogu,
Inorg. Chem., 2002, 41, 524; (b) S. Curreli, P. Deplano, C. Faulmann, A. Ienco, C. Mealli, M. L. Mercuri,
L. Pilia, G. Pintus, A. Serpe, E. F. Trogu, Inorg. Chem., 2002, 41, 5241; (c) C.-T. Chen, S.-Y. Liao, K.-J.
Lin, L.-L. Lai, Adv. Mater., 1998, 3, 335; (d) R. Kato, Y. Kashimura, H. Sawa, Y. Okano, Chem. Lett.,
1997, 921; (e) Y. Kashimura, Y. Okano, J.-I. Yamaura, R. Kato, Synth. Met., 1999, 2123; (f) E. Watanabe,
M. Fujiwara, J.-I. Yamaura, R. Kato, J. Mater. Chem., 2001, 11, 2131; (g) G. C. Papavassiliou, G. C.
Anyfantis, B. R. Steele, A. Terzis., C. P. Raptopolou, G. Tatakis, G. Chaidogiannos, N. Glezos, Y. Weng,
Y. Yoshino, K. Murata, Z. Naturforsch., 2007, 62b, 679; (h) G. C. Anyfantis, G. C. Papavassiliou, P.
Aloukos, S. Couris, Y. F. Weng, H. Yoshino, K. Murata, Z. Naturforsch., 2007, 62b, 200; (i) P. Aloukos, S.
Couris, J. B. Koutselas, G. C. Anyfantis, C. Papavassiliou, Chem. Phys. Lett., 2006, 428, 109; (j) G. C.
Anyfantis, G. C. Papavassoliou, A. Terzis, C. P. Raptopoulou, Y. F. Weng, H. Yoshino, K. Murata, Z.
Naturforsch., 2006, 61b, 1007; (k) G. C. Anyfantis, G. C. Papavassiliou, N. Assimomytis, A. Terzis, V.
Psycharis, C. P. Raptopolou, P. Kyritsis, V. Thoma, L. B. Koutselas, Solid State Sci., 2008, 10, 1729; (l) C.-
C. Wang, W.-C. Wu, G.-H. Lee, C.-T. Chen, J. Chin. Chem. Soc., 2002, 49, 805; (m) P. Deplano, L.
Marchiò, M. L. Mercuri, L. Pilia, G. Pintus, A. Serpe, E. B. Yagubskii, Monatsch. Chem., 2009, 140, 775;
(n) S. Dagleish, C. A. Morrison, D. S. Middlemiss, A. R. Mount, A. Collins, L. Pilia, M. L. Mercuri, A.
Page 260
References and Notes
246
Serpe, P. J. Murphy, N. Robertson, J. Mater. Chem., 2009, 19, 6149; (o) A. Vogler, H. Kunkely, Angew.
Chemie Int. Ed. Engl., 1982, 21, 77. 124 (a) C. Papavassiliou, G. C. Anyfantis, A. Terzis, V. Psycharis, P. Krystis, P. Paraskevopolou, Z.
Naturforsch., 2008, 63b, 1377; (b) G. C. Papavassiliou, G. C. Anyfantis, Z. Naturforsch., 2005, 60b, 811;
(c) M. C. Aragoni, M. Arca, C. Denotti, F. A. Devillanova, E. Grigiotti, F. Isaia, F. Laschi, V. Lippolis, L.
Pala, A. M. Z. Slawin, P. Zanello, J. D. Woollins, Eur. J. Inorg. Chem., 2003, 1291; (d) L. Pilia, F. Artizzu,
C. Faulmann, M. L. Mercuri, A. Serpe, P. Deplano, Inorg. Chem. Commun., 2009, 12, 490. 125 (a) C. Zhan, W. Xu, D. Zhang, D. Li, Z. Lu, Y. Nie, D. Zhu, J. Mater. Chem., 2002, 12, 2945; (b) C. S.
Winter, S. N. Oliver, J. D. Rush, C. A. S. Hill, A. E. Underhill, J. Appl. Phys., 1992, 71, 512. 126 (a) E. Coronado, J. R. Galàn-Mascaros, C. J. Gòmez-Garcìa, V. N. Laukhin, Nature, 2000, 408, 447; (b)
H. Hiraga, H. Miyasaka, K. Nakata, T. Kajiwara, S. Takaishi, Y. Oshima, H. Nojiri, M. Yamshita, Inorg.
Chem., 2007, 46, 9661; (c) H. Kisch, B. Eisen, R. Dinnebier, K. Shankland, W. I. F. Davis, F. Knoch,
Chem. Eur. J., 2001, 7, 738; (d) E. Coronado, P. Day, Chem. Rev., 2004, 104, 5419; (e) T. Enoki, A.
Miyazaki, Chem. Rev., 2004, 104, 5449. 127 S. D. Cummings, R. Eisenberg, J. Am. Chem. Soc., 1996, 118, 1949. 128 (a) C. G. Pierpont, R. Eisenberg, Inorg. Chem., 1970, 9, 2218; (b) G. P. Khare, R. Eisenberg, Inorg.
Chem., 1970, 9, 2211; (c) Y. Liu, Z. Peng, D. Li, Y. Zhou, Spectrochim. Acta A, 2008, 69, 471. 129 M. A. Mansour, R. J. Lachicotte, H. J. Gysling, R. Eisenberg, Inorg. Chem., 1998, 37, 4625. 130 (a) P. J. Gronlund, J. A. Burt, W. F. Wacholtz, Inorg. Chim. Acta, 1995, 357, 1198; (b) K. Halvorsen, W.
F. Wacholtz, G. Crosby, Inorg. Chim. Acta, 1995, 228, 81; (c) S. D. Cummings, L.-T. Cheng, R. Eisenberg,
Chem. Mater., 1997, 9, 440; (d) C. M. Liu, D.-Q. Zhang, Y.-L. Song, C.-L. Zhan, Y.-L. Li, D. B. Zhu, Eur.
J. Inorg. Chem., 2002, 1591; (e) Q.-H. Wang, D.-L. Long, H.-M. Hu, Y. Cui, J.-S. Huang, J. Coord. Chem.,
2000, 49, 201; (f) D. M. Hatch, W. F. Wacholtz, J. T. Mague, Acta Cryst, Sect. C, 2003, 59, m452; (g) S. V.
Vitushkina, V. A.Starodub, O. S.Pyshkin, Koord. Khim., 2006, 32, 247; (f) W. Guo, Z. Peng, D. Li, Y.
Zhou, Polyhedron, 2004, 23, 1701. 131 L.-L. Wen, Z.-H. Peng, B.-G. Zhang, Y.-H. Zhou, J. Mol. Struct., 2004, 694, 223. 132 (a) K. Natsuaki, M. Nakano, G. Matsubayashi, R. Arakawa, Inorg. Chim. Acta, 2000, 299, 112; (b) A.
Islam, H. Sugihara, K. Hara, L. P. Singh, R. Katoh, M. Yanagida, Y. Takahashi, S. Murata, H. Arakawa, J.
Photochem. Photobiol., 2001, 145, 135. 133 (a) W.-Y. Guo, Z.-H. Peng, C.-G. Wang, Y.-H. Zhou, J. Coord. Chem., 2006, 59, 1213. 134 M L. Calatayud, J. Sletten, I. Castro, M. Julve, G. Seitz, K. Mann, Inorg. Chim. Acta, 2003, 353, 159. 135 S. M. Dibrov, R. E. Bachman, Inorg. Chim. Acta, 2004, 357, 1198. 136 A. Vogler, H. Kunkley, J. Am. Chem. Soc., 1981, 103, 1559. 137 (a) C.-T. Chen, T.-Y. Jeremy Lin, C.-H. Chen, K.-J. Lin, J. Chin. Chem. Soc., 2000, 47, 197; (b) W.-Y.
Guo, Z.-H. Peng, C.-G. Wang, Y.-H. Zhou, J. Coord. Chem., 2006, 59, 1213. 138 As regards the M-S bond lengths, considerations similar to those deduced for homoleptic bis(1,2-
dichalcogenolene) complexes can be made: M-S distances range between 2.122137a and 2.58131 Å. Ni
complexes show the shortest average M-S bond distances recorded, while the cadmium complexes feature
the longest ones. On the other hand, M-N distances ranging between 1.926139 and 2.361131 Å are reported,
and also in this case the shortest bond lengths are observed in Ni complexes and the longest ones in Cd
Page 261
References and Notes
247
complexes. As regards angles, S-M-S angles have been found to range between 83.27130b and 98.39,130a
while N-M-N angles range between 70.08131 and 83.37° (Figure 1.15).139 139 T. M. Cocker, R. E .Bachman, Mol. Cryst. Liq. Cryst. Sci. Technol., Sect. A, 2004, 408,1. 140 J. S. Pap, F. L. Benedito, E. Bothe, E. Bill, S. DeBeer George, T. Weyhermuller, K. Wieghardt, Inorg.
Chem., 2007, 46, 4187. 141 J. Moussa, M. N. Rager, K. Boubekeur, H. Amouri, Eur. J. Inorg. Chem., 2007, 2648. 142 Y. Ji, R. Zhang, Y.-J. Li, Y.-Z. Li, J.-L. Zuo, X.-Z. You, Inorg. Chem., 2007, 46, 866. 143 B. W. Smucker, J. M. Hudson, M. A. Omary, K. R. Dunbar, Inorg. Chem., 2003, 42, 4714. 144 S. Parsons, Z. Zhang, P. J. Sadler, A. Daweson, R. Johnstone, Private Communication, 2006. 145 W. Liu, R. Wang, X.-H. Zhou, J.-L. Zuo, X.-Z. You, Organometallics, 2008, 27, 126. 146 R. Sakamoto, M. Murata, S. Kume, H. Sampei, M. Sugimoto, H. Nishihara, Chem. Commun., 2005, 125. 147 J.-L. Zuo, R.-G. Xiong, X.-Z. You, X.-Y. Huang, Inorg. Chim. Acta, 1995, 237, 117. 148 (a) K. Kubo, M. Nakano, H. Tamura, G.-E. Matsubayashi, Eur. J. Inorg. Chem., 2003, 4093; (b) K. Kubo,
M. Nakano, H. Tamura, G.-E. Matsubayashi, Inorg. Chim. Acta, 2002, 336, 120. 149 Also in this case, the longest M-S and M-N distances are observed for Cd complexes,128a while the
shortest ones are featured by the Co complexes.130f 150 (a) J. A. Zuleta, J. M. Bevilacqua, D. M. Proserpio, P. D. Harvey, R. Eisenberg, Inorg. Chem., 1992 31,
2396; (b) S. D. Cummings, R. Eisenberg, Inorg. Chem., 1995, 34, 2007. 151 C. Makedonas, C. A. Mitsopoulou, Eur. J. Inorg. Chem., 2007, 110. 152 C. A. Mitsopoulou, Coord. Chem. Rev., 2010, 254, 1448. 153 C. Makedonas, C. A. Mitsopoulou, Inorg. Chim. Acta, 2007, 360, 3997. 154 W. L. Fleeman, W. B. Connick, Comments. Inorg. Chem., 2002, 23, 205. 155 Y. Zhang, K. D. Ley, K. Schanze, Inorg. Chem., 1996, 35, 7102. 156 C.-T. Chem, S.-Y. Liao, K.-J. Lin, L.-L. Lai, Adv. mater., 1995, 3, 334. 157 C. A. Bignozzi, R. Argazzi, C. J. Kleverlaan, Chem. Soc. Rev., 2000, 29, 87. 158 E. A. M. Geary, L. J. Yellowlees, L. A. Jack, I. D. H. Oswald, S. Parsons, N. Hirata, J. R. Durrant, N.
Robertson, Inorg. Chem., 2005, 44, 242. 159(a) A. Islam, H. Sugihara, K. Hara, L. P. singh, R. KAtoh, M. Yanagida, Y. Takahshi, S. Murata, H.
Arakawa, Inorg. Chem., 2001, 40, 5371; (b) E. A. M. Geary, N. Hirata, J. Clifford, J. R. Durrant, S.
Parsons, A. Dawson, L. J. Yellowlees, N. Robertson, Dalton Trans., 2003, 3757; (c) E. A. M. Geary, K. L.
McCall, A. Turner, P. R. Murray, E. J. L. McInnes, L. A. Jack, L. J. Yellowlees, N. Robertson, Dalton
Trans., 2008, 3701. 160 M. Hissler, J. E. McGarrah, W. B. Connick, D. K. Geiger, S. D. Cummings, R. Eisenberg, Coord. Chem.
Rev., 2000, 208, 115. 161 J. Zhang, P. Du, J. Schneider, P. Jarosz, R. Eisenberg, J. Am. Chem. Soc., 2007, 129, 7726. 162 K. Kubo, M. Nakano, H. Tamura, G. Matsubayashi, Inorg. Chim. Acta, 2000, 311, 6 163 Y. Ji, R. Zhang, X.-B. Du, J.-L. Zuo, X.-Z. You, Dalton Trans., 2008, 2578. 164 C. A. Mitsopolou, C. E. Dagas, C. Makedonas, J. Inorg. Biochem., 2008, 102, 77. 165 P.-I. Kvam, M. V. Puzyk, V. S. Cotlyr, J. Songstad, K. P. Balashev, Acta Chem. Scand., 1997, 50, 6. 166 C. A. Goddard, R. H. Holm, Inorg. Chem., 1999, 38, 5389.
Page 262
References and Notes
248
167 C. L. Beswick, E. I. Stiefel, private communications. 168 (a) J. Locke, J. A. McCleverty, E. J. Wharton, C. J. Winscom, Chem. Comm., 1966, 677; (b) J. A.
McCleverty, N. M. Atherton, J. Locke, E. J. Wharton, C. J. Winscom, J. Am. Chem. Soc., 1967, 89, 6082. 169 S. K. Ibrahim, C. J. Pickett, J. Chem. Soc., Chem. Commun., 1991, 246. 170 M. Nomura, T. Cauchy, M. Formigué, Coord. Chem. Rev., 2010, 254, 1406. 171 A. Sugimori, T. Akiyama, M. Kajitani, T. Sugiyama, Bull. Chem. Soc. Jpn., 1996, 117, 69. 172 S. Eid, T. Roisnel, D. Lorcy, J. Organomet. Chem., 2008, 693, 2755. 173 (a) S. P. Kaiwar, A. Vodacek, N. V. Blough, R. S. Pilato, J. Am. Chem. Soc., 1997, 119, 3311; (b) K. A.
Van Houten, K. A. Walters, K. S. Schanze, R. S. Pilato, J. Fluoresc., 2000, 10, 35. 174 Y. Kostov, K. A. Van Houten, P. Harms, R. S. Pilato, G. Rao, Appl. Spectrosc.¸2000, 54, 864. 175 S. D. Cummings, R. Eisenberg, Progr. Inorg. Chem., 2004, 52, 315. 176 (a) S. J. N. Burgmayer, Progr. Inorg. Chem., 2004, 52, 491; (b) J. McMaster, J. M. Tunney, C. D. Garner,
Progr. Inorg. Chem., 2004, 52, 539; (c) C. D. Garner, L. J. Stewart, “Metal ions in Biological Systems”, M.
Dekker Inc. ed. (New York), 2002, vol. 39, 699; (d) J. McMaster, J. H. Enemark, Curr. Opin. Chem. Biol,
1998, 2, 201. 177 (a) R. Hille, Chem. Rev., 1996, 96, 2757; (b) “Molybdenum Enzymes, Cofactors and Model System ”, E. I.
Stiefel, D. Coucouvanis, W. E. Newton eds., American Chemical Society, Washington DC, 1993, 535. 178 M. J. Romão, Dalton Trans., 2009, 4053, and references therein. 179 C. D. Garner, R. Banham, S. J. Cooper, E. S. Davies, L. J. Stewart, in “Handbook on Metalloproteins 2”,
I. Bertini, A. Sigel, H. Sigel eds., M. Dekker Inc., New York, 2001, 539. 180 J. McMaster, J. M. Tunney, C. D. Garner, Cheminform., 2004, 35. 181 (a) F. E. Inscore, R. Mcnaughton, B. L. Wescott, M. E. Helton, R. Jones, I. K. Dahwan, J. H. Enemark, M.
L. Kirk, Inorg. Chem., 1999, 38, 1401; (b) Y. Izimu, T. Glaser, K. Rose, J. McMaster P. Basu, J. H.
Enemark, B. Hedman, K. O. Hodgson, E. I. Solomon, J. Am. Chem. Soc., 1999, 121, 10035; (c) S. P.
Greatbanks, I. H. Hillier, C. D. Garner, J. A. Joule, J. A. Joule, J. Chem. Soc., Perkin Trans., 1997, 2, 1529. 182 (a) T. Cassano, R. Tommasi, L. Nitti, M. C. Aragoni, M. Arca, C. Denotti, F. A. Devillanova, F. Isaia, V.
Lippolis, F. Lelj, P. Romaniello, J. Chem. Phys., 2003, 118, 5995; (b) T. Cassano, R. Tommasi, M. Arca, F.
A. Devillanova, F. Lelj, Recent Res. Devel. Chem. Phyisics, 2004, 5, 553; (c) T. Cassano, R. Tommasi, M.
Arca, F. A. Devillanova, J. Phys.: Condens. Mater, 2006, 18, 5279. 183 P. Romaniello, F. Lelj, J. Molec. Struct.: THEOCHEM, 2003, 636, 23. 184 (a) L. Pala, “Nuovi bis(1,2-ditioleni) ad elevata delocalizzazione elettronica: sintesi, caratterizzazione
spettroscopica, elettrochimica e cacoli DFT”, PhD thesis, University of Cagliari, 2005; (b) L. Ambrosio,
“Nuovi bis(1,2-ditioleni) metallici [M(Ar,H-edt)2]: sintesi, caratterizzazione strutturale, elettrochimica,
spettroscopica e calcoli DFT (M = Ni, Cu, Au)”, Master’s Degree thesis, University of Cagliari, 2006; (c)
M. C. Aragoni, M. Arca, F. A. Devillanova, V. Lippolis, F. Isaia, A. Pintus, G. Verani, unpublished results. 185 (a) S. P. Kaiwar, J. K. Hsu, A. Vodacek, G. Yap, L. M. Liable-Sands, A. L. Rheingold, R. S. Pilato, Inorg.
Chem., 1997, 36, 2406; (b) S. P. Kaiwar, A. Vodacek, N. V. Blough, R. S. Pilato, J. Am. Chem. Soc., 1997,
119, 9211; V. Madhu, S. K. Das, Inorg. Chem., 2008, 47, 5055; (c) R. S. Pilato, K. A. van Houten, Prog.
Inorg. Chem., 2004, 52, 369. 186 V. Madhu, S. K. Das, Inorg. Chem., 2006, 45, 10037.
Page 263
References and Notes
249
187 The crystal structures of 1,3-dithiol-2-ones considered are those having the following refcodes in the
Cambridge Crystallografic Database: BATPIW, BATTEW, CALVEQ, CUNQUX, FIYHUR, GIWDAS,
KAMSOE, KEKWOM, MIYDON, QUHNAT, QEHNEX, QIBQAT, RIPLOS, ULEWIR, YAYZIH,
YEGXOX10, and ZAMMUV. 188 V. Madhu, S. K. Das, Inorg. Chem., 2008, 47, 5055. 189 S. Rabaça, A. C. Cerdeira, A. I. S. Neves, S. I. G. Dias, C. Mézière, I. C. Santos, L. C. J. Pereira, M.
Formigué, R. T. Henriques, M. Almeida, Polyhedron, 2009, 28, 1069. 190 (a) K. Ray, T. Weyhermüller, A. Goossens, M. W. J. Craié, K. Wieghardt, Inorg. Chem., 2003, 42, 4082;
(b) K. Ray, T. Weyhermüller, F. Neese, K. Wieghardt, Inorg. Chem., 2005, 44, 5345. 191 (a) X. Liu, I. Wallman, E. Boudinov, J. Kielstrup-Hansen, M. Schiek, A. Lutzen, H.-G. Rubaham, Org.
Electron., 2010, 11, 1096; (b) R. Soumya, M. Charette, S. P. Finkelstein, PCT Int. Appl., 2009, WO
2009088975 A2 20090716. 192 (a) G. C. Papavassiliou, G. C. Anyfantis, C. P. Raptopoulou, V. Psycharis, N. Ioannidis, V. Petrouleas, P.
Paraskevopoulou, Polyhedron, 2009, 28, 3368; (b) D. M. D. Leeuw, M. M. J. Simenon, A. R. Brown, R. E.
F. Einerhand, Synth. Met., 1997, 87, 53. 193 (a) A. L. Balch, I. G. Dance, R. H. Holm, J. Am. Chem. Soc., 1968, 90, 1139 ; (b) J. C. Fitzmaurice, A. M.
Z. Slawin, D. J. Williams, J. D. Woollins, A. J. Lindsay, Polyhedron, 1990, 9, 1561; (c) O. Jeannin, M.
Formigué, New J. Chem., 2006, 30, 1774. 194 M. La Deda, I. Aiello, A. Grisolia, M. Ghedini, M. Amati, F. Lelj, Dalton Trans., 2006, 330. 195 (a) W. Koch, M. C. Holthausen, “A Chemist’s Guide to Density Functional Theory”, 2nd ed., Wiley-VCH,
Weinheim, Germany, 2002; (b) F. Neese, Coord. Chem. Rev., 2009, 253, 526. 196 (a) M. C. Aragoni, M. Arca, F. Demartin, F. A. Devillanova, F. Lelj, F. Isaia, V. Lippolis, A. Mancini, L.
Pala, G. Verani, Eur. J. Inorg. Chem., 2004, 3099; (b) P. Romaniello, F. Lelj, M. Arca, F. A. Devillanova,
Theor. Chem. Acc., 2007, 117, 621. 197 (a) M. A. Cinellu, G. Minghetti, F. Cocco, S. Stoccoro, A. Zucca, M. Manassero, M. Arca, Dalton Trans.,
2006, 5703; (b) C. Gabbiani, A. Casini, L. Messori, A. Guerri, M. A. Cinellu, G. Minghetti, M. Corsini, C.
Rosani, P. Zanello, M. Arca, Inorg. Chem., 2008, 47, 2368. 198 C. Adamo, V. Barone, J. Chem. Phys., 1998, 108, 664. 199 A. Schäfer, H. Horn, R. Ahlrichs, J. Chem. Phys., 1992, 97, 2571. 200 (a) T. H. Dunning, Jr., P. J. Hay in “Methods of Electronic Structure, Theory”, Vol. 2, H. F. Schaefer III
ed., Plenum Press, 1977; ( b) J.V. Ortiz, P. J. Hay, R. L. Martin, J. Am. Chem. Soc., 1992, 114, 2736. 201 R. Kirmse, M. Kampf, R.-M. Olk, M. Hildebrand, H. Krautscheid, Z. Allg. Chem., 2004, 630, 1433. 202 R. L. Schlupp, A. H. Maki, Inorg. Chem., 1974, 13, 44. 203 A similar analysis performed on 22 in its cis conformation, showed a rotational barrier (about 8 kcal mol–
1) more than double than that calculated for 20 and 20–. 204 Calculations were carried out on the neutral and monoanionic species investigated experimentally by UV-
Vis and emission spectroscopy (Sections 3.1.4 and 3.1.5). TD-DFT investigation on 20 and 20– were
carried out previously.184b 205 M. Kasha, Discuss. Faraday Soc., 1950, 9, 14. 206 M. P. Cifuentes, M. G. Humphrey, J. Organomet. Chem., 2004, 689, 3968.
Page 264
References and Notes
250
207 D. A. Kleinman, Phys. Rev., 1962, 126, 1977. 208 P. J. Mendes, A. J. P. Carvalho, J. P. P. Ramalho, Theochem, 2009, 900, 110. 209 (a) I. R. Whittall, M. G. Humphrey, Organometallics, 1996, 15, 573; (b) M. G. Humphrey, Gold Bull.,
2000, 33, 97; (c) S. K. Hurst, M. P. Cifuentes, A. M. McDonagh, M. G. Humphrey, M. Samoc, B. Luther-
Davies, I. Asselberghs, A. Persoons, J. Organomet. Chem., 2002, 642, 259; (d) G. Yang, Z. Su, C. Qin, Y.
Zhao, J. Chem. Phys., 2005, 123, 134302-1-5; (e) S.-L. Sun, C.-S. Qin, Y.-Q. Qiu, G.-C. Yang, Z.-M. Su, J.
Organomet. Chem., 2009, 694, 1266. 210 (a) G. T. Morgan, F. H. Burstall, J . Chem. Soc., 1934, 965; (b) E. Bielli, P. M. Gidney, R. D. Gillard, B.
T. Heaton, J. Chem. Soc., Dalton Trans., 1974, 2133. 211 J. S. Wu, C. Y. Chi, X. H. Wang, X. J. Zhao, J. Li, F. S. Wang, Chin. Chem. Lett., 2001, 12, 387. 212 J. Tang, X.-F. Liu, L.-Y. Zhang, X.-L. Xu, P.-R. Zhang, Synth. Commun., 2000, 30, 1657. 213 K. Griesbaum, Angew. Chem., Int. Ed. Engl., 1970, 9, 273. 214 J. Weinstein, M.T. Tierney, E.S. Davies, K. Base, A. A. Robeiro, M. W. Grinstaff, Inorg. Chem., 2006,
45, 4544. 215 A. Bondi, J. Phys. Chem., 1964, 68, 441. 216 Solvent parameters: toluene (0.172), THF (0.494), chloroform (0.610), dichloromethane (0.765), acetone
(0.797), DMF (0.901), DMSO (0.973), acetonitrile (1.000). 217 (a) J. A. Zuleta, J. M. Bevilacqua, R. Eisenberg, Coord. Chem. Rev., 1991, 111, 237; (b) J. M. Bevilacqua,
R. Eisenberg, Inorg. Chem., 1994, 33, 2913. 218 Notably, the emission profile of complexes 53-73 is also very similar to that found for the corresponding
dichlorocomplexes [Pt(N^N)Cl2], thus suggesting the E^E ligand is not involved in the emissive processes. 219 A linear correlation (R2 = 0.85) was also observed between the value of Φ determined for complexes of
Series 1 (53-59, Scheme 3.6) and the ones of Series 2 (60-66, Scheme 3.7) featuring the same E^E ligands. 220 C. Adamo, V. Barone, J. Chem. Phys., 1999, 110, 6158. 221 W.C. Ermler, R.B. Ross, P.A. Christiansen, Int. J. Quant. Chem., 1991, 40, 829. 222 J. Tomasi, B. Mennucci, R. Cammi, Chem. Rev., 2005, 105, 2999. 223 (a) T. Koopmans, Physica, 1934, 1, 104; (b) P. Politzer, A. A. Fakher, Theor. Chem. Acc., 1998, 99, 83;
(c) S. Hamel, P. Duffyc, M. E. Casidad, D. R. Salahub, J. Electron. Spectrosc. & Rel. Phenom., 2002, 123,
345; (d) G. Zhang, C. B. Musgrave, J. Phys. Chem A, 2007, 111, 1554. 224 R. S. Mulliken, J. Chem. Phys., 1955, 23, 1833. 225 D. C. Young, “Computational Chemistry: A Practical Guide for Applying Techniques to the Real World
Problems”, Wiley and Sons eds., 2001. 226 A. E. Reed, R. B. Weinstock, F. Weinhold, J. Chem. Phys., 1985, 83, 735. 227 (a) K. Kubo, A. Nakao, Y. Ishii, M. Tamura, R. Kato, G. E. Matsubayashi, J. Low Temp. Phys., 2006,
142, 413; (b) K. Kubo, A. Nakao, Y. Ishii, R. Kato, G.-E. Matsubayashi, Synth. Met., 2005, 153, 425. 228 G. Sanna, M. I. Pilo, N. Spano, G. Minghetti, M. A. Cinellu, A. Zucca, R, Seeber, J. Organomet. Chem.,
2001, 622, 47. 229 The crystal structures considered are those having the following refcodes in the Cambridge
Crystallographic Database: AMEXIZ, HIRZIR, TAFJEQ, YEDPON, YEDPUT, and YEDQAA.
Page 265
References and Notes
251
230 J. R. Lakiwicz, “Principles of Fluorescence Spectroscopy”, Kluwer Academic Publishing/Plenum, New
York, 1999. 231 Fityk 0.8, http://www.unipress.waw.pl/fityk/. 232 G. M. Sheldrick, University of Göttingen, Germany, 1997. 233 A. Altomare, M. C. Burla, M. Camalli, G. Cascarano, C. Giacovazzo, A. Guagliardi, A. G. G. Moliterni,
G. Polidori, R. Spagna, J. Appl. Cryst., 1999, 32, 115. 234 L. J. Farrugia, J. Appl. Cryst., 1999, 32, 837. 235 CheckCIF program (http://checkcif.iucr.org/). 236 F. H. Allen, O. Johnson, G. P. Shields, B. R. Smith, M. Towler, J. Applied Cryst., 2004, 37, 335. 237 13C NMR could not be recorded on the products due to solubility reasons, and for the same reason the 1H
NMR analysis could not be performed on some of the synthesised complexes. 238 M. J. Morris et al., unpublished results. 239 Gaussian 03, Revision E.01, M. J. Frisch, G. W. Trucks, H. B. Schlegel, G. E. Scuseria, M. A. Robb, J. R.
Cheeseman, J. A. Montgomery, Jr., T. Vreven, K. N. Kudin, J. C. Burant, J. M. Millam, S. S. Iyengar, J.
Tomasi, V. Barone, B. Mennucci, M. Cossi, G. Scalmani, N. Rega, G. A. Petersson, H. Nakatsuji, M. Hada,
M. Ehara, K. Toyota, R. Fukuda, J. Hasegawa, M. Ishida, T. Nakajima, Y. Honda, O. Kitao, H. Nakai, M.
Klene, X. Li, J. E. Knox, H. P. Hratchian, J. B. Cross, V. Bakken, C. Adamo, J. Jaramillo, R. Gomperts, R.
E. Stratmann, O. Yazyev, A. J. Austin, R. Cammi, C. Pomelli, J. W. Ochterski, P. Y. Ayala, K. Morokuma,
G. A. Voth, P. Salvador, J. J. Dannenberg, V. G. Zakrzewski, S. Dapprich, A. D. Daniels, M. C. Strain, O.
Farkas, D. K. Malick, A. D. Rabuck, K. Raghavachari, J. B. Foresman, J. V. Ortiz, Q. Cui, A. G. Baboul, S.
Clifford, J. Cioslowski, B. B. Stefanov, G. Liu, A. Liashenko, P. Piskorz, I. Komaromi, R. L. Martin, D. J.
Fox, T. Keith, M. A. Al-Laham, C. Y. Peng, A. Nanayakkara, M. Challacombe, P. M. W. Gill, B. Johnson,
W. Chen, M. W. Wong, C. Gonzalez, and J. A. Pople, Gaussian, Inc., Wallingford CT, 2004. 240 Gaussian 09, Revision A.02, M. J. Frisch, G. W. Trucks, H. B. Schlegel, G. E. Scuseria, M. A. Robb, J. R.
Cheeseman, G. Scalmani, V. Barone, B. Mennucci, G. A. Petersson, H. Nakatsuji, M. Caricato, X. Li, H. P.
Hratchian, A. F. Izmaylov, J. Bloino, G. Zheng, J. L. Sonnenberg, M. Hada, M. Ehara, K. Toyota, R.
Fukuda, J. Hasegawa, M. Ishida, T. Nakajima, Y. Honda, O. Kitao, H. Nakai, T. Vreven, J. A.
Montgomery, Jr., J. E. Peralta, F. Ogliaro, M. Bearpark, J. J. Heyd, E. Brothers, K. N. Kudin, V. N.
Staroverov, R. Kobayashi, J. Normand, K. Raghavachari, A. Rendell, J. C. Burant, S. S. Iyengar, J. Tomasi,
M. Cossi, N. Rega, J. M. Millam, M. Klene, J. E. Knox, J. B. Cross, V. Bakken, C. Adamo, J. Jaramillo, R.
Gomperts, R. E. Stratmann, O. Yazyev, A. J. Austin, R. Cammi, C. Pomelli, J. W. Ochterski, R. L. Martin,
K. Morokuma, V. G. Zakrzewski, G. A. Voth, P. Salvador, J. J. Dannenberg, S. Dapprich, A. D. Daniels,
Ö. Farkas, J. B. Foresman, J. V. Ortiz, J. Cioslowski, and D. J. Fox, Gaussian, Inc., Wallingford CT, 2009. 241 Æ. Frisch, H.P. Hratchian, R.D. Dennington II, T.A. Keith, John Millam, A.B. Nielsen, A.J. Holder, J.
Hiscocks. Gaussian, Inc. GaussView Version 5.0., 2009. 242 Gabedit is a free Graphical User Interface for computational chemistry packages written by Abdul-
Rahman Allouche. http://gabedit.sourceforge.net. 243 G. Schaftenaar, J. H. Noordik, J. Comput.-Aided Mol. Des., 2000, 14, 123. 244 N. M. OʹBoyle, A. L. Tenderholt, K. M. Langner, J. Comput. Chem., 2008, 29, 839.
Page 266
References and Notes
252
245 Basis sets were obtained from Basis Set Exchange and Basis Set EMSL Library; (a) D. Feller, J. Comput.
Chem., 1996, 17, 1571; (b) K. L. Schuchardt, B. T. Didier, T. Elsethagen, L. Sun, V. Gurumoorthi, J.
Chase, J. Li, T. L. Windus, J. Chem. Inf. Model, 2007, 47, 1045. 246 K. Burke, J. P. Perdew, Y. Wang, in “Electronic Density Functional Theory: Recent Progress and New
Directions”, J. F. Dobson, G. Vignale, M. P. Das eds. (Plenum), 1998. 247 J. P. Perdew, K. Burke, M. Ernzerhof, Phys. Rev. Lett., 1997, 78 1396. 248 T. M. Henderson, A. F. Izmaylov, G. Scalmani, G. E. Scuseria, J. Chem. Phys., 2009, 131, 044108. 249 M. Ernzerhof, J. P. Perdew, J. Chem. Phys., 1998, 109. 250 A. D. Becke, J. Chem. Phys., 1993, 98, 5648. 251 H. Iikura, T. Tsuneda, T. Yanai, K. Hirao, J. Chem. Phys. ,2001, 115, 3540. 252 T. Yanai, D. Tew, N. Handy, Chem. Phys. Lett., 2004, 393, 57. 253 J.-D. Chai, M. Head-Gordon, J. Chem. Phys., 2008, 12, 084106. 254 L. E. Roy, P. J. Hay, and R. L. Martin, J. Chem. Theory Comput., 2008, 4, 10290. 255 W. J. Stevens, M. Krauss, H. Basch, P. G. Jasien, Can. J. Chem., 1992, 70, 612. 256 M. Kaupp, P. V. R. Schleyer, H. Stoll, H. Preuss, J. Chem. Phys., 1991, 94, 1360. 257 This basis set was chosen based on the good results obtained in the case of different gold complexes with
variously substituted 2,2ʹ-bipyridine donors (Ref. 197).


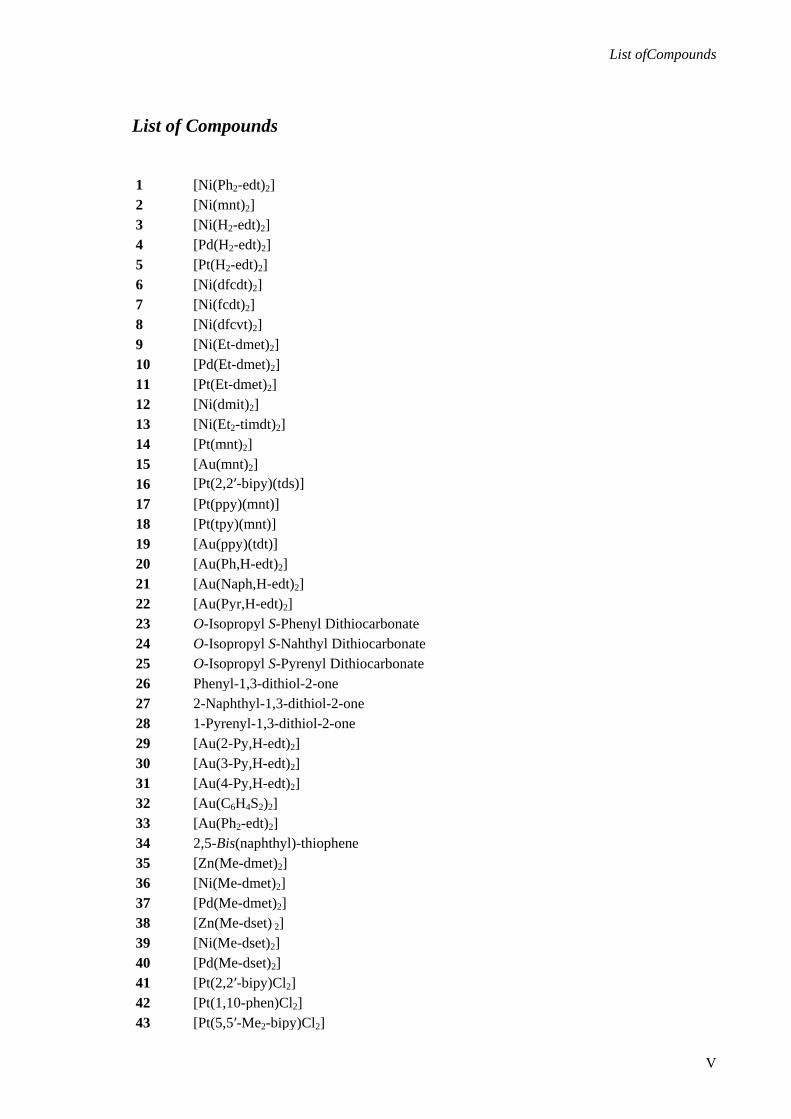


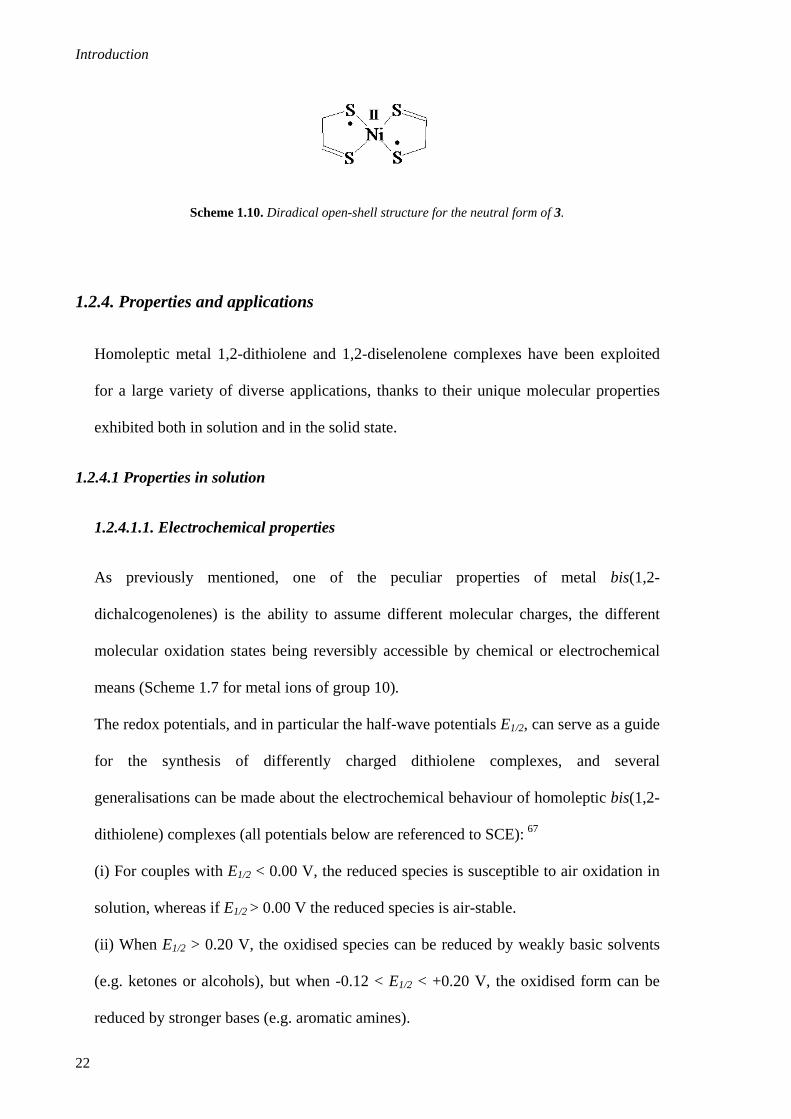


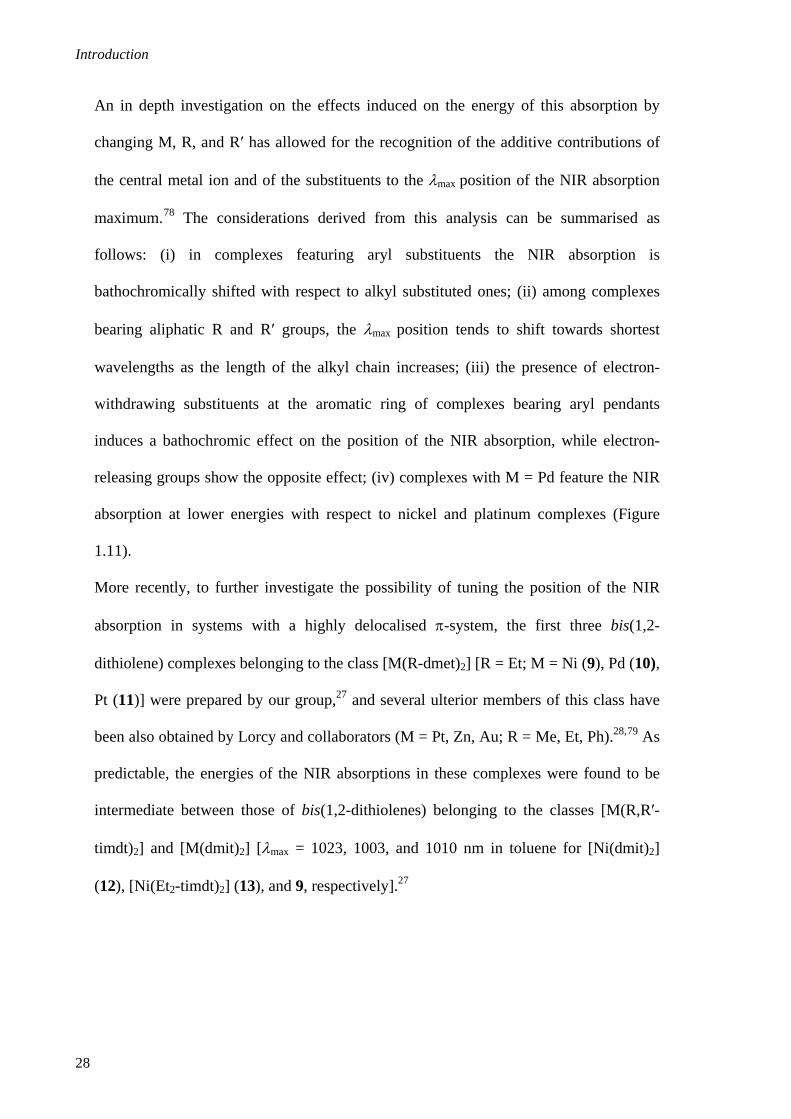


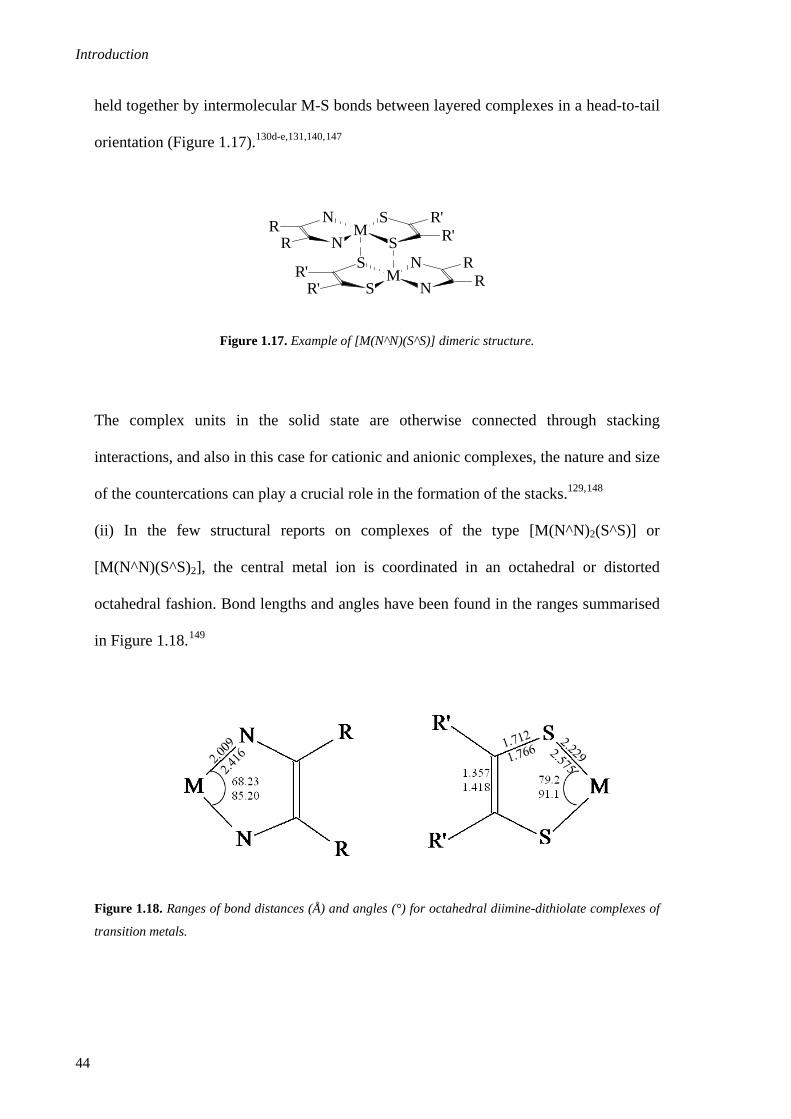


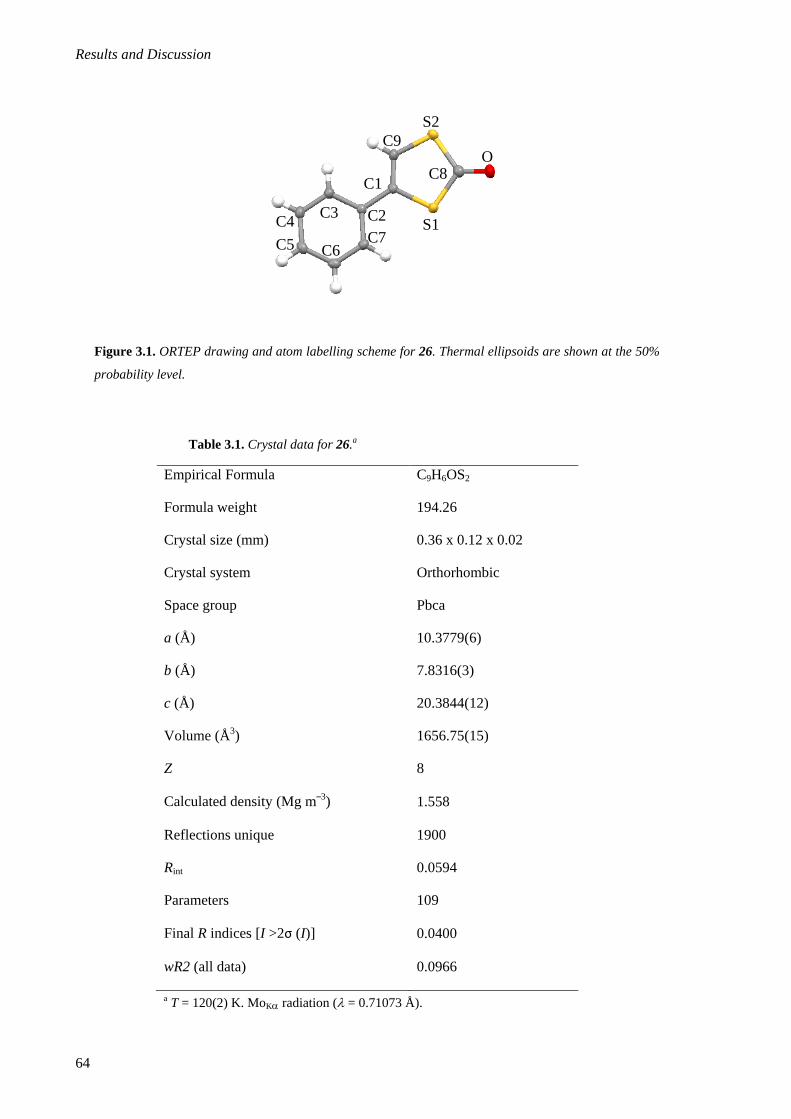


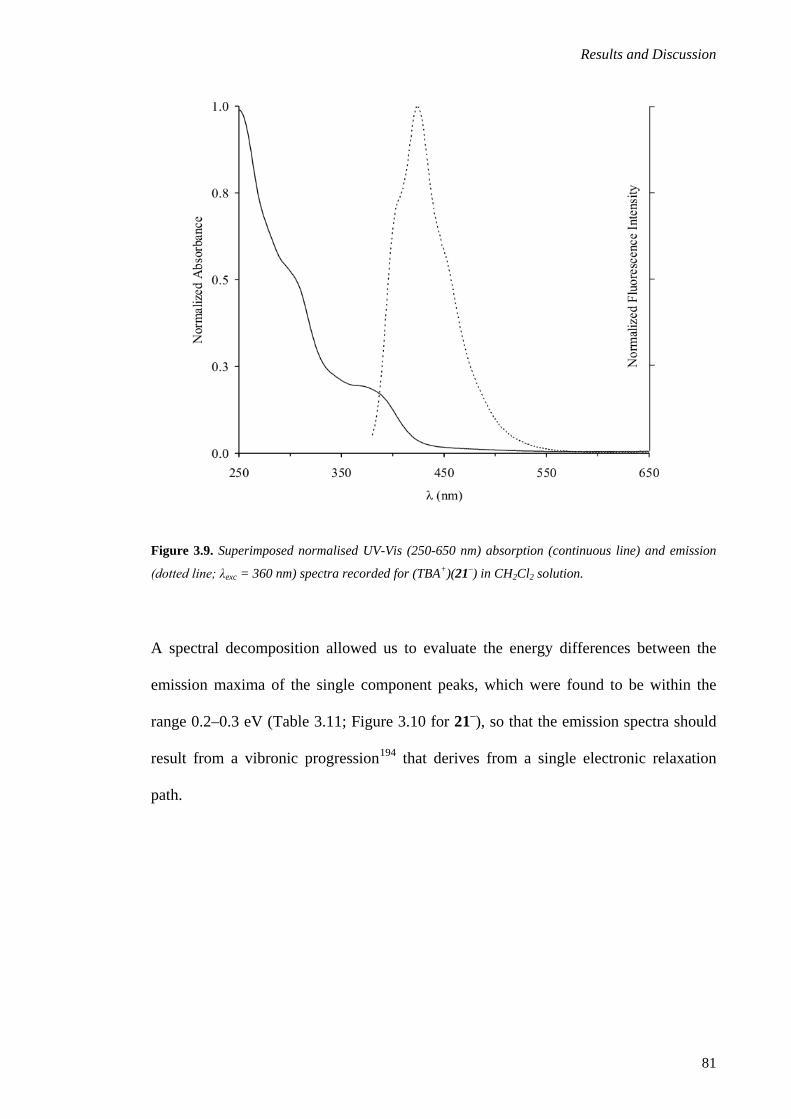


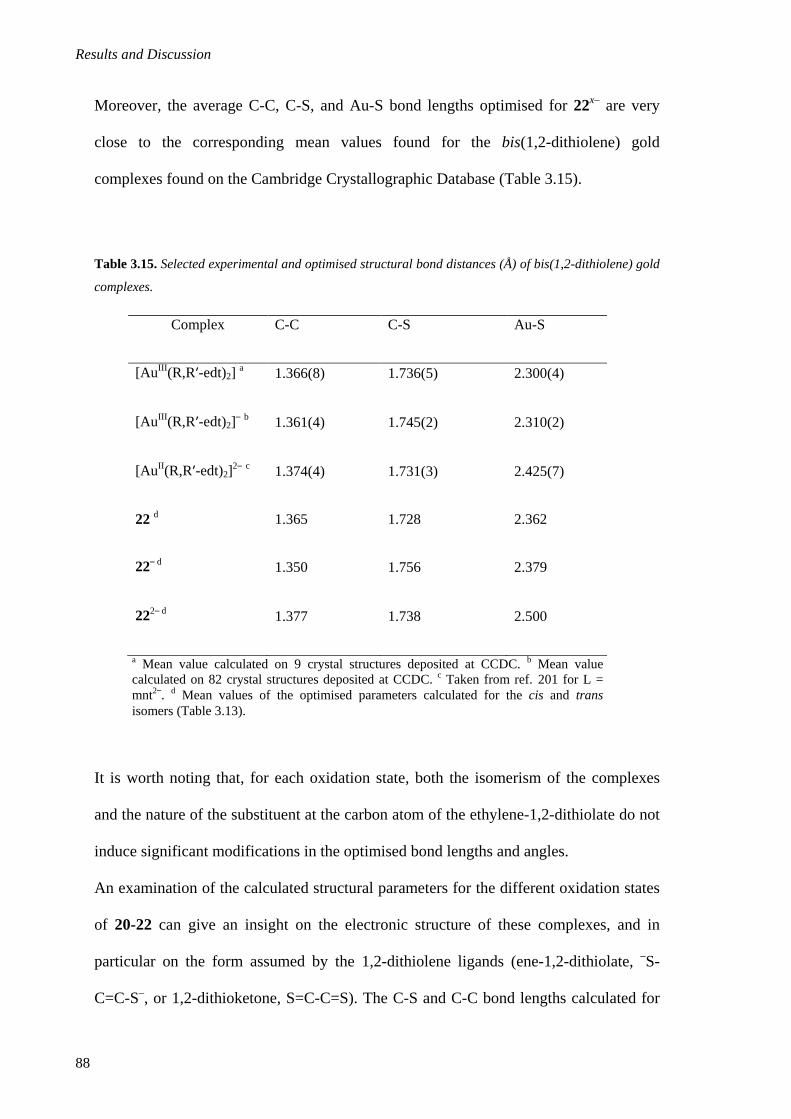


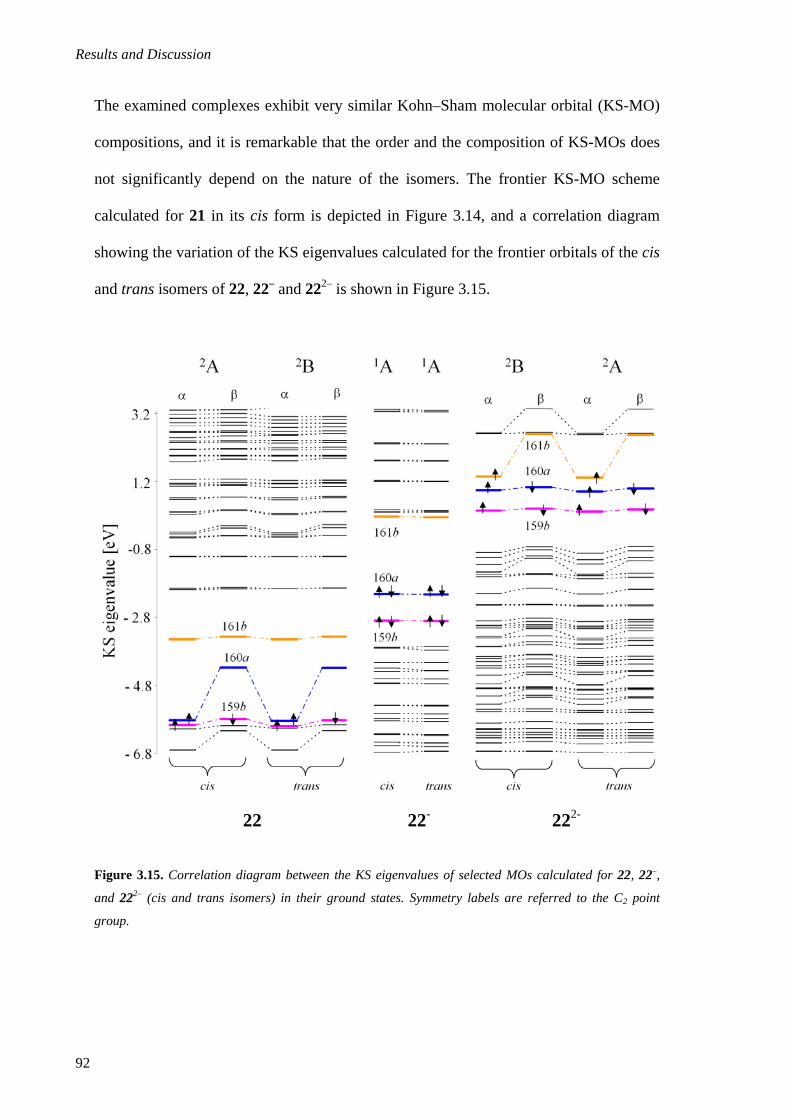
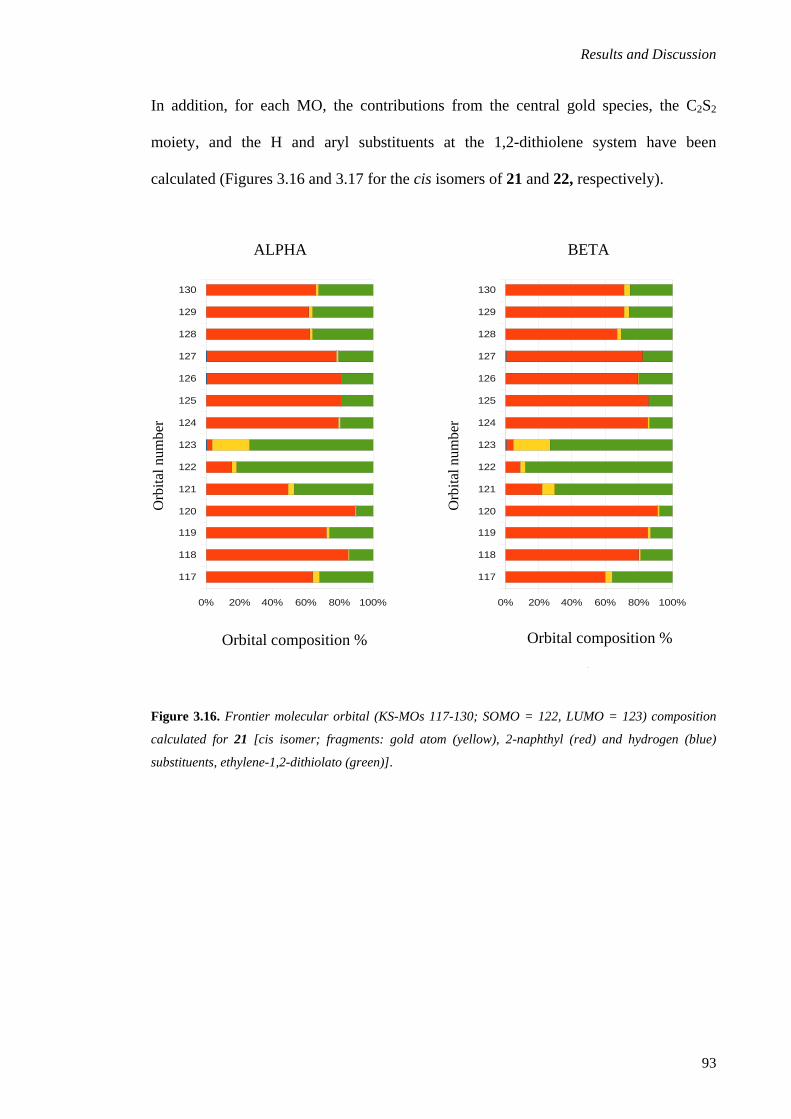


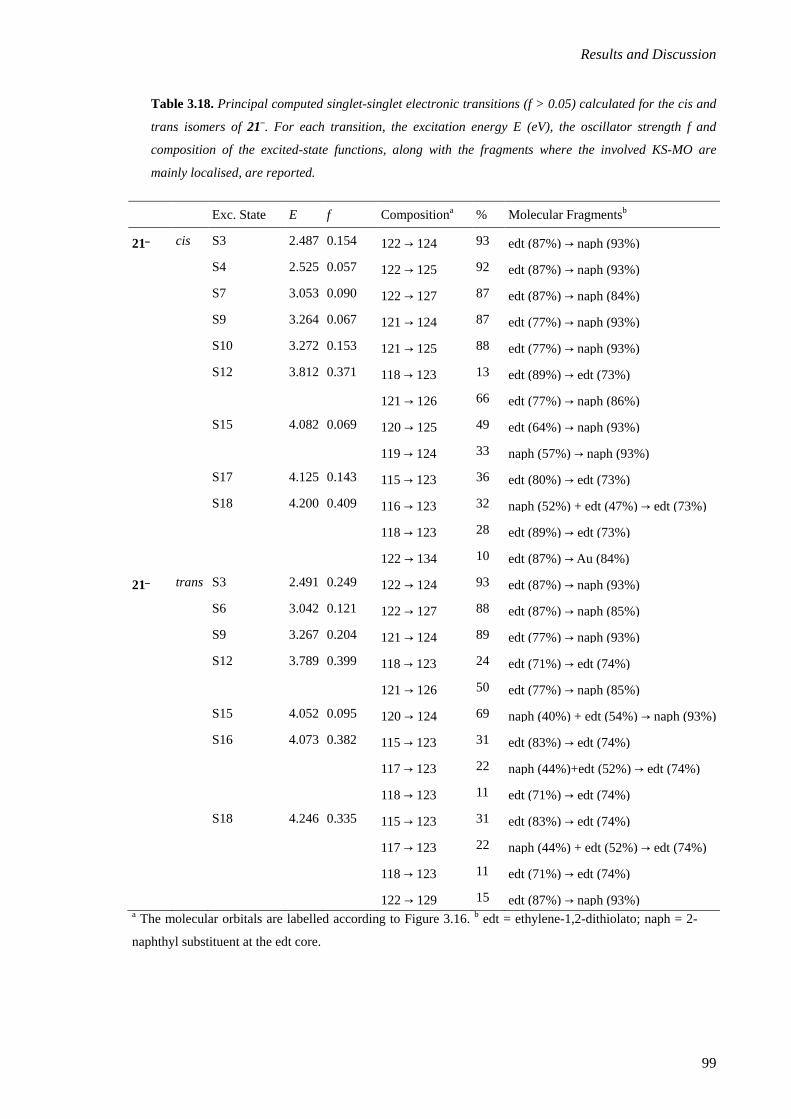


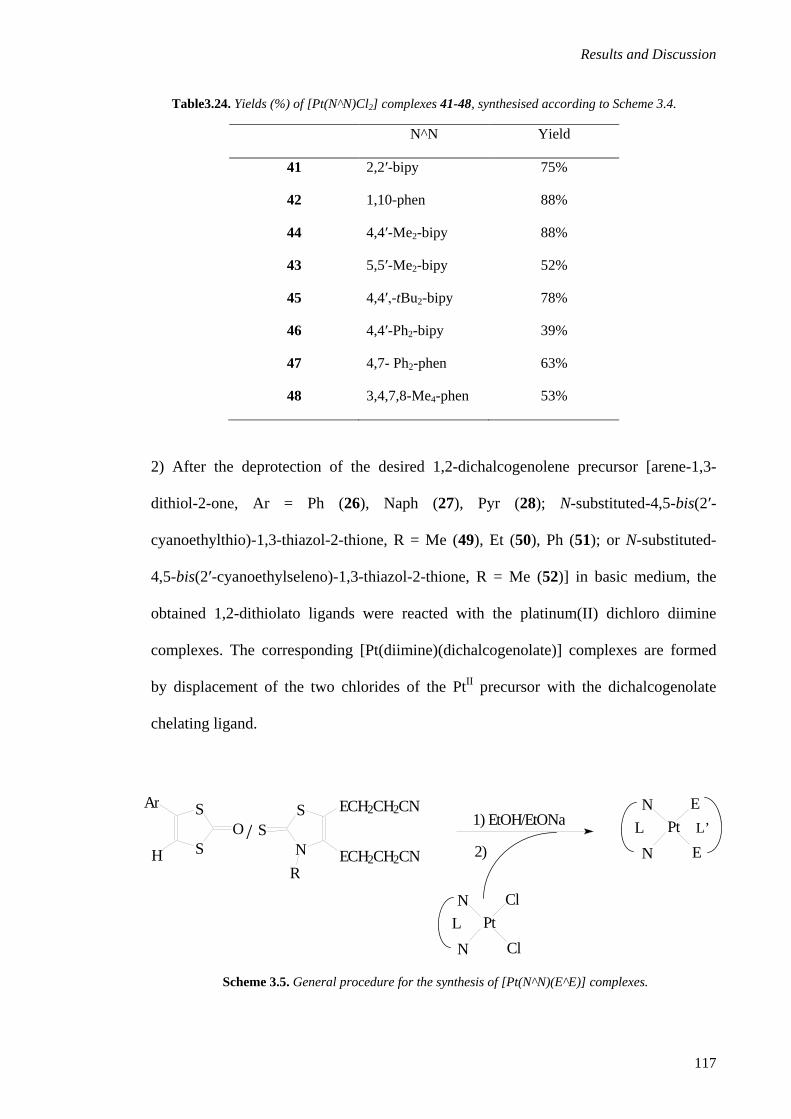


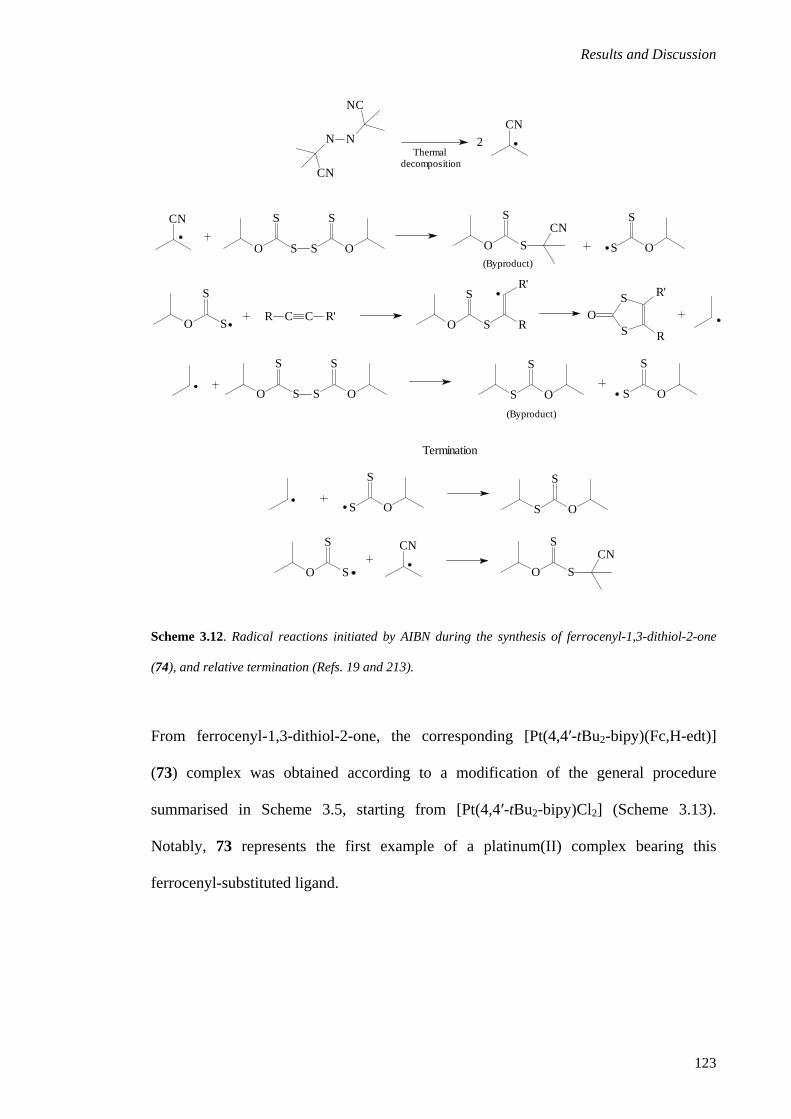

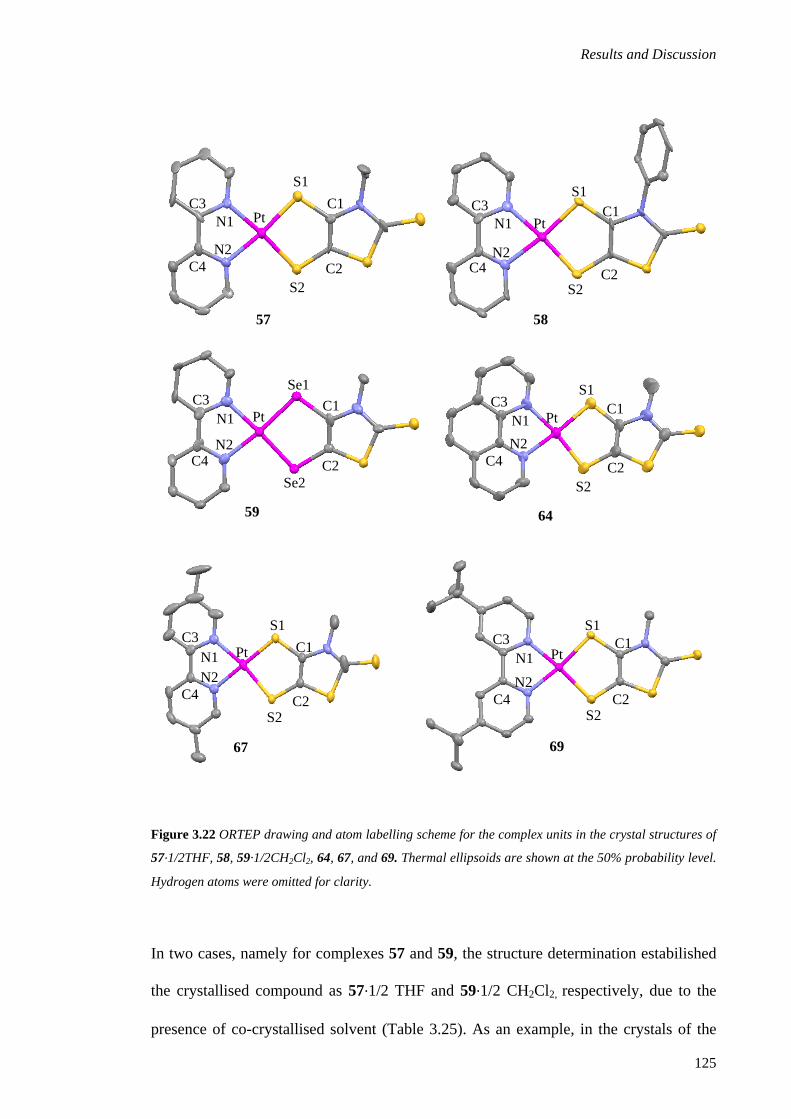


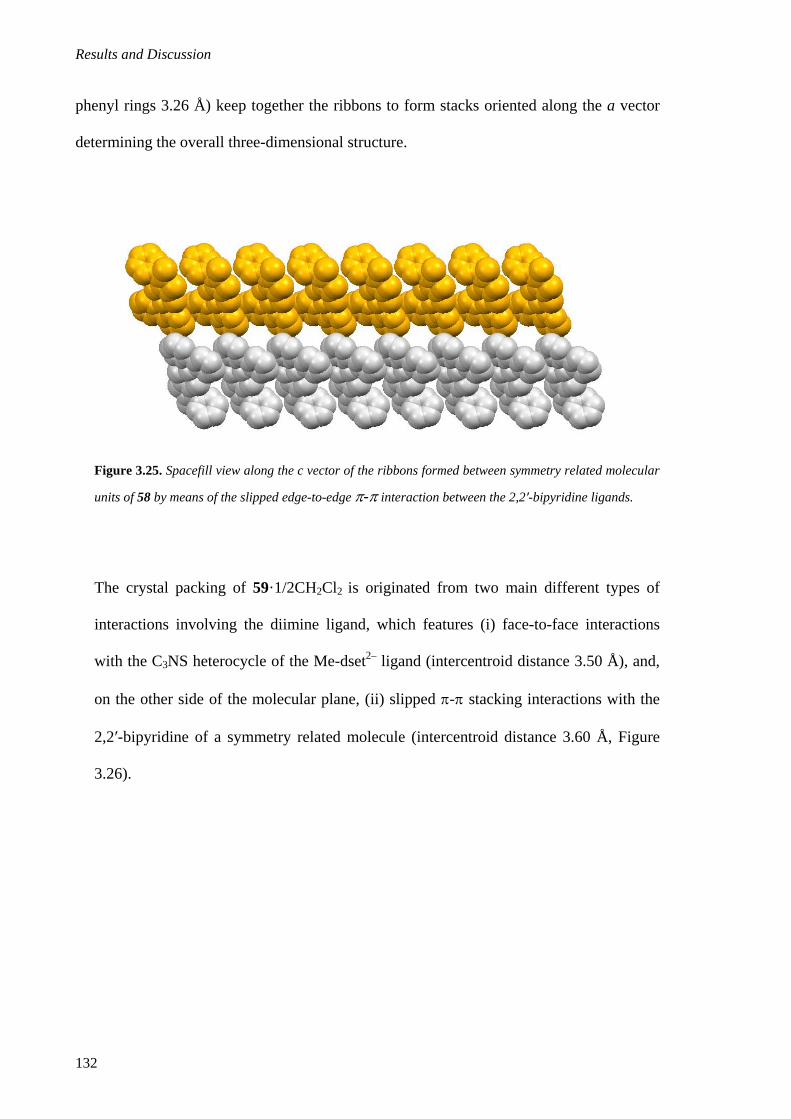


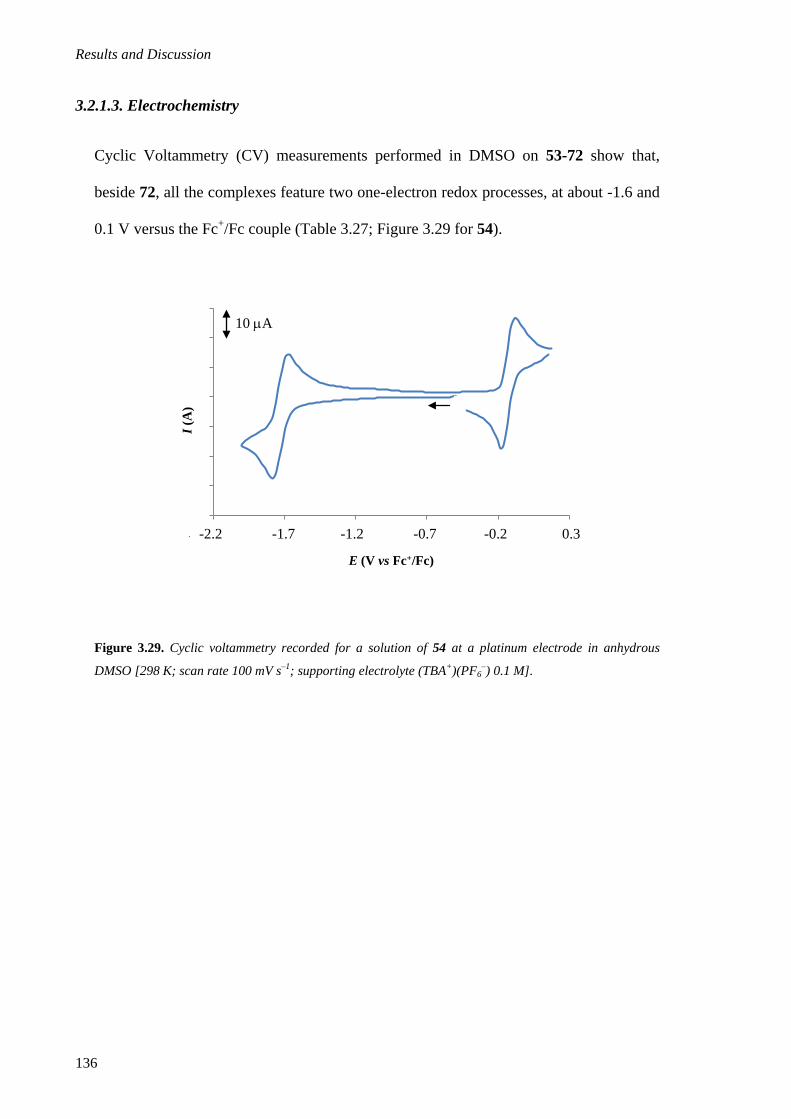


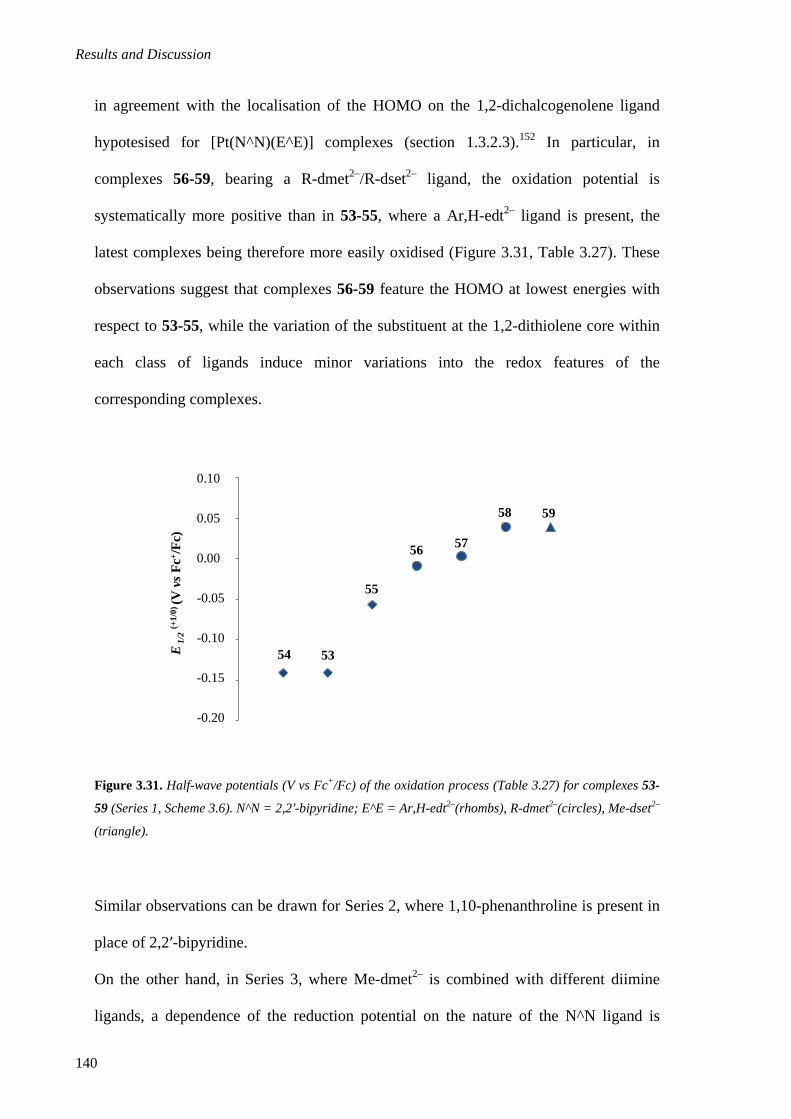


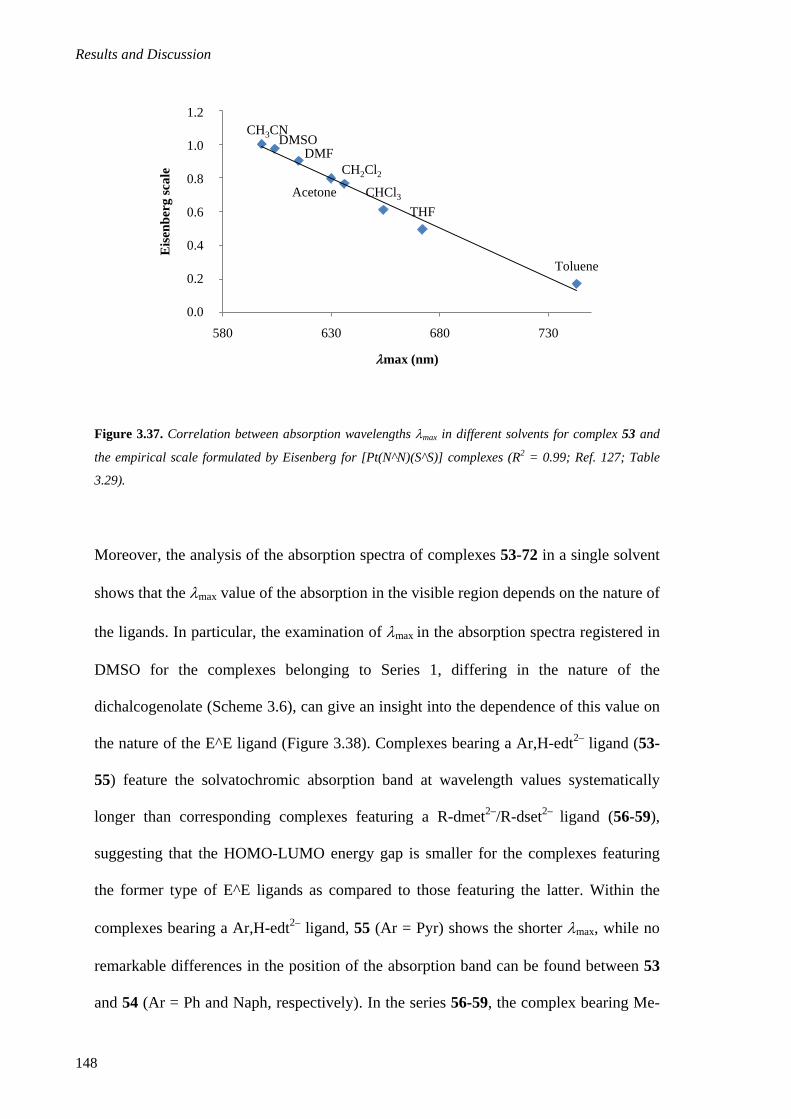


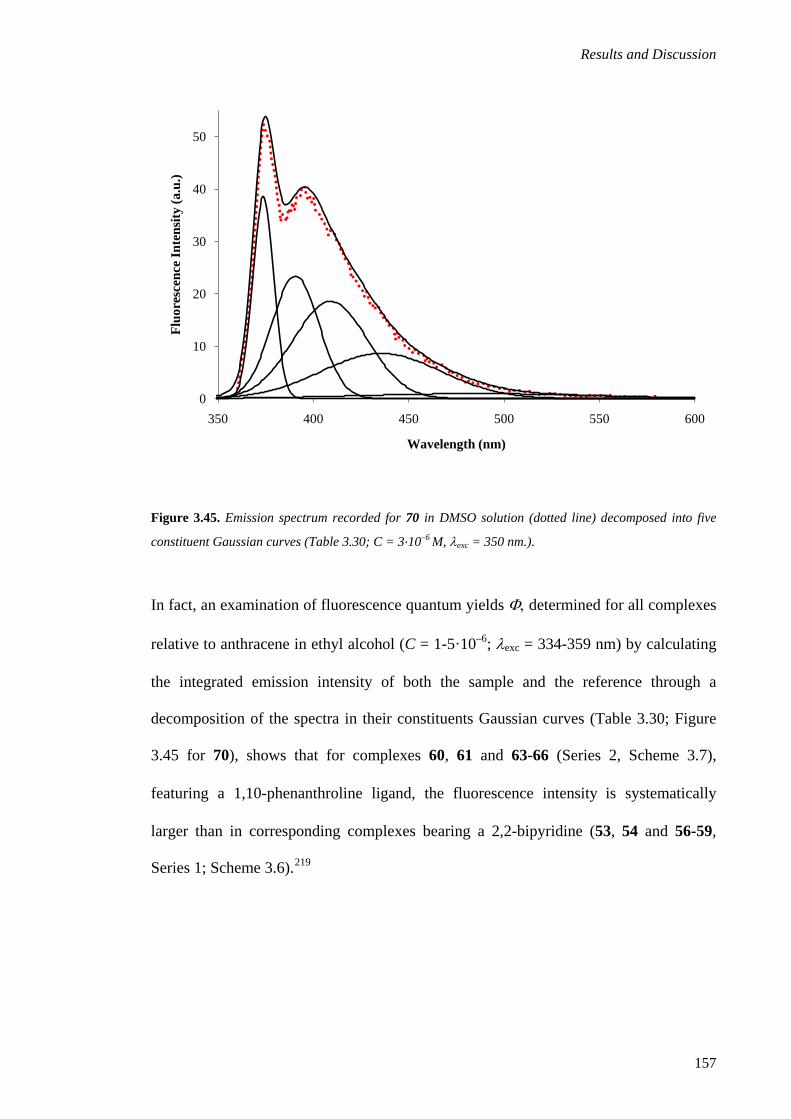


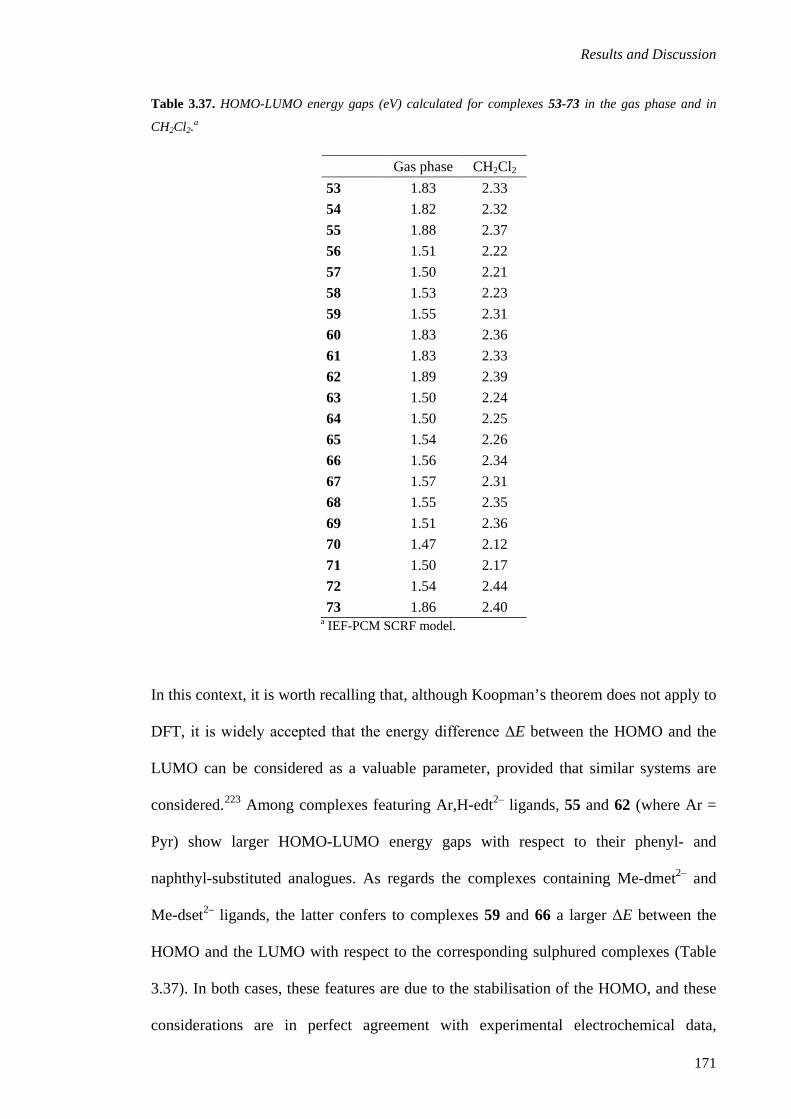


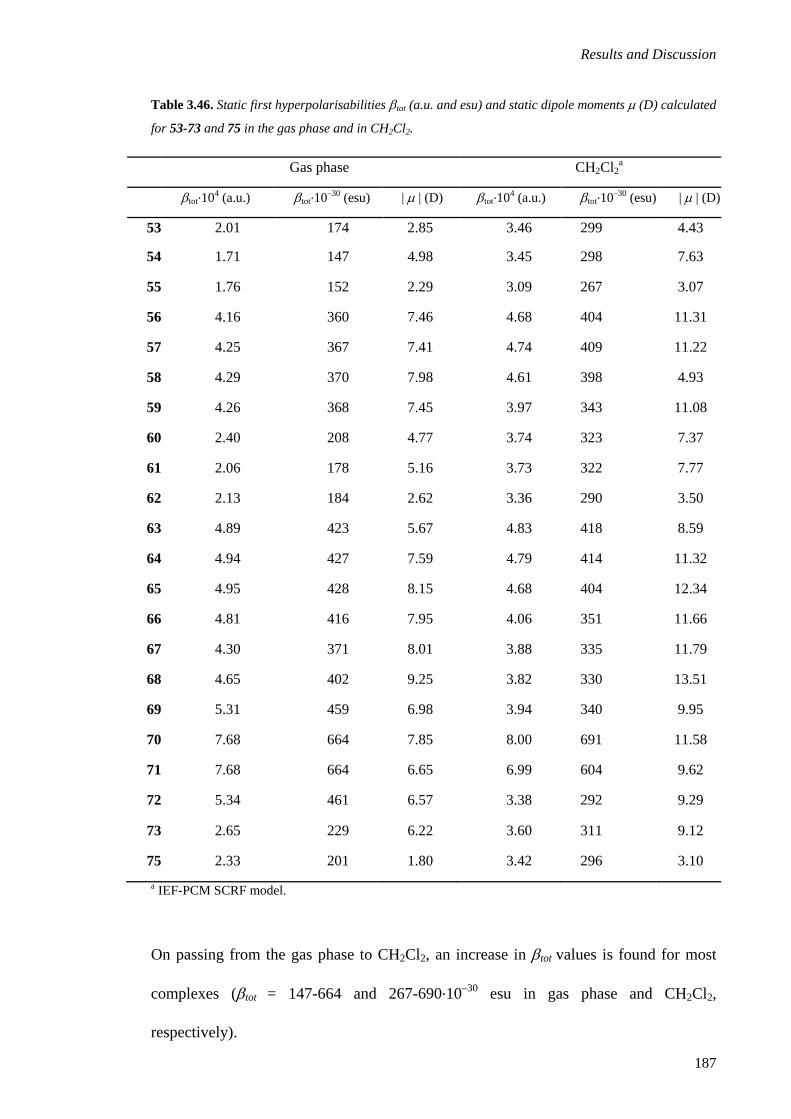


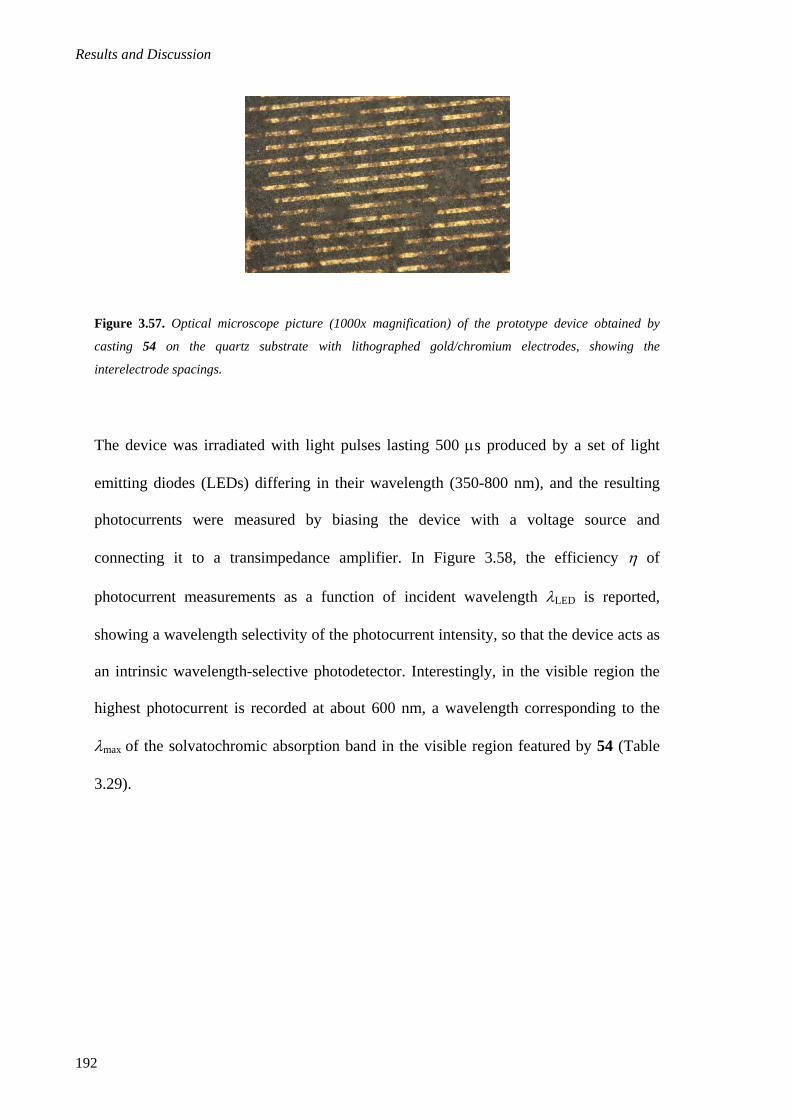


![Inorganica Chimica Acta - iris.unina.it · Inorganica Chimica Acta 453 (2016) 330–338 Contents lists available at ScienceDirect Inorganica Chimica Acta ... [10,11]. In addition,](https://static.documents.pub/doc/80x56/5c65ec8509d3f230488b5a47/inorganica-chimica-acta-irisuninait-inorganica-chimica-acta-453-2016-330338.jpg)


