Page 1
DIPLOMARBEIT
Stable isotope probing-based ecophysiological analysis
of sulphate-reducing microorganisms in an acidic fen
angestrebter akademischer Grad
Magister der Naturwissenschaften (Mag. rer.nat.)
Verfasser: Norbert Bittner
Matrikel-Nummer: 0040188
Studienrichtung(lt.Studienblatt): Molekulare Biologie
Betreuer: O. Univ. Prof. Dr. Michael Wagner
Wien, Jänner 2010
Page 3
Table of contents
1 Introduction............................................................................................................. 1
1.1 The sulphur cycle .............................................................................................. 1
1.2 Physiology and phylogeny of SRP ................................................................... 2
1.3 Dissimilatory reduction of sulphate .................................................................. 5
1.4 Habitats of SRP................................................................................................. 6
1.5 Wetlands, climate and SRP ............................................................................... 7
1.6 Aim of this study .............................................................................................. 8
2 Material and methods ........................................................................................... 10
2.1 Provided samples ............................................................................................ 10
2.1.1 Sampling site .................................................................................................. 10
2.1.2 Sample incubation .......................................................................................... 10
2.1.3 Soil DNA and RNA extraction ....................................................................... 11
2.2 General material and methods ........................................................................ 11
2.3 Buffers, media and solutions .......................................................................... 15
2.3.1 General solutions ............................................................................................ 15
2.3.2 General solutions for ultracentrifugation ........................................................ 15
2.3.3 Buffers, solutions and standards for gel electrophoresis ............................... 15
2.3.4 Culture media for Escherichia coli strains .................................................... 16
2.3.5 Culture media for Halobacterium salinarum ................................................ 17
2.4 Methods .......................................................................................................... 18
2.4.1 Quantitative analysis of nucleic acids ............................................................ 18
2.4.1.1 Nanodrop analysis........................................................................................... 18
2.4.1.2 Picogreen analysis ........................................................................................... 18
2.4.2 Qualitative nucleic acid analysis by agarose gel electrophoresis ................... 18
2.4.2.1 Qualitative nucleic acid fragment analysis ..................................................... 18
Page 4
4
2.4.2.1 Qualitative nucleic acid fragment analysis followed by gel extraction .......... 19
2.4.3 Amplification of specific nucleic acid fragments by PCR ............................. 19
2.4.3.1 Amplification of 16S rRNA genes .................................................................. 19
2.4.3.2 M13 screening PCR ........................................................................................ 21
2.4.3.3 Touchdown hot-start PCR amplification of dsrAB ........................................ 22
2.4.3.4 Amplification of reverse transcribed 16S rRNA fragments by RT-PCR ....... 24
2.4.4 Isopycnic centrifugation of nucleic acids ....................................................... 25
2.4.4.1 Refractrometric density measurements ........................................................... 25
2.4.4.2 Isopycnic centrifugation of DNA ................................................................... 25
2.4.4.3 Isopycnic centrifugation of RNA .................................................................... 26
2.4.5 Nucleic acid precipitation ............................................................................... 26
2.4.5.1 DNA precipitation out of CsCl gradient medium .......................................... 26
2.4.5.2 RNA precipitation out of CsTFA gradient medium ...................................... 26
2.4.6 Terminal restriction fragment length polymorphism analysis ....................... 26
2.4.7 Cloning of PCR products ............................................................................... 28
2.4.7.1 Cloning of 16S rRNA PCR products ............................................................. 28
2.4.7.2 Cloning of dsrAB amplicons .......................................................................... 28
2.4.8 DNA sequencing ............................................................................................ 29
2.4.9 Comparative sequence analysis ..................................................................... 29
2.4.9.1 Sequence alignement ..................................................................................... 29
2.4.9.2 Phylogeny ...................................................................................................... 30
2.4.9.3 Test for chimeric sequences ........................................................................... 31
2.4.9.4 Rarefaction ..................................................................................................... 31
2.4.9.5 Statistical comparison of different habitats ................................................... 31
3 Results ..................................................................................................................... 32
3.1 Gradient centrifugation of nucleic acids ....................................................... 32
3.2 T-RFLP analysis of density resolved nucleic acids ....................................... 34
3.2.1 Bacterial T-RFLP analysis of DNA SIP incubations .................................... 34
Page 5
5
3.2.2 Archaeal T-RFLP analysis of DNA SIP incubations ..................................... 40
3.2.3 Bacterial T-RFLP analysis of RNA SIP incubations ..................................... 42
3.3 Amplification, cloning and sequencing of 16S rRNA genes and dsrAB ....... 43
3.4 Sequence analysis .......................................................................................... 44
3.4.1 Bacterial 16S rRNA gene analysis ................................................................. 44
3.4.2 DsrAB analysis .............................................................................................. 48
4 Discussion ............................................................................................................... 50
5 Summary ................................................................................................................ 57
6 Literature ................................................................................................................ 59
7 List of abbreviations .............................................................................................. 69
8 Appendix ................................................................................................................. 71
8 Appendix ................................................................................................................. 71
9 Curriculum vitae .................................................................................................... 82
10 Acknowledgements ................................................................................................ 83
Page 6
Introduction
1
1 Introduction
1.1 The sulphur cycle
Besides carbon (C), nitrogen (N) and phosphorus (P), sulphur (S) is one of the main
elements found in biomass. It is an essential constituent of many enzymes, vitamins and
hormones. Sulphur is present in many different oxidation states, ranging from −2 (H2S)
to +6 (SO42−
), being constantly transformed chemically and biologically. Most of earths
sulphur is present in rocks and sediments like pyrite (FeS2) or gypsum (CaSO4). As geo-
logical turnover times are long and these sulphur-species are biologically inaccessible,
most of the biologically used sulphur can be found in the form of sulphate ions and hy-
drogen sulphide, playing essential roles in the biological sulphur cycle as illustrated in
Fig.1 (Hollemann and Wiberg 1985).
Fig.1 Biological sulphur cycle (modified from Madigan 2003).
Several plants, fungi and prokaryotes can use sulphate to build up the essential sulphur
containing amino acids cystein and methionine through assimilatory sulphate reduction.
Many organisms then use these amino acids for incorporation in their biomass. Beside
the anabolic utilisation of these amino acids, many microorganisms remineralise them
Page 7
Introduction
2
to sulphide via desulphurylation, which is then converted back to sulphate by sulphur-
oxidizing bacteria. Two distinct prokaryotic groups have the ability to oxidize sulphide.
One group are anaerobic living, phototrophic sulphur bacteria, the others are aerobic
chemolithotrophic bacteria (Madigan et al. 2003). Furthermore, elemental sulphur can
be oxidised by some prokaryotes, like Desulfocapsa sulfoexigens, resulting in sulphate
and closing the sulphur cycle (Frederiksen and Finster 2004).
Alternatively, sulphate, sulphite and thiosulphate can serve as an energy source for sul-
phate-reducing prokaryotes (SRP), not being converted to biomass (Karkhoff-Schweizer
et al. 1995). Dissimilatory sulphate reduction is restricted to anoxic/microoxic habitats,
playing an essential role in the turnover of sulphur and carbon in these environments
(Brune et al. 2000). It is one of earth‟s history oldest biogeochemical processes which
evolved 2.5 to 2.7 billion years ago (Canfield 1998) possibly emerging from sulphur
metabolism which was verified in 3.5 billion years old sediments (Philippot et al. 2007).
Compared to denitrification in anoxic habitats, sulphate reduction is an energetically
unfavourable process. Sulphate removal would therefore be expected to occur sequen-
tially after depletion of nitrate, unless there are other potential electron acceptors such
as iron and manganese. However, trough heterogeneous distribution of substrates, creat-
ing microenvironments, anaerobic sulphate reduction could be detected in almost any
anaerobic environment (Whitmire and Hamilton 2005).
1.2 Physiology and phylogeny of SRP
Apart from being essential for sulphur turnover, research showed that SRP are mainly
responsible for anaerobic carbon cycling. They are divided into two main groups, those
that degrade organic compounds incompletely to acetate and those that degrade organic
compounds to carbon dioxide. SRP that can degrade carbon compounds to carbon diox-
ide commonly can use acetate as a growth substrate. Two pathways of acetate oxidation
are utilised, a modified citric acid cycle as shown in Desulfobacter postgatei (Bran-
disheep et al. 1983) and the acetyl-CoA pathway, as employed for example by Desulfo-
bacca acetoxidans. Different species of sulphate reducers can utilise many kinds of or-
ganics, ranging from one carbon compounds (Nanninga and Gottschal 1987; Tanimoto
and Bak 1994; Parshina et al. 2005), aromatic hydrocarbons (Rabus et al. 1993), long-
and short-chain alkanes (Aeckersberg et al. 1998; Kniemeyer et al. 2007), to various
sugars (Sass et al. 2002) (Fig. 2).
In terms of phylogeny, SRP are distributed throughout several prokaryotic lineages.
Comparative analysis of 16S rRNA and dsrAB sequences of known SRP showed that
they can be grouped into five bacterial and two archaeal phyla (Fig. 3a+b) (Castro et al.
2000; Mori et al. 2003; Wagner et al. 2005). Most of them belong to the class of Del-
Page 8
Introduction
3
taproteobacteria, harbouring 79 species of Desulfovibrio spp. and members of the
Desulfobacteraceae family. A large number of SRP belong to the lineage Clostridia,
with several species of the Desulfosporosinus and Desulfotomaculum genera. These
bacteria have the ability to form endospores (Stackebrandt et al. 1997; Hattori et al.
2000; Sass et al. 2004).
The remaining bacterial lineages Nitrospirae, Thermodesulfobacteria and Thermodesul-
fobiaceae only contain thermophilic SRP (Jeanthon et al. 2002; Mori et al. 2003; Se-
kiguchi et al. 2008). Sulphate reducers belonging to the archaeal lineages were found at
submarine hydrothermal systems and in acidic hot springs and could be classified into
the phyla Euryarchaeota and Crenarchaeota (Stetter et al. 1987; Burggraf et al. 1990;
Itoh et al. 1999).
Fig.2 Pattern of microbial degradation of complex organic matter in anoxic environments in the
presence of sulphate (modified from Muyzer and Stams 2008).
Apart from 16S rRNA studies, functional gene based phylogenetic studies based on the
A and B subunit of dissimilatory (bi-) sulphite reductase (dsrAB) have been employed
to unravel the diversity and evolution of SRP (Fig.3). It could also be shown that some
species e.g. Desulfotomaculum acquired dsrAB by lateral gene transfer (Klein et al.
2001; Zverlov et al. 2005).
Page 9
Introduction
4
Fig.3 Phylogenetic trees of SRP based on their a) 16S rRNA and b) DsrAB sequences. Scale
bar shows estimated 10% sequence difference (Muyzer and Stams 2008, Wagner 2005).
a)
b)
Page 10
Introduction
5
1.3 Dissimilatory reduction of sulphate
SRP use sulphate as the terminal electron acceptor for growth. The E0‟
of the redox
couple sulphate-sulphite is −516 mV, which is too negative to allow reduction by the
electron acceptors ferredoxin or NADH (−420 mV respectively −310 mV) present in
SRP (Madigan et al. 2003). Therefore, sulphate has to be activated with adenosine-5‟-
triphosphate (ATP) by ATP sulphurylase. The resulting activated product, adenosine-5‟-
phosphosulphate (APS) is then converted to (bi-) sulphite, by APS reductase (−60 mV)
(Fig.4). In this reaction two electrons are transferred to the sulphur ion and adenosine-
5‟-monophosphate (AMP) is released. The released AMP is converted by ATP-
dependent adenylate kinase into two molecules of ATP. This makes the activation of
sulphate an energy-consuming step at the expense of two ATP.
Fig.4 Dissimilatory reduction of sulphate (modified from Madigan 2003).
The resulting sulphite is further reduced to sulphide. The exact mechanism remains un-
clear, whether it is one six-electron-step or three two-electron-steps through trithionate
and thiosulphate (Fitz and Cypionka 1990; Broco et al. 2005). In any regard, dissimila-
tory (bi-) sulphite reductase (dsrAB) is the essential catalysing enzyme of this step, ex-
pressed by all known sulphate reducers (Rabus et al. 2006). To obtain energy out of
these redox reactions, electron transfer is coupled to a membrane bound electron trans-
port chain, leading to a proton motive force that is used to form ATP via ATPase
(Odom and Peck 1984; Crane and Getzoff 1996). Taking into account the uptake and
Page 11
Introduction
6
activation of sulphate, the net yield of ATP would therefore be one quarter of an ATP
molecule per sulphate molecule reduced (Thauer et al. 2007). Besides sulphate, many
other compounds are used by SRP as electron acceptors. Those range from other sul-
phur compounds like thiosulphate, sulphite and sulphur to even nitrate and nitrite
(Moura et al. 1997). Also heavy metals such as iron (Lovley et al. 1993a), uranium
(Lovley et al. 1993b), chromate (Lovley and Phillips 1994) and arsenate (Macy et al.
2000) were found to be electron acceptors for certain SRP. However, it remains unclear
whether these processes are coupled to growth. Beside their biological role, this ability
makes SRP useful candidate organisms for removal of heavy metals from contaminated
soil, groundwater or waste water as already applied, e.g. in the mining industry (van
Houten et al. 2006).
1.4 Habitats of SRP
Due to their versatile use of different electron donors and electron acceptors, SRP are
ubiquitously distributed in natural and engineered environments. Although sulphate
reduction is an anaerobic process, SRP have also been found in oxic-anoxic transition
zones as they are capable of dealing with oxygen stress (Cypionka et al. 1985; Bade et
al. 2000). SRP have been detected in environments ranging from -2°C to 100°C as well
as under highly acidic (pH 2) (Koschorreck et al. 2003) or basic conditions (pH 10)
(Foti et al. 2007). Although being detected over this broad range of pH, the best condi-
tions for cultivated SRP were at neutral pH and acidic conditions even restricted growth
of certain species (Widdel 1988). In marine sediments, SRP play an essential role in the
carbon cycle due to the high availability of sulphate (28 mM) and anoxic conditions. It
is estimated that SRP account for up to 50% of the carbon mineralization in coastal
sediments (Jorgensen 1982). Many studies regarding SRP were dealing with these habi-
tats (Knoblauch et al. 1999; Sahm et al. 1999; Dhillon et al. 2003; Fishbain et al. 2003;
Purdy et al. 2003; Leloup et al. 2007). Despite low sulphate concentrations of 10 – 200
µM in freshwater environments (Ingvorsen et al. 1981), SRP have been detected in e.g.
groundwater, freshwater lake sediments and waste water treatment plants (Sass et al.
1998; Lehman et al. 2001; Dar et al. 2005; Ben-Dov et al. 2007). They are also found in
terrestrial ecosystems, e.g. in rice field soil (Ouattara et al. 1999; Scheid and Stubner
2001; Weber et al. 2001) and the plant rhizosphere (Hines et al. 1999). Moreover they
live in syntrophy with methanotrophic archaea (Boetius et al. 2000) and even as symbi-
onts in the marine worm Olavius argavensis (Dubilier et al. 2001). In this thesis, activ-
ity of SRP in peatlands was the focus of investigation. The studied site, the Schlöppner-
brunnen fen in the Lehstenbach catchment (Bavaria, Germany), has already been the
focus of several studies (Loy et al. 2004; Wentrup 2007; Hamberger et al. 2008; Wust
et al. 2009).
Page 12
Introduction
7
1.5 Wetlands, climate and SRP
Natural and agricultural wetlands account for 20 to 40% of the annual emission of the
powerful greenhouse gas methane (Fung et al. 1991; Hein et al. 1997). Regular flooding
and low abundance of electron acceptors like e.g. nitrate in these areas is favouring
growth of methanogenic species making wetlands their favoured habitat (Horn et al.
2003). Interestingly, emission of methane is decreased up to 78% when SRP are ac-
tively growing (Lovley and Klug 1983; Gauci et al. 2004; Schimel 2004). Both func-
tional groups of mcrobes can compete for the same substrates (i.e. acetate, hydrogen),
which they require for growth. Due to a higher energy yield of sulphate reduction, com-
pared to methanogenesis, SRP out compete these microorganisms even at low sulphate
concentration of about 100 µM (Lovley and Klug 1983).
Apart from these findings, other developments make sulphate reduction an important
research topic regarding climate change. Geo-engineering attempts to dampen the
greenhouse effect by SO2 deposition in the stratosphere, would increase sulphur deposi-
tion as well as predicted increase in industrial activity in developing countries, espe-
cially China (Gauci et al. 2004; Rasch et al. 2008). In this context, a catchment area of
the Fichtelgebirge in the northeast of Bavaria, the Schlöppnerbrunnen site, was found to
be a suitable model system (Fig.5).
Fig.5 The Schlöppnerbrunnen model system. The figure illustrates the flow of sulphur and ongo-
ing anaerobic processes in this area in the Fichtelgebirge in Bavaria, Germany (Loy 2006).
Many aspects of this ecosystem were already examined, e.g. methanogenesis (Wust et
al. 2009) anaerobic carbon flow (Hamberger et al. 2008) and sulphate reduction (Loy et
al. 2004; Duller 2005; Wentrup 2007). Most of the sulphur compounds found at the
Schlöppnerbrunnen site result from acidic rain being a consequence of anthropogenic
Page 13
Introduction
8
activities in the area of industrial build up in 1950 – 1987 (Novak et al. 2007). Nowa-
days, this accumulated sulphur is gradually released in the catchment after snowmelt or
heavy rain falls and collected in fen systems located at lower elevations, like for exam-
ple Schlöppnerbrunnen I an II. Studies investigating sulphur isotope ratios proved that
sulphate reduction is an ongoing process thereby providing an excellent environment for
studies about SRP in acidic wetlands (Alewell and Novak 2001).
1.6 Aims of this study
Although biogeochemical cycling is of importance in terrestrial ecosystems, the biology
of sulphate reduction is not very well understood. Earlier studies at the investigated site
discovered a great diversity of potential SRP on the basis of dsrAB phylogeny (Fig.6)
(Loy et al. 2004). Following studies, applying FISH and qPCR (Duller 2005; Wentrup
2007), tried to reveal abundance and identity of these new species. Relatively high
amounts of microorganisms harbouring these novel dsrAB were detected, but could not
be connected to sulphate reduction. In this study, a differential display stable isotope
probing (SIP) approach was applied to identify active SRP at the studied site. In the
recent past, SIP has been used extensively to connect phylogeny and activity of unculti-
vated microorganisms in situ, giving new insights into the utilisation of various sub-
strates such as phenol (Manefield et al. 2007) and various monosaccharides (Hamberger
et al. 2008). Applying SIP even gave insights in the syntrophic relationship mediating
the oxidation of propionate in rice field soil (Lueders et al. 2004b).
For this study, soil samples taken from the Schlöppnerbrunnen II site were incubated up
to 6 months with 13
C-labelled substrates and with or without sulphate. Soil slurries were
sampled at different time points and nucleic acids were extracted. Through isopycnic
centrifugation and gradient fractionation, 13
C-labelled nucleic acids of active microor-
ganisms were obtained. Those were identified by terminal restriction fragment length
polymorphism (T-RFLP) and clone library analysis of 16S rRNA and dsrAB marker
genes was applied.
The main objectives of this study were:
To identify the key players of sulphate reduction in the observed area by com-
paring the isotopically labelled nucleic acids of the microbial community via
16S rRNA screening of sulphate induced samples with non-sulphate induced
samples.
Connecting the new discovered species found by dsrAB analysis of the Schlöpp-
nerbrunnen (Loy et al. 2004) with active sulphate reducers by comparing the two
isotopically labelled fractions on the level of the dsrAB gene.
Page 14
Introduction
9
Fig.6 DsrAB tree of potential sulphate reducing microorganisms obtained from Schlöppnerbrun-
nen I and II. Scale bar indicates 10% sequence difference as inferred from distance matrix
analysis (Loy et al. 2004).
Page 15
Results
10
2 Material and Methods
All nucleic acid samples, investigated in this study, were prepared by Michael Pester
from the Department of Microbial Ecology, University of Vienna as explained in the
following section (2.1).
2.1 Provided samples
2.1.1 Sampling site
Soil samples were taken at the Schlöppnerbrunnen II sampling site (50°08‟38‟‟N,
11°51‟41‟‟E), located in the Lehstenbach catchment (Bavaria, Germany). The catch-
ment is a 4.2 km² wide forested area, of which 90% is covered with Norway spruce
(Picea abies). Soils in the catchment have developed from weathered granitic bedrock
and are predominantly cambisols and cambic podsols. The temperature level is around
5°C in average, with a mean precipitation of 900 to 1,160 mm per m² and year. The
sampling site is one of many fens, distributed throughout the catchment, with a soil pH
of approximately 3.9 to 4.2 (Loy et al. 2004). Samples were taken from a depth of
10-20 cm in November 2007, sealed and transported to the laboratory in a cooling de-
vice. Samples were stored at 4°C until further experimental usage.
2.1.2 Sample incubation
Prior to incubation with 13
C labelled substrates, 30 g of soil from the corresponding
samples were put in 125 ml glass bottles and gased with 100% N2, to establish anoxic
conditions. Additionally, 60 ml of anoxic fen soil water was added to the sample after
filter sterilisation (0.2 µM) and immediately sealed with butyl rubber septa. For deple-
tion of internal electron acceptors and donors, samples were preincubated without any
addition of substrate for 28 days at 14°C in the dark. After pre-incubation, a 12
C sub-
strate mix of lactate, acetate, propionate (100 µM each), and formate (200 µM) was
added twice over a period of 2 weeks to determine substrate turnover times. In addition,
three soil slurries were supplemented once with 200 µM sulphate. In all incubations,
lactate and formate were readily turned over within 2 days, while acetate and propionate
needed 4 and 6 days for turnover after the first and second substrate addition, respec-
tively. To isotopically label active prokaryotes, a mixture of fully labelled 13
C-substrates
was added weekly. The mixture consisted of lactate, acetate, propionate (100 µM each),
and formate (200 µM). In addition, sulphate was added to an end-concentration of 100–
200 µM. The concentrations were adjusted to resemble the natural concentrations of the
Page 16
Results
11
sampling site, being 20–240 µM for sulphate and 80–190 µM for the carbon species
(Loy et al. 2004; Schmalenberger et al. 2007). Soil slurries without sulphate addition
served as controls. Upon substrate addition, soil slurries were shaken to ensure complete
mixing. In total, 6 bottles, 3 with sulphate added and 3 without sulphate added were
prepared as described.
2.1.3 Soil DNA and RNA extraction
Total nucleic acids were extracted from frozen samples (–80°C) by grinding in liquid
nitrogen and following the procedure described by Lueders and co-workers (Lueders et
al. 2004a). Minor modifications were applied, including a humic acid precipitation step
with 7.5 M Na-Acetate as described by Bodrossy and co-workers (Bodrossy et al.
2006). DNA was separated from RNA using the All Prep DNA/RNA Mini Kit (Qiagen,
Hilden, Germany).
2.2 General Material and Methods
Except noted otherwise, all liquids and media used in this study were prepared using
double distilled, UV-light treated and filtered water of a water purification facility sys-
tem (Milli-Q®, Millipore, Billerica, MA, USA). In addition, used water was treated with
diethylpyrocarbonate (DEPC) to get rid of possible contaminations with RNAses
(H2ODEPC). Moreover, all liquids and heat resistant materials were sterilised in a water
vapour high-pressure autoclave (H+P, München, Germany) at 121°C and a pressure of
1.013×10⁵ Pa for 20 min. Heat sensitive liquids and substances were filter sterilised,
using 0.2 µm filters (Qualilab®, Merck Labor und Vertrieb GmbH, Bruchsal, Germany)
and added to the respective solutions after autoclaving. All of the solutions were kept in
bottles, which were baked at 180°C overnight to avoid RNAse contamination.
Table 1: Software
Software URL Reference
ARB software package http://www.arb-home.de/ Ludwig et al.
2004
Basic local alignment search tool http://www.ncbi.nlm.nih.gov/BLAST Altschul et al.
1990
Chromas Pro 1.42 http://www.technelysium.com.au/
ChromasPro.html unpublished
DOTUR http://schloss.micro.umass.edu/ soft-
ware/dotur.html
Schloss et a.l.
2005
Finch TV 1.4 http://www.geospiza.com/Products/
finchtv.shtml unpublished
Peak Scanner 1.0 http://www.appliedbiosystems.com/
peakscanner unpublished
SINA Webaligner http://www.arb-silva.de/aligner/ Pruesse et al. 2007
Page 17
Results
12
TRF Cut http://www.mpi-
marburg.mpg.de/downloads/ Ricke et al. 2005
UniFrac http://bmf.colorado.edu/unifrac/ Lozupone et al.
2006
Table 2: Technical equipment
Equipment Manufacturer
Centrifuges:
Mikro 22 R
Rotina 35
Mikro 120
Optima L-XP series
Andreas Hettich GmbH & Co. KG, Tuttlingen,
Germany
Beckman Coulter Inc., Fullerton CA, USA
DNA sequencer Applied Biosystems 3130 Applied Biosystems, Lincoln CA, USA
Digital refractometer: DR 301- 95 A.KRÜSS Optronic GmbH,Hamburg,Germany
Gel carriage:
Sub-Cell GT UV-Transparent Gel Tray Bio-Rad Laboratories, Inc., Hercules CA, USA
Gel electrophoresis:
Sub Cell®-GT Bio-Rad Laboratories, Inc., Hercules CA, USA
Gel Documentation System Media System
FlexiLine 4040 Biostep, Jahnsdorf, Germany
Heat Block:
VWR Digital heat block VWR Int. , Vienna, Austria
Infinite® 200 microplate reader Tecan Group Ltd., Männedorf, Switzerland
Laminar flow hood Safe 2010 Model 1.2 Holten, Jouan Nordic, Allerød, Denmark
NanoDrop® ND-1000 NanoDrop Technologies, Wilmington DE, USA
Microwave MD6460 Microstar
Magnetic stirrer:
RCT basic
Variomag® Maxi
IKA® Werke GmbH, Schwabach,Germany
Variomag®, Dayton Beach, FL, USA
Milli-Q® Ultrapure Water Purification System Millipore . Billerica MA,USA
PCR thermocyclers:
iCycler
System Mastercycler gradient
Bio-Rad Laboratories, Inc., Hercules CA, USA
Eppendorf AG, Hamburg, Germany
pH-Meter WTW inoLab Level 1
Wissenschaftlich-Technische Werkstätten
GmbH, Weilheim,Germany
Pipettes:
Pipetman® P2 – P1000
Eppendorf Research® pipettes 1 – 1000 μl
Gilson international, Wien, Austria
Eppendorf AG, Hamburg, Germany
Platform shaker Innova 2300 New Brunswick Co., Inc., Madison NJ, USA
Power supply for gel electrophoresis:
PowerPac Basic Bio-Rad Laboratories, Inc., Hercules CA, USA
Peristaltic pump:
WPI AL 2000 Programmable syringe pump WPI Inc., Sarasota FL, USA
Scales:
Sartorius BL 6100
Ohaus Analytical Plus
Sartorius AG, Goettingen, Germany
Ohaus Corporation, Florham Park NJ, USA
Transilluminator UST-30M-8E (312 nm) Biostep GmbH, Jahnsdorf, Germany
Page 18
Results
13
Ultracentrifuge Rotor: Vti 90 Beckman Coulter Inc., Fullerton CA, USA
Ultraviolet Sterilizing PCR Workstation Peqlab Biotechnology GmbH, Germany
Vortex Genie 2 Scientific Industries, New York, USA
Waterbath: DC10 Thermo Haake, Karlsruhe, Germany
Water vapour high pressure autoclaves:
Varioclav 135S H+P, München, Germany
Table 3: Consumables
Item Company
Centrifuge tubes, various sizes
Greiner Bio-One GmbH, Frickenhausen,
Germany
DURAN® bottles, various sizes Schott Glas, Mainz, Germany
Eppendorf reaction tubes, various sizes Eppendorf AG, Hamburg, Germany
Microseal “A” film
Whatman UNISEAL
MJ Research, Waltham, MA, USA
GE Healthcare, Piscataway NJ,USA
Microtiter plates:
Eppendorf® twin.tec PCR Plates 96
Greiner® 96 well plates black flat
U96 MicroWell™ Plates, 0.5 ml
Eppendorf AG, Hamburg, Germany
Greiner Bio-one GmbH, Frickenhausen,
Germany
Nunc life science, Roskilde, Denmark
Needles:
Braun Sterican 23 gauge
Braun Sterican 26 gauge
B. Braun Melsungen AG, Melsungen,
Germany
Optiseal™Ultracentrifude tubes 4.9ml Beckman Coulter Inc., Fullerton CA, USA
PCR tubes, 0.2 ml
Biozym Scientific GmbH, Hess. Oldendorf,
Germany
Petri dishes 94/16
Greiner Bio-one GmbH, Frickenhausen,
Germany
Sterile filter, 0.22 μm pore size
Qualilab®, Merk Labor und Vertrieb GmbH,
Bruchsal, Germany
Tips, various volumes
Biozym Scientific GmbH, Hess. Oldendorf,
Germany
Well Caps Nunc life science, Roskilde, Denmark
Table 4: Chemicals
Chemical Company
Agar
Sigma-Aldrich Chemie GmbH, Steinhausen,
Deutschland
Agarose, electrophoresis grade
Biozym Scientific GmbH, Hess. Oldendorf,
Germany
Boric acid Fluka Chemie AG, Buchs, Switzerland
Bovine Serume Albumin (BSA) Fermentas GmbH, St.Leon-Rot, Germany
Bromphenolblau
Sigma-Aldrich Chemie GmbH, Steinhausen,
Deutschland
Page 19
Results
14
Caesium Chloride
Sigma-Aldrich Chemie GmbH, Steinhausen,
Deutschland
CaesiumTrifluoroacetate (CSTFA) GE Healthcare, Piscataway NJ,USA
Diethylpyrocarbonate (DEPC)
Sigma-Aldrich Chemie GmbH, Steinhausen,
Deutschland
Deionised formamide Carl Roth GmbH & Co., Karlsruhe, Germany
Ethanol absolute per analysis (p.A.) Merck KgaA, Darmstadt, Germany
Ethidium bromide (EtBr) Fluka Chemie AG, Buchs, Switzerland
Ethylene-di-amine-tetra-acetic acid (EDTA)
Sigma-Aldrich Chemie GmbH, Steinhausen,
Germany
Ficoll
Sigma-Aldrich Chemie GmbH, Steinhausen,
Germany
Glycerol Carl Roth GmbH & Co., Karlsruhe, Germany
Glycogen Fermentas GmbH, St.Leon-Rot, Germany
Hydrogen peroxide (H2O2), 30% Carl Roth GmbH & Co., Karlsruhe, Germany
Hydrochloric acid (HCl) Carl Roth GmbH & Co., Karlsruhe, Germany
Isopropanol (2-propanol) p.A. Carl Roth GmbH & Co., Karlsruhe, Germany
Kanamycin
Sigma-Aldrich Chemie GmbH, Steinhausen,
Germany
Polyethyleneglycol-6000 (PEG-6000)
Sigma-Aldrich Chemie GmbH, Steinhausen,
Deutschland
Potassium acetate (KCl) Merck KgaA, Darmstadt, Germany
Sodium chloride (NaCl) Carl Roth GmbH & Co., Karlsruhe, Germany
Sodium hydroxide (NaOH) Carl Roth GmbH & Co., Karlsruhe, Germany
SYBR® Green I
Cambrex Bio Science, Rockland, Inc.,
Rockland, ME,USA
Tris Carl Roth GmbH & Co., Karlsruhe, Germany
Tryptone Oxoid LTD., Hampshire, England
X-Gal (5-brom-4-chlor-3-indolyl-β-D-
galactopyranoside Fermentas GmbH, St.Leon-Rot, Germany
Xylencyanol
Sigma-Aldrich Chemie GmbH, Steinhausen,
Germany
Yeast extract Oxoid LTD., Hampshire, England
Table 5: Molecular Biology Kits
Kit Company
MinElute PCR Purification Kit QIAgen, Hilden, Germany
One Tube Access RT-PCR System Kit Promega Corporation, Madison WI, USA
Quant-iT TM
PicoGreen® dsDNA
Assay kit Invitrogen Corporation, Carlsbad, CA, USA
Quant-iT™ RiboGreen® RNA Assay Kit Invitrogen Corporation, Carlsbad, CA, USA
QIAquick PCR purification kit QIAgen, Hilden, Germany
QIAquick® gel extraction kit QIAgen, Hilden, Germany
TOPO TA Cloning®
Invitrogen Corporation, Carlsbad, CA, USA
TOPO XL Cloning®
Invitrogen Corporation, Carlsbad, CA, USA
Page 20
Results
15
2.3 Buffers, media and solutions
2.3.1 General solutions
DEPC treated water
Diethylpyrocarbonate (DEPC) (conc.) 0.1% (v/v)
H2Obidist ad 1000 ml
stirred overnight (o.n.) under a fume hood followed by autoclaving
2.3.2 General solutions for ultracentrifugation
Caesium chloride (CsCl) solution (7.163 M)
CsCl 603.0 g
H2ODEPC 500 ml
0.1 M NaOH solution
NaOH 4 g
H2ODEPC 1000 ml
PEG – 6000 30% / 1.6 M NaCl solution
Polyethylene glycol 6000 150 g
NaCl 46.8 g
H2ODEPC 500 ml
Gradient buffer
Tris 0.1 M
KCl 0.1 M
EDTA 1 mM
2.3.3 Buffers, solutions and standards for gel electrophoresis
Modified TAE buffer (ready solution by Millipore)
50×TAE, modified
Tris 2 M
EDTA 5 mM
Page 21
Results
16
TBE buffer
10×TBE
Tris (890 mM) 162.0 g l−1
Boric acid (890 mM) 27.5 g l−1
EDTA (20 mM) 9.3 g l−1
H2Obidist ad 1000 ml
pH 8.3–8.7
Loading buffer
Ficoll 25% (w/v)
Bromphenol blue 0.5% (w/v)
Xylencyanol 0.5% (w/v)
EDTA 50 mM
Ethidium bromide stock solution
10 mg ml−1
Ethidium bromide (EtBr) in H2Obidist
Ethidium bromide staining solution
EtBr-stock solution 1:10,000 diluted in H2Obidist
SYBR® Green I staining solution
SYBR® Green I stock solution 1:10,000 diluted in H2Obidist
DNA ladder (Kbl)
GeneRulerTM 1 kb (Fermentas, St. Leon-Rot, Germany)
2.3.4 Culture media for Escherichia coli (E. coli) strains
Luria Bertani medium (LB medium)
Tryptone 10.0 g l−1
Yeast extract 5.0 g l−1
NaCl 5.0 g l−1
H2Obidist ad 1000 ml
pH 7.0–7.5
15 g l−1
of agar were added for solid media before autoclaving
Page 22
Results
17
LB-Kan medium
Kanamycin stock solution (Kan)
Kanamycin 100 mg ml−1
dissolved in H2Obidist
Kanamycin stock solution was added to LB media after autoclaving and
due to its heat sensitivity, LB media was cooled down to approximately
50°C, prior to adding of Kan to a final concentration of 140 µg ml−1
.
LB + 7% Glycerol freezing solution
LB media
Glycerol 7% (v/v)
Before freezing E. coli strains at – 80°C for conservation, they were grown
o.n. in LB + 7% Glycerol solution at 37°C in 96 well plates and sealed with
corresponding well caps (Nunc life science, Roskilde, Denmark).
Blue/white screening medium for TOPO TA cloning
®
For blue / white screening of positively transformed cells, 40 µl of X-Gal
solution (40 mg ml−1
Fermentas GmbH, St.Leon-Rot, Germany), was
spread on LB-Kan selective media plates before plating the transformed cells.
2.3.5 Culture media for Halobacterium salinarum
Casamino acids 7.50 g
Yeast extract 10.0 g
Na3-Citrate 3.0 g
KCl 2.0 g
MgSO4 20.0 g
FeSO4 0.05 g
MnSO4 0.20 mg
NaCl 250.00 g
Fill up to 1000 ml adjust to pH 7.4, then autoclave
Page 23
Results
18
2.4 Methods
2.4.1 Quantitative analysis of nucleic acids
2.4.1.1 NanoDrop®
analysis
Quantitative analysis using the NanoDrop® ND-1000 device, was performed according
to the manufacturers manual, by pipetting 1.0–1.5 µl of the nucleic acid solution to the
measurement pedestal. Concentrations were measured with UV-Vis at λ = 260 nm.
Additionally, ratios of 260/230 nm and 280/260 nm were evaluated, to assess the purity
of the sample.
2.4.1.2 Picogreen®
analysis
Quantitative measurements of dsDNA concentrations made with the Quant-iT TM
Pi-
coGreen®
dsDNA Assay kit were done according to the manufacturer‟s protocol and
measured with the Infinite® 200 microplate reader. PicoGreen
® is a fluorescent dye in-
tercalating into dsDNA, which is excited at λ = 480 nm when bound and an emission
maximum at λ = 520 nm. A provided dsDNA standard was diluted in different quanti-
ties (ng µl-1
) of the desired range for preparing a standard curve, which was measured in
duplicates, and plotted against its fluorescence intensities. Fluorescence values of DNA
samples were detected simultaneously, and concentrations determined with the regres-
sions curve of the evaluated standard.
2.4.2 Qualitative nucleic acid analysis by agarose gel electrophoresis
2.4.2.1 Qualitative nucleic acid fragment analysis
1% (w/v) agarose gels were made by mixing agarose (1 g × 100 ml −1
) with 1×TBE
buffer and melting the solution in a microwave oven. The solution was poured into a gel
tray with combs and after polymerisation, the tray was transferred into an electrophore-
sis unit filled with 1×TBE buffer. The nucleic acid solutions (3–50 µl) were mixed in
1:2-5 ratios with loading buffer and pipetted into the wells, after removing the combs,
as well as the nucleic acid size standard. For separation of nucleic acids, a voltage of
100–130 V was applied for 30–90 min, depending on the desired resolution of frag-
ments. For detection of the fragments, the gel was put into EtBr staining solution for 30
– 60 min and visualised by putting the gel onto a UV light emitting (λ = 312 nm) tran-
silluminator. Resulting patterns were recorded and digitalised using a gel documentation
system.
Page 24
Results
19
2.4.2.2 Qualitative nucleic acid fragment analysis followed by gel purification
1% (w/v) agarose gels were made as described above (2.4.2.1.), with the exception of
using 1×modified TAE buffer for the gel as well as for filling the gel electrophoresis
unit. Voltage used was the same as above with a running time of 90 min for adequate
fragment separation. To detect the fragments the gel was put in SYBR®
Green I staining
solution for 45 min and visualised with a transilluminator. The desired fragments were
cut out by a scalpel and nucleic acids were extracted using the QIAquick® gel extraction
kit according to the manufacturers protocol, except that the final elution step was done
in 30 µl H2ODEPC.
2.4.3 Amplification of specific nucleic acid fragments by PCR
For further analysis, specific DNA regions were amplified via polymerase chain reac-
tion (PCR). This three-step reaction was carried out using Taq polymerase. This enzyme
also attaches 3‟–dATP overhangs to amplified fragments, which facilitate further clon-
ing using the TOPO TA cloning®
kit. All used primers in this study were obtained from
Thermo Fisher Scientific Inc., Waltham MA, USA
2.4.3.1 Amplification of 16S rRNA
Reaction mix (25 µl) for one PCR
dNTP - Mix (2 mM/dNTP) 2.5 µl
Ex-Taq Polymerase Buffer (10 x) 2.5 µl
MgCl2 (25 mM) 2.0 µl
Forward primers (50 pmol µl-1
) 0.5 µl
Reverse primers (50 pmol µl-1
) 0.5 µl
Taq Polymerase (5 units µl-1
) 0.1 µl
Template 1.0-2.0 µl
H2Obidist ad 25 µl
All reagents except H2Obidist and primers were obtained from Fermentas GmbH,
St.Leon-Rot, Germany. When performing multiple reactions, all reagents except tem-
plates were mixed together, followed by pipetting 24 µl of the mixture in each 0.2 ml
PCR tubes. Negative control PCR were run with H2Obidist as template. 16S rRNA genes
of bacteria and archaea were amplified with primers shown in Tab. 6. Conditions for the
Page 25
Results
20
PCR reaction are shown in Tab.7 and Tab.8. Analysis of amplicons was performed by
agarose gel electrophoresis as described in 2.4.2.
Table 6: Primers used for 16S rRNA gene fragment amplification.
Primer Sequence (5' - 3') T (°C)
Reference
616Va
AGA GTT TGA TYM TGG CTC 54 (Edwards et al. 1989)
907Rb
CCG TCA ATT CMT TTG AGT TT 54 (Muyzer et al. 1995)
Ar109fa
ACK GCT CAG TAA CAC GT 55 (Grosskopf et al. 1998)
Ar912rtb GTG CTC CCC CGC CAA TTC
CTT TA 55 (Lueders and Friedrich 2002)
a forward primers (616V: universal bacterial primer; Ar109f: universal archaeal primer)
b reverse primers (907R: universal bacterial primer; Ar912rt: universal archaeal primer)
Table 7: Conditions for bacterial 16S rRNA gene fragment amplification
PCR step T (°C) Time Number of cycles
Initial denaturation 94 2 min. 1
Denaturation 94 30 sec
23/30 Annealing 54 30 sec
Elongation 72 1 min
Final elongation 72 10 min 1
Table 8: Conditions for archaeal 16S rRNA gene fragment amplification
PCR step T (°C) Time Number of cycles
Initial denaturation 94 2 min. 1
Denaturation 94 30 sec
23 Annealing 54 30 sec
Elongation 72 1 min 30 sec
Final elongation 72 10 min 1
Page 26
Results
21
2.4.3.2 M13 screening PCR
After cloning (section 2.4.7) of sequence fragments (16S rRNA, dsrAB), E. coli colo-
nies, potentially harbouring plasmids with the desired sequences, were screened via
M13 PCR, following the TOPO TA(XL) Cloning® kits (Invitrogen Corporation, Carls-
bad, CA, USA) protocol. Reactions were prepared as described in 2.4.3.1, with the
modification of using the double volume of each component of the reaction mix (50 µl).
The plasmid templates needed for M13 screening were obtained using two different
protocols.
Direct colony PCR (DCPCR) (Zon et al. 1989)
After overnight incubation at 37°C of transformed E.coli cultures, single colonies were
picked using sterile toothpicks and directly resuspended in 49 µl PCR reaction mix,
followed by PCR using an extended first denaturation step of 5 min., to promote lysis of
E. coli cells.
Fast plasmid preparation by boiling
E. coli colonies, obtained as described above, were re-suspended in 50 µl of H2Obidist
and then boiled at 100° C for 10 min. After keeping the reaction on ice for 30 sec, it was
centrifuged for 1 min at 4°C at maximum speed, to separate soluble DNA from cell de-
bris. 1 µl of supernatant was used for M13 PCR under described conditions.
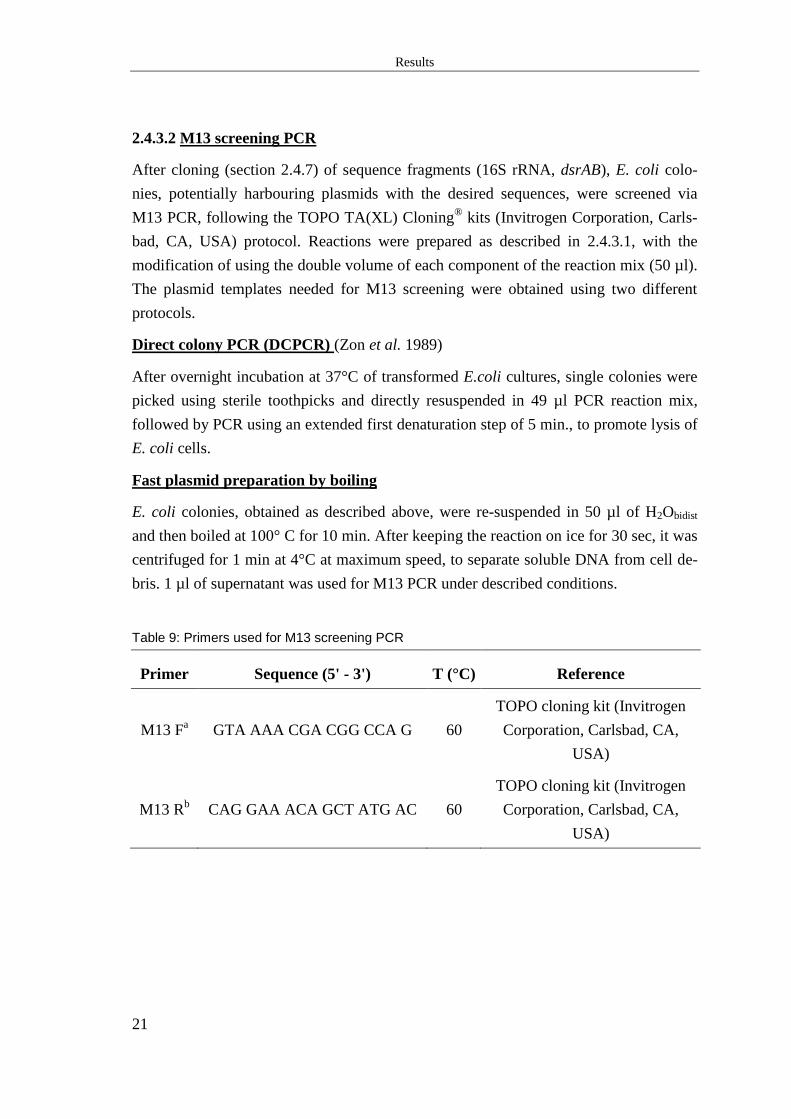
Table 9: Primers used for M13 screening PCR
Primer Sequence (5' - 3') T (°C) Reference
M13 Fa
GTA AAA CGA CGG CCA G 60
TOPO cloning kit (Invitrogen
Corporation, Carlsbad, CA,
USA)
M13 Rb
CAG GAA ACA GCT ATG AC 60
TOPO cloning kit (Invitrogen
Corporation, Carlsbad, CA,
USA)
Page 27
Results
22
Table 10: Conditions for M13 screening PCR
PCR step T (°C) Time
Number of
cycles
Initial denaturation 95 4-10 min 1
Denaturation 95 30 sec
30 Annealing 60 30 sec
Elongation 72 1min 15sec (16S rRNA)
1min 45sec (dsrAB)
Final elongation 72 10 min 1
2.4.3.3 Touchdown hot-start PCR amplification of dsrAB
Two genes coding for subunit A and B of dissimilatory (bi-)sulphite reductase (dsrAB)
were amplified by touchdown hot-start PCR (Don et al. 1991). Touchdown hot-start
PCR decreases amplification of unspecific sequences by using higher annealing tem-
peratures in the first cycles of PCR followed by a decrease of temperature in the follow-
ing cycles. A higher temperature at the beginning focuses binding of primers to per-
fectly matching target sequences. In subsequent rounds of amplification, the desired
amplicon outnumbers unspecific products due to the exponential nature of PCR amplifi-
cation. To further, increase the specificity the enzyme was added after heating up the
prepared reaction mixtures to 95°C for the first denaturation step. Reaction conditions
for touchdown Hot Start PCR are shown in Table 13.
A mixture of several forward and reverse primers was used to cover most known dsrAB
sequences (Tab. 11, 12). Reaction mixtures were prepared the same as described in
2.4.3.1 with the modification of using 50 µl of the reaction mix and 0.3 µl of Taq Poly-
merase. Quality analysis was done as described in 2.4.2.2 by agarose gel electrophoresis
followed by gel extraction of desired fragments via gel extraction.
Page 28
Results
23
Table 11: Dsr1F forward primer mixture solution for use in dsrAB PCR amplification
Primer
conc.
(pmol/µl) Sequence (5' - 3') Reference
DSR1F 10 ACS CAC TGG AAG CAC G (Wagner et al. 1998)
DSR1Fa 10 ACC CAY TGG AAA CAC G (Loy et al. 2004)
DSR1Fb 10 GGC CAC TGG AAG CAC G (Loy et al. 2004)
DSR1Fc 10 ACC CAT TGG AAA CAT G (Zverlov et al. 2005)
DSR1Fd 10 ACT CAC TGG AAG CAC G (Zverlov et al. 2005)
DSR1Fe 10 GTT CAC TGG AAA CAC G (Loy, unpublished)
DSR1Ff 10 AGC CAC TGG AAA CAC G (Loy, unpublished)
DSR1Fg 10 GGC CAC TGG AAA CAT G (Loy, unpublished)
DSR1Fh 10 GGC TAT TGG AAG CAC G (Loy, unpublished)
Table 12: Dsr4R reverse primer mixture solution for use in dsrAB PCR amplification
Primer
conc.
(pmol/µl) Sequence (5' - 3') Reference
DSR4R 10 GTG TAG CAG TTA CCG CA (Wagner et al. 1998)
DSR4Ra 10 GTG TAA CAG TTT CCA CA (Loy et al. 2004)
DSR4Rb 10 GTG TAA CAG TTA CCG CA (Loy et al. 2004)
DSR4Rc 10 GTG TAG CAG TTK CCG CA (Loy et al. 2004)
DSR4Rd 10 GTG TAG CAG TTA CCA CA (Zverlov et al. 2005)
DSR4Re 10 GTG TAA CAG TTA CCA CA (Zverlov et al. 2005)
DSR4Rf 10 GTA TAG CAR TTG CCG CA (Loy, unpublished)
DSR4Rg 10 GTG AAG CAG TTG CCG CA (Loy, unpublished)
Page 29
Results
24
Table 13: Conditions for dsrAB PCR amplification
PCR step T (°C) Time Number of cycles
Initial denaturation 95 3 min 1
Denaturation 95 30 sec
1 per °C Annealing 58−48 30 sec
Elongation 72 1 min 30 sec
Denaturation 95 30 sec
25 Annealing 48 30 sec
Elongation 72 1 min 30 sec
Final elongation 72 10 min 1
2.4.3.4 Amplification of 16S rRNA fragments by RT-PCR
The One Tube Access RT-PCR System Kit (Promega Corporation, Madison WI, USA)
was used for reverse transcription (RT) of 16s rRNA. RT is done by a RNA dependent
DNA-polymerase, which is synthesising single stranded (ss) DNA out of ssRNA mole-
cules. The resulting complementary DNA (cDNA) then serves as a template for further
amplification using standard PCR in the same reaction tube.
Reaction mix (25 µl) for one RT-PCR
dNTP - Mix (10 mM/dNTP) 0.5 µl
AMV/Tfl 5X Reaction Buffer 5.0 µl
MgCl2 (25 mM) 1.0 µl
Forward primers (50 pmol µl−1
) 0.5 µl
Reverse primers (50 pmol µl−1
) 0.5 µl
AMV Reverse Transcriptase (5u μl−1
) 0.5 µl
Tfl DNA Polymerase (5u μl−1
) 0.5 µl
Template 2.0 µl
Nuclease free water ad 25 µl
All solutions except templates and primers were provided with the manufacturer‟s kit.
Multiple reactions were prepared as described in section 2.4.3.1 and the primers de-
Page 30
Results
25
scribed in Table 6 were used. The reaction conditions are shown in Table 7 and 8 with
an extra reverse transcription step prior to PCR of 45 minutes at 45°C. Following quali-
tative analysis was done by agarose gel electrophoresis. To check for possible DNA
contaminations of templates and reagents, two negative controls were included each
time, one without template and one without AMV Reverse transcriptase.
2.4.4 Isopycnic centrifugation of nucleic acids
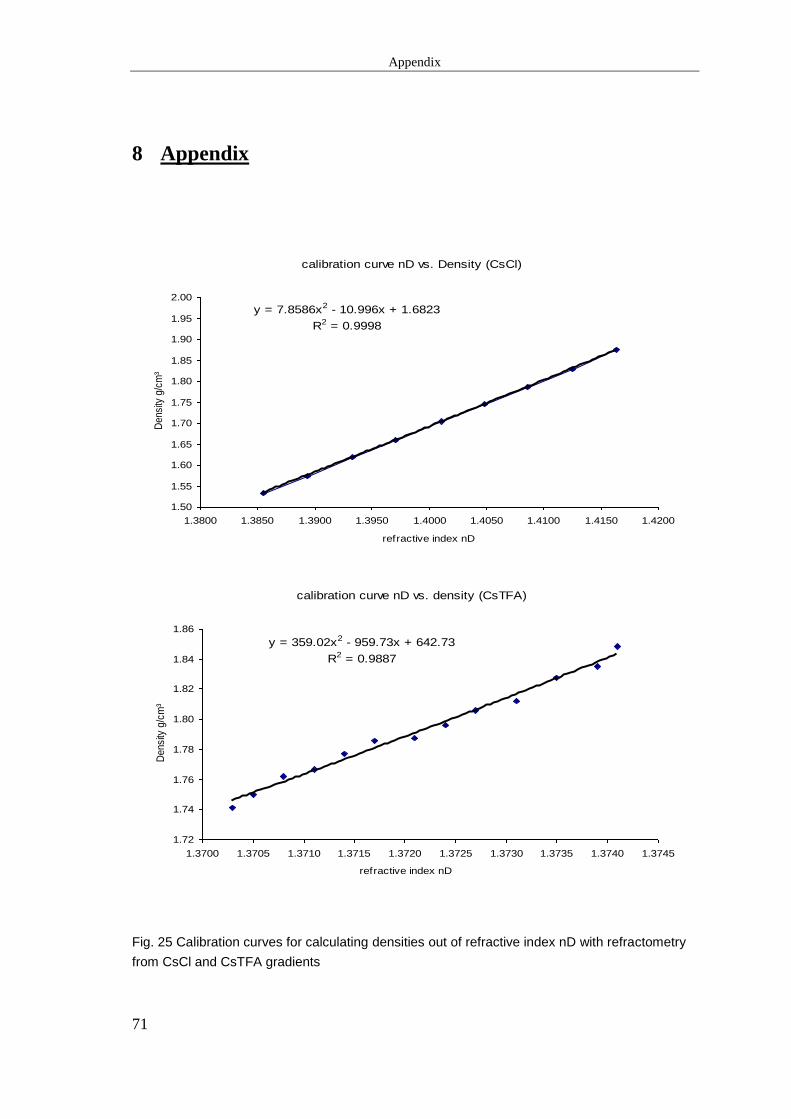
2.4.4.1 Refractrometric density measurements
For density measurements of corresponding CsCl/CsTFA solutions, refractive indices
(nD) of 50 µl aliquots were measured using a digital refractometer (A.KRÜSS Optronic
GmbH, Hamburg, Germany). To determine densities out of nD values a calibration
curve was set up by weighing 100 µl aliquots of fractions and measuring corresponding
nD values. Results are shown in the appendix section. All refractometric measurements
were performed at 23°C, weighing at 27°C.
2.4.4.2 Isopycnic centrifugation of DNA (Neufeld et al. 2007b)
To screen differentially isotopically labelled DNA from the conducted SIP experiments,
CsCl based isopycnic centrifugation was performed. CsCl solutions needed for adequate
separation of DNA and stock solutions were prepared as described in section 2.3.2 re-
sulting in a final density of ~ 1.890 g ml−1
. For setting up the gradient, the samples were
mixed together with gradient buffer (GB) and CsCl solution according to the following
formula:
GB/DNA volume (ml) = {CsCl stock density (g ml −1
) – desired final density (g ml −1
)}
*volume of CsCl stock added (ml)* 1.52
In this experiment, 4.9 ml centrifuge tubes were used and for each tube a gradient me-
dium with a final density of 1.725 g ml−1
was prepared. As suggested by Neufeld et.al
(2007), gradient medium was prepared in excess (6.0 ml) and the desired DNA/GB vol-
ume was 1.2 ml. The amount of DNA added to GB varied due to a maximum of 5 µg
DNA that can be loaded onto each gradient at a time and different DNA concentrations
of examined SIP DNA samples. After mixing the components in a 15 ml tube, the cal-
culated final density of the medium was confirmed empirically with refractometric
measurement. Centrifuge tubes were filled completely with the mixture, and corre-
sponding pairs were balanced to ± 1 mg prior of placing them in the Vti 90 rotor. Cen-
trifuging was performed with 177,000 × g for about 70 h. For gradient fractionation, the
tube was carefully pierced at the bottom and at the top with a sterile needle. For gradient
fractionation, H2ODEPC was pumped in with a flow rate of 750 µl min−1
and drops at the
bottom were collected for 20 sec each fraction. Prior to gradient fractionation the pump-
Page 31
Results
26
ing tube was cleaned once with 0.1 M NaOH and twice with 70 % EtOH and subse-
quently flushed with H2ODEPC to clean residual EtOH. For setting up a density gradient
curve, 50 µl of each fraction were measured by refractometry as explained in section
2.4.4.1.
2.4.4.3 Isopycnic centrifugation of RNA (Whiteley et al. 2007)
For centrifugation of SIP-RNA samples, the following CsTFA gradient medium with a
final density of 1.8 g ml−1
was prepared:
CsTFA stock solution (2 g ml−1
) 4.8025 ml
H2ODEPC 954.3 µl
Di Formamide 204.6 µl
RNA (max 500 ng) ad 6 ml
The following procedures for centrifuging and fractionation were the same as described
in section 2.4.4.2 except that centrifugation was performed at 128,000 × g.
2.4.5 Nucleic acid precipitation
After centrifugation and fractionation of isopycnic gradients, nucleic acids were re-
extracted for further analysis, using the following protocols.
2.4.5.1 DNA precipitation out of CsCl gradient medium after Neufeld (2007)
Each DNA fraction was amended with two volumes of PEG 6000 solution and 1 µl of
glycogen (20 µg/µl) and incubated at 4°C for 2 h–10 h. After precipitation, DNA was
pelleted by centrifugation (4°C at 13000 × g for 30 min) and supernatant was discarded.
The DNA was subsequently washed with 500 µl ice cold 70% ethanol and centrifuged
(4°C at 13000 × g for 10 min). After removal of ethanol the DNA pellet was air dried
for 15 min and resuspended in 20 µl H2ODEPC.
2.4.5.2 RNA precipitation out of CsTFA gradient medium after Whiteley (2007)
Each RNA fraction was amended with two volumes of ice cold isopropanol (2-
Propanol) and 1 µl of glycogen (20 µg/µl) followed by centrifugation (4°C at 13000 × g
for 30 min). The supernatant was discarded and the resulting RNA pellet was washed
with 500 µl ice cold 70% ethanol and centrifuged again (4°C at 13000 × g for 10 min).
Ethanol was removed, the resulting RNA pellet was air dried for 15 min and resus-
pended in 20 µl H2ODEPC.
Page 32
Results
27
2.4.6 Terminal restriction fragment length polymorphism (T-RFLP) analysis
For analysis of the microbial communities in the SIP incubations, T-RFLP analysis was
performed (Liu et al. 1997). T-RFLP is a rapid analysis method for assessing composi-
tions of microbial communities and is based on length differences in terminal 16S
rRNA restriction fragments. Nucleic acid samples were PCR amplified using fluores-
cently labelled primers, followed by endonuclease digestion.
Prior to experimental T-RFLP analysis of 16S rRNA amplicons, in silico analysis using
TRF-CUT (Ricke et al. 2005), a tool implemented in the ARB software package
(Ludwig et al. 2004), was performed to identify the optimal restriction enzymes. PCR
amplification was performed as described in section 2.4.3.1. Used primers and condi-
tions were the same, except that the 616V and Ar912rt primers were labelled with 6-
FAM, a fluorescent dye. Prior to restriction digestion, PCR products were purified using
the QIAquick PCR purification kit (QIAgen, Hilden, Germany). Qualitative and quanti-
tative analysis of purified PCR products was performed with agarose gel electrophoresis
and NanoDrop photometry respectively. For enzyme restriction, 40 ng (single se-
quences) or 100 ng (SIP fractions) were digested for 3 h with the appropriate restriction
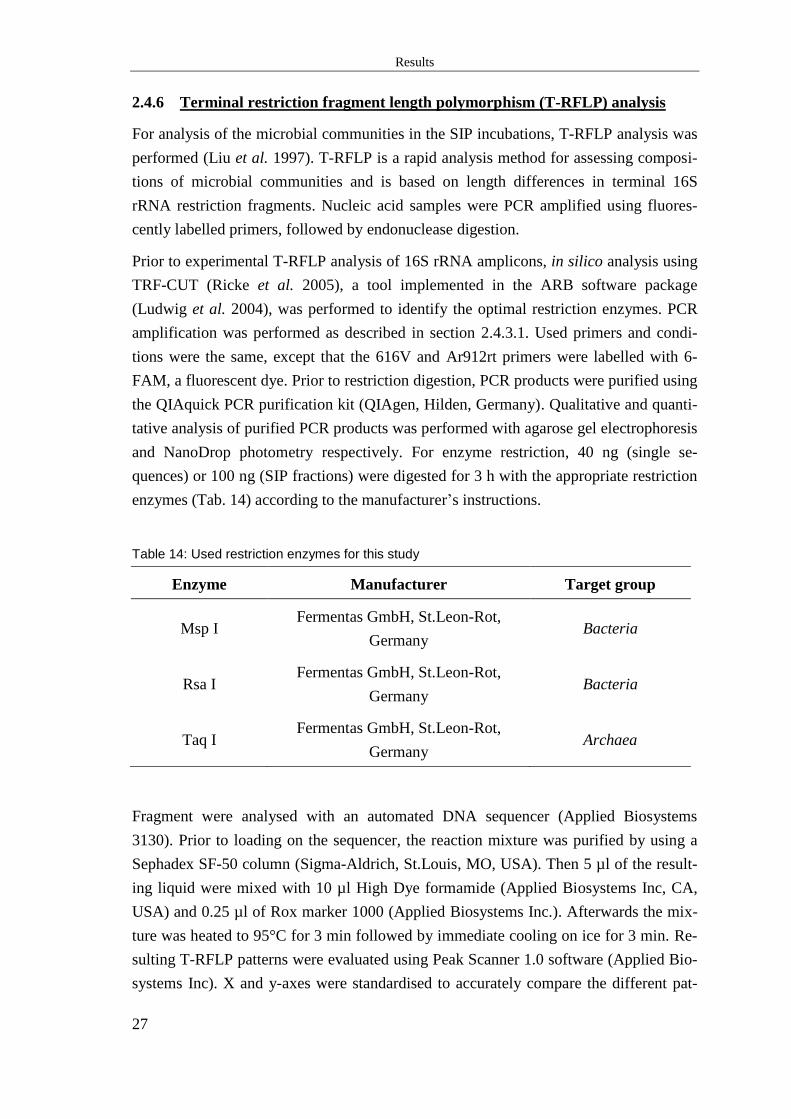
enzymes (Tab. 14) according to the manufacturer‟s instructions.
Table 14: Used restriction enzymes for this study
Enzyme Manufacturer Target group
Msp I Fermentas GmbH, St.Leon-Rot,
Germany Bacteria
Rsa I Fermentas GmbH, St.Leon-Rot,
Germany Bacteria
Taq I Fermentas GmbH, St.Leon-Rot,
Germany Archaea
Fragment were analysed with an automated DNA sequencer (Applied Biosystems
3130). Prior to loading on the sequencer, the reaction mixture was purified by using a
Sephadex SF-50 column (Sigma-Aldrich, St.Louis, MO, USA). Then 5 µl of the result-
ing liquid were mixed with 10 µl High Dye formamide (Applied Biosystems Inc, CA,
USA) and 0.25 µl of Rox marker 1000 (Applied Biosystems Inc.). Afterwards the mix-
ture was heated to 95°C for 3 min followed by immediate cooling on ice for 3 min. Re-
sulting T-RFLP patterns were evaluated using Peak Scanner 1.0 software (Applied Bio-
systems Inc). X and y-axes were standardised to accurately compare the different pat-
Page 33
Results
28
terns of the fractions. The x-axis showing base pairs, was scaled ranging from right after
the primer peak, (20 bp for 616V, 23 bp for Ar912rt) to 1000 bp and the y axis was
scaled to the top according to the highest peak.
2.4.7 Cloning of PCR products
2.4.7.1 Cloning of 16S rRNA PCR products
For cloning of amplified 16S rRNA gene sequences, the TOPO TA Cloning® kit (Invi-
trogen Corporation, Carlsbad, CA, USA) was used. Ligation of fragments is catalysed
by a topoisomerase, which connects the 16S rRNA fragments with the linearised vector.
The kanr and lacZα harbouring vector plasmid was then transformed into E. coli TOP
10 cells.
Fresh PCR products (2.4.6) were prepared with the following reagents according to the
following scheme:
PCR-product 2.0-4.0 μl
Salt solution 1.0 μl
Vector (pCR®II) 1.0 μl
H2Obidist ad 6 µl
The reaction was incubated at room temperature (RT) for 20 min before transformation.
For transformation, chemically competent E.coli TOP 10 cells were thawed on ice and
2 µl of the ligation reaction mixture were pipetted into the reaction tube containing the
cells. After additional 30 min on ice, the E. coli cells were immediately transferred into
a 42°C hot water bath and incubated for 30 sec. Following heat shock the cells were
amended with 250 µl SOC medium incubated at 37°C and shaken horizontally at 200
rpm.
Meanwhile kanamycin containing LB-agar plates were pre-heated in the 37°C room and
40 µl of X-Gal solution (40 mg ml−1
) were distributed on the plate prior of spreading
transformed cells. From each transformation reaction 25, 50, 75 and 100 µl were plated
out and incubated at 37°C o.n. Vector insert positive colonies were identified via M13
PCR (2.4.3.2).
2.4.7.2 Cloning of dsrAB amplicons
The TOPO XL cloning® kit (Invitrogen Corporation, Carlsbad, CA, USA) was used for
cloning of 1.9 kbp dsrAB PCR fragments. Ligation procedure was the same as decribed
in section 2.4.7.1, but different proportions of ligation reagents were used:
Page 34
Results
29
PCR-product 8 μl
Vector (pCR® XL-TOPO®) 1.5 μl
After 5 min of the ligation reaction, 1.5 µl of TOPO cloning® stop solution (6×) pro-
vided by the manufacturer was added. Transformation was performed as described in
section 2.4.7.1 using 2 µl of the ligation reaction mixture.
Transformed cells were plated out on kanamycin containing plates to select for positive
plasmid inserts (TOPO XL harbours kanr). Individual colonies were then analysed for
correct fragments via M13 PCR (2.4.3.2.).
2.4.8 DNA sequencing
Sequencing was done using the automated sequencer DNA Sequencer Applied Biosys-
tems 3130 following the manufacturer‟s instructions. For 16S rRNA sequencing either
primer TopoSeq-F or TopoSeq-R (Tab.15) having their priming site on the TOPO-TA
cloning vector was used. DsrAB was sequenced with the primer mix DSR1F or DSR4R
(Tab.11+12).
Table 15: Primers used for sequencing of 16S rRNA fragments
Primer Sequence (5' - 3') T (°C)
TOPOSeq-F AGC TTG GTA CCG AGC T 60
TOPOSeq-R GTA AAA CGA CGG CCA GT 60
Resulting partial forward and reverse sequences were proofread using FinchTV 1.4
(Geospiza, Inc) and merged with Chromas Pro 1.42 (Technelysium Pty Ltd). The output
files were exported in the FASTA format.
2.4.9 Comparative sequence analysis
For sequence analysis, the ARB software package (Ludwig et al. 2004), and its plug-ins
were used. The software package includes tools for phylogenetic calculations, sequence
alignment, probe and primer design, T-RFLP in silico analysis as well as import and
export of sequence data.
Page 35
Results
30
2.4.9.1 Sequence alignment
16S rRNA alignment
The sequenced and proofread 16S rRNA sequences (2.4.8) were merged into a multi-
FASTA file and were then imported into the SINA Web aligner (http://www.arb-
silva.de/aligner/) for automated alignment of sequences according to the latest SILVA
database release (Pruesse et al. 2007). In this procedure sequences are arranged in a way
that homologous regions are aligned for further comparative analysis, e.g. phylogenetic
analysis. The resulting ARB compatible output file was imported, the alignment proof-
read compared to the latest available database and if needed corrected manually.
DsrAB alignment
The retrieved dsrAB sequences were imported into ARB and aligned using the inte-
grated Fast Aligner. Alignment was done according to the latest dsrAB database
(Dsr_AB_dome_Cecillias_Endversion) provided by Doris Steger (Department of Mi-
crobial Ecology, University of Vienna) containing 3264 publicly available dsrAB se-
quences. The first alignment was based on the nucleic acid sequence, which was then
translated into an amino acid sequence for correct protein alignment. Automated align-
ments were inspected visually and adjusted manually.
2.4.9.2 Phylogeny
Phylogenetic trees of dsrAB were calculated using different software packages imple-
mented in ARB. Calculations were performed using several different treeing methods in
combination with different, integrated conservation filters to exclude highly variable
regions in the examined sequence alignments. In order to determine the root of the tree,
outgroup sequences were included in the tree calculations (Fig. 24).
For 16S rRNA phylogeny all found sequences were used for calculating trees with the
Neighbour-Joining (Saitou and Nei 1987) algorithm to get a quick overview of the phy-
logeny based on the 96_SILVA dataset (www.arb-silva.de). Following that, operational
taxonomic units (OTUs) were calculated using DOTUR (Schloss and Handelsman
2005). To reduce computing time, only one sequence of each OTU was used for later
calculations, as well as their closest relative according to BLAST (Altschul et al. 1990)
and close relatives out of the first neighbour joining tree. Different trees using
neighbour-joining (Saitou and Nei 1987), maximum parsimony (Felsenstein 1995) and
maximum likelihood (Stamatakis et al. 2002) algorithms were calculated and a consen-
sus tree was constructed manually out of these data.
The phylogeny of dsrAB clone sequences was calculated based on previously released
sequences from the studies of Loy (Loy et al. 2004) and Zverlov (Zverlov et al. 2005)
Page 36
Results
31
as references. Phylogenetic trees based on deduced amino acid sequences were com-
puted using the FITCH algorithm included in the ARB implemented PHYLIP (Felsen-
stein 1995) software. Additionally the indel filter and KIMURA (Kimura 1980) correc-
tion were applied.
2.4.9.3 Test for chimeric sequences
Due to the possibility of regarding chimeric sequences as new species when calculating
phylogenetic trees, all sequences where checked in ARB. Therefore, NJ trees out of the
obtained forward and reverse sequences were calculated independently. If the forward
and reverse sequences of the same clone were placed to different taxons, they were re-
garded as of chimeric origin and not used for further phylogenetic analysis.
2.4.9.4 Rarefaction
Despite calculating different OTUs, rarefaction curves of 16S rRNA and dsrAB librar-
ies, were calculated as well using DOTUR (Schloss and Handelsman 2005).
2.4.9.5 Statistical comparison of different habitats
UNIFRAC
To reliably compare community composition of the investigated environments, UNI-
FRAC a web-based online tool, was used. This tool employs several multivariate statis-
tic tools, using sequence data, to determine the significance of difference between mul-
tiple environments. Additionally the lineages contributing to this difference can be iden-
tified (Lozupone et al. 2006).
COVERAGE
Coverage calculations estimate to what extent the hypothetical genpool of a sample is
covered by the sequences obtained. Following formula is used (Good 1953):
Ccoverage = [1 − (n1/N)] * 100%
n1 = number of OTUs represented by a single sequence
N = number of all sequences in the gene library
Page 37
Results
32
3 Results
3.1 Gradient centrifugation of nucleic acids
Soil DNA and RNA extractions, from each time point (2 weeks, 2 months, 6 months) of
the SIP incubations (± sulphate), were centrifuged and re-extracted according to the
protocols described in section 2.4.4 and 2.4.5. To determine separation efficiency based
on GC content and 13
C labelling, different mixtures of 12
C and fully labelled 13
C-nucleic
acids of E. coli and 12
C-nucleic acids of Halobacterium salinarum were centrifuged
(Fig.7+8). DNA and RNA concentrations were measured by Picogreen® and Ri-
bogreen® assays respectively, and densities were calculated out of calibration curves
that were established prior to the experiment (Appendix 5.1).
Fig.7 CsCl density gradients of different mixtures of E. coli 12
C- and 13
C- and H. salinarum 12
C-
DNA. Respective densities of peak maxima are indicated in g cm−3
.
12C labelled DNA from E. coli with a GC content of 51 mol% (Blattner et al. 1997)
peaked at 1.707 g cm-3
. 12
C H. salinarum DNA with a GC content of 68 mol% (Ng et
al. 2000) peaked at 1.716 in the mixture with E. coli DNA and at 1.718 g cm-3
when
centrifuged alone. These values matched recently determined density values of 12
C
Page 38
Results
33
E. coli (1.710 g cm-3
) and 12
C M. extorquens (GC% 66; 1.719 g cm-3
) DNA (Lueders et
al. 2004a). In contrast, density values of 13
C E. coli DNA peaked at 1.730 and
1.732 g cm-3
showing great difference to a calculated value of 1.750 g cm-3
for 100% 13
C-labelled E. coli DNA (Buckley et al. 2007). This lower density indicates that the
used 13
C labelled E. coli DNA was not fully labelled. Nevertheless, separation of 12
C-
labelled E. coli DNA, 12
C-labelled H. salinarum DNA and partially labelled E. coli 13
C-DNA was successful.
Fig.8 CsTFA density gradients of different mixtures of E. coli 12
C and 13
C and H. salinarum 12
C
RNA. Respective densities of peak maxima are indicated in g cm−3
For RNA, GC content shows no effect regarding buoyant density, making 13
C content
the decisive component for separation (Lueders et al. 2004a). 12
C labelled E. coli RNA
peaks at 1.786 g cm−3
resembling the published value (1.785 g cm-3
) (Lueders et al.
2004a). H. salinarum peaks at 1.776 g cm−3
and fully 13
C labelled E. coli RNA peaks at
1.809 and 1.820 g cm−3
. The lower buoyant density for the centrifugation with 13
C
E.coli RNA only is presumably due to a loss of RNA while reextracting it from the
CsTFA fractions. This is indicated by an up and down of measured RNA concentrations
of the gradient after the peak maxima (Fig.8). After extrapolation of the curve, the esti-
mated peak maxima would be at 1.814 g cm-3
. This resembles the value for fully 13
C
labelled RNA of M. extorquens at 1.815 g cm-3
(Lueders et al. 2004a). As for DNA,
separation worked with the setup used, but unlike for DNA no great differences to lit-
erature values of buoyant density of fully 13
C labelled E.coli RNA was observed.
Page 39
Results
34
3.2 T-RFLP analysis of density resolved nucleic acids
T-RFLP analysis of the incubations was performed to examine differences in the micro-
bial community composition due to treatment with and without sulphate. In addition to
changes over time, differences between the active (13
C-labelled) and dormant (12
C-
labelled) microbial population were monitored. Prior to T-RFLP analysis of the incu-
bated samples, the reliability of the method was assessed. Clones p7k23f, p4k1f and
p2k9f harbouring 16S rRNA sequences from earlier studies of the Schlöppnerbrunnen
fen (Wentrup 2007) were amplified using fluorescently labelled bacterial primers
(2.4.3.1). Forty nanogram of PCR product was digested with endonuclease MspI and T-
RFLP profiles were analysed. No undigested fragments or fragments of the wrong size
could be detected in any of the profiles making the method applicable for analysis of the
incubated samples (Fig.27- appendix section).
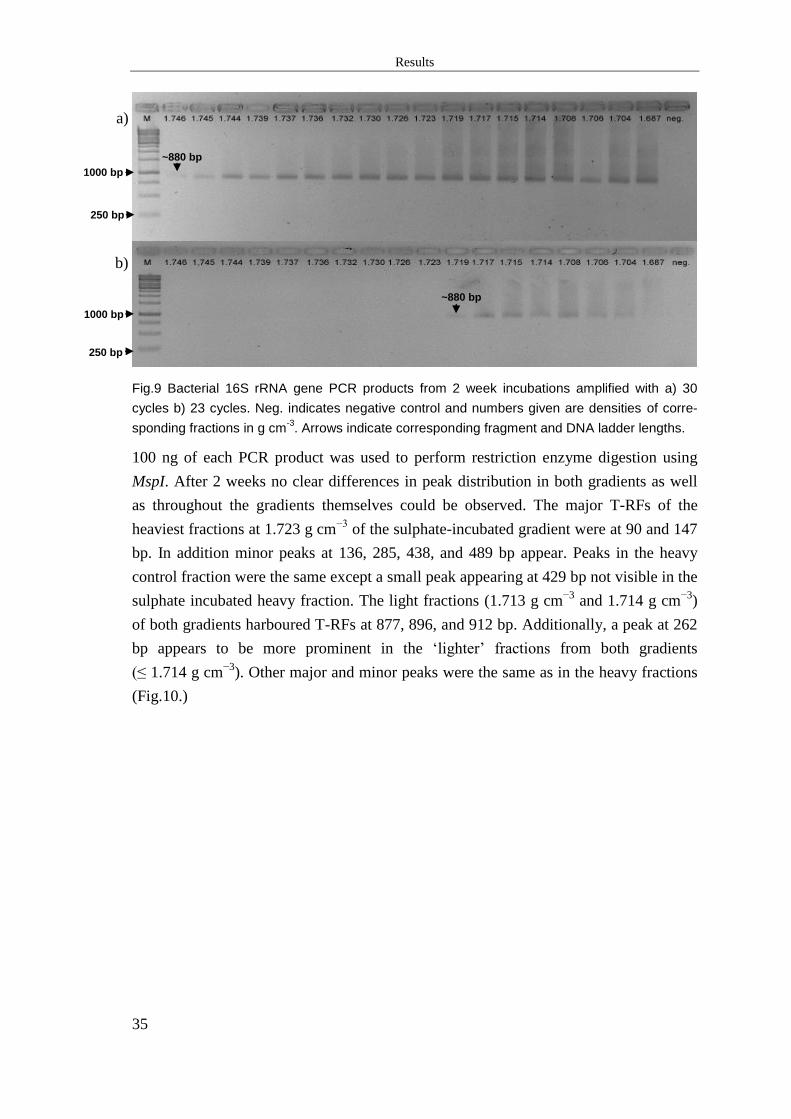
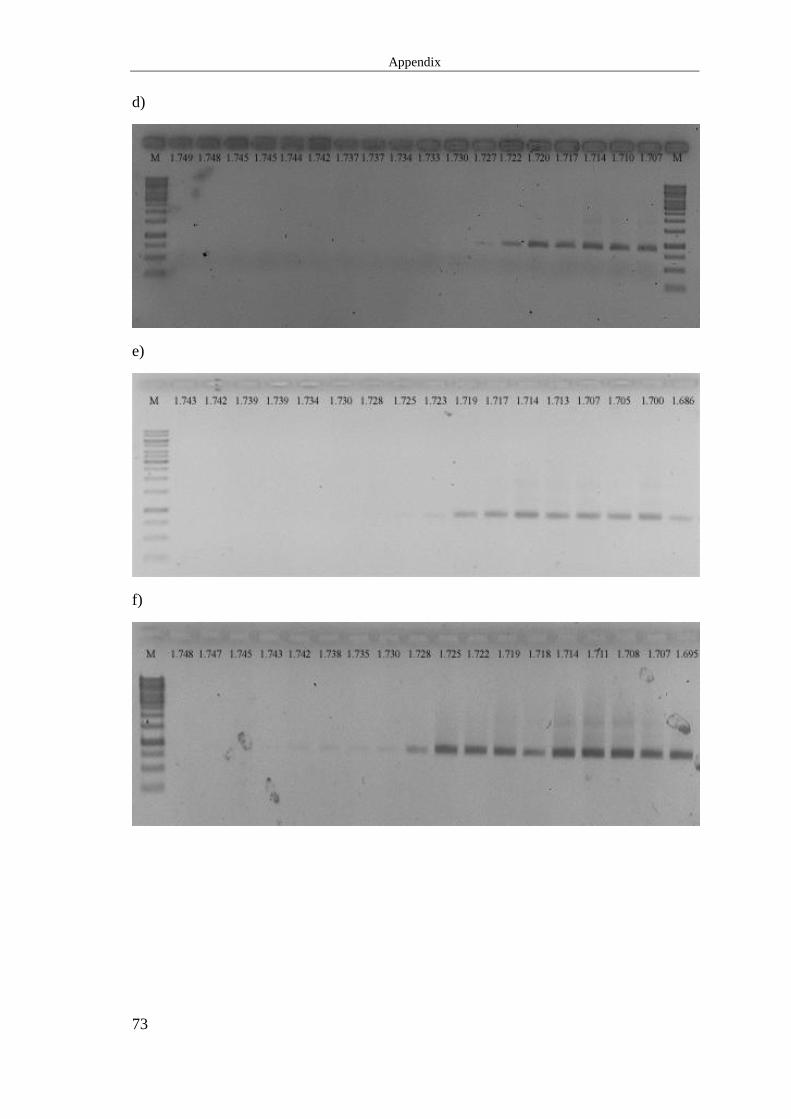
3.2.1 Bacterial T-RFLP analysis of DNA-SIP incubations
DNA templates of all fractions were amplified using the fluorescently labelled bacterial
primer pair, resulting in a fragment of approximately 880 bp length. Starting with the 2
weeks incubation, differences in yield of PCR reactions were evaluated performing am-
plifications with 23 and 30 cycles (Fig. 9). When performing 30 cycles of PCR, prod-
ucts can be visualised even at fraction densities of 1.746 g cm-3
. Although fully 13
C-
labelled DNA of M. extorquens (GC% 66) has a buoyant density of 1.757 g cm-3
, not
captured by our gradient, it is unlikely that after two weeks of incubation any of the
species found in the fen sample are 13
C-labelled largely due to the relatively low amount
of substrates applied. This leads to the assumption that PCR products found at 1.746 g
cm-3
are caused by applying too many PCR cycles. Choosing too many cycles could
possibly lead to an over amplification of certain 16S rRNA fragments due to PCR satu-
ration effects, resulting in a misinterpretation of the bacterial community composition
(Sipos et al. 2007). Therefore, 23 cycles instead of 30 PCR cycles were used for the
following gradients.
Page 40
Results
35
1000 bp
Fig.9 Bacterial 16S rRNA gene PCR products from 2 week incubations amplified with a) 30
cycles b) 23 cycles. Neg. indicates negative control and numbers given are densities of corre-
sponding fractions in g cm-3
. Arrows indicate corresponding fragment and DNA ladder lengths.
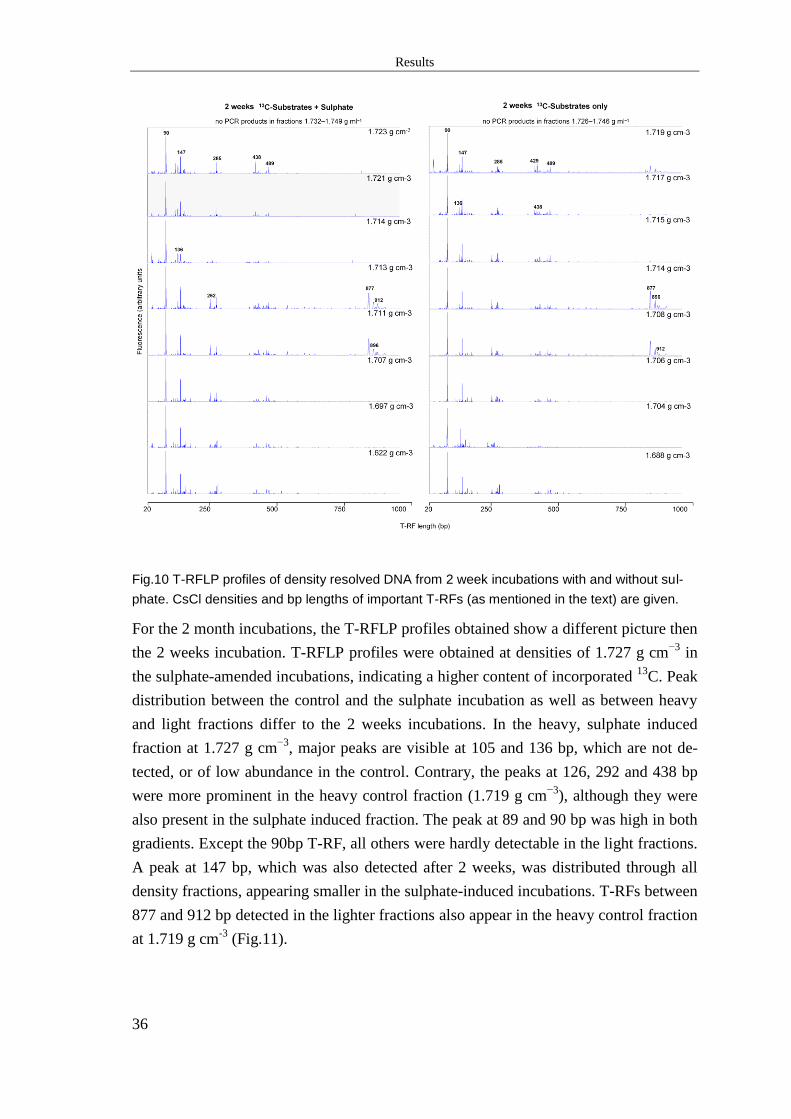
100 ng of each PCR product was used to perform restriction enzyme digestion using
MspI. After 2 weeks no clear differences in peak distribution in both gradients as well
as throughout the gradients themselves could be observed. The major T-RFs of the
heaviest fractions at 1.723 g cm−3
of the sulphate-incubated gradient were at 90 and 147
bp. In addition minor peaks at 136, 285, 438, and 489 bp appear. Peaks in the heavy
control fraction were the same except a small peak appearing at 429 bp not visible in the
sulphate incubated heavy fraction. The light fractions (1.713 g cm−3
and 1.714 g cm−3
)
of both gradients harboured T-RFs at 877, 896, and 912 bp. Additionally, a peak at 262
bp appears to be more prominent in the „lighter‟ fractions from both gradients
(≤ 1.714 g cm−3
). Other major and minor peaks were the same as in the heavy fractions
(Fig.10.)
250 bp
250 bp
1000 bp
~880 bp
~880 bp
a)
b)
Page 41
Results
36
Fig.10 T-RFLP profiles of density resolved DNA from 2 week incubations with and without sul-
phate. CsCl densities and bp lengths of important T-RFs (as mentioned in the text) are given.
For the 2 month incubations, the T-RFLP profiles obtained show a different picture then
the 2 weeks incubation. T-RFLP profiles were obtained at densities of 1.727 g cm−3
in
the sulphate-amended incubations, indicating a higher content of incorporated 13
C. Peak
distribution between the control and the sulphate incubation as well as between heavy
and light fractions differ to the 2 weeks incubations. In the heavy, sulphate induced
fraction at 1.727 g cm−3
, major peaks are visible at 105 and 136 bp, which are not de-
tected, or of low abundance in the control. Contrary, the peaks at 126, 292 and 438 bp
were more prominent in the heavy control fraction (1.719 g cm−3
), although they were
also present in the sulphate induced fraction. The peak at 89 and 90 bp was high in both
gradients. Except the 90bp T-RF, all others were hardly detectable in the light fractions.
A peak at 147 bp, which was also detected after 2 weeks, was distributed through all
density fractions, appearing smaller in the sulphate-induced incubations. T-RFs between
877 and 912 bp detected in the lighter fractions also appear in the heavy control fraction
at 1.719 g cm-3
(Fig.11).
Page 42
Results
37
Fig.11 T-RFLP profiles of density resolved DNA from 2 months incubations with and without
sulphate. CsCl and bp lengths of important T-RFs (as mentioned in the text) are given.
In the 6 months incubations, the obtained T-RF pattern changes again. T-RFLP profiles
were obtained in both gradients starting at a density of 1.728 g cm−3
. The largest peak in
the heavy, sulphate added incubation was still at 136 bp and peaks at 90, 105, 438, and
517 bp are visible, but to a relatively smaller extent. Here, T-RFs ranging from 865-945
bp, as detected in the two weeks incubations, also appeared. In the light fractions (1.719
g cm−3
and less) the 136 bp peak was smaller while peaks at 90 and 147 bp were rela-
tively high. The sulphate amended incubation fraction at 1.718 g cm−3
showed a promi-
nent peak at 489 bp, which could not be seen in this extent in other fractions of this in-
cubation. At this density, T-RFs between 878 and 945 bp were found that were detected
again at densities of 1.708 and 1.707 g cm−3
. In the heavy control incubation (1.725 g
cm−3
), major peaks were at 430 and 438 bp as well as smaller peaks at 105 bp. T-RF
fragments ranging from 865 to 917 bp could seen in all density fractions. At lower den-
sities, an additional peak at 90 bp appeared compared to T-RFs found at 1.725 g cm−3
.
At 1.721 g cm−3
the peaks at 105 and 438 bp decreased but a T-RF at 289 bp could be
seen. In the next less denser fractions, peaks at 147, 262 and 489 bp got more promi-
nent, as well as the peak at 90 bp which was relatively larger. In the following lighter
fractions, this peak was by far the largest one. Only the peaks at 147, 262 and 289 bp
remained relatively prominent throughout the rest of the light density gradients (Fig.12).
Page 43
Results
38
Fig.12 T-RFLP profiles of density resolved DNA from 6 months incubations with and without
sulphate. CsCl densities and bp lengths of important T-RFs (as mentioned in the text) are given.
Before constructing a gene library, T-RFLP profiles of the sulphate induced and control
incubation were compared to T-RFLP profiles from unincubated fen soil from a depth
of 10-20 cm (Fig.13). The major peak at 90 bp could be found in the zero control up to
densities of 1.722 g cm−3
, which might be caused by species with different GC content
represented by this T-RF. For peaks at 126, 292, and 438 bp in the 13
C only control as
well as for the peaks at 105 and 136 bp in the sulphate amended incubation 13
C labelling
clearly occurred as indicated by absence or appearance only at lighter densities in the
untreated zero control.
Page 44
Results
39
Fig.13 T-RFLP profiles of 2 months incubations compared to untreated zero control. CsCl densi-
ties and bp lengths of important T-RFs (as mentioned in the text) are given.
Furthermore, T-RFLP analysis was also performed with all DNA extracts prior to cen-
trifugation to control for consistency of dominant peaks compared to the centrifugations
(Fig.14). All dominant peaks could be found in the whole extracts as well. Peaks at 120,
147 and 443 bp, which could be found in relatively high extent in the zero control are
relatively lower or can not be detected anymore, indicating that the respective microor-
ganisms do not utilize the offered substrates under the given conditions. Interestingly,
the peak at 136 bp, which was very prominent at heavier densities in the sulphate in-
duced 2 months incubation, could also be found at low intensity in the zero control, the
2 months and the 6 months C13
incubations without sulphate. In the zero control the 136
bp peak could only be found until densities of 1.718 g cm-3
and in low abundance op-
posed to its dominant appearance at heavier densities in the 2 months sulphate induced
incubations. This indicates an important role in sulphate reduction for these species.
Page 45
Results
40
Fig.14 T-RFLP profiles of DNA whole extracts of all time points. The bp lengths of important T-
RFs (as mentioned in the text) are given.
3.2.2 Archaeal T-RFLP analysis of DNA SIP incubations
2 months incubations were also analysed for archaeal 16S rRNA sequences, using the
primers and conditions described in section 2.4.3.1, resulting in approximately 800 bp
fragments. According to the results of the previous amplification of bacterial 16S
rRNA, 23 PCR cycles were used. The highest densities where PCR products could be
obtained were at 1.721 g cm−3
and 1.719 g cm−3
(Fig.15). 100 ng of PCR products were
digested with the restriction enzyme TaqI and resulting fragments were identified by
capillary gel electrophoresis. Coinciding with weak bands visible on the agarose gel,
there was no sufficient fluorescence intensity above densities of 1.717 g cm−3
. This in-
dicates less 13
C labelling of the archaeal community compared to the bacterial commu-
nity after 2 months. The resulting T-RFLP profiles of all densities showed only few
peaks with no differences between the sulphate induced and control-incubation, as well
as throughout the gradients. A major peak at 184 bp and a smaller peak at 216 bp were
present in every fraction. In both of the „light‟ fractions at 1.707 g cm−3
and below, ad-
ditional peaks at 390, 740 bp, 852bp (+sulphate) and 861bp (-sulphate) appeared. Only
in the heaviest fractions of the control incubation, two additional T-RFs at 28 and 40 bp
are visible (Fig.16).
Page 46
Results
41
Fig.15 Archaeal 16S rRNA PCR products from 2 months incubations a) with b) and without sul-
phate added. Pos. indicates positive controls and numbers given are densities in g cm−³. Arrows
indicate corresponding fragment and DNA ladder lengths. Negative control is not shown.
Fig.16 Archaeal T-RFLP profiles of density resolved DNA from 2 months incubations with and
without sulphate. CsCl densities in g cm-3
are numbers in brackets. The bp lengths of important
T-RFs (as mentioned in the text) are given.
1000 bp
1000 bp
250 bp
250 bp
~800bp
~800bp
a)
b)
Page 47
Results
42
3.2.3 Bacterial T-RFLP analysis of RNA-SIP incubations
Samples incubated for two weeks were additionally subjected to RNA-SIP analysis.
RT-PCR was performed using the same bacterial primers as for DNA-SIP (2.4.3.4),
resulting in approximately 880 bp fragments (Fig.17). Due to problems with the tem-
perature correction of the refractometer, no valid density values could be obtained here.
Fig.17 RT-PCR products from 2 week incubations a) with b) and without sulphate added. Pos.
indicates positive control, Neg. negative control. Arrows indicate corresponding fragment and
DNA ladder lengths.
Digestion for T-RFLP was performed as done for DNA-SIP with restriction enzyme
MspI. T-RFLP profiles could even be obtained from fraction 17 without any visible
PCR product on the agarose gel. Peak distribution and variety showed great differences
to the corresponding 2 week DNA samples analysed. Starting with the heaviest fraction
of the sulphate amended incubation (8), major T-RFs are at 97 and 124 bp. In the lighter
fractions the most prominent peaks are at 130, 198, and 236 bp. In the lightest fractions,
1000 bp
250 bp
1000 bp
250 bp
880 bp
880 bp
a)
b)
Page 48
Results
43
additional peaks at 90 and 147 bp appeared and the T-RFs mentioned above get rela-
tively smaller or disappear. In the control incubation, the heaviest fraction (17) only
showed major peaks at 97 and 130 bp. At the following fraction peaks at 90, 145, and
198 bp appeared, while others get smaller. At lighter densities starting with fraction 19,
the peaks stayed the same, except at 198 bp and 236 bp. They were hardly detectable in
fractions 19 and 20 and showed up again at fraction 21. Another peak at 323 bp could
be found in fractions 19 to 22. Additionally, all fractions harbour T-RFs, ranging from
864 to 936 bp at different extents (Fig.18).
Fig.18 Bacterial T-RFLP profiles of density resolved RNA from 2 weeks incubations with and
without sulphate. The bp lengths of important T-RFs (as mentioned in the text) are given.
3.3 Amplification, cloning and sequencing of 16S rRNA genes and
dsrAB
Having shown with T-RFLP-fingerprinting that after two months of incubation commu-
nities of active bacteria in the two setups differ from each other, the corresponding
heavier fractions at 1.720 g cm-3
(+sulphate) and 1.719 g cm-3
(-sulphate) were used for
further cloning. 16S rRNA genes and dsrAB were PCR amplified using unlabelled
primers as described in section 2.4.3.1 and 2.4.3.3 and subsequently cloned. Prior to
cloning of dsrAB amplicons, fragments of the appropriate size (~1.9 kbp) were sepa-
rated from unspecific PCR products via agarose gel electrophoresis, cut out and ex-
tracted (Fig.19). Topo XL®
clones with a positive insert were grown on selective media
Page 49
Results
44
and were used for further analysis via M13 screening (2.4.3.2). Clones harbouring the
right insert were sequenced.
Fig.19 DsrAB PCR products from 2 months heavy fractions. Arrows indicate corresponding
fragment length of marker and cloned fragment. Pos. indicates positive control, Neg. negative
control
3.4 Sequence analysis
3.4.1 Bacterial 16S rRNA analysis
Phylogenetic analysis of proofread sequences confirmed the observed differences be-
tween the two examined fractions. Most of the clones of the sulphate amended incuba-
tion were affiliated with the genus Desulfosporosinus (20%), known gram-positive sul-
phate reducers (Stackebrandt et al. 1997). Numerous clones of Acidobacteria subgroup
1 (16%); subgroup 2 (7%); subgroup 3 (7%) and one clone of subgroup 8 were detected
as well. Members of the families Rhodospirillaceae (8%), Acidaminococcaceae (6%),
Acidimicrobiaceae (5%) and Acetobacteraceae (4%) were also among the prominent
members in the heavy DNA fraction from the sulphate-amended incubation (Fig. 20).
Furthermore, sequences of several other phyla were detected like members of the Pro-
teobacteria, Actinobacteria, Nitrospira, Spirochaetes, Planctomycetes and OP10.
The control incubation showed a different composition of 16S rRNA genes. No Desul-
fosporosinus and Acetobacteraceae related clones were detected. Members of the Aci-
dobacteria subgroup 1 (21%) represented the most abundant ones in the control and
members of the subgroups 2 (3%), subgroup 3 (6%), subgroup 6 (1%) and subgroup 13
(1%) could be identified as well. Additionally, sequences affiliated to Acidaminococca-
1500 bp
2000 bp ~1900 bp
Page 50
Results
45
ceae (13%), Rhodospirillaceae (14%), Azospirillum (10%), Acidimicrobiaceae (6%)
and Geobacter (5%) were found to a higher extent in the 13
C control without sulphate
(Fig. 20). Other clones with sequences belonging to the phyla Proteobacteria, Bacter-
oidetes, Spirochaeta, Planctomycetes, Cyanobacteria, OP10, OD1 and TG1, could be
identified as well.
Fig.20 Relative abundance of major bacterial lineages in the 16S rRNA gene clone libraries
obtained from the 2 months incubations in the presence and absence of sulphate. For details
and representing T-RFs see table 17 in the appendix section.
In addition to T-RF fragment length assignment of analysed sequences in silico, T-RF
lengths of corresponding single clones were empirically determined (Fig.28 - appendix
section). They were PCR amplified and 40 ng of product was digested with MspI. Dif-
ferences of empirically determined sizes to in silico values result from the size determi-
Page 51
Results
46
nation algorithms used in automated sequencing devices. These algorithms assume that
the migration time of fragments increases linearly with size, which is not true, making
size calling of fragments erroneous (Shyu et al. unpublished). In addition, the fluoro-
phores used for T-RFLP influence migrational behaviour of fragments (Tu et al. 1998).
The most abundant peaks corresponded with the number of clones of equivalent size
(Tab.17-appendix section). Peaks consisting of T-RFs of different microorganisms at
136 bp (Desulfosporosinus and Acidobacteria subgroup 3) and 437 bp (Rhodospirilla-
ceae and Rhizobiales) of the sulphate amended heavy fraction were further examined by
T-RFLP analysis with the enzyme RsaI. Peaks could be resolved and data shows that
the dominant members of the resolved peaks are of the genus Desulfosporosinus (136
bp) and the family of Rhodospirillaceae (437 bp). These findings are in accordance with
the frequency of clones found in the clone library (Fig.21, Table 17 appendix section).
Fig.21 RsaI resolved T-RFLP profile of the heavy sulphate induced fraction (1.720 g cm−3
) and
corresponding single clones. Fragment lengths of resolved peaks are given in bp. Fragment
lengths of MspI digests of single clones are given in brackets.
To determine the number of OTUs from each of the fractions, bacterial 16S rRNA se-
quences with a similarity of ≥ 99%, approximately defining species level phylotypes
(Stackebrandt 2006), were clustered together using the software DOTUR (Schloss and
Handelsman 2005). The heavy fraction from the sulphate-induced incubation consisted
of 54 OTUs compared to 47 for the control fraction. In addition, both 16S rRNA gene
clone libraries were subjected to rarefaction and coverage calculations using different
sequence similarity thresholds for OTU determination (Fig. 22 and Tab.16).
Page 52
Results
47
Table 16: Goods coverage results for 16S rRNA gene sequences of the 2 months incubations
with different similarity thresholds.
Sequence similarity threshold Coverage (+ sulphate) Coverage (-sulphate)
90% 60.71% 40.74%
95% 32.55% 31.57%
97% 31.91% 30.23%
99% 27.78% 21.27%
Fig.22 Rarefaction curves of the analysed heavy fractions of the 2 months incubations
Except for 90% of sequence similarity for OTU calculation, the resulting curves did not
reach the plateau phase. In accordance with low coverage values this indicates a high
diversity of microorganisms in the incubations not sufficiently sampled yet.
UNIFRAC divergence analysis of the heavy fractions resulted in a p-value of 0.05 indi-
cating minor divergence. Additionally, lineage specific divergence analysis (G-test)
confirmed the Desulfosporosinus genus being the genus responsible for this minor di-
vergence (branch length threshold = 0.117791) (Lozupone et al. 2006).
Page 53
Results
48
3.4.2 DsrAB analysis
In addition, phylogenetic analysis of dsrAB was performed examining the heavy frac-
tions already used for construction of the 16S rRNA gene libraries. OTU assignment
with DOTUR revealed 13 distinct OTUs for the sulphate-amended fraction, compared
to 9 for the incubation without added sulphate. OTUs were defined with a sequence
similarity threshold of ≥ 90% based on earlier studies (Loy et al. 2004). Additionally,
rarefaction and coverage analysis was performed. A curve not reaching the plateau and
small coverage values were gained, but only 26 clones of the sulphate induced fraction
and 20 of the control fraction were sequenced (Fig.23).
Fig.23. Number of dsrAB OTUs observed calculated with the rarefaction method and coverage
values for analysed gene libraries of heavy fractions of 2 months incubations.
Phylogenetic analysis revealed that most of the new sequences cluster closest to the
novel deep branching dsrAB lineages, namely OTU 2, 7 and 10 found by Loy and co –
workers (Fig.24) (Loy et al. 2004). Contrastly to 16S rRNA gene libraries no significant
differences between the sulphate amended incubations and the control incubations could
be observed since each observed OTU was present in both fractions. Furthermore, no
dsrAB sequence was clustering close to Desulfosporosinus orientis or relatives, com-
pared to the findings of the 16S rRNA data. Sequences found in both fractions, cluster
close to Thermosinus carboxydivorans a bacteria known for the utilisation of thiosul-
phate (Sokolova et al. 2004). Sequences from each OTU were used for construction of
phylogenetic trees (Fig.24).
red – 13
C-Substrates + Sulphate (coverage = 50%)
blue – 13
C-Substrates only (coverage = 37.5%)
Page 54
Results
49
Fig. 24 DsrAB tree based on 318 deduced amino acids showing the affiliation of the OTUs de-
tected within this study from the sulphate-induced incubation (red) and control incubation (blue).
Clone numbers are given in parentheses. Coloured section shows dsrAB OTUs specific for fen
soils found in this and a previous study (Loy et.al. 2004).
Page 55
Discussion
50
4 Discussion
Examining the microorganisms that are actively involved in sulphate reduction in the
investigated acidic model fen, the Schlöppnerbrunnen peatland was the main aim of this
study. Several recent studies, based on SIP e.g. (Hamberger et al. 2008), 16S rRNA
(Kraigher et al. 2006) as well as dsrAB phylogenetic analysis (Loy et al. 2004; Wentrup
2007) have already allowed insights into the diversity and metabolic capability of the
microorganisms inhabiting this area. However, until now no studies have been con-
ducted, employing differential display SIP focussing on SRP. Based on previous studies
the applied concentrations of sulphate and carbon were relatively low, resembling the
conditions at the investigated area (Hamberger et al. 2008). This helps reducing com-
muntiy shift biases in SIP introduced by applying too high concentrations of substrates
(Neufeld et al. 2007a).
To calibrate the centrifugation system prior to the actual fen soil experiments, 100% 13
C
labelled E. coli DNA was used. I never observed a greater difference than 0.02 g cm–3
to
unlabelled E. coli DNA, which is only half the value of fully 13
C labelled DNA as pub-
lished by Lueders in 2004. One reason may be that when growing the bacteria, part of
the initially used 12
C -LB-medium was transferred and contaminated the 13
C media.
Additionally, 13
C growing media was not kept airtight, therefore natural 12
CO2 was in-
corporated during E.coli nucleotide synthesis, lowering 13
C content of E.coli DNA to a
small extent. Nonetheless, separation of gradients worked and we proceeded with the
centrifugation of the soil incubation experiments.
Although the system was calibrated, I could not establish a gradient with densities
higher than 1.749 g cm–3
as published in earlier studies (Lueders et al. 2004a). This may
have several reasons as e.g. the use of a different rotor than in the study by Lueders,
therefore having different g forces influencing the gradients shape (Neufeld et al.
2007). Nevertheless, we covered most of the density range allowing us to gain insights
into SRP activity in the investigated area.
For bacteria, T-RFLP profiles of all time points were screened and clear differences
between the sulphate amended- and control incubations could be observed over time.
After two weeks of substrate incubation, only minor changes were detected between the 13
C-labelled and unlabelled fractions of both incubations. This was not surprising, con-
sidering that relatively low concentrations of labelled substrates were added weekly and
that SRP are generally slow growing bacteria, due to the lower energy yield of dissimi-
latory sulphate reduction (Thauer et al. 1977). However, certain parts of the bacterial
Page 56
Discussion
51
community incorporated labelled carbon after this short period, indicated by the appear-
ance of certain peaks in the T-RFLP profiles at heavier densities e.g. 285bp at 1.723 g
cm–3
compared to 1.720 g cm-3
for the zero control.
T-RFLP profiles from the RNA-SIP of the 2 week incubation showed great variety to
the corresponding DNA profiles as well as between the control and the sulphate-
induced incubation. On the RNA level, the effects of isotope labelling can be observed
earlier than on the DNA level due to fast and direct incorporation of labelled carbon, not
dependent on cell division. This has already been demonstrated in several studies, e.g.
with experiments on phenol degrading microorganisms (Manefield et al. 2002). In gen-
eral, when examining a complex microbial community with SIP after a short incubation
time, results have to be interpreted with care due to gene doses effects of differences in
rrna gene copy number and transcription regulation among different bacteria (von
Wintzingerode et al. 1997). In addition, the buoyant densities of the RNA fractions in
our study could not be determined due to temperature correction problems while meas-
uring refractive indices. Therefore, a closer look at the later time points of the DNA-SIP
experiments was taken.
At the later time points, clear differences in community composition were observed. A
peak at 136 bp, dominating in the two months as well as in the 6 months heavier frac-
tions of the sulphate induced incubations, could be identified to consist almost exclu-
sively of 16S rRNA gene sequences affiliated with the genus Desulfosporosinus. Activ-
ity was clearly demonstrated by comparing density values with the untreated zero con-
trol where this peak could be observed to a relatively small extent at 1.722 g cm–3
. In
the examined sulphate amended fraction this peak was dominating. In addition, the den-
sity of the fraction observed was at 1.727 g cm-3
demonstrating labelling with heavy 13
C
isotopes (Fig.13). Interestingly, a peak at 105 bp, which could only be found in the sul-
phate added heavy fractions after two months, appeared in the control incubation with-
out sulphate after six months as well. Possibly, it was also present in minor quantities
in the control incubation after two months, but results of the 16S rRNA clone library,
constructed with the two heavy fractions at 1.719 g cm-3
or 1.720 g cm -3,
could not
prove that point. Other observed major peaks were present in both fractions to a differ-
ent extent.
Despite observing more significant differences after 6 months, the shorter incubation
time was chosen for sequence analysis to reduce bias affiliated with possible cross feed-
ing effects, which have to be considered when interpreting results of later time points
(Dumont and Murrell 2005; Okabe et al. 2005). In addition, to the construction of the
16S rRNA gene library of the bacterial consortia, T-RFLP profiles of the archaeal
community after 2 months were analysed as well. Archaeal sulphate reducers of the
Page 57
Discussion
52
genera Euryarcheota and Crenarcheota (Achenbach-Richter et al. 1987; Itoh et al.
1998; Itoh et al. 1999) are known, but analysis showed no differences between the two
incubations. This leads to the conclusion that if any sulphate reducing archaea are found
in this habitat, their activity is low compared to the bacterial community (Fig.10,
13).This does not seem to be surprising as all known sulphate reducing archaea were
found at hot environments e.g. hot springs and hydrothermal vents (Stetter et al. 1987;
Burggraf et al. 1990; Itoh et al. 1999). Therefore, no deeper analysis of the archaeal
community was performed.
Some peaks of the observed fractions, RNA as well as DNA, showed different sized
T-RFs, with lengths of ≥860 bp. It is suggested that these originate from uncut PCR
products of unknown sequences having no restriction site for the enzymes used. Al-
though performing T-RFLP analysis of known 16S rRNA sequences in silico prior to
the in vitro experiments, choice of the appropriate restriction enzyme remains critical
when applying T-RFLP (Engebretson and Moyer 2003; Schutte et al. 2008). Surpris-
ingly, none of these longer fragments could be found in any of the two gene libraries
constructed, but the fractions cloned did not show high occurrence of these peaks. This
coincides with the notion that clone libraries preferentially cover high abundant species
(Ward et al. 1992). For further sequence analysis, a gene library of fractions showing
higher occurrence of these species, could be constructed and analysed.
Analysis of the gene libraries of the heaviest fractions from incubations with or without
sulphate, confirmed the results gained with T-RFLP. The proportion of genera in the
clone library, correlated with the abundance of the observed major peaks (Fig.10,
Tab.17). Coinciding with sulphate addition, the most abundant genus in the correspond-
ing heavy fraction was identified to be Desulfosporosinus. Desulfosporosinus species
are known Gram-positive members of the Firmicutes phylum, capable of sulphate re-
duction. Although being classified as Gram-positive, these spore forming bacteria, stain
Gram-negative due to their unusually thin peptidoglycan layer (Spring and Rosenzweig
2006). Several species within the genera have been described to be active in acidic soils
(Church et al. 2007; Kupka et al. 2007), capable of fermenting several organic sub-
strates including lactate, which was used in this study. All of the used carbon species are
incompletely oxidized to acetate by Desulfosporosinus (Campbell and Postgate 1965;
Stackebrandt et al. 1997; Robertson et al. 2001).
Furthermore, the second lineage only appearing in the sulphate-induced incubation is
the Acetobacteraceae. This lineage of the class of the Alphaproteobacteria mainly con-
sists of species of the genus Acidocella. Surprisingly, Acidocella spp. are reported to
grow only in pure culture in aerobic media (Hallberg and Johnson 2001). Nonetheless,
recent experiments with a mixture of two pure cultures in an anoxic fermenter under
Page 58
Discussion
53
acidic conditions (pH 3.8 – 4.2), resembling the low pH conditions of the investigated
fen, showed a possible syntrophic relationship between Desulfosporosinus orientis and
Acidocella aromatica (Kimura et al. 2006). Syntrophic relationships are common with
anaerobic microorganisms, but little is known about syntrophic living aerobic microor-
ganisms (McInerney et al. 2009). The authors of the fermenter study assume that acetate
produced by Desulfosporosinus orientis is metabolized to molecular hydrogen and car-
bon dioxide by Acidocella aromatica. Results of the Kimura study strongly support that
this novel type of syntrophy is existing in natural environments, but further experiments
confirming these findings are necessary, e.g. CARD and RAMAN FISH as well as q-
PCR to specifically prove activity and occurrence of the species involved. It is interest-
ing, that after 6 months the 105 bp peak, identified to be Acetobacteraceae, is also ap-
pearing in the heavy fraction of the control incubation. It is suggested that the acetate
applied and acetate produced by other microorganisms than Desulfosporosinus, is util-
ised by these bacteria. Possibly other types of syntrophic relationships, e.g. with
methanogenic species have developed which allow anaerobic growth of Acidocella
(McInerney et al. 2008).
Interestingly, no other known sulphate-reducing bacteria except single clones that affili-
ated with Desulfobulbacaeae and Desulfovibrio were found in the gene library. Al-
though dsrAB and 16S rRNA gene microarray data of previous other studies indicate
several dsrAB harbouring microorganisms in the examined area e.g. Desulfobacca ace-
toxidans and Syntrophobacter wolinii related species, the 16S rRNA data of this study
show no important role of these microorganisms under the experimental conditions
(Loy et al. 2004; Wentrup 2007). Possibly other sulphate reducing microorganisms are
outgrown by Desulfosporosinus due to a higher affinity to the substrates used here or
several species possessing dsrAB are yet not identified as SRP. Surprisingly, dsrAB
analysis, which will be discussed in detail later, gave results different to the 16S rRNA
data. Under these conditions Desulfosporosinus is the main sulphate reducer, but SIP
experiments with other substrates than used here, could give additional insights into
microbial activity of SRP.
Although the main focus of this study was to find the main sulphate reducing microor-
ganisms in the Schlöppnerbrunnen fen via comparative SIP analysis, several other bac-
terial groups could be identified to actively assimilate the 13
C-labelled substrates added
under these conditions. In both of the fractions the dominant phylum were the Acido-
bacteria correlating with results of recent studies revealing the high abundance of this
phylum in the Schlöppnerbrunnen habitat (Wentrup 2007). Little is known about these
bacteria and only few cultivated and described species are known, although it is sug-
gested that this phylum harbours a high diversity of bacterial species (Barns et al.
Page 59
Discussion
54
2007). As in other studies about Acidobacteria most of the members found here can be
assigned to the subgroups 1, 2 and 3, known to favour acidic soil pH (Sait et al. 2002;
Mannisto and Haggblom 2006; Sait et al. 2006). Two representatives of subgroup 1,
Acidobacterium capsulatum and Terriglobus roseus, have been cultivated and both have
been identified to be acidophilic (Kishimoto and Tano 1987; Kishimoto et al. 1991;
Hiraishi et al. 1995; Eichorst et al. 2007; Meisinger et al. 2007). In this context, it is
interesting that although being described as members of soil microbial populations, so
far no activity under anoxic conditions has been reported for members of subgroup 3 as
indicated by the T-RFLP data from this study. Additionally, single sequences of the
subgroups 6, 8 and 13 have been found, but little is known about them (Barns et al.
2007).
Following, the other major lineages found in this study are described briefly.
Another lineage of the Firmicutes phylum, prominent in both incubations (6% in the
sulphate-induced incubation and 13% in the control) is the Acidaminococcaceae. They
are known as anaerobic members of the order Clostridiales, which have been found in
the investigated area (Wentrup 2007; Wust et al. 2009), as well as in other moderately
acidic soil habitats (Kuhner et al. 2000; Matthies et al. 2001; Lee et al. 2007). They are
known fermenters of several organic compounds including lactate, utilised in this study,
which can be degraded to acetate by e.g. Psychrosinus fermentans and Pelosinus fer-
mentans (Shelobolina et al. 2007; Sattley et al. 2008).
Despite the already described Acetobacteraceae, the metabolic diverse phylum of the
Proteobacteria is also represented by numerous genera in this study. Clearly dominant,
especially in the control incubation, are members of the Rhodospirillaceae family and
several Azospirillum species. Compared to only 1% of the clone library sequences in the
sulphate-induced incubation, 10% of all retrieved sequences in the control clustered
close to the Azospirillum genus. They are known nitrogen-fixing bacteria, associated
with plants and were already isolated from various soils (Paredes-Cardona et al. 1988;
Tapia-Hernandez et al. 1990; Doroshenko et al. 2007; Young et al. 2008; Zhou et al.
2009). The observed decreased abundance of Azospirillum species in the sulphate
amended incubation may be due to the toxic effect of sulphate on the nitrogenase activ-
ity of these bacteria (Rao and Venkateswarlu 1985). Other members of the Rhodospiril-
laceae were also found to be active in acidic soils, fermenting several organic com-
pounds, for example the aerotolerant bacteria Telmatospirillum siberiense (Sizova et al.
2007).
Betaproteobacteria found in equal amounts (3%) in both incubations are of the Chro-
mobacterium genus. Chromobacterium species were already isolated from forest soil
and showed growth on various organic compounds including many sugars like lactose.
Page 60
Discussion
55
They are aero-tolerant, but are producing a violet dye under oxic conditions, presuma-
bly to diminish effects of oxygen radicals (Martin et al. 2007). Prominent in both incu-
bations too, are species of Geobacter, known anaerobic Deltaproteobacteria capable of
oxidizing acetate, formate and hydrogen with humic substances serving as electron ac-
ceptors. These compounds can be found in the investigated area (Coates et al. 2002;
Cervantes et al. 2003; Shrestha et al. 2009). Gammaproteobacteria of the genus Hydro-
genophaga were only identified in the control incubation. Members of this genus are
chemo-organotrophic or chemolithoautotrophic, gaining their energy via the oxidation
of hydrogen and CO2 as a carbon source (Wen et al. 1999; Spring et al. 2004). There
are no reports about sulphate inhibition of these bacteria, but presumably sulphate fa-
vours growth of certain species that outcompete Hydrogenophaga.
Few clones (5-6%) found in this habitat under both conditions belong to the family
Acidimicrobiaceae. Members are widespread in acidic soil environments but many of
them are reported to be sulphide oxidizers (Okibe and Johnson 2004; Cleaver et al.
2007; Jenkins et al. 2009). It remains unclear whether the identified members are active
in sulphate reduction, due to their equivalent occurrence in both experimental setups.
For a more detailed view into the phylogeny of active sulphate reducers, dsrAB libraries
of both fractions, already used for 16S rRNA analysis, were constructed with surprising
results. Not a single sequence was found which clustered close to already known Desul-
fosporosinus dsrAB gene sequences. Furthermore, all sequences found clustered next to
the novel dsrAB sequences found previously by Loy and co-workers (Loy et al. 2004),
except one sequence having high similarity to the Thermosinus carboxydivorans dsrAB
sequence. This is rather unusual, because studies on this bacterium revealed that it could
not grow on sulphate, neither on one of the carbon substrates used. It grows on thiosul-
phate, ferric iron and several sugars and is capable of utilising carbon monoxide, pro-
ducing hydrogen, carbon dioxide and acetate (Sokolova et al. 2004). Nonetheless, the
majority of sequences clustered next to the novel dsrAB OTUs 2, 7 and 10 (71.64 –
96.67 % sequence similarity) and no significant differences between fractions with or
without sulphate added could be determined. The OTUs 2, 7 and 10 are all from the
same lineages described by Loy and colleagues (Loy et al. 2004). Except OTU 10 all
these sequences were found in the same sampling site as for this study, although soil
samples from a bigger depth were analysed (22.5 – 30 cm). Clones related to these se-
quences were already identified in uranium mill tailing groundwater and Everglades soil
(Chang et al. 2001; Castro et al. 2002). It is suggested, that these novel dsrAB OTUs
derive from either novel bacterial or archaeal phyla or organisms that are yet not known
to be capable of sulphate reduction. This has been confirmed by analysis of their gene
sequence, finding conserved catalytic sequence motifs indicating that they are no
Page 61
Discussion
56
pseudo-genes (Loy et al. 2004). Still it remains unclear why all lineages identified were
also found under non sulphate conditions. This may be a result of sequencing only 51
clones altogether, and rarefaction and coverage calculations showed that further se-
quencing is necessary for better coverage. Another possibility maybe, that although the
bacteria are harbouring the gene for dissimilatory sulphate reduction, they are not ac-
tively using the gene as reported for Pelotomaculum strain MGP. It is suggested that
this strain recently adopted to a syntrophic lifestyle with a hydrogenotrophic methano-
gen and therefore lost its ability of sulphate reduction (Imachi et al. 2006).
The non-emergence of sequences affiliated with Desulfosporosinus could have several
reasons. First of all, the database for calculating phylogenetic trees only comprised a
single sequence from Desulfosporosinus orientis that is covered by the primers used. It
is very unlikely, but possibly dsrAB sequences of the other Desulfosporosinus species
known, do not cluster close to the variant in the database due to lateral gene transfer,
described for SRP (Zverlov et al. 2005). Secondly, the dsrAB sequence of other Desul-
fosporosinus species are possibly not covered by the primer mix used and these are pos-
sibly the dominant species identified with 16S rRNA data. Sequencing and further
analysis of the dsrAB genes of pure cultures of known Desulfosporosinus species could
give clearing insights. (Note added: new primers specific for the Desulfosporosi-
nus/Desulfitobacterium cluster, developed after this thesis could obtain sequences clus-
tering close to Desulfosporosinus out of the examined soil samples.)
Page 62
Summary
57
5 Summary
Despite their importance for carbon mineralization in wetlands, little is known about
sulphate-reducing prokaryotes (SRP) in these habitats. In addition, by out-competing
methanogenic microorganisms, which are highly active in these environments, they can
significantly reduce emission of the greenhouse gas methane.
For this study the Schlöppnerbrunnen, a fen located in the Fichtelgebirge (Germany) at
the German-Czech border was chosen. This area has been exposed to acidic rain and
sulphur deposition due to intensive soft coal burning in the time of the former socialist
regimes. Earlier 16S rRNA gene and dsrAB diversity studies at this site indicated the
presence of a community that consists of known SRP species and microorganisms with
novel, deep-branching dsrAB SRP. In the present study, a differential display DNA sta-
ble isotope probing approach was employed to identify the active SRP in the fen. Soil
samples from the fen were incubated with 13
C substrates for up to 6 months with and
without sulphate. Subsequently, nucleic acid samples from different time points were
separated based on their 13
C content and these “heavy” nucleic acids were subjected to
further downstream analysis by T- RFLP and clone library analysis of 16S rRNA genes
and dsrAB.
Data obtained from the 2 months samples revealed that members of the genus Desul-
fosporosinus are the main sulphate reducers in this wetland under the conditions em-
ployed. These findings could only be observed based on the data obtained through 16S
rRNA clone library analysis. In addition, clone sequences that could be affiliated to the
genus Acidocella were also enriched in 13C in the sulphate amended incubation. Al-
though Acidocella species only grow aerobically in pure culture, an anaerobic, sulphate
reduction-based syntrophy was recently postulated between a Acidocella strain and a
Desulfosporosinus strain in co-culture. A similar lifestyle might be the basis for co-
occurrence of the Desulfosporosinus and Acidocella species in the Schlöppnerbrunnen
fen. Contrary to 16S rRNA data no dsrAB that was affiliated to Desulfosporosinus was
found, but this was discovered to be due to biased PCR primers. Furthermore, dsrAB
clone library analysis indicated no distinct activity of the “novel” dsrAB harbouring
microorganisms and thus their physiology and identity remains unknown, making fur-
ther research necessary.
Page 63
Literature
58
Zusammenfassung
Neben den vielfältigen ökologischen Funktionen von Feuchtgebieten als Wasserspei-
cher und Lebensraum einer hochspezialisierten Flora und Fauna gehören sie auch zu
den wichtigsten CO2 Speichern der Erde. Sulfatreduzierende Mikroorganismen haben
einen großen Anteil an der Metabolisierung von Kohlenstoff und Schwefel in diesen
Habitaten, jedoch ist sehr wenig über ihre Physiologie und Aktivität bekannt. Außer
ihrer wichtigen Rolle im Schwefel- und Kohlenstoffzyklus, wurde auch beobachtet dass
durch ihre Aktivität methanogene Mikroorganismen in ihrem Metabolismus gehemmt
werden und dadurch der Ausstoß von Methan, einem klimaschädlichen Treibhausgas
aus Moorgebieten stark reduziert wird. Für diese Studie wurde das
Schlöppnerbrunnenmoor an der deutsch-tschechischen Grenze gewählt, da in dieses
Gebiet bis in die 80er Jahre ein hoher Sulfateintrag durch sauren Regen als Folge von
industrieller Braunkohleverbrennung stattgefunden hat. Frühere Studien lassen auf eine
diverse Gemeinschaft an sulfatreduzierenden Mikroorganismen in dem untersuchten
Moor schließen. Zusätzlich zu bereits bekannten Spezies wurden mithilfe genetischer
Analysen der dsrAB Markergene, welche für die dissimilatorische (Bi)Sulfitreduktase
kodieren, mögliche neue sulfatreduzierende Mikroorganismen entdeckt. Die Identifi-
zierung der aktiven Sulfatreduzierer erfolgte in der vorliegenden Studie mittels ‚DNA-
stable isotope probing„. Hierbei wurden zur Markierung der Nukleinsäuren aktiver Mik-
roorganismen Moorbodenproben bis zu 6 Monate lang mit 13
C markierten Substraten
und Sulfat versetzt. Zu verschiedenen Zeitpunkten wurden Proben der Inkubationen
entnommen und durch Ultrazentrifugation markierte von unmarkierten Nukleinsäuren
getrennt. Danach wurden die markierten Nukleinsäuren mit Hilfe der Analyse von ter-
minalen Restriktionsfragmenten und Klonbibliotheken der 16S rRNS und der dsrAB
Gene untersucht. Es konnte nachgewiesen werden dass unter diesen Bedingungen der
Großteil des Sulfats von Spezies der Gattung Desulfosporosinus reduziert wurde. Zu-
sätzlich wurden Sequenzen der Gattung Acidocella entdeckt, einem üblicherweise aerob
lebenden Bakterium. Frühere Studien lassen jedoch auf eine anaerobe, syntrophe Le-
bensweise mit Desulfosporosinus schließen. Eine Symbiose, die eventuell ebenfalls die
Grundlage des gemeinsamen Auftretens dieser beiden Gattungen im untersuchten Moor
darstellt. Auf der Ebene von dsrAB konnte überraschenderweise keine
Desulfosporosinus Sequenz entdeckt werden, was sich jedoch als Artefakt der einge-
setzten PCR Primer herausstellte. Sulfatreduzierende Aktivität konnte für die neuen
dsrAB-tragenden Mikroorgansimen nicht nachgewiesen werden. Somit bleibt die Identi-
tät und Physiologie dieser neuen Mikroorganismen weiter unbekannt.
Page 64
Literature
59
6 Literature
Achenbach-Richter, L., Stetter, K.O. and Woese, C.R. (1987) A possible biochemical missing link among
archaebacteria. Nature 327, 348-349.
Aeckersberg, F., Rainey, F.A. and Widdel, F. (1998) Growth, natural relationships, cellular fatty acids
and metabolic adaptation of sulfate-reducing bacteria that utilize long-chain alkanes under anoxic condi-
tions. Arch Microbiol 170, 361-369.
Alewell, C. and Novak, M. (2001) Spotting zones of dissimilatory sulfate reduction in a forested catch-
ment: the 34S-35S approach. Environ Pollut 112, 369-377.
Altschul, S.F., Gish, W., Miller, W., Myers, E.W. and Lipman, D.J. (1990) Basic local alignment search
tool. J Mol Biol 215, 403-410.
Bade, K., Manz, W. and Szewzyk, U. (2000) Behavior of sulfate reducing bacteria under oligotrophic
conditions and oxygen stress in particle-free systems related to drinking water. FEMS Microbiol Ecol 32,
215-223.
Barns, S.M., Cain, E.C., Sommerville, L. and Kuske, C.R. (2007) Acidobacteria phylum sequences in
uranium-contaminated subsurface sediments greatly expand the known diversity within the phylum. Appl
Environ Microbiol 73, 3113-3116.
Ben-Dov, E., Brenner, A. and Kushmaro, A. (2007) Quantification of sulfate-reducing bacteria in indus-
trial wastewater, by real-time polymerase chain reaction (PCR) using dsrA and apsA genes. Microb Ecol
54, 439-451.
Blattner, F.R., Plunkett, G., 3rd, Bloch, C.A., Perna, N.T., Burland, V., Riley, M., Collado-Vides, J.,
Glasner, J.D., Rode, C.K., Mayhew, G.F., Gregor, J., Davis, N.W., Kirkpatrick, H.A., Goeden, M.A.,
Rose, D.J., Mau, B. and Shao, Y. (1997) The complete genome sequence of Escherichia coli K-12. Sci-
ence 277, 1453-1462.
Bodrossy, L., Stralis-Pavese, N., Konrad-Koszler, M., Weilharter, A., Reichenauer, T.G., Schofer, D. and
Sessitsch, A. (2006) mRNA-Based Parallel Detection of Active Methanotroph Populations by Use of a
Diagnostic Microarray. Appl Environ Microbiol 72, 1672-1676.
Boetius, A., Ravenschlag, K., Schubert, C.J., Rickert, D., Widdel, F., Gieseke, A., Amann, R., Jorgensen,
B.B., Witte, U. and Pfannkuche, O. (2000) A marine microbial consortium apparently mediating anaero-
bic oxidation of methane. Nature 407, 623-626.
Bond, P.L., Smriga, S.P. and Banfield, J.F. (2000) Phylogeny of microorganisms populating a thick,
subaerial, predominantly lithotrophic biofilm at an extreme acid mine drainage site. Appl Environ Micro-
biol 66, 3842-3849.
Brandisheep, A., Gebhardt, N.A., Thauer, R.K., Widdel, F. and Pfennig, N. (1983) ANAEROBIC ACE-
TATE OXIDATION TO CO2 BY DESULFOBACTER-POSTGATEI .1. DEMONSTRATION OF ALL
ENZYMES REQUIRED FOR THE OPERATION OF THE CITRIC-ACID CYCLE. Archives of Micro-
biology 136, 222-229.
Broco, M., Rousset, M., Oliveira, S. and Rodrigues-Pousada, C. (2005) Deletion of flavoredoxin gene in
Desulfovibrio gigas reveals its participation in thiosulfate reduction. FEBS Lett 579, 4803-4807.
Brune, A., Frenzel, P. and Cypionka, H. (2000) Life at the oxic-anoxic interface: microbial activities and
adaptations. FEMS Microbiol Rev 24, 691-710.
Buckley, D.H., Huangyutitham, V., Hsu, S.-F. and Nelson, T.A. (2007) Stable Isotope Probing with 15N
Achieved by Disentangling the Effects of Genome G+C Content and Isotope Enrichment on DNA Den-
sity. Appl Environ Microbiol 73, 3189-3195.
Page 65
Literature
60
Burggraf, S., Jannasch, H.W., Nicolaus, B. and Stetter, K.O. (1990) ARCHAEOGLOBUS-PROFUNDUS
SP-NOV, REPRESENTS A NEW SPECIES WITHIN THE SULFATE-REDUCING ARCHAEBACTE-
RIA. Systematic and Applied Microbiology 13, 24-28.
Campbell, L.L. and Postgate, J.R. (1965) Classification of the spore-forming sulfate-reducing bacteria.
Bacteriol Rev 29, 359-363.
Canfield, D.E. (1998) A new model for Proterozoic ocean chemistry. Nature 396, 450-453.
Castro, H., Reddy, K.R. and Ogram, A. (2002) Composition and function of sulfate-reducing prokaryotes
in eutrophic and pristine areas of the Florida Everglades. Appl Environ Microbiol 68, 6129-6137.
Castro, H.F., Williams, N.H. and Ogram, A. (2000) Phylogeny of sulfate-reducing bacteria(1). FEMS
Microbiol Ecol 31, 1-9.
Cervantes, F.J., Duong-Dac, T., Ivanova, A.E., Roest, K., Akkermans, A.D., Lettinga, G. and Field, J.A.
(2003) Selective enrichment of Geobacter sulfurreducens from anaerobic granular sludge with quinones
as terminal electron acceptors. Biotechnol Lett 25, 39-45.
Chang, Y.J., Peacock, A.D., Long, P.E., Stephen, J.R., McKinley, J.P., Macnaughton, S.J., Hussain, A.K.,
Saxton, A.M. and White, D.C. (2001) Diversity and characterization of sulfate-reducing bacteria in
groundwater at a uranium mill tailings site. Appl Environ Microbiol 67, 3149-3160.
Church, C.D., Wilkin, R.T., Alpers, C.N., Rye, R.O. and McCleskey, R.B. (2007) Microbial sulfate re-
duction and metal attenuation in pH 4 acid mine water. Geochem Trans 8, 10.
Cleaver, A.A., Burton, N.P. and Norris, P.R. (2007) A novel Acidimicrobium species in continuous cul-
tures of moderately thermophilic, mineral-sulfide-oxidizing acidophiles. Appl Environ Microbiol 73,
4294-4299.
Coates, J.D., Cole, K.A., Chakraborty, R., O'Connor, S.M. and Achenbach, L.A. (2002) Diversity and
ubiquity of bacteria capable of utilizing humic substances as electron donors for anaerobic respiration.
Appl Environ Microbiol 68, 2445-2452.
Crane, B.R. and Getzoff, E.D. (1996) The relationship between structure and function for the sulfite re-
ductases. Curr Opin Struct Biol 6, 744-756.
Cypionka, H., Widdel, F. and Pfenning, N. (1985) SURVIVAL OF SULFATE-REDUCING BACTERIA
AFTER OXYGEN STRESS, AND GROWTH IN SULFATE-FREE OXYGEN-SULFIDE GRADI-
ENTS. Fems Microbiology Ecology 31, 39-45.
Dar, S.A., Kuenen, J.G. and Muyzer, G. (2005) Nested PCR-denaturing gradient gel electrophoresis ap-
proach to determine the diversity of sulfate-reducing bacteria in complex microbial communities. Appl
Environ Microbiol 71, 2325-2330.
Dhillon, A., Teske, A., Dillon, J., Stahl, D.A. and Sogin, M.L. (2003) Molecular characterization of sul-
fate-reducing bacteria in the Guaymas Basin. Appl Environ Microbiol 69, 2765-2772.
Don, R.H., Cox, P.T., Wainwright, B.J., Baker, K. and Mattick, J.S. (1991) 'Touchdown' PCR to circum-
vent spurious priming during gene amplification. Nucleic Acids Res 19, 4008.
Doroshenko, E.V., Bulygina, E.S., Spiridonova, E.M., Turova, T.P. and Kravchenko, I.K. (2007) [Isola-
tion and characterization of nitrogen-fixing bacteria of the genus Azospirillum from the soil of a Sphag-
num peat bog]. Mikrobiologiia 76, 107-115.
Dubilier, N., Mulders, C., Ferdelman, T., de Beer, D., Pernthaler, A., Klein, M., Wagner, M., Erseus, C.,
Thiermann, F., Krieger, J., Giere, O. and Amann, R. (2001) Endosymbiotic sulphate-reducing and sul-
phide-oxidizing bacteria in an oligochaete worm. Nature 411, 298-302.
Duller (2005) Identifizierung and Quantifizierung einer bislang unbekannten Entwicklungslinie von
sulfatreduzierenden Prokaryoten. Thesis.
Dumont, M.G. and Murrell, J.C. (2005) Stable isotope probing - linking microbial identity to function.
Nat Rev Microbiol 3, 499-504.
Edwards, U., Rogall, T., Blocker, H., Emde, M. and Bottger, E.C. (1989) Isolation and direct complete
nucleotide determination of entire genes. Characterization of a gene coding for 16S ribosomal RNA.
Nucleic Acids Res 17, 7843-7853.
Page 66
Literature
61
Eichorst, S.A., Breznak, J.A. and Schmidt, T.M. (2007) Isolation and characterization of soil bacteria that
define Terriglobus gen. nov., in the phylum Acidobacteria. Appl Environ Microbiol 73, 2708-2717.
Engebretson, J.J. and Moyer, C.L. (2003) Fidelity of select restriction endonucleases in determining mi-
crobial diversity by terminal-restriction fragment length polymorphism. Appl Environ Microbiol 69,
4823-4829.
Felsenstein, J. (1995) PHYLIP (Phylogeny Inference Package). Seattle, Department of Genetics, Univer-
sity of Washington.
Fishbain, S., Dillon, J.G., Gough, H.L. and Stahl, D.A. (2003) Linkage of high rates of sulfate reduction
in Yellowstone hot springs to unique sequence types in the dissimilatory sulfate respiration pathway. Appl
Environ Microbiol 69, 3663-3667.
Fitz, R.M. and Cypionka, H. (1990) FORMATION OF THIOSULFATE AND TRITHIONATE DUR-
ING SULFITE REDUCTION BY WASHED CELLS OF DESULFOVIBRIO-DESULFURICANS. Ar-
chives of Microbiology 154, 400-406.
Foti, M., Sorokin, D.Y., Lomans, B., Mussman, M., Zacharova, E.E., Pimenov, N.V., Kuenen, J.G. and
Muyzer, G. (2007) Diversity, activity, and abundance of sulfate-reducing bacteria in saline and hyper-
saline soda lakes. Appl Environ Microbiol 73, 2093-2100.
Frederiksen, T.M. and Finster, K. (2004) The transformation of inorganic sulfur compounds and the as-
similation of organic and inorganic carbon by the sulfur disproportionating bacterium Desulfocapsa sul-
foexigens. Antonie Van Leeuwenhoek 85, 141-149.
Fung, I., John, J., Lerner, J., Matthews, E., Prather, M., Steele, L.P. and Fraser, P.J. (1991) 3-
DIMENSIONAL MODEL SYNTHESIS OF THE GLOBAL METHANE CYCLE. J Geophys Res-Atmos
96, 13033-13065.
Gauci, V., Matthews, E., Dise, N., Walter, B., Koch, D., Granberg, G. and Vile, M. (2004) Sulfur pollu-
tion suppression of the wetland methane source in the 20th and 21st centuries. Proceedings of the Na-
tional Academy of Sciences 101, 12583-12587.
Good, I.J. (1953) The population frequency of species and the estimation of population parameters. Bio-
metrica 40, 237 - 264.
Grosskopf, R., Janssen, P.H. and Liesack, W. (1998) Diversity and structure of the methanogenic com-
munity in anoxic rice paddy soil microcosms as examined by cultivation and direct 16S rRNA gene se-
quence retrieval. Appl Environ Microbiol 64, 960-969.
Hallberg, K.B. and Johnson, D.B. (2001) Biodiversity of acidophilic prokaryotes. Adv Appl Microbiol 49,
37-84.
Hamberger, A., Horn, M.A., Dumont, M.G., Murrell, J.C. and Drake, H.L. (2008) Anaerobic Consumers
of Monosaccharides in a Moderately Acidic Fen. Appl Environ Microbiol 74, 3112-3120.
Hattori, S., Kamagata, Y., Hanada, S. and Shoun, H. (2000) Thermacetogenium phaeum gen. nov., sp.
nov., a strictly anaerobic, thermophilic, syntrophic acetate-oxidizing bacterium. Int J Syst Evol Microbiol
50 Pt 4, 1601-1609.
Hein, R., Crutzen, P.J. and Heimann, M. (1997) An inverse modeling approach to investigate the global
atmospheric methane cycle. Glob Biogeochem Cycle 11, 43-76.
Hines, M.E., Evans, R.S., Sharak Genthner, B.R., Willis, S.G., Friedman, S., Rooney-Varga, J.N. and
Devereux, R. (1999) Molecular phylogenetic and biogeochemical studies of sulfate-reducing bacteria in
the rhizosphere of spartina alterniflora. Appl Environ Microbiol 65, 2209-2216.
Hiraishi, A., Kishimoto, N., Kosako, Y., Wakao, N. and Tano, T. (1995) Phylogenetic position of the
menaquinone-containing acidophilic chemo-organotroph Acidobacterium capsulatum. FEMS Microbiol
Lett 132, 91-94.
Hollemann and Wiberg (1985). Lehrbuch der anorganischen Chemie Berlin , Walter de Gruyter.
Horn, M.A., Matthies, C., Kusel, K., Schramm, A. and Drake, H.L. (2003) Hydrogenotrophic
Methanogenesis by Moderately Acid-Tolerant Methanogens of a Methane-Emitting Acidic Peat. Appl
Environ Microbiol 69, 74-83.
Page 67
Literature
62
Imachi, H., Sekiguchi, Y., Kamagata, Y., Loy, A., Qiu, Y.L., Hugenholtz, P., Kimura, N., Wagner, M.,
Ohashi, A. and Harada, H. (2006) Non-sulfate-reducing, syntrophic bacteria affiliated with
desulfotomaculum cluster I are widely distributed in methanogenic environments. Appl Environ Micro-
biol 72, 2080-2091.
Ingvorsen, K., Zeikus, J.G. and Brock, T.D. (1981) Dynamics of Bacterial Sulfate Reduction in a Eutro-
phic Lake. Appl Environ Microbiol 42, 1029-1036.
Itoh, T., Suzuki, K. and Nakase, T. (1998) Thermocladium modestius gen. nov., sp. nov., a new genus of
rod-shaped, extremely thermophilic crenarchaeote. Int J Syst Bacteriol 48 Pt 3, 879-887.
Itoh, T., Suzuki, K., Sanchez, P.C. and Nakase, T. (1999) Caldivirga maquilingensis gen. nov., sp. nov., a
new genus of rod-shaped crenarchaeote isolated from a hot spring in the Philippines. Int J Syst Bacteriol
49 Pt 3, 1157-1163.
Jeanthon, C., L'Haridon, S., Cueff, V., Banta, A., Reysenbach, A.L. and Prieur, D. (2002) Thermodesul-
fobacterium hydrogeniphilum sp. nov., a thermophilic, chemolithoautotrophic, sulfate-reducing bacterium
isolated from a deep-sea hydrothermal vent at Guaymas Basin, and emendation of the genus Thermode-
sulfobacterium. Int J Syst Evol Microbiol 52, 765-772.
Jenkins, S.N., Waite, I.S., Blackburn, A., Husband, R., Rushton, S.P., Manning, D.C. and O'Donnell,
A.G. (2009) Actinobacterial community dynamics in long term managed grasslands. Antonie Van Leeu-
wenhoek 95, 319-334.
Jorgensen, B.B. (1982) MINERALIZATION OF ORGANIC-MATTER IN THE SEA BED - THE ROLE
OF SULFATE REDUCTION. Nature 296, 643-645.
Karkhoff-Schweizer, R.R., Huber, D.P. and Voordouw, G. (1995) Conservation of the genes for dissimi-
latory sulfite reductase from Desulfovibrio vulgaris and Archaeoglobus fulgidus allows their detection by
PCR. Appl Environ Microbiol 61, 290-296.
Kimura, M. (1980) A simple method for estimating evolutionary rates of base substitutions through com-
parative studies of nucleotide sequences. J Mol Evol 16, 111-120.
Kimura, S., Hallberg, K.B. and Johnson, D.B. (2006) Sulfidogenesis in low pH (3.8-4.2) media by a
mixed population of acidophilic bacteria. Biodegradation 17, 159-167.
Kishimoto, N., Inagaki, K., Sugio, T. and Tano, T. (1991) PURIFICATION AND PROPERTIES OF AN
ACIDIC BETA-GLUCOSIDASE FROM ACIDOBACTERIUM-CAPSULATUM. Journal of Fermenta-
tion and Bioengineering 71, 318-321.
Kishimoto, N. and Tano, T. (1987) ACIDOPHILIC HETEROTROPHIC BACTERIA ISOLATED
FROM ACIDIC MINE DRAINAGE, SEWAGE, AND SOILS. Journal of General and Applied Microbi-
ology 33, 11-25.
Klein, M., Friedrich, M., Roger, A.J., Hugenholtz, P., Fishbain, S., Abicht, H., Blackall, L.L., Stahl, D.A.
and Wagner, M. (2001) Multiple lateral transfers of dissimilatory sulfite reductase genes between major
lineages of sulfate-reducing prokaryotes. J Bacteriol 183, 6028-6035.
Kniemeyer, O., Musat, F., Sievert, S.M., Knittel, K., Wilkes, H., Blumenberg, M., Michaelis, W., Clas-
sen, A., Bolm, C., Joye, S.B. and Widdel, F. (2007) Anaerobic oxidation of short-chain hydrocarbons by
marine sulphate-reducing bacteria. Nature 449, 898-901.
Knoblauch, C., Sahm, K. and Jorgensen, B.B. (1999) Psychrophilic sulfate-reducing bacteria isolated
from permanently cold arctic marine sediments: description of Desulfofrigus oceanense gen. nov., sp.
nov., Desulfofrigus fragile sp. nov., Desulfofaba gelida gen. nov., sp. nov., Desulfotalea psychrophila
gen. nov., sp. nov. and Desulfotalea arctica sp. nov. Int J Syst Bacteriol 49 Pt 4, 1631-1643.
Koschorreck, M., Wendt-Potthoff, K. and Geller, W. (2003) Microbial sulfate reduction at low pH in
sediments of an acidic lake in Argentina. Environ Sci Technol 37, 1159-1162.
Kraigher, B., Stres, B., Hacin, J., Ausec, L., Mahne, I., van Elsas, J.D. and Mandic-Mulec, I. (2006) Mi-
crobial activity and community structure in two drained fen soils in the Ljubljana Marsh. Soil Biol Bio-
chem 38, 2762-2771.
Page 68
Literature
63
Kuhner, C.H., Matthies, C., Acker, G., Schmittroth, M., Gossner, A.S. and Drake, H.L. (2000) Clostrid-
ium akagii sp. nov. and Clostridium acidisoli sp. nov.: acid-tolerant, N2-fixing clostridia isolated from
acidic forest soil and litter. Int J Syst Evol Microbiol 50 Pt 2, 873-881.
Kupka, D., Rzhepishevska, O.I., Dopson, M., Lindstrom, E.B., Karnachuk, O.V. and Tuovinen, O.H.
(2007) Bacterial oxidation of ferrous iron at low temperatures. Biotechnol Bioeng 97, 1470-1478.
Lee, Y.J., Romanek, C.S. and Wiegel, J. (2007) Clostridium aciditolerans sp. nov., an acid-tolerant spore-
forming anaerobic bacterium from constructed wetland sediment. Int J Syst Evol Microbiol 57, 311-315.
Lehman, R.M., Roberto, F.F., Earley, D., Bruhn, D.F., Brink, S.E., O'Connell, S.P., Delwiche, M.E. and
Colwell, F.S. (2001) Attached and unattached bacterial communities in a 120-meter corehole in an acidic,
crystalline rock aquifer. Appl Environ Microbiol 67, 2095-2106.
Leloup, J., Loy, A., Knab, N.J., Borowski, C., Wagner, M. and Jorgensen, B.B. (2007) Diversity and
abundance of sulfate-reducing microorganisms in the sulfate and methane zones of a marine sediment,
Black Sea. Environ Microbiol 9, 131-142.
Liu, W.T., Marsh, T.L., Cheng, H. and Forney, L.J. (1997) Characterization of microbial diversity by
determining terminal restriction fragment length polymorphisms of genes encoding 16S rRNA. Appl
Environ Microbiol 63, 4516-4522.
Lovley, D.R. and Klug, M.J. (1983) Sulfate Reducers Can Outcompete Methanogens at Freshwater Sul-
fate Concentrations. Appl Environ Microbiol 45, 187-192.
Lovley, D.R. and Phillips, E.J.P. (1994) REDUCTION OF CHROMATE BY DESULFOVIBRIO-
VULGARIS AND ITS C(3) CYTOCHROME. Applied and Environmental Microbiology 60, 726-728.
Lovley, D.R., Roden, E.E., Phillips, E.J.P. and Woodward, J.C. (1993a) ENZYMATIC IRON AND
URANIUM REDUCTION BY SULFATE-REDUCING BACTERIA. Marine Geology 113, 41-53.
Lovley, D.R., Widman, P.K., Woodward, J.C. and Phillips, E.J.P. (1993b) REDUCTION OF URANIUM
BY CYTOCHROME-C(3) OF DESULFOVIBRIO-VULGARIS. Applied and Environmental Microbiol-
ogy 59, 3572-3576.
Loy, A., Küsel, K., Lehner, A., Drake, H.L. and Wagner, M. (2004) Microarray and functional gene
analyses of sulfate-reducing prokaryotes in low-sulfate, acidic fens reveal cooccurrence of recognized
genera and novel lineages. Applied And Environmental Microbiology 70, 6998-7009.
Lozupone, C., Hamady, M. and Knight, R. (2006) UniFrac--an online tool for comparing microbial com-
munity diversity in a phylogenetic context. BMC Bioinformatics 7, 371.
Ludwig, W., Strunk, O., Westram, R., Richter, L., Meier, H., Yadhukumar, Buchner, A., Lai, T., Steppi,
S., Jobb, G., Forster, W., Brettske, I., Gerber, S., Ginhart, A.W., Gross, O., Grumann, S., Hermann, S.,
Jost, R., Konig, A., Liss, T., Lussmann, R., May, M., Nonhoff, B., Reichel, B., Strehlow, R., Stamatakis,
A., Stuckmann, N., Vilbig, A., Lenke, M., Ludwig, T., Bode, A. and Schleifer, K.H. (2004) ARB: a soft-
ware environment for sequence data. Nucleic Acids Res 32, 1363-1371.
Lueders, T. and Friedrich, M.W. (2002) Effects of amendment with ferrihydrite and gypsum on the struc-
ture and activity of methanogenic populations in rice field soil. Appl Environ Microbiol 68, 2484-2494.
Lueders, T., Manefield, M. and Friedrich, M.W. (2004a) Enhanced sensitivity of DNA- and rRNA-based
stable isotope probing by fractionation and quantitative analysis of isopycnic centrifugation gradients.
Environmental Microbiology 6, 73-78.
Lueders, T., Pommerenke, B. and Friedrich, M.W. (2004b) Stable-Isotope Probing of Microorganisms
Thriving at Thermodynamic Limits: Syntrophic Propionate Oxidation in Flooded Soil. Appl Environ
Microbiol 70, 5778-5786.
Macy, J.M., Santini, J.M., Pauling, B.V., O'Neill, A.H. and Sly, L.I. (2000) Two new arsenate/sulfate-
reducing bacteria: mechanisms of arsenate reduction. Archives of Microbiology 173, 49-57.
Madigan, M.T., Martinko, J.M. and Parker, J. (2003) Biology of Microorganisms. Prentice Hall Interna-
tional Inc , Upper Saddle River.
Manefield, M., Griffiths, R., McNamara, N.P., Sleep, D., Ostle, N. and Whiteley, A. (2007) Insights into
the fate of a C-13 labelled phenol pulse for stable isotope probing (SIP) experiments. Journal Of Micro-
biological Methods 69, 340-344.
Page 69
Literature
64
Manefield, M., Whiteley, A.S., Ostle, N., Ineson, P. and Bailey, M.J. (2002) Technical considerations for
RNA-based stable isotope probing: an approach to associating microbial diversity with microbial com-
munity function. Rapid Communications In Mass Spectrometry 16, 2179-2183.
Mannisto, M.K. and Haggblom, M.M. (2006) Characterization of psychrotolerant heterotrophic bacteria
from Finnish Lapland. Syst Appl Microbiol 29, 229-243.
Martin, P.A., Gundersen-Rindal, D., Blackburn, M. and Buyer, J. (2007) Chromobacterium subtsugae sp.
nov., a betaproteobacterium toxic to Colorado potato beetle and other insect pests. Int J Syst Evol Micro-
biol 57, 993-999.
Matthies, C., Kuhner, C.H., Acker, G. and Drake, H.L. (2001) Clostridium uliginosum sp. nov., a novel
acid-tolerant, anaerobic bacterium with connecting filaments. Int J Syst Evol Microbiol 51, 1119-1125.
McInerney, M.J., Sieber, J.R. and Gunsalus, R.P. (2009) Syntrophy in anaerobic global carbon cycles.
Curr Opin Biotechnol 20, 623-632.
McInerney, M.J., Struchtemeyer, C.G., Sieber, J., Mouttaki, H., Stams, A.J., Schink, B., Rohlin, L. and
Gunsalus, R.P. (2008) Physiology, ecology, phylogeny, and genomics of microorganisms capable of
syntrophic metabolism. Ann N Y Acad Sci 1125, 58-72.
Meisinger, D.B., Zimmermann, J., Ludwig, W., Schleifer, K.H., Wanner, G., Schmid, M., Bennett, P.C.,
Engel, A.S. and Lee, N.M. (2007) In situ detection of novel Acidobacteria in microbial mats from a
chemolithoautotrophically based cave ecosystem (Lower Kane Cave, WY, USA). Environ Microbiol 9,
1523-1534.
Mori, K., Kim, H., Kakegawa, T. and Hanada, S. (2003) A novel lineage of sulfate-reducing microorgan-
isms: Thermodesulfobiaceae fam. nov., Thermodesulfobium narugense, gen. nov., sp. nov., a new ther-
mophilic isolate from a hot spring. Extremophiles 7, 283-290.
Moura, I., Bursakov, S., Costa, C. and Moura, J.J.G. (1997) Nitrate and nitrite utilization in sulfate-
reducing bacteria. Anaerobe 3, 279-290.
Muyzer, G., Teske, A., Wirsen, C.O. and Jannasch, H.W. (1995) Phylogenetic relationships of Thiomi-
crospira species and their identification in deep-sea hydrothermal vent samples by denaturing gradient gel
electrophoresis of 16S rDNA fragments. Arch Microbiol 164, 165-172.
Nanninga, H.J. and Gottschal, J.C. (1987) Properties of Desulfovibrio carbinolicus sp. nov. and Other
Sulfate-Reducing Bacteria Isolated from an Anaerobic-Purification Plant. Appl Environ Microbiol 53,
802-809.
Neufeld, J., Dumont, M., Vohra, J. and Murrell, J. (2007a) Methodological Considerations for the Use of
Stable Isotope Probing in Microbial Ecology. Microbial Ecology 53, 435.
Neufeld, J.D., Vohra, J., Dumont, M.G., Lueders, T., Manefield, M., Friedrich, M.W. and Murrell, J.C.
(2007b) DNA stable-isotope probing. Nat Protocols 2, 860.
Ng, W.V., Kennedy, S.P., Mahairas, G.G., Berquist, B., Pan, M., Shukla, H.D., Lasky, S.R., Baliga, N.S.,
Thorsson, V., Sbrogna, J., Swartzell, S., Weir, D., Hall, J., Dahl, T.A., Welti, R., Goo, Y.A., Leithauser,
B., Keller, K., Cruz, R., Danson, M.J., Hough, D.W., Maddocks, D.G., Jablonski, P.E., Krebs, M.P.,
Angevine, C.M., Dale, H., Isenbarger, T.A., Peck, R.F., Pohlschroder, M., Spudich, J.L., Jung, K.W.,
Alam, M., Freitas, T., Hou, S., Daniels, C.J., Dennis, P.P., Omer, A.D., Ebhardt, H., Lowe, T.M., Liang,
P., Riley, M., Hood, L. and DasSarma, S. (2000) Genome sequence of Halobacterium species NRC-1.
Proc Natl Acad Sci U S A 97, 12176-12181.
Novak, M., Mitchell, M.J., Jackova, I., Buzek, F., Schweigstillova, J., Erbanova, L., Prikryl, R. and Fot-
tova, D. (2007) Processes affecting oxygen isotope ratios of atmospheric and ecosystem sulfate in two
contrasting forest catchments in Central Europe. Environmental Science & Technology 41, 703-709.
Odom, J.M. and Peck, H.D., Jr. (1984) Hydrogenase, electron-transfer proteins, and energy coupling in
the sulfate-reducing bacteria Desulfovibrio. Annu Rev Microbiol 38, 551-592.
Okabe, S., Kindaichi, T. and Ito, T. (2005) Fate of 14C-labeled microbial products derived from nitrifying
bacteria in autotrophic nitrifying biofilms. Appl Environ Microbiol 71, 3987-3994.
Page 70
Literature
65
Okibe, N. and Johnson, D.B. (2004) Biooxidation of pyrite by defined mixed cultures of moderately
thermophilic acidophiles in pH-controlled bioreactors: significance of microbial interactions. Biotechnol
Bioeng 87, 574-583.
Ouattara, A.S., Patel, B.K., Cayol, J.L., Cuzin, N., Traore, A.S. and Garcia, J.L. (1999) Isolation and
characterization of Desulfovibrio burkinensis sp. nov. from an African ricefield, and phylogeny of Desul-
fovibrio alcoholivorans. Int J Syst Bacteriol 49 Pt 2, 639-643.
Paredes-Cardona, E., Carcano-Montiel, M., Mascarua-Esparza, M.A. and Caballero-Mellado, J. (1988)
[Response of maize to inoculation with Azospirillum brasilense]. Rev Latinoam Microbiol 30, 351-355.
Parshina, S.N., Sipma, J., Nakashimada, Y., Henstra, A.M., Smidt, H., Lysenko, A.M., Lens, P.N., Let-
tinga, G. and Stams, A.J. (2005) Desulfotomaculum carboxydivorans sp. nov., a novel sulfate-reducing
bacterium capable of growth at 100% CO. Int J Syst Evol Microbiol 55, 2159-2165.
Philippot, P., Van Zuilen, M., Lepot, K., Thomazo, C., Farquhar, J. and Van Kranendonk, M.J. (2007)
Early Archaean Microorganisms Preferred Elemental Sulfur, Not Sulfate. Science 317, 1534-1537.
Pruesse, E., Quast, C., Knittel, K., Fuchs, B.M., Ludwig, W., Peplies, J. and Glockner, F.O. (2007)
SILVA: a comprehensive online resource for quality checked and aligned ribosomal RNA sequence data
compatible with ARB. Nucleic Acids Res 35, 7188-7196.
Purdy, K.J., Nedwell, D.B. and Embley, T.M. (2003) Analysis of the sulfate-reducing bacterial and
methanogenic archaeal populations in contrasting Antarctic sediments. Appl Environ Microbiol 69, 3181-
3191.
Rabus, R., Hansen, T.A. and Widdel, F. (2006) Dissimilatory Sulfate- and Sulfur-Reducing Prokaryotes.
In The Prokaryotes: A Handbook on the Biology of Bacteria eds. Dworkin, M., Falkow, S., Rosenberg,
E., Schleifer, K.-H. and Stackebrandt, E. pp.659-768. Singapore: Springer.
Rabus, R., Nordhaus, R., Ludwig, W. and Widdel, F. (1993) Complete oxidation of toluene under strictly
anoxic conditions by a new sulfate-reducing bacterium. Appl Environ Microbiol 59, 1444-1451.
Rao, A.V. and Venkateswarlu, B. (1985) Salt tolerance of Azospirillum brasilense. Acta Microbiol Hung
32, 221-224.
Rasch, P.J., Tilmes, S., Turco, R.P., Robock, A., Oman, L., Chen, C.C., Stenchikov, G.L. and Garcia,
R.R. (2008) An overview of geoengineering of climate using stratospheric sulphate aerosols. Philos
Transact A Math Phys Eng Sci 366, 4007-4037.
Ricke, P., Kolb, S. and Braker, G. (2005) Application of a newly developed ARB software-integrated tool
for in silico terminal restriction fragment length polymorphism analysis reveals the dominance of a novel
pmoA cluster in a forest soil. Appl Environ Microbiol 71, 1671-1673.
Robertson, W.J., Bowman, J.P., Franzmann, P.D. and Mee, B.J. (2001) Desulfosporosinus meridiei sp.
nov., a spore-forming sulfate-reducing bacterium isolated from gasolene-contaminated groundwater. Int J
Syst Evol Microbiol 51, 133-140.
Sahm, K., Knoblauch, C. and Amann, R. (1999) Phylogenetic affiliation and quantification of psychro-
philic sulfate-reducing isolates in marine Arctic sediments. Appl Environ Microbiol 65, 3976-3981.
Sait, M., Davis, K.E. and Janssen, P.H. (2006) Effect of pH on isolation and distribution of members of
subdivision 1 of the phylum Acidobacteria occurring in soil. Appl Environ Microbiol 72, 1852-1857.
Sait, M., Hugenholtz, P. and Janssen, P.H. (2002) Cultivation of globally distributed soil bacteria from
phylogenetic lineages previously only detected in cultivation-independent surveys. Environ Microbiol 4,
654-666.
Saitou, N. and Nei, M. (1987) The neighbor-joining method: a new method for reconstructing phyloge-
netic trees. Mol Biol Evol 4, 406-425.
Sass, A., Rutters, H., Cypionka, H. and Sass, H. (2002) Desulfobulbus mediterraneus sp. nov., a sulfate-
reducing bacterium growing on mono- and disaccharides. Arch Microbiol 177, 468-474.
Sass, H., Overmann, J., Rutters, H., Babenzien, H.D. and Cypionka, H. (2004) Desulfosporomusa poly-
tropa gen. nov., sp. nov., a novel sulfate-reducing bacterium from sediments of an oligotrophic lake. Arch
Microbiol 182, 204-211.
Page 71
Literature
66
Sass, H., Wieringa, E., Cypionka, H., Babenzien, H.D. and Overmann, J. (1998) High genetic and physio-
logical diversity of sulfate-reducing bacteria isolated from an oligotrophic lake sediment. Arch Microbiol
170, 243-251.
Sattley, W.M., Jung, D.O. and Madigan, M.T. (2008) Psychrosinus fermentans gen. nov., sp. nov., a lac-
tate-fermenting bacterium from near-freezing oxycline waters of a meromictic Antarctic lake. FEMS
Microbiol Lett 287, 121-127.
Scheid, D. and Stubner, S. (2001) Structure and diversity of Gram-negative sulfate-reducing bacteria on
rice roots. FEMS Microbiol Ecol 36, 175-183.
Schimel, J. (2004) Playing scales in the methane cycle: from microbial ecology to the globe. Proc Natl
Acad Sci U S A 101, 12400-12401.
Schloss, P.D. and Handelsman, J. (2005) Introducing DOTUR, a computer program for defining opera-
tional taxonomic units and estimating species richness. Appl Environ Microbiol 71, 1501-1506.
Schmalenberger, A., Drake, H.L. and Küsel, K. (2007) High unique diversity of sulfate-reducing pro-
karyotes characterized in a depth gradient in an acidic fen. Environmental Microbiology 9, 1317-1328.
Schutte, U.M., Abdo, Z., Bent, S.J., Shyu, C., Williams, C.J., Pierson, J.D. and Forney, L.J. (2008) Ad-
vances in the use of terminal restriction fragment length polymorphism (T-RFLP) analysis of 16S rRNA
genes to characterize microbial communities. Appl Microbiol Biotechnol 80, 365-380.
Sekiguchi, Y., Muramatsu, M., Imachi, H., Narihiro, T., Ohashi, A., Harada, H., Hanada, S. and Kama-
gata, Y. (2008) Thermodesulfovibrio aggregans sp. nov. and Thermodesulfovibrio thiophilus sp. nov.,
anaerobic, thermophilic, sulfate-reducing bacteria isolated from thermophilic methanogenic sludge, and
emended description of the genus Thermodesulfovibrio. Int J Syst Evol Microbiol 58, 2541-2548.
Shelobolina, E.S., Nevin, K.P., Blakeney-Hayward, J.D., Johnsen, C.V., Plaia, T.W., Krader, P.,
Woodard, T., Holmes, D.E., Vanpraagh, C.G. and Lovley, D.R. (2007) Geobacter pickeringii sp. nov.,
Geobacter argillaceus sp. nov. and Pelosinus fermentans gen. nov., sp. nov., isolated from subsurface
kaolin lenses. Int J Syst Evol Microbiol 57, 126-135.
Shrestha, P.M., Kube, M., Reinhardt, R. and Liesack, W. (2009) Transcriptional activity of paddy soil
bacterial communities. Environ Microbiol 11, 960-970.
Sipos, R., Szekely, A.J., Palatinszky, M., Revesz, S., Marialigeti, K. and Nikolausz, M. (2007) Effect of
primer mismatch, annealing temperature and PCR cycle number on 16S rRNA gene-targetting bacterial
community analysis. FEMS Microbiol Ecol 60, 341-350.
Sizova, M.V., Panikov, N.S., Spiridonova, E.M., Slobodova, N.V. and Tourova, T.P. (2007) Novel facul-
tative anaerobic acidotolerant Telmatospirillum siberiense gen. nov. sp. nov. isolated from mesotrophic
fen. Syst Appl Microbiol 30, 213-220.
Sokolova, T.G., Gonzalez, J.M., Kostrikina, N.A., Chernyh, N.A., Slepova, T.V., Bonch-Osmolovskaya,
E.A. and Robb, F.T. (2004) Thermosinus carboxydivorans gen. nov., sp. nov., a new anaerobic, thermo-
philic, carbon-monoxide-oxidizing, hydrogenogenic bacterium from a hot pool of Yellowstone National
Park. Int J Syst Evol Microbiol 54, 2353-2359.
Spring, S., Jackel, U., Wagner, M. and Kampfer, P. (2004) Ottowia thiooxydans gen. nov., sp. nov., a
novel facultatively anaerobic, N2O-producing bacterium isolated from activated sludge, and transfer of
Aquaspirillum gracile to Hylemonella gracilis gen. nov., comb. nov. Int J Syst Evol Microbiol 54, 99-106.
Spring, S. and Rosenzweig, F. (2006) The genera Desulfitobacterium and Desulfosporosinus : Taxonomy.
The Prokaryotes Third Edition 771 - 786.
Stackebrandt, E., Sproer, C., Rainey, F.A., Burghardt, J., Pauker, O. and Hippe, H. (1997) Phylogenetic
analysis of the genus Desulfotomaculum: evidence for the misclassification of Desulfotomaculum gut-
toideum and description of Desulfotomaculum orientis as Desulfosporosinus orientis gen. nov., comb.
nov. Int J Syst Bacteriol 47, 1134-1139.
Stackebrandt, E.E.E. (2006) Taxonomic parameters revisited: tarnished gold standards. Microbiology
today, 7 - 10.
Page 72
Literature
67
Stamatakis, A.P., Ludwig, T., Meier, H. and Wolf, M.J. (2002) AxML: a fast program for sequential and
parallel phylogenetic tree calculations based on the maximum likelihood method. Proc IEEE Comput Soc
Bioinform Conf 1, 21-28.
Stetter, K.O., Lauerer, G., Thomm, M. and Neuner, A. (1987) Isolation of Extremely Thermophilic Sul-
fate Reducers: Evidence for a Novel Branch of Archaebacteria. Science 236, 822-824.
Tanimoto, Y. and Bak, F. (1994) Anaerobic degradation of methylmercaptan and dimethyl sulfide by
newly isolated thermophilic sulfate-reducing bacteria. Appl Environ Microbiol 60, 2450-2455.
Tapia-Hernandez, A., Mascarua-Esparza, M.A. and Caballero-Mellado, J. (1990) Production of bacterio-
cins and siderophore-like activity by Azospirillum brasilense. Microbios 64, 73-83.
Thauer, R.K., Jungermann, K. and Decker, K. (1977) Energy conservation in chemotrophic anaerobic
bacteria. Microbiol Mol Biol Rev 41, 100-180.
Thauer, R.K., Stackebrandt, E. and Hamilton, W.A. (2007) Sulphate-reducing bacteria: Environmental
and Engineered Systems. Cambridge Univ Press, 1 - 37.
Tu, O., Knott, T., Marsh, M., Bechtol, K., Harris, D., Barker, D. and Bashkin, J. (1998) The influence of
fluorescent dye structure on the electrophoretic mobility of end-labeled DNA. Nucleic Acids Res 26,
2797-2802.
van Houten, B., Roest, K., Tzeneva, V.A., Dijkman, H., Smidt, H. and Stams, A.J.M. (2006) Occurrence
of methanogenesis during start-up of a full-scale synthesis gas-fed reactor treating sulfate and metal-rich
wastewater. Water Research 40, 553-560.
von Wintzingerode, F., Gobel, U.B. and Stackebrandt, E. (1997) Determination of microbial diversity in
environmental samples: pitfalls of PCR-based rRNA analysis. FEMS Microbiol Rev 21, 213-229.
Wagner, M., Loy, A., Klein, M., Lee, N., Ramsing, N.B., Stahl, D.A. and Friedrich, M.W. (2005) Func-
tional marker genes for identification of sulfate-reducing prokaryotes. In Environmental Microbiology.
pp.469-489. San Diego: Elsevier Academic Press Inc.
Wagner, M., Roger, A.J., Flax, J.L., Brusseau, G.A. and Stahl, D.A. (1998) Phylogeny of dissimilatory
sulfite reductases supports an early origin of sulfate respiration. J Bacteriol 180, 2975-2982.
Ward, D.M., Bateson, M.M., Weller, R. and Ruffroberts, A.L. (1992) RIBOSOMAL-RNA ANALYSIS
OF MICROORGANISMS AS THEY OCCUR IN NATURE. Adv Microb Ecol 12, 219-286.
Weber, S., Stubner, S. and Conrad, R. (2001) Bacterial populations colonizing and degrading rice straw in
anoxic paddy soil. Appl Environ Microbiol 67, 1318-1327.
Wen, A., Fegan, M., Hayward, C., Chakraborty, S. and Sly, L.I. (1999) Phylogenetic relationships among
members of the Comamonadaceae, and description of Delftia acidovorans (den Dooren de Jong 1926 and
Tamaoka et al. 1987) gen. nov., comb. nov. Int J Syst Bacteriol 49 Pt 2, 567-576.
Wentrup, C. (2007) Potential identity and abundance of novel and uncultured sulphate-reducing microor-
ganisms in an acidic fen system. In Department of Microbial Ecology at the University of Vienna. p.122.
Göttingen: University of Göttingen.
Whiteley, A.S., Thomson, B., Lueders, T. and Manefield, M. (2007) RNA stable-isotope probing. Nat
Protocols 2, 838-844.
Whitmire, S.L. and Hamilton, S.K. (2005) Rapid removal of nitrate and sulfate in freshwater wetland
sediments. J Environ Qual 34, 2062-2071.
Widdel, F. (1988) Microbiology and ecology of sulfate- and sulfur-reducing bacteria. Biology of anaero-
bic microorganisms A J B Zehnder New York, John Wiley & Sons, 469-585.
Wust, P.K., Horn, M.A. and Drake, H.L. (2009) Trophic links between fermenters and methanogens in a
moderately acidic fen soil. Environ Microbiol.
Young, C.C., Hupfer, H., Siering, C., Ho, M.J., Arun, A.B., Lai, W.A., Rekha, P.D., Shen, F.T., Hung,
M.H., Chen, W.M. and Yassin, A.F. (2008) Azospirillum rugosum sp. nov., isolated from oil-
contaminated soil. Int J Syst Evol Microbiol 58, 959-963.
Zhou, Y., Wei, W., Wang, X., Xu, L. and Lai, R. (2009) Azospirillum palatum sp. nov., isolated from
forest soil in Zhejiang province, China. J Gen Appl Microbiol 55, 1-7.
Page 73
Literature
68
Zon, L.I., Dorfman, D.M. and Orkin, S.H. (1989) The polymerase chain reaction colony miniprep. Bio-
techniques 7, 696-698.
Zverlov, V., Klein, M., Lucker, S., Friedrich, M.W., Kellermann, J., Stahl, D.A., Loy, A. and Wagner, M.
(2005) Lateral gene transfer of dissimilatory (bi)sulfite reductase revisited. J Bacteriol 187, 2203-2208.
Page 74
Abbreviations
69
7 List of abbreviations
% percent
°C degrees celsius
µ micro
16S rRNA small subunit of rRNA
ARB software package for phylogenetic analyses
ATP adenosine-5'-triphosphate
BLAST basic local alignment search tool
bp base pair
C carbon
cm centimetre
cm³ cubic centimetre
CO2 carbon dioxide
conc. concentration
CsCl caesium chloride
CSTFA caesium Trifluoroacetate
DEPC diethylpyrocarbonate
DNA desoxyribonuleic acid
dNTP desoxy-nucleotide-tri-phosphate
DSR dissimilatory (bi-)sulphite-reductase
dsrAB gene encoding the α- und β- subunit of DSR
E.coli Escherichia coli
E0 reduction potential
EDTA ethylenediaminetetraacetic acid
EtBr ethidium bromide
FAM fluorescein
Fig. figure
FISH fluorescence in situ hybridization
g gram
GC mol% guanine and cytosine
h hours
H2O water
H2S hydrogen sulphide
kbp kilo base pairs
LB Luria Bertani
M molar
m milli
Page 75
Abbreviations
70
m² square metre
MgCl2 magnesium chloride
min. minutes
mL millilitre
mm millimetre
mV millivolts
N nitrogen
Na sodium
NaCl sodium chloride
NaOH sodium hydroxide
nD refractive index
neg. negative
ng nanogram
nm nanometre
o.n. over night
OTU operational taxonomic unit
p.A. per analysis
PCR polymerase chain reaction
PEG polyethyleneglycol
pH cologarithm of dissolved hydrogen ions
pos. positive
qPCR quantitative PCR
RNA ribonucleic acid
rpm rounds per minute
RT-PCR reverse transcription PCR
S sulphur
sec. seconds
SIP stable isotope probing
SO4-2
sulphate ion
SRP sulphate reducing prokaryotes
Tab. table
TAE Tris-acetate-EDTA
Taq DNA-polymerase from Thermus aquaticus
TBE Tris-boric acid-EDTA
T-RF terminal restriction fragment
T-RFLP terminal restriction fragment polymorphism
Tris trishydroxymethylaminomethane
UV ultra violet
v/v volume per volume
w/v weight per volume
x g gravitational force
Page 76
Appendix
71
8 Appendix
calibration curve nD vs. Density (CsCl)
y = 7.8586x2 - 10.996x + 1.6823
R2 = 0.9998
1.50
1.55
1.60
1.65
1.70
1.75
1.80
1.85
1.90
1.95
2.00
1.3800 1.3850 1.3900 1.3950 1.4000 1.4050 1.4100 1.4150 1.4200
refractive index nD
Den
sity
g/c
m³
calibration curve nD vs. density (CsTFA)
y = 359.02x2 - 959.73x + 642.73
R2 = 0.9887
1.72
1.74
1.76
1.78
1.80
1.82
1.84
1.86
1.3700 1.3705 1.3710 1.3715 1.3720 1.3725 1.3730 1.3735 1.3740 1.3745
refractive index nD
Density
g/c
m³
Fig. 25 Calibration curves for calculating densities out of refractive index nD with refractometry
from CsCl and CsTFA gradients
Page 77
Appendix
72
a)
b)
c)
Page 78
Appendix
73
d)
e)
f)
Page 79
Appendix
74
g)
Fig.26 Agarose gel pictures from the amplification of the bacterial 16S rRNA gene out of
isopycnic gradient centrifugations from the a) zero control, b) 2 weeks with and c) without sul-
phate d) 2 months with and e) without sulphate and f) 6 months with and g) without sulphate
incubations. Numbers given are densities in g cm-3
.
Fig.27 T-RFLP profiles of test plasmids harbouring 16S rRNA sequences digested with restric-
tion enzyme MspI
Page 80
Appendix
75
Fig.28 T-RFLP profiles of single clones derived from the 16S rRNA clone library of the 2 months
fraction. S_II_2 refers to the sulphate induced incubation, S_II_5 refers to the the control incu-
bation. Numbers given are bp.
Page 81
Appendix
76
Table 17: Phylogenetic affiliations and numbers of bacterial 16S rRNA clones retrieved from
16S rRNA gene-libraries of examined 2 months incubations. T-RF lengths given originate from
in silico analysis. Corresponding empirically determined T-RF lengths of single clones are
shown in italic. If determined, sizes given in the text refer to empiric values.
13
C-substrates + sulfate a
13C-substrates only
b
Phylogenetic lineage Clones (%)
T-RF (bp) Clones (%)
T-RF (bp)
Firmicutes Desulfosporosinus spp. Acidaminococcaceae
20 6
140 (136), 171
292 (292)
― 13
―
290, 292 (292)
Acidobacteria Subgroup 1 Subgroup 2 Subgroup 3 Subgroup 6 Subgroup 8 Subgroup 13
16 7 7 ― 1 ―
94 (89), 95, 267
83, 289 (288), 499 68,140 (136), 146,
149, 150 278 ―
21 3 6 1 ― 1
95 (89), 97, 265
289 (288) 140(136), 150(147), 152, 263
292 ―
153
Proteobacteria Alpha-Proteobacteria Acetobacteraceae Rhodospirillaceae Azospirillum spp. Rhizobiales unclassified Beta-Proteobacteria Chromobacterium Gamma-Proteobacteria Nevskia/Hydrogenophaga Delta-Proteobacteria Geobacter spp. Desulfovibrio spp. Desulfobulbacaea uncultured
4 8 1 2 1 3
― 3 1 1 ―
110 (105) 439 (437)
445 445, 152
67
81, 430, 494
―
130 (126), 163 505 164 ―
― 14 10 3 1 3 3 5 ― ― 1
― 439 (437)
66, 118, 129(126), 130, 437 118, 160
67
430, 494, 495
490, 492
130 (126), 161 ― ― 78
Actinobacteria Acidimicrobiaceae Acidothermaceae Rubrobacteriaceae
5 1 1
70, 82, 139, 170
146 142
6 ― ―
70, 139, 150
― ―
a in total 95 clones; additional clones present in Nitrospirae, Spirochaeta, Planctomycetes, OP10, unclassified
b in total 80 clones, additional clones present in Bacteroidetes, Spirochaeta, Planctomycetes, OP10, OD1, Elusimicrobia, Cyanobac-
taria
Page 82
Appendix
77
Table 18: All bacterial 16S rRNA gene sequences obtained out of the 2 months incubation clustered into OTUs of 95% sequence similarity. Clones used for cal-
culations of phylogenetic affiliations are in bold print. Affiliations are based on neighbour joining trees calculated in ARB. S_II_2 refers to the sulphate amended
incubation, S_II_5 refers to the control incubation.
OTU name
# of
clones Clones Phylum Next Blastn Hit (ACC) next cultivated representative
Similarity(%) with next
cultivated representative
16S-SIP-5.18 6
SII_5_75,SII_5_17,SII_5_101,SII_5_3,
SII_5_36,SII_5_92 Acidobacteria FJ625318 Acidobacteria bacterium Ellin7137 94
16S-SIP-2.2 5
SII_2_10,SII_2_63,SII_2_105,SII_2_89
SII_2_107 Acidobacteria FJ625318 Acidobacteria bacterium Ellin7137 94
16S-SIP-2.20 5
SII_2_32,SII_2_87,SII_2_73,SII_2_75,
SII_2_40 Acidobacteria FJ625365 Candidatus Koribacter versatilis 92
16S-SIP-5.5 4 SII_5_3,SII_5_55,SII_5_22,SII_5_71 Acidobacteria FJ625318 Acidobacteria bacterium Ellin7137 94
16S-SIP-2.11 3 SII_2_17,SII_2_56,SII_2_49 Acidobacteria AB262726 Acidobacteria bacterium Ellin7148 88
16S-SIP-2.14 2 SII_2_20,SII_2_76 Acidobacteria EF019891 Acidobacteria bacterium KBS 96 93
16S-SIP-2.19 2 SII_2_29,SII_2_82 Acidobacteria FJ466259 Acidobacteria bacterium Ellin7148 94
16S-SIP-2.23 2 SII_2_37,SII_2_55 Acidobacteria FJ625310 Bacterium K-5b2 96
16S-SIP-2.32 2 SII_2_90,SII_2_104 Acidobacteria FJ466226 Bacterium Ellin5237 96
16S-SIP-5.7 2 SII_5_6,SII_5_74 Acidobacteria AM773947 Acidobacteria bacterium Ellin7137 92
16S-SIP-5.17 2 SII_5_31,SII_5_72 Acidobacteria EU445207 Solibacter usitatus Ellin6076 95
16S-SIP-5.19 2 SII_5_40,SII_5_80 Acidobacteria FJ625310 Bacterium K-5b2 96
16S-SIP-5.20 2 SII_5_29,SII_5_83 Acidobacteria EU360064 Bacterium K-5b2 93
16S-SIP-2.3 1 SII_2_11 Acidobacteria AM162430 H.foetida strain TMBS4-T 91
16S-SIP-2.22 1 SII_2_34 Acidobacteria EF492962 Solibacter usitatus Ellin6076 94
16S-SIP-2.25 1 SII_2_43 Acidobacteria AJ292582 Solibacter usitatus Ellin6076 92
16S-SIP-2.31 1 SII_2_103 Acidobacteria AM162428 Acidobacteria bacterium Ellin7184 94
16S-SIP-2.33 1 SII_2_106 Acidobacteria FJ625320 Acidobacteria bacterium KBS 96 94
16S-SIP-2.38 1 SII_2_38 Acidobacteria EF019053 Solibacter usitatus Ellin6076 93
16S-SIP-2.39 1 SII_2_57 Acidobacteria FJ624912 Acidobacteria bacterium Ellin7184 90
16S-SIP-2.42 1 SII_2_47 Acidobacteria EU399672 Acidobacteria bacterium KBS 96 92
16S-SIP-2.37 1 SII_2_91 Acidobacteria AM773947 Acidobacteria bacterium Ellin7137 92
Page 83
Appendix
78
OTU name
# of
clones Clones Phylum Next Blastn Hit (ACC) next cultivated representative
Similarity(%) with next
cultivated representative
16S-SIP-5.1 1 SII_5_1 Acidobacteria EU335384 H.foetida strain TMBS4-T 82
16S-SIP-5.6 1 SII_5_5 Acidobacteria EF019342 Solibacter usitatus Ellin6076 94
16S-SIP-5.12 1 SII_5_56 Acidobacteria AB262727 Bacterium Ellin5227 85
16S-SIP-5.16 1 SII_5_70 Acidobacteria EF073672 Acidobacteria bacterium KBS 83 94
16S-SIP-5.23 1 SII_5_87 Acidobacteria EU680438 Acidobacteria bacterium Ellin7184 90
16S-SIP-5.25 1 SII_5_34 Acidobacteria FJ624909 Acidobacteria bacterium Ellin7184 88
16S-SIP-5.27 1 SII_5_105 Acidobacteria AM162423 Solibacter usitatus Ellin6076 92
16S-SIP-5.28 1 SII_5_107 Acidobacteria DQ453805 Acidobacteria bacterium KBS 96 92
16S-SIP-5.33 1 SII_5_17 Acidobacteria FJ625318 Acidobacteria bacterium Ellin7137 94
16S-SIP-5.36 1 SII_5_33 Acidobacteria EU150216 Acidobacteriaceae bacterium Gsoil 969 95
16S-SIP-5.11 3 SII_5_57,SII_5_72,SII_5_108 Actinobacteria EU360030 Actinobacterium BGR 43 92
16S-SIP-2.12 2 SII_2_18,SII_2_80 Actinobacteria AM162469 Actinobacterium BGR 43 95
16S-SIP-2.10 1 SII_2_7 Actinobacteria EU881209 Acidothermus cellulolyticus 88
16S-SIP-2.16 1 SII_2_24 Actinobacteria FJ475379 Solirubrobacter sp. BXN5-15 93
16S-SIP-2.26 1 SII_2_69 Actinobacteria EU360020 Actinobacterium BGR 43 92
16S-SIP-2.35 1 SII_2_85 Actinobacteria EU360030 Actinobacterium BGR 43 92
16S-SIP-2.41 1 SII_2_101 Actinobacteria EF446258 Actinobacterium BGR 43 92
16S-SIP-5.26 1 SII_5_102 Actinobacteria EU044043 Actinobacterium YJF2-33 92
16S-SIP-5.37 1 SII_5_53 Actinobacteria DQ906070 Actinobacterium BGR 43 94
16S-SIP-5.2 11
SII_5_10,SII_5_77,SII_5_14,SII_5_91,
SII_5_20,SII_5_78,SII_5_8,SII_5_27,
SII_5_59,SII_5_89,SII_5_21 Alphaproteobacteria AF524861 Bacterium K-5b5 100
16S-SIP-2.8 8
SII_2_6,SII_2_65,SII_2_54,SII_2_8,
SII_2_51,SII_2_36,SII_2_42 Alphaproteobacteria DQ094180 Telmatospirillum siberiense 100
16S-SIP-5.8 6
SII_5_7,SII_5_79,SII_5_106,SII_5_9,
SII_5_47,SII_5_26 Alphaproteobacteria DQ660857 Azospirillum sp. S07 95
16S-SIP-2.6 4 SII_2_16,SII_2_93,SII_2_96,SII_2_21 Alphaproteobacteria DQ906080 Acidocella aluminiidurans 97
16S-SIP-2.1 1 SII_2_1 Alphaproteobacteria FM252034 Beijerinckiaceae bacterium BW863 100
Page 84
Appendix
79
OTU name
# of
clones Clones Phylum Next Blastn Hit (ACC) next cultivated representative
Similarity(%) with next
cultivated representative
16S-SIP-2.15 1 SII_2_23 Alphaproteobacteria EF196942alphaproteobacterium endosymbiont 1b
of Inanidrilus makropetalos 91
16S-SIP-2.28 1 SII_2_77 Alphaproteobacteria EU266918 Pedomicrobium manganicum 96
16S-SIP-2.40 1 SII_2_68 Alphaproteobacteria EU491294alphaproteobacterium endosymbiont 1b
of Inanidrilus makropetalos 91
16S-SIP-5.4 1 SII_5_2 Alphaproteobacteria EF494345 Bacterium Ellin6089 95
16S-SIP-5.14 1 SII_5_61 Alphaproteobacteria AM773974 Bacterium Ellin5299 92
16S-SIP-5.29 1 SII_5_111 Alphaproteobacteria EU491294alphaproteobacterium endosymbiont 1b
of Inanidrilus makropetalos 91
16S-SIP-5.31 1 SII_5_96 Alphaproteobacteria EU881204 Phyllobacteriaceae bacterium AMV1 91
16S-SIP-5.38 1 SII_5_38 Alphaproteobacteria AM162440 Methylocystis sp. LW5 94
16S-SIP-2.13 3 SII_2_19,SII_2_25,SII_2_74 Betaproteobacteria AM396358 Paludibacterium yongneupense 100
16S-SIP-5.21 3 SII_5_110,SII_5_19,SII_5_85 Betaproteobacteria AM396358 Paludibacterium yongneupense 100
16S-SIP-5.3 4 SII_5_11,SII_5_37,SII_5_67,SII_5_49 Deltaproteobacteria FJ479238 Geobacter bemidjiensis 97
16S-SIP-2.7 1 SII_2_2 Deltaproteobacteria AY921969 Geobacter sp. Ply1 97
16S-SIP-2.17 1 SII_2_27 Deltaproteobacteria AY607219 Geobacter bemidjiensis 97
16S-SIP-2.27 1 SII_2_70 Deltaproteobacteria DQ205193 Desulfovibrio putealis strain B7-43 97
16S-SIP-2.30 1 SII_2_67 Deltaproteobacteria EU542434 Sulfate-reducing bacterium STP23 97
16S-SIP-2.43 1 SII_2_71 Deltaproteobacteria AY922036 Pelobacter propionicus 97
16S-SIP-5.22 1 SII_5_86 Deltaproteobacteria EU335338 Geobacter sp. FRC-32 84
16S-SIP-2.4 19
SII_2_12,SII_2_48,SII_2_52,SII_2_35,
SII_2_41,SII_2_30,SII_2_94,SII_2_92,
SII_2_46,SII_2_4,SII_2_45,SII_2_95
SII_2_3,SII_2_88,SII_2_5,SII_2_84,
SII_2_13,SII_2_15,SII_2_22,SII_2_28 Firmicutes EU981221 Desulfosporosinus sp. 44a-T3a 98
16S-SIP-5.10 9
SII_5_43,SII_5_68,SII_5_84,SII_5_28,
SII_5_12,SII_5_44,SII_5_76,SII_5_81,
SII_5_54 Firmicutes AB486409 Psychrosinus fermentans strain FCF9 96
16S-SIP-2.21 6
SII_2_33,SII_2_44,SII_2_26,SII_2_50,
SII_2_64 Firmicutes AM159306 Pelosinus sp. UFO1 97
16S-SIP-5.34 1 SII_5_18 Firmicutes AB486393 Low G+C Gram-positive bacterium TR1 99
16S-SIP-5.9 2 SII_5_39,SII_5_64 Gammaproteobacteria FJ625378 Gammaproteobacterium CH43 94
16S-SIP-2.5 1 SII_2_14 Nitrospirae EF492940 Stigmatella aurantiaca 95
Page 85
Appendix
80
OTU name
# of
clones Clones Phylum Next Blastn Hit (ACC) next cultivated representative
Similarity(%) with next
cultivated representative
16S-SIP-2.9 1 SII_2_9 Nitrospirae EF464628 Thermodesulfovibrio yellowstonii 88
16S-SIP-2.18 1 SII_2_28 Nitrospirae FM956249 Magnetobacterium bavaricum 87
16S-SIP-5.15 1 SII_5_63 OD1 EF516850 Oscillatoriales cyanobacterium UVFP2 75
16S-SIP-2.29 2 SII_2_61,SII_2_62 OP10 EU266864 Thermincola carboxydiphila strain 2204 82
16S-SIP-5.24 1 SII_5_32 OP10 EF075557 Candidate division OP10 bacterium Gsoil 348 91
16S-SIP-5.32 1 SII_5_13 Planctomyces AY963300 Planctomycetales bacterium Ellin7244 92
16S-SIP-2.34 1 SII_2_83 Planctomycetes EF075416 Planctomycetacia bacterium WSF3-27 92
16S-SIP-2.36 1 SII_2_86 Spirochaeta AB234282 Spirochaeta sp. TM3 97
16S-SIP-5.13 1 SII_5_60 Spirochaeta AB234282 Spirochaeta sp. TM3 97
16S-SIP-5.30 1 SII_5_95 TG1 AB280391 Actinobacterium YJF1-30 80
16S-SIP-5.35 1 SII_5_25 uncultured DQ223200 Gloeobacter violaceus PCC 7421 84
16S-SIP-2.24 2 SII_2_39,SII_2_72 uncultured EF018887 Thermoanaerobacter tengcongensis 85
Page 86
Appendix
81
Table 18. All dsrAB sequences obtained out of the 2 months incubation clustered into OTUs of 90% amino acid sequence similarity. Clones used for calculations
of phylogenetic affiliations are in bold print. Affiliations are based on neighbour joining trees calculated in ARB. dsrS_II_2 refers to the sulphate amended incuba-
tion, dsrS_II_5 refers to the control incubation.
OTU name # of clones Clones Next relative Habitat Next Blastn Hit
dsrSIP 1 2 dsrSII_2_6,dsrSII_2_15 Uncultured sulfate-reducing bacterium clone OTU-20
anoxic paddy soil FJ472883
dsrSIP 2 3 dsrSII_2_9,dsrSII_2_52,dsrSII_2_58 Uncultured sulfate-reducing bacterium clone W17
metalliferous organic soil DQ855255
dsrSIP 3 8 dsrSII_2_27,dsrSII_2_28,dsrSII_5_9,dsrSII_2_38dsrSII_2_91,dsrSII_5_4,dsrSII_5_25,dsrSII_5_15
Uncultured prokaryote clone dsrSbII-3 Schlöppnerbrunnen fen soil AY167467
dsrSIP 4 11
dsrSII_2_35,dsrSII_2_45,dsrSII_5_13, dsrSII_2_47,dsrSII_2_61,dsrSII_2_93, dsrSII_5_45,dsrSII_2_89,dsrSII_5_21, dsrSII_5_53,dsrSII_5_10
Uncultured sulfate-reducing bacterium clone W3
metalliferous organic soil DQ855249
dsrSIP 5 2 dsrSII_2_49,dsrSII_5_17 Uncultured prokaryote clone dsrSbII-3 Schlöppnerbrunnen fen soil AY167467
dsrSIP 6 2 dsrSII_2_50,dsrSII_2_101 Uncultured sulfate-reducing bacterium clone W3
metalliferous organic soil DQ855249
dsrSIP 7 2 dsrSII_2_54,dsrSII_5_16 Uncultured sulfate-reducing bacterium clone W3
metalliferous organic soil DQ855249
dsrSIP 8 1 dsrSII_2_57 Uncultured sulfate-reducing bacterium clone W3
metalliferous organic soil DQ855249
dsrSIP 9 2 dsrSII_2_71,dsrSII_5_30 Uncultured prokaryote clone dsrSbII-3 Schlöppnerbrunnen fen soil AY167467
dsrSIP 10 1 dsrSII_2_73 Uncultured sulfate-reducing bacterium clone W6
metalliferous organic soil DQ855250
dsrSIP 11 2 dsrSII_2_79,dsrSII_2_80 Uncultured sulfate-reducing bacterium clone W3
metalliferous organic soil DQ855249
dsrSIP 12 1 dsrSII_2_88 Uncultured sulfate-reducing bacterium clone DSRIV-4
Aarhus bay sediment FM179973
dsrSIP 13 6 dsrSII_2_92,dsrSII_5_8,dsrSII_5_28,dsrSII_5_40dsrSII_5_46,dsrSII_5_26
Uncultured sulfate-reducing bacterium clone W3
metalliferous organic soil DQ855249
dsrSIP 14 1 dsrSII_5_3 Uncultured prokaryote clone dsrSbII-34 Schlöppnerbrunnen fen soil AY167468
dsrSIP 15 1 dsrSII_5_14 Uncultured sulfate-reducing bacterium clone OTU-20
anoxic paddy soil FJ472883
dsrSIP 16 1 dsrSII_5_47 Uncultured sulfate-reducing bacterium W3
metalliferous organic soil DQ855249
Page 87
Curriculum vitaes
82
9 Curriculum Vitae
May 10, 1982 Geboren in Hainburg/Donau, Österreich
Juni 2000 Matura am Bundesrealgymnasium Bruck/Leitha,
Österreich
Oktober, 2000 – Oktober 2001 Studium der Lebensmittel- und Biotechnologie an der
Universität für Bodenkultur Wien, Österreich
Oktober 2001 – Februar 2010 Studium der Molekularen Biologie an der Universität
Wien, Österreich
Page 88
Acknowledgements
83
10 Acknowledgements
First of all, I would like to thank Michael Pester for supporting and guiding me through
the experimental and theoretical work throughout this diploma thesis.
Alexander Loy and Michael Wagner for giving me the opportunity for this diploma the-
sis at DOME as well as supporting my work.
Christian Baranyi for being a patient sequencer.
The whole DOME team, especially the people from the upper lab, for giving me a relax-
ing and funny working time and for always having a helping hand.
My family for supporting me in many aspects throughout my whole university time.
And of course all my friends for listening to my scientific stories, although not under-
standing a lot of the vocabulary I used.
Page 89
84
Abgrenzung der eigenen Arbeitsleistung
Sämtliche Arbeiten dieser Diplomarbeit wurden eigenständig erbracht, mit Ausnahme
der Probenvorbereitung, Alignment der 16S rRNA und dsrAB Sequenzen, Mini- bzw.
Kochpräp der E. coli Klone, sowie der Berechnung der phylogenetischen Stammbäume.
Diese Arbeitsschritte wurden unter Mithilfe von Dr. Michael Pester (Department of
Microbial Ecology, Universität Wien) durchgeführt.
Wien, Dezember 2009 (Bittner Norbert)