5
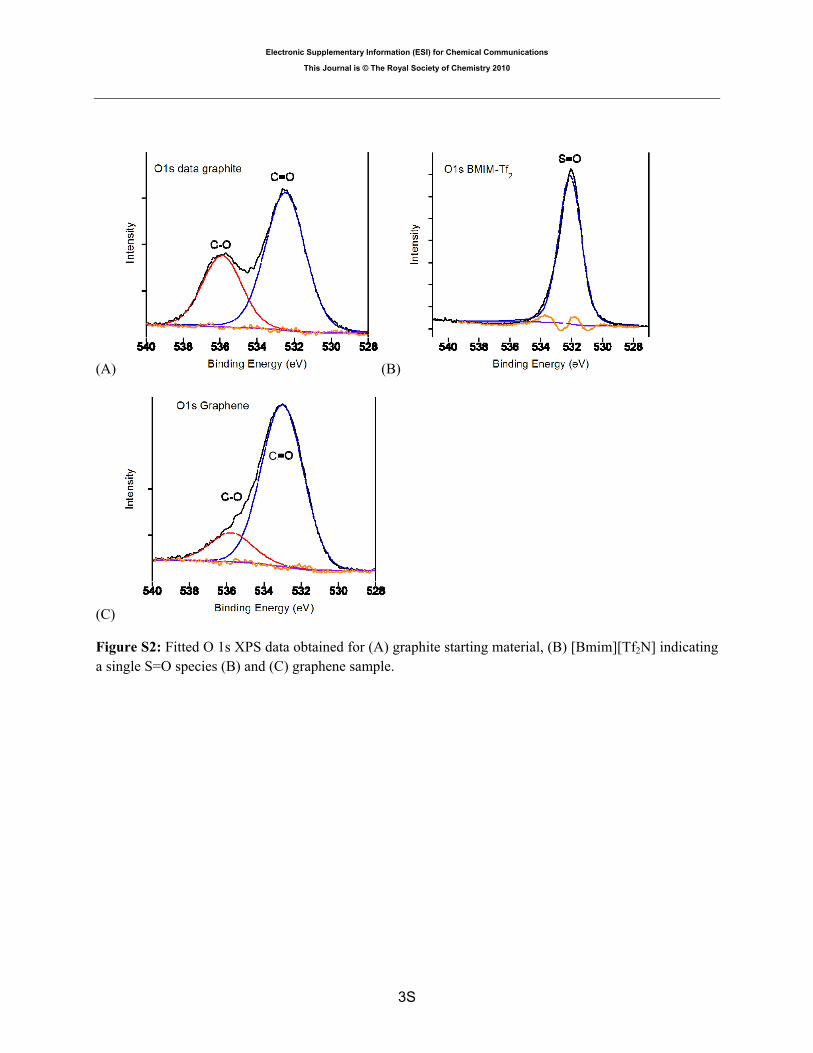
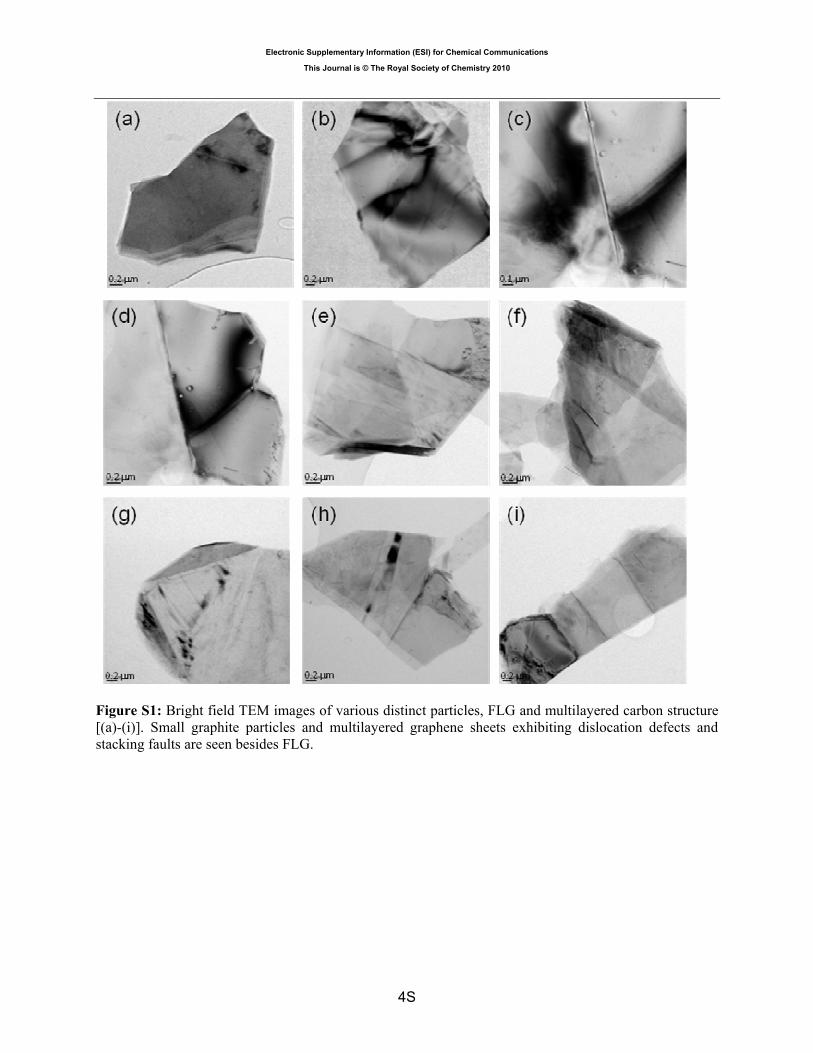
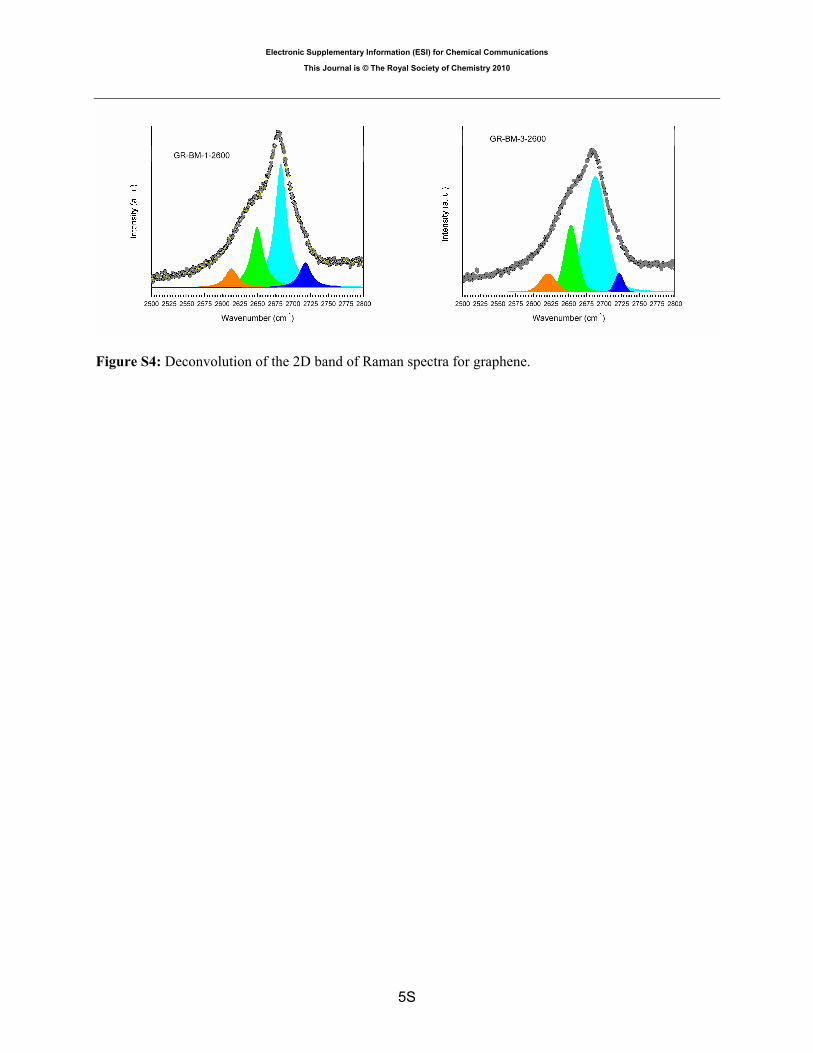
Electronic Supplementary Information (ESI) for Chemical Communications This Journal is © The Royal Society of Chemistry 2010 1S Direct exfoliation of natural graphite into micrometer size few layers graphene sheets using ionic liquids Xiqing Wang, a Pasquale F. Fulvio, a Gary A. Baker, a Gabriel M. Veith, b Raymond R. Unocic, b and Shannon M. Mahurin, a Miaofang Chi, b and Sheng Dai* a Characterization: X-ray photoelectron spectroscopy (XPS) data were collected using a PHI 3056 spectrometer with an Al anode source operated at 15 kV and an applied power of 350 W. Graphite and dry graphene samples were manually pressed between two pieces of Indium foil instead of a carbon tape as support to avoid any contributions to the carbon and oxygen signals from the tape itself. The piece of Indium foil with the sample on it was then mounted to the sample holder and the experimental energy shifts were corrected relative to C1s a 284.8 eV (J. F. Moulder et al., Perkin-Elmer Corp., Ed. J. Chastain, 1992). An inert gold cup was used to hold a sample of the IL used in these experiments. High resolution data (for least squares fitting of the peaks) was collected at a pass energy of 5.85 eV with 0.05 eV step sizes and a minimum of 100 scans to improve the signal to noise ratio; lower resolution survey scans (atomic concentration data) were collected at a pass energy of 93.5 eV with 0.5 eV step sizes and a minimum of 25 scans. Data were analyzed using the PHI MultiPak suite of programs and standard sensitivity factors applied for each element. For TEM characterization, an aliquot of the concentrated ethanolic graphene suspension was further diluted with additional ethanol and briefly homogenized in an ultrasonic bath. A drop of the final suspension was transferred to a lacy carbon coated 200-mesh copper TEM grid and dried in ambient air prior to electron microscopy analysis. Specimens were then characterized using a Hitachi HD-2000 operating in STEM mode using a secondary electron (SE) and/or bright-field STEM detector operating at 200 kV. TEM imaging and selected area diffraction patterns of the FLG were acquired with a Hitachi HF3300 TEM operating at 300 kV. The FLG possessed a small number of defects such as dislocations and stacking faults when imaged under diffraction contrast TEM imaging conditions. For Raman measurements, graphene samples were prepared by drop coating onto a clean glass substrate. Raman spectra were collected using a Renishaw system 1000 Raman spectrometer equipped with an integral microscope (Leica DMLMS/N). Excitation was provided by a 25-mW He-Ne laser (Renishaw) and the 632.8 nm excitation beam was focused onto the sample with a 50× objective; the laser power at the sample was approximately 3 mW. The backscattered Raman light was collected with the same 50× objective and focused into a Peltier cooled charge-coupled device (CCD) camera (400 × 600 pixels). An edge filter removed background from the Rayleigh scattered light, while a holographic grating (1800 grooves/mm) and a 50 μm slit permitted a spectral resolution of ~ 1 cm -1 . A silicon wafer with a Raman band at 520 cm −1 was used to calibrate the spectrometer and the accuracy of the spectral measurements was estimated to be better than 1 cm −1 .