1 Direct Investigation of the Birefringent Optical Properties of Black Phosphorus with Picosecond Interferometry Wei Zheng, Andrei Nemilentsau, Dustin Lattery, Peipei Wang, Tony Low, Jie Zhu, * and Xiaojia Wang * W. Zheng, D. Lattery, Dr. J. Zhu, Prof. X. Wang Department of Mechanical Engineering, University of Minnesota, Minneapolis, MN 55455, USA E-mail: [email protected] & [email protected]Dr. A. Nemilentsau, Prof. T. Low Department of Electrical and Computer Engineering, University of Minnesota, Minneapolis, MN 55455, USA Dr. P. Wang Department of Physics, Southern University of Science and Technology, Shenzhen, Guangdong 518055, China Keywords: black phosphorus; picosecond interferometry; birefringent optical constants; Brillouin scattering; anisotropic optical absorption Abstract: Black phosphorus (BP) is an emerging two-dimensional semiconducting material with great potential for nanoelectronic and nanophotonic applications, especially owing to its unique anisotropic electrical and optical properties. Many theoretical studies have predicted the anisotropic optical properties of BP, but the direct experimental quantification remains challenging. The difficulties stem from the ease of BP’s degradation when exposed to air in ambient conditions, and from the indirect nature of conventional approaches that are subject to large measurement uncertainties. This work reports a direct investigation of the birefringent optical constants of
Transcript
1
Direct Investigation of the Birefringent Optical Properties of Black
Phosphorus with Picosecond Interferometry
Wei Zheng, Andrei Nemilentsau, Dustin Lattery, Peipei Wang, Tony Low, Jie Zhu,* and Xiaojia
Wang*
W. Zheng, D. Lattery, Dr. J. Zhu, Prof. X. Wang
Department of Mechanical Engineering, University of Minnesota, Minneapolis, MN 55455, USA
Department of Electrical and Computer Engineering, University of Minnesota, Minneapolis, MN
55455, USA
Dr. P. Wang
Department of Physics, Southern University of Science and Technology, Shenzhen, Guangdong
518055, China
Keywords: black phosphorus; picosecond interferometry; birefringent optical constants; Brillouin
scattering; anisotropic optical absorption
Abstract: Black phosphorus (BP) is an emerging two-dimensional semiconducting material with
great potential for nanoelectronic and nanophotonic applications, especially owing to its unique
anisotropic electrical and optical properties. Many theoretical studies have predicted the
anisotropic optical properties of BP, but the direct experimental quantification remains challenging.
The difficulties stem from the ease of BP’s degradation when exposed to air in ambient conditions,
and from the indirect nature of conventional approaches that are subject to large measurement
uncertainties. This work reports a direct investigation of the birefringent optical constants of
2
micrometer-thick BP samples with picosecond (ps) interferometry, over the wavelength range
from 780 to 890 nm. In this ps-interferometry approach, an ultrathin (~5 nm) platinum layer for
launching acoustic waves naturally protects the BP flake from degradation. The birefringent
optical constants of BP for light polarization along the two primary crystalline orientations, zigzag
and armchair, are directly obtained via fitting the attenuated Brillouin scattering signals. A bi-
exponential model is further proposed to analyze the BS signals for a random incident light
polarization. The BP experimental results and the associated measurement sensitivity analysis
demonstrate the reliability and accuracy of the ps-interferometry approach for capturing the
polarization-dependent optical properties of birefringent materials.
3
TOC
Black phosphorus (BP) is an emerging two-dimensional semiconducting material with unique anisotropic optical properties. This work reports a direct investigation of the birefringent optical constants of BP with picosecond interferometry in the near-infrared regime. The birefringent optical constants of BP for light polarization along zigzag and armchair directions are obtained via analyzing the attenuated Brillouin scattering signals.
4
1. Introduction
Black phosphorus (BP) has become increasingly promising as an emerging two-dimensional (2D)
material with great potential for optical and electrical applications.[1-10] It is formed as a stack of
parallel 2D sheets with adjacent layers under van der Waals interactions.[11-14] This structure makes
BP easy to be mechanically exfoliated into monolayer or few-layer BP flakes, allowing for its
integration with nanoscale devices.[1,4,15-16] The bandgap energy of BP depends on its number of
layers and can be tuned from 0.3 (bulk BP) to 1.0 eV (monolayer).[17-18] BP has an orthorhombic
structure with in-plane covalent bonding, with its characteristic zigzag (ZZ) and armchair (AC)
crystal orientations. The unique atomic puckering crystal structure, resulting from the sp3
nonequivalent hybridization of each P atom, leads to the robust in-plane anisotropy nature of BP.[19]
Previous studies have shown strong anisotropy of BP in its physical properties, along high-
symmetry ZZ and AC directions, including thermal,[20-23] electrical,[24-25] and optical
properties.[3,19,26-29] The bandgap tunability, high mobility[4] and anisotropic nature of BP makes it
a potential competitor against other well-studied 2D materials, such as graphene and molybdenum
disulfide,[30-33] as a promising candidate for next-generation nanoelectronic and nanophotonic
devices. In addition, conventional birefringent optics are typically bulky due to the inherently weak
birefringence. Black phosphorus, in conjunction with plasmonic effects, would also enable strong
tunable birefringence with atomically thin material.[34] Especially, the birefringent mid-infrared
optical response in black phosphorus is exceptionally large compared to conventional birefringent
non-cubic crystals such as barium borate, calcite, ruby etc., which only features a differential
optical index of ~0.1[9,24]. Birefringence is used in many optical devices,[35] such as liquid crystal
displays, where the display brightness is controlled via polarized light through a birefringent
material. Another example is wave plates which are widely used in free-space optics measurement.
5
To advance the future potential of BP for nanophotonic devices,[2-5,36-37] precise
characterization of the birefringent optical constants of BP crystals is of great importance. To date,
there have been literature studies reporting the optical properties of BP, both theoretical[24,38-41]
and experimental.[9,19,28-30] These studies have indicated one unique feature of BP, that its
extinction coefficient (, the imaginary part of the complex refractive index), is strongly dependent
on its crystalline orientation. The absorption is the strongest when the incident light is polarized
along the AC direction, and the weakest when the light is polarized along the ZZ direction.[24,38-41]
Experimental investigation of BP is challenging because of its degradable nature when
exposed to air. As a result, conventional spectroscopic studies usually require special controlled
environments or protective approaches.[27,30] For example, in the spectroscopic and phase-
anisotropy measurements, BP thin films were supported on a transparent substrate (glass or
sapphire) and coated with a thin layer of Poly(methyl methacrylate) (PMMA) for protection.[27]
Both the substrates and protective layers would also contribute to the reflection and transmission
signals, and therefore induce more complexities and uncertainties in analyzing the experimental
data. Other than that, in spectroscopic measurements, BP samples need to be ultrathin (tens of
nanometers) for sufficient light transmission, since BP is highly absorbing for certain light
polarization.[3,19,27,30] As an indirect approach for obtaining the optical constants ( and n, the real
part of the refractive index), conventional spectroscopic methods need precise information about
the thickness of BP and the protective/supporting layers. This will introduce not only additional
thickness characterizations but also measurement uncertainties in the extracted optical constants.[39]
Another indirect method based on the electron energy loss spectroscopy (EELS), has also been
employed for optically characterizing 100~200-nm-thick BP films.[29] In this method, a high
vacuum chamber at the temperature of ~20 K was applied to minimize thermal broadening in
6
signals, with the assumption that the measured results would not be temperature dependent.[29]
These aforementioned challenges in previous studies make it difficult to directly and precisely
obtain the birefringent optical constants of BP.
In this study, we synthesize high-quality large crystals of BP and employ picosecond (ps)
interferometry to study the birefringent in-plane optical properties of BP that are micrometers in
thickness. Our ps-interferometry method is upgraded from a basic ultrafast all-optical pump-probe
setup,[42] which captures the Brillouin scattering (BS) signals from the acoustic wave propagation
within the micrometer-thick BP. The interference of probe beams, reflected from the BP surface
and from the moving acoustic wave front inside of BP, allows for the direct manifestation of the
birefringent optical absorption of BP from the attenuated BS signals. We obtain reliable values of
the polarization-dependent optical constants of BP by coating each BP flake with a 5-nm platinum
(Pt) transducer, which is used to launch acoustic waves and naturally prevents the contamination
and degradation of the BP crystal.
2. Picosecond Interferometry
The birefringent in-plane optical constants of BP flakes are characterized with ps
interferometry, which is a modified pump-probe method for measuring acoustic wave propagation
and attenuation.[43-46] Prior to ps-interferometry measurements, each BP sample is coated with a
semitransparent thin film. In this work, BP flakes with size on the order of a few microns are
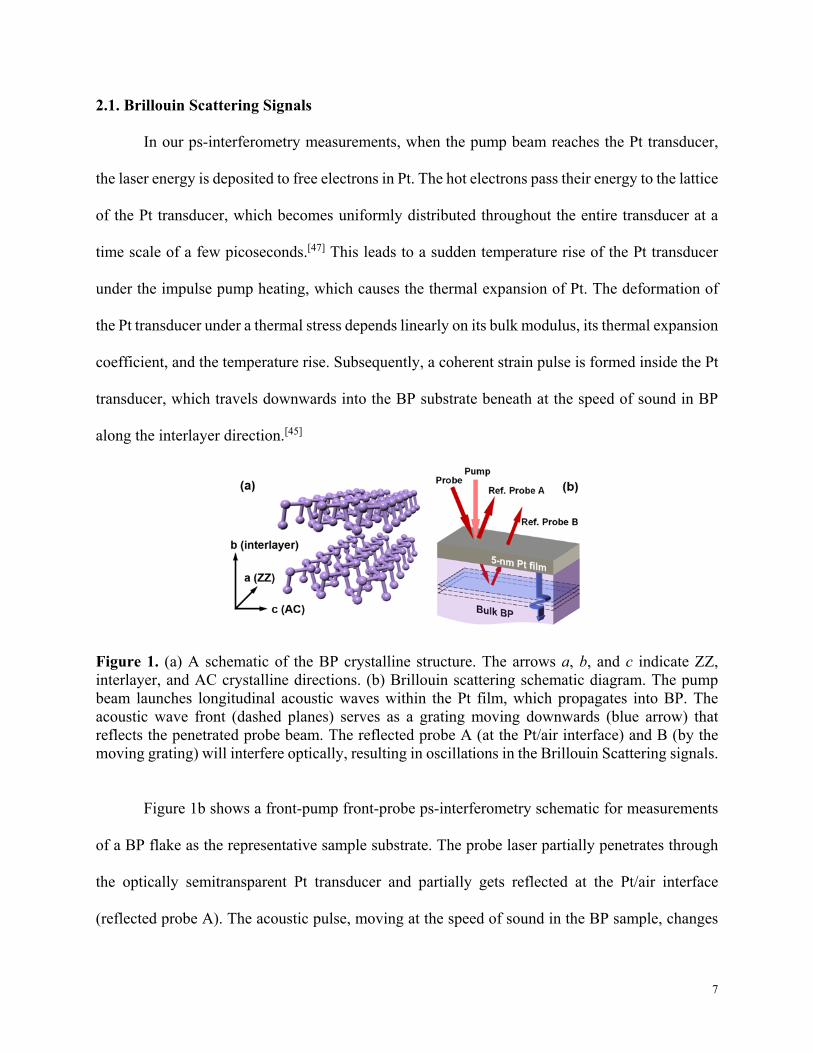
mechanically exfoliated and placed on silicon wafers. Figure 1a depicts the layered structure of
BP, with the three crystalline directions denoted as a (zigzag or ZZ), b (interlayer or through-
plane), and c (armchair or AC). A 5-nm Pt layer is deposited on the surface of BP flake to act as
the transducer.
7
2.1. Brillouin Scattering Signals
In our ps-interferometry measurements, when the pump beam reaches the Pt transducer,
the laser energy is deposited to free electrons in Pt. The hot electrons pass their energy to the lattice
of the Pt transducer, which becomes uniformly distributed throughout the entire transducer at a
time scale of a few picoseconds.[47] This leads to a sudden temperature rise of the Pt transducer
under the impulse pump heating, which causes the thermal expansion of Pt. The deformation of
the Pt transducer under a thermal stress depends linearly on its bulk modulus, its thermal expansion
coefficient, and the temperature rise. Subsequently, a coherent strain pulse is formed inside the Pt
transducer, which travels downwards into the BP substrate beneath at the speed of sound in BP
along the interlayer direction.[45]
Figure 1. (a) A schematic of the BP crystalline structure. The arrows a, b, and c indicate ZZ, interlayer, and AC crystalline directions. (b) Brillouin scattering schematic diagram. The pump beam launches longitudinal acoustic waves within the Pt film, which propagates into BP. The acoustic wave front (dashed planes) serves as a grating moving downwards (blue arrow) that reflects the penetrated probe beam. The reflected probe A (at the Pt/air interface) and B (by the moving grating) will interfere optically, resulting in oscillations in the Brillouin Scattering signals.
Figure 1b shows a front-pump front-probe ps-interferometry schematic for measurements
of a BP flake as the representative sample substrate. The probe laser partially penetrates through
the optically semitransparent Pt transducer and partially gets reflected at the Pt/air interface
(reflected probe A). The acoustic pulse, moving at the speed of sound in the BP sample, changes
8
its local optical constants (n and ) through the nonlinear acousto-optic effect.[48] This local change
in the optical properties of BP acts as a moving grating (dashed planes in Figure 1b) which can
scatter light, and is also commonly known as Brillouin scattering.[49] When the transmitted probe
laser arrives at the instantaneous location of the acoustic wave, it will be partially reflected back
due to BS, as the reflected probe B shown in Figure 1b. These two reflected probe beams (A and
B) can interfere with each other constructively or destructively depending on the instantaneous
location of the acoustic wave. The oscillation of the reflectance signal due to this interference can
be captured by the ps-interferometry system (in-phase signal in time-domain thermoreflectance
measurements).[46,50-52] To obtain the optical constants of the material via analyzing the
interference data, several periods of the oscillating signals need to be collected.
Figure 2 depicts a typical BS signal (black line), performed on the sample stack of 5-nm Pt
on BP with the incident light being polarized along the ZZ crystalline direction. The BS signal is
plotted after the thermal background (VBG, red line in the inset of Figure 2) is subtracted from the
original signal (Vin, black line in the inset of Figure 2). It should be noted that we use a rapid scan
with a time constant of 0.7 s over a long-range of time delay (up to 2 ns) for data collection to
generate Figure 2. For ps-interferometry measurements to determine the optical constants of BP
(as shown in Figures 5 and 6 to be discussed later), we use a higher time constant of 1.2 s to
improve the signal-to-noise ratio for data collection of up to 300 ps.
As the acoustic wave propagates through the entire BP flake and reaches the interface
between BP flake and thermal tape, the acoustic wave is reflected at the interface with an acoustic
wave reflection coefficient ac s t s t( ) / ( )r Z Z Z Z , where Zt and Zs are the acoustic impedance
(defined as the product of material density and speed of sound) of the thermal tape and BP sample,
respectively. The lower acoustic impedance of the thermal tape will cause a shift in the acoustic
9
wave at the interface, and the phase shift will produce a negative peak in the thermal background
signal. As shown in the inset of Figure 2, the negative peak at ~1340 ps indicates that the acoustic
wave has returned to the top surface. This can also be confirmed by the bumpy feature of the BS
signal at ~1340 ps in Figure 2, which results from the enhanced interference signal when the
acoustic wave front moves back to the top surface.
Figure 2. A representative BS signal from 5-nm Pt/BP after subtracting the thermal background (VBG, red line in the inset) from the original ps-interferometry signal (Vin, black line in the inset). The incident light is polarized along the ZZ direction. The blue dashed lines indicate the boundaries of the BS wave packet. The amplitude of BS oscillations reaches the minimum at ~670 ps, due to the strongest BP absorption of Probe B before it gets reflected by the acoustic wave traveling to the BP/tape interface. When the acoustic wave returns to the top surface at ~1340 ps, the amplitude of BS oscillations increases again due to the reduced optical path of Probe B in BP. The negative peak of the red curve at ~1340 ps in the inset of Figure 2 indicates that the acoustic wave has reached the BP/tape interface and is reflected to the sample surface during one measurement.
2.2. Theoretical Model
The physics of ps interferometry has been well-understood for non-absorbing media.[43,45,47]
The frequency and attenuation rate of the oscillating signal, shown in Figure 2, depends on the
optical properties of the sample. For a normal incident angle, the change in reflection R has two
components that can be described as a function of time delay and the material properties by
10
2 2 2so sound o o sound sound
22 cos( )
nv tR r r r r r r
, (1)
where ro and rsound are the Fresnel reflection coefficients of the probe metal transducer reflection
and the probe acoustic wave reflection, t is time, vs is the speed of sound, is the phase shift, and
n is the refractive index. The term |ro|2 is the change in thermoreflectance signal caused by the
excitation process, and the middle term on the right-hand side of Eq. 1 is the oscillation in
thermoreflectance signal caused by the constructive or destructive interference in the reflected
probe laser. The oscillation frequency is directly related to the speed of sound in the substrate
medium and the refractive index. In order to separate the two reflection components and focus
solely on analyzing the oscillation, the excitation process signal is extracted by applying a second-
order Savitzky-Golay smoothing filter with points in a window of delay-time longer than the
oscillation period. The thermal background signal due to pump excitation is then subtracted from
the original signal to obtain the pure BS oscillation signal. For bulk absorbing media such as BP,
light absorption contributes to the attenuation of the oscillation amplitude. In this case, the full-
level of oscillation attenuation includes both acoustic wave decay and light absorption, which can
be expressed as
D s( )exp( )exp( )cos(2 )R S t t nv t , ( 2 )
where S() is the BS coefficient, D is the acoustic wave decay rate, and is the optical absorption
decay rate, which relates with the absorption coefficient and the speed of sound as vs.[43]
By fitting the oscillation signals from ps interferometry, the extinction coefficient can be
obtained via =4 .
The two exponential decay constants (andD) cannot be separately observed in the
experiment even though they are caused by different mechanisms. However, the exponential decay
11
of the acoustic wave in the propagation medium is usually very slow in comparison to the time
scale of the measurement. The slowly decaying acoustic wave was observed in the BS oscillation
signals of glass and SiO2 in previous studies,[42-43] suggesting the signal decay due to the acoustic
wave damping can be neglected. In our experiments, we have also verified this assumption in BP.
When the probe light polarization is aligned along the ZZ direction, BP should exhibit the least
amount of light absorption. Thus, the impact of acoustic wave decay should be more significant in
the attenuation in this case. However, as shown in Figure 2, compared to the amplitude of the first
oscillation (1.36 V), the 45% of the oscillation remains at the time delay of ~ 1340 ps (0.61 V).
This 55% reduction in the oscillation amplitude at ~1340 ps includes the contributions from both
the mechanical damping of the acoustic wave and the acoustic wave transmission at the BP/tape
interface. The mechanical damping decay is an order of magnitude lower than the light absorption
decay, where only 3% of the oscillation is captured at ~670 ps (0.04 V). The optical penetration
depth is estimated to be 3.2 m, corresponding to a time delay of 670 ps. This confirms that the
acoustic wave exponential decay rate is much slower than the optical absorption decay rate in BP.
Therefore, we omit the acoustic wave decay rate D in our data analysis and only consider the
decay due to optical absorption.
2.3. Sensitivity Analysis
To better illustrate the effectiveness of the optical property measurement through ps-
interferometry, we calculate the sensitivity of the measurement signals to different parameters. In
ps interferometry, since the measurement signal is oscillating in nature, the sensitivity is defined
as the normalized signal in in( ) / max( ) /S x V V x x , where Vin is the in-phase signal and
inmax( )V is the maximum value of the measured Vin, taken as the amplitude of the first BS
12
oscillation peak. x represents one of the parameters that the measurement is sensitive to, including
the optical decay , oscillation frequency f, and the phase shift. In the calculations of S, a small
perturbation of 0.2% is introduced for all the /x x , and the calculated S does not change when
this perturbation is further reduced.
Figure 3. The ps-interferometry signal sensitivities to optical absorption decay (or , red line), frequency f (or n, blue line), and phase shift (black line). The value of used in the plots are (a) 0.21 and (b) 0.04, respectively, as two representative values of the extinction coefficient of BP along the AC and ZZ directions.
Examples of the calculated sensitivities are plotted as functions of time delay in Figure 3.
The value of n is set as 3.8 (from the averaged frequency of the oscillating BS signals) for all the
sensitivity analysis, while the values of are 0.21 (AC) and 0.04 (ZZ) in Figures 3a and b,
respectively. It can be clearly seen that the sensitivity itself also oscillates, and the measurement
is very sensitive to both the frequency f (related to the refractive index n) and the phase shift .
The signal of ps interferometry is less sensitive to the extinction coefficient compared to f (or n)
and . When is lower, the sensitivity to or maintains a certain value throughout the first
1000 ps of time delay as shown in Figure 3b (red line). This is favorable to the extraction of a
-3
0
3
6
0 200 400 600
-20
0
20
S ()
Sf (n)
S
Sen
sitiv
ity
Time Delay (ps)
(a)
(b)
13
precise value. For the higher- case in Figure 3a, though the sensitivity to (red line) attenuates
to almost zero before 200 ps of time delay, the amplitudes of these sensitivity oscillations at the
first few periods are apparently higher than those of the lower- case, which already provides
sufficient data for a reliable fitting. Thus, the sensitivity analysis justifies the robustness of our ps-
interferometry method for determining the optical properties regardless the high or low values of
for various materials.
The duration of time delay at which the measurements have sufficient sensitivities also
determines the necessary sample thickness to gather enough data via ps interferometry. For
example, in both cases plotted in Figure 3, the periods of the wavy feature and the signal sensitivity
to same to) are both sufficiently high during the first 200 ps. This suggests that a sample
thickness of ~1 m, obtained as the product of time duration (~200 ps) and speed of sound
(~5 nm ps1), is adequate to gather useful data for reliable measurements.
Compared with conventional spectroscopic approaches,[53-55] ps interferometry has several
advantages. The thin transducer for launching acoustic waves naturally serves as a protective layer,
preventing BP from rapid degradation. It can directly measure the optical constants of anisotropic
materials and extract both n and simultaneously from reflectance only. Thus, optical absorption
measurements by ps interferometry do not require information about the sample thickness, as
typically it can directly probe without knowing the optical transmission of the sample.[45]
3. Results and Discussion
3.1. Sample Structure
Single crystals of bulk BP are synthesized using a low-pressure synthesis technique.[56] In
Figure 4a, no impurity phase is observed in the X-ray diffraction (XRD) patterns, which suggests
14
the presence of only a single phase of BP. Only the (0 k 0) reflections can be recognized (k = 2, 4,
or 6), which confirms that the crystal surface normal direction is parallel to the b axis, and the
sheets are parallel to the a–c plane. To determine the in-plane orientations of BP, we measured the
[061] planes using XRD following the approach detailed in Ref. [20]. The results are consistent
with literature studies showing that the narrow width of the ribbon-like BP flake is along the
armchair direction (c axis), and the longer length of the ribbon-like BP flake corresponds to the
zigzag direction (a axis). Figure 4b illustrates an (Atomic Force Microscope) AFM image scanned
over a 3 m × 3 m area with a root-mean-square (rms) roughness of 0.9 nm. Figure 4c shows the
BP ribbon exfoliated from the bulk BP (inset picture) with notation of the in-plane crystalline
directions. Figure 4d depicts an optical image of the measured BP sample surface, which suggests
a long-range flatness.
Figure 4. (a) The powder XRD 2 scan of the BP sample revealing the [0 2 0], [0 4 0] and [0 6 0] crystalline planes. (b) The AFM image of BP flake on a Si substrate. (c) Optical microscopic image of the ribbon-like BP flake. The dashed lines indicate the BP flake exfoliated from the bulk crystal
15
(inset). (d) The microscopic image of the measured BP sample surface, which suggests a long-range flatness.
3.2. Polarization-Dependent Optical Constants of BP
BP has been observed to have the highest (lowest) optical absorption when the incident
light is linearly polarized aligned along its AC (ZZ) direction.[3,19,27-28] In this experiment, the light
polarization along the ZZ direction is defined as 0, and that along the AC direction is defined as
90. When the linearly polarized light is aligned along either the ZZ or AC crystal direction, the
optical constants can be directly extracted from the experimental data based on Eq. 2. Using the
reported speed of sound value 4.76 nm ps1 in BP along the interlayer direction,[57-58] the extracted
refractive index n is 3.77 ± 0.19 at a wavelength of = 783 nm, which agrees well with reported
values of 3.83 from literature (within 2% difference).[29] And the values of n show very weak
dependence on incident light polarization, which confirms the previous observations on the
nanometer-thick BP films with a light wavelength in the near infrared.[3,26] At the same time, the
absorption coefficients along the ZZ and AC directions can also be extracted by fitting the BS
signals with Eq. 2. A strong anisotropy of BP absorption is observed as consistent with previous
theoretical predictions and indirect measurements of BP optical constants.[3,39] We further
determine the extinction coefficients for both directions using , and the fitted ZZ and AC are
0.027 ± 0.008 and 0.210 ± 0.063 respectively. These results on micron-thick BP are consistent
with the reported values on 100~200-nm film of 0.017 and 0.210 at this wavelength that were
indirectly obtained via EELS measurements.[29]
At an arbitrary polarization angle between 0 and 90, Eq. 2 is not sufficient to describe the
birefringent behavior of BP, and the combined absorption of ZZ and AC must be considered. For
linearly polarized light oriented at an arbitrary angle , the intensity of the reflected wave is
16
202S E where 0 is the free space impedance and E is the electric field as a function of the
incident polarization angle. The reflected electric field can be decomposed into two polarization
components as cos sinr x x y y r x yE e E e E E e e . The sum of x and y direction intensity
components is 22
0/ 2rx ryS E E
. In this case, the change in reflectivity at an arbitrary
polarization angle p is
2 2p( ) (0)cos (90)sinR R R . ( 3 )
Experimental data can be fitted by substituting the polarization angle, ZZ and AC into Eq. 3,
which becomes a bi-exponential function similar to Eq. 2:
2p p ZZ s s
2p AC s s
( ) ( )[cos exp( 2 ) cos(2 )
sin exp( 2 ) cos(2 )]
R S v t nv t
v t nv t
. ( 4 )
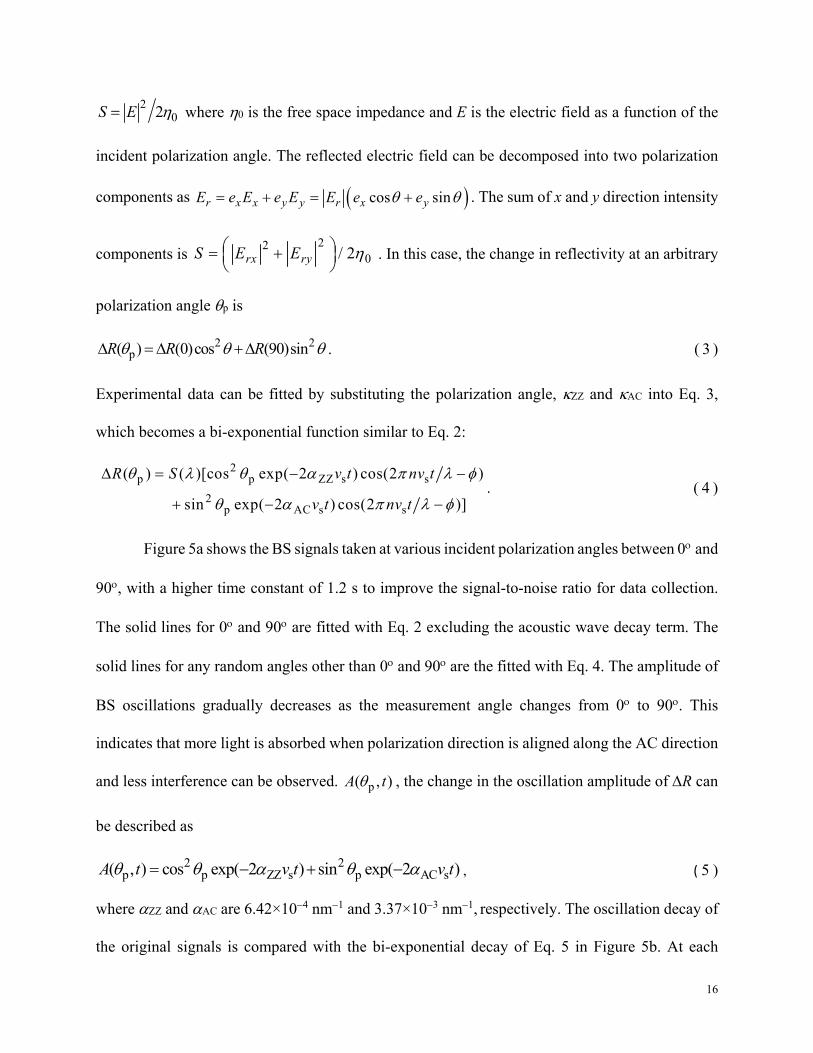
Figure 5a shows the BS signals taken at various incident polarization angles between 0and
90, with a higher time constant of 1.2 s to improve the signal-to-noise ratio for data collection.
The solid lines for 0 and 90 are fitted with Eq. 2 excluding the acoustic wave decay term. The
solid lines for any random angles other than 0 and 90 are the fitted with Eq. 4. The amplitude of
BS oscillations gradually decreases as the measurement angle changes from 0 to 90. This
indicates that more light is absorbed when polarization direction is aligned along the AC direction
and less interference can be observed. p( , )A t , the change in the oscillation amplitude of R can
be described as
2 2p p ZZ s p AC s( , ) cos exp( 2 ) sin exp( 2 )A t v t v t , ( 5 )
where ZZ and AC are 6.42×10⁴ nm1 and 3.37×10³ nm1, respectively. The oscillation decay of
the original signals is compared with the bi-exponential decay of Eq. 5 in Figure 5b. At each
17
incident light polarization angle, the oscillation decay of the signal can be expressed as a function
of the absorption coefficients along both the ZZ and AC polarization directions. This is an excellent
evidence of BP’s linear dichroic characteristics with anisotropic optical absorption, which is a
desired property for future polarization-sensitive optoelectronic devices, such as photodetectors,
field-effect transistors (FET), LEDs, solar cells, displays or optical switches.
Figure 5. Picosecond interferometry signals from BP. (a) The signals subtracted with thermal background VBG at various angles between the ZZ and AC crystalline directions (open symbols). The solid lines represent the best fittings with the models. (b) The amplitude of the oscillations as a function of time delay. The signals are normalized to the first peak. The black open circles are the amplitude of oscillation of the original data, and the red solid lines are bi-exponential calculations from Eq. 5 containing the angular-dependent decaying term.
3.3. Optical Constants of BP Measured at Longer Wavelengths
The ps-interferometry measurements on BP at 835 nm and 890 nm are also conducted as
shown in Figure 6. This is done by tuning the laser wavelength and keeping the wavelength full-
width half maximum to be less than 13 nm while maintaining all other measurement parameters
at their same values. The n and values at 835 nm are 3.70 ± 0.19, 0.156 ± 0.047 for the AC
100 150 200 250 300
90
86
76
66
56
26
16
Vin-V
BG (
a.u.
)
Time Delay (ps)
0
100 200 300 400 500
Time Delay (ps)
46
16
56
76
Nor
mal
ized
Vin (
a.u.
)
(a) (b)
18
direction, and 3.73 ± 0.19, 0.035 ± 0.011 for the ZZ direction. At 890 nm, n and are 3.69 ± 0.19,
0.267 ± 0.080 for the AC direction, and 3.69 ± 0.19, 0.032 ± 0.010 for the ZZ direction. The results
demonstrate BP’s strong linear birefringence of optical absorption in the near infrared region.
Figure 6. The oscillation signals (discrete points) along the AC (a) and ZZ (b) directions obtained at 835 nm and 890 nm. By fitting the experiment data with Eq. 2 (red solid lines), n (c) and (d) values are extracted. Black solid squares are the measured values in the AC direction and solid red circles are the measured values in the ZZ direction. Open blue squares and circles are literature values[29] of the optical constants for BP thin films along AC and ZZ, respectively. The error bars for obtained n and k in this work are 10% and 30%, respectively.
As shown in Figures 6c and 6d, our ps-interferometry data agree reasonably well with the
previous EELS results,[29] with a difference within our measurement uncertainties (note that
measurement error bars are not provided in Ref. [28]). This deviation is presumably caused by the
difference between these two measurement methods, and the sample system variations. In addition,
800 9002
3
4
AC ZZ AC28
ZZ28
n
Wavelength (nm)
60 100 140 180
0.0
0.5
1.0
= 890 nm
Nor
mal
ized
Vin (
a.u.
)
Time Delay (ps)
= 835 nmAC
100 200 300 400 500
0
1
2
= 835 nm
= 890 nm
Nor
mal
ized
Vin (
a.u.
)
Time Delay (ps)
ZZ
800 9000.01
0.02
0.05
0.1
0.2
0.5
Wavelength (nm)
(a)
(b)
(c)
(d)
19
the thicknesses of BP flakes in previous EELS measurements ranged from 100 to 200 nm,[29] while
the thicknesses of our samples are on the order of a few microns. Since BP is known for its
thickness-dependent optical properties, this difference in sample thickness may also account for
discrepancies in the reported values for the optical constants of BP.[38] Here, we also would like to
point it out that we only present the discrete measurement data within near-IR spectrum due to the
limit of operating wavelength range of our Ti-Sapphire ultrafast laser (from 760 to 900 nm).
However, the approach of ps interferometry for studying materials’ optical properties can be
extended to wider spectra by incorporating a laser source with a broad tunable wavelength range[59]
into the system.
4. Conclusion
In summary, a ps-interferometry method is developed to probe the polarization-dependent
optical properties of micrometer-thick BP. This method naturally provides BP with metal-layer
protection against the sample’s degradation caused by the ambient environment, allowing for the
direct measurements of optical properties for the materials of interest with high accuracy. The ps-
interferometry signals of BP along the through-plane direction with different probing wavelengths
(780-890 nm) and polarization directions are obtained. The optical extinction coefficient with the
probe beam being polarized along the AC direction of BP (~0.2) is much higher than that along
the ZZ direction (~0.03). This confirms the linear birefringence of BP at the wavelengths used in
this study. Meanwhile, the refractive index n remains almost constant throughout the range of the
780 to 890 nm wavelengths. For linearly polarized incident light that is not aligned along either
the AC or ZZ crystalline direction, the ps-interferometry signals can be well described by a newly-
developed bi-exponential decay model. Both the measurement results and sensitivity analysis
20
show that the ps-interferometry method is robust for optical measurements on materials with a
wide range of optical properties and thicknesses. The optical absorption data and approach
presented in this work would benefit engineering of future applications of BP. A laser with a broad
tunable spectrum would be able to easily generalize our ps-interferometry approach for studying
the optical properties of other 2D materials over a wide range of optical wavelengths.
5. Experimental Section
Sample preparation: High-quality single crystals of BP are grown with a low-pressure synthesis
technique, which has been described previously.[20] A mixture of 60 mg of Sn (Alfa Aesar, 99.85%),
30.6 mg of SnI4 (Alfa Aesar, 99.998%), and 1.5g of red phosphorus (Alfa Aesar, 98.9%) are
vacuum sealed in a quartz tube with an inner diameter of 12 mm and a length of 25 cm. The sealed
quartz ampoule is placed inside a tube furnace and heated to 650 °C. After maintaining the
temperature at 650 °C for 1 hour, the furnace is cooled for 26.2 hours at a constant rate of 0.22 °C
per minute down to 300 °C, during which time the BP crystals are formed. The BP crystal structure
is examined with powder X-ray diffraction from a Rigaku Smartlab 9 KW with Cu K-α radiation
(λ=1.5406 Å). The BP sample grown by this technique tends to be exfoliated along the ZZ direction.
The bulk sample is mechanically exfoliated into smaller flakes and fixed onto a silicon substrate
with a thermally conductive tape.
Optical measurement method: The picosecond interferometry setup used in this study is modified
from the basic pump-probe setup, which has been described elsewhere.[60-61] The pump and probe
laser beams have a pulse duration of ~0.1 ps and the wavelength are centered at 783, 835, and 890
nm in this study. The laser repetition rate is 80 MHz. The pump laser is modulated by an electro-
21
optic modulator at 9 MHz, and the probe laser is modulated by a mechanical chopper at 200 Hz.
Since the sample flake is small, a 10× objective lens is used to focus the pump laser and the probe
laser onto the sample, which produces 1/e2 beam spot radius of approximately 6 m. The pump
laser power and probe laser power are 5 mW and 5 mW, respectively. To measure the anisotropic
optical properties of BP, a half waveplate mounted on a high precision rotation mount is placed
before the focusing lens to tune the polarization direction of the probe laser. When the waveplate
is rotated by an arbitrary angle (), the probe laser polarization angle is rotated by p = 2. The 1
resolution of the optical mount produces a rotational resolution of 2 for actual measurements. The
reflected probe signal is received by a photodetector and sent to a lock-in amplifier for post data
processing.
References
[1] H. Liu, Y. Du, Y. Deng, D. Y. Peide, Chem. Soc. Rev. 2015, 44, 2732. [2] M. Buscema, D. J. Groenendijk, S. I. Blanter, G. A. Steele, H. S. van der Zant, A. Castellanos-Gomez, Nano Lett. 2014, 14, 3347. [3] H. Yuan, X. Liu, F. Afshinmanesh, W. Li, G. Xu, J. Sun, B. Lian, A. G. Curto, G. Ye, Y. Hikita, Nat. Nanotechnol. 2015, 10, 707. [4] L. Li, Y. Yu, G. J. Ye, Q. Ge, X. Ou, H. Wu, D. Feng, X. H. Chen, Y. Zhang, Nat. Nanotechnol. 2014, 9, 372. [5] N. Youngblood, C. Chen, S. J. Koester, M. Li, Nat. Photonics 2015, 9, 247. [6] M. Engel, M. Steiner, P. Avouris, Nano Lett. 2014, 14, 6414. [7] E. Flores, J. R. Ares, A. Castellanos-Gomez, M. Barawi, I. J. Ferrer, C. Sánchez, Appl. Phys. Lett. 2015, 106, 022102. [8] T. Low, M. Engel, M. Steiner, P. Avouris, Phys. Rev. B 2014, 90, 081408. [9] G. W. Zhang, S. Y. Huang, A. Chaves, C. Y. Song, V. O. Ozcelik, T. Low, H. G. Yan, Nat. Commun. 2017, 8, 14071. [10] J. Kim, S. S. Baik, S. H. Ryu, Y. Sohn, S. Park, B. G. Park, J. Denlinger, Y. Yi, H. J. Choi, K. S. Kim, Science 2015, 349, 723. [11] A. Rodin, A. Carvalho, A. C. Neto, Phys. Rev. Lett. 2014, 112, 176801. [12] R. W. Keyes, Phys. Rev. 1953, 92, 580. [13] A. Morita, Appl. Phys. A-Mater. Sci. Process. 1986, 39, 227. [14] T. Low, A. Chaves, W. Ji, J. Maassen, T. Dumitrica, in 2D Materials: Properties and Devices, (Eds: P. Avouris, T. F. Heinz, T. Low), Cambridge University Press, New York 2017, 381.
22
[15] A. Castellanos-Gomez, L. Vicarelli, E. Prada, J. O. Island, K. Narasimha-Acharya, S. I. Blanter, D. J. Groenendijk, M. Buscema, G. A. Steele, J. Alvarez, 2D Mater. 2014, 1, 025001. [16] Y. Chen, G. Jiang, S. Chen, Z. Guo, X. Yu, C. Zhao, H. Zhang, Q. Bao, S. Wen, D. Tang, D. Fan, Opt. Express 2015, 23, 12823. [17] V. Eswaraiah, Q. Zeng, Y. Long, Z. Liu, Small 2016, 12, 3480. [18] A. N. Rudenko, M. I. Katsnelson, Phys. Rev. B 2014, 89, 201408. [19] N. N. Mao, J. Y. Tang, L. M. Xie, J. X. Wu, B. W. Han, J. J. Lin, S. B. Deng, W. Ji, H. Xu, K. H. Liu, L. M. Tong, J. Zhang, J. Am. Chem. Soc. 2016, 138, 300. [20] J. Zhu, H. Park, J. Y. Chen, X. Gu, H. Zhang, S. Karthikeyan, N. Wendel, S. A. Campbell, M. Dawber, X. Du, Adv. Electron. Mater. 2016, 2, 1600040. [21] A. Jain, A. J. McGaughey, Sci. Rep. 2015, 5, 8501. [22] T.-H. Liu, C.-C. Chang, Nanoscale 2015, 7, 10648. [23] Z. Luo, J. Maassen, Y. Deng, Y. Du, R. P. Garrelts, M. S. Lundstrom, P. D. Ye, X. Xu, Nat. Commun. 2015, 6, 8572. [24] J. Qiao, X. Kong, Z.-X. Hu, F. Yang, W. Ji, Nat. Commun. 2014, 5, 4475. [25] R. Fei, L. Yang, Nano Lett. 2014, 14, 2884. [26] X. M. Wang, S. F. Lan, Adv. Opt. Photonics 2016, 8, 618. [27] S. F. Lan, S. Rodrigues, L. Kang, W. S. Cai, ACS Photonics 2016, 3, 1176. [28] D. Li, H. Jussila, L. Karvonen, G. Ye, H. Lipsanen, X. Chen, Z. Sun, Sci. Rep. 2015, 5, 2045. [29] R. Schuster, J. Trinckauf, C. Habenicht, M. Knupfer, B. Büchner, Phys. Rev. Lett. 2015, 115, 026404. [30] F. Xia, H. Wang, Y. Jia, Nat. Commun. 2014, 5, 4458. [31] F. Bonaccorso, Z. Sun, T. Hasan, A. Ferrari, Nat. Photonics 2010, 4, 611. [32] F. Schwierz, Nat. Nanotechnol. 2010, 5, 487. [33] W. Zhu, T. Low, Y.-H. Lee, H. Wang, D. B. Farmer, J. Kong, F. Xia, P. Avouris, Nat. Commun. 2014, 5, 3087. [34] K. Khaliji, A. Fallahi, L. Martin-Moreno, T. Low, Phys. Rev. B 2017, 95, 201401. [35] M. McCall, I. Hodgkinson, Q. Wu, Birefringent thin films and polarizing elements, Imperial College Press, London 2014. [36] Z. Guo, H. Zhang, S. Lu, Z. Wang, S. Tang, J. Shao, Z. Sun, H. Xie, H. Wang, X.-F. Yu, P. K. Chu, Adv. Funct. Mater. 2015, 25, 6996. [37] S. B. Lu, L. L. Miao, Z. N. Guo, X. Qi, C. J. Zhao, H. Zhang, S. C. Wen, D. Y. Tang, D. Y. Fan, Opt. Express 2015, 23, 11183. [38] T. Low, A. Rodin, A. Carvalho, Y. Jiang, H. Wang, F. Xia, A. C. Neto, Phys. Rev. B 2014, 90, 075434. [39] V. Tran, R. Soklaski, Y. Liang, L. Yang, Phys. Rev. B 2014, 89, 235319. [40] H. Asahina, A. Morita, J. Phys. C: Solid State Phys. 1984, 17, 1839. [41] D. Çakır, H. Sahin, F. M. Peeters, Phys. Rev. B 2014, 90, 205421. [42] K. O’Hara, X. Hu, D. G. Cahill, J. Appl. Phys. 2001, 90, 4852. [43] W. Ma, T. Miao, X. Zhang, M. Kohno, Y. Takata, J. Phys. Chem. C 2015, 119, 5152. [44] C. Thomsen, H. Grahn, H. Maris, J. Tauc, Opt. Commun. 1986, 60, 55. [45] C. Thomsen, H. T. Grahn, H. J. Maris, J. Tauc, Phys. Rev. B 1986, 34, 4129. [46] J. Zhu, X. Wu, D. M. Lattery, W. Zheng, X. Wang, Nanoscale Microscale Thermophys. Eng. 2017, 21, 177. [47] H. N. Lin, R. Stoner, H. Maris, J. Tauc, J. Appl. Phys. 1991, 69, 3816.
23
[48] R. M. White, J. Appl. Phys. 1963, 34, 3559. [49] L. Brillouin, Ann. Phys.(Paris) 1922, 17, 88. [50] D. G. Cahill, Rev. Sci. Instrum. 2004, 75, 5119. [51] J. Zhu, Y. Zhu, X. Wu, H. Song, Y. Zhang, X. Wang, Appl. Phys. Lett. 2016, 108, 231903. [52] J. Zhu, D. W. Tang, W. Wang, J. Liu, K. W. Holub, R. G. Yang, J. Appl. Phys. 2010, 108, 094315. [53] R. Asahi, T. Morikawa, T. Ohwaki, K. Aoki, Y. Taga, Science 2001, 293, 269. [54] N. V. Tkachenko, Elsevier, Oxford 2006, 89. [55] S. Kawata, in Near-Infrared Spectroscopy: Principles, Instruments, Applications, (Eds: H. W. Siesler, Y. Ozaki, S. Kawata, H. M. Heise), John Wiley & Sons, Weinheim 2008, 43. [56] M. Köpf, N. Eckstein, D. Pfister, C. Grotz, I. Krüger, M. Greiwe, T. Hansen, H. Kohlmann, T. Nilges, J. Cryst. Growth 2014, 405, 6. [57] H. Jang, J. D. Wood, C. R. Ryder, M. C. Hersam, D. G. Cahill, Adv. Mater. 2015, 27, 8017. [58] Y. Fujii, Y. Akahama, S. Endo, S. Narita, Y. Yamada, G. Shirane, Solid State Commun. 1982, 44, 579. [59] C. Manzoni, D. Polli, G. Cerullo, Rev. Sci. Instrum. 2006, 77, 023103. [60] C. A. Paddock, G. L. Eesley, J. Appl. Phys. 1986, 60, 285. [61] W. S. Capinski, H. J. Maris, Rev. Sci. Instrum. 1996, 67, 2720.