217 Fahrbach et al. 2001: Polar Research 20(2), 217–224 Direct measurements of volume transports through Fram Strait Eberhard Fahrbach, Jens Meincke, Svein Østerhus, Gerd Rohardt, Ursula Schauer, Vigdis Tverberg & Jennifer Verduin Heat and freshwater transports through Fram Strait are understood to have a significant influence on the hydrographic conditions in the Arctic Ocean and on water mass modifications in the Nordic seas. To determine these transports and their variability reliable estimates of the volume transport through the strait are required. Current meter moorings were deployed in Fram Strait from September 1997 to September 1999 in the framework of the EU MAST III Variability of Exchanges in the Northern Seas pro- gramme. The monthly mean velocity fields reveal marked velocity vari- ations over seasonal and annual time scales, and the spatial structure of the northward flowing West Spitsbergen Current and the southward East Greenland Current with a maximum in spring and a minimum in summer. The volume transport obtained by averaging the monthly means over two years amounts to 9.5 ± 1.4 Sv to the north and 11.1 ± 1.7 Sv to the south (1 Sv = 10 6 m 3 s -1 ). The West Spitsbergen Current has a strong barotropic and a weaker baroclinic component; in the East Greenland Current baro- tropic and baroclinic components are of similar magnitude. The net trans- port through the strait is 4.2 ± 2.3 Sv to the south. The obtained northward and southward transports are significantly larger than earlier estimates in the literature; however, within its range of uncertainty the balance obtained from a two year average is consistent with earlier estimates. E. Fahrbach, G. Rohardt, U. Schauer & J. Verduin, Alfred Wegener Institute for Polar and Marine Research, Box 12 01 61, D-27515 Bremerhaven, Germany; J. Meincke, Institute of Marine Research, University of Hamburg, Troplowitzstr. 7, D-22529 Hamburg, Germany; S. Østerhus, Bjerknes Center, Geophysical Institute, University of Bergen, Allégaten 70, N-5007 Bergen, Norway; V. Tverberg, Nor- wegian Polar Institute, Polar Environmental Centre, N-9296 Tromsø, Norway. Fram Strait is the only deep water passage to the Arctic Ocean. Transports through Fram Strait therefore determine to a large extent the exchanges between the North Atlantic and the Arctic Ocean and consequently influence water mass modifica- tions in the World Ocean. Warm and saline Atlan- tic waters flow through the strait into the Arctic Ocean where they are cooled by heat loss to the atmosphere and freshened mainly by river inflow and mixing with Pacific waters, forming a rela- tively fresh shallow outflow of Polar Waters. For- mation of sea ice increases the salinity of the water column to an extent that saline deep water leaves the Arctic Ocean through Fram Strait to the south. This outflow affects the water mass modifications in the Greenland, Norwegian and Iceland seas and feeds to some extent the overflow into the North Atlantic. Measuring these fluxes is a major requirement to understanding and quan- tifying the turnover rates within the large circula- tion cells of the Arctic and the Atlantic oceans. To this end, combined sea-going and modelling activities are being carried out within the Euro- pean Union MAST III programme Variability of
Transcript
217Fahrbach et al. 2001: Polar Research 20(2), 217–224
Direct measurements of volume transports through Fram Strait
Heat and freshwater transports through Fram Strait are understood to have a significant influence on the hydrographic conditions in the Arctic Ocean and on water mass modifications in the Nordic seas. To determine these transports and their variability reliable estimates of the volume transport through the strait are required. Current meter moorings were deployed in Fram Strait from September 1997 to September 1999 in the framework of the EU MAST III Variability of Exchanges in the Northern Seas pro-gramme. The monthly mean velocity fields reveal marked velocity vari-ations over seasonal and annual time scales, and the spatial structure of the northward flowing West Spitsbergen Current and the southward East Greenland Current with a maximum in spring and a minimum in summer. The volume transport obtained by averaging the monthly means over two years amounts to 9.5 ± 1.4 Sv to the north and 11.1 ± 1.7 Sv to the south (1 Sv = 106 m3s-1). The West Spitsbergen Current has a strong barotropic and a weaker baroclinic component; in the East Greenland Current baro-tropic and baroclinic components are of similar magnitude. The net trans-port through the strait is 4.2 ± 2.3 Sv to the south. The obtained northward and southward transports are significantly larger than earlier estimates in the literature; however, within its range of uncertainty the balance obtained from a two year average is consistent with earlier estimates.
E. Fahrbach, G. Rohardt, U. Schauer & J. Verduin, Alfred Wegener Institute for Polar and Marine Research, Box 12 01 61, D-27515 Bremerhaven, Germany; J. Meincke, Institute of Marine Research, University of Hamburg, Troplowitzstr. 7, D-22529 Hamburg, Germany; S. Østerhus, Bjerknes Center, Geophysical Institute, University of Bergen, Allégaten 70, N-5007 Bergen, Norway; V. Tverberg, Nor-wegian Polar Institute, Polar Environmental Centre, N-9296 Tromsø, Norway.
Fram Strait is the only deep water passage to the Arctic Ocean. Transports through Fram Strait therefore determine to a large extent the exchanges between the North Atlantic and the Arctic Ocean and consequently influence water mass modifica-tions in the World Ocean. Warm and saline Atlan-tic waters flow through the strait into the Arctic Ocean where they are cooled by heat loss to the atmosphere and freshened mainly by river inflow and mixing with Pacific waters, forming a rela-tively fresh shallow outflow of Polar Waters. For-mation of sea ice increases the salinity of the
water column to an extent that saline deep water leaves the Arctic Ocean through Fram Strait to the south. This outflow affects the water mass modifications in the Greenland, Norwegian and Iceland seas and feeds to some extent the overflow into the North Atlantic. Measuring these fluxes is a major requirement to understanding and quan-tifying the turnover rates within the large circula-tion cells of the Arctic and the Atlantic oceans.
To this end, combined sea-going and modelling activities are being carried out within the Euro-pean Union MAST III programme Variability of
218 Direct measurements of volume transports through Fram Strait
Exchanges in the Northern Seas (VEINS), and flux measurements have been achieved by obtain-ing synoptic time series of water and property transports through the key passages. The field measurements in Fram Strait were carried out in cooperation with VEINS partners. The moorings were supplied by the Alfred Wegener Institute, the Norwegian Polar Institute and the University of Hamburg.
Determining heat and salt-/freshwater trans-ports through Fram Strait, and their variability, requires reliable estimates of the volume trans-port. Past estimates of the transport through Fram Strait were achieved in two ways. They were either based on balance calculations for the Arctic Ocean mass, heat and/or dissolved substances using hydrographic measurements (e.g. Östlund & Hut 1984; Rudels 1987; Rudels & Quadfasel 1991; Schlichtholz & Houssais 1999) or on direct
observations of velocities, which are interpolated and extrapolated to obtain transports (Aagaard et al. 1973; Greisman 1976; Hanzlick 1983; Fold-vik et al. 1988). The direct current measurements show a strong barotropic contribution of the West Spitsbergen Current. Morison (1991) documented the seasonal variation of the barotropic flow (2 Sv peak to peak) being of the same order of the mag-nitude as the mean transports. However, all these data sets cover only a part of the strait. Notably, all transport estimates obtained from direct cur-rent observations result in larger values than those derived from balance estimates.
With the warming of the Atlantic Layer in the Arctic Ocean which was observed during the ‘90s (e.g. Quadfasel et al. 1991; Carmack et al. 1995; Zhang et al. 1998), the fluxes through Fram Strait attracted new interest. To distinguish between the effect of variations in the atmosphere—ocean
Fig 1. Map of Fram Strait with the positions of the CTD section (line) and the moorings deployed during VEINS from September 1997 to September 1999 (dots). The location of the observation area is given in the insert, upper right.
219Fahrbach et al. 2001: Polar Research 20(2), 217–224
interaction within the Arctic Ocean and varia-tions which could be induced by changes in the water mass properties or the quantities of the flow through Fram Strait, appropriate measurements are needed. Since a significant inflow into the Arctic Ocean occurs through the Barents Sea, final conclusions can only be drawn if both pas-sages are taken into account.
This paper concentrates on the direct current measurements in Fram Strait and describes the variability of the transports obtained by a two-year-long record. The data from an extensive array of moored current meters allow us for the first time to derive strait-wide transports and to assess the validity of estimates obtained by differ-ent methods and at different time periods.
Data
From September 1997 to September 1998, 14 moorings with 47 instruments were deployed in Fram Strait. One mooring was lost. During the second period, from September 1998 to Septem-ber 1999, 14 current meter moorings were again deployed; all could be recovered (Figs. 1, 2). Since the recovery in 1999 occurred in early September, time series from September 1997 to August 1999 were used for analysis. The moored instruments covered the water column from 10 m above the seabed to approximately 60 m below the surface. The measurements extended from 6° 51’ W, at the eastern Greenland shelf break, to 8° 40’ E, at the western shelf break off Spitsbergen. To avoid as much as possible topographic variations in the strait, the transect was located at its eastern part along 78° 50’ N and at its western part along 79° N. During the first mooring period, from summer 1997 to 1998, 37 complete and 6 partial time series were obtained. For the second period, from summer 1998 to 1999, 44 instruments sup-plied full records. Given the number of available instruments, the optimal coverage of the strait was achieved by a relatively narrow horizontal spac-ing of the moorings over the continental slopes, where strong horizontal gradients were expected, and a wider spacing in the interior. In the deep moorings one instrument was placed in the near surface layer, one in the centre of the Atlantic Water, one in the deep water and one in the near bottom layer. At the upper continental slopes only two or three current meters were needed to obtain a comparable resolution. For more details
see reports by Woodgate et al. (1998), Fahrbach (1999) and Schauer (2000).
The uppermost current meters were Falmouth Scientific (FSI) 3-dimension acoustic current meters with temperature and pressure sensors. The other instruments were Aanderaa rotor cur-rent meters with temperature sensors. Both types of instruments were sent for maintenance and calibration before the deployment and after the recovery to assure the manufacturers’ specifica-tions. Two moorings in the East Greenland Cur-rent were equipped with upward-looking Doppler profiling current meters from Aanderaa. They recorded velocities in six levels between 50 m depth and the sea surface. The accuracy of the velocity data from the Aanderaa rotor current meters amounts to 1 cm/s for a single measure-ment. Threshold problems did not occur because the currents were always above the rotor thresh-olds. The accuracy of the FSI instruments amounts to 0.5 cm/s. The sample rates of both instrument types were set to 1 hour.
Temperature and salinity distributions were obtained with significantly higher spatial resolu-tion by CTD (conductivity, temperature, depth) measurements during the deployment and recov-ery cruises (Fig. 3). At this stage of the work, the temperature and salinity fields are only used to check the consistency of the current fields with the hydrographic features seen in the transect.
The following analysis is based on spatially interpolated monthly mean velocity fields. The obtained values are influenced by the method to derive the fields. Since we approached the method of our calculations stepwise, the numbers given here differ from those presented in earlier ver-
Fig. 2. Vertical transect across Fram Strait with the location of the moored instruments deployed from September 1998 to September 1999. The deployment from September 1997 to September 1998 was instrumented similarly, but mooring F11-1 was lost.
220 Direct measurements of volume transports through Fram Strait
Fig. 3. Vertical transect of (a) the potential temperature in °C and (b) salinity in practical salin-ity units across Fram Strait meas-ured with RV Lance in September 1997. The numbers on top indi-cate the station numbers.
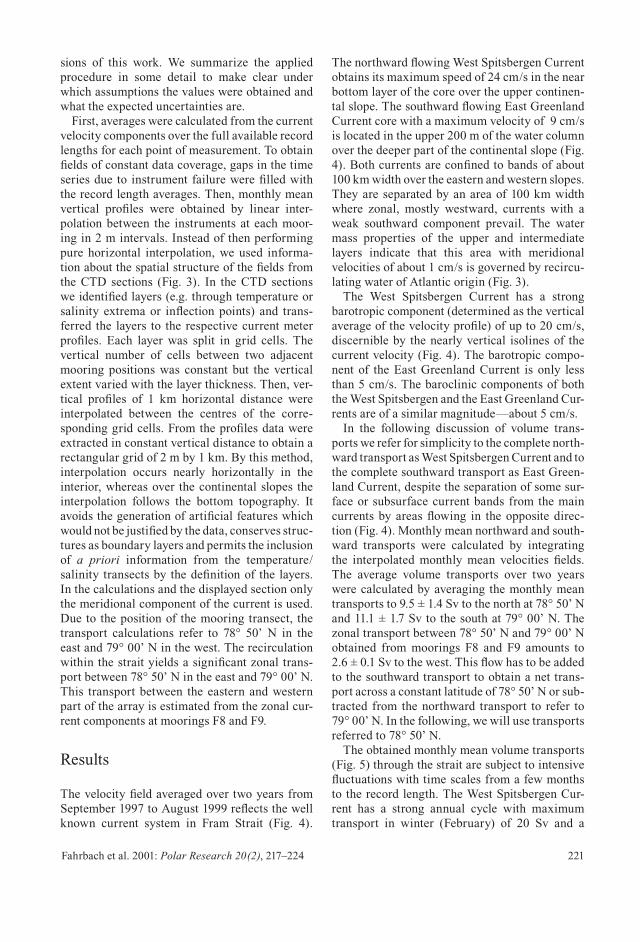
Fig. 4. Vertical transect of the zonal current velocities through Fram Strait averaged over the time period from September 1997 to August 1999. Currents to the north are positive, to the south negative. Areas with cur-rents higher than 5 cm/s are shaded. The numbers on top indicate the mooring numbers.
(a)
(b)
221Fahrbach et al. 2001: Polar Research 20(2), 217–224
sions of this work. We summarize the applied procedure in some detail to make clear under which assumptions the values were obtained and what the expected uncertainties are.
First, averages were calculated from the current velocity components over the full available record lengths for each point of measurement. To obtain fields of constant data coverage, gaps in the time series due to instrument failure were filled with the record length averages. Then, monthly mean vertical profiles were obtained by linear inter-polation between the instruments at each moor-ing in 2 m intervals. Instead of then performing pure horizontal interpolation, we used informa-tion about the spatial structure of the fields from the CTD sections (Fig. 3). In the CTD sections we identified layers (e.g. through temperature or salinity extrema or inflection points) and trans-ferred the layers to the respective current meter profiles. Each layer was split in grid cells. The vertical number of cells between two adjacent mooring positions was constant but the vertical extent varied with the layer thickness. Then, ver-tical profiles of 1 km horizontal distance were interpolated between the centres of the corre-sponding grid cells. From the profiles data were extracted in constant vertical distance to obtain a rectangular grid of 2 m by 1 km. By this method, interpolation occurs nearly horizontally in the interior, whereas over the continental slopes the interpolation follows the bottom topography. It avoids the generation of artificial features which would not be justified by the data, conserves struc-tures as boundary layers and permits the inclusion of a priori information from the temperature/salinity transects by the definition of the layers. In the calculations and the displayed section only the meridional component of the current is used. Due to the position of the mooring transect, the transport calculations refer to 78° 50’ N in the east and 79° 00’ N in the west. The recirculation within the strait yields a significant zonal trans-port between 78° 50’ N in the east and 79° 00’ N. This transport between the eastern and western part of the array is estimated from the zonal cur-rent components at moorings F8 and F9.
Results
The velocity field averaged over two years from September 1997 to August 1999 reflects the well known current system in Fram Strait (Fig. 4).
The northward flowing West Spitsbergen Current obtains its maximum speed of 24 cm/s in the near bottom layer of the core over the upper continen-tal slope. The southward flowing East Greenland Current core with a maximum velocity of 9 cm/s is located in the upper 200 m of the water column over the deeper part of the continental slope (Fig. 4). Both currents are confined to bands of about 100 km width over the eastern and western slopes. They are separated by an area of 100 km width where zonal, mostly westward, currents with a weak southward component prevail. The water mass properties of the upper and intermediate layers indicate that this area with meridional velocities of about 1 cm/s is governed by recircu-lating water of Atlantic origin (Fig. 3).
The West Spitsbergen Current has a strong barotropic component (determined as the vertical average of the velocity profile) of up to 20 cm/s, discernible by the nearly vertical isolines of the current velocity (Fig. 4). The barotropic compo-nent of the East Greenland Current is only less than 5 cm/s. The baroclinic components of both the West Spitsbergen and the East Greenland Cur-rents are of a similar magnitude—about 5 cm/s.
In the following discussion of volume trans-ports we refer for simplicity to the complete north-ward transport as West Spitsbergen Current and to the complete southward transport as East Green-land Current, despite the separation of some sur-face or subsurface current bands from the main currents by areas flowing in the opposite direc-tion (Fig. 4). Monthly mean northward and south-ward transports were calculated by integrating the interpolated monthly mean velocities fields. The average volume transports over two years were calculated by averaging the monthly mean transports to 9.5 ± 1.4 Sv to the north at 78° 50’ N and 11.1 ± 1.7 Sv to the south at 79° 00’ N. The zonal transport between 78° 50’ N and 79° 00’ N obtained from moorings F8 and F9 amounts to 2.6 ± 0.1 Sv to the west. This flow has to be added to the southward transport to obtain a net trans-port across a constant latitude of 78° 50’ N or sub-tracted from the northward transport to refer to 79° 00’ N. In the following, we will use transports referred to 78° 50’ N.
The obtained monthly mean volume transports (Fig. 5) through the strait are subject to intensive fluctuations with time scales from a few months to the record length. The West Spitsbergen Cur-rent has a strong annual cycle with maximum transport in winter (February) of 20 Sv and a
222 Direct measurements of volume transports through Fram Strait
minimum of 5 Sv in summer (August). This cycle occurs consistently in both years. The fluctua-tions on monthly time scales are on the order of 2 Sv. The variability of the East Greenland Current is less clear. Whereas in the first year (summer 1997 to summer 1998), a strong maxi-mum occurs in winter, simultaneously with the one in the West Spitsbergen Current, in the fol-lowing year (summer 1998 to summer 1999) the East Greenland Current reaches a minimum during the occurrence of the maximum in the West Spitsbergen Current. In spring 1998 strong northward and southward transports but weak net transports indicate intensive recirculation in the strait. In spring 1999, the net flow reaches a peak value to the north which does not recirculate within the strait. In the East Greenland Current semi-annual fluctuations are more prominent. In both years transport maxima between 19 and 24 Sv occur in autumn (December) and spring (April to June). The persistence of the extrema in the time and intensity suggests a stable mode of variability.
To investigate the stability of the transport esti-mates cumulative averages were calculated for the northward and southward transports, i.e. the averaging period was increased in monthly steps and the results of an average over 1, 2, 3 etc. months are displayed as time series (Fig. 6). The obtained mean transports increase by about 4 Sv
during the first seven months and then remain rather constant. A second step occurs in the trans-port of the West Spitsbergen Current at an average period of 15 months. This development towards a stable mean reflects the dominant effect of the annual cycle since the time series start in summer during a period of weak transports. The net south-ward transport decreases with increasing average period to 4.2 ± 2.3 Sv as the average over two years.
The differences of the monthly averages between northward and southward transports between 0.3 and 10.9 Sv seem unrealistic because an outflow of this magnitude over a month would lead to a noticeable sea level depression in the Arctic Ocean. However, Nøst et al. (2000) report an inflow of similar intensity, which might com-pensate for this outflow, south of Spitsbergen in February 1999. It remains to be investigated if a flow like this would be consistent with the water mass property distribution. However, we cannot fully rule out that the monthly averages might still be affected by aliasing due to meso-scale per-turbations.
Uncertainties
The transport estimates are subject to uncertain-ties in the measured current velocities and the
Fig. 5. Monthly averages of the volume transport through Fram Strait determined from the current meter array moored from September 1997 to August 1999. The errors are given as shaded areas. The southward transport is referred to 78° 50’ N by adding the recirculation between moorings F8 and F9.
Fig. 6. Cumulative averages of the monthly volume transports through Fram Strait determined from the current meter array moored from September 1997 to August 1999. Errors are shown as shaded areas. The southward transport is referred to 78° 50’ N by adding the recirculation between moorings F8 and F9.
223Fahrbach et al. 2001: Polar Research 20(2), 217–224
interpolation method which includes rounding errors. The current velocity measurements are affected by instrumental errors and time variabil-ity. Random instrumental errors can be neglected since the monthly averages were calculated from a large number of individual hourly samples. Sys-tematic errors were avoided by calibration.
The variability of the daily values after having removed tides indicates that meso-scale eddies (fluctuations with time scales of several days which are not correlated between adjacent moor-ings) would alias the estimates of daily transport time series. Therefore, monthly velocity averages were calculated to eliminate the effect of meso-scale perturbations before the interpolation. The uncertainty of the monthly velocity means due to the eddy noise was estimated as the error of the mean. The number of independent samples was calculated from the integral time scale for each month-long time series.
The uncertainty due to interpolation depends on the structure of the fields. Since the eddy field is eliminated by time averaging, the interpolation error has to describe to what extent the interpo-lated large-scale field represents the real large-scale field between the moorings. With an average distance of 24 km between the moorings a monot-onic structure of the large scale field between them is likely. The potential error then increases with velocity difference which is spanned by the interpolation. Therefore, the interpolation error within the area of influence of each instrument
(halfway to the adjacent instruments or the dis-tance to the boundary) was estimated as the mean of the velocity differences to the adjacent points.
The obtained errors of the monthly mean veloc-ities and the interpolation were weighted by the area of influence of each instrument and applied by Gaussian error propagation on the northward, southward and the net transport calculations (Figs. 6, 7). The errors of annual and biannual means were obtained similarly from year-long and two-year-long time series (Table 1).
We calculated annual or biannual averages on the basis of monthly transport estimates to cap-ture the transport variability. Due to the nonlin-earity of the transport of a current with variable spatial extent, annual mean northward and south-ward transports calculated on the basis of annual mean velocity fields are different from those obtained as averages of monthly mean transports. Both are given in Table 1.
Conclusions
The obtained volume transports are all signifi-cantly larger than earlier estimates given in the literature. The transport in the West Spitsbergen Current of 9.5 ± 1.4 Sv is larger than Hanzlick’s (1983) the estimate of 5.6 Sv. Even larger is the discrepancy to values obtained from hydro-graphic data estimated through inverse methods by Rudels (1987) and Schlichtholz & Houssais (1999) of 3.0 and 1.1 Sv, respectively. Despite the inverse approach, which aims to overcome the weakness of calculations based on the baroclinic currents and an arbitrary reference level, these authors largely underestimate the barotropic con-tribution. Our estimate of the transport in the East Greenland Current of 13.7 ± 1.7 Sv is larger than Schlichtholz & Houssais’s of 6.2 Sv and Rudels’s of 4.1 Sv. The estimate of Foldvik et al. (1988) of 3 Sv, based on current meter observations, includes only the upper 700 m and a much smaller hori-zontal extent than our measurements and cannot be easily compared.
Besides methodological reasons, the larger transport in comparison to earlier estimates can be due to the northward shift of the recirculation in the Greenland Sea. The higher temperatures observed in Fram Strait from 1997 to 1999 in comparison to the ‘80s support the northward shift. Further analysis of the data has to show
Mean Volume transport (106 m3s-1)transport southward northward differ- recircu-from Period at 79° N at 78° 50’ N ence lation net
09/97– 11.6 9.0 2.6 S 2.8 W 5.4 S 08/98 ± 2.5 ± 0.9 ± 3.1 ± 0.2 ± 3.2
09/98– 10.7 10.1 0.6 S 2.4 W 3.0 S 08/99 ± 2.4 ± 2.2 ± 3.2 ± 0.2 ± 3.3
09/97– 11.1 9.5 1.6 S 2.6 W 4.2 S 08/99 ± 1.7 ± 1.4 ± 2.2 ± 0.1 ± 2.3
09/97– 9.8 6.9 2.9 S 2.8 W 5.7 S 08/98 ± 2.2 ± 1.9 ± 2.9 ± 0.1 ± 2.9
09/98– 8.8 8.1 0.7 S 2.4 W 3.1 S 08/99 ± 2.2 ± 2.1 ± 3.0 ± 0.1 ± 3.0
09/97– 8.9 7.2 1.7 S 2.6 W 4.3 S 08/99 ± 1.6 ± 1.3 ± 2.0 ± 0.1 ± 2.0
Table 1. Volume transports for the two years of observations,from September 1997 to August 1999, calculated from the monthly transports and from annual and biannual means of the veloci-ties. The calculated uncertainties are described in the text.
Monthly mean transports
Annual mean velocities
224 Direct measurements of volume transports through Fram Strait
if a northward shift of the recirculation affects the heat flow through the strait. The most serious restriction of the comparison of meridional trans-ports is the large meridional variation due to the recirculation. An average decrease of the north-ward transport in the east or the increase of the southward transport in the west by 2.6 Sv over a distance of 10 nm, which is normally the sta-tion distance, requires comparisons at the same exact location. This holds not only for compari-sons between different observations but also for the comparisons with model results which are normally not available on gridpoints correspond-ing to the location of the observed section. How-ever, since the net transport is not affected by the recirculation if it is properly resolved, it can be used for comparison.
The aim of the project was to design an opti-mal array of moored instruments, suitable to be maintained for longer time periods. Working out the relation of transport fluctuations to variations in the sea level elevation or bottom pressure dif-ferences might permit the use of fewer moorings after the establishment of an appropriate cali-bration data set. Under the assumption of the geostrophic equilibrium, the bottom pressure dif-ference along the transect corresponds to the barotropic current perpendicular to it. Since the baroclinic current seems to be small in compari-son to the barotropic currents, variations of the sea level elevation or bottom pressure differences might be used to derive transport fluctuations after appropriate corrections for the baroclinic component. The hypothetical differences of the sea level elevation across the West Spitsbergen Current derived from the barotropic currents measured with the moored instruments vary from 15 cm in February 1999 to 5 cm in August 1999. Consequently, the expected sea level or bottom pressure variations are in the range to be meas-ured. However, the transition from northward to southward flow, i.e. the zonal limit between the two current systems, was displaced by more than 250 km westwards during winter, necessitating the measurement of the horizontal pressure pro-file to enable us to estimate transports.
We conclude that transport estimates of Atlan-tic Water through Fram Strait towards the Arctic Ocean and, consequently, of a reliable heat trans-port can only be obtained by direct current measurements which sufficiently resolve the recir-culation. Therefore, further time series measure-ments with moored instruments are required.
Acknowledgements.—We are grateful to Matthias Monsees, Ekkehard Schütt and Andreas Wisotzki who participated in the work at sea, the data processing and provided draw-ings. We appreciate the valuable contribution of Rebecca A. Woodgate to advance the project during her stay in Bremer-haven and the later analysis by intensive and fruitful discus-sions. A significant part of the work was carried out under the European Union MAST III VEINS programme, contract number MAS3-CT96-0070.
References
Aagaard, K., Darnall, C. & Greisman, P. 1973: Year-long cur-rent measurements in the Greenland–Spitsbergen passage. Deep-Sea Res. 20, 743–746.
Carmack, E. C., Macdonald, R. W., Perkin, R. G., McLaugh-lin, F. A. & Pearson, R. J. 1995: Evidence for warming of Atlantic water in the Southern Canadian basin of the Arctic Ocean: results from the Larsen-93 Expedition . Geophys. Res. Lett. 22, 1061–1064.
Fahrbach, E. (ed.) 1999: The Expedition ARKTIS XIV/2 of the Research Vessel POLARSTERN in 1998. Berichte zur Polarforschung 326, 1–114.
Foldvik, A., Aagaard, K. & Tørresen, T. 1988: On the veloc-ity field of the East Greenland Current. Deep-Sea Res. 35, 1335–1354.
Greisman, P. E. 1976: Current measurements in the Eastern Greenland Sea. PhD thesis, University of Washington.
Hanzlick, D. J. 1983: The West Spitsbergen Current, trans-port, forcing and variability. PhD thesis, University of Washington.
Morison, J. H. 1991: Seasonal variations in the West Spits-bergen Current estimated from bottom pressure measure-ments. J. Geophys. Res. 96(C10), 18,381–18,395.
Nøst O. A. 2000: ADCP and CTD measurements on NP VEINS cruises across the Barents Sea opening. In H. Loeng (ed.): Summary report to VEINS meeting in Ham-burg, 19–21 January 2000, workpackage 1.2: northeastern boundaries.
Östlund H. G. & Hut, G. 1984: Arctic Ocean water mass balance from isotope data. J. Geophys. Res. 89(C4), 6373–6381.
Quadfasel, D., Sy, A., Wells, D. & Tunik, A. 1991: Warming in the Arctic. Nature 350, 385.
Rudels, B. 1987: On the mass balance of the Polar Ocean, with special emphasis on the Fram Strait. Nor. Polarinst. Skr. 188. Olso: Norwegian Polar Institute.
Rudels, B. & Quadfasel, D. 1991: Convection and deep water formation in the Arctic Ocean—Greenland Sea System. J. Mar. Syst. 2, 435–450.
Schauer, U. (ed.) 2000: Die Expedition ARKTIS XV/3 des For-schungsschiffes POLARSTERN 1999. Berichte zur Polar-forschung 350.
Schlichtholz, P. &. Houssais, M.-N. 1999: An inverse model-ling study in Fram Strait. Part I: dynamics and circulation. Deep-Sea Res. II 46, 1083–1135.
Woodgate, R., Schauer, U. & Fahrbach, E. 1998: Moored cur-rent meters in the Fram Strait at 79° N: preliminary results with special emphasis on the West Spitsbergen Current. Ber. Fachber. Phys. 91, 1–25.
Zhang, J., Rothrock, D. A. & Steele, M. 1998: Warming of the Arctic Ocean by strengthened Atlantic inflow: model results. Geophys. Res. Lett. 25, 1745–1748.