DIRECT SEQUENCE SPREAD SPECTRUM TECHNIQUES FOR LAND MOBILE RADIO APPLICATIONS by David Arthur Drun Submitted in fulfilment of the requirements for the degree of Doctor of Philosophy The University of Leeds, Department of Electrical and Electronic Engineering March 1981
Transcript
DIRECT SEQUENCE SPREAD SPECTRUM TECHNIQUES
FOR LAND MOBILE RADIO APPLICATIONS
by
David Arthur Drun
Submitted in fulfilment of the requirements
for the degree of Doctor of Philosophy
The University of Leeds,
Department of Electrical and
Electronic Engineering
March 1981
ABSTRACT
This thesis describes an investigation into the application and
performance of direct sequence spread spectrum techniques for land
mobile radio systems.
There is a brief description of the basic principles of operation
of direct sequence systems.
The multiple user facility is analysed and values obtained for
the maximum number of simultaneous system users in terms of system
parameters. This clearly illustrates the need for power control. A
possible method of providing power control is described. Comparison
of user density is made against conventional narrowband modulation
methods. There is some discussion of the effect of sequence
cross-correlations on the number of system users. The system
organisation is mentioned, showing possible application of a calling
channel.
Consideration is given to the possibilities of bandsharing with
narrowband modulation systems. Figures are derived for the
resulting interference to existing systems which would be caused
by such an arrangement.
A brief resume of the pertinent features of the land mobile
radio channel is given. The effects of shadowing on the output
quality and spectral efficiency of direct sequence systems is
discussed. There is an analysis of the effects of shadowing on
the user density in small cell schemes. An analysis shows the
effects of multipath propagation on direct sequence performance
by reference to a simple two path channel.
Details are given of a simple experimental direct sequence
spread spectrum transmitter and receiver constructed. The measured
results for the performance of the system against various forms of
interference and channel degredation are compared with their
theoretical values.
Finally ideas for future work are discussed.
CONTENTS
Symbols and Abbreviations
Chapter 1 Introduction
Chapter 2 Spread Spectrum Principles
2.1 Operation
2.2 Process Gain
2.3 Alternative Implementations
2.4 Spreading Signal
2.4.1 Transmitted Spectrum
2.5 Analogue Message Modulation
Chapter 3 Multiple User Facility
3.1 Multiple User Analysis
3.2 Graceful Degredation
3.3 Qualification of Multiple User Facility
3.3.1 Spreading Sequence Cross Correlations
3.3.2 An Alternative Approach
3.3.3 Orthogonal Spreading Signals
3.3.4 Sequence Lengths
3.4 Near Far Problem
3.5 Spectral Efficiency in Cellular Schemes
3.5.1 Problems of Comparison
3.6 Aspects of System Organisation
Chapter 4 Bandsharing
4.1 Interference to Narrowband Systems
4.2 Interference to Direct Sequence Systems
4.2.1 Problems with Multiple Narrowband
Transmi ssions
Pagei v
Chapter 5 Propagation Effects 49
5.1 The Land Mobile Radio Channel 49
5.2 Effects of Shadowing in Area Coverage 51
Schemes
5.3 Effects of Shadowing in Small Cell 53
Schemes
5.4 Effects of Multipath Propagation 60
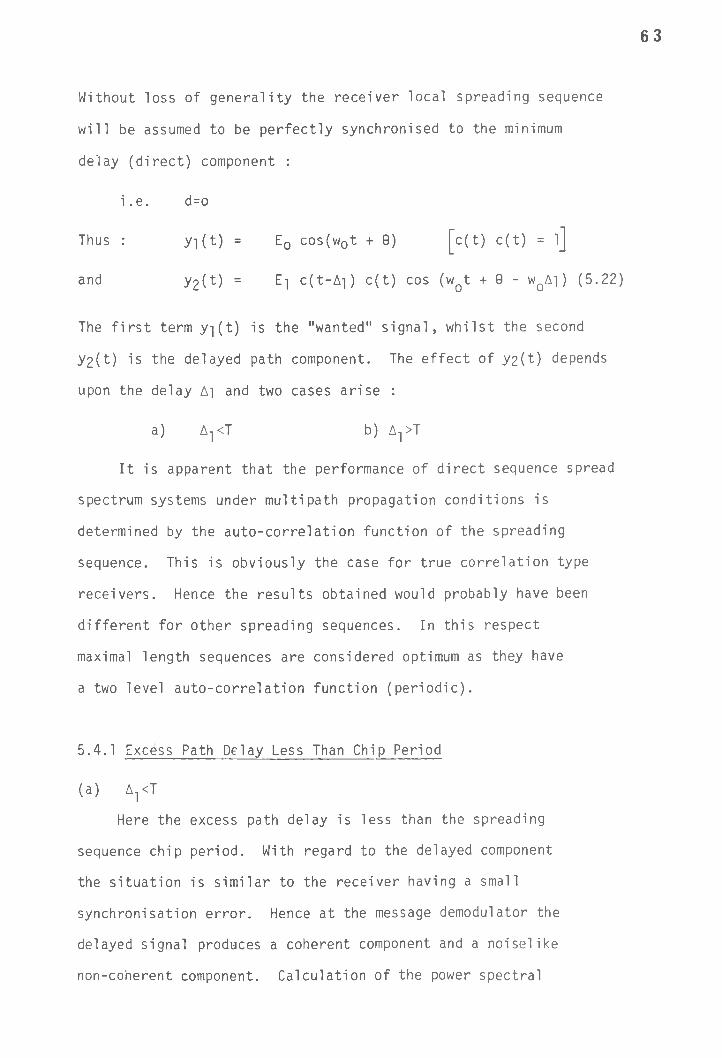
5.4.1 Excess Path Delay Less than Chip Period 63
5.4.2 Excess Path Delay exceeds Chip Period 66
5.4.3 Effect of Multipath on Message Signals 68
5.4.4 Problems of Analysis over Multipath ' 69
Channels
Chapter 5 Experimental Transmitter and Receiver 74
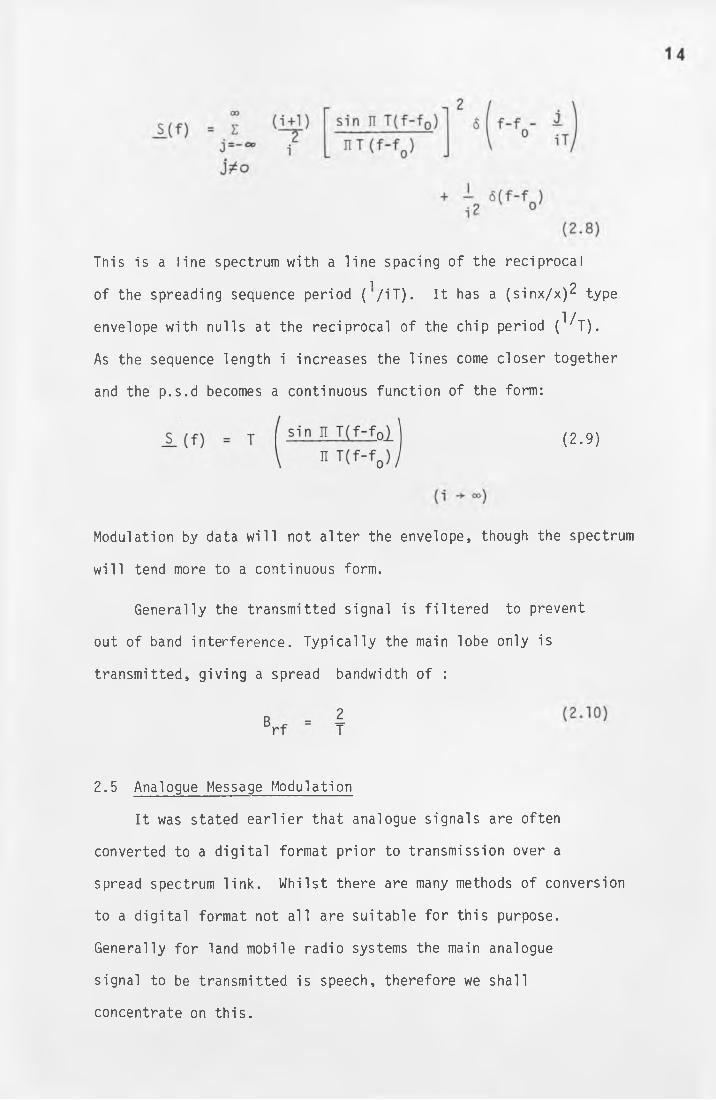
Obviously the higher the figure of merit the more suitable the speech
conversion scheme is for spread spectrum application.
Whilst it would be desirable to incorporate thresholds in this
evaluation scheme it is difficult to give measure to their effect.
Table 2.1 shows figures at merit evaluated for a range of
speech conversion schemes, the information being derived from the
40relevent sections of Carlson . It should be noted that there is
32 42disagreement between authors 5 on the performance of pulse position
and pulse duration modulation schemes as much depends upon the
assumptions made. Fig. 3.5 at the end of chapter 3 presents the
same information as table 2.1 though in a graphical form. Most of
the speech conversion schemes mentioned here would benefit from
speech processing technques such as companding, though no account
has been taken of these in deriving the results.
TABLE 2.1
FIGURES OF MERIT FOR SPEECH CONVERSION SCHEMES
BandwidthRatio
ModulationImprovement
Threshold s.n.r. dB
Figure of Merit
Notes
a) Pulse Code Modulation 6it Threshold
No. of levels
8 (=23 ) 12 6.82 8.47 .568 1>2,3,4
16 (=24 ) 16 20.09 9.78 1.255
32 (=25) 20 62.66 10.83 3.13
b) Pulse Code Modulation cit 10dB above Threshold
8 (=23 ) 12 1.36 8.47 .113 1,2,3,4
16 (=24 ) 16 4.02 9.78 .251
32 (=25) 20 12.50 10.83 .625
c) Pulse Posi'i:ion Modulati on
4 .50 3 .125 1,2,5
8 4.0 3 .50
12 13.5 3 1.125
16 32.0 3 2.0
d) Pulse Dural:ion Modulati on
4 1 3 .25 1,2,5
8 4 3 .50
12 9 3 .75
.... ........16 16 3 1
NOTES:
1. Phase Reversal keying modulation of carrier assumed. Hence s.n.r. at output of carrier demodulator assumed to equal s.n.r. at input.
2. Sampling rate = 2 x Message Bandwidth
3. I.F. Bandwidth = 4 x Message Bandwidth x No. of bits/sample
4. Threshold s.n.r. = Carrier s.n.r. such that decoding errors equal quantisation noise.
5. I.F. Bandwidth = 4 x Message Bandwidth x Some Integer.
CHAPTER 3
Multiple User Facility
16
CHAPTER 3
Multiple User Facility
So far the discussion of spread spectrum systems has centred
on a single link. From a system viewpoint it is necessary to
simultaneously operate many links independently in the same
geographical area. Consideration will now be given as to how
this is achieved.
Obviously the use of separate channels, by assigning to each
link a separate carrier frequency is impracticable because of
the bandwidth required. Instead all links operate on the same
carrier frequency and separation is achievedas follows. To each
link is assigned a unique spreading sequence, from the set of
available sequences, unrelated to the sequences used by other
links. Thus at any receiver along with the wanted signal will be
received signals from unwanted transmitters. The unwanted signals
are treated as any other interference and their effect is reduced
by the system process gain.
3.1 Multiple User Analysis
It is apparent that the output signal to noise ratio at any
receiver is determined by the interference from other users. As
each receiver requires a minimum signal to noise ratio for
acceptable operation there is a limit to the number of simultaneous
users of the system.
To evaluate this limit consider the situation shown in
Fig. 3.1. Here M equi-power signals are present at the input
to a direct sequence receiver along with noise of power N.
(t)C0S(27rf0t)
17
S-<Dto
CD
Q _
cnc
o_c(/>
rCS-cnra
ro
cn
18
If one of the signals is the wanted one then the signal to interference
ratio at the receiver input is :
Assuming that the interference is reduced by the system process
gain, then the signal to noise ratio at the message demodulator
input is :
This can be re-arranged to give:
NM * s? - 5 + 1 (3.3)
( 'N)0
Equation (3.3) shows that to obtain the largest number of
simultaneous users in a given band the ratio of wanted signal
to extraneous noise should be high. Hence if the only interference
is that due to other users (3.3) can be written as :
(3.1)
(3.2)
(3.4)
Or substituting for the process gain :
we obtain
M = Brf + 1 (3.5)
10 dB
19
2E
2T>
Q.CO
s ja sn jaqmnfj
Fig
3.2
NUMBER
OF
USERS
AGAINST
SPREAD
BANDWIDTH
Information
bandwidth
25
kHz
20
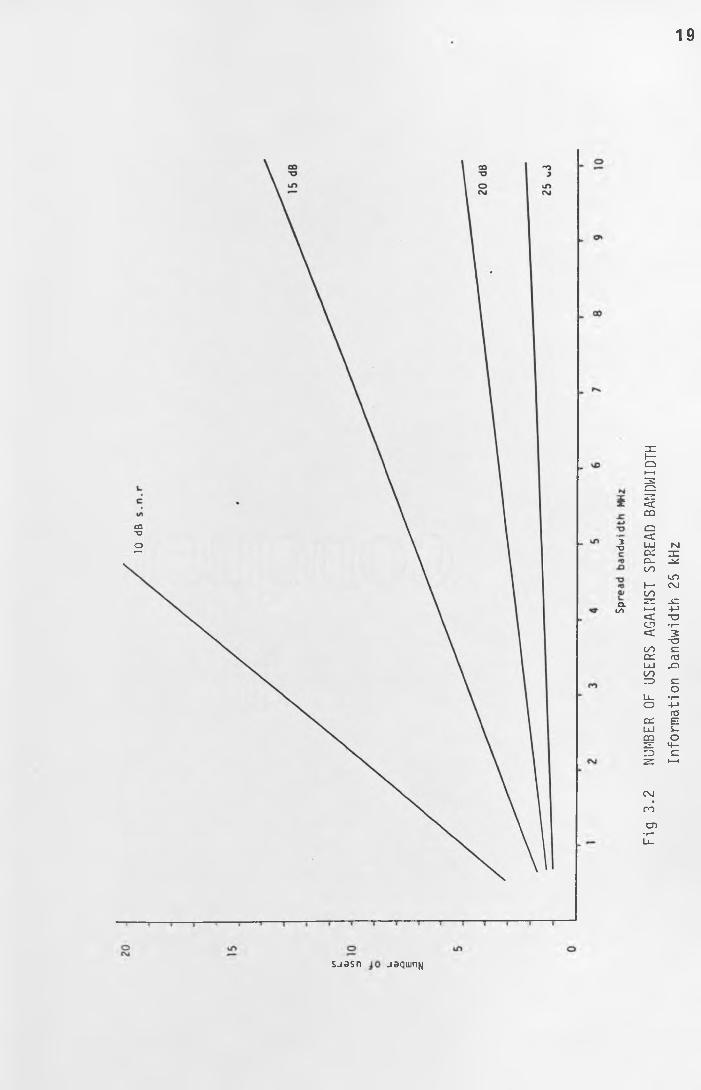
Fig. 3 2 shows equation (3.5) plotted out, where the maximum
number of users is evaluated against spread bandwidth for various
signal to noise ratios at the input to the message demodulator.
As mentioned elsewhere the audio signal to noise ratio will
generally be different to that at the input to the message
demodulator. Examination of fig 3.2 shows that to obtain the
maximum number of users in a given system the minimum required
post-despreader signal to noise ratio must be small. This
implies the use of an efficient message modulation method.
3.2 Graceful Degredation
A valuable feature of spread spectrum multiple user systems
is that of graceful degredation. This allows the system to tolerate
temporarily slight increases in the number of users above the
limits evaluated without system collapse. To achieve this a
message modulation technique having no sharp thresholds is
required. Having satisfied this requirement a large system with
many users can tolerate slight overloads with only small
degredations in output signal to noise ratio.
Consider a large system using power control where the only
interference at the message demodulator is caused by other users.
Thus the signal to noise ratio at the message demodulator with
M users operational is :
If now the number of users increases by 10% this value becomes :
(3.6)
21
I - ) = gp\ N /0 (M-l) (1+0.1
"°" ( " l / ^ o = Ti^oTT)
Thus the signal to noise ratio is decreased from its original
value by 0.4 dB. Providing the ratio of output to input signal
to noise for the message demodulator is linear at this point such
change is unlikely to be noticed.
Under conditions where the system is highly loaded priority
users may find that communications are not reliable enough for
their purposes. To overcome this such users may be allowed an
increase in transmitter power or transmitted bandwidth. Either
of these will provide an increase in signal to noise ratio, thus
allowing more reliable communications. The use of increased
transmitter power results in a decrease in signal to noise ratio
for other users of the system. Hence use of this facility would
have to be restricted. The use of increased bandwidth, providing
an increase in process gain, carries no such penalty. However
to obtain a 3dB improvement a doubling of the occupied bandwidth
would be required.
3.3 Qualification of Multiple User Facility
At the beginning of this section it was assumed that the
interference effect of unwanted spread spectrum users was reduced
by the system process gain. Whilst this is a reasonable assumption
it is nevertheless desirable to justify it.
(3.7)
(3.8)
2 2
Q
A paper by Judge considers multiplexing using maximal
length sequences and correlation receivers. For M equal power
received signals in the absence of noise this paper gives the output
signal to noise ratio at any receiver as :
= ---— 7-4------ \ (3.9)N ) ' (M-l) I + T
Tm'o
2The term k-j accounts for the sequence cross-correlations and the
ratio T/j is the ratio of chip to data bit period. This equation m
can be re-arranged as :
M = — ---------- ---- + 1 (3.10)T ( 7N) / 1 + k? T
' 1 o 1 m
Now to a reasonable approximation :
Tm = Brf = GT B PT m
Hence M = _______ 1_____ + 1 (3.11)
(S/N)q (1 + k2 Gp)
Comparison with equation (3.4) shows that (3.11) is identical
except for an extra factor. This extra factor of :
1
1 + Gp
reduces to unity for
ki GP « 1
23
Judge evaluates the cross correlation factor k-j for various
maximal length sequences and indeed for moderate values of process
gain
ki Gp « 1
3.3.1 Spreading Sequence Cross-Correlations
In general for the situation where all transmitters are
received at equal levels the maximum number of users will be given
by :
M * GP kc + 1 (3.12)
(S / N )0
The factor kc accounts for various effects, mainly though for the
spreading sequence cross-correlations. For most situations kc will
be close to unity.
The significance of sequence cross-correlations in active
despreader type direct sequence systems can be deduced from a
qualitative argument. Consider such a system operating well above
noise and having a single direct sequence interferer present at the
input to the receiver. If the cross-correlation between locally
generated and interfering sequences is low, then the signal at the
despreader output will resemble a spreading sequence. It will
therefore have a smooth spectrum with no concentrations of energy
centred on the filter passband. Hence the interference energy will
be reduced by the system process gain. If the cross-correlation
between the sequencesis high then the despreader output will not
resemble a sequence. One could imagine the interfering signal having
a sequence equal to the locally generated sequence with a few bits
changed. Thus the filter input will have a spectrum with large
energy concentrations falling on its passband. Hence most of the
interference energy will appear at the input to the message
demodulator.
T h e u s e f u l n e s s o f s e q u e n c e s for s p r e a d s p e c t r u m a p p l i c a t i o n s is
g e n e r a l l y m e a s u r e d in t e r m s o f t h e i r a u t o a n d c r o s s - c o r r e l a t i o n
f u n c t i o n s . H o w e v e r f o r a g i v e n s e t o f s e q u e n c e s t h e s e f u n c t i o n s c a n
t a k e d i f f e r e n t f o r m s d e p e n d i n g u p o n t h e i r d e f i n i t i o n .
C o n s i d e r i n i t i a l l y the s e q u e n c e a u t o - c o r r e l a t i o n f u n c t i o n
(a.c.f), u s u a l l y d e f i n e d in g e n e r a l t e r m s as: -
a n d a p e r i o d i c a u t o - c o r r e l a t i o n f u n c t i o n s . T h e p e r i o d i c a u t o
c o r r e l a t i o n f u n c t i o n r e f e r s to the c o r r e l a t i o n o f a c y c l i c s h i f t o f
the s e q u e n c e w i t h i t s e l f t a k e n o v e r the c o m p l e t e l e n g t h o f t h e
s e q u e n c e . As the n a m e i m p l i e s the r e s u l t i n g c o r r e l a t i o n f u n c t i o n is
r e p e t a t i v e w i t h a p e r i o d e q u a l to the t o t a l s e q u e n c e p e r i o d . The
a p e r i o d i c a u t o - c o r r e l a t i o n f u n c t i o n r e f e r s to the c o r r e l a t i o n o f o n l y
a small p a r t o f the s e q u e n c e w i t h itself. Thi s is to say t h a t onl y
a s m a l l s u b s e c t i o n o f the s e q u e n c e is c o r r e l a t e d w i t h th a t s e q u e n c e in
part, r e s u l t i n g in a n o m i n a l l y n o n r e p e t i t i v e a u t o - c o r r e l a t i o n f u n c t i o n
O b v i o u s l y as the l e n g t h o f s e q u e n c e s u b - s e c t i o n i n c r e a s e d t h e a p e r i o d i c
a u t o - c o r r e l a t i o n f u n c t i o n a p p r o a c h e s the p e r i o d i c one for t h a t s e q u e n c e
N o t e t h a t f o r i n f i n i t e l e n g t h s e q u e n c e s o n l y an a p e r i o d i c t y p e o f
a u t o - c o r r e l a t i o n f u n c t i o n exists.
f a i r l y s i m p l e , o n l y t a k i n g o n a f e w va l u e s . T h e a p e r i o d i c a u t o
c o r r e l a t i o n f u n c t i o n is h o w e v e r g e n e r a l l y m o r e c o m p l i c a t e d , t a k i n g on
f(t) f(t - ' t ) dt
F o r f i n i t e l e n g t h s e q u e n c e s t h i s g i v e s r i s e to the p e r i o d i c
F o r m a n y s e q u e n c e s the p e r i o d i c a u t o - c o r r e l a t i o n f u n c t i o n is
a w i d e r r a n g e o f v a lues.
24 A
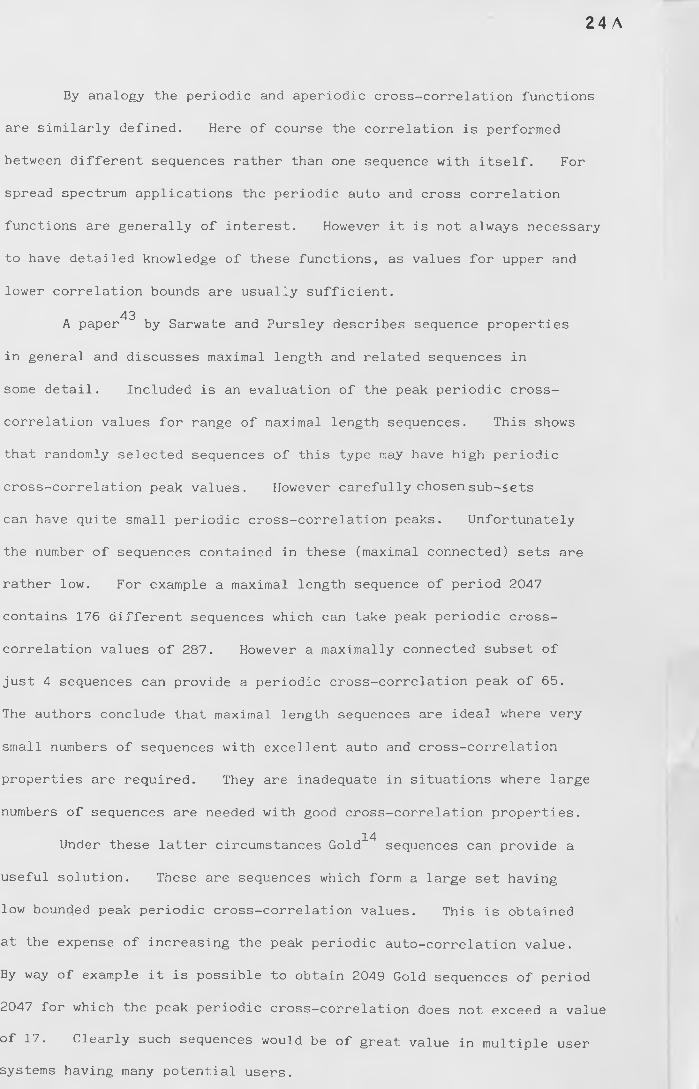
By a n a l o g y the p e r i o d i c and a p e r i o d i c c r o s s - c o r r e l a t i o n f u n c t i o n s
are s i m i l a r l y defined. H e r e o f c o u r s e the c o r r e l a t i o n is p e r f o r m e d
b e t w e e n d i f f e r e n t s e q u e n c e s r a t h e r t h a n one s e q u e n c e w i t h itself. F o r
s p r e a d s p e c t r u m a p p l i c a t i o n s the p e r i o d i c aut o a n d c r o s s c o r r e l a t i o n
f u n c t i o n s are g e n e r a l l y o f interest. H o w e v e r it is n o t a l w a y s n e c e s s a r y
to hav e d e t a i l e d k n o w l e d g e o f t h e s e f u nctions, as v a l u e s f o r u p p e r a n d
l o w e r c o r r e l a t i o n b o u n d s are u s u a l l y sufficient.
43A p a p e r b y S a r w a t e a n d P u r s l e y d e s c r i b e s s e q u e n c e p r o p e r t i e s
in g e n e r a l and d i s c u s s e s m a x i m a l l e n g t h a n d r e l a t e d s e q u e n c e s in
some detail. I n c l u d e d is an e v a l u a t i o n o f the p e a k p e r i o d i c c r o s s
c o r r e l a t i o n v a l u e s f o r r a n g e o f m a x i m a l l e n g t h sequences. T h i s s h o w s
th a t r a n d o m l y s e l e c t e d s e q u e n c e s o f this type m a y h a v e h i g h p e r i o d i c
c r o s s - c o r r e l a t i o n p e a k values. H o w e v e r c a r e f u l l y c h o s e n s u b - s e t s
c a n h a v e q u i t e s m a l l p e r i o d i c c r o s s - c o r r e l a t i o n peaks. U n f o r t u n a t e l y
the n u m b e r o f s e q u e n c e s c o n t a i n e d in t h e s e (maximal c o n n e c t e d ) se t s are
r a t h e r low. F o r e x a m p l e a m a x i m a l l e n g t h s e q u e n c e o f p e r i o d 2 0 4 7
c o n t a i n s 176 d i f f e r e n t s e q u e n c e s w h i c h c a n take p e a k p e r i o d i c c r o s s
c o r r e l a t i o n v a l u e s o f 287. H o w e v e r a m a x i m a l l y c o n n e c t e d s u b s e t o f
j u s t 4 s e q u e n c e s c a n p r o v i d e a p e r i o d i c c r o s s - c o r r e l a t i o n p e a k o f 65.
The a u t h o r s c o n c l u d e t h a t m a x i m a l l e n g t h s e q u e n c e s are ideal w h e r e v e r y
s m all n u m b e r s o f s e q u e n c e s w i t h e x c e l l e n t aut o and c r o s s - c o r r e l a t i o n
p r o p e r t i e s are re q u i r e d . T h e y are i n a d e q u a t e in s i t u a t i o n s w h e r e large
n u m b e r s o f s e q u e n c e s are n e e d e d w i t h g o o d c r o s s - c o r r e l a t i o n p r o p e r t i e s .
14U n d e r t h e s e l a t t e r c i r c u m s t a n c e s G o l d s e q u e n c e s c a n p r o v i d e a
u s e f u l s o l ution. T h e s e are s e q u e n c e s w h i c h fo r m a l arge s e t h a v i n g
l o w b o u n d e d p e a k p e r i o d i c c r o s s - c o r r e l a t i o n values. T h i s is o b t a i n e d
at the e x p e n s e o f i n c r e a s i n g the p e a k p e r i o d i c a u t o - c o r r e l a t i o n value.
By w a y o f e x a m p l e it is p o s s i b l e to o b t a i n 2 0 4 9 G o l d s e q u e n c e s o f p e r i o d
204 7 for w h i c h the p e a k p e r i o d i c c r o s s - c o r r e l a t i o n does n o t e x c e e d a v a l u e
o f 17. C l e a r l y s u c h s e q u e n c e s w o u l d be o f g r e a t v a l u e in m u l t i p l e use r
s y s t e m s h a v i n g m a n y p o t e n t i a l users.
24 lr
A n a l t e r n a t i v e a p p r o a c h to s e q u e n c e c o n s t r u c t i o n is th a t
44d e s c r i b e d by M i l s t e m et al . H e r e the e m p h a s i s is on s e q u e n c e s w h i c h
nc a n r e a d i l y be s y c h r o n i s e d in a s h o r t time, w i t h on l y a few b i t s of
A
the s e q u e n c e received. T h e s e s e q u e n c e s are f o r m e d b y c o m b i n i n g 2 (or
p o s s i b l y more) s h o r t s e q u e n c e s to y i e l d a lon g sequence, h a v i n g less
t h a n ideal auto and c r o s s - c o r r e l a t i o n p r o p e r t i e s . F o r a c o m b i n a t i o n
9s e q u e n c e o f l e n g t h 10 bit s f o r m e d fro m 2 s e q u e n c e s o f a p p r o x i m a t e
4l e n g t h 3 x 10 b i t s M i l s t e m s t a t e s t h a t 11 s i m u l t a n e o u s s y s t e m u sers
c a n be t o l e r a t e d for r e l i a b l e o p e r a t i o n . O b v i o u s l y suc h s e q u e n c e s do
n o t h a v e i m m e d i a t e a p p l i c a t i o n in s y s t e m s d e s i g n e d to o p e r a t e w i t h
m a n y u s e r s .
3-3.2 An Alternative Approach
An alternative approach to the calculation of the number of
simultaneous allowable users of a spread spectrum system is
13that of Beale and Tozer . They consider the problem of reliably
synchronising a user in the presence of interference from existing
users of the system. Using true correlation type receivers with
synchronisation by searching for a correlation peak the results
are pessimistic. For equi-power received signals a theoretical
maximum of 10 users can be reliably synchronised for a 25 dB system
process gain. The results for practical spreading sequences are
shown to be slightly worse than this.
Examination of Fig. 3.2 shows that for a 25dB process gain
(spread bandwidth 7.9 MHz) 11 simultaneous users can be active for
a 15 dB despreader output signal to noise ratio. Whilst the valuesu s e r s
for the allowable number of simultaneous^obtained from Fig. 3.2 may
be considered optimistic, the author feels that the values given by
Beale and Tozer represent a lower limit. In practical systems
synchronisation will be a sophisticated process and may not rely on
searching for synchronisation peaks. In particular use of some
reference for synchronisation, such as the base to mobile calling
channel, would remove the restrictions imposed by Beale and Tozer.
Consequently the number of allowable simultaneous users will increase
to limits imposed by spreading sequence cross-correlations.
2 4 ci
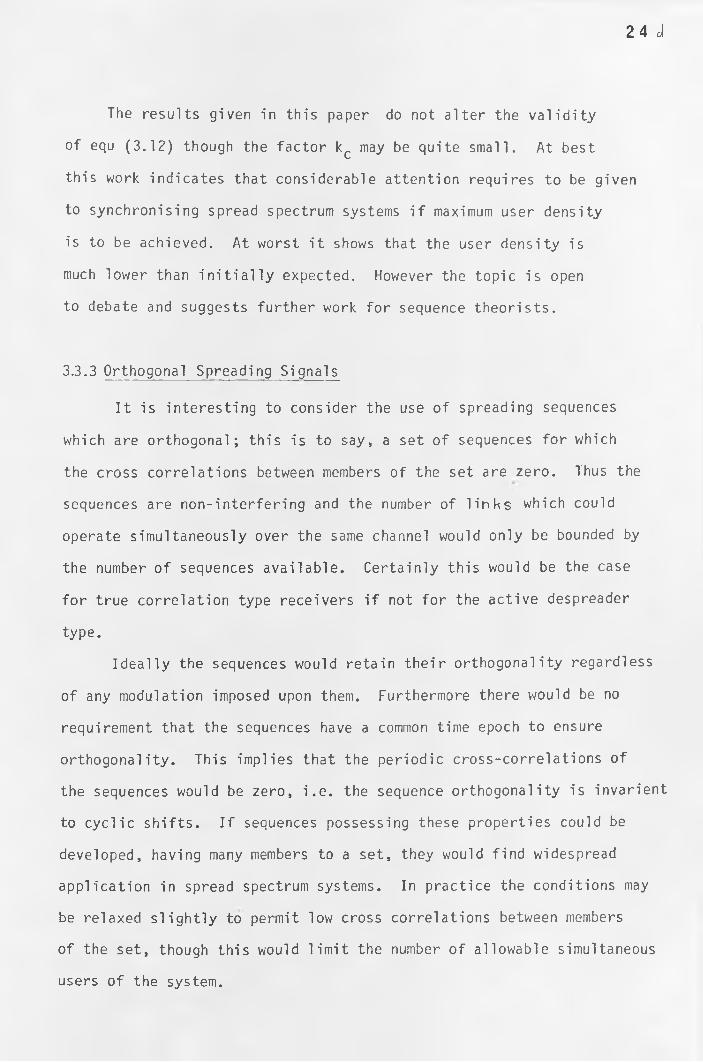
The results given in this paper do not alter the validity
of equ (3.12) though the factor kc may be quite small. At best
this work indicates that considerable attention requires to be given
to synchronising spread spectrum systems if maximum user density
is to be achieved. At worst it shows that the user density is
much lower than initially expected. However the topic is open
to debate and suggests further work for sequence theorists.
3.3.3 Orthogonal Spreading Signals
It is interesting to consider the use of spreading sequences
which are orthogonal; this is to say, a set of sequences for which
the cross correlations between members of the set are zero. Thus the
sequences are non-interfering and the number of links which could
operate simultaneously over the same channel would only be bounded by
the number of sequences available. Certainly this would be the case
for true correlation type receivers if not for the active despreader
type.
Ideally the sequences would retain their orthogonality regardless
of any modulation imposed upon them. Furthermore there would be no
requirement that the sequences have a common time epoch to ensure
orthogonality. This implies that the periodic cross-correlations of
the sequences would be zero, i.e. the sequence orthogonality is invarient
to cyclic shifts. If sequences possessing these properties could be
developed, having many members to a set, they would find widespread
application in spread spectrum systems. In practice the conditions may
be relaxed slightly to permit low cross correlations between members
of the set, though this would limit the number of allowable simultaneous
users of the system.
2 5
3.3.4 Sequence Lengths
It is appropriate at this point in the thesis to discuss
briefly the topic of spreading sequence lengths for direct
sequence spread spectrum systems. The topic is of relevance, -as
several properties of spreading sequences are related to sequence
length, having an effect on the performance and operation of direct
sequence systems.
In a large scheme with many individual users it is desirable
to provide each user with a unique spreading sequence from a
given set of available sequences. The number of unique spreading
sequences available from a given set increases with increasing
26
sequence length. Consequently direct sequence spread spectrum
systems having many users each requiring a unique spreading
sequence must use long length sequences. As an illustration
of the numbers involved Table 3.i shows the number of unique
maximal length spreading sequences available against length
of sequence.3^
As discussed in Section 3.3.1 it is necessary for all the
members of a given set of available spreading sequences to have
low cross-correlations in order to allow for the greatest number
of simultaneous users of a system. For maximal length sequences
Judge^ shows that the sequence cross-correlations, as measured
by the factor , decrease for increasing sequence length.
Representative values given by Judge are given in Table 3.i.
On a similar theme it was stated in Chapter 2 that received
interference is given noiselike properties in the despreading
process due to the properties of the spreading sequence. As
useful spreading sequences are periodic they have line spectra,
which to approximate to noise must have a small spacing between
the spectral lines. It is difficult to quantify the line spacing
required as this is generally a compromise between various factors,
nevertheless it does effect the sequence length. As an example
of the numbers involved consider a direct sequence system having
a 10 MHz spread bandwidth for which a 100 Hz line spacing is
required. From equation (2.8) the line spacing for maximal length
sequences is :
iT 2i
27
Hence rearranging: 710xi = -------------
2 x 10²
4= 5 x 10 bits
In practice a 65,535 bit maximal length sequence would be used
as the nearest value.
Another consideration that enters into the topic of sequence
length is that of synchronisation. Consider the initial
synchronisation process, where the receiver local sequence replica
is 'drifted1 slowly past the incoming signal until they are aligned,
a process generally referred to as sliding correlation. The 'drift'
rate is determined by the post-despreader filter bandwidth and the
time required to identify alignment between the sequences. As these
factors are fixed the only variable affecting the synchronisation
time is the sequence length. On the average the shorter the
spreading sequence the shorter the initial synchronisation time,
an important point in direct sequence communications systems.
For a sequence of length i 'drifted' at a rate Bp past the
incoming signal the time Tp to drift through the complete sequence
is:
TD = ^ (3-13)Bd
Thus a 65,535 bit maximal length sequence 'drifted' at 10 k bits/sec
would take 6.55 seconds to drift through the sequence. Assuming
that initial synchronisation was completed when the received and
local sequences first came into alignment the period TQ represent
the maximum synchronisation time. On the average it would not be/
necessary to drift through the complete sequence and the
28
synchronisation time would be correspondingly less. Other
38synchronisation schemes * can be used which do not require
the system to search through the spreading sequence and therefore
have shorter synchronisation times.
The selection of a spreading sequence length is likely to
be a compromise for many systems between multiple user and
synchronisation considerations. For systems using matched filters
constraints^ on the filters will limit the sequence lengths usable
and consequently the system performance. Using such systems the
process gain will equal the sequence length unless recursive
techniques are used. However for any direct sequence spread spectrum
system it is apparent that the selection of the spreading sequence
length requires careful consideration.
3.4 Near Far Problem
The analysis has so far assumed that each unwanted transmitter
produces the same power at a receiver as the wanted signal. Failure
to achieve this results in the classic "near far" problem. This
arises where the signal from a wanted distant transmitter is swamped
by local unwanted transmissions. Despite the system process gain it
is impossible to achieve a satisfactory signal to noise ratio at the
receiver output. In a fixed station situation control of power
levels and the use of directional antennae may alleviate the
problem.
The 'near far' problem in a mobile context is analysed in
Appendix A for a circular coverage area and uniform distribution
of mobiles. The problem also receives some attention in a paperO
by Matthews et al. The analysis shows that in the mobile to
base direction the penalty for not achieving equal received powers
is a large decrease in the number of allowable simultaneous
users of the system. Hence for this scheme power control
is required in the mobile to base direction to ensure equality of
received powers by overcoming the differing propagation losses.
In consequence use of separate transmit and receive bands is
necessary. Furthermore direct mobile to mobile communication is
not possible in this scheme as the power control would be ineffective.
This is not a serious restriction as the range would be limited.
It should be noted that power control is not required in the
base to mobile direction of transmission. Here the ratio of
wanted to unwanted signal levels will be constant throughout the
coverage area for a central base station. However the absolute
signal level will decrease with increasing distance from the
transmitter.
To achieve power control, knowledge is required of the path
loss between mobile and base station. The mobile transmitter
power can then be adjusted to produce a constant received level
at the base station. Assuming the propagation path to be
reciprocal, power control can be achieved by adjusting the mobile
transmitter power to follow the variations in received signal
from the base station. The sensing circuit should be connected
close to the message demodulator. This ensures that the system
operates on the wanted signal rather than interference. A block
diagram of this simple method of achieving power control is given
in Fig 3.3.
2 9
3 0
BS = Base Station M = Mobile
Fig 3.4 Layout for Co-Channel Interference Calculations
Fig 3.3 TRANSMITTER POWER CONTROL
31
3.5 Spectral Efficiency in Cellular Systems
It is useful to compare the spectral efficiency of direct sequence
and existing mobile ratio systems. Generally frequency reuse is
obtained by spatial separation, leading to mobile radio systems
being interference limited. Thus for acceptable operation it is
necessary to have a minimum protection ratio against co-channel
interference. This leads to a minimum separation distance for
frequency reuse. For narrowband modulation techniques a paper
by Gosling^ evaluates the spectral efficiencies as a function of
protection ratio.
To make a meaningful comparison of spectral efficiencies
it is necessary to compare like with like. Hence following Gosling
consider a large coverage area divided into many equal area
hexagonal cells, as shown in Fig 3.4. At the cell centre is a base
station having M equal power transmitters for communication to
mobiles in the cell. Base stations using the same frequency bands
are spaced distance r apart. The mobiles are assumed to have
omnidirectional antennae as are the base stations, whilst a fourth
power propagation law is assumed. Thus a mobile located on the
line joining a wanted and unwanted base station and a distance
xr (o<x<l) from the wanted base station will receive power Pw
from it, where
The total received interference Pj will be due to M-l other
transmissions originating from the wanted base station and M
interfering transmissions from the distant cell using the same
frequency band.
32
Hence aM - 14 4
x r ( 1- x ) V(3.15)
Internal External
This can be rearranged to give the input signal to interference
ratio as :
________1___________ (3.16a)
H (M - 1) + M x4S
(1-x)
which can be rewritten as :
,S-) >‘/i
1
(M-1) + M
(3.16b)
V = 1-x
If the mobile is on the limit of its service area then V is the
ratio of interference range to service range.
Assuming that the input signal to interference ratio is
improved by the system process gain, then the signal to noise
ratio at the input to the message demodulator is :
I
Brf
m(M-1) + M
?
(3.17)
This can be rearranged to give the value for the maximum number
of users of a cell as :
BM =
rf 1 (3.18)
Bm (| /l + 11 + 1
o
Fig 3.5 Graph o f A u d i o O u t p u t Signal to Noi s e Ratio a g a i n s t C a r r i e r to N o i s e R a t i o for V a r i o u s M o d u l a t i o n Schemes.
Thus if F frequency bands have to be used to provide frequency
reuse, the spectral efficiency in Users/MHz is :
106 M = _____ J O 6______+ __________106 ____ (3.19)
F F k f + F B r f ( 1 + ? )
(All Bandwidths in Hz)
For cellular schemes of this type there is generally some fixed
relationship between the number F of frequency bands and the
parameter V.
Table 3.ii shows the user densities obtainable in a direct
sequence system for a range of post despread bandwidths and signal
to noise ratios. As might be expected high spectral efficiencies
only occur for low signal to noise ratios and small bandwidths
at the despreader output. However the spectral efficiency falls
as the position of the interfering cells moves outwards. Under
these conditions the interference is predominantly from the users
own cell, rather than from distant cells. The decrease in
interference allows more simultaneous users in a cell, though
not proportiona11y to the number of frequency bands needed to
achieve this. Hence the number of users per unit bandwidth
decreases. The user density is largest for the single band
case with interference from immediately adjacent cells and is
half of the maximum obtainable if co-channel interference is
absent. (V = °°)
For convenience Fig. 3.5 shows the relationship between audio
output signal to noise ratio and despreader output signal to noise
for a range of speech conversion schemes. The graphs were plotted
from the same information used to derive table 2.1 in section 2.5,
and assume a 3 KHz speech bandwidth.
Thus using Fig. 3.5 and Table 3.ii it is possible to obtain
the spectral utilisation for a system using any of the speech
conversion schemes shown. Consider a system for which a minimum
audio signal to noise ratio of 12 dB is required and only a single
frequency band is to be used. Using a 10 KHz p.d.m. speech
conversion scheme Fig. 3.5 shows that a 13.5 dB despreader output
s.n.r. is required, which interpolating from Table 3.11 permits a
spectral utilisation of 2.28 Users / M H z . However a 25 KHz p.d.m.
scheme requiring only a 5 dB despreader s.n.r. can achieve 6.37
Users / MHz.
For comparison user densities for narrowband modulation
techniques are given in Table 3.iii as a function of the required
protection ratio. This analysis included the effects of Rayleigh
fading due to multipath propagation. However no account of
multipath propagation was taken in calculating the user density
for direct sequence systems. This topic is discussed elsewhere
in this thesis as are the effects of shadowing, both of which
lower the allowable user density of direct sequence systems.
Hence the figures for the spectral efficiency of direct sequence
systems evaluated here should be taken as upper bounds, only
attainable under ideal conditions.
The wideband and narrowband analyses only considered the
interference arising from the most proximate co-channel cell.
However interference is present from other co-channel cells
though at a lower level. Nevertheless this may be significant at
certain positions of the mobile on the boundary of the cell.
User density figures for narrowband mobile radio systems
11 15have been calculated by other authors ’ and show reasonable
agreement with those of Gosling. The values in Table 3.i i i compare
well with those for the user density of a frequency hopping scheme
described by Cooper and Nettleton.^
3 3 a
3 4
3.5.1 Problems of Comparison
It is difficult to make accurate comparisons of the spectral
efficiencies of mobile radio systems because of the many variables
involved. Obviously as a start the analysis must be performed
on systems operating under identical conditions. Even then the
results can vary from analysis to analysis depending on the
initial assumptions made.
An area where problems can arise is in measuring the system
performance. Generally for speech communications the system quality
is measured by the audio signal to noise ratio. This may be
unsatisfactory where the audio interference is not noise but some
other form of degredation, perhaps of an intelligible nature.
The subjective effects will probably be different to that of true
noise of an equivalent power. Connected with this is the minimum
required performance for reliable communication. This is
important in direct sequence systems where the spectral efficiency
is highly dependent on the required signal to noise ratio.
It is apparent that direct sequence systems can achieve
user densities of the same order of magnitude as narrowband
systems, the actual user density obtainable varying with the
system parameters chosen. It should be noted that the signal to
noise ratios given in Table 3.i i are those at the input to the
message demodulator. The audio signal to noise ratio will generally
equal or exceed these values. On this basis direct sequence systems
can be considered as spectrally efficient as conventional modulation
techniques. Furthermore, spread spectrum techniques show several
advantages over conventional systems.
In practical systems most users are only likely to be active
for a small fraction of the time. As all direct sequence users are
identical, except for spreading sequence, users can replace each
other with no difference to the system. Hence providing the
activity is evenly distributed in time it is possible to have many
more potential users than active users in the system. Free access
to the channel is available at all times, though communication may
be difficult when many users are active. Thus the system will tend
to be-self regulating. When the loading is high users with non
urgent messages will find communications difficult due to the
low signal to noise ratio. They may then cease communicating
until conditions are more favourble. Users with urgent messages
will probably develop more precise methods of communicating and
will be able to operate under all conditions. These latter
points are concerned with operating technique and are
therefore matters of conjecture.
This situation should be contrasted with that for schemes using
conventional narrowband modulation techniques. Again advantage can
be taken of the low user activity factor to allow many more potential
users than active users in the system. To do this entails channel
sharing between users, implying that access to the channel may be
restricted. In large schemes some form of channel assignment technique
is necessary requiring a central control and considerable extra
circuitry at the mobile. Such techniques may not adapt easily to
changed circumstances and do not provide unrestricted access to the
channel.
3.6 Aspects of System Organisation
It has been shown that direct sequence spread spectrum
techniques allow several links to communicate simultaneously
over the same channel without undue mutual interference. To make
effective use of this facility requires some system organisation
as the following discussion will illustrate. For simplicity a
large area coverage scheme will be considered in which a central
base station serves a small fleet of mobiles. The use of separate
bands for transmission to and reception from the mobiles is
assumed as is the use of power control at the mobile.
If simultaneous communication with several mobiles is required
then a corresponding number of links must be set up. On this
basis it is reasonable to assign to each mobile its own spreading
sequence which acts as a unique address and allows selective calling
thereby. Thus the base station only requires a small number of
transmitters and receivers which can be programmed with any of
the spreading sequences in use. When contact with a particular
mobile is required the appropriate spreading sequence is programmed
into an available transmitter/receiver and the mobile called.
When a mobile wishes to initiate a contact problems arise
as the base station will not know which mobile is calling.
Consequently the base station will not have a transmitter/receiver
programmed with the appropriate spreading sequence. This problem
can be overcome in a number of ways, the most apparent being
scanning or the use of a calling channel.
In scanning, as the name implies, a base station receiver
is regularly programmed with all the inoperative spreading
sequences one at a time. The presence of a signal at any instant
identifies a calling mobile allowing a transmitter/receiver to
be programmed for communication.
3 6
An alternative is the use of a dedicated calling channel
or more appropriately calling sequence. Mobiles wishing to i
initiate a contact would transmit an identifying signal using
a common spreading sequence. This signal is received at the
base station and causes equipment for communication to be set
up as before. This system is perhaps more complicated than the
previous one and problems would arise if several mobiles tried
to initiate contacts simultaneously. Also the calling channel
would reduce the spectral efficiency of the system slightly,
though being low data rate it could be low power.
In the base station to mobile direction a form of calling
channel/sequence is particularly valuable. It would provide
an acknowledgement to a cal 1 ing mobi1e that its call had been
successful. If operated continuously it would provide a
suitable signal for controlling mobile transmitter power control
circuits. Finally the calling sequence could be used as a
broadcast facility and might also find use for synchronisation
purposes.
UNIVERSITY LIBRARY LEEDS
38
Table 3.i
Number ot unique sequences and cross-correlation factor
against sequence length for maximal length sequences
Number of Sequence
Shift Register Sequence Number of Cross-correlation
Stages Length Sequences'^Q
Factor
2 3 1
3 7 2 0.714
4 15 2 0.466
5 31 6 0.291
6 63 6
7 127 18 0.134
8 255 16
9 511 48
10 1023 60
11 2047 176 0.047
12 4095 144 0.078
13 8191 630 0.016
14 16383 756
15 32767 1800
16 65535 2048
17 131071 7710
18 262143 8064
39
Number of Users/MHz for Direct Sequence Cellular System
Table 3.ii
Despreader
Output s.n.r. (Minimum dB)
V = 1
Bm
25kHz
F = 1
Bm
10kHz
V = 2
Bm
25kHz
F = 3
Bm
10kHz
V = 3
Bm
25kHz
F = 4
Bm
10kHz
0 20.05 50.05 12.58 31.40 9.90 24.72
5 6.37 15.86 3.99 9.95 3.17 7.83
10 2.05 5.05 1.28 3.17 1.02 2.49
15 0.68 1.63 0.42 1.02 0.33 0.80
20 0.25 0.55 0.15 0.34 0.12 0.27
25 0.11 0.20 0.07 0.13
(Assumes 10 MHz spread bandwidth)
V = Ratio of interference range to service range on boundary
F = Number of frequency bands required
Bm = Post despreader filter bandwidth
Table 3.iii
Number of Users/MHz for frequency modulation (from Gosling ^ )
Modulation
25 kHz F.M.
12.5 kHz F.M.
Protection ratio dB
3<a<9.5 9.5<a<18.5 18.5<a
10
20
5.7
11.4
4.4
8.8
a = Protection ratio
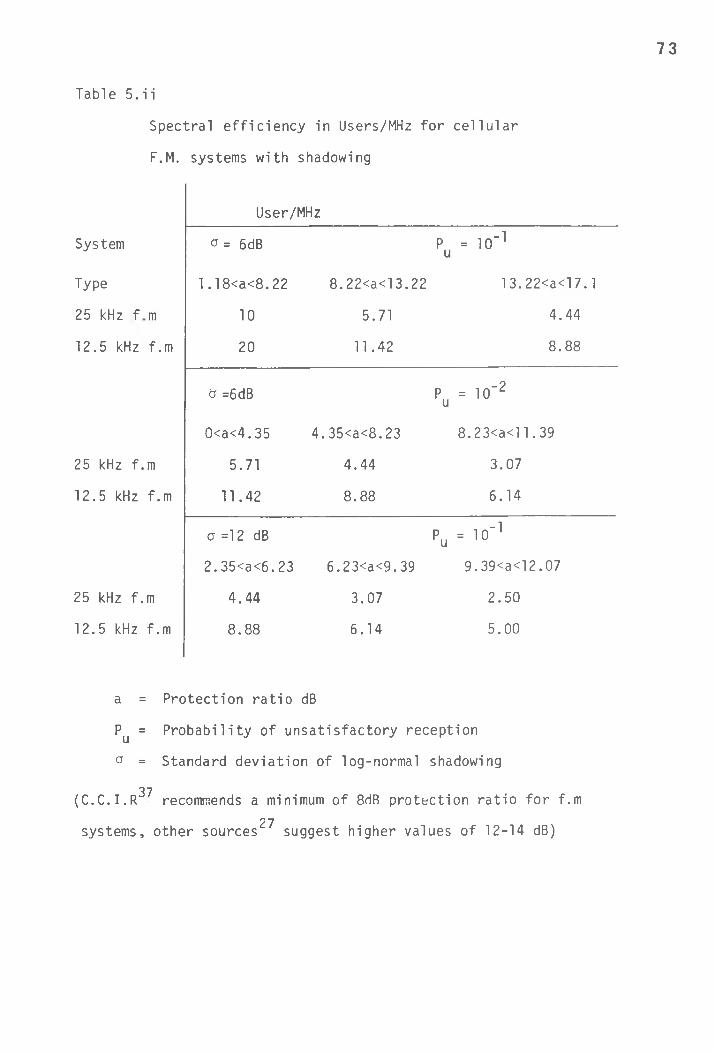
37(C.C.I.R. recommends a minimum of 8 dB protection ratio for
27f.m. systems, other sources suggest higher values of 12-14 dB).
CHAPTER 4
BANDSHARING
CHAPTER 4
BANDSHARING
Up to the present point in the thesis consideration has been
given to spread spectrum systems sharing a common wideband channel.
In view of the wide bandwidth required it is unlikely that channels
could be allocated for exclusive use by spread spectrum systems.
Hence the possibility of bandsharing with existing narrowband
systems requires investigation. The onus falls on the spread
spectrum system to prove that negligible interference would be
caused to existing systems. Having established this then it remains
to show that spread spectrum systems could operate satisfactorily
under these conditions.
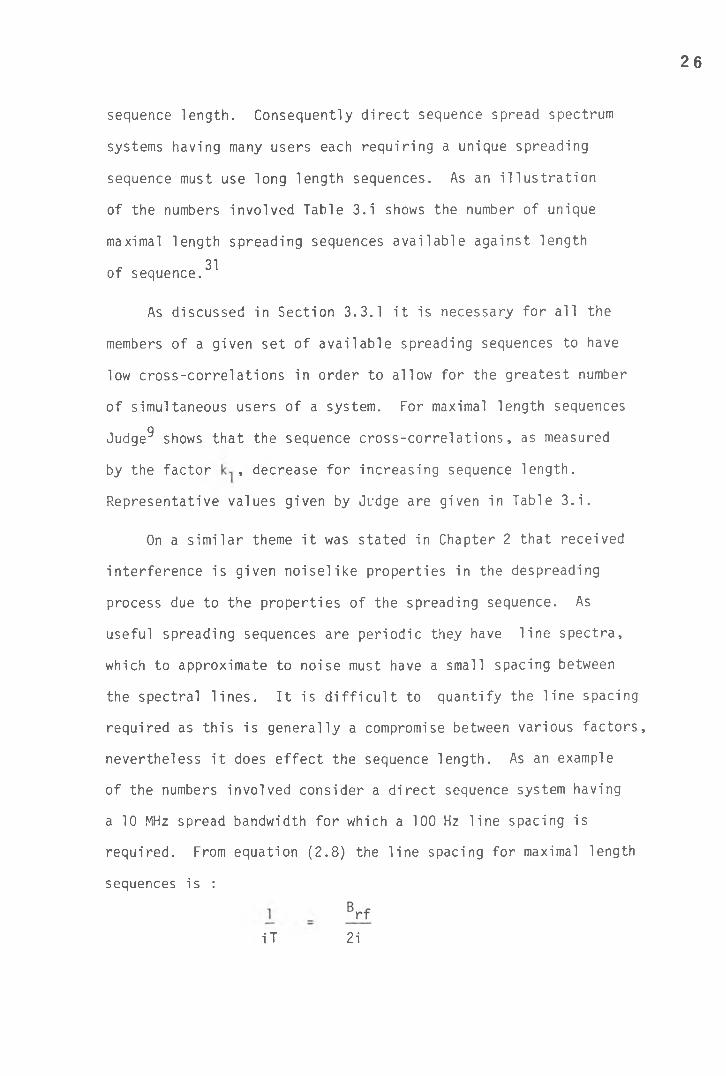
4.1 Interference to Narrowband Systems
For the narrowband system the concern is in the level and
nature of the interference resulting from the spread spectrum
overlay. To evaluate these consider the situation of a narrowband
system operating in a band in which a single direct sequence
transmitter is operational. The frequency domain representation
is shown in Fig 4.1, where the effects of receiver noise and
other interference are neglected. The direct sequence power Psn
accepted by the narrowband receiver is dependent on the power
spectral density _S_(f) and the receiver frequency response |Hn(f) | .
Thus:oo
P sn = f | H n ( f ) | 2 _ S ( 0 df ( 4 -] )— OO
Considering the single sided spectral density, which for a long
length maximal sequence is :
4 0
41
Fig. 4.1 Narrowband receiver tuned over
Direct Sequence Transmission
*------------------------------ B r f -------------------------------- >
Fig. 4.3 Direct sequence receiver tuned
over narrowband transmission
42
A ( f ) = PsT
equation (4.1) becomes :
oo
Psn - f | H n(f)|2
sin II T (f-fo)
n T (f-fo)
P,Tsin ITT (f-fo)
ITT (f-fo)
df
(4.2)
If the receiver passband is assumed to have the form:
'l
H (f) = n v '
f Bn ^f £ fn + Bn n ' T ~T
0 elsewhere
i.e. a rectangular passband of width B n centred on fn, the direct
sequence power P sn appearing at the output becomes :
f n + t t 2
sn
fn - Y
This can be rearranged to give :
B
r
P ST sinll T (f-fo)
-/ r>n T (f-fo)_
df (4.3)
sn Ps dx (4.4)n x,
fo)
The worst case situation occurs when the narrowband receiver has
its passband centred on the direct sequence carrier (fp = f ), thus:
, - I B n p
Pc = 2 I 2 Ks sn
sin II x \ dx
nx
(4.5)
T Bn Ps - 2Ps Bn- (Bn« B rf)Brf
43
IDO
'd-O
COO
(XIo
_ oC\J
cn
Oc\ jI
ocoi
oI
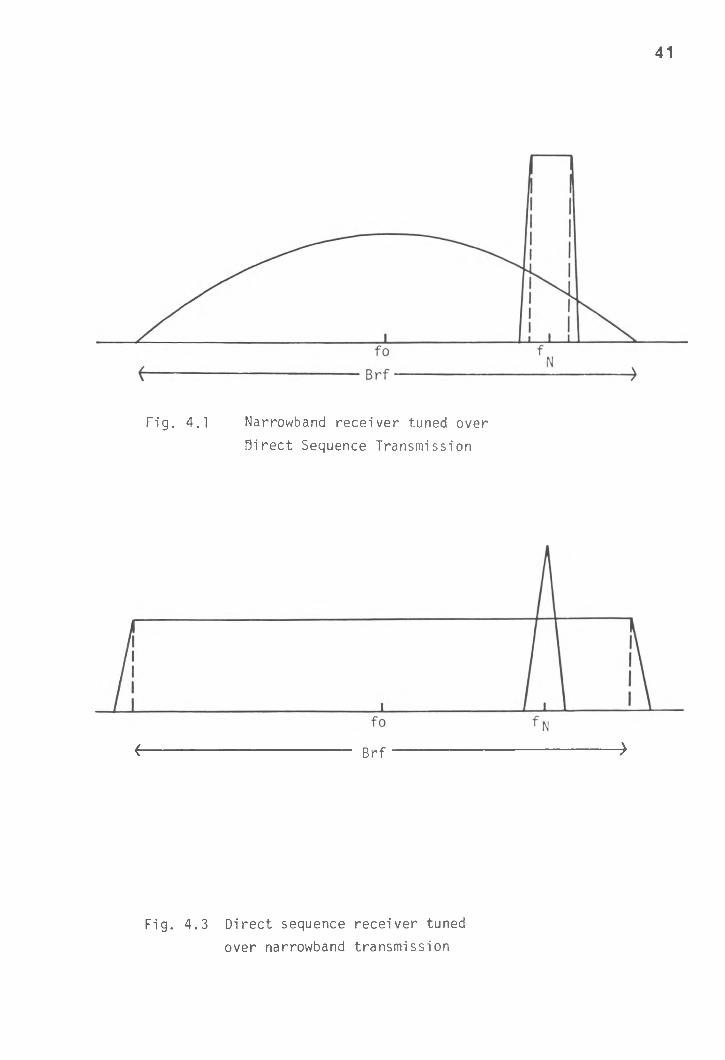
Graph
showing
ratio
of
direct
sequence
power
at
output
of
narrowband
receiver
to
total
direct
sequence
power
against
bandwidth
ratios
44
Equation (4.5) has been plotted in Fig 4.2 for various ratios
of narrowband to spread spectrum main lobe bandwidths. The vertical
axis shows the ratio of power accepted by the narrowband receiver to the
total direct sequence power. The results can be extended to the
situation of many interfering direct sequence transmitters by
superposition. It is apparent that for small ratios of narrowband
to spread spectrum bandwidths the direct sequence power entering
a narrowband receiver can be small. Knowing the narrow band signal
power Pn Fig 4.2 can be used to evaluate the signal to interference
ratio at the narrowband receiver.
For example :
Ps = Pn Brf = 10 MHz Bp = 104 Hz
fn = f0
= - 26dB
Ps
The level of interference having been evaluated it remains
to discuss its nature. The above analysis assumed the direct
sequence signal to have a continuous spectrum, implying a close
line spacing. Thus to a narrowband receiver the direct sequence
signal will be indistinguishable from Gaussien noise. This is the
case, for filtered maximal length sequences are often used as
white Gaussien noise sources. As the sequence length decreases
the direct sequence spectrum becomes a line spectrum. Providing
the line spacing remains fairly small, with many lines in the
narrowband passband, the same conclusion holds. However as the
stage is reached where the receiver passband contains only a few
lines the interference cannot be considered noise like.
4 5
4.2 Interference to Direct Sequence Systems
The previous section examined the effect of direct sequence
transmissions on narrowband reception. Hence it remains to evaluate
the effect of narrowband transmissions on direct sequence reception.
Intuitively it is expected that the narrowband signals would be
reduced in their effect by the spread spectrum process gain. To
illustrate this consider initially the situation of a single
narrowband transmission located in the passband of a direct sequence
receiver, as shown in Fig 4.3. Assuming that the narrowband signal
and spreading sequence are unrelated then the interference power at
the direct sequence message demodulator is:
oo
Pns = J K (f)|2 [c(f) * (f)] df (4.6)— OO
Using the single sided spectral representation the spreading
sequence can be taken to have the spectral density :
. .. ..12C(f)
sin nTf]
n Tfj
Thus the interference power becomes :
Pns
0° oo .
f lH (f )|2 I sin IlT(f-g) j Pp (g) dg df (4.7)
L S 1 L \ n T( f-g) /
(where the convolution of power spectral densities has been
expanded).
Furthermore if the pre-demodulator filter has a rectangular
passband of bandwidth centred on f , then
P
f0 + % 0 0 / \ of~ 2 T (sin nT (f-g) | pn(9) dg (4 -8 )
ns
f . hi -°°1 o 2
n T (f-g).
4 6
Knowing the form of the narrowband spectral density the resultant
interference to the direct sequence message demodulator can be
evaluated.
For the situation where the narrowband signal has a small
bandwidth compared to the direct sequence signal it is reasonable
to write:
_Pn_(f) = Pn 6(f-fn ) (4.9)
This approximates the narrowband signal to a carrier.
p = [f° + ^ f pnx ( sin HT(f-g)]2 6(g-fn ) dg dfThusns
f . 4 i, ' "T(f'9>/ <4.10)To 2
which can be rearranged to give :
r° + \ P T / sin nT(f-fn )|2 df (4.11)
Pns = I n \ nT(f-fn y
f _ ^
2
This equation is in an identical form to equation (4.3) dealing
with the interference output from narrowband receivers produced by
direct sequence transmissions. Hence similar results and
conclusions apply as reached earlier. The worst case situation is
when the interfering signal is centred on the direct sequence
carrier.
In these circumstances :
P„s = 2 pn 8m (4 -12>
BrfAs expected the narrowband interference is reduced by the direct
sequence process gain. Also interferers located away from the
carrier produce less interference at the message demodulator.
The interference output for the situation of many interfering
transmitters can be calculated by an extension of this analysis.
4.2.1 Problems with Multiple Narrowband Transmissions
Some care is required in interpreting the situation. Consider
a direct sequence system operating over a band shared with many
narrowband systems. Due to the number of signals the signal to
interference ratio at the message demodulator may be low. If
in an attempt to improve this the process gain is increased by
increasing the occupied bandwidth extra interference enters the
receiver from narrowband transmissions which now fall in the direct
sequence passband. Hence the expected improvement in signal to
interference ratio is not achieved. If in some defined sense
the average total narrowband power per unit bandwidth is constant
then the signal to interference ratio at the direct sequence message
demodulator will be fixed regardless of spread bandwidth. The
situation is akin to that of white noise interference where the
interference level at the message demodulator is independent
of spread bandwidth.
The above analysis has investigated the compatabi1ity of direct
sequence spread spectrum and narrowband systems. It shows that the
interference caused to one system by the other is fairly innocuous
providing the interference power is not excessive. Hence the
possibility of bandsharing by both systems.arises. Whilst
bandsharing is possible it would be difficult for the two systems
to simultaneously share a common service area. The interference
levels would be too high for satisfactory operation of either
system.
47
However bandsharing would be practicable where the systems
used adjacent service areas. The interference levels would be
acceptable, except perhaps on the boundaries where the signal
to interference ratio would be at its lowest.
To minimise interference the available bandwidth should be
split into two. Both spread spectrum and narrowband systems
covering adjacent service areas would use the same band for
mobile to base transmission and the remaining half for base to
mobile communication.
Whilst bandsharing with existing mobile radio systems is
possible there are considerable organisational problems. However
one part of the spectrum where bandsharing appears feasible is
the U.H.F. television band (U.K.) In any given geographical
area only a part of the band is used for local television
reception, the remainder is left fallow to prevent co-channel
interference between transmitters serving different areas. Hence
spread spectrum systems could operate in the fallow band, where
they would only cause interference to receivers in adjacent service
areas. The television receivers in these areas might gain some
added protection due to their antennae rejecting the direct
sequence transmissions. Also the location and coverage area of
the television transmitters is known, enabling the system to be
planned for least overall interference. If required,techniques^’̂
could be used to prevent spread spectrum operation in the channels
used for broadcasting in the immediate adjacent areas. The idea
18 19is discussed by Ormondroyd ’ who provides information on the
protection ratio's required for minimal television interference.
4 8
CHAPTER 5
PROPAGATION EFFECTS
CHAPTER 5
PROPAGATION EFFECTS
The land mobile radio environment provides possibly the
most difficult channel over which to provide a radio communications
link. The transmitted signal is degraded by the channel making
it difficult for the receiver to produce a useable output. The
degredations are caused by the methods of propagation which
are closely related to the environment in which the system is
operating. It is thus important to investigate the effects of
the channel on direct sequence spread spectrum systems to evaluate
their suitability for land mobile radio use. This task will be
undertaken here and where relevant comparison made with narrowband
systems. Before doing this a brief discussion of the channel
characteristies is worthwhile.
5.1 The Land Mobile Radio Channel
20It is generally accepted that the land mobile radio channel
has the following characteristics :
a) Mean signal strength related to distance
b) Doppler shifts
c) Shadowing
d) Multiple propagation paths
The list is not complete, though these are the pertinent
characteristics. Also the characteristics listed are not exclusive
to the mobile radio channel.
The variation of signal strength with distance is not a channel
degredation per se. However it is perhaps the most important factor
to be considered in the design of a radio communication system.
49
50
In most land mobile radio systems the doppler shifts encountered
are small (<100 Hz) and are in consequence not troublesome.
However in those systems where phase coherence is important the
tracking loops can be designed to compensate for doppler shifts
of this magnitude. Finally doppler shifts in the received signal
only occur when there is relative motion between transmitter
and receiver.
The characteristics of shadowing and multiple propagation
paths are almost unique to the land mobile radio channel. They are
the characteristics which cause the degredation of signals sent
over the channel and arise from the method of propagation.
In urban and suburban areas, radio waves to and from low
21aerials are propagated predominantly by reflection and diffraction.
Shadowing is caused by obstacles blocking the propagation
path, resulting in a shadow area into which signals are not
directly propagated. Consequently signals only reach the shadow
area by diffraction, which results in a mean signal strength less
than predicted directly from free space/plane earth propagation
models. Furthermore the mean signal level varies over small areas
in which it would otherwise be expected to remain sensibly constant.
This spatial variation is only apparent over distances of many
tens or hundreds of wavelengths. By its nature shadowing affects
all frequencies equally in a given band and can be viewed as
a kind of extra path loss.
Multipath propagation is caused by the reflection of the
transmitted signal by obstacles in the locality. Thus the received
signal is composed of many components of varying amplitudes and
51
phases. At a fixed location these will interfere either
constructively or destructively depending upon the frequency.
Hence the channel has a frequency response comprising peaks and
nulls. At a fixed frequency the channel response will be a function
of position, having a spatial distribution of peaks and nulls.
The spacing between nulls is of the order of a wavelength or
less.
An assessment of the effects of shadowing and multipath
propagation on a radio communications scheme can take several
forms. An obvious approach is to consider a single link in
isolation and investigate the effects of the channel on the output
quality. An alternative approach is to consider a scheme in
which many links are operating. Here the effects of the channel
on output quality of a single link could be investigated along
with any effects on the operation of the complete system. Both
approaches have their merits though the latter is more
valuable for systems design and operation.
For either approach it is simplest to investigate the effects
of shadowing and multipath propagation separately. This is valid
as the two modes of propagation are essentially independent.
However in practical mobile radio channels both shadowing and
multipath propagation are likely to be present simultaneously.
5.2 Effects of Shadowing in Area Coverage Schemes
To analyse the effects of shadowing on a direct sequence
spread spectrum system consider initially a single area coverage
scheme. This has a central base station attempting to provide
complete coverage to the service area. The only interference is
52
that arising from other users in the service area. Neglecting
for the moment receiver noise we shall investigate the effect of
shadowing on the spectral efficiency of the system.
Consider initially the base to mobile direction of
transmission. The signals arriving at the mobile will have
travelled over the same path. Thus it is reasonable to assume
that the shadowing on each is totally correlated. Hence the
ratio of wanted signal to other user signal power will be
constant regardless of the position of the mobile and regardless
of the shadowing. In the mobile to base direction of transmission
signals reaching the base station will have travelled over
different paths. Consequently the shadowing is likely to be
uncorrelated between the incoming signals. However assuming
each mobile/base station path to be reciprocal the mobile power
control circuit will ensure equality of received signals at the
base station. Hence the ratio of wanted signal to other user
signal powers will be the same for all users. Thus for this
scheme shadowing causes no reduction in the number of allowable
simultaneous users.
The above statement requires qualification to indicate the
tacit assumptions in the argument. The problems arise in those
locations where the path loss is high, i.e. deep fades. It was
assumed that the mobile power control was effective at all
signal levels. However this may not be the case for low signal
levels, where considerable mobile transmitter power would be
required. Furthermore the analysis assumed that at all times
the wanted signal was well above the noise level, predominantly
receiver noise. Again this will not be true for deep fades.
* There is no work to support or dennounce the existance of reciprocal paths other than the Lorentz reciprocity theorem39.
The situation is similar to that for narrowband transmission.
For reasonable coverage of a given area high transmitter powers
are required to overcome the extra path loss (over free space/
plane earth). Also unless repeaters or other schemes are used
there will be locations to or from which communication is impossibl
5.3 Effects of Shadowing in Small Cell Schemes
Complications arise when shadowing in small cell schemes is
considered. Here the shadow fading on signals to and from
separate base stations may not always be correlated. Hence there
will be times when the ratio of wanted signal to total unwanted
signal power will be less than expected. This is due to the
mobile being shielded from the wanted local base station and
in 'full view' of an interfering base station. The situation for
15conventional narrowband modulation methodsis discussed by French,
who shows the deleterious effects of shadowing on the spectral
efficiency of cellular narrowband systems.
This work can be used to gain a reasonable estimate of the
effect of shadowing on the spectral efficiency of a cellular
direct sequence mobile radio system. Consider the situation
shown in Fig 5.1 for which the following are assumed :
a) Each cell has a central base station for communications
with the mobiles in that cell.
b) Frequency reuse is obtained by spatial separation.
c) Each mobile has its own unique spreading sequence.
d) Only interference is from transmissions in the
wanted mobiles cell and the nearest adjacent
unwanted cell.
54
^--Mobi 1 e
\
Fig 5.1 Layout for Co-channel Interference Calculations
with Shadowing
e) No other interference or propagation effect
is present.
Due to local obstacles there is shadowing on all signals
giving rise to wideband fading. The shadowing on all signals
from any base station is assumed correlated, whilst the shadowing
between signals from adjacent base stations is independent,
i.e., uncorrelated. The shadowing is assumed to have a log-normal
probability density function.
Consider the base station to mobile direction of
transmission only. For a given wanted mobile close to the
cell boundary let the received wanted signal power from the
wanted base station transmitter be P . Now if there are a total
of M active users per cell, including the wanted mobile, the
total received interference power from the base station in that
cell will be :
(M - 1) Ps (5.1)
From the nearest adjacent unwanted cell if each transmitter
produces a received interference power of Pj at the mobile, then
the total interference power received by the mobile from this
cell is :
M Pj (5 .2 )
Hence at the mobile the ratio of wanted signal power to
total interference power (S/I)j is :
/s\ Ps (5.3)
\ T /, “ (M-1)PS + MP,
This is improved by the system process gain to produce a signal
5 5
to interference ratio (S/I)0 at the message demodulator,
input where :
S
(M-1) + M Pj
( 5 .4 )
Obviously there is a minimum acceptable value of signal to
interference ratio (S/ 1)Qn1 -jn at the input to the message
demodulator, below which system operation is unsatisfactory.
This must correspond to a worst case situation when the maximum
number of allowable simultaneous users are active.
5 6
Hence for the situation considered system operation is
unsatisfactory if :
J s'(M-1) P + MPj orrn n
which can be rearranged as :
M
- M + 1
.(S/I ̂ omin
This can be rewritten as :
where M
- M + 1
(s/n .v ' o m m
( 5 .6 )
( 5 .7 )
( 5 .8 )
Now fading due to shadowing is a statistical process and the
interest is therefore in the probability of unsatisfactory
reception, i.e. :
P ( P s £ P i 6 ) (5 .9 )
Thus Fig 4 , Section V of French can be used to evaluate a
value for $ as this corresponds to the protection ratio required
in narrowband modulation schemes.
Hence knowing 3 a value for the maximum allowable number
of simultaneous users M can be evaluated. This of course depends
on the mean received signal powers "F" and F ^ and also on the
desired probability of not being able to communicate.
G_E
(S/I),
Hence M = + 1 (5.10)
omin
1 + I3
Substituting for the process gain from [2.2) and rearranging
gives a value for the spectral efficiency in users/MHz :
M^77 " Brf m
106 06
( L n
+B *rf
I W )
(5.11)
(all bandwidths in Hz)
Consider the wanted and interfering base stations to be
situated a distance r apart. Let the wanted mobile be on the
boundary of its cell on the line joining the two base stations and
distance xr (0<x<l) from the wanted base station. Assuming
equal transmitter powers and the use of omnidirectional antennae,
then for a fourth power propagation law the mean received wanted
transmitter power F g is :
F a — L _ <5 -12a)ps a - 4 -3-x r
Whilst the mean received interference power Fj from the
interfering cell is :
1
5 8
Hence
h. -
Where V =
Hence from French
6 =
As in Section 3.5 equations (5.11) and (5.14) can be used
to obtain values for the user spectral density under various
conditions. Typical figures are given in Table 5.i for the
spectral efficiency in users/MHz for 10 MHz spread bandwidths.
To permit a comparison with the results given in Table 3.ii
account has been taken of the number of frequency bands F
required to provide frequency reuse, following Section 3.5.
For the purposes of comparison table 5.ii shows the spectral
utilisation of cellular f.m schemes operating under identical
conditions. The values given are based on the work of Gosling
and French. Examination of tables 5.i and 5.ii shows that an
increase in the standard deviation of the shadowing or a decrease
in the allowable outage time reduces the spectral utilisation
of f.m and direct sequence modulation schemes.
Comparison of tables 5.i and 3.ii shows that shadow fading
reduces the spectral utilisation of direct sequence systems, the
reduction being greatest for small reuse distances. When the
reuse distance is small the ratio of mean wanted signal power
to mean co-channel interference power is small. Consequently
a large protection margin is required to ensure reliable operation
(1 - x)‘
x4
1 - x
= V
Qzd/10
(5.13)
(5.14)
in the presence of shadow fading. To provide this protection
margin a reduction in the number of active simultaneous
users is necessary. Hence the spectral utilisation of the
complete system decreases from the situation where shadowing
is absent.
As the reuse distance increases the mean ratio of wanted
signal power to co-channel interference power also increases.
Thus the protection margin required against shadow fading
decreases with a consequent increase in the spectral utilisation.
As the spacing between co-channel cells increases the spectral
utilisation will approach that for the situation where shadow
fading is absent.
Thus for cellular direct sequence systems operating under
conditions of shadowing several frequency bands are required to
provide greatest spectrum utilisation. This contrasts with the
analysis in Chapter 3, where shadowing was absent, for which greatest
spectrum utilisation was achieved using a single frequency band.
The relationship between despreader output signal to noise
ratio and audio signal to noise ratio is shown in Fig. 5.4 for a
range of speech conversion schemes. This is to be used in conjunction
with table 5.i in an identical manner to the use of Fig. 3.5 with
table 3.ii in Chapter 3. As an example of the numbers involved
consider a direct sequence system using a 25 KHz p.d.m. speech
conversion scheme which is required to maintain a minimum 12 dB audio
signal to noise ratio. Thus from Fig. 5.4 a minimum of a 5 dB
despreader output signal to noise ratio is required. In the presence
of log-normal shadowing having a standard deviation of 6 dB the
5 9
spectral utilisation would be 2.77 Users///MHz for a 10% outage
time. For a similar outage time with shadowing of 12 dB standard
deviation the spectral utilisation falls to 1.12 Usersy/MHz.
Comparison with table 5.ii shows that this particular direct
sequence system has a lower spectral utilisation than 12.5 and
25 KHz f.m. schemes operating under similar conditions and requiri
a 10 dB protection ratio.
S--VFi g » G r a p h o f A u d i o O u t p u t Si g n a l to N o i s e R a tio a g a i n s t C a r r i e r to N o i s e R a t i o f o r V a r i o u s M o d u l a t i o n Schemes.
5.4 Effects of Multipath Propagation
To investigate the effect of multipath propagation on a
direct sequence spread spectrum system consider initially a
single link. For convenience assume that no interference is
present and that receiver noise etc., is negligible. Furthermore,
assume the mobile is stationary.
For a multiple propagation path channel the impulse
response is given by :
nh(t) Z Ej 6(t-A.-D) (5.15)
j=o J
+• hWhere E- is the gain of the j path, A,- is the excess path
J J
delay and D is the minimum propagation delay. Without loss of
generality the minimum propagation delay D can be neglected as
only relative delay is important. Also let the minimum
propagation delay path have j=o i.e., A, = o. Thus theJ
channel impulse response becomes :
nh(t) = E0 S(t) + E E. 6(t - A.) .(5.16)
j=l J J
Consideration must now be given to the signal sent over
the channel. For simplicity this will be a maximal length
sequence p.s.k modulated onto the carrier, no message modulation
being used. Any adjustments to the analysis for message modulation
can be discussed later. Thus the transmitted signal is :
s(t) = c(t) cos (wQ t + 0) (5.17)
[c(t) = ±1 . w Q = 2nf0]
Where c(t) is the maximal length sequence, of bit period T.
60
61
After transmission over the channel the received signal
is :
x(t) = s(t) * h(t)
OO
= f c(t-*q cos (w0 [ t - ^ ] + 0). [ e 0 &{~t)
-oo
(5.18)
nx(t) = E c(t) cos (wQ t + 0) + I E. c(t-A.) cos (w0t + 0 -W0A,)
o j=1 J J
(5.19)
In the receiver this signal is multiplied with a locally
generated replica of the spreading sequence to give :
y(t) = x(t) c(t-d)
= E0 c(t) c(t-d) cos (wQt + 0)
The resulting signal is bandpass filtered prior to demodulation.
As the system is linear it is convenient to consider only a single
delayed component present at the input to the receiver along with
the minimum delay signal. The complete system is as shown in
Fig. 5.2. Hence :
n+ E E. c(t-A •) c(t-d) cos (w0t + 0 -w0A.) (5.20)