34
Monte Carlo Composition Inversion Acceptance/Rejection Sampling Direct Simulation Methods Econ 690 Purdue University Justin L. Tobias Direct Simulation

Monte Carlo Composition Inversion Acceptance/Rejection Sampling
Direct Simulation Methods
Econ 690
Purdue University
Justin L. Tobias Direct Simulation

Monte Carlo Composition Inversion Acceptance/Rejection Sampling
Outline
1 Monte Carlo Integration
2 The Method of Composition
3 The Method of Inversion
4 Acceptance/Rejection Sampling
Justin L. Tobias Direct Simulation

Monte Carlo Composition Inversion Acceptance/Rejection Sampling
Monte Carlo Integration
Suppose you wish to calculate a posterior moment of the form:
E [g(θ)|y ] =
∫Θ g(θ)p(y |θ)p(θ)dθ∫
Θ p(y |θ)p(θ)dθ.
With Monte Carlo Integration, we assume that we can drawdirectly from the posteiror p(θ|y).
Justin L. Tobias Direct Simulation

Monte Carlo Composition Inversion Acceptance/Rejection Sampling
If this is true, then, under reasonable conditions, a law of largenumbers guarantees that
In the above θ(i) iid∼ p(θ|y).
Note that n here is under our control, as it refers to the MonteCarlo sample size rather than the number of observations.
Thus, we can estimate the desired (finite-sample) momentwith arbitrary accuracy.
This technique has a very demanding prerequisite - that wecan draw directly from p(θ|y).
Justin L. Tobias Direct Simulation

Monte Carlo Composition Inversion Acceptance/Rejection Sampling
Method of Composition
The method of composition provides a convenient way ofdrawing from p(θ|y) when the joint distribution isdecomposed into a product of marginals and conditionals, andeach of these component pieces can be easily drawn from.
For example, suppose θ = [θ′1 θ′2]′ and that p(θ2|y) and
p(θ1|θ2, y) are well known densities that are easily sampled.
Justin L. Tobias Direct Simulation

Monte Carlo Composition Inversion Acceptance/Rejection Sampling
Under these conditions, one can obtain a draw from p(θ|y) in thefollowing way:
1
2
Why this works is, perhaps, obvious, but considerA× B ⊆ Θ1 ×Θ2. Then,
Justin L. Tobias Direct Simulation

Monte Carlo Composition Inversion Acceptance/Rejection Sampling
Consider the linear regression model:
y = Xβ + u, u|X ∼ N(0, σ2In)
under the priorp(β, σ2) ∝ σ−2.
In our linear regression model notes, we showed
β|σ2, y ∼ N[β̂, σ2(X ′X )−1]
and
σ2|y ∼ IG
[n − k
2, 2[(y − X β̂)′(y − X β̂)]−1
].
Thus, we can sample from the joint posterior p(β, σ2|y) by firstsampling σ2 from its marginal posterior, and then sampling β fromthe conditional normal posterior.
Justin L. Tobias Direct Simulation

Monte Carlo Composition Inversion Acceptance/Rejection Sampling
The method of composition can also prove to be a very valuabletool for problems of (posterior) prediction.
To this end, consider an out-of-sample value yf which is presumedto be generated by our regression model:
yf = Xf β + uf , uf |Xf ∼ N(0, σ2).
1 Note that yf |β, σ2 does not depend on y . (But does throughβ and σ2. )
2 The goal is to simulate draws from the posterior predictive:
p(yf |y),
which does not depend on any of the model’s parameters.
Justin L. Tobias Direct Simulation

Monte Carlo Composition Inversion Acceptance/Rejection Sampling
To generate draws from this posterior predictive, we first considerthe joint posterior distribution:
p(yf , β, σ2|y).
If we can draw from this distribution, we can use only the yf draws(and ignore those associated with β and σ2) as draws from themarginal p(yf |y).
How can we do this?
Justin L. Tobias Direct Simulation

Monte Carlo Composition Inversion Acceptance/Rejection Sampling
Note
This suggests that draws from the marginal posterior predictivedistribution can be obtained by
1
2
3
4 Note, of course, this requires that Xf is known.
5 Doing this many times will produce a set of draws from theposterior predictive yf |y .
Justin L. Tobias Direct Simulation

Monte Carlo Composition Inversion Acceptance/Rejection Sampling
Let’s apply this method to generate draws from the posteriorpredictive using our log wage example:
log(wage)i = β0 + β1Edi + ui .
The method just described could be applied directly to samplefrom the predictive distribution of (log) hourly wages.
However, the wage density itself is actually more interpretable.
To sample from the posterior predictive of wages (in levels),we can consider drawing from an augmented density of theform:
p(wf , yf , β, σ2|y)
wherewf = exp(yf ).
Justin L. Tobias Direct Simulation

Monte Carlo Composition Inversion Acceptance/Rejection Sampling
p(wf , yf , β, σ2|y)
We can write this joint distribution as follows:
where the last line follows since the distribution of wf only dependson yf and, in fact,
Justin L. Tobias Direct Simulation

Monte Carlo Composition Inversion Acceptance/Rejection Sampling
Thus, within the context of our example, we can generate drawsfrom the posterior predictive distribution of hourly wages wf asfollows:
1 Generate
2 Generate
3 Generate
4 Generate
Justin L. Tobias Direct Simulation

Monte Carlo Composition Inversion Acceptance/Rejection Sampling
We apply this technique to our data set and generate 10,000draws from the posterior predictive distribution of hourlywages for two cases: Ed = 12 and Ed = 16.
The 10,000 draws are then smoothed nonparametrically via akernel density estimator. [I will provide a MATLAB file for youthat does these calculations].
Graphs of these densities are provided on the following page.
Justin L. Tobias Direct Simulation

Monte Carlo Composition Inversion Acceptance/Rejection Sampling
0 10 20 30 40 500
0.01
0.02
0.03
0.04
0.05
0.06
0.07
0.08
0.09
Hourly Wage
Density
Education =12
Education = 16
Figure: Posterior Predictive Hourly Wage Densities
Justin L. Tobias Direct Simulation

Monte Carlo Composition Inversion Acceptance/Rejection Sampling
The (posterior predictive) mean hourly wage for high schoolgraduates is (approximately) $11.07
The mean hourly wage for those with a BA is (approximately)$15.88
The posterior probability that a high school graduate willreceive an hourly wage greater than $15 is
Pr(wf > 15|Edf = 12, y) ≈ .19
The posterior probability that an individual with a BA willreceive an hourly wage greater than $15 is
Pr(wf > 15|Edf = 16, y) ≈ .44
If you are curious, doing the same exercise for someone with aPh.D., i.e., Ed = 20, gives Pr(wf > 15|Edf = 20, y) ≈ .72
Justin L. Tobias Direct Simulation

Monte Carlo Composition Inversion Acceptance/Rejection Sampling
The Method of Inversion
Suppose that X is a continuous random variable withdistribution function F and density f . Further, assume thatthe distribution function F can be easily calculated.
Let U ∼ U(0, 1), a Uniform random variable on the unitinterval, and define Y = F−1(U).
Derive the distribution of the random variable Y .
Justin L. Tobias Direct Simulation

Monte Carlo Composition Inversion Acceptance/Rejection Sampling
U ∼ U(0, 1), Y = F−1(U).
We can establish the desired result using a change of variables.
First, note that
with I (·) denoting an indicator function and U = F (Y ).
Thus,
Therefore Y has distribution function F .
Justin L. Tobias Direct Simulation

Monte Carlo Composition Inversion Acceptance/Rejection Sampling
How is the result we just established useful?
This result is extremely useful in cases where the cdf F and itsinverse are easily calculated because it provides a way togenerate draws from f .
Specifically, we can:
1
2
It follows that Y is a draw from f . We now provide severalexamples of this method.
Justin L. Tobias Direct Simulation

Monte Carlo Composition Inversion Acceptance/Rejection Sampling
Consider an exponential random variable with density function
p(x |θ) = θ−1 exp(−x/θ), x > 0.
Show how the inverse transform method can be used to generatedraws from the exponential density.
Justin L. Tobias Direct Simulation
Monte Carlo Composition Inversion Acceptance/Rejection Sampling
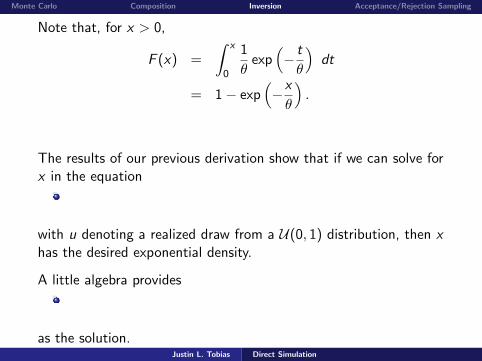
Note that, for x > 0,
F (x) =
∫ x
0
1
θexp
(− t
θ
)dt
= 1− exp(−x
θ
).
The results of our previous derivation show that if we can solve forx in the equation
with u denoting a realized draw from a U(0, 1) distribution, then xhas the desired exponential density.
A little algebra provides
as the solution.Justin L. Tobias Direct Simulation

Monte Carlo Composition Inversion Acceptance/Rejection Sampling
Let x ∼ TN[a,b](µ, σ2) denote that x is a truncated Normal
random variable.
Specifically, this notation indicates that x is generated from aNormal density with mean µ and variance σ2, which istruncated to lie in the interval [a, b]. The density function forx in this case is given as
Show how the inverse transform method can be used togenerate draws from this truncated Normal density.
Justin L. Tobias Direct Simulation

Monte Carlo Composition Inversion Acceptance/Rejection Sampling
For a ≤ x ≤ b, the c.d.f. of the truncated Normal random variableis
Therefore, if x is a solution to the equation
u =Φ( x−µ
σ
)− Φ
(a−µσ
)Φ(
b−µσ
)− Φ
(a−µσ
) ,where u is realized draw from a U(0, 1) distribution, thenx ∼ TN[a,b](µ, σ
2).
Justin L. Tobias Direct Simulation

Monte Carlo Composition Inversion Acceptance/Rejection Sampling
With a little algebra it follows that
x = µ+ σΦ−1
(Φ
(a− µσ
)+ u
[Φ
(b − µσ
)− Φ
(a− µσ
)])is a solution.
When:
b =∞, so that the random variable is truncated from belowonly, we substitute Φ[(b − µ)/σ] with 1 in the aboveexpression.
a = −∞, so that the random variable is truncated from aboveonly, we substitute Φ[(a− µ)/σ] with 0 in the aboveexpression.
Justin L. Tobias Direct Simulation

Monte Carlo Composition Inversion Acceptance/Rejection Sampling
Suppose y |µ, σ2 ∼ LN(µ, σ2), implying
p(y) =1√
2πσ2
1
yexp
(− 1
2σ2[ln y − µ]2
), y > 0.
We seek to use inversion to generate draws from the lognormaldistribution.
Justin L. Tobias Direct Simulation
Monte Carlo Composition Inversion Acceptance/Rejection Sampling
Note, for c > 0,
Let
Then
Thus, setting
produces a draw from the desired lognormal distribution.
Justin L. Tobias Direct Simulation

Monte Carlo Composition Inversion Acceptance/Rejection Sampling
Rejection Sampling provides another way of obtaining drawsfrom some density of interest.
Generally, it proceeds as follows:1 Draw from some approximating density
2 Compute a statistic, like a “critical” value.
3 If some condition is met related to the size of the criticalvalue, then keep the draw as a draw from the target density.Otherwise, start over until the needed condition is satisfied.
Justin L. Tobias Direct Simulation
Monte Carlo Composition Inversion Acceptance/Rejection Sampling
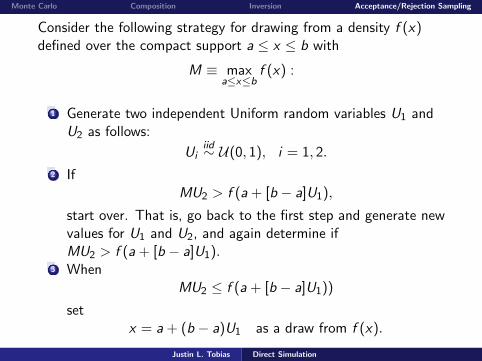
Consider the following strategy for drawing from a density f (x)defined over the compact support a ≤ x ≤ b with
M ≡ maxa≤x≤b
f (x) :
1 Generate two independent Uniform random variables U1 andU2 as follows:
Uiiid∼ U(0, 1), i = 1, 2.
2 IfMU2 > f (a + [b − a]U1),
start over. That is, go back to the first step and generate newvalues for U1 and U2, and again determine ifMU2 > f (a + [b − a]U1).
3 WhenMU2 ≤ f (a + [b − a]U1))
setx = a + (b − a)U1 as a draw from f (x).
Justin L. Tobias Direct Simulation

Monte Carlo Composition Inversion Acceptance/Rejection Sampling
We will answer the following two questions regarding thisalgorithm:
(a) What is the probability that any particular iteration in theabove algorithm will produce a draw that is accepted?
(b) Sketch a proof as to why x , when it is accepted, hasdistribution function F (x) =
∫ xa f (t) dt.
Justin L. Tobias Direct Simulation

Monte Carlo Composition Inversion Acceptance/Rejection Sampling
First, we will consider question (a) and investigate the probabilityof acceptance. Note that
Justin L. Tobias Direct Simulation

Monte Carlo Composition Inversion Acceptance/Rejection Sampling
The third line uses the fact that U1 and U2 are independent,
The fourth and fifth lines follow from the fact thatUi ∼ U(0, 1), i = 1, 2,
The fifth line also applies a change of variable, settingt = a + (b − a)U1.
Thus the probability of accepting a candidate draw in thealgorithm is [M(b − a)]−1.
Note that, when using this method to sample from a Uniformdistribution on [a, b], all candidates from the algorithm areaccepted.
Justin L. Tobias Direct Simulation

Monte Carlo Composition Inversion Acceptance/Rejection Sampling
Let us now move on to part (b), which seeks to establish why thisalgorithm works: Note that
Therefore, a candidate draw which is accepted from theacceptance/rejection method has distribution function F , asdesired.
Justin L. Tobias Direct Simulation

Monte Carlo Composition Inversion Acceptance/Rejection Sampling
Let us now consider an applicaton of this rejection samplingalgorithm.
Consider the triangular density function, given as
p(x) = 1− |x |, x ∈ [−1, 1].
Describe how the rejection sampling algorithm can be used togenerate draws from this density function.
Justin L. Tobias Direct Simulation

Monte Carlo Composition Inversion Acceptance/Rejection Sampling
For this simple example, note that M = 1 and b − a = 2, sothat the overall acceptance rate is one-half.
That is, we would expect that, say, 50,000 pairs ofindependent Uniform variates in the acceptance/rejectionalgorithm would be needed in order to produce a final sampleof 25,000 draws.
Here is a small MATLAB program that does this:
iter = 10000;U2 = rand(iter,1);U1 = rand(iter,1);
fff = U2 - 1 + abs(2*U1-1);points = find(fff <= 0);
draws = -1 + 2*U1(points);
Justin L. Tobias Direct Simulation


