Xylose Upgrade Directing the metabolism of xylose towards P(3HB), xylitol and xylonic acid in Burkholderia sacchari Inˆ es Maria Vicente Palolo Thesis to obtain the Master of Science Degree in Biological Engineering Supervisors: Dr. Maria Teresa Ferreira Ces´ ario Smolders Prof. Dr. Maria Manuela Regalo da Fonseca Examination Committee Chairperson: Prof. Dr. Duarte Miguel de Franc ¸a Teixeira dos Prazeres Supervisor: Dr. Maria Teresa Ferreira Ces´ ario Smolders Member of the Committee: Dr. Maria Catarina Marques Dias de Almeida December 2016
Transcript
Xylose Upgrade
Directing the metabolism of xylose towards P(3HB), xylitol andxylonic acid in Burkholderia sacchari
Ines Maria Vicente Palolo
Thesis to obtain the Master of Science Degree in
Biological Engineering
Supervisors:
Dr. Maria Teresa Ferreira Cesario SmoldersProf. Dr. Maria Manuela Regalo da Fonseca
Examination Committee
Chairperson: Prof. Dr. Duarte Miguel de Franca Teixeira dos PrazeresSupervisor: Dr. Maria Teresa Ferreira Cesario Smolders
Member of the Committee: Dr. Maria Catarina Marques Dias de Almeida
December 2016
To my grandparents, whom I miss everyday.
Once we accept our limits we can go beyond them.Albert Einstein
Preface
The work described in this document was performed under the framework of the curricular course
Master Dissertation in order to obtain the Masters degree in Biological Engineering at Instituto Superior
Tecnico (IST).
All the research was carried out at Institute for Bioengineering and Biosciences (IBB), Department
of Bioengineering, at IST, Alameda campus, from February to November 2016, under the supervision of
the Post-Doc researcher Mª Teresa Cesario and of Professor Mª Manuela Fonseca.
This dissertation consists of a literature review within the experimental work focus, the description
of the obtained results and respective discussion. Finally, conclusions and future work prospects are
described as well.
v
Acknowledgments
First of all, I would like to thank both Professor Mª Manuela Fonseca and Doctor Mª Teresa Cesario
for giving me this amazing opportunity. The work I developed under your oversight in the past nine
months not only allowed me to obtain my Masters degree but also helped me developing my critical
sense and my engineering skills. Also, your vast knowledge in the field and your availability to advise
me and revise my work were crucial to the success of this dissertation thesis, for which I am deeply
grateful.
Now, for the rest of you, this is one of those ”once in a life time” things, and I definitely want to make
it count, so prepare yourselves because I am going to do my best to bring you all to tears!
I would like to start thanking to the engineers around: Rodrigo Raposo and Claudia Henriques, my
predecessors. Your insight knowledge and advice were precious throughout this time, although I decided
to ignore part of them and leave things until the last minute. And also Marisa Santos, who I cannot thank
enough for all the HPLC emergency responses and time spent around that cursed (but very treasured,
and also broken...) machine, and for all your support and advice during my time in the lab.
One of the major acknowledgements goes to the crew of IST’s South tower seventh floor lab: Joao
Lourenco, one of the friends college brought me, and who always cracks ”that” joke lightening up the
mood; Margarida Silva, for always telling me that everything was going to be okay; Ana Santos, for
giving life to the ”thirteen” and for your extraordinary ability to turn any serious and factual conversation
naughty (I am also glad that I can now call you an engineer as well); Ana Pfluck, for your advice and
willingness to, together with Ana S., organize all the social-cultural events in these past months; the
brazilians Darlisson D. Alexandria and Willian Birolli, who cheer up any slow work afternoon in the lab or
lunch hour with fun facts about Brazil or any other subject, and I hope I get to meet you in Sao Paulo in a
not so distant future; and also Marcel Lackner, the funniest german I met so far (and the only one), who I
should remind that offered to give me a Frankfurt city-tour. I want to thank you for all these past months,
for the lunch hours, the dinners out, the people I got to meet through you, but especially for the trips,
since I concquered more portuguese land this summer than in the last 5 years. These are memories I
will always treasure. You were my semester abroad.
I also would like to thank Carolina Gaibino, Ines Maltez and Isabel Lopes, literally my ”homegirls”, for
your support throughout these years. We witnessed each other grow into four fine young women, with
brilliant lives ahead of us. Looking back to where we started, and looking to where we are now... I am
vii
definitely proud of us.
Next in line is Joana Costa, the girl who stood by me since day three of college. We will always have
our disagreements but we just can’t get enough of each other. Thank you for your patience with my
terrible morning mood and for pushing me to get stuff done. Also, to Lia Vieira, Marlene Oliveira, Sara
Estevens, Tatiana Mangericao, and Rui Campos, you are the ”friends-for-life” college brought me, even
if for some reason we follow different paths. You’ve always stood by me and that’s enough. Aside from
my degree, you are the best I could’ve asked for during these years.
Last, but definitely not least, I would like to thank my amazing family, with all its perks, especially
my dad, Victor, my mom, Anita, and sister, Mafalda. This is your concquest too. Your unconditional
love, patience and support during all these years was everything, and without it none of this would have
never happened, and for that you have my eternal gratitude. Thank you for believing in me, sometimes
even more than I believed in myself. I cannot end ”this” without mentioning my grandparents who always
pushed me to do better and be better. Me becoming an engineer was also your dream, and I am sorry
that you’re not here to witness it... I hope I made you proud.
As strange as it sounds, I would like to finish these acknowledgements by thanking Tecnico. You
were the university I didn’t want to get into... and here we are. After seven years of engineering college,
seven years of laughter, exams, tears, group projects, barbecues and lab reports, our relatioship finally
comes to an end. These were without any doubt the best and the worst years of my life. Honestly, I
would do it all over again. It has been a hell of a ride my friend, but it’s time for me to get a life.
Cheers!
Obrigada, e um brinde a vos!
viii
Abstract
Burkholderia sacchari produces insoluble energy-storage compounds called poly-hydroxyalkanoates
(PHAs) when cultivated under unbalanced growth conditions such as excess carbon source and limita-
tion of an essential nutrient. PHAs are biodegradable and biocompatible thermoplastics and thus a
suitable alternative for petroleum-based plastics. Moreover, when cultivated on D-xylose, this strain
is able to produce D-Xylitol and D-xylonic acid. Given the capability of B. sacchari to produce differ-
ent commercially interesting compounds from D-xylose, its potential was explored within the biorefinery
concept.
Opposite to what has been published based on glucose, nitrogen limiting conditions allowed for
higher polymer production compared to phosphorus limited medium. By decreasing the oxygen supply
and thus imposing a double limitation, P(3HB) production was enhanced, achieving yields of 0.07 g
P(3HB)/g xylose and 0.12 g P(3HB)/g xylose in P- and N-limited media, respectively. Based on these
results, improvement of P(3HB) production using a xylose-rich feed (ratio xylose-glucose of 8:1) and
simulating the conditions of an assay carried out previously in our laboratory was sought. By limiting
the oxygen supply to the bioreactor, a yield of 0.15 g P(3HB)/g total sugars, and a polymer content of
30% (g P(3HB)/g CDW) were attained in conditions where no polymer production had been previously
observed.
In short, results suggest that in B. sacchari xylose-cultivations the dissolved oxygen in the medium
is a target factor to enhance P(3HB) production. Additionally, it is shown that depending on the xylose
concentration in the broth, D-xylitol and D-xylonic acid production can be promoted.
Currently, the world population faces two major problems as regards the energy demand and waste
generation. Not only both industrialised and developing countries require an increasingly amount of
energy difficult to fulfil sustainably, but also the energy demand is projected to grow more than 50%
by 2025 (Ragauskas, 2006), and, morevover, the amount of residues generated is growing. Population
growth, booming economy, rapid urbanization, and the rise in living standards have accelerated the solid
waste generation in the world (Minghua et al., 2009; Song et al., 2015). In fact, human population is
expected to increase up to 9.7 billions by 2050 (United Nations Department of Economic and Social
Affairs Population Division, 2015). In 2011, the global solid waste volume was estimated about 11 billion
t per year, and per capita as approximately 1.74 t per year. Along with the large solid waste generation,
an enormous amount of natural resources are depleted everyday (Song et al., 2015).
In the past years, our society has been driven towards sustainability as it becomes more conscious
about the environment. The zero waste (ZW) concept has been highly embraced once it stimulates sus-
tainable production and consumption, optimum recycling and resource recovery, while restricting mass
incineration and landfilling. The Zero Waste International Alliance defines ZW as ”a goal that is both
pragmatic and visionary, to guide people to emulate sustainable natural cycles, where all discarded ma-
terials are resources for others to use”. Also, adopting this strategy means ”designing and managing
products and processes to reduce the volume and toxicity of waste and materials, conserve and recover
all resources, and not burn or bury them” (Zero Waste International Alliance, 2009). However, according
to Zaman (2015), in today’s society, it is not possible to achieve a 100% diversion rate1 in production,
consumption and waste management systems, i.e. it is still not possible to conduct all the waste gen-
erated towards reuse, recycling or composting. Actually, it is necessary a universal transformation of
existing extraction, production, marketing, consumption, management and treatment systems (Zaman,
2015).
Within the ZW concept, the material flow is circular, which means no materials are wasted or un-
derused. If at their end of lives products cannot be reused or repaired, they can instead be recycled
or recovered from the waste stream and used as inputs, substituting the demand for the extraction of
natural resources (Song et al., 2015). Shifting society’s dependence from petroleum-based to renew-
able biomass-based resources is generally viewed as key to the development of a sustainable industrial
society, energy independence, and to the effective management of greenhouse gas emissions (PNNL
and NREL, 2004; Ragauskas, 2006; FitzPatrick et al., 2010).
Biomass represents an abundant carbon-neutral renewable resource for the production of bioenergy
and biomaterials through biorefinery manufacturing technologies. This biorefinery vision will contribute
to sustainability not only by its inherent dependence on sustainable bioresources, but also by recycling
waste. An integrated biorefinery is an approach that optimises the use of biomass for the production of
biofuels, bioenergy, and biomaterials for both short- and long-term sustainability (Ragauskas, 2006).
In 2004, the US Department of Energy (DOE) identified 30 chemicals, derived from the conversion1Diversion rate is defined as the percentage of total waste that is diverted from disposal at permitted landfills and transformation
facilities such as incineration, and instead is directed to reduction, reuse, recycling and composting programs (CalRecycle, 2012).
2
of biomass, which could be used as building block chemicals2 in a bio-based economy (PNNL and
NREL, 2004). Biomass carbohydrates will provide a viable route to products such as alcohols, carboxylic
acids, and esters. Bio-based feedstocks are already having an impact on some practical applications,
including solvents, plastics, lubricants, and fragrances. However, these commercially viable processes
require purified feedstocks. The major impediment to biomass use is the development of methods
to separate, deconstruct, refine, and transform it into chemicals and fuels (Ragauskas, 2006). Since
chemical production requires low volumes of biomass compared to fuel production, there has been an
increasing research interest in the value of bio-sourced materials and effective use of biomass feedstock
(FitzPatrick et al., 2010). The lignocellulosic biomass (LC), the worldwide most abundant renewable raw
material, comprises different fractions such as carbohydrates, proteins, and fats that can be converted
to value-added products, fuels, and chemicals through the implementation of the biorefinery concept.
LC is a promising choice as raw material due to the high worldwide availability, in consequence of the
waste generated by agricultural and forestry processes, to its renewable nature, and to being a carbon
source which is a nonedible feedstock (Cesario and de Almeida, 2015).
Burkholderia sacchari is a Gram-negative poly-hydroxyalkanoate-accumulating bacterium isolated
from the soil of a sugar-cane plantation in Brazil (Bramer et al., 2001). These insoluble energy-storage
compounds called poly-hydroxyalkanoates (PHAs) are produced by many microbial strains under unbal-
anced growth conditions such as presence of excess carbon source or limitation of an essential nutrient
(Lee, 1996; Verlinden et al., 2007). Due to its properties, PHAs are biodegradable and biocompatible
thermoplastics, thus the interest from industry in this strain, capable of metabolising different carbon
sources (namely glucose, xylose, organic acids, etc.), and reach high cell densities, for conventional
petroleum-derived products replacement (Bramer et al., 2001; Cesario et al., 2014; Alexandrino et al.,
2015). Several studies found that B. sacchari accumulates up to 70% of the cell dry weight as poly-3-
hydroxybutyrate (P(3HB)) with different carbon sources (Bramer et al., 2001; Silva et al., 2004; Cesario
et al., 2014; Raposo et al., 2017).
Previous work developed by Henriques (2015) with B. sacchari towards P(3HB) production in a three-
stage continuous system demonstrated low P(3HB) productivities since xylose, one of the main compo-
nents of lignocellulosic hydrolysates, was not consumed for polymer production. Raposo et al. (2017)
carried other studies with this bacterial strain which revealed production of xylitol and xylonic acid, two
value-added chemical compounds, as by-products of bacterial growth on xylose. These studies mo-
tivated further research regarding polymer, xylonic acid and xylitol production using solely xylose as
substrate, and the growth conditions that promote each metabolite formation.
Cultivations of B. sacchari using xylose as main carbon source were performed to study the growth
conditions that promote P(3HB), xylonic acid, and/or xylitol production in both shake flasks and fed-
batch bioreactor cultivations, and the corresponding metabolic pathways. In this context, cultivation
requirements such as the amount of carbon source, nutrient limitations, or oxygen supply were assessed
throughout this work. Furthermore, efforts were made in order to enhance polymer production in the third
bioreactor of the continuous series, by unveiling one possible target factor.2Building block chemicals are molecules that can be converted into several secondary chemicals and intermediates, and, in
turn, into a broad range of different downstream applications.
3
1.2 Objectives
The main goal of this experimental work was the study of the growth conditions that promote poly-
3-hydroxybutyrate, xylonic acid and/or xylitol productions in fed-batch cultivations of B. sacchari using
xylose as main carbon source. The three major objectives for this dissertation are the study of:
1. the conditions that promote xylose metabolism towards P(3HB) production.
2. the bacteria’s potential to produce other important metabolites such as xylitol and xylonic acid.
3. B. sacchari xylose metabolic network.
4
2State of the Art
5
2.1 The Biorefinery Concept
The current energy demand and waste generation crisis, along with the environmental impact caused
by natural non-renewable resources depletion in developing industries and nations, has led towards
a bio-based economy, shifting society’s dependence away from petroleum to renewable biomass re-
sources (Ragauskas, 2006). While the economy of energy can be based on various alternative raw
materials (such as wind, sun, water, biomass, nuclear fission and fusion), the material economy of sub-
stances mainly depends on biomass, in particular plant biomass (Kamm and Kamm, 2004). An economy
based on innovative and cost-efficient use of biomass for the production of both bio-based products and
bioenergy should be driven by well-developed integrated biorefinning systems (de Jong and Jungmeier,
2015).
The IEA Bioenergy Task 42 (van Ree and van Zeeland, 2014) defined biorefinery as ”the sustainable
processing of biomass into a spectrum of marketable products and energy”. Thus, a biorefinery can re-
late to a facility, a process, a plant, or even a cluster of facilities. Biorefineries are expected to contribute
to an increased competitiveness and wealth of the countries by responding to the need for supplying a
wide range of bio-based products and energy in an economically, socially, and environmentally sustain-
able manner (de Jong and Jungmeier, 2015).
Figure 2.1: Biorefinery concept schematics, integrated in the agro-biofuel-biomaterial-biopower cycle. Based on Ragauskas(2006) and SIADEB (2010).
The majority of biological raw materials are produced in agriculture, forestry, and by microbial sys-
tems. Waste biomass and biomass of nature and landscape cultivation are valuable organic reservoirs
of raw material and must be used in accordance to their organic composition. Because of low cost, plen-
tiful supply, and amenability to biotechnology, carbohydrates appear likely to be the dominant source
of feedstocks for biocommodity processing. Advantages over cellulosic materials include much larger
ultimate supply, lower purchase cost and lower anticipated transfer cost, less erosity, and lower inputs
of chemicals and energy required for production. The lignocellulosic feedstock (LCF)-biorefinery will
probably be the most successful. On the one hand the raw material situation is optimal, on the other
hand conversion products have a good position in the traditional petrochemical as well as in the future
6
Figure 2.2: Sugarcanes, a raw materialfor sugar production.
Figure 2.4: Molasses, an industrial by-product of sugar production.
bio-based product market (Kamm and Kamm, 2007).
2.2 Xylose: the major component of the renewable feedstock lig-nocellulose used as sole carbon source
The most frequently reported factor that influences the price of PHA is the cost of the carbon source,
whose selection should not focus only on the market prices, but also on the availability and global price
consistency. Inexpensive carbon sources such as agricultural wastes and industrial by-products may
incur additional costs due to pre-treatment steps, extended cultivation times, and purification. Although
simple carbon sources, such as sugar and starch from crops, seem to be superior to complex carbon
sources, they are also a primary source of human food and animal feed (Chanprateep, 2010).
2.2.1 Lignocellulosic materials
Lignocellulosic materials consist of three primary chemical fractions or precursors: (i) hemicellu-
lose/polyases, a sugar polymer of predominantly pentoses; (ii) cellulose, a glucose-polymer; and (iii)
lignin, a polymer of phenols (Kamm and Kamm, 2007). Cellulose and hemicellulose are polysaccha-
rides embedded in a complex lignin matrix, which gives the plant structural support, impermeability, and
resistance against microbial attack and oxidative stress (Cesario and de Almeida, 2015).
Biological conversion of lignocellulosic materials into value-added building block chemicals and fuels
usually involves several sequential steps: lignocellulose pretreatment/fractionation, enzymatic cellulose
hydrolysis to fermentable sugars (e.g., glucose and xylose), and fermentation (Cesario and de Almeida,
2015). In order to be used by microorganisms, lignocellulosic waste must undergo hydrolysis, from
which different sugars are released from the cellulosic and hemicellulosic fractions and, depending on
the biomass nature, different hexose/pentose ratios are attained (Raposo et al., 2017). Since agricultural
wastes like wheat straw, rice straw and corn stover are rich in xylose and, generally, have a lower lignin
content, they make a perfect fit as feedstock. For instance, molasses, represented in figure 2.4, is
one potentially inexpensive carbon source for PHA production. However, its value been increasing to
unprecedented levels at both origin and destination (Chanprateep, 2010).
Although xylose is a major component of lignocellulose and the second most abundant sugar in
nature, efficient use is still a technical barrier due to the strong physical and chemical construction of
lignocellulose (Venkateswar Rao et al., 2016). Therefore, the effective biological conversion of lignocel-
7
lulosic hydrolysates is restricted by the ability of the strain used to consume pentoses (Raposo et al.,
2017).
The major difficulty associated with the use of sugar mixtures and thus with lignocellulosic hy-
drolysates is the carbon catabolite repression (CCR), a regulatory mechanism that prevents the expres-
sion of the genes needed for other carbon sources catabolism, usually pentoses, while the substrate
that enables the fastest growth (usually glucose) is present. In Escherichia coli cultivations carried with
sugar mixtures as carbon sources, diauxic growth is observed, i.e. a sequential consumption of the
sugar takes place resulting in a series of exponential growth phases separated by lag phases. The CCR
regulation mechanism varies depending on the bacterial species (Raposo et al., 2017). For instance, in
Burkholderia sacchari cultivations Cesario et al. (2014) observed that in media containing glucose and
citrate, the uptake of glucose started upon citrate exhaustion. Moreover, CCR has been reported in this
strain with glucose/xylose mixtures containing 10 gL-1 of glucose plus 10 gL-1 of xylose (Cesario et al.,
2014).
2.2.2 Xylose metabolic network
For the purpose of understanding the fundamentals of this work, an overview of the metabolic re-
actions involved in xylose metabolism by bacteria was carried out. The network described in figure
2.5 represents the proposed xylose metabolism for Burkholderia sacchari (B. sacchari), and was con-
structed based on literature review (Jeffries, 1983; Lam et al., 1980; Moat et al., 2002; Gottschalk, 1986;
Sudesh et al., 2000; Radek et al., 2014; Kanehisa et al., 2016; Ogata et al., 1999; Raposo et al., 2017).
Glucose conversion reactions are represented as well, however these will not be detailed in the follow-
ing text. It is important to note that the network is far from comprising all the possible metabolic pathways.
Bacteria generally employ active transport mechanism for the uptake of sugars and other nutrients.
Active transport mechanisms are mediated by carrier proteins, and hence exhibit the properties of sat-
urability, substrate specificity, and specific inhibition. This process occurs at the expense of metabolic
energy, but sugars can be transported against a concentration gradient. The metabolic energy required
can be provided by establishing a membrane potential as in the chemiosmotic energization mechanism,
by the hydrolysis of Adenosine Triphosphate (ATP) as in the direct energization mechanism, or by the
transfer of phosphate from phosphoenolpyruvate (PEP) to the sugar substrate as in the group translo-
cation mechanism (Jeffries, 1983).
In Escherichia coli , the transport of D-xylose across the cell membrane is linked to the movement of
protons, as evidenced by a rise in pH in the extracellular medium upon addition of D-xylose. In other
words, D-xylose transport is energized by a chemiosmotic mechanism in which protons are transported
together across the cell membrane, and not by directly energized or PEP-phosphotransferase mech-
anisms (Jeffries, 1983). Chemiosmotic-driven transport systems accomplish movement of a molecule
across the membrane at the expense of a previously established ion gradient such as a proton motive
force or a sodium motive force. There are three basic types: symport, which involves the simultaneous
transport of two substrates in the same direction by a single carrier; antiport, that also involves simul-
8
Figure 2.5: Xylose metabolism for B. sacchari, based on literature review (Jeffries, 1983; Lam et al., 1980; Moat et al., 2002;Gottschalk, 1986; Sudesh et al., 2000; Radek et al., 2014; Kanehisa et al., 2016; Ogata et al., 1999; Raposo et al., 2017).The enzimatic activites are abbreviated as follows: xylose isomerase (XI); xylulokinase (XK); xylose reductase (XR); xylitoldehydrogenase (XOHDH); xylose dehydrogenase (XDH); xylonolactonase (XL); ribulose-phosphate 3-epimerase (RPE); trans-ketolase (TKL); transaldolase (TAL); phosphoketolase (PKL); ribulose-phosphate isomerase (RPI); glyceraldehyde-3-phosphatedehydrogenase (GlyPDH); 3-phosphoglycerate kinase (PGK); enolase (EL); pyruvate kinase (PK); pyruvate dehydrogenase com-plex (PDH); acetate kinase (AK); pyrophosphate-acetate phosphotransferase (PAP); acetyl-CoA synthase (ACS); β-kethiolase(PhaA); acetoacetyl-CoA reductase (PhaB); PHA synthase (PhaC); KDPG aldolase (KDPGA); glucose-6-phosphate dehydroge-nase (GluPDH); phosphogluconate dehydrogenase (GNDH); phosphogluconate dehydratase (GNDY); hexokinase (HK).
taneous transport of two like-charged compounds by a common carrier but in opposite directions; and
uniport, which occurs when movement of a substrate is independent of any coupled ion (Moat et al.,
2002). Lam et al. (1980) observation indicate that xylose transport is energized by a proton-motive
force. When xylose was added to anaerobic energy-depleted cells, an alkaline pH change expected for
a sugar-H+ symport system occurred. Contrary to phosphotransferase systems, which give an acid shift,
or directly energized systems that yield no pH change (Lam et al., 1980).
There are at least four different pathways for the catabolism of D-xylose described in literature (Ogata
et al., 1999; Kanehisa et al., 2016), namely an Oxido-reductase pathway, an Isomerase pathway, and
9
two oxidative pathways, called Weimberg and Dahms. Prokaryotes typically use an isomerase pathway,
and the two oxidative pathways (Cherix et al., 2014). The Weimberg pathway (Weimberg, 1961) repre-
sented in figure 2.6 is an oxidative pathway where D-xylose is oxidized to D-xylonolactone by a xylose
dehydrogenase (XDH) followed by a lactonase to hydrolyse the lactone to D-xylonic acid. A xylonate
dehydratase (XDY) is splitting off a water molecule resulting in 2-keto-3-desoxyxylonate. A second de-
hydratase forms the 2-keto-glutarate semialdehyde which is subsequently oxidized to 2-ketoglutarate.
For instance, Frost (2008) reported the ability of E. coli to catabolise D-xylonic acid, involving a NAD-
dependent D-XDY. The Dahms pathway (Stephen Dahms, 1974) starts as the Weimberg pathway but
the 2-keto-3-desoxy-xylonate is split by an aldolase to pyruvate and glycoaldehyde.
Raposo et al. (2017) reported the accumulation of D-xylonic acid in the broth when xylose is present
as substrate in B. sacchari cultivations, suggesting the presence of the Weimberg pathway in this strain’s
metabolism.
Figure 2.6: Two alternative metabolic routes from D-xyloseto α-ketoglutarate in C. glutamicum (Radek et al., 2014).
In order to identify which of the pathways men-
tioned are enconded in B. sacchari genome, Cherix
et al. (2014) conducted an in silico study using
the enzymes present in all four xylose pathways.
The isomerase pathway was found to be the xy-
lose metabolic pathway used by this bacterium, since
xylose isomerase (XI), xylulokinase (XK) and ABC
xylose transporter were genes present in its genome.
Some of the genes involved in the Weimberg path-
way were also found to have homologous genes in
B. sacchari . However, it was noted the absence
of the gene for 2-keto-3-desoxy-D-xylonate dehy-
dratase, which may be the reason for the reported
accumulation of D-xylonic acid, since it cannot be
converted into α-ketoglutarate semialdehyde. The
products from each of the pathways are directed to
the central metabolism of the bacteria through a dif-
ferent way, towards the Pentose Phosphate (PPP), in the case of the isomerase, and to the tricarboxylic
acid cycle (TCA) cyle in Weimberg’s. The genes of the Oxidoreductase and Dahm’s pathways were not
found in the B. sacchari genome (Cherix et al., 2014).
Once inside the bacterial cell, D-xylose is first converted to D-xylulose, a reversible isomerisation
reaction catalysed by D-XI, and then phosphorylated to D-xylulose-5-phosphate by D-XK. Both enzymes
are specifically induced by D-xylose in bacteria. On the other hand, the reduction of D-xylose to xylitol is
catalysed by XR, whereas the reoxidation of xylitol to D-xylulose is catalysed by xylitol dehydrogenase
(XOHDH). This reaction is readily reversible and NADH oxidation occurs, since this enzyme showed no
activity with NAD(P)H (Jeffries, 1983). D-xylose is required for the induction of xylose reductase (XR)
and XOHDH activities, hence xylitol formation does not occur in the absence of this pentose. Together
10
with aeration, D-xylose concentration affects xylitol formation the most (Winkelhausen and Kuzmanova,
1998).
Bacteria have been shown to possess both XR for the production of xylitol and NAD-dependent
pentitol dehydrogenases for the assimilation of pentitols, whereas the production of these sugar alcohols
is essentially a function of the NAD(P)H-specific aldolase reductase (Jeffries, 1983). Nevertheless,
Bramer et al. (2001) reported that B. sacchari does not assimilate xylitol as carbon source.
D-xylose degradation continues towards PPP pathway, a series of reversible transaldolase (TAL)
and transketolase (TKL) reactions, which primary functions are to provide NAD(P)H, which is used
primarily for reducing power in biosynthetic reactions, and two very important biosynthetic precursors,
sedoheptulose-7-phosphate and erythrose-4-phosphate, which are essential for aromatic amino acids
(Moat et al., 2002). The pathway consists of an oxidative phase that converts hexose phosphates to pen-
tose phosphates, and a non-oxidative phase that converts pentose phosphates back to hexose phos-
phates (Jeffries, 1983). Rybulose-5-phosphate is maintained in equilibrium with rybose-5-phosphate
and xylulose-5-phosphate by the action of ribulose-phosphate isomerase (RPI) and ribulose-phosphate
3-epimerase (RPE), respectively (Moat et al., 2002).
Carbon exits from the sugar phosphate pool by at least three and sometimes four routes: D-fructose-
6-phosphate and glyceraldehyde-3-phosphate can enter the Embden-Meyerhoff-Parnas (EMP) pathway;
D-rybose-5-phosphate is used for nucleotide synthesis; D-erythrose-4-phosphate is the starting point for
the shikimic acid pathway leading to the synthesis of aromatic amino acids; and, in some organisms,
D-xylulose-5-phosphate can form glyceraldehyde-3-phosphate plus acetyl phosphate through the action
of pyruvate kinase (PK) (Jeffries, 1983).
After pyruvate formation, the next step towards energy production for the cell is the oxidative de-
carboxylation of pyruvate to acetyl-coenzyme A (acetyl-CoA) by the pyruvate dehydrogenase com-
plex (PDH), and then the oxidation of acetyl-CoA via the TCA, commonly known as Krebs cycle (KC).
The cycle carries out the oxidation of the acetyl moiety of acetyl-CoA to CO2 with transfer of the re-
ducing equivalents to Nicotinamide Adenine Dinucleotide (oxidized form) (NAD)+, NAD(P)+, and FAD
(Gottschalk, 1986).
As regards the P(3HB) formation, two acetyl-CoA moities are combined to form acetoacetyl-CoA by
a β-ketothiolase (PhaA). The product then undergoes reduction by an NAD(P)H-dependent reductase,
acetoacetyl-CoA reductase (PhaB), which produces the (R)-isomer of 3-hydroxybutyryl-CoA. Finally, the
poly-hydroxyalkanoate synthase (PhaC) polimerises the 3-hydroxybutyryl-CoA to poly-hydroxybutyrate
(PHB) inclusions through the formation of ester bonds between the hydroxyl groups of the monomers,
with the liberation of coenzyme-A. PhaC shows a broad substrate specificity and thefore a wide variety of
monomers can be polimerised. The most important factors that determine the type of PHA constituents
is the carbon source, and only (R)-isomers are accepted as substrates for the polymerising enzyme due
to its stereospecificity (Sudesh et al., 2000; Verlinden et al., 2007).
According to (Gomez et al., 2014), B. sacchari showed flux exclusively in Entner-Doudoroff (ED)
pathway, replacing the first reactions in the EMP pathway. The two key enzymes for ED pathway are
11
6-phosphogluconate dehydratase (GNDY), which catalyses dehydration of 6-phosphogluconate to form
2-keto-3-deoxy-6-phosphogluconate (KDPG), and KDPGA, which cleaves KDPG to pyruvate and glyc-
eraldehyde 3-phosphate, the latter being further catabolised through the EMP pathway and TCA cycle.
2.3 Polyhydroxyalkanoates: a route towards biobased plastics
Plastic materials have become an integral part of contemporary life on account of many desirable
properties including durability and resistance to degradation. However, throughout the past decades,
these nondegradable plastics have accumulated in the environment (Lee, 1996), leading to catastrophic
consequences, namely groundwater and land pollution, and animal life endangerment.
Recently, the society have become more conscious about this subject, and efforts have been made
in several fronts towards an effective solid waste management and sustainability. These concerns have
created a renewed interest in biologically derived polymers, ignored for a long time due to high pro-
duction cost compared to petrochemical derived plastics. During recent years, intensive research has
investigated the bacterial production of PHAs and a great effort is underway to improve this procedure.
Nonetheless, the PHA production price is still far above the price of conventional plastics (Verlinden
et al., 2007).
2.3.1 Polyhydroxyalkanoates (PHAs)
In order to find alternative materials to oil-based plastics, researchers have developed fully biodegrad-
able plastics, such as PHAs which show similar material properties to polypropylene. Other advantages
of these materials over petrochemical plastics are that they are natural, renewable and biocompatible
(Verlinden et al., 2007). Another important feature of PHAs is that they are degraded naturally by mi-
croorganisms which enable carbon dioxide and organic compound recycling in the ecosystem, providing
a buffer to climate change (Chanprateep, 2010).
Bacteria synthesise and accumulate PHAs as carbon and energy storage materials or as a sink for
redundant reducing power under the condition of limiting nutrients, such as nitrogen, phosphorus or
oxygen, in the presence of generous carbon supplies (Lee, 1996; Sudesh et al., 2000). Also, by poly-
merising soluble intermediates into these insoluble PHAs granules, the cell does not undergo alterations
of its osmotic state (Verlinden et al., 2007), and, once accumulated, the polymer serves as both carbon
and energy source during starvation (Sudesh et al., 2000).
2.3.1.A PHAs synthesis, chemical structure and physical properties
The first poly-hydroxyalkanoate to be discovered thus the most widely studied, was described by
Lemoigne in 1926 as an unknown material in the form of a homopolyester of the 3-hydroxybutyric acids
called poly-hydroxybutyrate (PHB) (Suriyamongkol et al., 2007). As described in section 2.2.2, within the
bacterial metabolism carbon substrates are converted into hydroxyl-CoA thioesters, which are converted
into PHB by three biosynthetic enzymes, as seen in figure 2.7 (Verlinden et al., 2007).
12
Figure 2.7: PHAs synthesis in bacteria using hydroxyacyl-CoA thioesters as precursor, where the pendant group (R) varies frommethyl (C1), to tridecyl (C13) (Verlinden et al., 2007).
Table 2.1: P(3HB) chemical and physical properties. Adapted from Verlinden et al. (2007); Lee (1996); Henriques (2015).
Parameter Value
Decomposition temperature (°C) 246.3
Melting temperature (°C) 177
Glass transition temperature(°C) 2
Crystallinity (%) 60
Tensile strengh (MPa) 40
Extension to break (%) 5
Other properties
Non-toxic, good UV light resistance, relative resistance to hydrolytic degradation, water
insoluble, good oxygen impermeability, sinks in water facilitating anaerobic degradation
The array of aplications for PHAs stems from the enormous variation possible in the length and
composition of the side chains. For instance, PHB and poly-hydroxyvalerate (PHV) form a class of
PHAs typically referred to as small chain length PHAs (scl-PHAs), whereas PHAs composed of C6 to
C16 3-hydroxy fatty acids are known as medium chain length PHA (mcl-PHA). Copolymers of PHB are
formed when mixed substrates are used, and these will be random copolymers unless substrates are
alternated overtime. PHB homopolymer is a highly crystalline thermoplastic, stiff, but brittle substance,
and when spun into fibres it behaves as a hard-elastic material (Verlinden et al., 2007). These and other
characteristics that make PHB a suitable alternative for petroleum-based plastics are summarised in
table 2.1.
2.3.1.B Approaches for P(3HB) production and recovery
PHAs are synthesised by many living organisms including plants, yeasts and bacteria. Plants can
only cope with low yields of PHA production (<10% (w/w)), due to the negative effects higher levels of
polymer have on its growth and development. In contrast, bacteria can accumulate PHAs up to 90%
(w/w) of of the cell dry weight. Bacterial fermentation of Cupriavidus necator is by far the most exten-
sively studied strain for PHAs production, and it seems to be the most cost-effective process. A few
important other strains capable of producing PHAs by way of fermentation processes include: Bacillus
cherichia coli , Burkholderia sacchari and Halomonas boliviensis (Verlinden et al., 2007). According to
Suriyamongkol et al. (2007), currently, more than 300 microorganisms are reported to synthesise PHAs.
Since the scope of this work is xylose biological conversion, in table 2.2 is given an overview of the
strains reported to be able to metabolise this pentose and produce P(3HB).
13
One of the main current research focus regarding polymer production is productivity maximisation,
i.e. the goal is to obtain the highest density of products of interest in a reaction volume within the shortest
time (Ienczak et al., 2013). Several approaches and operation modes from batch to continuous, with or
without cell recycling, have been studied and reviewed throughout the last decades (Verlinden et al.,
2007; Ienczak et al., 2013). Despite the broad spectrum of strains able to accumulate PHAs, research
groups have struggled to optimise polymer production when inexpensive carbon sources are used as
substrate (Chanprateep, 2010).
In fed-batch cultivations cells are grown under a batch regime usually until close to the end of the ex-
ponential phase, and then a solution of substrates is fed to the bioreactor, without removal of culture broth
(Ienczak et al., 2013). The fermentative production of PHAs is normally operated as a two-stage fed-
batch process: an initial growth phase in nutritionally enriched medium, which yields sufficient biomass,
followed by a product formation phase in a nitrogen-depleted medium. Single fed-batch fermentation
that are nitrogen limited lead to low amounts of polymer, since there is not enough accumulation of
biomass (Verlinden et al., 2007).
Industrial PHA production only becomes economically viable when high cell densities and high poly-
mer production are achieved at low cost. PHAs’ productivity is proportional to the residual biomass pro-
duction once this polymer accumulates inside the cells. Therefore, processes with high-cell-densities,
i.e. higher residual biomass concentration, are preferred because they allow for culture volume re-
duction, for lower production costs and lower investment in equipment compared to low-cell-density
processes (Ienczak et al., 2013).
Chanprateep (2010) cited academic research groups that have focused on other approaches for
PHB production optimisation. For instance, mathematical models have been developed to control the
fermentation conditions in order to maximise PHB production, strategies such as maintaining a constant
nutrient concentration to promote polymer accumulation, and on-line feeding strategies for fed-batch
cultivations have also been studied (Chanprateep, 2010).
It has been reported that resorting to mixed bacterial cultures for PHAs production can improve the
efficiency of the fermentation, fomenting the decrease of the PHAs’ cost due to lower sterility, equip-
ment and control requirements, and the ability to utilise a wide range of cheap substrates (including
industrial and agricultural wastes), and therefore increase their market potential (Verlinden et al., 2007;
Chanprateep, 2010).
PHAs’ production in mixed cultures is induced by an intracellular limitation, through a process referred
to as feast and famine. In this strategy, cells are exposed to consecutive periods of substrate accessibility
(”feast”) and then unvailability (”famine”), altering the phisiology of bacteria. These conditions allow for
the selection of an enriched culture with a high stable capacity of PHA production. A sudden increase of
carbon substrate supply causes the cells to change their physiology again, however, as PHA-synthesis
requires less adaptation than growth, the culture channels the substrate towards polymer accumulation
instead of cell growth (Dias et al., 2006; Verlinden et al., 2007).
PHA production in bacteria and yeast requires growth under sterile conditions, incurring the process
with high costs. In contrast, in plant systems the production of polymer is considerably less expensive
14
since it only relies on water, soil nutrients, atmospheric CO2 and sunlight. Regarding the life cycle of
PHAs described in figure 2.8, it is also a more environmentaly friendly process as plants use phospho-
synthetically fixed CO2 and water to generate the bioplastic, which after disposal is degraded back to
CO2 and water. In fact, eucaryotic systems have been studied as PHAs production hosts as an alterna-
tive to bacteria to gather information about how these pathways work and how they can be incorporated
into plants (Suriyamongkol et al., 2007).
Genetic engineering has been proved very useful in bacterial metabolism optimisation towards poly-
mer production. In fact, according to Ienczak et al. (2013), generally recombinant microorganisms have
showed more competitiveness for industrial processes than wild-type strains due to the absence of de-
polymerase enzyme, the absence of the necessity of nutrient limitation, and the capacity to produce
higher P(3HB) content whithin a short time period. However, recombinant microorganisms have shown
instability for industrial processes as well, requiring antibiotics and inductors for expressing the genes of
interest (Ienczak et al., 2013).
To recover the polymer formed during cultivation, bacterial cells containing the PHA are in the first
place separated from the medium by centrifugation. Then, organic solvents, such as acetone, chloro-
form, methylene chloride or dichloroethane, have been used to extract the intracellular product. How-
ever, in industrial processes it is necessary a large amount of solvent what turns the procedure both
economically and environmentally unappealing. Nevertheless, when it comes to medical applications,
the solvent extraction is a good method since the resulting PHA presents high purity. As an alternative,
aqueous enzymatic procedures, treatments with ammonia, or digestion with sodium hypochlorite and
surfactants have been proposed. More recently, supercritical fluid disruption, dissolved-air flotation, and
selective dissolution of cell biomass for the recovery of PHAs have also been studied (Verlinden et al.,
2007).
2.3.2 Biodegradability
Figure 2.8: Life cycle of PHAs: these will biodegrade toCO2, H2O, humic matter and biomass. New agriculturalcrops, using nutrients from compost and fixing CO2, willproduce building blocks, monomers and polymers (Gross,2002; Verlinden et al., 2007).
Conventional polymers such as polyethylene and
polypropylene persist in the environment for many
years after disposal. Additionally to being inappro-
priate for applications in which plastics are used for
short time periods and then disposed, plastics are of-
ten soiled by food and other biological substances,
making physical recycling impractical and generally
undesirable (Gross, 2002).
In his review, Lee (1996) cited a number of aero-
bic and anaerobic PHA-degrading bacteria and fungi
isolated from various environments, namely from soil,
activated sludge, sea and also lake water, by using
PHA hydrolases and PHA depolymerases. The en-
zymes’ activity and hence the rate of PHA biodegra-
15
dation, may vary according to the composition of the polymer and the environmental conditions, such
as the microbial population and the temperature. Moreover, the presence of UV light can accelerate the
process. The end products of PHA degradation in aerobic environments are carbon dioxide and water,
while methane is also produced in anaerobic conditions (Verlinden et al., 2007; Lee, 1996).
As shown in figure 2.8, the synthesis and biodegradation of PHAs are totally compatible with the
carbon-cycle once its fermentative production uses agricultural feeds such as sugars and fatty acids as
carbon and energy sources. Despite the fact that PHAs are renewable compounds, which is one of the
most notable features of these polymers, studies into their life cycle showed that more energy would be
needed, from crop growing to moulding the final product, than in the life cycle of conventional plastics.
Nonetheless, the fermentation process to make PHA is far from optimised (Verlinden et al., 2007), and
research regarding polymer production using lignocellulosic wastes as raw materials is underway.
2.3.3 Applications and commerciallisation
The majority of expected applications of PHAs, whether used in pure form or as additives to oil-
derived plastics such as polyethylene, are as replacements for petrochemical polymers. Target markets
for the biopolymers include packaging materials (trash bags, wrappings, loose-fill foam, food containers,
film wrapping, laminated paper), disposable nonwovens (engineered fabrics) and hygiene products (di-
i Unknownii g per g of substrate consumediii simultaneous P(3HB) production
27
28
3Aim of Studies: directing Burkholderiasacchari metabolism towards P(3HB),
xylitol and xylonic acid production
29
As mentioned previously, biobased plastics such as PHAs are currently far more expensive than
petrochemically based plastics and are therefore used mostly in applications that conventional plastics
cannot perform, such as medical applications (Verlinden et al., 2007). One of the major drawbacks that
limit the success for industrial production via fermentation and commercialization of PHAs is the cost
of the substrate, fact that motivated extensive research in PHA production using raw materials, such
as agricultural wastes. The choice of a renewable and inexpensive carbon source is the key for a PHA
production process economically feasible (Cesario and de Almeida, 2015).
Lignocellulosic hydrolysates are rich in C5 sugars. Cesario and de Almeida (2015) described a
limited number of strains able to metabolise these substrates and convert them into PHAs, in which
Burkholderia sacchari , the bacterial strain selected to carry this experimental work, is included. These
are preferred both to increase the total carbon uptake by the cells and to avoid pentose accumulation in
the broth in fed-batch assays, therefore inhibitory concentrations.
B. sacchari was isolated from the soil of a sugar cane plantation in Brazil. The cells of strain IPT 101
are Gram-negative, rod-shaped and motile due to the presence of several polar flagella. When plated
on nutrient broth medium (Difco), white and opaque colonies are formed as result of PHA accumulation.
The optimum growth temperature range is 28-30°C, growing well between 25 and 37 °C. B. sacchari
IPT 101 demonstrated to oxidise several carbohydrates, namely glucose, xylose, and sucrose, with-
out assimilating xylitol (Bramer et al., 2001). A Transmission Electronic Microscope (TEM) image of
B. sacchari DSM 17165 cells with PHA granules is represented in figure 3.1.
Figure 3.1: TEM image of B. sacchari containing 70% (dry weight) of P(3HB) (Cesario and de Almeida, 2015).
Silva et al. (2004) studied P(3HB) production and accumulation on xylose, on xylose+glucose, and on
bagasse hydrolysates. B. sacchari IPT 101 showed promising results on xylose, accumulating 58% of
P(3HB). However, CCR prevented an efficient metabolisation of pentoses in sugar mixtures composed
of glucose, xylose, and arabinose by this wild-type strain. Through CCR the cells select from a mixture
of carbon sources the one that allows for the highest gowth rate, by inhibiting cell’s transport capacity of
other carbon sources, enzymatic activity, and related gene expression (Cesario and de Almeida, 2015).
In bacteria, the biochemical mechanisms of D-xylose metabolism are quite different from those of
D-glucose. Whereas the latter is metabolised by the EMP pathway, D-xylose metabolism proceeds by
way of the PPP pathway. Following transport into the cell, D-xylose is either isomerized or reduced, then
reoxidised to form D-xylulose. This pentulose is then phosphorylated, isomerized, and rearranged to
30
form a metabolic pool of phosphorylated 3-, 4-, 5-, 6-, and 7-carbon sugars. These intermediates can
exit the PPP to be used by other metabolic pathways through the formation of nucleic acids, aromatic
amino acids, lipids, and other metabolic end products (Jeffries, 1983).
Henriques (2015) described a three stage continuous bioreactor cascade mode for P(3HB) produc-
tion using simulated lignocellulosic hydrolysates as carbon source. Within this continuous system, the
goal was to achieve high cell densities in the first bioreactor, through a batch phase where phosphorus
was initially provided in excess, to accumulate P(3HB) in the second fed-batch bioreactor limited by phos-
phorus, by consuming preferably the glucose in the feed, and to convert the sugars present in the xylose-
rich medium in the third bioreactor, to increase the polymer yield. However, results showed low polymer
productivities and conversion yields attained, namely 0.90 gP(3HB)L-1h-1 and 0.10 gP(3HB)/gGluc+Xyl, re-
spectively, for a dilution rate of 0.1 h-1.
Since studies in a two-stage continuous system demonstraded higher polymer productivities and
yields on glucose, 2.21 gP(3HB)L-1h-1 and 0.31 gP(3HB)/gGluc, respectively, also for a dilution rate of 0.1 h-1,
the problem was thought to be the fact that B. sacchari was not able to convert the xylose present in
the medium towards polymer production because of the metabolic pathways triggered by glucose in the
second bioreactor. On the other hand, xylitol production took place in the second and third bioreactors,
with a maximum overall volumetric productivity of 0.28 gXyltL-1h-1 and a maximum overall xylitol yield of
0.13 gXylt/gXyl. It is thus, assumed that xylose accumulation and, therefore, high xylose concentrations
in the broth leads to xylitol production.
Aiming to find the reasons for this setback on continuous P(3HB) production using lignocellulosic
hydrolysates, fed-batch cultivations were carried out in order to simulate the third bioreactor of the three-
stage continuous system and to optimise the cultivation conditions of B. sacchari in xylose.
B. sacchari has been extensively studied as a PHA-accumulating bacteria. More recently, with the
work developed by Raposo et al. (2017), xylitol production has been reported with xylose concentrations
above 30-40 gL-1. Production of xylonic acid has also been observed. These findings revealed alterna-
tive pathways in B. sacchari metabolism when the main carbon source is a pentose. To understand the
metabolic pathways in this bacterial strain several shake flask and bioreactor assays were performed
using xylose as sole carbon source.
In conclusion, this thesis’ work focuses on the xylose metabolism in B. sacchari cultivations, aiming
to find the optimum conditions for P(3HB), xylitol and/or xylonic acid production using this pentose as
substrate.
31
32
4Materials and Methods
33
4.1 Microorganism
Burkholderia sacchari DSM 17165, a strain able to grow, accumulate PHAs, and produce xylitol and
xylonic acid on xylose, was used throughout this work.
4.2 Strain storage and preparation
Cultures of B. sacchari were stored at -80°C in 2 mL cryovials. The stock cultures were prepared
transferring 1500 µL of a previously grown liquid culture in seeding medium (see subsection 4.3.1)
supplemented with 20 gL-1 of xylose, collected in the late exponential growth phase, to sterile cryovials
containing 300 µL of pure sterilized glycerol. This procedure was performed under aseptic conditions
(sterilization under UV light for 15 minutes) in a laminar flow chamber (BIOAIR Instruments aura 2000
MAC 4 NF, Italy) using sterile material.
4.3 Culture media
4.3.1 Seeding medium
The seeding medium (Kim et al., 1994) was prepared by mixing the compounds listed in table 4.1 in 1
L of distilled water, where the pH was adjusted to 6.8 adding the conjugated acid of the phosphate buffer,
KH2PO4. The medium was sterilized by autoclaving at 121°C for 20 minutes. A 100 gL-1 MgSO4·7H2O
solution was prepared and autoclaved separately to avoid the formation of precipitates, and then added
to the medium under sterile conditions.
Table 4.1: Seeding medium composition.
Compound Concentration (gL-1)i Brand name Purity (%)
Na2HPO4·2H2O 4.47 VWR Prolabo 99.9
KH2PO4 1.5 Panreac 98.0-100.5
(NH4)2SO4 1.0 Panreac >99.0
Yeast Extract 1.0 Quilaban −
MgSO4·7H2O solution 2 mLL-1 Panreac 98.0-102.0
Oligo elements solution 1 mLL-1 − −i Unless stated otherwise.
4.3.1.A Oligoelements solution
The oligo elements solution (Kim et al., 1994) was prepared by dissolving the compounds listed in
table 4.2 in distilled water, and then sterilized by autoclaving at 121°C for 20 minutes. This solution was
stored at 4°C.
34
Table 4.2: Oligo elements solution composition.
Compound Concentration (gL-1)i Brand name Purity (%)
FeSO4·7H2O 10 Sigma >99.0
ZnSO4·7H2O 2.25 Sigma >99.0
CuSO4·5H2O 1.00 Panreac >99.0
MnSO4·H2O 0.379 Sigma >99.0
CaCl2·2H2O 2.00 Merck >99.5
Na2B4O7·10H2O 0.23 Merck 99.5-105.0
(NH4)MO7O24·4H2O 0.106 Merck >99.0
HCL 37% 10 mL Fisher Chemical 35i Unless stated otherwise.
4.3.2 Cultivation medium to impose limitation by phosphorus
The bioreactor cultivation medium used to trigger limitation by phosphorus (Kim et al., 1994) was
prepared by mixing the components listed in table 4.3 in distilled water, to attain 1.3 L final working
volume, and adjusting the pH to 7.11 with a 5 M KOH (Panreac) solution. The medium was sterilized
inside the bioreactor at 121°C for 20 minutes. A 100 gL-1 MgSO4·7H2O solution was prepared and
autoclaved separately to avoid the formation of precipitates. The magnesium and a concentrated sugar
solutions were later added to the medium aseptically.
Table 4.3: Phosphorus limited medium composition.
Compound Concentration (gL-1)i Brand name Purity (%)
(NH4)2SO4 4.0 Panreac >99.0
KH2PO4 3.0 Panreac 98.0-100.5
Citric acid·H2O 1.85 Panreac 98.0-102.0
EDTA 40 mg Panreac 98.0
MgSO4·7H2O 12 mLL-1 Panreac 98.0-102.0
Oligo elements solution 10 mLL-1 − −i Unless stated otherwise.
4.3.3 Cultivation medium to impose limitation by nitrogen
The bioreactor cultivation medium used to impose limitation by nitrogen (Kim et al., 1994) was pre-
pared by mixing the components listed in table 4.4 in distilled water, to attain 1.3 L final working volume,
and adjusting the to 7.11 with a 5 M KOH (Panreac) solution. A 100 gL-1 MgSO4·7H2O solution was
prepared and autoclaved separately to avoid the formation of precipitates. The magnesium and a con-
centrated sugar solutions were later added to the medium aseptically.1During autoclaving, the culture medium tends to become more acidic, decreasing below the optimum pH value, 6.8.
35
Table 4.4: Nitrogen limited medium composition.
Compound Concentration (gL-1)1 Brand name Purity (%)
(NH4)2SO4 4.0 Panreac >99.0
KH2PO4 13.3 Panreac 98.0-100.5
Citric acid·H2O 1.85 Pareac 99.5-102.0
EDTA 40 mg Panreac 98.0
MgSO4·7H2O 12 mLL-1 Panreac 98.0-102.0
Oligo elements solution 10 mLL-1 − −1 Unless stated otherwise.
4.4 Carbon sources
All the shake flask and bioreactor assays were carried out using monohydrate dextrose (or D-glucose)
(Dextropam, Portugal), D-sucrose (Fischer Scientific, UK), and D-xylose (Danisco GmbH, Austria). The
sugar solutions were prepared with deionized water and then sterilized by autoclaving at 121°C for 20
minutes. Concerning dextrose (glucose), yield and productivity calculations were performed in terms of
anhydrous glucose.
4.4.1 Feed solution
Unless stated otherwise, the feed for both bioreactors consisted of a 600 gL-1 xylose solution, which
was fed to the stirred-tank reactors (STRs) at a flow rate of ca. 2.7 Lmin-1 (2.6 Lmin-1 for STR 1 and 2.8
Lmin-1 for STR 2.). This solution was prepared with deionized water and then sterilised by autoclaving
at 121°C for 20 minutes. When not in use, the feed solutions were stored at 4°C.
4.5 Culture conditions
4.5.1 Shake flask assays
4.5.1.A Inoculum preparation
Inocula for the shake flasks assays were prepared transferring the content of one cryovial to 500
mL shake flasks containing 94 mL of seeding medium supplemented with 20 gL-1 of glucose (unless
stated otherwise), and incubated at 30°C in an orbital incubator (Infors AG, Switzerland) at 170 rpm for
12 hours (or more, in case of using a different sugar), i.e. until the end of the exponential growth phase.
4.5.1.B Shake flask cultivation
Shake flask assays were performed to determine the growth, substrate consumption and by-products
formation by B. sacchari on xylose. These assays were carried out in 500 mL baffled conical flasks con-
taining 100 mL of liquid phase. The inoculum fraction varied between 5-10% (v/v) in order to obtain
identical initial optical densities (ca. 0.3). Different initial sugar concentrations were used, as well as
36
different carbon sources. These assays were performed in duplicate and the average value was consid-
ered.
4.5.1.C Culture sampling
Culture samples were periodically harvested, four per day on average, in order to analyse biomass,
sugar, polymer and other by-products concentrations. In some cases pH was also measured.
4.5.2 Fed-batch assays
4.5.2.A Inoculum preparation
Inocula for the bioreactor assays were prepared as described in section 4.5.1.A, with a volume of 65
mL (5% v/v of the bioreactor initial working volume).
4.5.2.B Fed-batch cultivation
Fed-batch cultivations were carried out in 2 L STRs (New Brunswick Bioflo 115) operated using the
BioCommand Batch Control software, which enabled control, monitoring and data acquisition. The pH
was controlled at 6.8 with 30% NH4OH or 5 M KOH, depending on the type of limitation used as trigger
for P(3HB) production, namely phosphorus or nitrogen limitation, respectively. The aeration rate used
was 2.6 Lmin-1, unless stated otherwise, and the temperature was set to 30°C. The dissolved oxygen set
point was 20% saturation, unless stated otherwise, and the maximum agitation speed was 1200 rpm.
The inoculum (5% v/v) was prepared as described in section 4.5.1.A. The initial volume of the fed-batch
cultivations was 1.3 L, including all medium components and inoculum.
Feeding was triggered by the increase of the dissolved oxygen (with a correspondent decrease in
the stirring speed), resulting from carbon source exhaustion in the medium. Figure 4.1 presents the
schematics for the experimental set-up of fed-batch cultivations.
Figure 4.1: Experimental set-up for the fed-batch cultivations. Inocula grown on glucose (Gluc), is transferred to the bioreactorwhere it is cultivated on xylose (Xyl) with pH and temperature control, and online DO measurement. Periodic sampling takes placefor biomass, sugars and organic acids, and P(3HB) determination.
37
4.5.2.C Culture sampling
In the fed-batch assays, culture samples were periodically harvested, three per day on average,
in order to determine biomass, sugar, polymer and other by-products concentrations. Phosphate and
ammonia concentrations were also determined when relevant. Typically, a total volume of approximately
17 mL of culture was harvested with a syringe through a non-return valve to maintain aseptia.
4.6 Analytical methods
4.6.1 Optical density measurements
Cellular growth was monitored offline by measuring the optical density (OD) of samples at 600 nm
in a double beam spectrophotometer (Hitachi U-2000), using 3 mL glass cuvettes with an optical path
length of 1 cm. For the OD determination, an aliquot of the culture sample was diluted with deionized
water in order to obtain an absorbance value lower than the threshold (ca. 0.5-0.6). Deionized water
was used as reference.
4.6.2 Cell dry weight determination
The cell dry weight (CDW) was determined by centrifuging at 12000 rpm for 3 minutes (in a Sigma
1-15 P microcentrifuge) 1.2 mL aliquots of culture samples collected in dried and weighted microtubes.
The supernatant was rejected and the pellet washed with deionized water, and then dried at 60°C in
a Memmert oven (Model 400) until constant weight. The CDW was determined dividing the weight
difference after drying the pellets by the collected aliquots volume.
4.6.3 Carbon sources, xylonic acid, xylitol and phosphate determinations
Glucose, sucrose, xylose, xylonic acid, xylitol and phosphate concentrations were determined offline
in a High Performance Liquid Chromatography (HPLC) apparatus (Hitachi LaChrom Elite) equipped with
a Rezex ROA-Organic acid H+ 8% (300 mm × 7.8 mm) column, an autosampler (Hitachi LaChrome
Elite L-2200), an HPLC pump (Hitachi LaChrome Elite L-2130), a Hitachi L-2490 refraction index (RI)
detector for sugars and phosphate and a Hitachi L-2420 UV-Vis detector for organic acids. A column
heater for larger columns (Croco-CIL 100-040-220P, 40 cm × 8 cm × 8 cm, 30-99°C) was connected
externally to the HPLC system. The injection volume was 20 µL and elution was achieved using a 5 mM
solution of H2SO4 as mobile phase. The column was kept at 65°C under a pressure of 26 bar, and the
pump operated at a flow rate of 0.5 mLmin-1.
Due to equippment failure during this thesis’ experimental work, another HPLC had to be used in
order to determine carbon sources and by-products concentrations. This equipment comprised a similar
HPLC apparatus (Hitachi LaChrom Elite), equipped with an Aminex HPX-87H (300 mm × 7.8 mm)
column. The injection volume was 20 µL and elution was achieved using a 5 mM filtered solution of
H2SO4 as mobile phase. The column was kept at 65°C under a pressure of 46 bar, and the pump
38
operated at a flow rate of 0.6 mLmin-1. The two detector modules (RI and UV-vis) were also set in
series.
4.6.3.A Sample preparation
Samples for HPLC analysis were prepared by mixing 300 µL of supernatant aliquots with 300 µL of
a 50 mM solution of H2SO4 in a microtube. After vortexing, these solutions were centrifuged (in a Sigma
1-15 P microcentrifuge) at 12000 rpm for 3 minutes. Samples for injection consisted of 100 µL of the
previous dilution plus 900 µL of the 50 mM H2SO4 solution, giving a final dilution of 1:20.
4.6.3.B Calibration curves
Calibration curves for glucose, xylose, xylonic acid, xylitol and phosphate determinations were ob-
tained for working ranges of 0.5 to 60 gL-1 for glucose, xylose, xylonic acid and phosphate, while a range
of concentrations from 0.1 to 50 gL-1 was chosen for xylitol (see equations A.1 to A.6 in appendix A).
Xylose and xylonic acid showed similar retention times in HPLC runs, which caused an overlap of
both peaks when using the RI detector leading to incorrect concentration values. To avoid this, xylonic
acid concentration was determined using the UV-visible chromatograms (see figure A.2) with an ap-
propriate calibration curve. Using another calibration curve determined for the RI chromatograms (see
figure A.1) the area of xylonic acid in RI chromatograms was computed through the concentration previ-
ously calculated. By subtracting the xylonic acid peak area to the total peak area measured with the RI
detector, it was possible to determine the ”real” xylose peak area and, consequently, the sugar concen-
tration of the sample.
During this experimental work, it was necessary to use a second HPLC apparatus due to technical
problems encountered while using the first, therefore standards were run again in order to determine
new calibration curves. Equations A.7 to A.12 were used to determine the carbon source, xylonic acid,
xylitol and phosphate concentrations.
It is of upmost importance to outline the fact that in the latter HPLC apparatus phosphate and xylitol
exhibit identical retention times. This became an issue in bioreactor cultivations directed towards xylitol
production, as described further in this document.
4.6.4 P(3HB) determination
P(3HB) determination was carried out by Gas Chromatography (GC). Samples prepared as de-
scribed below, in section 4.6.4.A, were analysed in a GC (Agilent Technologies 5890 series II) equipped
with a FID detector and a 7683B injector. The capillary column was a HP-5 from Agilent J&W Scientific,
30 m in length and 0.32 mm of internal diameter. The oven, injector, and detector were kept at constant
temperatures of 60°C, 120°C, and 150°C, respectively. Data acquisition and integration were performed
by a Shimadzu CBM-102 communication Bus Module and Shimadzu GC solution software (version 2.3),
respectively. Peak identification was achieved using as standard 3-methyl hydroxybutyrate (Sigma).
39
4.6.4.A Sample preparation: acidic methanolysis
In order to prepare samples for GC analysis, 1.2 mL aliquots of culture medium were withdrawn from
the culture medium and centrifuged at 12000 rpm for 3 minutes. The pellets were washed with deionized
water and frozen for storage prior to acidic methanolysis. Acidic methanolysis (Cavalheiro et al., 2012)
of the polymer in the cell pellet was carried out by adding to the microtubes 1 mL of an acidic methanol
solution containing (per 100 mL solution): 97 mL of methanol plus 3 mL of H2SO4 96% and 330 µL
of hexanoic acid as the internal standard (IS). The re-suspendend pellets were transferred to Pyrex
hermetic tubes with teflon cases and 1 mL of chloroform was added to each tube. After vortexing for
1 minute, these mixtures were incubated for 5 hours at 100°C in a Memmert GmbH oven (model 200).
After cooling, 1 mL of Na2CO3 was added to the tubes for neutralization, and the samples were vortexed
for 1 min and centrifuged at 4500 rpm for 5 minutes in a Heraeus SEPATECH Labofuge centrifuge
(model 200). 200 µL of the organic phase from each microtube was withdrawn to appropriate vials and
kept at -20°C until GC analysis.
4.6.4.B Calibration curve
The calibration curve for P(3HB) determination was obtained using samples of P(3HB) previously
produced which were subjected to acidic methanolysis, as described before. This curve was determined
for a working range of 0 to 10 gL-1, and is described by equation A.13.
4.6.5 Ammonium quantification
Ammonium concentration was determined offline with an ion-selective electrode (Mettler Toledo In-
Lab 152233000), with a Ag/AgCl reference system in order to confirm the nitrogen limitation in the culture
medium when required.
4.6.5.A Sample preparation
To proceed with the ammonium determination, 15 mL samples of culture broth were harvested pe-
riodically and centrifuged in an Eppendorf 5810 R centrifuge at 12000 rpm during 3 min, at room tem-
perature. The supernatant recovered was then diluted with deionized water to a final volume of 45 mL,
and 5 mL of ISA2 solution were added to maintain the pH constant and minimize interferences with other
ions.
4.6.5.B Calibration curves
Calibration curves with NH4Cl known concentration solutions were performed every time the elec-
trode was used. To assess nitrogen measurement in samples along the entire culture, it was found
necessary to define two working ranges for the ammonium concentrations, a low range from 10-6 M to
10-4 M, and a high range from 10-4 M to 10-1 M. Since this quantification was performed several times,
for different assays, the calibration curves obtained are not included in this section, but can be consulted
in appendix A.2Ionic Strength Adjuster (ISA) is a 0.9 M aluminium sulphate solution (METTLER TOLEDO).
40
4.6.6 Overall yield and productivity calculations
To assess by-products formation during B. sacchari shake flask cultivations, overall product yields
were computed according to equation 4.1. In general, these values were obtained dividing the final
product concentration ([P ]f ) by the concentration of substrate consumed ([S]cons), which is xylose, un-
less stated otherwise. The substrate consumption is determined through a mass balance, computing
the difference between the initial ([S]i) and final ([S]f ) substrate concentrations in the culture broth. It is
important to notice that volume variations due to sampling were neglected in shake flasks assays, i.e.
the biomass concentration is assumed not to be affected.
YP/S (g P/g Scons) =[P ]f
[S]i − [S]f=
[P ]f[S]cons
(4.1)
In bioreactor cultivations, yield calculations were performed using a different approach: instead of
using the final by-product concentration, the mass of product present in each sample harvested was
calculated (assuming that an approximate volume of 17 mL was retrieved at each sampling time), just
as in the culture broth, at the end of the cultivation. In other words, a mass balance was performed at
each sampling time for each product.
As described in equation 4.2, the yields were computed dividing the total by-product mass obtained
in samples (Σ mPs ) plus the remaining amount in the broth (mPf), by the amount of substrate consumed
during cultivation (mScons). Again, the substrate consumption is determined through a mass balance,
computing the difference between the initial amount of substrate (mSi), plus its quantity added in the
feed for fed-batch cultivations (mSfeed), and the final substrate mass in the culture broth (mSf
).
YP/S (g P/g Scons) =Σ mPs
+mPf
mSi+mSfeed
−mSf
=mPf
mScons
(4.2)
Both for shake flask and bioreactor assays, overall productivities were computed dividing the final
product concentration attained ([P ]f ) by the cultivation time (tcult). Similarly, maximum productivities
were computed dividing the maximum product concentration ([P ]max) by the corresponding sampling
time (ts). Equations 4.3 and 4.4 describe these calculations.
ProdP (g P L−1 h−1) =[P ]ftcult
(4.3)
ProdmaxP(g P L−1 h−1) =
[P ]max
ts(4.4)
41
42
5Results and Discussion
43
5.1 Shake flask assays
Fed-batch bioreactor assays based solely on xylose (Raposo et al., 2017) have shown a negligible
P(3HB) production compared to the production on the same carbon source but in shake flasks. With the
aim of understanding the reasons for that fact, several assays were carried out in shake flasks under
different culture conditions.
Shake flask experiments have thus been designed to explore the culture behaviour according to:
i) the composition of cultivation medium, ii) the oxygen availability, and iii) pH control. In addition, the
influence of using inocula grown on different carbon sources on the P(3HB) production based on xylose
has also been tested.
5.1.1 Xylose as sole carbon source for B. sacchari cultivations
To assess the implications in B. sacchari cultivations when using xylose as main carbon source,
a shake flask assay was performed in order to evaluate the growth and production of this strain. The
maximum specific cell growth rate (µmax) of B. sacchari in xylose cultivations was also computed. Figure
5.1 represents the time course of growth, production and substrate consumption obtained in this assay.
Figure 5.1: B. sacchari shake flask cultivation data for growthand production in seeding medium, supplemented with 20 gL-1
of xylose as main carbon source, using an inoculum cultivatedon glucose.
In batch cultivations, the variation of biomass (X), in gL-1, over time is expressed by equation 5.1,
which, when integrated, gives equation 5.2. In these, µ (h-1) is the specific cell growth rate, and X0 (gL-1)
corresponds to the biomass at the beginning of the exponential phase, i.e. at time t0 (h). Since during
the exponential phase cells grow at their maximum growth rate, the plot of experimental data in this time
44
Figure 5.2: Plot of equation 5.2 using experimental data fromthe exponential phase of the shake flask assay represented infigure 5.1.
interval (ln(CDW ) vs. time, as seen in figure 5.2) allowed for µmax (h-1) determination for B. sacchari
shake flask cultivations using xylose as sole carbon source.
dXt
dt= µ×Xt (5.1)
ln(Xt) = ln(X0) + µ (t− t0) (5.2)
From literature, it is known that B. sacchari cultures can achieve a CDW of 6.3 gL-1, with a maximum
production of 3.8 gL-1 of P(3HB), which corresponds to 60% of cell polymer content, when using glucose
as main carbon source (Cesario et al., 2014).
In this experiment, a CDW of ca. 4.2 gL-1 was achieved, with 1.6 gL-1 of P(3HB), corresponding to
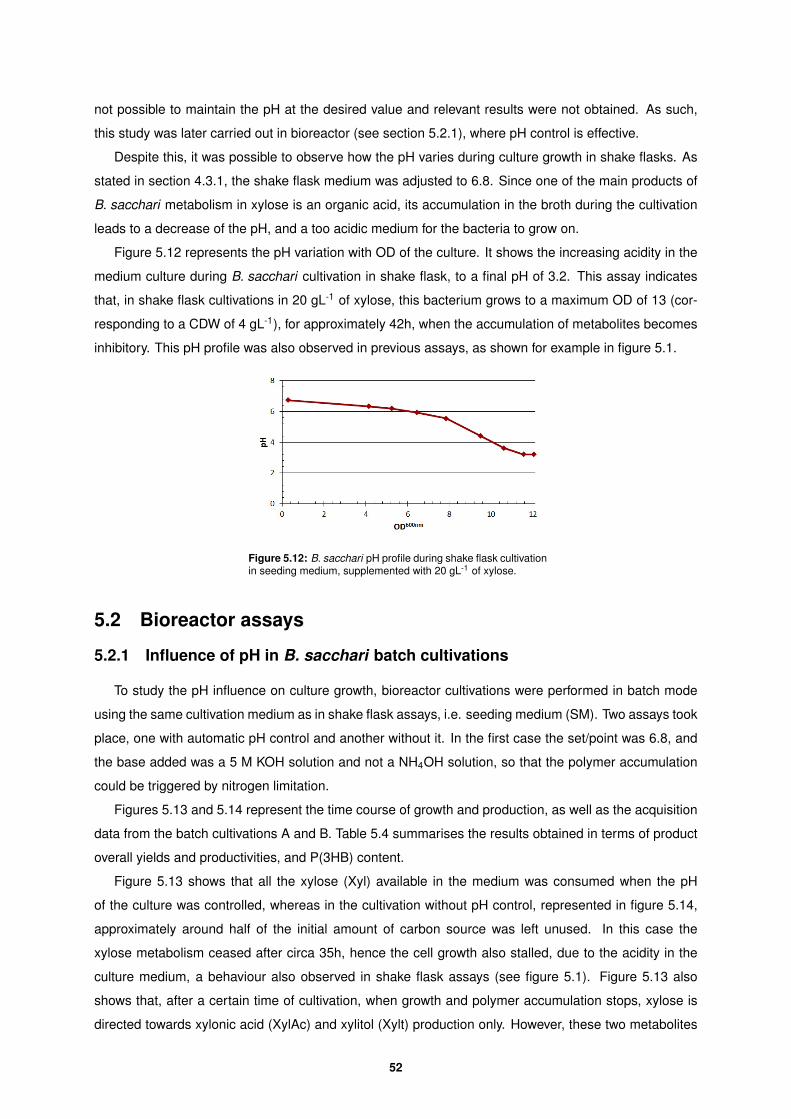
39% of cell content. A P(3HB) overall yield of 0.09 g of P(3HB) per g of xylose consumed was obtained,
as well as an overall yield in D-xylonic acid (XylAc) of 0.83 g of XylAc per g of xylose. Additionally,
according to the plot represented in figure 5.2 a µmax of 0.14 h-1 was obtained. This value is slightly
lower than the one reported by Cesario et al. (2014) (µmax of 0.18 h-1) for B. sacchari cultivations on
30 gL-1 of xylose. The lack of more experimental points may be the reason for such difference. In this
report, a µmax of ca. 0.28 h-1 for cultivations on glucose was obtained, which is consistent with the fact
that cell growth on xylose is twice slower than in cultivations on glucose. The yield of P(3HB) on xylose
is not consistent with the one reported in Cesario et al. (2014), where a higher value of 0.24 g P(3HB)
per g xylose was obtained. However, in that study xylonic acid production was not reported as it had
not been yet detected. Due to the overlaping of the xylose and xylonic acid peaks when using the RI
detector, the amount of xylose consumed was miscalculated and so was the yield of polymer on xylose.
In the present study, xylonic acid production was in fact observed as a by-product of xylose metabolism
by B. sacchari , which is in agreement with more recent reports (Raposo et al., 2017).
5.1.2 Influence of the C-source used for inocula growth
In order to evaluate the influence, if any, of the substrate used to grow the inoculum, three shake
flask assays were performed in triplicate, each inoculated with cells cultivated in different sugars, namely:
45
Figure 5.3: Experimental set-up to study of the influence of the sugar used to grow the inoculum: glucose (Gluc), xylose (Xyl)and sucrose (Suc), on the growth and production performance of cultures grown on 20 gL-1 of xylose. Periodic sampling for pH,biomass, sugars and organic acids, and P(3HB) determination.
Table 5.1: Overall yields of xylonic acid (XylAc) and P(3HB) in shake flask cultivations using 20 gL-1 of xylose as sole carbonsource, and inocula grown in three different sugars: glucose, xylose and sucrose.
C-sourceYXylAc/Xyl cons YP(3HB)/Xyl cons %P(3HB)
(g XylAc/g Xyl) (g P(3HB)/g Xyl) (g P(3HB)/g CDW)
Glucose 0.54 0.086 39.4
Xylose 0.54 0.084 39.8
Sucrose 0.68 0.090 43.6
glucose (Gluc), D-xylose (Xyl) and sucrose (Suc). A schematic of the experimental set-up is represented
in figure 5.3.
Figures 5.4 to 5.6 represent the time course of production and substrate consumption in shake flask
cultivations, and table 5.1 summarises the results in terms of product overall yields and polymer content.
As shown in figures 5.4 to 5.6, the residual biomass (Xr) values attained are similar for all three
cultivations (around 2 gL-1). Inocula grown on glucose and xylose feature similar substrate (xylose)
consumption during both cultivations, while the culture with the inoculum grown on sucrose led to higher
consumption of xylose.
Despite the absence of glucose in the data represented above, a residual amount of this sugar was
present in the assays due to the carryover of glucose from the inoculum. This explains the fact that xylose
is not being consumed from the very beginning. Since it was a negligible amount of sugar (less than 1
gL-1), its presence was not taken into account in any yield calculations. Since sucrose is a disaccharide
46
Figure 5.4: B. sacchari shake flask cultivation data for growthand production in SM, supplemented with 20 gL-1 of xylose asmain carbon source, and an inoculum grown on glucose.
Figure 5.5: B. sacchari shake flask cultivation data for growthand production in SM, supplemented with 20 gL-1 of xylose asmain carbon source, and an inoculum grown on xylose.
Figure 5.6: B. sacchari shake flask cultivation data for growthand production in SM, supplemented with 20 gL-1 of xylose asmain carbon source, using an inoculum grown on sucrose.
47
composed of glucose and fructose units, it wasn’t possible to determine this sugar concentration. As
such, sucrose presence in shake flask cultivations was also assumed as negligible.
Table 5.1 shows identical D-xylonic acid (XylAc) yields in xylose cultivations using inocula grown on
glucose or xylose, and higher yield for the inoculum grown on sucrose. The same results are again ob-
tained for P(3HB) yields and %P(3HB). Also, the polymer content, around 40% of the CDW, is consistent
with the assay described in section 5.1.1 and also with the report of Cesario et al. (2014).
The results obtained suggest that in B. sacchari xylose-cultivations there are no significant differ-
ences in terms of residual biomass and product overall yields using inocula grown on glucose or xylose.
However, when sucrose grown inocula was used, higher cell growth and products concentrations were
attained, due to an increased quantity of substrate consumed. Despite these conclusions, in order to
compare the results of this study with previous studies, it was chosen to proceed the experimental work
with glucose grown inocula.
Moreover, B. sacchari cell growth on glucose, xylose and sucrose was monitored during inocula
preparation. It was interesting to notice that B. sacchari cultures on xylose achieve the stationary phase
only after ca. 24h, i.e. much later than those on glucose and sucrose. This is in fact supported by
the lower µmax determined experimentally for cultivations on xylose (see section 5.1.1), and also by
literature (Cesario et al., 2014)).
5.1.3 Influence of YE presence in seeding medium
As mentioned previously, another significant difference between shake flask and bioreactor media is
the fact that the first is a complex medium whereas the second is a defined medium.
The rate of growth and the activity of metabolic processes may be strongly affected by the type and
ratio of nutrients provided to the culture, hence affecting cell mass and specific product yields. These
nutrients are often supplied from raw materials that are complex, ill-defined mixtures of natural origin and
subject to significant variation, such as yeast extract (YE). YE, produced by the hydrolysis and spray-
drying of baker’s or brewer’s yeast, is a powder consisting of protein, free amino nitrogen, vitamins, and
minerals (Kasprow et al., 1998).
Aiming to study the effect of YE presence in the culture medium, an assay in duplicate was carried
out to compare cell growth and product yields of B. sacchari cultivations on xylose. A schematic of the
experimental set-up is represented in figure 5.7.
Figures 5.8 and 5.9 represent the time course of production and substrate consumption, and table
5.2 summarises the results in terms of product overall yields and polymer content.
As stated in the beginning of this section, cell growth is highly dependent on the nutrients ratio
present in the culture medium. If the amount of essential nutrients is too small for the amount of carbon
source available, as it happens in the culture without YE, the sugar consumption will be lower, leading
to a lower cell growth and a lower polymer production.
The results displayed in table 5.2, indicate that the xylonic acid yield is similar in both cases, but
around 10% higher in the cultivation carried without YE, suggesting that the production of this organic
acid is not directly influenced by the nutrients provided through this compound. Additionally, this be-
48
Figure 5.7: Experimental set-up for the study of the influence of yeast extract (YE) presence in the shake flask cultivation seedingmedium. Inoculum grown on glucose (Gluc) cultivated in complete seeding medium (SM) and in seeding medium without YE(SM-YE), supplemented with 20 gL-1 of xylose (Xyl). Periodic sampling for pH, biomass, sugars and organic acids, and P(3HB)determination.
Figure 5.8: B. sacchari glucose grown inoculum cultivated inshake flask, in complete SM supplemented with 20 gL-1 of xyloseas main carbon source.
Figure 5.9: B. sacchari glucose grown inoculum cultivated inshake flask with 20 gL-1 of xylose as main carbon source, inseeding medium without YE.
Table 5.2: Overall yields of xylonic acid (XylAc) and P(3HB) in shake flask cultivations using seeding medium with and withoutyeast extract (YE).
medium (g XylAc/g Xyl) (g P(3HB)/g Xyl) (g P(3HB)/g P(3HB))
SM 0.61 0.081 38.5
SM-YE 0.72 0.061 35.0
49
haviour indicates that the cells seem to conduct the xylose preferably towards xylonic acid production
pathway instead of P(3HB) formation pathway.
It is important to notice the small differences in terms of residual biomass and product yields between
the cultivations represented in figures 5.4 and 5.8. These cultivations were carried under the same
growth conditions, however, the results obtained for the latter assay show higher XylAc yield and lower
polymer yield. One plausible explanation could be experimental error. The product yields attained for
the cultivation of glucose grown inoculum in complete seeding medium (see table 5.2) are similar to the
product yields attained for the sucrose grown inoculum cultivation (see table 5.1). This supports the idea
of no influence of the sugar used for inoculum cultivations.
5.1.4 Influence of inhibitory substrate concentrations
Previous studies (Raposo et al., 2017) revealed D-xylitol (Xylt) production, both in shake flask and
bioreactor cultivations, when high concentrations of xylose were present, i.e. above 30-40 gL-1.
In order to obtain xylitol production in B. sacchari cultivations, duplicate assays were carried with a
glucose grown inoculum cultivated in seeding media supplemented with 50 gL-1 of xylose. A schematic
of the experimental set-up is represented in figure 5.10. Figure 5.11 represents the time course of
production and substrate consumption, and table 5.3 summarises the results in terms of product overall
yields and polymer content.
Figure 5.10: Experimental set-up for the study of xylitol production in shake flask cultivations. Inoculum grown on glucosecultivated in seeding medium (SM) supplemented with 50 gL-1 of xylose (Xyl). Periodic sampling for pH, biomass, sugars andorganic acids, and P(3HB) determination.
Table 5.3: Overall yields of xylonic acid (XylAc), xylitol (Xylt) and P(3HB) in shake flask cultivations with inhibitory concentrationsof xylose (50 gL-1).
Similar values for residual biomass were obtained for both cultivations with 20 gL-1 and 50 gL-1 (ca.
2.5 gL-1), as represented in figures 5.1 and 5.11, respectively. However, figure 5.11 shows that only half
of the xylose initially present in the culture medium was consumed, probably due to cell growth having
cessed as a consequence of the medium becoming too acidic.
A comparison between the results described in section 5.1.1 and table 5.3 reveals that lower polymer
yields were obtained when the xylose concentration in the culture medium was inhibitory, hence the
50
Figure 5.11: Glucose grown inoculum cultivated in seedingmedium, supplemented with high concentrations of substrate (50gL-1 of xylose).
polymer content was lower than 30%. The same result was obtained for xylonic acid: a lower yield was
found in the presence of 50 gL-1 of xylose. These results demonstrate that less substrate was directed
towards the formation of these two products, suggesting the presence of a third metabolite.
As expected, it was possible to confirm xylitol production in shake flask cultivations of B. sacchari
when using inhibitory concentrations of xylose as main carbon source. Thus, the substrate was con-
ducted towards xylonic acid, polymer and xylitol production, three by-products of the xylose metabolism.
5.1.5 Influence of pH
The enzymatic activity is of microbial cells is intrinsically related with the medium pH. Bacterial cells
are capable of maintaining their intracellular pH even when subjected to significant exterior pH varia-
tions. This happens at the expense of maintenance energy, so as to keep the proton gradient constant
through the cell membrane. However, this capacity decreases when the extracellular pH drops due to
organic acids formation. These acids penetrate cells by passive diffusion, where they meet a higher
intracellular pH and dissociate. High organic acids concentrations force cells to pump protons to the
exterior, leading to an elevated energy outlay (da Fonseca and Teixeira, 2007). Medium buffering is
almost always insufficient to maintain the culture pH between acceptable values, hence the addition of
acids or bases to control the pH is essential.
To assess pH variations during culture growth, shake flask assays were performed. Foremost, the
goal was to control the culture medium pH with small additions of a base solution with known concen-
tration (1 M KOH). However, due to the presence of the phosphate buffer in the seeding medium, it was
51
not possible to maintain the pH at the desired value and relevant results were not obtained. As such,
this study was later carried out in bioreactor (see section 5.2.1), where pH control is effective.
Despite this, it was possible to observe how the pH varies during culture growth in shake flasks. As
stated in section 4.3.1, the shake flask medium was adjusted to 6.8. Since one of the main products of
B. sacchari metabolism in xylose is an organic acid, its accumulation in the broth during the cultivation
leads to a decrease of the pH, and a too acidic medium for the bacteria to grow on.
Figure 5.12 represents the pH variation with OD of the culture. It shows the increasing acidity in the
medium culture during B. sacchari cultivation in shake flask, to a final pH of 3.2. This assay indicates
that, in shake flask cultivations in 20 gL-1 of xylose, this bacterium grows to a maximum OD of 13 (cor-
responding to a CDW of 4 gL-1), for approximately 42h, when the accumulation of metabolites becomes
inhibitory. This pH profile was also observed in previous assays, as shown for example in figure 5.1.
Figure 5.12: B. sacchari pH profile during shake flask cultivationin seeding medium, supplemented with 20 gL-1 of xylose.
5.2 Bioreactor assays
5.2.1 Influence of pH in B. sacchari batch cultivations
To study the pH influence on culture growth, bioreactor cultivations were performed in batch mode
using the same cultivation medium as in shake flask assays, i.e. seeding medium (SM). Two assays took
place, one with automatic pH control and another without it. In the first case the set/point was 6.8, and
the base added was a 5 M KOH solution and not a NH4OH solution, so that the polymer accumulation
could be triggered by nitrogen limitation.
Figures 5.13 and 5.14 represent the time course of growth and production, as well as the acquisition
data from the batch cultivations A and B. Table 5.4 summarises the results obtained in terms of product
overall yields and productivities, and P(3HB) content.
Figure 5.13 shows that all the xylose (Xyl) available in the medium was consumed when the pH
of the culture was controlled, whereas in the cultivation without pH control, represented in figure 5.14,
approximately around half of the initial amount of carbon source was left unused. In this case the
xylose metabolism ceased after circa 35h, hence the cell growth also stalled, due to the acidity in the
culture medium, a behaviour also observed in shake flask assays (see figure 5.1). Figure 5.13 also
shows that, after a certain time of cultivation, when growth and polymer accumulation stops, xylose is
directed towards xylonic acid (XylAc) and xylitol (Xylt) production only. However, these two metabolites
52
Figure 5.13: Data obtained in B. sacchari batch cultivation A,using seeding medium supplemented with 50 gL-1 of xylose, withpH controlled at 6.8 and 20% of DO. Equations A.1 to A.6 wereused as calibrations curves.
Figure 5.14: Data obtained in B. sacchari batch cultivation B,using seeding medium supplemented with 50 gL-1 of xylose, with20% of DO and without pH control. Equations A.1 to A.6 wereused as calibrations curves.
Table 5.4: Overall yields and productivities of xylonic acid (XylAc), xylitol (Xylt) and P(3HB) in bioreactor batch cultivations, usingseeding medium supplemented with 50 gL-1 of xylose, with (A) and without (B) pH control, and 20% saturation of DO in themedium.
Cultivation XylAc Xylt P(3HB)%P(3HB)
(g P(3HB)/g CDW)
A: with pH control
YP/S (g/g Xyl) 0.95 0.056 0.039
ProdP/S (g L-1 h-1) 0.45 0.027 0.018 39
Prodmax P/S (g L-1 h-1) 0.46 0.031 0.018
B: without pH control
YP/S (g/g Xyl) 0.54 0.027 0.029
ProdP/S (g L-1 h-1) 0.18 0.009 0.009 35
Prodmax P/S (g L-1 h-1) 0.22 0.010 0.047
53
start being formed even before polymer accumulation starts. The shortage of some component in the
exhausted culture medium may be the cause for the cessation of P(3HB) production stopping and thus
xylose is channeled only to xylitol and xylonic acid production.
Theoretically, the more substrate cells consume, the higher the cell or product concentration achieved.
In the batch assay with pH control at 6.8, is possible to confirm the higher cell growth (ca. 3.6 gL-1 of
residual biomass) and production levels (approximately 60 gL-1 of xylonic acid and ca. 3.6 gL-1 of xylitol)
compared to the cultivations without pH control. The results concerning P(3HB) production are higher
when pH control takes place probably since more substrate is consumed and channeled into polymer
formation. In cultivations without pH control, the metabolism tends to stagnate at pH 3.2, the cell growth
ceases and so does the metabolite production. These results establish the necessity of pH control for
microbial cultivations.
Note that the pH fluctuation represented in figure 5.14 is identical to the pH profile obtained for
B. sacchari in shake flask (see figures 5.1 and 5.11). Also, from the results described in table 5.4, the
cell content of P(3HB) is similar to the values attained for shake flask assays (see table 5.1). Another
interesting aspect is xylitol production, which occurs when high concentrations of xylose are present in
the culture medium, as reported in the literature (Raposo et al., 2017) and confirmed in the correspond-
ing shake flask assay (see section 5.1.4).
At fixed air flow, the agitation in bioreactor cultivations changes automatically to maintain the dissolved
oxygen (DO) set-point (%DO sat.). The concentration of the DO in the culture medium is a translation of
the cells metabolism. In other words, when cells are metabolising the sugar, oxygen is being consumed,
hence the agitation increases to maintain the DO set-point, i.e. at 20% saturation. If there is no substrate
left for consumption, or cell growth just ceased due to metabolite accumulation in the broth, the %DO
increases towards saturation and agitation levels remain at the lower threshold.
Data regarding agitation and DO in the culture medium were collected during the time course of both
cultivations. Observing figures 5.13 and 5.14, the most predominant difference is the DO curve in the
cultivation without pH control. Once the metabolism ceases, after 32h of cultivation, the % DO increases
to saturation levels (around 95%) and the agitation remains at the lower threshold. On the contrary,
in the cultivation with pH control, the cells continue metabolizing the remaining substrate, and the DO
presents values around 30% saturation, without the necessity of increasing the agitation.
5.2.2 Influence of the limiting nutrient in the medium used for fed-batch cultiva-tions
As described before, bioreactor cultivation medium is a defined medium (see section 4.3), as op-
posed to the seeding medium used in shake flasks, which is a complex medium due to the presence of
yeast extract. Since P(3HB) synthesis occurs under limitation of an essential nutrient and in the pres-
ence of excess carbon source (Sudesh et al., 2000), two types of bioreactor media were used throughout
this work to impose nutrient limitation: phosphorus and nitrogen limiting media. Another difference be-
tween seeding and the bioreactor media tested in previous studies (Raposo et al., 2017) is that the first
54
is limited by nitrogen while the latter is limited by phosphorus. Recent research on P(3HB) production
using B. sacchari in bioreactor cultivations has been carried out in media with P-limitation (Silva et al.,
2004; Cesario et al., 2014) since (Ryu et al., 1997) first reported that higher polymer accumulation was
attained on Ralstonia eutropha cultivations based on glucose.
In order to evaluate the influence of the limiting nutrient in the medium used for B. sacchari cultiva-
tions in xylose, fed-batch assays were performed with different media compositions (see section 4.3)
and the results obtained for growth and production compared. Figures 5.15 and 5.16 represent the time
course of growth and metabolite production, as well as data obtained in the fed-batch cultivations C
and D. Table 5.5 summarises the results in terms of product overall yields and productivities, as well as
P(3HB) content.
Figure 5.15: Data obtained in B. sacchari fed-batch cultivationC, using P limited medium supplemented with 30 gL-1 of xyloseas main carbon source, at pH 6.8 and 20% of DO. A 600 gL-1
solution of xylose was used as feed. Equations A.7 to A.12 wereused as calibration curves.
Figure 5.16: Data obtained in B. sacchari fed-batch cultivationD, using N limited medium supplemented with 30 gL-1 of xyloseas main carbon source, at pH 6.8 and 20% of DO. A 600 gL-1
solution of xylose was used as feed. Equations A.1 to A.6, andA.14 were used as calibrations curves.
55
Table 5.5: Overall yields and productivities of xylonic acid (XylAc), xylitol (Xylt) and P(3HB) in fed-batch cultivations C and D,carried out in an essential nutrient limiting medium supplemented with 30 gL-1 of xylose, at pH 6.8 and 20% of DO in the medium.
Cultivation XylAc Xylt P(3HB)%P(3HB)
(g P(3HB)/g CDW)
C: P-limited
YP/S (g/g Xyl) 0.65 - 0.000
ProdP/S (g L-1 h-1) 0.54 - 0.00 0
Prodmax P/S (g L-1 h-1) 0.92 - 0.016
D: N-limited
YP/S (g/g Xyl) 1.07 - 0.041
ProdP/S (g L-1 h-1) 0.73 - 0.028 35
Prodmax P/S (g L-1 h-1) 0.73 - 0.068
First of all, it is important to point out the alkaline pH shift in the bioreactor assays’ data graphs repre-
sented above within the first 12-24 hours. This could be explained by the citrate present in the medium
that is consumed in the first place (Cesario et al., 2014), and/or by the alkaline shift caused by D-xylose
presence in the culture (Jeffries, 1983; Lam et al., 1980). The latter may support the assumption that
D-xylose uptake in B. sacchari is indeed driven by a chemiosmotic system, as seen for Escherichia
coli (E. coli). Note that the batch assays’ data also exhibit this pH change (see figures 5.13 and 5.14),
even with the presence of buffer.
Figure 5.15 shows no significant polymer formation, suggesting that all the xylose (Xyl) provided was
consumed and used mainly for cell growth (ca. 35 gL-1 of Xr) and xylonic acid production (reaching a
maximum value of 72 gL-1). Phosphorus limitation during cultivation is confirmed, however it did not
promote a significant amount of polymer formation.
On the contrary, figure 5.16 exhibits higher P(3HB) and xylonic acid productivities attained under
nitrogen limitation, as well as polymer content, despite the lower cell growth compared to cultivation C
(around 7.5 gL-1 of residual biomass, less than half of the value attained for medium limited by phos-
phorus). A decrease in the ammonium concentration is also observed in cultivation D, suggesting a
tendency towards nitrogen limitation. With regard to the nutrient limitation, it is important to keep in mind
that the limiting factor could not be simply the nitrogen availability, but instead the ratio carbon-nitrogen.
For instance, if the amount of nitrogen present is too small for the quantity of carbon source available for
cell growth, we should consider that the culture is facing limiting conditions.
Figure 5.16 shows that the pH in cultivation D was measured low in the first 8 hours of culture. Since
the cultivation medium is settled at pH 7.1 prior to sterilization (as described in sections 4.3.3 and 4.3.3),
it is very unlikely that the pH droped so abrutly during this procedure. One explanation could be an
improper assembly of the electrode cable or poor pH calibration. Nevertheless, the culture growth did
not seem compromised and plausible results were in fact obtained. It is also important to highlight that
there were difficulties when using the ammonium electrode to assess N-limitation during the cultivation
once the obtained ammonia concentration values in the culture were erratic. One explanation could be
56
interference from the other components of the broth, such as metabolites, impairing the accuracy of the
equipment.
In short, the results discussed above allow to conclude that cultivations in media limited by nitrogen
lead to higher P(3HB) accumulation when using xylose as main carbon source, unlike what happens
in glucose-cultivations. In fact, Cesario et al. (2014) reported that the %P(3HB) content on xylose was
44.4% compared to glucose, which was determined as 60.3%. On the other hand, cultivations carried
out in phosphorus limited medium led to higher cell growth when compared to their N limited counter-
parts.
One of the objectives for this work assignment is the design of a process approach for P(3HB)
production by B. sacchari on xylose. Given the results obtained so far, a strategy that could be worth
testing would be carrying a first cultivation stage using phosphorus limited medium in order to reach high
values of cell growth, despite the no (significant) polymer formation. Once CDW values above 30 gL-1
had been reached, a second stage of the culture would take place, where the addition of a P-source
(through a feed solution or by changing the base to KOH) would switch the limiting nutrient into nitrogen,
thus promoting P(3HB) production.
5.2.3 Influence of the dissolved oxygen availability in the culture broth
In aerated bioreactors, molecular oxygen is the final electron acceptor in cell metabolism, enabling
fast substrate conversion. Given the high reaction volumes, and the high costs associated with aeration,
bioreactors are often operated with dissolved oxygen (DO) percentages just above the critical concen-
tration, where double limitation from the substrate as well as from the oxygen may occur (da Fonseca
and Teixeira, 2007).
To assess the influence of oxygen availability in B. sacchari cultivations, assays were performed with
a lower value for the DO set-point. Typically, cultivations were carried with an aeration of 2 vvm, and 20%
of DO saturation maintained by the agitation speed (the higher the agitation, the higher the superficial
oxygen transfer area, ergo the higher the rate of oxygen transfer into the medium). In order to decrease
the amount of oxygen available, the DO set-point was set to 1% saturation. To attain this value, the
air flow was reduced to ca. 1.0 Lmin-1, corresponding to 0.8 vvm. It is important to keep in mind that
lowering the amount of dissolved oxygen in the medium does not necessarily mean that the culture is
limited by oxygen itself, but again by high values for the ratio C/O2. With the objective of assessing
the effects of reducing the oxygen supply during cultivation, fed-batch cultivations were carried out in
duplicate using media limited by phosphorous and nitrogen.
The results obtained in the time course for growth and production, as well as online acquired data
in the P-limited fed-batch cultivations E and F are shown in figures 5.17 and 5.18, and figures 5.19
and 5.20 represent the results achieved under N-limitation, corresponding to cultivations G and H, all
with low DO set-point. Table 5.6 summarises the results obtained in terms of product overall yields and
productivities, as well as P(3HB) content.
57
Figure 5.17: Data obtained in B. sacchari fed-batch cultivationE, using P limiting medium supplemented with 30 gL-1 of xyloseas main carbon source, at pH 6.8 and 1% of DO. A 600 gL-1
solution of xylose was used as feed. Equations A.1 to A.6 wereused as calibrations curves.
Figure 5.18: Data obtained in B. sacchari fed-batch cultivationF, using P limiting medium supplemented with 30 gL-1 of xyloseas main carbon source, at pH 6.8 and 1% of DO. A 600 gL-1
solution of xylose was used as feed. Equations A.7 to A.12 wereused as calibrations curves.
58
Figure 5.19: Data obtained in B. sacchari fed-batch cultivationG, using N limiting medium supplemented with 30 gL-1 of xyloseas main carbon source, at pH 6.8 and 1% of DO. Manual pulsesof a 600 gL-1 solution of xylose were added during cultivation asfeed. Equations A.7 to A.12, and A.15 were used as calibrationscurves.
Figure 5.20: Data obtained in B. sacchari fed-batch cultivationH, using N limiting medium supplemented with 30 gL-1 of xyloseas main carbon source, at pH 6.8 and a set point for DO of 1%. Atotal volume of 316 mL of a 600 gL-1 xylose solution was used asfeed. Equations A.7 to A.12, and A.16 were used as calibrationscurves.
59
Table 5.6: Overall yields and productivities of xylonic acid (XylAc), xylitol (Xylt) and P(3HB) in fed-batch cultivations using phos-phorus (cultivations E and F) and nitrogen (cultivations G and H) limited medium supplemented with 30 gL-1 of xylose, at pH 6.8and 1% saturation of DO.
Cultivation XylAc Xylt P(3HB)%P(3HB)
(g P(3HB)/g CDW)
E: P-limited
YP/S (g/g Xyl) 0.17 0.007 0.070
ProdP/S (g L-1 h-1) 0.14 0.005 0.056 26
Prodmax P/S (g L-1 h-1) 0.14 0.005 0.139
F: P-limited
YP/S (g/g Xyl) 0.17 - 0.067
ProdP/S (g L-1 h-1) 0.15 - 0.057 20
Prodmax P/S (g L-1 h-1) 0.23 - 0.058
G: N-limited
YP/S (g/g Xyl) - - 0.120
ProdP/S (g L-1 h-1) - - 0.037 36
Prodmax P/S (g L-1 h-1) - - 0.039
H: N-limited
YP/S (g/g Xyl) 0.29 - 0.083
ProdP/S (g L-1 h-1) 0.18 - 0.047 30
Prodmax P/S (g L-1 h-1) 0.18 - 0.074
As figures 5.17 and 5.18 show, in the P-limited cultivations there is polymer formation for DO con-
centrations around 1%, reaching up to 0.07 g of P(3HB) per g of xylose consumed in cultivation E, and
similar values for CDW are attained. This suggests that a possible double limitation by phosphorus and
oxygen took place and led to P(3HB) production. To avoid a possible limitation by carbon source, man-
ual pulses were added to the culture E which caused an increase in the xylose concentration levels (up
to 40 gL-1) and, as demonstrated previously throughout this work, high xylose concentrations triggered
xylitol production. It is important to notice that it was not possible to verify phosphorus limitation during
cultivation F due to peak overlap in the HPLC chromatograms. Another interesting aspect is the xylonic
acid production, which starts later compared to cultivations with similar limitation but carried out at 20%
saturation of DO in the medium, when xylose concentrations are close to zero. From table 5.6 is possi-
ble to observe similar P(3HB) yields for both assays (ca. 0.07 g P(3HB) per g of xylose consumed), but
lower polymer content in cultivation F.
As discussed previously, culture media limited by nitrogen favoured P(3HB) formation, with a yield of
ca. 0.04 g of P(3HB) per g of xylose consumed for cultivation D. Additionally, with the results represented
in figures 5.19 and 5.20, by decreasing the DO concentration to 1-3% saturation, the polymer production
attained increased up to 0.12 g of P(3HB) per g of xylose consumed, for cultivation G. Therefore, the
P(3HB) yield apparently increases under double limitation, despite the lower cellular growth . As figure
5.19 shows, feeding through the usual strategy was difficult once the air supplied was enough to satisfy
the cellular metabolism, and increasing agitation was not necessary. In consequence, a very small
amount of feed was added to the culture manually, to avoid depletion of the carbon source. Comparing
60
both cultivations G and H, the most evident differences are the cell growth, oxygen and agitation curves.
Due to a possible malfunction of the oxygen electrode or poor calibration, negative values for the DO in
the medium were recorded in cultivation H, which are not physically possible. These triggered the stirrer
speed to unnecessary high values, and thus to frequent feed pulses, hence the xylose accumulation
in the broth in the end of cultivation. However, not enough time passed to observe xylitol production.
Also, the higher oxygen availability in the medium may be responsible for the higher cellular growth.
In addition, P(3HB) production is lower in cultivation H, and lower yield and productivity values were
attained. It is worthy of notice that the ammonia concentration appears to be constant during the time
course of both cultivations. Since this assay was carried under oxygen limitation, cell growth is much
slower and hence more time is needed to achieve the N-limiting conditions.
One final observation regarding the cultivation H is the inconsistency of CDW values, which is likely
due to experimental error during sampling. Therefore, an average value is presented in table 5.6 for the
polymer content.
From the results summarised in table 5.6 in terms of yield and productivity, these indicate that,
among all growth conditions studied, the best approach towards P(3HB) production by B. sacchari , so
far, seems to be a combination of N-limited medium and 1% of oxygen saturation. Therefore, aiming at
an improvement of polymer production based on xylose, a two stage system should take place: a first
stage using P-limiting conditions to achieve high cellular growth, followed by a second cultivation stage
using N-limitation and low values of DO (less than 5%).
5.2.4 Cultivations towards xylitol production: influence of inhibitory xylose con-centrations
To study the parameters that promote xylitol production in B. sacchari cultivations on xylose, du-
plicate assays were performed using medium limited by phosphorus and 20% saturation of DO, since
these were the conditions that led to higher cell growth, with no polymer formation thus increasing the
chances of conducting the substrate consumed towards xylitol formation and secretion.
Figures 5.21 and 5.22 represent the time course of growth and production of cultivations I and J,
respectively, and table 5.7 summarises the results in terms of product overall yields and productivities,
as well as P(3HB) content.
Observing both figures 5.21 and 5.22, these show an identical behaviour in terms of cell growth,
polymer formation and oxygen and agitation profiles. Also, culture medium limitation by phosphorus
is confirmed in both cultivations. However, the feeding strategy used for xylose accumulation in the
broth was not accomplished, thus leading to no xylitol production in any of the assays. The lack of
xylose monitoring during the cultivation (due to HPLC technical problems) was the main cause for the
triggering of feed not having been adjusted correctly. Increasing the pulses’ volume or trigger the xylose
pulses more frequently would have allowed for substrate accumulation in the culture medium, potentially
creating the ”ideal” cultivation conditions for xylitol formation.
Despite these assays, in previous cultivations xylose did accumulate in the broth (see cultivation E
61
Figure 5.21: Data obtained in B. sacchari fed-batch cultivationI, using P-limited cultivation medium supplemented with 30 gL-1
of xylose as main carbon source, at pH 6.8 and 20% of DO. Atotal volume of 198 mL of a 600 gL-1 xylose solution was usedas feed. Equations A.7 to A.12 were used as calibrations curves.
Figure 5.22: Data obtained in B. sacchari fed-batch cultivationJ, using P-limited cultivation medium supplemented with 30 gL-1
of xylose as main carbon source, at pH 6.8 and 20% of DO. Atotal volume of 236 mL of a 600 gL-1 xylose solution was usedas feed. Equations A.7 to A.12 were used as calibrations curves.
Table 5.7: Overall yields and productivities of xylonic acid (XylAc), xylitol (Xylt) and P(3HB) in the bioreactor fed-batch cultivationsusing a phosphorus limited medium, supplemented with 30 gL-1 of xylose, at pH 6.8 and 20% saturation of DO.
Cultivation XylAc Xylt P(3HB)% P(3HB)
(g P(3HB)/g CDW)
I: P-limited
YP/S (g/g Xyl) 0.151 - 0.008
ProdP/S (g L-1 h-1) 0.187 - 0.014 3
Prodmax P/S (g L-1 h-1) 0.195 - 0.014
J: P-limited
YP/S (g/g Xyl) 0.000 - 0.000
ProdP/S (g L-1 h-1) 0.000 - 0.000 0
Prodmax P/S (g L-1 h-1) 0.06 - 0.021
62
shown in figure 5.17), however not intentionally, conducting to xylitol production. The aim of the assays
described above was to achieve high xylose concentrations in the broth and determine the conditions
to enhance xylitol production in B. sacchari cultivations. Despite the efforts made, the influence of high
xylose concentrations was not assessed properly and relevant conclusions weren’t withdrawn from the
assays performed in this matter.
On the other hand, once again it was noted that cultivations using P limiting medium with 20% of DO
did not led to significant polymer formation, confirming the conclusions drawn from the assays performed
earlier.
One interesting aspect worth noticing, is the fact that in the cultivation H, represented in figure 5.22,
cell growth appears to have two exponential phases, given the increasing curve for residual biomass.
This was the highest cell growth achieved within all the work described in this document, ca. 47 gL-1.
Also, the xylonic acid formed appears to be converted given the decreasing concentration values towards
zero, hence the null yield. The increasing pH in the culture medium is an important indicator in terms of
organic acids production and following consumption as well.
Finally, with regard to xylonic acid production, the results obtained throughout this work, may suggest
that when the xylose concentration in the culture medium is limitant, i.e. close to zero, xylonic acid
production takes place (see figures 5.15 to 5.18) whereas xylose concentrations above 30 gL-1 channel
the substrate towards the xylitol formation pathway (see figures 5.13, 5.14 and 5.17). Therefore, an
appropriate cultivation strategy to enhance xylonic acid production involves the control of the xylose
concentration in the broth.
5.2.5 Three-stage continuous bioreactors series: third bioreactor optimisationapproach
As mentioned previously, a three-stage stirred-tank reactor system operating in continuous and aim-
ing at P(3HB) production was run by Henriques (2015) based on a mixture glucose and xylose mimicking
a hemicellulosic hydrlysate. However, significant polymer production was not attained in the third biore-
actor of the series. To find a possible solution for this set back, P(3HB) production was assessed is
a fed-batch cultivation using similar feed composition and cultivation conditions (P-limiting medium and
20% of oxygen saturation). The feed solution was composed by a mixture of xylose and glucose with
a ratio of 8:1. Figure 5.23 represents the time course of growth and production, as well as online data
from the batch cultivations for the assay K.
The assays described in section 5.2.3 demonstrated that a reduced availability of oxygen in cultiva-
tions using P-limiting media leads to polymer production. In this context, the assay L, simulating the third
bioreactor of the continuous series, was also performed at 1% DO, aiming to attain higher P(3HB) yield
and productivites. The results of this cultivation are shown in figure 5.24.
Table 5.8 summarises the results in terms of product overall yields and productivities, as well as
P(3HB) content, for both cultivations described above.
Likewise to the third stage of the continuous series, there was no P(3HB) formation under the sim-
ulated cultivation conditions (P limiting medium with 20% of DO). This suggests that the presence of
63
Figure 5.23: Data obtained in B. sacchari fed-batch cultivationK, using P limiting medium supplemented with 30 gL-1 of xylose,at pH 6.8 and 20% of DO. A mixed solution of 600 gL-1 of xyloseand 75 gL-1 of glucose was used as feed. Equations A.7 to A.12were used as calibrations curves.
Figure 5.24: Data obtained in B. sacchari fed-batch cultivationL, using P-limited medium supplemented with 30 gL-1 of xylose,at pH 6.8 and 1% of DO. A total volume of 26 mL of a mixedsolution of 600 gL-1 of xylose and 75 gL-1 of glucose was usedas feed. Equations A.7 to A.12 were used as calibrations curves.
Table 5.8: Overall yields and productivities of xylonic acid (XylAc) and P(3HB) in the third bioreactor simulating fed-batch cultivationusing medium limited by phosphorous, supplemented with 30 gL-1 of xylose, at pH 6.8 with different oxygen saturations. Note thatyield calculations were performed in terms of total of sugars consumed.
Cultivation XylAc P(3HB)% P(3HB)
(g P(3HB)/g CDW)
K: 20% DO
YP/S (g/g sugars) 0.01 0.000
ProdP/S (g L-1 h-1) 0.11 0.000 0
Prodmax P/S (g L-1 h-1) 0.35 0.029
L: 1% DO
YP/S (g/g sugars) - 0.149
ProdP/S (g L-1 h-1) - 0.052 30
Prodmax P/S (g L-1 h-1) - 0.060
64
glucose in the culture does not necessarily promote polymer formation by itself, or limit xylose consump-
tion. However, both shake flask and bioreactor assays indicate that glucose is preferably metabolized
compared to xylose.
Just as previous assays showed (see figure 5.15), cellular growth attained in the presence of 20% of
oxygen saturation was higher than when the oxygen supply was lower (see figures 5.17 or 5.18, for 1%
of dissolved oxygen). Xylonic acid was difficult to quantify in these assays since other HPLC equipment
was used. However, in the cultivation limited both by phosphorus and oxygen no xylonic acid production
was observed.
Previous assays showed xylonic acid production for P limited media when using 20% saturation of
DO in the medium. The amount, and therefore the yield, of xylonic acid decreased substantially when
the oxygen supply was reduced. This was to be expected since xylonic acid is produced along an
oxidative pathway.
Finally, as shown in figure 5.24 and described in table 5.8, low oxygen supply did promote polymer
production in the culture simulating the third bioreactor of the continuous setup. In fact, this assay
resulted in the highest yield attained for P(3HB) production throughout this work. This suggests that
the oxygen availability in culture medium is the target factor for enhancing P(3HB) production in xylose-
cultivations of B. sacchari .
5.2.6 B. sacchari cultivation strategies towards xylonic acid, xylitol and P(3HB)production
Table 5.9 lists the maximum yields attained in B. sacchari fed-batch cultivations within all the oper-
ation conditions studied throughout this work, allowing for an overview of what appears to be the best
cultivation conditions to promote each of the three products formation.
From the assays listed in the table below, higher cellular growth is achieved in cultivation G when
phosphorus is the limiting nutrient (ca. 47 gL-1 of residual biomass). Thus, if a cultivation is carried out
with the aim of producing a dense cell culture, P-limited medium and with 20% saturation of DO should
be used.
Xylonic acid (XylAc) seems to attain higher concentration values, and higher yield, in seeding medium
cultivations A and B, where the limiting nutrient is nitrogen. However, a yield of 0.65 g of xylonic acid
per g of xylose consumed was attained in cultivation C, medium being limited by phosphorous and with
20% of oxygen saturation.
Within this experimental work, it was not possible to conclude about the culture conditions that pro-
mote higher xylitol production. However, xylitol formation was indeed confirmed when a high xylose
concentration (above 40 gL-1) was measured in the broth.
Despite the inconclusive results regarding xylonic acid and xylitol, it was possible to conclude that
the target factor towards enhancing P(3HB) production is the oxygen availability during Burkholderia
sacchari cultivations. The results obtained suggest that if a double limitation takes place, polymer pro-
duction is induced.
65
Table 5.9: Summary of the results obtained for B. sacchari bioreactor cultivations strategies towards xylonic acid (XylAc), xylitol (Xylt) and/or P(3HB) production throughout thiswork. Residual biomass (Xr) and maximum yield obtained for each metabolite under the various operation conditions studied are shown.