48


6
DIRECTORATE-GENERAL FOR INTERNAL POLICIES
POLICY DEPARTMENT B: STRUCTURAL AND COHESION POLICIES
FISHERIES
FUEL SUBSIDIES IN THE
EU FISHERIES SECTOR
NOTE

This document was requested by the European Parliament's Committee on Fisheries.
AUTHORS
Joint Research Centre of the European Commission, Italy:
Alessandra BORRELLO, Arina MOTOVA, Natacha DENTES DE CARVALHO
RESPONSIBLE ADMINISTRATOR
Irina POPESCU
Policy Department B: Structural and Cohesion Policies
European Parliament
E-mail: [email protected]
EDITORIAL ASSISTANCE
Virginija KELMELYTE
LINGUISTIC VERSIONS
Original: EN
ABOUT THE PUBLISHER
To contact the Policy Department or to subscribe to its monthly newsletter please write to:
Manuscript completed in July, 2013.
© European Union, 2013.
This document is available on the Internet at:
http://www.europarl.europa.eu/studies
DISCLAIMER
The opinions expressed in this document are the sole responsibility of the author and do
not necessarily represent the official position of the European Parliament.
Reproduction and translation for non-commercial purposes are authorized, provided the
source is acknowledged and the publisher is given prior notice and sent a copy.

DIRECTORATE-GENERAL FOR INTERNAL POLICIES
POLICY DEPARTMENT B: STRUCTURAL AND COHESION POLICIES
FISHERIES
FUEL SUBSIDIES IN THE
EU FISHERIES SECTOR
NOTE
Abstract
This briefing note is intended to provide the European Parliament with an
analysis on tax allowances, as provided by the Directive 2003/96/EC, on
fuels used by the EU fishing fleet. An estimate of the effects of this
directive in terms of forgone revenue by governments of the EU MS is
provided. Additionally, the benefits gained by fishers from tax
reductions/exemptions are analysed across fleet segments.
IP/B/PECH/IC/2013-114 July 2013
PE 513.963 EN


Fuel subsidies in the EU fisheries sector
3
CONTENTS
LIST OF ABBREVIATIONS 5
LIST OF TABLES 7
LIST OF FIGURES 7
EXECUTIVE SUMMARY 9
1. INTRODUCTION 11
2. FUEL SUBSIDIES IN THE EU FISHERIES SECTOR 13
3. FUEL TAX RATES FOR THE MOST COMMONLY USED FUEL TYPES
IN THE EU FISHERIES 21
4. FORGONE REVENUE BY GOVERNMENTS AS A CONSEQUENCE OF
THE FUEL TAX REDUCTIONS AND EXEMPTIONS FOR FISHERS 25
5. EVALUATION OF FLEET DEPENDENCY ON THE FUEL
CONSUMPTION 29
6. COMPARISON OF FUEL CONSUMPTION IN FISHERY WITH THE
OTHER SECTORS 35
7. CONCLUSIONS 39
REFERENCES 41

Policy Department B: Structural and Cohesion Policies
4

Fuel subsidies in the EU fisheries sector
5
LIST OF ABBREVIATIONS
OECD The Organisation for Economic Co-operation and Development
JRC Joint Research Centre of the European Commission
DCF Data Collection Framework
DCR Data Collection Regulation
IMO International Maritime Organization
FAO Food and Agriculture Organization of the United Nations
CPUE Catch Per Unit of Effort
MS Member State
EEA European Environment Agency
Fishing Technologies
DFN Drift and/or fixed netters
DRB Dredgers
DTS Demersal trawlers and/or demersal seiners
FPO Vessels using pots and/or traps
HOK Vessels using hooks
MGO Vessel using other active gears
MGP Vessels using polyvalent active gears only
PG Vessels using passive gears only for vessels < 12m
PGO Vessels using other passive gears
PGP Vessels using polyvalent passive gears only
PMP Vessels using active and passive gears
PS Purse seiners
TM Pelagic trawlers
TBB Beam trawlers

Policy Department B: Structural and Cohesion Policies
6
European Countries
BEL Belgium
BGR Bulgaria
CYP Cyprus
DEU Germany
DNK Denmark
ESP Spain
EST Estonia
EU European Union
FIN Finland
FRA France
GBR United Kingdom
GRC Greece
IRL Ireland
ITA Italy
LTU Lithuania
LVA Latvia
MLT Malta
NLD Netherlands
POL Poland
PRT Portugal
ROU Romania
SVN Slovenia
SWE Sweden

Fuel subsidies in the EU fisheries sector
7
LIST OF TABLES
Table 1
Fuel tax reductions/exemptions in EU Countries 17
Table 2
Fuel tax reductions/exemptions outside the EU 20
Table 3
Level of taxation for fuels used by fishing vessels 23
Table 4
Estimation of the forgone revenue by MS (million euros) 28
Table 5
Energy consumption over fishing days in 2011, l/fishing day 31
Table 6
Average energy consumption per value of fish landed in 2011, l/Euro 32
Table 7
Average energy consumption per volume of fish landed in 2011, l/kg 33
Table 8
Share of fuel consumed by the fishing fleet in EU MS in comparison to the total
energy consumption 36
Table 9
An analysis of the total fuel consumed by the EU fishing fleet and the sector’s
share in comparison to the agriculture energy consumption 37
LIST OF FIGURES
Figure 1
Existence of fuel tax reductions, exemptions or other types of support related to
fuel used by fishers 16
Figure 2
Comparison across fleet segments of the benefits derived from the tax
exemption in terms of competitiveness in % of total operating costs 30

Policy Department B: Structural and Cohesion Policies
8

Fuel subsidies in the EU fisheries sector
9
EXECUTIVE SUMMARY
This briefing note is intended to provide the European Parliament with an analysis on tax
allowances related to fuel used by the EU fishing fleet as provided for by the Directive
2003/96/EC. It is important to note that due to the time constraint the present briefing
note is based on information currently available, and that shortcomings in the data
prevented a more in depth analyses, as well as robust statistical assessments. More specific
details of data issues that arose during the compilation of the present note are provided
throughout the document.
Fuel subsidies for fishers within the European Union consist mainly of fuel tax exemptions
with respect to the Excise taxes directed at specific fuels. Furthermore, according to Council
Directive 2003/96/EC, which states that MS shall be exempt from taxation on “energy
products supplied for use as fuel for the purposes of navigation within Community waters
(including fishing)”, a full tax exemption is usually applied to the fisheries sector.
The level of tax exemption for any one fishing firm depends on the MS to which it belongs,
since the fuel taxes that that firm would pay in the absence of the exemptions differ across
MS. Furthermore, Council Directive 2003/96/EC is implemented differently across EU MS.
In some MS, such as Denmark, Sweden and Germany, the excise duties currently applied
are much higher than the minimum rate set by the directive. In other MS, for example
Spain and Lithuania, the rate is equal to the minimum value. However, this does not
necessarily imply, for example, that for a Danish firm the fuel tax exemption is more
relevant than for a Spanish firm because to draw conclusions in this regard it would be
necessary to consider the incidence of tax on fuel price and on total variable costs faced by
the firm, and these issues were not approached in the present note.
On the other hand, it is possible to make assumptions on the consequences that the
abolition of fuel tax exemptions would have on the revenue of governments in the EU MS.
Based on the results of the present note, in the absence of fuel tax exemptions (for
fishers), the various MS governments would have different returns, to a higher or lower
degree, depending on the total amount of fuel consumed by the fishing fleet and on the
value of the excise duties on fuels used in the fisheries sector. According to the total
amount of forgone revenue by governments in the last decade, as estimated for the
purpose of this note, the overall benefit to EU Governments (22 countries taking part in the
DCF) was estimated at €1.05 billion, or 0.022% of overall average governmental revenues.
However, this amount should be considered a maximum, as fishers would most probably
adjust their fishing behaviour and activities to reduce fuel consumption in the absence of
tax exemptions, similar to that observed during recent periods of high fuel price increases.
It is important to note that the actual importance of such a measure for each government
should be assessed taking into account another important element: how large is the
amount of fuel consumed by the fisheries sector compared to the total fuel consumed by
the country. As a matter of fact, in most EU countries the share of fuel consumed by
vessels with respect to the total energy consumption is very low (<1%).
As regards the effects on the market from the abolition of the fuel tax exemptions (to
fishers), it is reasonable to presume that it may have two different impacts: 1) it could lead
to an increase in the prices paid by final consumers and 2) reduce the profitability of fishing
firms. However, other aspects should be considered, for example, the type of product (e.g.
substitute or complementary products) and differences between products in terms of price
Policy Department B: Structural and Cohesion Policies
10
elasticity. In countries where consumers tend to prefer fresh products it is likely that the
abolition of the exemption would lead to a price increase directly affecting the consumer. At
the same time, this would totally or partially compensate fishers for the profit reduction due
to the higher energy costs. On the contrary, if the consumer does not have well defined
preferences, consumer prices would not increase and producer costs would be destined to
decrease.
Other possible effects of abolishing fuel tax exemptions could be a reduction in the total
amount of fuel consumed by fishers and increased investment in energy efficient
technologies.

Fuel subsidies in the EU fisheries sector
11
1. INTRODUCTION
This briefing note is intended to provide the European Parliament with an analysis on tax
allowances related to fuel used by the EU fishing fleet as provided by the Directive
2003/96/EC.
More specifically, this note includes:
An overview of the tax allowances for fuel used in the fish catching sector, by EU
Member State and a comparison between the EU tax exemption and tax systems in
other countries, as far as fuels used for vessels are concerned;
An outline of the current level of fuel tax that fishers would pay in EU Member States if
the fishing fuel tax exemption was not implemented;
An estimate of the amount of revenue forgone by governments of each Member State
from 2002 to 2011 as a consequence of the fuel tax reductions/exemption in place for
the fishing fleet;
An assessment and comparison across fleet segments of the benefits derived from the
tax exemption in terms of competitiveness;
An analysis, at MS level, of the total fuel consumed by the EU fishing fleet and the
sector’s share in comparison to the total energy consumption in the EU for all purposes
(fuel, heating, electricity generation, etc.).
The note relies on various data sources, of which the main are listed below. More details
are provided throughout the document.
Data Collection Framework (DCF) database, housed at the JRC and containing Member
State’s data submissions under the 2013 call for Economic data on the EU fishing fleet
[MARE/A3/AC(2013)]1;
Eurostat data2;
OECD data, including working papers3.
It is important to note that due to the time constraint, the present note (commissioned by
the European Parliament in late May 2013), is mainly based on information currently
available and that shortcomings in the data prevented a more in depth analyses, as well as
more robust statistical analyses. Details of issues that arose during the compilation of the
present note are provided throughout the document.
1 http://datacollection.jrc.ec.europa.eu/ 2 http://epp.eurostat.ec.europa.eu/portal/page/portal/eurostat/home/ 3 http://www.oecd-ilibrary.org/

Policy Department B: Structural and Cohesion Policies
12
Fuel subsidies in the EU fisheries sector
13
2. FUEL SUBSIDIES IN THE EU FISHERIES SECTOR
KEY FINDINGS
Fuel subsidies for fisheries within the EU, as well as in the non-EU countries
covered by the analysis, mainly consist of fuel tax reductions/exemptions.
Tax allowances for fuel used in the fisheries catching sector are usually provided
“through lower rates, exemptions, or rebates with respect to the two main types of
consumption taxes: Value added taxes (VAT) and Excise taxes directed at specific
fuels” (OECD 2012).
The type of tax allowances (on fuel) which apply to the fisheries catching
sector varies across countries. It can consist of a tax refund, a reduction on fuel
taxes or a total exemption. Direct budgetary payments related to fuel use
were rare in the countries covered by this note.
In the European Union, the fuel tax reductions/exemptions (to fishers) are
granted according to common rules set by the community framework for
the taxation of energy products and electricity (established through the
adoption of Council Directive 2003/96/EC of 27 October 2003).
According to Council Directive 2003/96/EC, Member States shall be exempt from
taxation on “energy products supplied for use as fuel for the purposes of
navigation within Community waters (including fishing)”.
For EU MS, fuel taxes and relative exemptions/reduction are homogeneous
within the country. Furthermore, a full tax exemption is usually applied to the
fisheries sector. For third countries, differences may be observed at sub-
national level.
It is important to clarify what is meant by fuel subsidy. Generally speaking, in the context
of fisheries the term “fuel subsidy” refers to any government intervention regarding fossil
fuels that benefits fishers by reducing their costs or increasing their revenue. According to a
more narrow definition, fuel subsidies consist of “the difference between the price per litre
of fuel paid by fishers and the national price applied to fuel purchases for other uses in a
given economy” (Sumaila and Pauly 2006).
For the purpose of the present note, the definition of fuel subsidies adopted by
the Organisation for Economic Co-operation and Development (OECD) in one of its
recent working papers (Fuel Tax Concessions in the Fisheries Sector - OECD Food,
Agriculture and Fisheries Papers No. 56) was used essentially because a large part of the
information included in this chapter, as well as in other sections of this document, derives
from the OECD study. According to the OECD, “a fuel subsidy (to fishers) is defined
broadly as a rebate, refund, expenditure4 or reduction (to fishers) from Value
Added Taxes (VAT) and other such direct fuel taxes that are normally levied by
the government on fuel users in the economy; price controls that suppress fuel
prices below normal market prices; and, programs that provide direct transfers or
payments”. However, as explicitly stated in the OECD report, the extent to which the
various fuel tax exemptions/concessions reported in the document can be equated to a
“fuel subsidy” is still debated in various forums (in particular WTO; Martini 2012).
4 An expenditure from a fuel tax to fishers may either be specified directly in the legislation or may be
represented by cases where there is an economy wide tax that is not applied to fishing vessels (Martini 2012).

Policy Department B: Structural and Cohesion Policies
14
Also, how fuel subsidies should be classified is not straightforward. There are different
criteria for classifying fishery subsidies in general and fuel subsidies in particular; the
various categories mostly overlap depending on the nature of the subsidy and the purpose
of classification (Sumaila and Pauly 2006).
According to the Food and Agricultural Organisation categorisation5, fuel subsidies may fall
into two different groups of fisheries subsidies: direct payments by the government to the
fisheries industry and services, and indirect financial transfers. On the other hand, based on
an economic theory which considers natural resources, including fishery resources, as a
natural capital, fuel subsidies (e.g. tax exceptions) can be defined as “capacity-enhancing”
or “bad” subsidies because they may stimulate overcapacity and overfishing through
artificial profit increases6 (Sumaila et al. 2010).
Regardless how they are defined and classified, it seems that fuel subsidies to fishers
usually consist of indirect money transfers resulting from some kind of special
treatment for fishers concerning fuel taxes. Nevertheless, in some cases they may
also come in the form of direct payments. For example, limited to the EU MS, fishers may
not only receive subsidies in the form of tax reduction/exemptions, but also direct income
payments under the so called de minimis aid7.
Specifically concerning the EU MS, exemptions or reductions in the tax level that fishers
should pay are granted according to common rules set by the community framework for
the taxation of energy products and electricity.
The community framework for taxing mineral oils was established in 1992 through the
adoption of two directives: Council Directive 92/81/EEC of 19 October 1992 on the
harmonisation of the structures of excise duties on mineral oils and Council Directive
92/82/EEC laying down provision in respect of the minimum rates of excise duty applicable
to certain mineral oils.
The Council Directive 2003/96/EC imposes a common framework for taxation of
energy products and electricity in the MS and includes many exemptions or reductions
in tax levels, some general and others specific to MS. For example, total or partial
exemptions or reductions in the level of taxation can be applied when taxable products are
used “in the field of pilot projects for the technological development of more environmentally-
friendly products or in relation to fuels from renewable resources” (Art. 15).
In the context of fisheries, according to Council Directive 2003/96/EC, MS shall be
exempt from taxation on “energy products supplied for use as fuel for the
purposes of navigation within Community waters (including fishing), other than
5 The Food and Agricultural Organization (FAO) defines the fisheries subsidies as “government actions or
inactions outside of normal practices that modify - by increasing or decreasing - the potential profits by the
fisheries industry in the short-, medium- or long-term”. In addition the FAO classifies them in four categories:
1) Direct payments by the government to the fisheries industry (e.g. Investment grants, grants for safety
equipment, vessel decommissioning programs, price support, direct export incentives, etc.), 2) Services and
indirect financial transfers (e.g. tax rebates, inspection and certification for exports, fuel tax exemptions,
investment tax credits, etc.), 3) Government regulatory interventions (e.g. Import quotas, direct foreign
investment restrictions, etc.), 4) Lack of government intervention (comprising inaction on behalf of the
government that allows producers to impose certain costs of production on others). 6 According to this classification, other two categories of subsidies are identified: “beneficial”, when they favour
the growth of fish stocks and “ambiguous”, when they can have positive or negative effects on the fisheries
stocks depending on how the program is designed. 7 In a study on fishing subsidies in the European Union, conducted by the International Organization Oceana in
2011, it is mentioned that, besides the de minimis aid, in 2006 “fuel subsidies, in the form of direct payments
for fuel to fishing companies, were paid in France, Greece, Poland, Spain and Sweden (Sumaila and Pauly
2006)”.

Fuel subsidies in the EU fisheries sector
15
private pleasure craft8, and electricity produced on board a craft” (Art. 14). This exemption
is also extended to international waters on the basis of international agreements partly
based on IMO FAL Convention on Facilitation of International Maritime Traffic (Salz 2009).
As already mentioned, the EU also allows direct payments, potentially linked to fuel use, to
fishers under the de minimis aid scheme which was introduced in 2008 to mitigate the
consequences of rapidly rising energy prices.
More specifically, according to the de minimis regulation for the fisheries sector (EC Reg.
875/2007) a maximum amount of EUR 30,000 can be given to a fisheries firm for each
three-year period during 2007-20139. This state support might be used to pay costs
relating to fishing vessels, among which the energy cost is one of the most relevant. As for
the primary agriculture sector, there is an overall limit per MS, which is set at 2.5% of the
total production value of the fisheries sector.
As already mentioned, this chapter is mainly based on information included in the OECD
Food, Agriculture and Fisheries Papers No. 56 which attempts to determine the extent of
fuel tax exemptions and other policy measures related to the fuel consumption in the
fisheries sector for OECD member countries. This paper was based on a questionnaire,
developed and circulated to Delegates of the OECD Committee for Fisheries in December
2009. According to the definition of “fuel subsidies” adopted by OECD for the purposes of
the exercise, the questionnaire requested information on “any government intervention
relating to fossil fuels that reduces the cost and increases the revenues of commercial
fishers, regardless of whether or not they involve direct financial transfers” (rebate, refund,
expenditure or reduction from Value Added Taxes (VAT) and other such direct fuel taxes,
price controls, direct transfers or payments, etc.).
The survey results indicated that fuel subsidies for fisheries within the EU, at least as far
as the OECD members are concerned, as well as in the non-EU surveyed countries, mainly
consists of fuel tax exemptions or reductions. These are usually provided through
lower rates, exemptions, or rebates with respect to the two main types of
consumption taxes: Value added taxes (VAT) and Excise taxes directed at specific fuels
(OECD 2012).
Furthermore, tax allowances are conceded to fishers according to the specific type of fuel
used. For example, in Sweden, the “special energy tax” differs depending on the
environmental standard of the fuel used. A more general example is the lower fuel tax for
diesel compared to gasoline.
The effort made by our research group mainly consisted of summarising the OECD work, as
far as the country review on government interventions related to fuel use in the fisheries
sector were concerned. This was supplemented by some information compiled in the
database on environmentally related taxes, fees and charges, other economic instruments
and voluntary approaches used in environmental policy and natural resources management
by the OECD and the European Environment Agency10. Additional information was gathered
through a short questionnaire which was sent to national fisheries experts by the Joint
8 According to the Energy Tax Directive, private pleasure craft is defined as "any craft used by its owner or the
natural or legal person who enjoys its use either through hire or through any other means, for other than
commercial purposes and in particular other than for the carriage of passengers or goods or for the supply of
services for consideration or for the purposes of public authorities". 9 In 2008 an additional package of emergency measures was adopted by the European Commission (EC Reg.
744/2008) aimed at speeding up the restructuring of the European fishing fleet through the European Fisheries
Fund. 10 This database is located at http://www2.oecd.org/ecoinst/queries/index.htm

Policy Department B: Structural and Cohesion Policies
16
Research Centre, asking for a description of all government interventions related to fuel
used for fisheries in each MS. However, by the time the present note was submitted only
experts from a few MS (Belgium, Finland, Lithuania, Sweden, Portugal and Italy) had
replied to the request. The content of this section essentially consists of a schematic
overview of the tax allowances for fuels used in the fisheries sector by EU MS. Additionally,
a comparison between the EU tax exemption and the tax system in other countries is
provided.
The box below contains a summary account of the presence/absence of any type of
government intervention in relation to fuel use in, and outside, the EU (Figure 1).
Figure 1: Existence of fuel tax reductions, exemptions or other types of
support related to fuel used by fishers
INSIDE THE EU
- Fuel tax reduction/exemptions: Belgium, Bulgaria, Cyprus, Denmark, Estonia, Finland,
France, Germany11, Greece, Italy, Ireland, Latvia, Lithuania, Netherlands, Romania,
Slovenia, Spain, Sweden, United Kingdom, Poland12, and Portugal13
- No fuel tax reduction/exemptions or other support: none
OUTSIDE THE EU
- Fuel tax reduction/exemptions: Australia, Canada, Japan, Mexico, New Zealand,
Norway, Turkey, and United States
- No fuel tax reduction/exemptions or other support: Iceland
- Budgetary support: Russian Federation
Source: OECD Food, Agriculture and Fisheries Papers No. 56
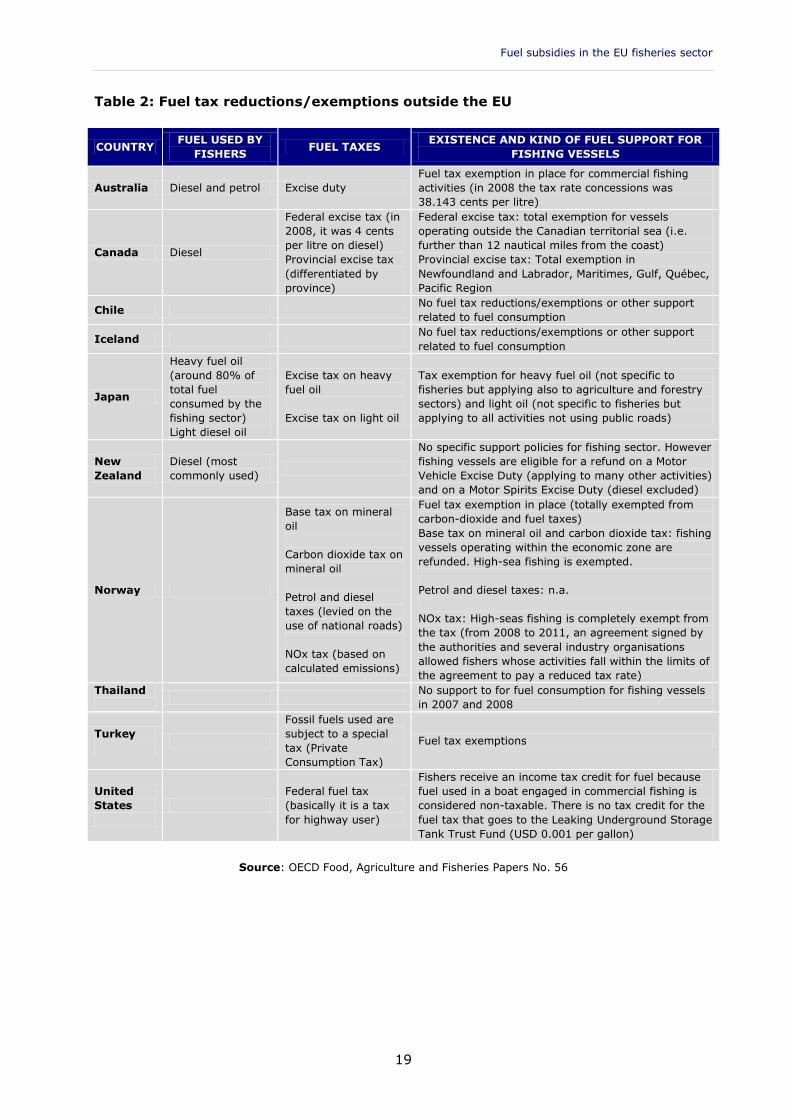
Table 1 and Table 2 provide overviews by EU MS and third countries on the type of fuel
used (where available) and the types of fuel tax exemptions for fishing vessels. Note that,
unless otherwise mentioned, all information included in the two tables refers to the results
of the analysis performed by the OECD.
According to the results of the OECD survey, the type of tax allowances applied to the
fisheries catching sector varies across countries. In some cases, it consists of a tax
refund, meaning that fishers pay the fuel tax entirely which is then totally or partially
11 According to the information provided by a national expert for fisheries (per.com.), Germany is included in the
group of countries for which fuel tax concessions apply. This is also in line with the fact that, through an
exercise different from the one to which the present report refer (i.e. Fuel Tax Concessions in the Fisheries
Sector), Germany reported a fuel-tax concession for the OECD and European Environment Agency database on
instruments used for environmental policy and natural resources management – an Exemption for Navigation
specified as “Use as fuel for the purpose of navigation, except private pleasure craft”.
However, in the OECD paper “Fuel Tax Concessions in the Fisheries Sector”, Germany was included in the
category “no fuel tax concessions or other support”. 12 In the OECD report, Poland is included in the list of countries for which no fuel tax concession or other supports
are in place. However, in the same document, a rate of fuel tax concession of 1.05 euro per litre is reported for
Poland. Furthermore, in the country reviews, also included in the OECD paper, it is stated, for Poland, that
“fuel used for commercial navigation purposes are exempt from the fuel-excise tax”. Clarifications about this
apparently inconsistent information were asked to the OECD. However, unfortunately, the request was not
answered by the time the present report was submitted. Therefore, it was decided to include Poland in the
group of countries for which fuel tax exemptions apply, although this explicitly contradicts the OECD short
“summary of country submissions”. 13 According to the information provided by a national expert for fisheries (per.com.), Portugal is included in the
group of countries for which fuel tax concessions apply. This is also consistent with what is reported in the
OECD/EEA database on environmentally related taxes, fees and charges, other economic instruments and
voluntary approaches used in environmental policy and natural resources management (i.e. an Exemption for
Navigation specified as “Gas oil and fuel oils for consumption in sea-coast and inland waterways navigation”).
However, in the OECD paper “Fuel Tax Concessions in the Fisheries Sector”, Portugal is in the category “no fuel
tax concessions or other support”.

Fuel subsidies in the EU fisheries sector
17
refunded by their governments. In others, fishers are eligible for a reduction on fuel taxes
or a total exemption.
A third category consists of budgetary payments related to fuel use. However, according to
the results of the OECD’s survey these were only applied in Russia during period under
analysis.
As reported in Table 1 and Table 2, for each EU MS, fuel taxes and fuel tax
reduction/exemptions are homogeneous within the country. Furthermore, for the
majority, a full tax exemption is applied to the fisheries sector. On the other hand, when it
comes to non-EU countries, differences in the levels of taxes and tax allowances
related to fuel used by fishers may be observed at the sub-national level.
It is important to point out that, besides the non-coastal EU countries (Austria, Czech
Republic, Hungary, Luxembourg and Slovakia), the analysis does also not cover Croatia and
Malta, for which no information was available.
Table 1: Fuel tax reductions/exemptions in EU Countries
COUNTRY FUEL USED BY FISHERS FUEL TAXES EXISTENCE AND KIND OF FUEL
SUPPORT FOR FISHING VESSELS
Belgium
Gasoline - light fuel oil
(also known as marine
gas oil)14
Excise duty: 21 euro per
1000 litres Total fuel tax exemption in place
Bulgaria15 Fuel excise tax Total tax exemption for fuel used for
international navigation
Cyprus16 Fuel excise tax
Total tax exemption for diesel used for
agriculture, fishing and bunkering
operations
Denmark Direct tax on fuel
CO2 tax on fuel
Total tax exemption in place for the two
types of fuel taxes
Estonia
Excise duty
differentiated by fuel
type
Partial fuel tax exemption in place17
Finland
Petrol
Diesel oil18
Domestic fuel oil
Excise duty
differentiated by fuel
type
Total fuel tax exemption in place
France19
Excise duty
differentiated by fuel
type
Total fuel tax exemption in place
Germany20
Excise duty
differentiated by fuel
type
Total fuel tax exemption in place
Greece Special Consumption
Tax on fuel
Total fuel tax exemption in place for
professional fisheries21
Italy22 Mostly diesel Excise duty Total fuel tax exemption in place for
14 0.1% sulphur content, 0.86 density, HS code 27101945 15 Information from the OECD/EEA database on environmentally related taxes, fees and charges, other economic
instruments and voluntary approaches used in environmental policy and natural resources management 16 Ibid., note 13 17 According to the information reported in the 2013 Excise Duty Tables for energy products, “Estonia applies a
common reduced excise rate when gas oils are used for shipping traffic, including in commercial fishing, except
in non-commercial recreational shipping” (the reduced rate for 2013 is 110,95 euro per 1000 litre). 18 As clarified by the country expert for Finland, the off shore fishing vessels usually use light fuel oil that is taxed
at a lower level than diesel. 19 Ibid., note 13. 20 Information provided to the JRC by the national fisheries expert. 21 Law 2960/2001 (article 78, paragraph 1b) “National Customs Code” (O.G.J. 265 A), as amended by Law
3366/2005 (O.G.J. 96 A) and Decision T1940/41/14.4.2003 of the Ministry of Economy and Finance. 22 Ibid., note 13.

Policy Department B: Structural and Cohesion Policies
18
COUNTRY FUEL USED BY FISHERS FUEL TAXES EXISTENCE AND KIND OF FUEL
SUPPORT FOR FISHING VESSELS
differentiated by fuel
type
fishing and the shipping industry
Ireland23 Mineral oil tax
Total tax exemption for mineral oil used
for sea navigation, including sea fishing
(except in private pleasure craft)
Latvia
Excise duty
differentiated by fuel
type
Total tax exemption in place for oil
products used by ships (national fishing
fleet, warships, transport ships, and pilot
boats)
Lithuania24
Most vessels longer than
12 m operating in Baltic
Sea and Atlantic Ocean:
diesel
Small scale fleet (0-12
m.): mostly unleaded
petrol (only few vessels
longer than 10 m use
diesel)
Excise duty
differentiated by fuel
type
Baltic Sea vessels are exempted from VAT
tax (21%) and from fuel excise
Coastal boats in 2011 paid full price for
fuel (including excise duty and VAT)
Long distance vessels: no fuel subsidies25
Netherland26
Excise duty
differentiated by fuel
type
Total tax exemption in place for mineral
oils used for propelling of ships (other
than pleasure craft). No exemptions for
petrol
Poland
Excise duty
differentiated by fuel
type
Fuel used for commercial navigation
purposes (including commercial fishing
trips) are exempt from the fuel-excise tax
under the Law on Excise Tax of 6
December 2008
Portugal27 Tax on petroleum and
energy products
Fuel tax exemption for gas oil and fuel
oils for consumption in sea-coast and
inland waterways navigation28
Romania29 Fuel excise tax Total exemption for navigation
Slovenia
Excise duty
differentiated by fuel
type
Total fuel tax exemption in place in the
form of a return of the excise duty paid30
Spain
Excise duty
differentiated by fuel
type
Total fuel tax exemption in place for
products used in sea and inland water
navigation, other than private pleasure
navigation31
Sweden
Diesel (largest share of
consumption)
Gasoline (only some small
vessels)32
Excise duty
differentiated by fuel
type
Carbon dioxide tax
(equal for all fuel types)
Total fuel tax exemption in place from
carbon-dioxide and fuel taxes
United
Kingdom
Duty on hydrocarbon
oils
Total exemption for fuels supplied for use
in ships, other than in inland waters
Source: OECD Food, Agriculture and Fisheries Papers No. 56
23 Ibid., note 13. 24 All information included in the table was provided by the country expert for Lithuania. 25 This information partially contradicts what is stated in the OECD/EEA database (see note 13 for details),
according to which all fuel used for fishing vessels is exempted from the fuel excise tax. 26 Ibid., note 13. 27 Ibid., note 13. 28 Ibid., note 13. 29 Ibid., note 13. 30 Fossil fuel tax concessions in Slovenia are regulated by the Excise Duty Act (Official Journal of the RS, No 2/07,
25/09 and 41/09). 31 Fuel-tax exemptions relevant to fishing vessels are governed by Real decreto 1517/2007 of 16 November. 32 According to a survey on fuel use in the fisheries sector (Statistics Sweden (2006), Energy consumption in the
fishery sector), in 2005 98% of fuel used by fishers was gas oil (or diesel), 1% was unleaded petrol, 1%
domestic heating oil.
Fuel subsidies in the EU fisheries sector
19
Table 2: Fuel tax reductions/exemptions outside the EU
COUNTRY FUEL USED BY
FISHERS FUEL TAXES
EXISTENCE AND KIND OF FUEL SUPPORT FOR
FISHING VESSELS
Australia Diesel and petrol Excise duty
Fuel tax exemption in place for commercial fishing
activities (in 2008 the tax rate concessions was
38.143 cents per litre)
Canada Diesel
Federal excise tax (in
2008, it was 4 cents
per litre on diesel)
Provincial excise tax
(differentiated by
province)
Federal excise tax: total exemption for vessels
operating outside the Canadian territorial sea (i.e.
further than 12 nautical miles from the coast)
Provincial excise tax: Total exemption in
Newfoundland and Labrador, Maritimes, Gulf, Québec,
Pacific Region
Chile No fuel tax reductions/exemptions or other support
related to fuel consumption
Iceland No fuel tax reductions/exemptions or other support
related to fuel consumption
Japan
Heavy fuel oil
(around 80% of
total fuel
consumed by the
fishing sector)
Light diesel oil
Excise tax on heavy
fuel oil
Excise tax on light oil
Tax exemption for heavy fuel oil (not specific to
fisheries but applying also to agriculture and forestry
sectors) and light oil (not specific to fisheries but
applying to all activities not using public roads)
New
Zealand
Diesel (most
commonly used)
No specific support policies for fishing sector. However
fishing vessels are eligible for a refund on a Motor
Vehicle Excise Duty (applying to many other activities)
and on a Motor Spirits Excise Duty (diesel excluded)
Norway
Base tax on mineral
oil
Carbon dioxide tax on
mineral oil
Petrol and diesel
taxes (levied on the
use of national roads)
NOx tax (based on
calculated emissions)
Fuel tax exemption in place (totally exempted from
carbon-dioxide and fuel taxes)
Base tax on mineral oil and carbon dioxide tax: fishing
vessels operating within the economic zone are
refunded. High-sea fishing is exempted.
Petrol and diesel taxes: n.a.
NOx tax: High-seas fishing is completely exempt from
the tax (from 2008 to 2011, an agreement signed by
the authorities and several industry organisations
allowed fishers whose activities fall within the limits of
the agreement to pay a reduced tax rate)
Thailand
No support to for fuel consumption for fishing vessels
in 2007 and 2008
Turkey
Fossil fuels used are
subject to a special
tax (Private
Consumption Tax)
Fuel tax exemptions
United
States
Federal fuel tax
(basically it is a tax
for highway user)
Fishers receive an income tax credit for fuel because
fuel used in a boat engaged in commercial fishing is
considered non-taxable. There is no tax credit for the
fuel tax that goes to the Leaking Underground Storage
Tank Trust Fund (USD 0.001 per gallon)
Source: OECD Food, Agriculture and Fisheries Papers No. 56

Policy Department B: Structural and Cohesion Policies
20

Fuel subsidies in the EU fisheries sector
21
3. FUEL TAX RATES FOR THE MOST COMMONLY USED
FUEL TYPES IN THE EU FISHERIES
KEY FINDINGS
The typical fuel used by EU fishing vessels is the light fuel oil (also called
marine diesel or marine gas oil)
Unleaded petrol is also used by EU fishing fleets to some extent
Quantitative data on the type of fuel used by the fleets is not available.
However the majority of the information collected, reveals that diesel/marine gas oil
is the most commonly used fuel in larger vessels, and that petrol is sometimes used
in the small scale fishery.
In all EU MS, fuels most commonly used in fisheries are taxed to some degree,
however the rate of taxation varies widely across countries
This section is intended to provide an estimate of what would be the level of fuel tax for
fishers in the EU MS if the exemption on fishing fuel taxation was not implemented.
In 2003, the community framework for the taxation of energy products was restructured
and extended to electricity, coal and natural gas, through the adoption of the Council
Directive 2003/96/EC of 27 October 2003.
The Council Directive 2003/96/EC imposes a common framework for taxation of
energy products and electricity in the MS and includes many exemptions or reductions
in tax levels, some general and others specific to MS. For example, total or partial
exemptions or reductions in the level of taxation can be applied when taxable products are
used “in the field of pilot projects for the technological development of more
environmentally-friendly products or in relation to fuels from renewable resources” (Art.
15).
In the context of fisheries, according to Council Directive 2003/96/EC, MS shall be exempt
from taxation of “energy products supplied for use as fuel for the purposes of navigation
within Community waters (including fishing), other than private pleasure craft33, and
electricity produced on board a craft” (Art. 14). This exemption is also extended to
international waters on the basis of international agreements partly based on the IMO
(International Maritime Organization) FAL Convention on Facilitation of International
Maritime Traffic (Salz 2009).
Furthermore, according to article 15 of the directive, MS may apply total or partial
exemptions or reductions in the level of taxation also to energy products “supplied for use
as fuel for navigation on inland waterways”, always with the exception of fuel used in
private pleasure craft.
As the fuel tax rate depends on fuel type, to estimate what fishers would actually pay in the
absence of fuel tax reductions/exemptions, data on fuel consumptions broken down by type
(petrol, diesel, biofuel, etc.) would be necessary.
33 According to the Energy Tax Directive, private pleasure craft is defined as "any craft used by its owner or the
natural or legal person who enjoys its use either through hire or through any other means, for other than
commercial purposes and in particular other than for the carriage of passengers or goods or for the supply of
services for consideration or for the purposes of public authorities".

Policy Department B: Structural and Cohesion Policies
22
However, quantitative data on the type of fuel used by the EU fleets is not currently
available in the DCF database. In fact, currently the DCF implementation does not explicitly
request fuel type. Fuel consumption broken down by type is provided by MS only “if
possible”34.
In addition to fuel types included in the OECD report mentioned above, additional
information was gathered through a short questionnaire which was sent by the JRC to
national fisheries experts, asking, inter alia, for fuel consumption breakdown by types of
fuel. The information collected is included in the country reviews on government support
related to fuel use reported in the previous section of the note (Table 1 and Table 2).
According to the available sources, diesel appears to be the most commonly used
fuel. This is also confirmed by the literature. In fact, in a recent paper on the energy
efficiency and the economic performance of the EU fishing fleets light fuel oil (gas oil or
marine diesel) was used for all analyses (Cheilari et al. 2013).
Another recent paper about the energy consumption in the Norwegian fisheries, found that
the typical fuel used for fishing vessels is marine gas oil (diesel) (Schau et al. 2009).
In addition, available information showed that, although it certainly represents a much
smaller share of the total fuel consumption compared to marine diesel, unleaded petrol is
used by fishing fleets to some extent. Sometimes this type of fuel is used on small
boats with a different type of outboard engine.
Table 3 provides an outline by MS of the current tax rates for the two types of fuel which
appeared to be the most commonly used by fishers: gas oil and unleaded petrol. This is
intended to represent what would be the level of fuel tax for fishers in the EU MS if
the exemption on fishing fuel taxation did not exist.
All information included in the table below is based on data reported in the most recent
(2013) “Excise Duty Tables for Energy products and Electricity” (accessed on the DG
TAXUD Web site35). These tables, produced by the European Commission (DG Taxation and
Customs Union) in collaboration with the MS, provide up-to-date information on MS
main excise duty rates. Gas oil tax rates for agriculture and, whenever available, for
fishing fleets are also provided to allow for a comparison between these two primary
sectors in terms of tax allowances.
Above minimum values laid down at the EU level, MS are free to set their own national fuel
tax rates. The minimum rate of taxation for fuel and energy products is defined in the
Council Directive 2003/96/EC. All EU MS are obliged to adopt excise tax rates equal or
higher than minimum values, equal to:
395 EUR per 1000 litres of unleaded petrol;
330 EUR per 1000 litres of propellant gas oil (diesel).
In addition, as already mentioned, MS are also allowed to use special rates for different
energy products used for specific purposes.
The implementation of the Council Directive 2003/96/EC depends on the national priorities
and the overall national policy. As shown in Table 3, in all EU MS marine fuels are taxed to
34 http://datacollection.jrc.ec.europa.eu/c/document_library/get_file?uuid=296dffd3-9c81-4759-b691-
9b1654ea66b9&groupId=10213 35 http://ec.europa.eu/taxation_customs/index_en.htm#; accessed on June 28, 2013.

Fuel subsidies in the EU fisheries sector
23
some degree, and the rate of taxation can vary widely across countries. In some MS, the
excise duties are more than 50% higher than the minimum rate (e.g. Denmark, Sweden,
Germany, UK, Italy and etc.), while in others the minimum rates apply (e.g. Spain, Latvia
and Lithuania). In certain cases, countries joining the EU are allowed to have a transition
period before the full implementation of the Council Directive 2003/96/EC. This is the
reason why, for example, the Romanian excise duty for petrol is almost 9% below the
minimum excise duty.
Table 3: Level of taxation for fuels used by fishing vessels, euro per 1000 litres
MS VAT
Unleaded petrol (CN 2710 1131; CN 2710 1141; CN 2710
1145; CN 2710 1149)
Gas oil - Propellant (CN 2710 1941 to 2710 1949)
Usual tax rate Usual tax rate Tax rate for Agriculture (vehicles)
Tax rate for fishing fleets
BEL 21% 613.57-628.57 427.69-442.69 0.00 0.00
BGR 20% 363.02 329.79 n.a. t.e.
DNK 25% * 592.59 443.57 * 58.08 0.00
DEU 19% 654.50 - 669.80 470.40 - 485.70 n.a. 0.00
EST 20% 422.77 392.92 110.95 110.00
GRC 23% 670.00 330.00 0-264.00 0.00
ESP * 21% 424.69 - 455.92 331.00 78.71 0.00
FRA 20% * 589.20 - 639.60 * 416.90 - 428.40 72.00 0.00
IRL 23% * 587.71 * 479.02 102.28 0.00
ITA 21% 728.40 617.40 n.a. 0.00
CYP * 18% 429.00 400.00 0-124.73 0.00
LVA 21% * 415.11 * 336.11 * 0.00 0.00
LTU 21% 434.43 330.17 * 0.00 t.e.
MLT 18% 469.39 382.40 n.a. -
NLD 21% 746.55 440.28 - 451.44 n.a. t.e.
POL 23% 406.30-443.77 354.61 - 0.00
PRT 23% 585.27 367.53 77.51 t.e.
ROU 24% * 359.59 * 330.40 21.00 0.00
SVN 20% * 575.94 * 448.90 153.18 0.00
FIN* 24% 650.40 469.50 163.40 0.00
SWE 25% 460.28 - 668.00 572.99 - 621.38 372.35 0.00
GBR 20% 674.15 674.15 129.59 t.e.
Source: 2013 Excise Duty Tables for Energy products and Electricity
Table notes:
t.e.: tax exemption in place. More details are provided in Table1.
DNK: Includes CO2 tax.
GRC: Gas oil industrial use – a refund of duty (EUR 125 per 1000 litres) is given to industries that use gas oil in
their production activities, after a fiscal control.
ESP: VAT rate valid as of 1 September 2012
FRA: A rate is determined for each region.
IRL: Includes a CO2 charge of 45.87 EUR per 1000 litres. No CO2 charge applies to biofuel or to the biofuel
proportion of a blend.
CYP: VAT rate valid as from 14th January 2013
LVA: Unleaded petrol: reduced rates for petrol when ethanol (70%-85% of volume) has been added (LVL 86.70 –
EUR 124,53). Gas oil propellant: reduced rate for gas oil when biodiesel (obtained from rape seed oil) has been
added at minimum 30% biodiesel of volume=LVL 164 (EUR 235.56) and biodiesel that is completely obtained from
rape seed oil = LVL 0.
LVA and LTU reduced tax rate for agriculture is limited in terms of volume per production unit.
ROU: The energy products used as motor fuel are exempted from the payment of excise duties when they are
produced in totality from biomass.
FIN: Includes taxes of energy and CO2 components and strategic stockpile fee
SVN: Includes CO2-tax in the amount of 32.50 € per 1000 litres.
SWE: Includes CO2-tax.

Policy Department B: Structural and Cohesion Policies
24

Fuel subsidies in the EU fisheries sector
25
4. FORGONE REVENUE BY GOVERNMENTS AS A
CONSEQUENCE OF THE FUEL TAX REDUCTIONS AND
EXEMPTIONS FOR FISHERS
KEY FINDINGS
If fuel tax exemptions were eliminated several side effects are to be
expected, such as a change of behaviour and decrease in fuel consumption. A
robust estimation of the amount of forgone revenue by governments of EU MS
should take this into account. However, due to lack of data and time constraints, the
present analysis does not address this aspect.
The estimated forgone revenue relative to the period 2002-2011 is highly
variable depending on country, fuel consumption and tax rates. Italy, France
and the Netherlands show values considerably higher with respect to other MS. On
the other hand, compared to average Governmental Revenues, estimated fuel tax
exemptions represent around 0.05%, 0.03% and 0.04%, for these MS respectively.
The overall annual foregone revenues were estimated at around €1.05
billion, or 0.022% of overall average governmental revenues.
This section provides an estimate of the amount of revenue forgone by governments of
each MS over the past decade related to fuel tax exemption in the fishing fleet.
For the purpose of the present note, the annual revenue forgone by governments of EU MS
was estimated by multiplying the volume of fuel consumed by the country’s fishing fleet by
an estimated rate of fuel tax exemption, representing the difference between the price per
litre of fuel paid by fishers and the national price applied to fuel purchases for other uses.
For most MS (Belgium, Denmark, Estonia, Finland, France, Greece, Italy, Netherlands,
Poland, Slovenia, Spain, Sweden and United Kingdom), this rate corresponds to the rate of
fuel tax concessions (FTC) which was estimated36 in 2008 by the OECD37. For other MS
(Germany, Belgium, Sweden and Italy) the FTC rate has been updated according to the
information provided by national experts. Finally, for countries for which no other
information was available (Latvia and Portugal plus non-OECD members - Bulgaria, Cyprus,
Ireland Lithuania, Malta, Romania), the 2013 excise duty rate (see Table 3) for gas oil
propellant or the difference between the usual gas oil tax rate and the one for gas oil used
in agriculture (for MS where a partial fuel tax exemption is in place) have been used as a
proxy for the country’s rate of fuel tax exemption.
In brief, the analysis was based on four types of data:
Fuel tax concession rates estimated by the OECD;
Excise duty rate for diesel;
Data received from national experts;
36 As for the estimation approach, it is stated in the OECD report on “Fuel Tax Concessions in the Fisheries
Sector” (although only for some countries) that the rate of FTC was calculated as the weighted average of
exemptions for different types of fuel. 37 Martini, R. (2012), Fuel Tax Concessions in the Fisheries Sector, OECD Food, Agriculture and Fisheries Papers
No. 56, OECD Publishing.
Policy Department B: Structural and Cohesion Policies
26
Fuel consumed by the EU fishing fleets in 2002-2011, extracted from data
submissions by MS during the calls for economic data on the EU fishing sector under
the Data Collection Regulation (2002-2007) and Data Collection Framework (2008-
2011).
It should be noted that only a rough estimate of the amount of revenue forgone by
governments is provided due to of several data/analysis limitations and that these results
should be considered with care. The most relevant issues include:
For most MS it is not possible to cover the reference period entirely because the
DCR/DCF database includes MS data starting from their accession year to the EU
and some countries did not provide full data sets during the last data calls;
The OECD FTC used in the analysis was estimated for 2008 on the basis of excise
duties on fuels in place at that time. However the excise duties change over time.
More recent information, provided by national experts, was available for only for a
few MS.
As already mentioned, excise duties vary according to fuel type. However, only total
fuel consumption (not broken down by type) is available in the DCR/DCF databases;
The analysis does not take into account possible side effects of the absence of the
fuel tax (e.g. decrease in fuel consumption, firms’ profitability, etc.), which would
certainly affect the amount of forgone revenue by the governments in each MS. For
example, it is well known that variations in fuel prices may cause changes in the
fishers’ behaviour. Usually, when fuel prices paid by fishers increase (for example
because of the elimination of fuel tax exemptions), fishers tend to use less fuel and,
whenever possible, to invest in more energy efficient fishing techniques in order to
save money (Cheilari et al., 2013).
Due to the data limitations already listed, the estimation of the foregone revenues is based
on the following assumptions:
The tax rate for diesel was constant from 2002 to 2011;
As shown in Table 4, fuel consumption data for the entire period (2002-2011) is
available only for a few MS (i.e. Belgium, Denmark, France, Germany, Italy, the
Netherlands, Sweden and the UK). For all other MS, an annual average forgone
revenue was estimated based on consumption data available (Table 4).
A different approach to estimating the total value of fuel subsidies received by the fish
catching sector in the EU MS was adopted in a study on fisheries subsidies in the EU,
recently conducted by Oceana, an international organisation focused on ocean
conservation38. Oceana provided estimations of the total amount of indirect fuel subsidies
per MS provided during 2009 via the fuel tax exemption for the fishing sector39.
Calculation of average annual fuel consumption and foregone revenues, based on rates by
country shows that Italy and France have the highest fuel taxation rates and foregone
revenues, followed by the Netherlands, Greece and UK. However, compared to the overall
average governmental revenues of these countries over the decade analysed, the
estimated foregone revenues were 0.05% for Italy and 0.03% for France.
38 The European Union and Fishing Subsidies, Oceana, September 2011. 39 Oceana estimates that in 2009 the amount of indirect fuel subsidies received by fishers in all EU MS was equal
to 1.4 billion Euros. Information on how these figures was estimated can be found in the EU subsidies table,
accessible at www.oceana.org/eusubsidies
Fuel subsidies in the EU fisheries sector
27
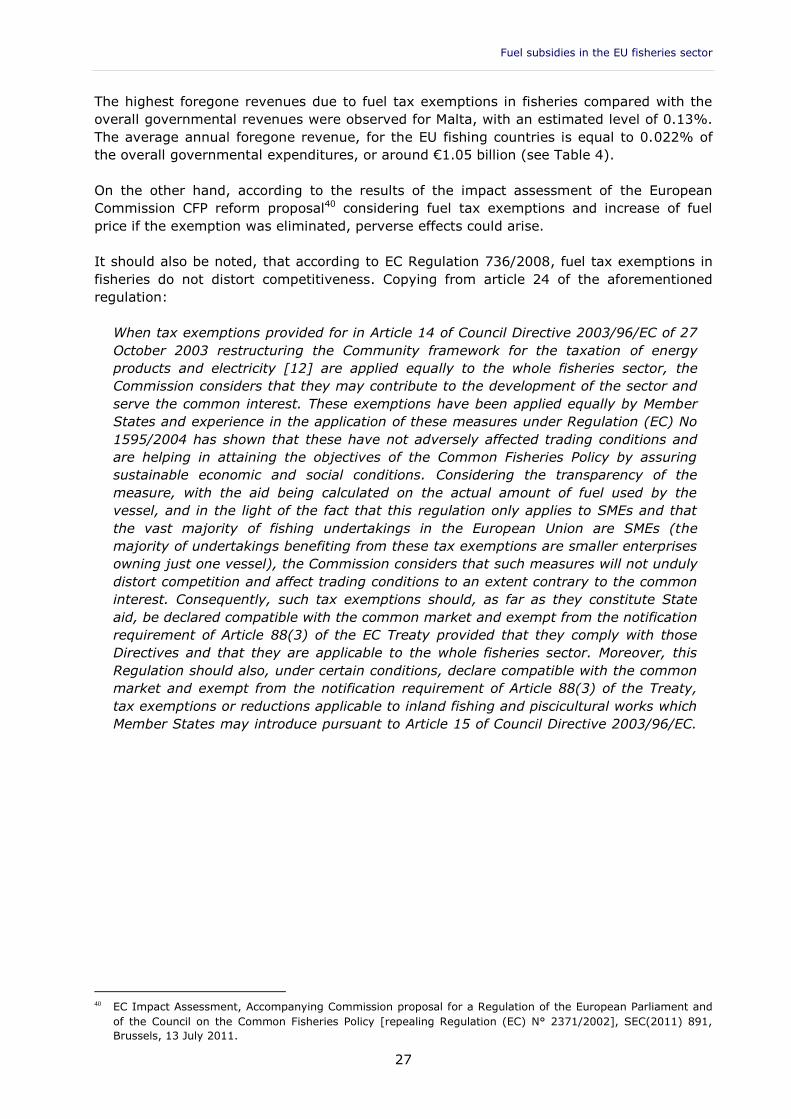
The highest foregone revenues due to fuel tax exemptions in fisheries compared with the
overall governmental revenues were observed for Malta, with an estimated level of 0.13%.
The average annual foregone revenue, for the EU fishing countries is equal to 0.022% of
the overall governmental expenditures, or around €1.05 billion (see Table 4).
On the other hand, according to the results of the impact assessment of the European
Commission CFP reform proposal40 considering fuel tax exemptions and increase of fuel
price if the exemption was eliminated, perverse effects could arise.
It should also be noted, that according to EC Regulation 736/2008, fuel tax exemptions in
fisheries do not distort competitiveness. Copying from article 24 of the aforementioned
regulation:
When tax exemptions provided for in Article 14 of Council Directive 2003/96/EC of 27
October 2003 restructuring the Community framework for the taxation of energy
products and electricity [12] are applied equally to the whole fisheries sector, the
Commission considers that they may contribute to the development of the sector and
serve the common interest. These exemptions have been applied equally by Member
States and experience in the application of these measures under Regulation (EC) No
1595/2004 has shown that these have not adversely affected trading conditions and
are helping in attaining the objectives of the Common Fisheries Policy by assuring
sustainable economic and social conditions. Considering the transparency of the
measure, with the aid being calculated on the actual amount of fuel used by the
vessel, and in the light of the fact that this regulation only applies to SMEs and that
the vast majority of fishing undertakings in the European Union are SMEs (the
majority of undertakings benefiting from these tax exemptions are smaller enterprises
owning just one vessel), the Commission considers that such measures will not unduly
distort competition and affect trading conditions to an extent contrary to the common
interest. Consequently, such tax exemptions should, as far as they constitute State
aid, be declared compatible with the common market and exempt from the notification
requirement of Article 88(3) of the EC Treaty provided that they comply with those
Directives and that they are applicable to the whole fisheries sector. Moreover, this
Regulation should also, under certain conditions, declare compatible with the common
market and exempt from the notification requirement of Article 88(3) of the Treaty,
tax exemptions or reductions applicable to inland fishing and piscicultural works which
Member States may introduce pursuant to Article 15 of Council Directive 2003/96/EC.
40 EC Impact Assessment, Accompanying Commission proposal for a Regulation of the European Parliament and
of the Council on the Common Fisheries Policy [repealing Regulation (EC) N° 2371/2002], SEC(2011) 891,
Brussels, 13 July 2011.
Policy Department B: Structural and Cohesion Policies
28
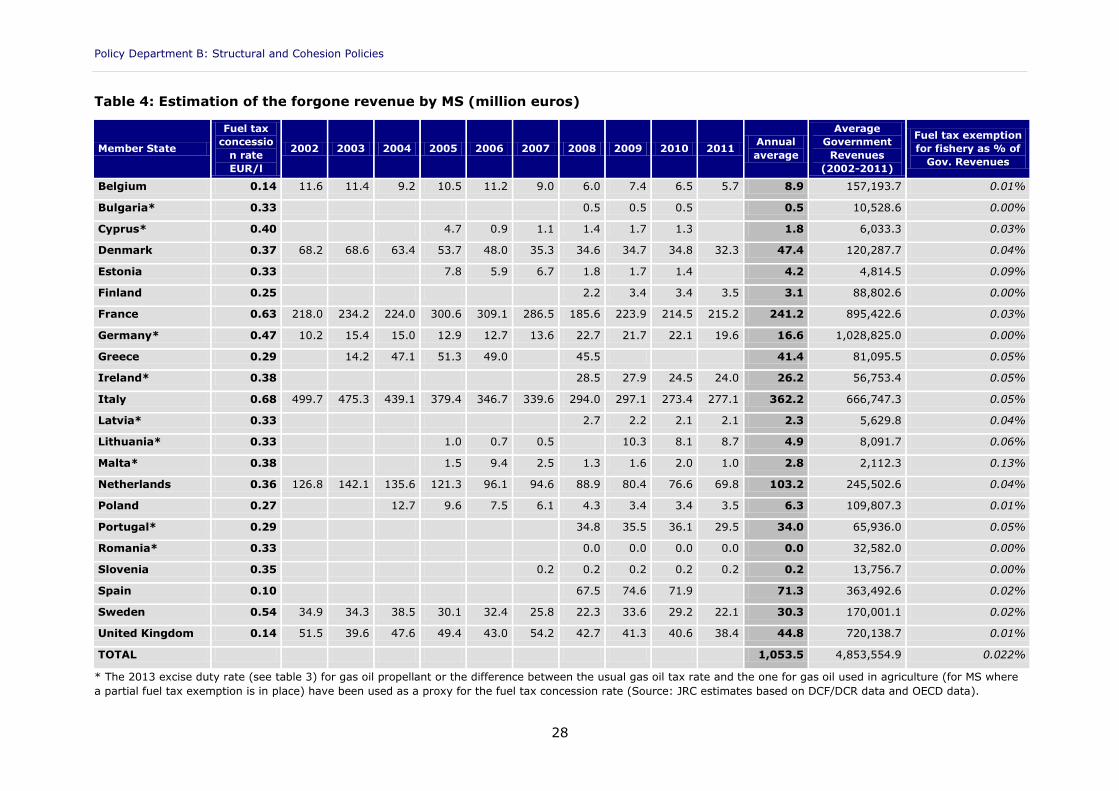
Table 4: Estimation of the forgone revenue by MS (million euros)
Member State
Fuel tax
concessio
n rate
EUR/l
2002 2003 2004 2005 2006 2007 2008 2009 2010 2011 Annual
average
Average
Government
Revenues
(2002-2011)
Fuel tax exemption
for fishery as % of
Gov. Revenues
Belgium 0.14 11.6 11.4 9.2 10.5 11.2 9.0 6.0 7.4 6.5 5.7 8.9 157,193.7 0.01%
Bulgaria* 0.33 0.5 0.5 0.5 0.5 10,528.6 0.00%
Cyprus* 0.40 4.7 0.9 1.1 1.4 1.7 1.3 1.8 6,033.3 0.03%
Denmark 0.37 68.2 68.6 63.4 53.7 48.0 35.3 34.6 34.7 34.8 32.3 47.4 120,287.7 0.04%
Estonia 0.33 7.8 5.9 6.7 1.8 1.7 1.4 4.2 4,814.5 0.09%
Finland 0.25 2.2 3.4 3.4 3.5 3.1 88,802.6 0.00%
France 0.63 218.0 234.2 224.0 300.6 309.1 286.5 185.6 223.9 214.5 215.2 241.2 895,422.6 0.03%
Germany* 0.47 10.2 15.4 15.0 12.9 12.7 13.6 22.7 21.7 22.1 19.6 16.6 1,028,825.0 0.00%
Greece 0.29 14.2 47.1 51.3 49.0 45.5 41.4 81,095.5 0.05%
Ireland* 0.38 28.5 27.9 24.5 24.0 26.2 56,753.4 0.05%
Italy 0.68 499.7 475.3 439.1 379.4 346.7 339.6 294.0 297.1 273.4 277.1 362.2 666,747.3 0.05%
Latvia* 0.33 2.7 2.2 2.1 2.1 2.3 5,629.8 0.04%
Lithuania* 0.33 1.0 0.7 0.5 10.3 8.1 8.7 4.9 8,091.7 0.06%
Malta* 0.38 1.5 9.4 2.5 1.3 1.6 2.0 1.0 2.8 2,112.3 0.13%
Netherlands 0.36 126.8 142.1 135.6 121.3 96.1 94.6 88.9 80.4 76.6 69.8 103.2 245,502.6 0.04%
Poland 0.27 12.7 9.6 7.5 6.1 4.3 3.4 3.4 3.5 6.3 109,807.3 0.01%
Portugal* 0.29 34.8 35.5 36.1 29.5 34.0 65,936.0 0.05%
Romania* 0.33 0.0 0.0 0.0 0.0 0.0 32,582.0 0.00%
Slovenia 0.35 0.2 0.2 0.2 0.2 0.2 0.2 13,756.7 0.00%
Spain 0.10 67.5 74.6 71.9 71.3 363,492.6 0.02%
Sweden 0.54 34.9 34.3 38.5 30.1 32.4 25.8 22.3 33.6 29.2 22.1 30.3 170,001.1 0.02%
United Kingdom 0.14 51.5 39.6 47.6 49.4 43.0 54.2 42.7 41.3 40.6 38.4 44.8 720,138.7 0.01%
TOTAL 1,053.5 4,853,554.9 0.022%
* The 2013 excise duty rate (see table 3) for gas oil propellant or the difference between the usual gas oil tax rate and the one for gas oil used in agriculture (for MS where
a partial fuel tax exemption is in place) have been used as a proxy for the fuel tax concession rate (Source: JRC estimates based on DCF/DCR data and OECD data).
Fuel subsidies in the EU fisheries sector
29
5. EVALUATION OF FLEET DEPENDENCY ON THE FUEL
CONSUMPTION
KEY FINDINGS
Energy consumption is mostly driven by vessels size and fishing technique.
For vessels, using active fishing techniques (e.g. trawlers) fuel costs may exceed
40% of the total operating costs.
Vessel types consuming the largest amount of fuel per fishing day are large
pelagic trawlers, beam trawlers, demersal trawlers and seiners. Small scale
fleets operating in coastal areas consume lower amounts of fuel per fishing day and
are economically less dependent on fuel price.
Fuel consumption per weight and value of landings also depends on the fish
targeted and CPUE (catch per unit of effort). Pelagic trawlers and purse seiners
consume the highest amount of fuel per fishing day on average, but their CPUE is
much higher than in the other fleets, resulting in quite low fuel consumption per
production unit and a higher efficiency of fuel use.
This section provides an assessment of the benefits across fleet segments derived from fuel
tax exemptions in terms of competitiveness.
The analysis is based on several indicators, such as the share of fuel costs to total
operating costs, fuel consumption per fishing day, etc., at MS level and by main fishing
technique (e.g. demersal trawlers, pelagic trawlers, etc.).
The entire section relies on data relating to the year 2011, extracted from MS data
submissions under the 2013 call for Economic data on the EU fishing fleet
[MARE/A3/AC(2013)], housed at the JRC in the Data Collection Framework (DCF) database.
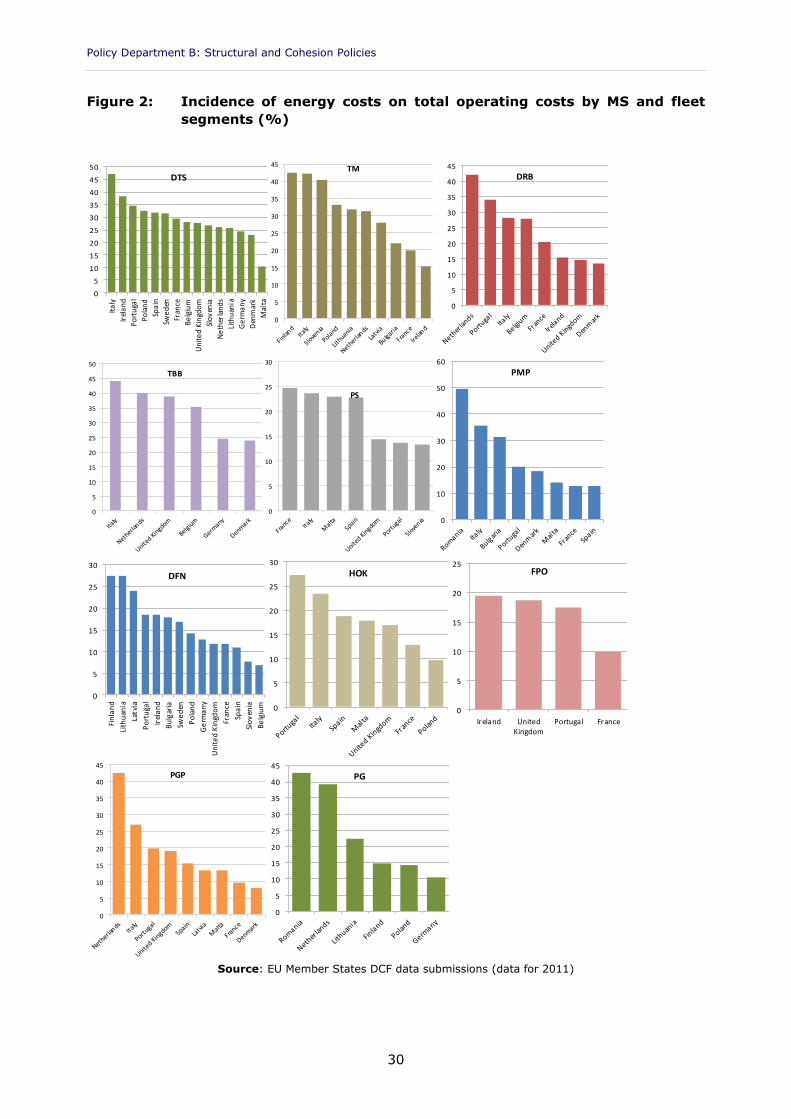
Figure 2 shows a comparison across MS and fishing techniques in terms of the ratio
between energy costs and total operating costs. Results show that vessels using active
fishing techniques, e.g. trawlers, consume more fuel and in certain cases their fuel costs
exceed 40% of the total operating costs (e.g. Italian demersal, pelagic and beam trawlers,
Dutch dredgers and Finnish and Slovenian pelagic trawlers), while vessels using passive
gears are less economically dependent on the fuel use (see Figure 2).
The Romanian and Dutch coastal fleets (vessels <12 m) and vessels using active and
passive gears shows relatively high energy costs compared to total operating costs.
However, it is not clear if these results are driven by specific operations or due to the
quality of the data provided.
Policy Department B: Structural and Cohesion Policies
30
Figure 2: Incidence of energy costs on total operating costs by MS and fleet
segments (%)
Source: EU Member States DCF data submissions (data for 2011)
0
5
10
15
20
25
30
35
40
45
50
Ita
ly
Irel
an
d
Po
rtu
gal
Po
lan
d
Spa
in
Swe
den
Fran
ce
Be
lgiu
m
Un
ite
d K
ingd
om
Slo
ven
ia
Ne
ther
lan
ds
Lith
uan
ia
Ge
rma
ny
Den
mar
k
Mal
ta
DTS
0
5
10
15
20
25
30
35
40
45TM
0
5
10
15
20
25
30
35
40
45
DRB
0
5
10
15
20
25
30
35
40
45
50
TBB
0
5
10
15
20
25
30
PS
0
10
20
30
40
50
60
PMP
0
5
10
15
20
25
30
Fin
lan
d
Lith
uan
ia
Latv
ia
Po
rtu
gal
Irel
an
d
Bu
lgar
ia
Swe
den
Po
lan
d
Ge
rma
ny
Un
ite
d K
ingd
om
Fran
ce
Spa
in
Slo
ven
ia
Be
lgiu
m
DFN
0
5
10
15
20
25
30
HOK
0
5
10
15
20
25
Ireland UnitedKingdom
Portugal France
FPO
0
5
10
15
20
25
30
35
40
45
PGP
0
5
10
15
20
25
30
35
40
45
PG
Fuel subsidies in the EU fisheries sector
31
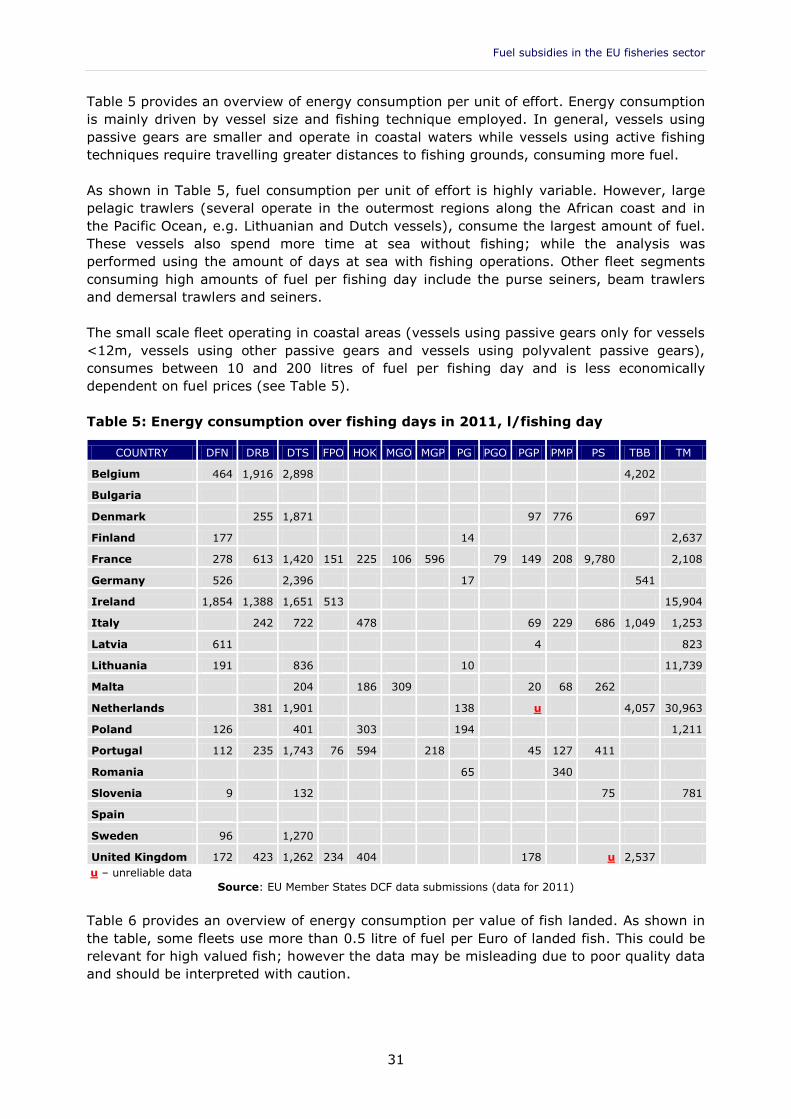
Table 5 provides an overview of energy consumption per unit of effort. Energy consumption
is mainly driven by vessel size and fishing technique employed. In general, vessels using
passive gears are smaller and operate in coastal waters while vessels using active fishing
techniques require travelling greater distances to fishing grounds, consuming more fuel.
As shown in Table 5, fuel consumption per unit of effort is highly variable. However, large
pelagic trawlers (several operate in the outermost regions along the African coast and in
the Pacific Ocean, e.g. Lithuanian and Dutch vessels), consume the largest amount of fuel.
These vessels also spend more time at sea without fishing; while the analysis was
performed using the amount of days at sea with fishing operations. Other fleet segments
consuming high amounts of fuel per fishing day include the purse seiners, beam trawlers
and demersal trawlers and seiners.
The small scale fleet operating in coastal areas (vessels using passive gears only for vessels
<12m, vessels using other passive gears and vessels using polyvalent passive gears),
consumes between 10 and 200 litres of fuel per fishing day and is less economically
dependent on fuel prices (see Table 5).
Table 5: Energy consumption over fishing days in 2011, l/fishing day
COUNTRY DFN DRB DTS FPO HOK MGO MGP PG PGO PGP PMP PS TBB TM
Belgium 464 1,916 2,898 4,202
Bulgaria
Denmark 255 1,871 97 776 697
Finland 177 14 2,637
France 278 613 1,420 151 225 106 596 79 149 208 9,780 2,108
Germany 526 2,396 17 541
Ireland 1,854 1,388 1,651 513 15,904
Italy 242 722 478 69 229 686 1,049 1,253
Latvia 611 4 823
Lithuania 191 836 10 11,739
Malta 204 186 309 20 68 262
Netherlands 381 1,901 138 u 4,057 30,963
Poland 126 401 303 194 1,211
Portugal 112 235 1,743 76 594 218 45 127 411
Romania 65 340
Slovenia 9 132 75 781
Spain
Sweden 96 1,270
United Kingdom 172 423 1,262 234 404 178 u 2,537
u – unreliable data
Source: EU Member States DCF data submissions (data for 2011)
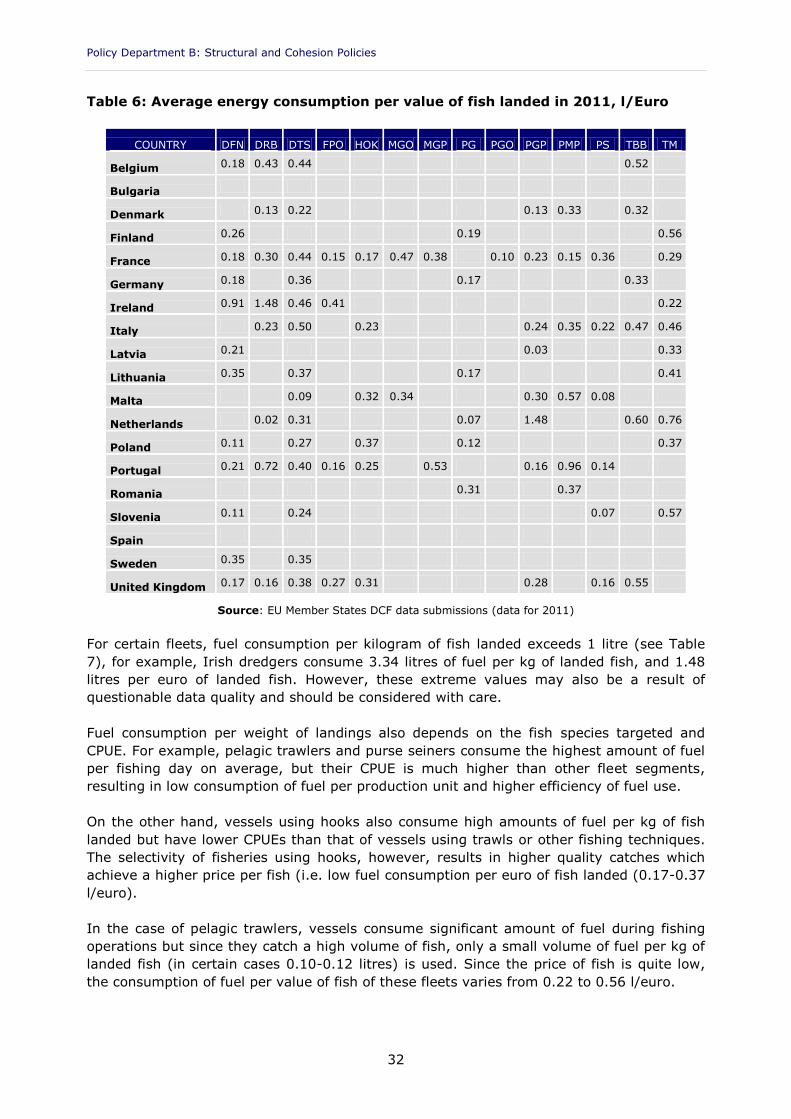
Table 6 provides an overview of energy consumption per value of fish landed. As shown in
the table, some fleets use more than 0.5 litre of fuel per Euro of landed fish. This could be
relevant for high valued fish; however the data may be misleading due to poor quality data
and should be interpreted with caution.
Policy Department B: Structural and Cohesion Policies
32
Table 6: Average energy consumption per value of fish landed in 2011, l/Euro
COUNTRY DFN DRB DTS FPO HOK MGO MGP PG PGO PGP PMP PS TBB TM
Belgium 0.18 0.43 0.44 0.52
Bulgaria
Denmark 0.13 0.22 0.13 0.33 0.32
Finland 0.26 0.19 0.56
France 0.18 0.30 0.44 0.15 0.17 0.47 0.38 0.10 0.23 0.15 0.36 0.29
Germany 0.18 0.36 0.17 0.33
Ireland 0.91 1.48 0.46 0.41 0.22
Italy 0.23 0.50 0.23 0.24 0.35 0.22 0.47 0.46
Latvia 0.21 0.03 0.33
Lithuania 0.35 0.37 0.17 0.41
Malta 0.09 0.32 0.34 0.30 0.57 0.08
Netherlands 0.02 0.31 0.07 1.48 0.60 0.76
Poland 0.11 0.27 0.37 0.12 0.37
Portugal 0.21 0.72 0.40 0.16 0.25 0.53 0.16 0.96 0.14
Romania 0.31 0.37
Slovenia 0.11 0.24 0.07 0.57
Spain
Sweden 0.35 0.35
United Kingdom 0.17 0.16 0.38 0.27 0.31 0.28 0.16 0.55
Source: EU Member States DCF data submissions (data for 2011)
For certain fleets, fuel consumption per kilogram of fish landed exceeds 1 litre (see Table
7), for example, Irish dredgers consume 3.34 litres of fuel per kg of landed fish, and 1.48
litres per euro of landed fish. However, these extreme values may also be a result of
questionable data quality and should be considered with care.
Fuel consumption per weight of landings also depends on the fish species targeted and
CPUE. For example, pelagic trawlers and purse seiners consume the highest amount of fuel
per fishing day on average, but their CPUE is much higher than other fleet segments,
resulting in low consumption of fuel per production unit and higher efficiency of fuel use.
On the other hand, vessels using hooks also consume high amounts of fuel per kg of fish
landed but have lower CPUEs than that of vessels using trawls or other fishing techniques.
The selectivity of fisheries using hooks, however, results in higher quality catches which
achieve a higher price per fish (i.e. low fuel consumption per euro of fish landed (0.17-0.37
l/euro).
In the case of pelagic trawlers, vessels consume significant amount of fuel during fishing
operations but since they catch a high volume of fish, only a small volume of fuel per kg of
landed fish (in certain cases 0.10-0.12 litres) is used. Since the price of fish is quite low,
the consumption of fuel per value of fish of these fleets varies from 0.22 to 0.56 l/euro.

Fuel subsidies in the EU fisheries sector
33
Table 7: Average energy consumption per volume of fish landed in 2011, l/kg
COUNTRY DFN DRB DTS FPO HOK MGO MGP PG PGO PGP PMP PS TBB TM
Belgium 1.43 1.07 1.47 2.10
Bulgaria
Denmark 0.03 0.11 0.33 0.52 0.36
Finland 0.60 0.20 0.11
France 0.77 0.46 1.23 0.34 0.77 2.84 0.54 0.09 1.20 0.24 0.47 0.39
Germany 0.75 0.55 0.19 0.59
Ireland 1.48 3.34 0.84 0.56 0.12
Italy 0.66 3.59 1.72 1.92 2.92 0.48 2.21 0.56
Latvia 0.32 0.01 0.10
Lithuania 0.42 0.27 0.13 0.23
Malta 0.70 1.82 1.60 1.21 2.78 0.29
Netherlands 0.05 0.90 0.49 3.45 1.69 0.30
Poland 0.13 0.21 1.92 0.11 0.10
Portugal 0.77 1.53 1.13 0.70 0.75 0.24 0.72 2.88 0.10
Romania 0.58 0.29
Slovenia 0.95 1.19 0.17 0.74
Spain
Sweden 0.89 0.21
United Kingdom 0.46 0.19 0.85 0.62 0.77 0.83 0.16 1.47
Source: EU Member States DCF data submissions (data for 2011)

Policy Department B: Structural and Cohesion Policies
34
Fuel subsidies in the EU fisheries sector
35
6. COMPARISON OF FUEL CONSUMPTION IN FISHERY
WITH THE OTHER SECTORS
KEY FINDINGS
Energy consumption in the fishery sector is quite low compared to other
sectors and total energy consumption in most countries is less than 1% of total
MS energy use. The maximum average consumption per year is observed in
Malta, Portugal and Ireland, reaching 1.97%, 1.12% and 1.01%. The lowest
energy consumption, when compared with the overall sectors, is observed in
Romania (less than 0.01%), Slovenia and Germany – around 0.02%.
The fuel consumption for fisheries in comparison to the agriculture sector varies
between MS. In some countries, with a developed agriculture sector and
comparatively small fishing sector, fuel consumption for fisheries is less
than 1% (Poland and Romania), however for others it may exceed 50%
(e.g. UK and Portugal).
This section contains an analysis of the total fuel consumed by the EU fishing fleet and the
sector’s share in comparison to the total oil consumption in the EU MS for all energy
purposes (fuel, heating, electricity generation, etc.). The analysis is performed at national
level and covers both the periods under the DCR (2002-2008) and the DCF (2008-2011)
regulations.
For comparison between fuel consumption in fisheries and other sectors, two data sets
were consulted: the DCR/DCF data sets, provided by MS for fishing fleets during the data
calls, and the EUROSTAT data base. In the Eurostat database, energy consumption is
expressed in tonnes of oil equivalent while fuel consumption collected under the DCF is
expressed in litres. To estimate the share of energy consumed by the EU fishing fleet in
comparison to the energy consumption in the EU for all energy purposes, the following
conversion was used: 1 tonne of oil equivalent = 1,160.61 litre. Additionally, not all MS
provided data on the volume of fuel consumed and in some cases, data sets are
incomplete, e.g. Lithuanian fuel consumption data 2009-2011 covers long-distance water
fleets fishing in the Atlantic and Pacific Oceans, while the corresponding data is not
available for the period 2005-2007.
As shown in Table 8, energy consumption in the fishery sector is quite low when compared
to other sectors and total MS consumption. In most countries it is less than 1% of total
energy use. The maximum average consumption per year was observed in Malta, Denmark
and Spain, reaching 1.55%, 0.73% and 0.68%. The lowest energy consumption for
fisheries when compared to the total energy consumption was observed in Romania (lower
than 0.001%), Slovenia, Bulgaria and Germany – around 0.01–0.02%.
In addition to comparing the fuel consumption of the fishing fleet to the total fuel
consumption by MS, a comparison with food production primary sector was done for the
purpose of this note.

Policy Department B: Structural and Cohesion Policies
36
Table 8: Share of fuel consumed by the fishing fleet in EU MS in comparison to
the total energy consumption
FUEL CONSUMED BY FISHING FLEET/TOTAL ENERGY CONSUMPTION (%)
COUNTRY 2002 2003 2004 2005 2006 2007 2008 2009 2010 2011
Belgium 0.20 0.18 0.15 0.18 0.19 0.16 0.10 0.13 0.11 0.09
Bulgaria 0.01 0.01 0.02
Cyprus 0.55 0.10 0.12 0.15 0.19 0.14
Denmark 1.08 1.06 0.97 0.81 0.72 0.53 0.52 0.55 0.53 0.52
Estonia 0.71 0.53 0.56 0.15 0.16 0.13
Finland 0.03 0.05 0.04 0.05
France 0.19 0.20 0.19 0.25 0.26 0.25 0.16 0.20 0.18 0.20
Germany 0.01 0.01 0.01 0.01 0.01 0.01 0.02 0.02 0.02 0.02
Greece 0.20 0.69 0.73 0.68 0.64
Ireland 0.50 0.54 0.47 0.51
Italy 0.51 0.46 0.42 0.36 0.33 0.33 0.29 0.31 0.28 0.29
Latvia 0.17 0.14 0.13 0.14
Lithuania 0.05 0.04 0.03 0.59 0.44 0.48
Malta 0.84 5.58 1.47 0.62 0.83 1.01 0.50
Netherlands 0.59 0.65 0.61 0.56 0.45 0.45 0.42 0.38 0.34 0.33
Poland 0.07 0.05 0.04 0.03 0.02 0.02 0.02 0.02
Portugal 0.56 0.58 0.59 0.51
Romania 0.00 0.00 0.00 0.00
Slovenia 0.01 0.01 0.01 0.01 0.01
Spain 0.62 0.73 0.70
Sweden 0.16 0.16 0.18 0.14 0.16 0.12 0.11 0.17 0.14 0.11
United Kingdom 0.21 0.16 0.19 0.20 0.17 0.22 0.17 0.18 0.17 0.17
Source: estimation by the JRC based on EU Member States DCF/DCR data submissions and Eurostat data
The average consumption of fuel in the agriculture and forestry sectors (fisheries excluded)
in all 22 analysed countries, compared with the overall consumption of energy was 2.3% in
2002-2011, with the minimum average consumption observed in Germany (0.02%) and
the maximum average in the Netherlands (6.5%).
According to Table 9, MS with the highest share of fisheries fuel consumption compared to
agriculture included Portugal (27.8-31.3%), United Kingdom (25.1-38.0%) and Ireland
(20.5-23.8%). The Maltese fishing fleet consumed almost 4 times more fuel than the
agriculture sector; however this may be explained by the reduced land available for
agriculture and a comparatively large fishing area around the island.
The lowest fuel consumption for fisheries compared to agriculture was observed for
Slovenia, Poland Bulgaria and Romania, where fuel used in the fishing industry was less
than 1% of fuel used for agricultural purposes.

Fuel subsidies in the EU fisheries sector
37
Table 9: An analysis of the total fuel consumed by the EU fishing fleet and the
sector’s share in comparison to the agriculture energy consumption
FUEL CONSUMED BY FISHING FLEET/AGRICULTURE ENERGY CONSUMPTION (%)
COUNTRY 2002 2003 2004 2005 2006 2007 2008 2009 2010 2011
Belgium 11.68 8.43 8.70 7.68 7.94 6.03 4.40 5.60 4.77 4.24
Bulgaria 0.64 0.64 0.74
Cyprus 26.39 4.87 5.86 7.37 9.72 7.12
Denmark 22.41 22.87 21.56 18.44 15.70 12.16 11.47 11.54 11.41 11.22
Estonia 19.64 15.63 18.78 4.94 4.66 3.92
Finland 0.89 1.38 1.67 1.87
France 7.96 8.64 8.07 10.83 11.35 11.11 6.59 7.99 7.18 7.33
Germany 1.97 2.78 2.70 2.48 2.35 2.55 4.14 3.98 5.24 4.63
Greece 3.38 12.68 13.37 12.45 12.39
Ireland 21.46 23.77 20.51 21.89
Italy 21.48 20.11 18.82 16.00 14.75 14.95 13.31 13.29 12.78 13.01
Latvia 5.93 4.39 3.88 3.97
Lithuania 2.39 1.67 1.11 26.47 19.39 21.04
Malta 368.87
Netherlands 8.40 9.47 9.00 8.35 7.25 7.09 6.78 5.82 5.41 5.16
Poland 0.94 0.69 0.63 0.56 0.38 0.30 0.28 0.30
Portugal 29.01 30.23 31.28 27.83
Romania 0.02 0.02 0.00 0.01
Slovenia 0.82 0.49 0.62 0.50 0.59
Spain 21.68 27.37 27.80
Sweden 7.31 7.05 8.10 6.43 7.03 5.74 5.25 7.86 7.22 8.01
United Kingdom 27.47 26.66 33.38 31.82 29.87 38.03 27.98 28.59 25.83 25.08
Source: estimation by the JRC based on EU Member States DCF/DCR data submissions and Eurostat data

Policy Department B: Structural and Cohesion Policies
38
Fuel subsidies in the EU fisheries sector
39
7. CONCLUSIONS
The analysis showed that fuel subsidies for fishers within the European Union mainly
consist of fuel tax exemptions with respect to the excise taxes directed at specific fuels.
Furthermore, according to Council Directive 2003/96/EC, which states that MS shall be
exempt from taxation on “energy products supplied for use as fuel for the purposes of
navigation within Community waters (including fishing)”, a full tax exemption is usually
applied to the fisheries sector.
It has to be noted however that the total value of the exemption for any one firm
depends on the country to which it belongs, since the fuel taxes that that firm would pay
in the absence of the exemptions differ according to the MS. In fact, Council Directive
2003/96/EC is implemented differently across EU MS. In some MS, for example
Denmark, Sweden and Germany, the excise duties currently applied are much higher
than the minimum rate set by the directive. In others, for example Spain and Lithuania,
the rate is equal to the minimum value. However, this does not necessarily mean that
for a Danish firm, for example, the fuel tax exemption is more relevant than for a
Spanish firm because in order to draw conclusions in this regard it necessary to consider
the incidence of tax on fuel price, and on total variable costs faced by the firm; these
issues were not analysed in the present note.
On the other hand, it is possible to make assumptions on the consequences that the
abolition of the fuel tax exemptions would have on the revenue of the governments in
the EU MS. Based on the results of the present note, it can be affirmed that if fuel tax
exemption was eliminated (for fishers), the various MS would have different returns to a
higher or lower degree depending on the total amount of fuel consumed by the fishing
fleet and on the excise duties on fuels used in the fisheries sector. According to the total
amount of forgone revenue by governments in the last decade, as estimated for the
purpose of this note, the overall benefit to EU Governments (22 countries taking part in
the DCF) could reach €1.05 billion, or 0.022% of overall average governmental
revenues. However this amount should be considered a maximum, as most probably
fishers would adjust their behaviour, reducing fuel consumption as was observed during
recent fuel price increases.
It is important to note that the actual importance of such a measure for each
government should be assessed taking into account another important element: how
large is the amount of fuel consumed by the fisheries sector compared to the total fuel
consumed by the country. As a matter of fact, in most EU countries the share of fuel
consumed by vessels with respect to the total energy consumption is very low (<1%).
As regards the effects on the market of the abolition of the fuel tax exemptions (to
fishers), it is reasonable to assume that it may have two different effects: 1) it could
lead to an increase in the prices paid by final consumers and 2) it may also reduce the
profitability of the fishing activities. However, other aspects should be considered, for
example the differences between products in terms of price elasticity and type of product
(e.g. substitute or complementary products). In countries where consumers tend to
prefer fresh products it is likely that the removal of the exemption would lead to a price
increase directly affecting the consumer. At the same time, this would totally or partially
compensate fishers for the profit reduction due to the higher energy costs. On the
contrary, if the consumer does not have well defined preferences, consumer prices
would not increase and producer costs would be destined to decrease.
Policy Department B: Structural and Cohesion Policies
40
Other possible effects of eliminating fuel tax exemptions could be the reduction of the
total amount of fuel consumed by fishers and increased investment in energy efficient
technologies. According to results contained in the 2012 Annual Economic Report (AER)
on the EU fishing fleet, as fuel prices increased in 2008, the total fuel consumption of the
EU fleet fell significantly. Furthermore, in 2010 and 2011 a decrease in the amount of
fuel consumed by the EU fleet was observed, largely due to the steady increase in fuel
prices.
It is important to note that, due to the time constraint, the present note (commissioned
by the European Parliament in late May 2013) is mainly based on currently available
information and that data limitations prevented a more in depth analyses, as well as
robust estimations. Details on issues which arose compiling the present note are
provided throughout the document.
Since the above mentioned weaknesses result from absence of data and information
availability, it might also be advisable, considering that data on fuel type should become
obligatory in any future Data collection scheme.

Fuel subsidies in the EU fisheries sector
41
REFERENCES
Cheilari A., Guillen J., Damalas D., Barbas T. (2013), Effects of the fuel price crisis on
the energy efficiency and the economic performance of the European Union fishing
fleets, Marine Policy 4018-24.
Martini, R. (2012), Fuel Tax Concessions in the Fisheries Sector, OECD Food, Agriculture
and Fisheries Papers No. 56, OECD Publishing.
Salz P. (2009), Towards elimination of subsidies in fisheries, Board of Baltic Sea 2020
Scientific, Technical and Economic Committee for Fisheries (STECF) (2012). The 2012
annual economic report on the EU fishing fleet (STECF-2-10). Anderson J., Carvalho N.,
Contini F., Virtanen J., editors. Luxembourg: Publications Office of the European Union.
EUR 25452 EN, JRC 73332, 380 pp.
Schau E. M., Ellingsen H., Endal A., Aanondsen S.A (2009), Energy consumption in the
Norwegian fisheries, Journal of Cleaner Production.
Sumaila, U.R., Pauly D. (2006), Catching more bait: a bottom-up re-estimation of
global fisheries subsidies, Fisheries Centre, University of British Columbia, 115 pp.
Sumaila U.R., Khan A., Dyck A., Watson R., Munro G., Tydemers P., Pauly D. (2010), A
Bottom-Up Re-Estimation of Global Fisheries Subsidies, Research Report, Fisheries
Centre, University of British Columbia, Canada.
Council Directive 2003/96/EC of 27 October 2003 on the Community framework for the
taxation of energy products and electricity.


