102
DIRECTORS’ REPORT For the year ended 30 June 2015 (including the Operating Financial Review and the Remuneration Report)
DIRECTORS’ REPORT For the year ended 30 June 2015 (including the Operating Financial Review and the Remuneration Report)
TABLE OF CONTENTS 1. PRINCIPAL ACTIVITIES
2. REVIEW OF OPERATIONS
3. SIGNIFICANT CHANGES IN THE STATE OF AFFAIRS
4. EVENTS SUBSEQUENT TO BALANCE DATE
5. DIVDIDENDS
6. DIRECTORS
7. INFORMATION ON DIRECTORS AND COMPANY SECRETARIES
8. DIRECTORS MEETINGS
9. DIRECTORS’ INTERESTS IN SHARES, OPTIONS AND RIGHTS
10. ENVIRONMENTAL REGULATION AND PERFORMANCE
11. INDEMNITIES AND INSURANCE FOR DIRECTORS AND OFFICERS
12. AUDITOR INDEPENDENCE
13. NON-AUDIT SERVICES
14. PROCEEDINGS ON BEHALF OF THE COMPANY
15. ROUNDING OF AMOUNTS
16. REMUNERATION
Page | 2 Origin Energy Limited ABN 30 000 051 696
20 August 2015 Directors’ Report for the year ended 30 June 2015 In accordance with the Corporations Act 2001, the Directors of Origin Energy Limited (Company) report on the Company and the consolidated entity Origin Energy Group (Origin), being the Company and its controlled entities for the year ended 30 June 2015. The Operating and Financial Review and Remuneration Report form part of this Directors’ Report. 1. Principal activities During the year, the principal activity of Origin was the operation of energy businesses including: • exploration and production of oil and gas; • electricity generation; and • wholesale and retail sale of electricity and gas. There were no significant changes in the nature of these activities during the year. 2. Review of operations A review of the operations and results of operations of Origin during the year, and the business strategies and prospects for future financial years, is set out in the Operating and Financial Review, which is attached. 3. Significant changes in the state of affairs The following significant changes in the state of affairs of the Company occurred during the year: Australia Pacific LNG Australia Pacific LNG continues to make good progress on the delivery of the CSG to LNG project and was 97% complete on the Upstream and 92% on the Downstream parts of the project as at 30 June 2015. As of 30 June 2015, $25 billion1 had been spent. Estimated costs to complete are not expected to be materially different from budget2. During the year, gas was delivered to Curtis Island and the start up of the first four of seven gas turbine power generators were achieved and the Downstream Project switched over from construction power to plant power. Both LNG tanks reached mechanical completion and have been powered up, ready for LNG. The refrigerant storage facility was completed and the Project commenced the process of loading refrigerant into the storage facilities during July. Funding Origin completed a number of funding initiatives during the period to extend its debt maturity profile and improve its liquidity position. In September 2014, Origin issued €1 billion ($1.4 billion) of hybrid capital securities swapped into Australian dollars. The hybrid has been treated as debt for accounting purposes and has received 50% equity credit from both Standard & Poor’s and Moody’s. Proceeds from the hybrid issuance were used to finance Origin’s $686 million acquisition of a 40% interest in two offshore exploration permits, WA-315-P and WA-398-P, the Poseidon permits in the offshore Browse Basin. The balance of the proceeds was used to repay debt. In December 2014, Origin amended $6.6 billion of syndicated loan facilities to reduce the interest rate margin, extend the maturities and increase the limit of the facilities by $750 million to $7.4 billion. The interest cost of the bank loan facilities was reduced by 0.30% per annum and flexibility was added with
1 Includes an unfavourable foreign exchange translation impact of A$375 million relative to project cost estimates announced in February 2013, which were based on 31 December 2012 exchange rates. 2 As announced in February 2013, based on December 2012 exchange rates.
Page | 3 Origin Energy Limited ABN 30 000 051 696
increased US Dollar drawdown capacity. The terms of the bank loan facilities were extended by 16 months to December 2018 and December 2019 respectively. In March 2015, Origin executed $500 million of guarantee facilities with maturities between March 2018 and March 2020. Developments On 12 August 2014, Origin acquired a 40% interest in two offshore exploration permits (WA 315-P and WA-398-P) in the Browse Basin in Western Australia. During the year, the drilling of the Yolla-5 and Yolla-6 production wells in the Bass Basin occurred, and subsequent to year end production commenced. The condensate and compressor modules were lifted onto the Yolla Platform and together with Yolla-5 and Yolla-6 will allow production to the Lang Lang processing facility to be extended. The Halladale-2 development well was completed during the June Quarter and suspended for future production. The Speculant campaign drilled three wells (one exploration well and two appraisal wells including the Speculant-2 side track well), two of which were cased, completed and suspended for future production. These high deliverability Halladale/Speculant wells will enable increased utilisation of the Onshore Otway facilities. In Perth, the Senecio-3 appraisal well successfully identified gas in the primary Senecio target (Dongara and Wagina sandstones) and also encountered new gas pools in the secondary Waitsia target of the deeper Kingia and High Cliff sandstones. The Irwin 1 exploration well was drilled, within the EP 320 exploration permit. The well encountered gas within the Dongara/Wagina tight gas reservoir. The events described above and those disclosed in the Financial Statements represent the significant changes in the state of affairs of Origin for the year ended 30 June 2015. 4. Events subsequent to balance date Other than the item described below, no matters or circumstances have arisen since 30 June 2015, which have significantly affected, or may significantly affect: • the Company’s operations in future financial years; • results of those operations in future financial years; or • the Company’s state of affairs in future financial years.
Sale of Entire Interest in Contact Energy Limited
On 10 August 2015 Origin completed the sale of its 53.09 per cent shareholding in Contact Energy. The transaction was underwritten at a fixed price of NZ$4.65 per share providing NZ$1.8 billion (A$1.6 billion) in net proceeds. Origin's investment in Contact Energy is recorded at its recoverable amount at 30 June 2015 therefore there will be no significant profit or loss realised on divestment in the year ending 30 June 2016. The proceeds have been utilised to repay A$1.4 billion of debt and will be used to redeem preference shares issued by Origin’s 100% owned subsidiary Origin Energy Contact Finance No. 2 Limited (NZ$0.2 billion/A$0.2 billion).
Since the end of the financial year, the directors have determined to pay a final dividend of 25 cents per share, unfranked, payable 28 September 2015. The financial effect of this dividend has not been brought to account in the financial statements for the year ended 30 June 2015 and will be recognised in subsequent financial statements. 5. Dividends (a) Dividends paid during the year by the Company were as follows:
$ million 25 cents per ordinary share, unfranked, for the year ended 30 June 2014, paid 26 September 2014. 276
25 cents per ordinary share, unfranked, for the half year ended 31 December 2014, paid 31 March 2015. 277
Page | 4 Origin Energy Limited ABN 30 000 051 696
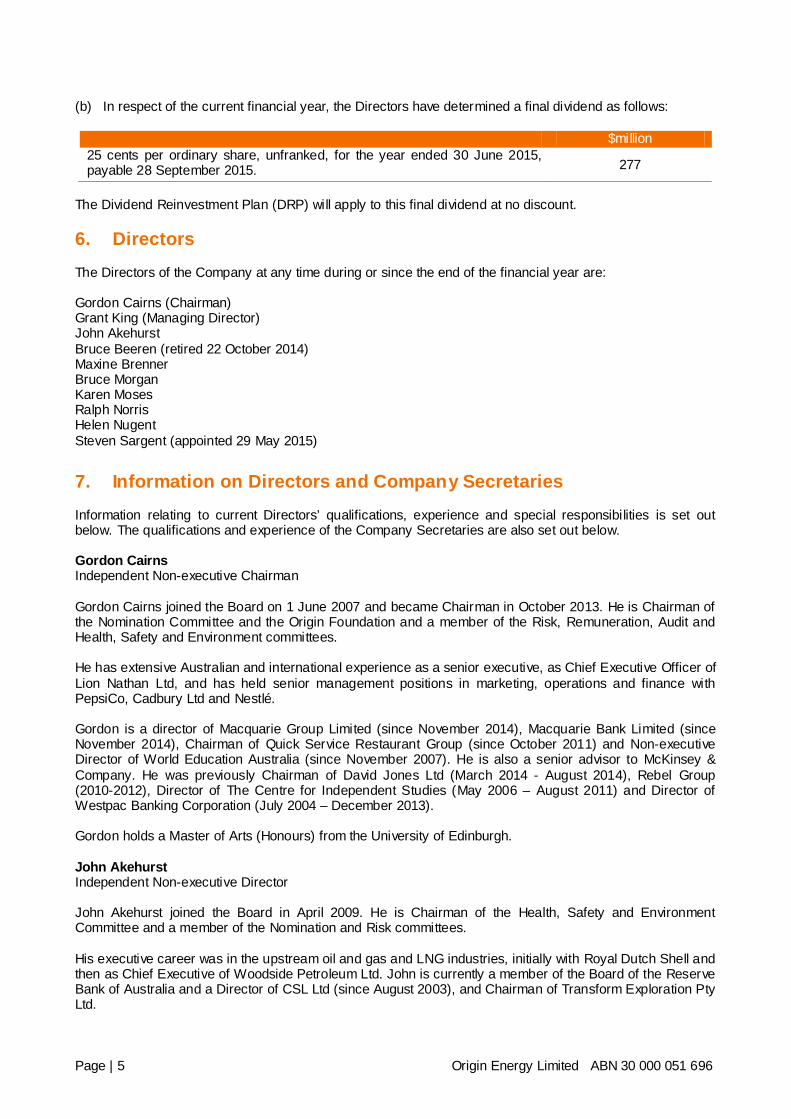
(b) In respect of the current financial year, the Directors have determined a final dividend as follows:
$million 25 cents per ordinary share, unfranked, for the year ended 30 June 2015, payable 28 September 2015. 277
The Dividend Reinvestment Plan (DRP) will apply to this final dividend at no discount. 6. Directors The Directors of the Company at any time during or since the end of the financial year are: Gordon Cairns (Chairman) Grant King (Managing Director) John Akehurst Bruce Beeren (retired 22 October 2014) Maxine Brenner Bruce Morgan Karen Moses Ralph Norris Helen Nugent Steven Sargent (appointed 29 May 2015) 7. Information on Directors and Company Secretaries Information relating to current Directors’ qualifications, experience and special responsibilities is set out below. The qualifications and experience of the Company Secretaries are also set out below. Gordon Cairns Independent Non-executive Chairman Gordon Cairns joined the Board on 1 June 2007 and became Chairman in October 2013. He is Chairman of the Nomination Committee and the Origin Foundation and a member of the Risk, Remuneration, Audit and Health, Safety and Environment committees. He has extensive Australian and international experience as a senior executive, as Chief Executive Officer of Lion Nathan Ltd, and has held senior management positions in marketing, operations and finance with PepsiCo, Cadbury Ltd and Nestlé. Gordon is a director of Macquarie Group Limited (since November 2014), Macquarie Bank Limited (since November 2014), Chairman of Quick Service Restaurant Group (since October 2011) and Non-executive Director of World Education Australia (since November 2007). He is also a senior advisor to McKinsey & Company. He was previously Chairman of David Jones Ltd (March 2014 - August 2014), Rebel Group (2010-2012), Director of The Centre for Independent Studies (May 2006 – August 2011) and Director of Westpac Banking Corporation (July 2004 – December 2013). Gordon holds a Master of Arts (Honours) from the University of Edinburgh. John Akehurst Independent Non-executive Director John Akehurst joined the Board in April 2009. He is Chairman of the Health, Safety and Environment Committee and a member of the Nomination and Risk committees. His executive career was in the upstream oil and gas and LNG industries, initially with Royal Dutch Shell and then as Chief Executive of Woodside Petroleum Ltd. John is currently a member of the Board of the Reserve Bank of Australia and a Director of CSL Ltd (since August 2003), and Chairman of Transform Exploration Pty Ltd.
Page | 5 Origin Energy Limited ABN 30 000 051 696

He is Chairman of the National Centre for Asbestos Related Diseases and of the Fortitude Foundation, a former Chairman of Alinta Ltd and Coogee Resources Ltd and a former Director of Oil Search Ltd, Securency Ltd, Murdoch Film Studios Pty Ltd and the University of Western Australia Business School. John holds a Masters in Engineering Science from Oxford University and is a Fellow of the Institution of Mechanical Engineers. Maxine Brenner Independent Non-Executive Director Maxine Brenner joined the Board in November 2013. She is a member of the Audit and Nomination committees, and from 1 July 2015, became the Chairman of the Risk Committee. Maxine is a Non-executive Director of Orica Ltd (since April 2013) and Qantas Airways Ltd (since August 2013). She is also an Independent Director and Chairman of the Audit and Risk Committee for Growthpoint Properties Australia and a member of the University of NSW Council. Maxine was formerly a Managing Director of Investment Banking at Investec Bank (Australia) Ltd. Prior to Investec, Maxine was a Lecturer in Law at the University of NSW and a lawyer at Freehills, specialising in corporate law. Her former directorships include Treasury Corporation of NSW, Neverfail Springwater Ltd, Federal Airports Corporation, where she was Deputy Chair, and Bulmer Australia Ltd. In addition, Maxine has served as a member of the Takeovers Panel. Maxine holds a Bachelor of Arts and a Bachelor of Laws from the University of NSW. Grant King Managing Director Grant King was appointed Managing Director of the Company at the time of its demerger from Boral Ltd in February 2000, and was Managing Director of Boral Energy from 1994. Grant is a member of the Company’s Health, Safety and Environment Committee. Prior to joining Boral, he was General Manager, AGL Gas Companies. Grant is a councillor of the Australian Petroleum Production and Exploration Association, a Director of the Business Council of Australia and Chairman of the Business Council of Australia Infrastructure & Sustainability Growth Committee. He is a former Chairman of Contact Energy Limited (2004 – 2015), a former Director of Envestra Ltd (1997-2007) and former Chairman of the Energy Supply Association of Australia Ltd. Grant is a Fellow of the AICD. Grant has a Civil Engineering degree from the University of NSW and a Master of Management from the University of Wollongong. Bruce Morgan Independent Non-executive Director Bruce Morgan joined the Board in November 2012 and is Chairman of the Audit Committee and a member of the Health, Safety and Environment, Nomination and Risk committees. Bruce served as Chairman of the Board of PricewaterhouseCoopers (PwC) Australia between 2005 and 2012. In 2009, he was elected as a member of the PwC International Board, serving a four year term. He was previously Managing Partner of PwC’s Sydney and Brisbane offices. An audit partner of the firm for over 25 years, he was focused on the financial services and energy and mining sectors leading some of the firm’s most significant clients in Australia and internationally. He is Chairman of Sydney Water Corporation (since October 2013), a Director of Caltex Australia Ltd (since June 2013), Chairman of Redkite (since April 2015), a Director of the University of NSW Foundation and the European Australian Business Council. Bruce has a Bachelor of Commerce (Accounting and Finance) from the University of NSW. He is a Fellow of Chartered Accountants Australia and New Zealand and of the AICD.
Page | 6 Origin Energy Limited ABN 30 000 051 696
Karen Moses Executive Director, Finance and Strategy Karen Moses joined the Board in March 2009. She is responsible for the finance, tax and accounting functions, interactions with capital markets and for information technology. In addition, she oversees corporate strategy and transactional activity, and overall risk including health, safety and environment, commodity risk, compliance and insurance. Karen also sits on the Board of Australia Pacific LNG and oversees Origin’s international development opportunities. Karen has over 30 years’ experience in the energy industry spanning oil, gas, electricity and coal commodities and upstream production, supply and downstream marketing operations. This experience has been gained both within Australia and overseas. Karen has worked with Origin (formerly Boral Energy) since 1994 and prior to that Exxon and BP. Karen is a former Director of Contact Energy Limited (2004 – 2015), Energia Andina S.A., Australian Energy Market Operator Ltd (2009-2012), Energy and Water Ombudsman (Victoria) Ltd, Australian Energy Market Operator (Transitional) Ltd and VENCorp (2007-2009). Karen holds a Bachelor of Economics and a Diploma of Education from the University of Sydney. Ralph Norris KNZM Independent Non-executive Director Ralph Norris joined the Board in April 2012. He is a member of the Audit and Remuneration committees. Ralph retired as Managing Director and Chief Executive Officer of the Commonwealth Bank of Australia in November 2011 following a 40 year career in business and the banking sector in Australia and New Zealand. During his career, he had a number of senior executive roles including Chief Executive Officer of ASB Bank and Air New Zealand Ltd. He is a Chairman of Fletcher Building Ltd (since October 2014) and RANQX Holdings Ltd (since June 2015) and Director of Fonterra Ltd (since May 2012), New Zealand Treasury, FSF Funds Management Ltd, the Advisory Board of Tax Management Ltd and Families Inc and a former Director of the Business Council of Australia, the International Monetary Conference, Chairman of Sovereign Insurance Ltd, the New Zealand Bankers’ Association, New Zealand Business Roundtable and the Australian Bankers’ Association. He is a member of the New Zealand Olympic Advisory Committee, the Juvenile Diabetes Research Foundation Advisory Board and the Auckland University Council. Ralph was awarded an honorary doctorate by the University of NSW in 2013. He was made a Knight Companion of the New Zealand Order of Merit in 2009 and a Distinguished Companion of the New Zealand Order of Merit for services to business in 2006. He is a Fellow of the New Zealand Institute of Management and a Fellow of the New Zealand Computer Society. Dr Helen Nugent AO Independent Non-executive Director Dr Helen Nugent joined the Board in March 2003. She is Chairman of the Remuneration Committee and a member of the Company’s Audit, Risk and Nomination committees. Previously, she was Chairman of the Audit Committee. She has significant experience in the financial services and resources sectors. She is Chairman of Veda Group Limited (since September 2013) and Funds SA (the $26 billion investment fund of the South Australian Government). She is a former Non-executive Director of Macquarie Group Limited (August 2007 – July 2014), Macquarie Bank Limited (June 1999 – July 2014), Chairman of Swiss Re Life and Health (Australia) (2001-2010) and Swiss Re (Australia) (2001 – 2005); and Director of Strategy at Westpac Banking Corporation. While a partner at McKinsey & Company, she worked extensively in the financial services and resources, including for one of Australia’s leading resources company. She gives back to society in education and the arts. Dr Nugent holds a Bachelor of Arts (Hons), a Doctorate of Philosophy in Indian History and an Honorary Doctorate in Business from the University of Queensland. She also holds a Master of Business Administration (with Distinction) from the Harvard Business School.
Page | 7 Origin Energy Limited ABN 30 000 051 696
Steven Sargent Independent Non-executive Director Steven Sargent joined the Board in May 2015. He is a member of the Health, Safety & Environment and Remuneration committees. Steve is a Non-executive Director of Veda Group Limited (since March 2015), Bond University Limited (since January 2010) and the Great Barrier Reef Foundation (since March 2015). Over recent years Steve has been a member of the Australian Treasurer’s Financial Sector Advisory Council, President of the American Chamber of Commerce and a Director on the Board of the Business Council of Australia. Steve was most recently the President and Chief Executive Officer of GE Mining, GE's global mining technology and services business. He joined GE Capital in 1993 and held a number of global leadership positions with the company, spanning the US, Europe and Asia. He was a member of the Australian B20 Leadership Group and Coordinating Chair of the B20 Human Capital Taskforce. Steve holds a Bachelor of Business from Charles Sturt University in New South Wales and is a Fellow with the Australian Academy of Technological Sciences and Engineering. Andrew Clarke Group General Counsel and Company Secretary Andrew Clarke joined Origin in May 2009 and is responsible for the company secretarial and legal functions. He was a partner of a national law firm for 15 years and was Managing Director of a global investment bank for more than two years prior to joining Origin. Andrew has a Bachelor of Laws (Hons) and a Bachelor of Economics from Sydney University, and is a member of the AICD. Helen Hardy Company Secretary Helen Hardy joined Origin in March 2010. She was previously General Manager, Company Secretariat of a large ASX listed company, and has advised on governance, financial reporting and corporate law at a Big 4 accounting firm and a national law firm. Helen is a Chartered Accountant and Chartered Secretary. She holds a Bachelor of Laws and a Bachelor of Commerce from the University of Melbourne, and is admitted to practice in New South Wales and Victoria.
Page | 8 Origin Energy Limited ABN 30 000 051 696
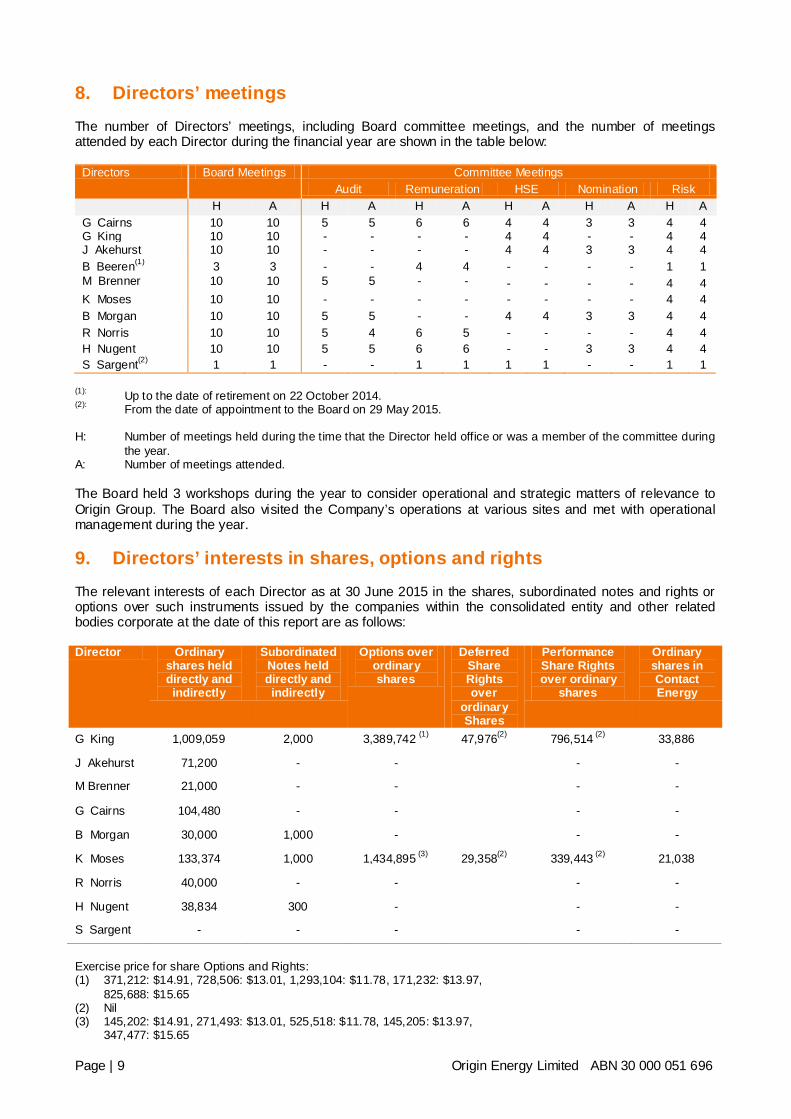
8. Directors’ meetings The number of Directors’ meetings, including Board committee meetings, and the number of meetings attended by each Director during the financial year are shown in the table below:
Directors Board Meetings Committee Meetings Audit Remuneration HSE Nomination Risk
H A H A H A H A H A H A G Cairns 10 10 5 5 6 6 4 4 3 3 4 4 G King 10 10 - - - - 4 4 - - 4 4 J Akehurst 10 10 - - - - 4 4 3 3 4 4 B Beeren(1) 3 3 - - 4 4 - - - - 1 1 M Brenner 10 10 5 5 - - - - - - 4 4 K Moses 10 10 - - - - - - - - 4 4 B Morgan 10 10 5 5 - - 4 4 3 3 4 4 R Norris 10 10 5 4 6 5 - - - - 4 4 H Nugent 10 10 5 5 6 6 - - 3 3 4 4 S Sargent(2) 1 1 - - 1 1 1 1 - - 1 1
(1): Up to the date of retirement on 22 October 2014. (2): From the date of appointment to the Board on 29 May 2015. H: Number of meetings held during the time that the Director held office or was a member of the committee during
the year. A: Number of meetings attended. The Board held 3 workshops during the year to consider operational and strategic matters of relevance to Origin Group. The Board also visited the Company’s operations at various sites and met with operational management during the year. 9. Directors’ interests in shares, options and rights The relevant interests of each Director as at 30 June 2015 in the shares, subordinated notes and rights or options over such instruments issued by the companies within the consolidated entity and other related bodies corporate at the date of this report are as follows: Director Ordinary
shares held directly and indirectly
Subordinated Notes held directly and indirectly
Options over ordinary shares
Deferred Share Rights over
ordinary Shares
Performance Share Rights over ordinary
shares
Ordinary shares in Contact Energy
G King 1,009,059 2,000 3,389,742 (1) 47,976(2) 796,514 (2) 33,886
J Akehurst 71,200 - - - -
M Brenner 21,000 - - - -
G Cairns 104,480 - - - -
B Morgan 30,000 1,000 - - -
K Moses 133,374 1,000 1,434,895 (3) 29,358(2) 339,443 (2) 21,038
R Norris 40,000 - - - -
H Nugent 38,834 300 - - -
S Sargent - - - - -
Exercise price for share Options and Rights: (1) 371,212: $14.91, 728,506: $13.01, 1,293,104: $11.78, 171,232: $13.97, 825,688: $15.65 (2) Nil (3) 145,202: $14.91, 271,493: $13.01, 525,518: $11.78, 145,205: $13.97, 347,477: $15.65
Page | 9 Origin Energy Limited ABN 30 000 051 696
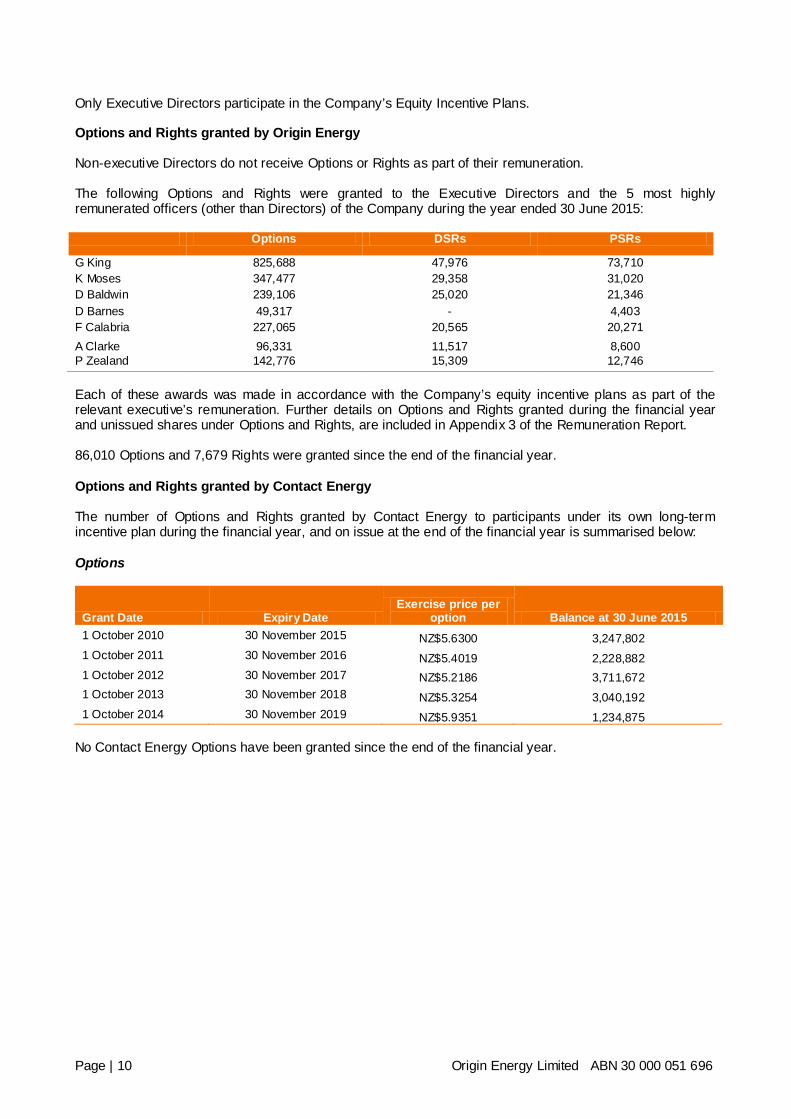
Only Executive Directors participate in the Company’s Equity Incentive Plans. Options and Rights granted by Origin Energy Non-executive Directors do not receive Options or Rights as part of their remuneration. The following Options and Rights were granted to the Executive Directors and the 5 most highly remunerated officers (other than Directors) of the Company during the year ended 30 June 2015: Options DSRs PSRs
G King 825,688 47,976 73,710 K Moses 347,477 29,358 31,020 D Baldwin 239,106 25,020 21,346 D Barnes 49,317 - 4,403 F Calabria 227,065 20,565 20,271 A Clarke 96,331 11,517 8,600 P Zealand 142,776 15,309 12,746 Each of these awards was made in accordance with the Company’s equity incentive plans as part of the relevant executive’s remuneration. Further details on Options and Rights granted during the financial year and unissued shares under Options and Rights, are included in Appendix 3 of the Remuneration Report. 86,010 Options and 7,679 Rights were granted since the end of the financial year. Options and Rights granted by Contact Energy The number of Options and Rights granted by Contact Energy to participants under its own long-term incentive plan during the financial year, and on issue at the end of the financial year is summarised below: Options
Grant Date Expiry Date Exercise price per
option Balance at 30 June 2015 1 October 2010 30 November 2015 NZ$5.6300 3,247,802 1 October 2011 30 November 2016 NZ$5.4019 2,228,882 1 October 2012 30 November 2017 NZ$5.2186 3,711,672 1 October 2013 30 November 2018 NZ$5.3254 3,040,192 1 October 2014 30 November 2019 NZ$5.9351 1,234,875
No Contact Energy Options have been granted since the end of the financial year.
Page | 10 Origin Energy Limited ABN 30 000 051 696
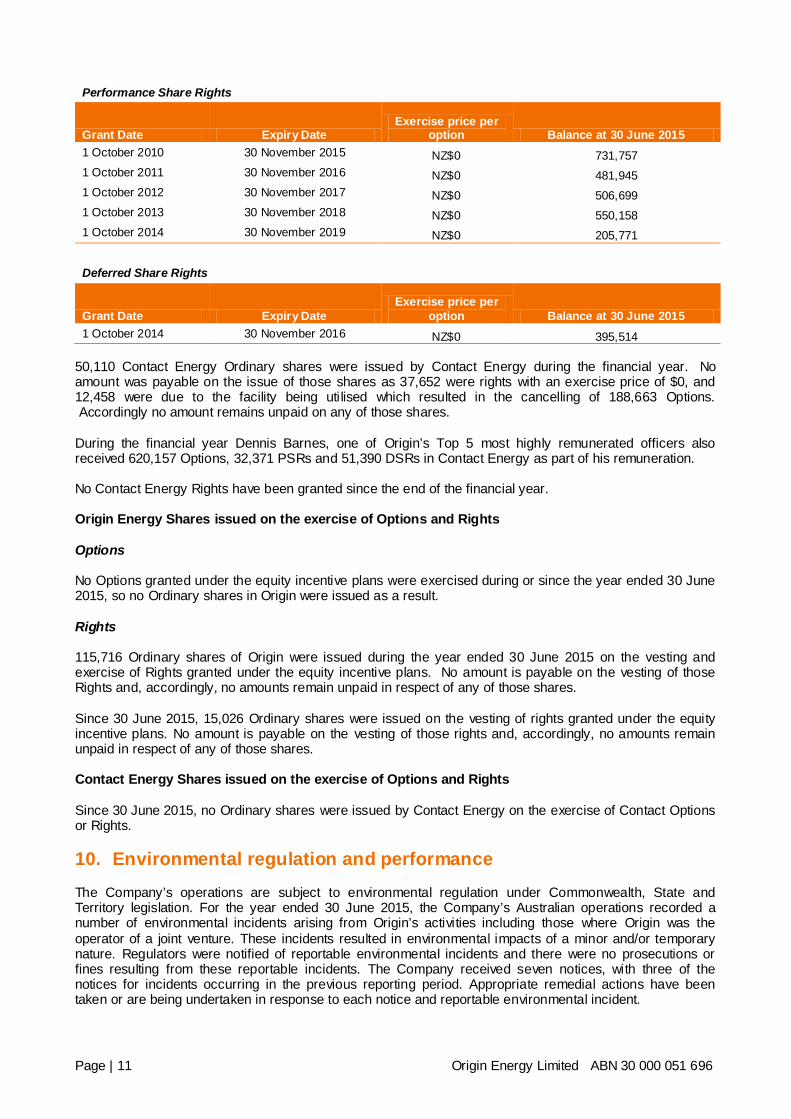
Performance Share Rights
Grant Date Expiry Date Exercise price per
option Balance at 30 June 2015 1 October 2010 30 November 2015 NZ$0 731,757 1 October 2011 30 November 2016 NZ$0 481,945 1 October 2012 30 November 2017 NZ$0 506,699 1 October 2013 30 November 2018 NZ$0 550,158 1 October 2014 30 November 2019 NZ$0 205,771
Deferred Share Rights
Grant Date Expiry Date Exercise price per
option Balance at 30 June 2015 1 October 2014 30 November 2016 NZ$0 395,514
50,110 Contact Energy Ordinary shares were issued by Contact Energy during the financial year. No amount was payable on the issue of those shares as 37,652 were rights with an exercise price of $0, and 12,458 were due to the facility being utilised which resulted in the cancelling of 188,663 Options. Accordingly no amount remains unpaid on any of those shares. During the financial year Dennis Barnes, one of Origin’s Top 5 most highly remunerated officers also received 620,157 Options, 32,371 PSRs and 51,390 DSRs in Contact Energy as part of his remuneration. No Contact Energy Rights have been granted since the end of the financial year. Origin Energy Shares issued on the exercise of Options and Rights Options No Options granted under the equity incentive plans were exercised during or since the year ended 30 June 2015, so no Ordinary shares in Origin were issued as a result. Rights 115,716 Ordinary shares of Origin were issued during the year ended 30 June 2015 on the vesting and exercise of Rights granted under the equity incentive plans. No amount is payable on the vesting of those Rights and, accordingly, no amounts remain unpaid in respect of any of those shares. Since 30 June 2015, 15,026 Ordinary shares were issued on the vesting of rights granted under the equity incentive plans. No amount is payable on the vesting of those rights and, accordingly, no amounts remain unpaid in respect of any of those shares. Contact Energy Shares issued on the exercise of Options and Rights Since 30 June 2015, no Ordinary shares were issued by Contact Energy on the exercise of Contact Options or Rights. 10. Environmental regulation and performance The Company’s operations are subject to environmental regulation under Commonwealth, State and Territory legislation. For the year ended 30 June 2015, the Company’s Australian operations recorded a number of environmental incidents arising from Origin’s activities including those where Origin was the operator of a joint venture. These incidents resulted in environmental impacts of a minor and/or temporary nature. Regulators were notified of reportable environmental incidents and there were no prosecutions or fines resulting from these reportable incidents. The Company received seven notices, with three of the notices for incidents occurring in the previous reporting period. Appropriate remedial actions have been taken or are being undertaken in response to each notice and reportable environmental incident.
Page | 11 Origin Energy Limited ABN 30 000 051 696
11. Indemnities and insurance for Directors and Officers Under its Constitution, the Company may indemnify current and past Directors and Officers for losses or liabilities incurred by them as a Director or Officer of the Company or its related bodies corporate to the extent allowed under law. The Constitution also permits the Company to purchase and maintain a Directors’ and Officers’ insurance policy. No indemnity has been granted to an auditor of the Company in their capacity as auditor of the Company. The Company has entered into agreements with current Directors and certain former Directors whereby it will indemnify those Directors from all losses or liabilities in accordance with the terms of, and subject to the limits set by, the Constitution. The agreements stipulate that the Company will meet the full amount of any such liability, including costs and expenses to the extent allowed under law. The Company is not aware of any liability having arisen, and no claim has been made against the Company during or since the year ended 30 June 2015 under these agreements. During the year, the Company has paid insurance premiums in respect of Directors’ and Officers’ liability, and legal expense insurance contracts for the year ended 30 June 2015. The insurance contracts insure against certain liability (subject to exclusions) of persons who are or have been Directors or Officers of the Company and its controlled entities. A condition of the contracts is that the nature of the liability indemnified and the premium payable not be disclosed. 12. Auditor independence There is no former partner or director of KPMG, the Company’s auditors, who is or was at any time during the year ended 30 June 2015 an officer of the Origin Energy Group. The auditor’s independence declaration for the financial year (made under section 307C of the Corporations Act) is attached to and forms part of this report. 13. Non-audit services The amounts paid or payable to KPMG for non-audit services provided during the year was $705,000 (shown to nearest thousand dollar). Amounts paid to KPMG are included in F7 to the full financial statements. Based on written advice received from the Audit Committee Chairman pursuant to a resolution passed by the Audit Committee, the Board has formed the view that the provision of those non-audit services by KPMG is compatible with, and did not compromise, the general standards of independence for auditors imposed by the Corporations Act. The Board’s reasons for concluding that the non-audit services provided by KPMG did not compromise its independence are: • all the non-audit services provided were subjected to the Company’s corporate governance procedures
and, on each occasion, were below the pre-approved limits imposed by the Audit committee; • all the non-audit services provided did not, and do not, undermine the general principles relating to
auditor independence as they did not involve reviewing or auditing the auditor’s own work, acting in a management or decision making capacity for the Company, acting as an advocate for the Company or jointly sharing risks and rewards; and
• there were no known conflict of interest situations nor any other circumstance arising out of a relationship between Origin (including its Directors and officers) and KPMG which may impact on auditor independence.
14. Proceedings on behalf of the Company
No proceedings have been brought on behalf of the Company, nor have any applications been made in respect of the Company under section 237 of the Corporations Act.
Page | 12 Origin Energy Limited ABN 30 000 051 696
15. Rounding of amounts The Company is a company of a kind referred to in ASIC Class Order 98/100 dated 10 July 1998 and in accordance with that class order, amounts in the financial report and Directors’ Report have been rounded off to the nearest million dollars unless otherwise stated. 16. Remuneration The Remuneration Report is attached and forms part of this Directors’ Report.
Page | 13 Origin Energy Limited ABN 30 000 051 696
ORIGIN ENERGY Operating and Financial Review For the Year ended 30 June 2015 This report is attached to and forms part of the Directors’ Report.

IMPORTANT INFORMATION This Operating and Financial Review (OFR) contains forward looking statements, including statements of current intention, statements of opinion and predictions as to possible future events and future financial prospects. Such statements are not statements of fact and there can be no certainty of outcome in relation to the matters to which the statements relate. Forward looking statements involve known and unknown risks, uncertainties, assumptions and other important factors that could cause the actual outcomes to be materially different from the events or results expressed or implied by such statements, and the outcomes are not all within the control of Origin. Statements about past performance are not necessarily indicative of future performance. Neither the Company nor any of its subsidiaries, affiliates and associated companies (or any of their respective officers, employees or agents) (the “Relevant Persons”) makes any representation, assurance or guarantee as to the accuracy or likelihood of fulfilment of any forward looking statement or any outcomes expressed or implied in any forward looking statement. The forward looking statements in this OFR reflect views held only at the date of this report and except as required by applicable law or the ASX Listing Rules, the Relevant Persons disclaim any obligation or undertaking to publicly update any forward looking statements, or discussion of future financial prospects, whether as a result of new information or future events. This OFR and Directors’ Report refer to Origin’s financial results, including Origin’s Statutory Profit and Underlying Profit. Origin’s Statutory Profit contains a number of items that when excluded provide a different perspective on the financial and operational performance of the business. Income Statement amounts, presented on an underlying basis such as Underlying Profit, are non-IFRS financial measures, and exclude the impact of these items consistent with the manner in which the Managing Director reviews the financial and operating performance of the business. Each underlying measure disclosed has been adjusted to remove the impact of these items on a consistent basis. A reconciliation and description of the items that contribute to the difference between Statutory Profit and Underlying Profit is provided in Section 3.1 of this OFR. Certain other non-IFRS financial measures are also included in this OFR. These non-IFRS financial measures are used internally by management to assess the performance of Origin’s business and make decisions on allocation of resources. Further information regarding the non-IFRS financial measures is included in the Glossary in Appendix 2 of this OFR. Non-IFRS measures have not been subject to audit or review. Certain comparative amounts from the prior corresponding period have been re-presented to conform to the current period’s presentation. Disclosures of Origin and Australia Pacific LNG’s reserves and resources are as at 30 June 2015. These reserves and resources were announced on 31 July 2015 in Origin’s Annual Reserves Report for the year ended 30 June 2015 (Annual Reserves Report). Origin confirms that it is not aware of any new information or data that materially affects the information included in the Annual Reserves Report and that all the material assumptions and technical parameters underpinning the estimates in the Annual Reserves Report continue to apply and have not materially changed. Petroleum reserves and contingent resources are typically prepared by deterministic methods with support from probabilistic methods. Petroleum reserves and contingent resources are aggregated by arithmetic summation by category and as a result, proved reserves (1P reserves) may be a conservative estimate due to the portfolio effects of the arithmetic summation. Proved plus probable plus possible (3P reserves) may be an optimistic estimate due to the same aforementioned reasons. Some of Australia Pacific LNG CSG reserves and resources are subject to reversionary rights to transfer back to Tri-Star a 45% interest in Australia Pacific LNG’s share of those CSG interests that were acquired from Tri-Star in 2002 if certain conditions are met. Approximately 22% of Australia Pacific LNG’s 3P CSG reserves as of 30 June 2015 are subject to the reversionary rights. If reversion occurs this may mean that the uncommitted reserves that are subject to reversion are not available for Australia Pacific LNG to sell or use after the date of reversion. Origin has assessed the potential impact of reversionary rights associated with such interests based on economic tests consistent with these reserves and resources and based on that assessment does not consider that reversion will impact the reserves and resources quoted in the Annual Reserves Report. In October 2014, Tri-Star filed proceedings against Australia Pacific LNG claiming that reversion has occurred. Australia Pacific LNG will defend the claim. On 10 August 2015, Origin divested its entire 53.09% interest in Contact Energy. Contact has been classified as held for sale in the balance sheet at 30 June 2015 and, as a consequence, has been presented as a discontinued operation in the income statement. The Operating and Financial Review provides a discussion of the performance and operations of all of Origin’s businesses during the 2015 financial year, including Contact. The OFR details Origin’s financial performance for the 2015 financial year. For information regarding non-financial performance refer to Origin’s Sustainability Report.
Page | 15 Origin Energy Limited ABN 30 000 051 696
TABLE OF CONTENTS
1. FINANCIAL AND OPERATING HIGHLIGHTS 2. ORIGIN’S BUSINESS STRATEGY
2.1 Regional leader in energy markets 2.2 Regionally significant position in natural gas and LNG production 2.3 Growing position in renewable energy in the Asia Pacific region
3. REVIEW OF FINANCIAL PERFORMANCE 3.1 Underlying financial performance 3.2 Final dividend – 25.0 cps unfranked
4. REVIEW OF CASH FLOWS 4.1 Statement of cash flows 4.2 Operating Cash Flow After Tax (OCAT) 4.3 Capital expenditure and Origin’s cash contributions to Australia Pacific LNG 4.4 Funding and capital management
5. PROSPECTS AND OUTLOOK FOR FUTURE FINANCIAL YEARS 5.1 Prospects 5.2 Outlook
6. REVIEW OF SEGMENT OPERATIONS 6.1 Energy Markets 6.2 Contact Energy 6.3 Exploration & Production 6.4 LNG 6.5 Corporate
7. RISKS RELATED TO ORIGIN’S FUTURE FINANCIAL PROSPECTS APPENDIX 1 – ORIGIN’S KEY FINANCIALS APPENDIX 2 – GLOSSARY AND INTERPRETATION
Page | 16 Origin Energy Limited ABN 30 000 051 696
1. FINANCIAL AND OPERATING HIGHLIGHTS
Year ended 30 June 2015 ($m)
2014 ($m)
Change (%)
Statutory Results 3:
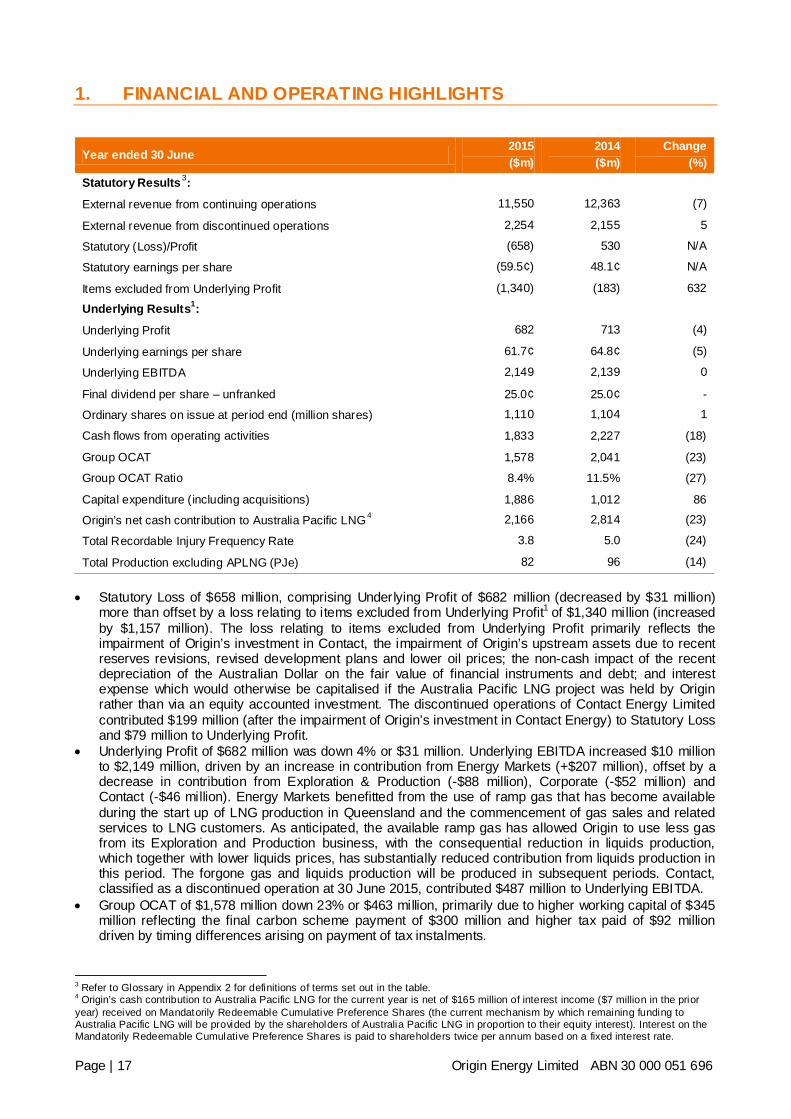
External revenue from continuing operations 11,550 12,363 (7)
External revenue from discontinued operations 2,254 2,155 5
Statutory (Loss)/Profit (658) 530 N/A
Statutory earnings per share (59.5¢) 48.1¢ N/A
Items excluded from Underlying Profit (1,340) (183) 632
Underlying Results1:
Underlying Profit 682 713 (4)
Underlying earnings per share 61.7¢ 64.8¢ (5)
Underlying EBITDA 2,149 2,139 0
Final dividend per share – unfranked 25.0¢ 25.0¢ -
Ordinary shares on issue at period end (million shares) 1,110 1,104 1
Cash flows from operating activities 1,833 2,227 (18)
Group OCAT 1,578 2,041 (23)
Group OCAT Ratio 8.4% 11.5% (27)
Capital expenditure (including acquisitions) 1,886 1,012 86
Origin’s net cash contribution to Australia Pacific LNG4 2,166 2,814 (23)
Total Recordable Injury Frequency Rate 3.8 5.0 (24)
Total Production excluding APLNG (PJe) 82 96 (14) • Statutory Loss of $658 million, comprising Underlying Profit of $682 million (decreased by $31 million)
more than offset by a loss relating to items excluded from Underlying Profit1 of $1,340 million (increased by $1,157 million). The loss relating to items excluded from Underlying Profit primarily reflects the impairment of Origin’s investment in Contact, the impairment of Origin’s upstream assets due to recent reserves revisions, revised development plans and lower oil prices; the non-cash impact of the recent depreciation of the Australian Dollar on the fair value of financial instruments and debt; and interest expense which would otherwise be capitalised if the Australia Pacific LNG project was held by Origin rather than via an equity accounted investment. The discontinued operations of Contact Energy Limited contributed $199 million (after the impairment of Origin’s investment in Contact Energy) to Statutory Loss and $79 million to Underlying Profit.
• Underlying Profit of $682 million was down 4% or $31 million. Underlying EBITDA increased $10 million to $2,149 million, driven by an increase in contribution from Energy Markets (+$207 million), offset by a decrease in contribution from Exploration & Production (-$88 million), Corporate (-$52 million) and Contact (-$46 million). Energy Markets benefitted from the use of ramp gas that has become available during the start up of LNG production in Queensland and the commencement of gas sales and related services to LNG customers. As anticipated, the available ramp gas has allowed Origin to use less gas from its Exploration and Production business, with the consequential reduction in liquids production, which together with lower liquids prices, has substantially reduced contribution from liquids production in this period. The forgone gas and liquids production will be produced in subsequent periods. Contact, classified as a discontinued operation at 30 June 2015, contributed $487 million to Underlying EBITDA.
• Group OCAT of $1,578 million down 23% or $463 million, primarily due to higher working capital of $345 million reflecting the final carbon scheme payment of $300 million and higher tax paid of $92 million driven by timing differences arising on payment of tax instalments.
3 Refer to Glossary in Appendix 2 for definitions of terms set out in the table. 4 Origin’s cash contribution to Australia Pacific LNG for the current year is net of $165 million of interest income ($7 million in the prior year) received on Mandatorily Redeemable Cumulative Preference Shares (the current mechanism by which remaining funding to Australia Pacific LNG will be provided by the shareholders of Australia Pacific LNG in proportion to their equity interest). Interest on the Mandatorily Redeemable Cumulative Preference Shares is paid to shareholders twice per annum based on a fixed interest rate.
Page | 17 Origin Energy Limited ABN 30 000 051 696
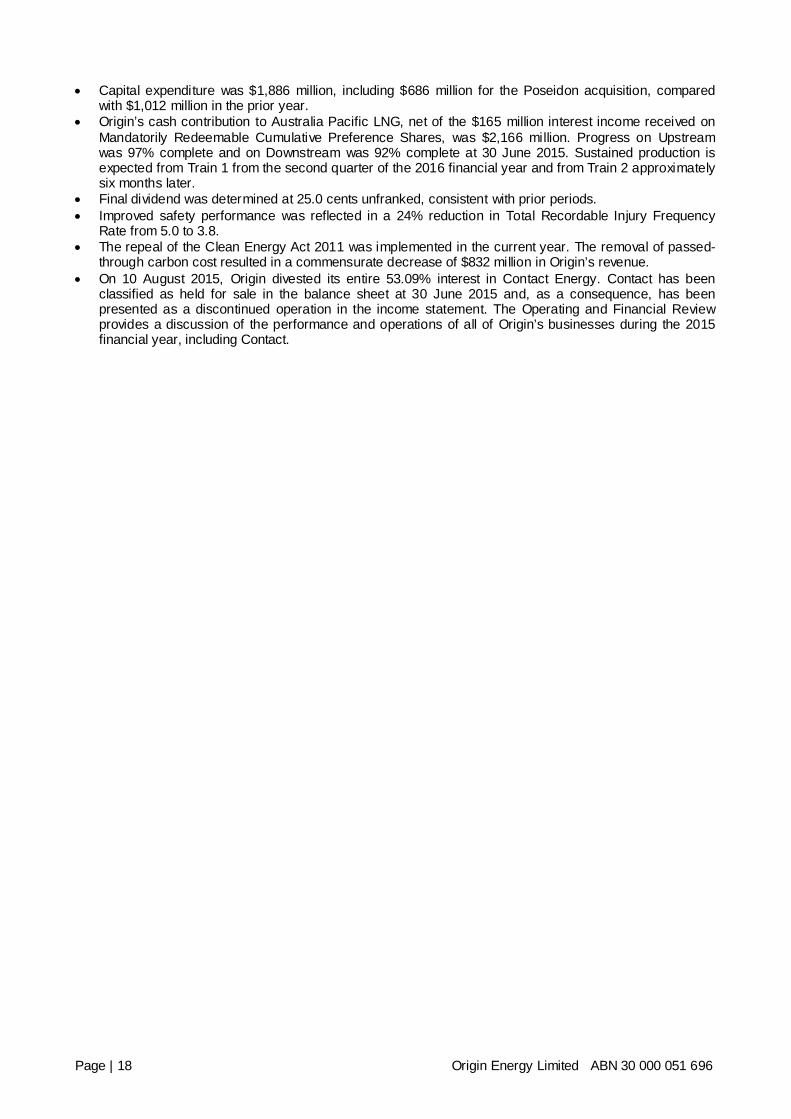
• Capital expenditure was $1,886 million, including $686 million for the Poseidon acquisition, compared with $1,012 million in the prior year.
• Origin’s cash contribution to Australia Pacific LNG, net of the $165 million interest income received on Mandatorily Redeemable Cumulative Preference Shares, was $2,166 million. Progress on Upstream was 97% complete and on Downstream was 92% complete at 30 June 2015. Sustained production is expected from Train 1 from the second quarter of the 2016 financial year and from Train 2 approximately six months later.
• Final dividend was determined at 25.0 cents unfranked, consistent with prior periods. • Improved safety performance was reflected in a 24% reduction in Total Recordable Injury Frequency
Rate from 5.0 to 3.8. • The repeal of the Clean Energy Act 2011 was implemented in the current year. The removal of passed-
through carbon cost resulted in a commensurate decrease of $832 million in Origin’s revenue. • On 10 August 2015, Origin divested its entire 53.09% interest in Contact Energy. Contact has been
classified as held for sale in the balance sheet at 30 June 2015 and, as a consequence, has been presented as a discontinued operation in the income statement. The Operating and Financial Review provides a discussion of the performance and operations of all of Origin’s businesses during the 2015 financial year, including Contact.
Page | 18 Origin Energy Limited ABN 30 000 051 696
2. ORIGIN’S BUSINESS STRATEGY
Origin currently supplies energy to wholesale and retail energy markets primarily in Australia and, looking forward, to the Asia Pacific region as Australia Pacific LNG commences sustained production from Train 1 from the second quarter of the 2016 financial year. In supplying these markets, Origin’s strategy is to invest in the contestable segments of energy production, power generation and energy retailing. This strategy is designed to provide opportunities to grow the value of the Company and deliver a return on capital employed in excess of the Company’s cost of capital by connecting energy production to customers, while allowing for the more effective management of the risks that arise across an increasingly competitive energy supply chain. Origin pursues this strategy through its Energy Markets and Exploration & Production businesses and a 37.5% interest in Australia Pacific LNG in Australia. Both natural gas and renewable energy are expected to be the strongest growing fuels globally in the medium to longer term. Origin intends to grow its interests in natural gas resources in Australia with paths to monetise resources both domestically and internationally through LNG exports, particularly to the Asia Pacific region where demand for energy is expected to increase over the medium to long term. Origin also intends to continue growing its capabilities and investing in renewable energy development opportunities including wind, geothermal, solar and hydro resources. Origin believes the successful pursuit of this strategy will lead to Origin: • being the regional leader in energy markets; • having a regionally significant position in natural gas and LNG production and • having a growing position in renewable energy in the Asia Pacific region.
2.1 Regional leader in energy markets
Origin holds a significant position in energy markets in Australia through its Energy Markets business. Origin, through its Energy Markets business segment, has leading integrated operations in the energy supply, power generation and retail sectors of the Australian energy supply chain, comprising: • a large and diverse gas portfolio which, together with flexible gas transport arrangements and coal
supply agreements, support a strong domestic generation and retail business; • a large generation portfolio of approximately 6,000 MW providing flexibility and diversity across fuel,
generation type and geography; and • the leading energy retailing position in Australia by customer accounts with approximately 29%5 share of
natural gas and electricity retail customer accounts in Australia’s eastern and southern states, servicing approximately 4.3 million electricity, gas and LPG customers with a diverse portfolio of energy products and solutions including green energy products.
Origin’s fuel portfolio supplies gas to its retail gas customers and gas-fired power stations, and coal to operate the Eraring Power Station. Origin’s fleet of gas-fired and coal-fired power stations provides a hedge to the retail electricity business and, in particular, helps to manage risks associated with wholesale electricity prices during extreme price events. Origin will continue to build on this integrated strategy to capture value across the energy supply chain, enhance the range of growth opportunities and manage risks. In particular, Origin’s portfolio of competitively-priced gas contracts, a significant amount being set at previously low domestic prices, enable value to be captured as wholesale gas prices rise. With the largest retail customer base in Australia, Origin is focused on building customer loyalty and trust and offering new energy services and solutions.
5 Based on Origin natural gas and electricity customer accounts as at 30 June 2015 and estimated market customer accounts as at 30 June 2014.
Page | 19 Origin Energy Limited ABN 30 000 051 696
2.2 Regionally significant position in natural gas and LNG production
Origin has an upstream Exploration & Production business in Australia and New Zealand, with exploration and production interests principally located in eastern and southern Australia, the Browse and Perth basins in Western Australia, the Bonaparte basin in north-western Australia and Beetaloo basin in the Northern Territory and in New Zealand. Origin holds a 37.5% shareholding in Australia Pacific LNG which owns extensive CSG reserves, predominantly in the Surat and Bowen basins in Queensland. Australia Pacific LNG has the largest 2P CSG reserves position6 in Australia of 13,778 PJe7 and is developing a large-scale CSG-to-LNG project that has a nameplate capacity of 9 million tonnes of LNG each year for export to supply Asian customers under long term supply contracts. Origin is the upstream operator of the Australia Pacific LNG project, responsible for the development of the CSG resources and the processing and transportation of gas to the LNG facility on Curtis Island. The Australia Pacific LNG project is expected to commence sustained production from Train 1 from the second quarter of the 2016 financial year and from Train 2 approximately six months later. As the upstream operator of the Australia Pacific LNG project, together with Origin’s own existing gas operations, Origin has significant capabilities in natural gas production and has a substantial reserves position in the Asia Pacific region with 6,260 PJe of 2P reserves8. Origin’s existing upstream business in Exploration & Production, its shareholding in Australia Pacific LNG and a significant set of exploration and development opportunities make Origin a regionally significant participant in natural gas and LNG. 2.3 Growing position in renewable energy in the Asia Pacific region
In May 2015, the Australian Government settled on the revised Large-scale Renewable Energy Target (LRET) of 33 TWh which provides certainty for the energy industry to invest in the development of additional sources of renewable energy. Origin estimates that a 33 TWh LRET, should it be met by additional wind development, will require about 5,000 MW of capacity to be built by 2020. Large scale solar farms are also increasingly economic and may provide a viable alternative to wind farms. As the leading energy retailer in Australia with close to 30% share of electricity customer accounts in Australia’s eastern and southern states, Origin will be required to acquit its share of LRET liabilities. In Australia, Origin currently has a substantial portfolio of renewable energy comprising its wind farm at Cullerin Range, a series of wind power purchase agreements and a number of wind development opportunities, most notably Stockyard Hill in Victoria. Origin’s energy portfolio provides flexibility for Origin to develop or support the development of the additional renewable energy required to meet the LRET target. Origin is also developing its renewable capabilities internationally with utility scale solar and hydro development opportunities in Chile, including acquisition, via the Energia Andina joint venture, of a stake in the Javiera solar project in Chile’s Atacama desert which commenced operation during the financial year. Origin will continue to build on its existing renewable portfolio and seek new opportunities such as in solar technologies where market structures provide attractive and sustainable value for renewable resources.
6 EnergyQuest, May 2015 7 At 30 June 2015. For further information refer to Origin’s Annual Reserves Report for the year ended 30 June 2015, announced on 31 July 2015. Also refer to the Important Information on reserves and resources disclosures prior to Section 1. 8 At 30 June 2015. Including hydrocarbon liquids. Includes Origin’s 37.5% share of Australia Pacific LNG.
Page | 20 Origin Energy Limited ABN 30 000 051 696
3. REVIEW OF FINANCIAL PERFORMANCE
3.1 Underlying financial performance9
Year ended 30 June 2015 ($m)
2014 ($m)
Change (%)
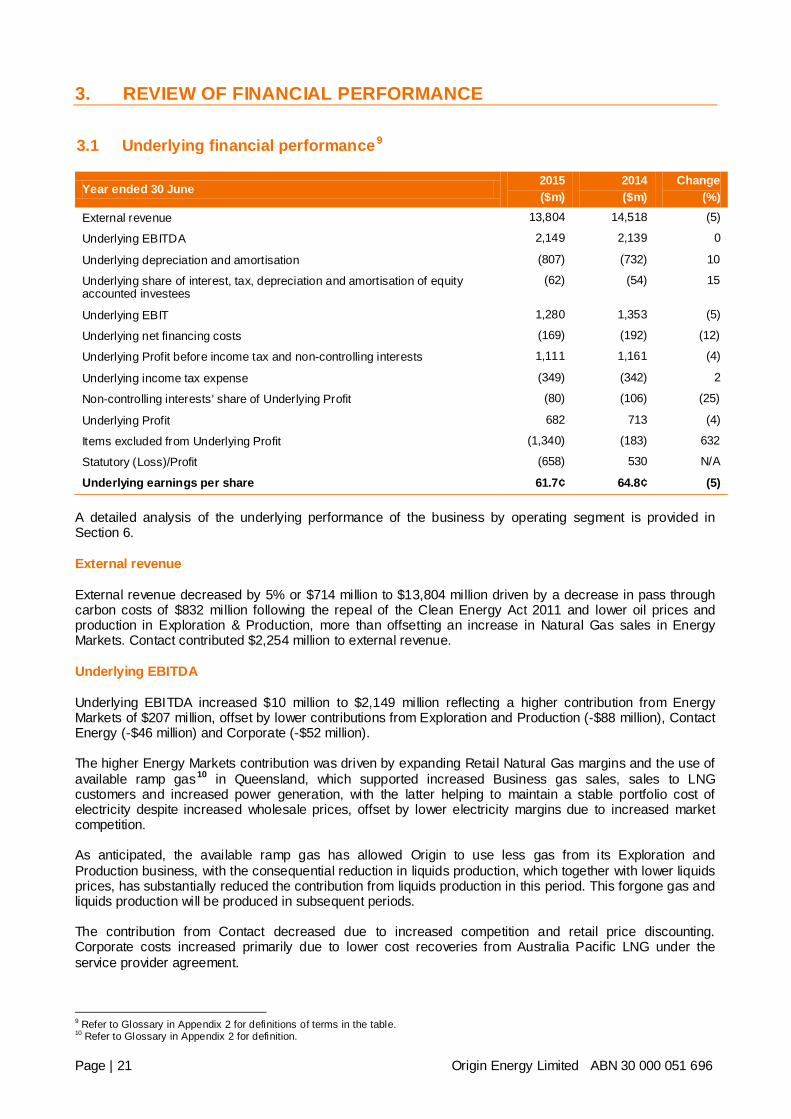
External revenue 13,804 14,518 (5)
Underlying EBITDA 2,149 2,139 0
Underlying depreciation and amortisation (807) (732) 10
Underlying share of interest, tax, depreciation and amortisation of equity accounted investees
(62) (54) 15
Underlying EBIT 1,280 1,353 (5)
Underlying net financing costs (169) (192) (12)
Underlying Profit before income tax and non-controlling interests 1,111 1,161 (4)
Underlying income tax expense (349) (342) 2
Non-controlling interests’ share of Underlying Profit (80) (106) (25)
Underlying Profit 682 713 (4)
Items excluded from Underlying Profit (1,340) (183) 632
Statutory (Loss)/Profit (658) 530 N/A
Underlying earnings per share 61.7¢ 64.8¢ (5) A detailed analysis of the underlying performance of the business by operating segment is provided in Section 6. External revenue
External revenue decreased by 5% or $714 million to $13,804 million driven by a decrease in pass through carbon costs of $832 million following the repeal of the Clean Energy Act 2011 and lower oil prices and production in Exploration & Production, more than offsetting an increase in Natural Gas sales in Energy Markets. Contact contributed $2,254 million to external revenue. Underlying EBITDA
Underlying EBITDA increased $10 million to $2,149 million reflecting a higher contribution from Energy Markets of $207 million, offset by lower contributions from Exploration and Production (-$88 million), Contact Energy (-$46 million) and Corporate (-$52 million). The higher Energy Markets contribution was driven by expanding Retail Natural Gas margins and the use of available ramp gas10 in Queensland, which supported increased Business gas sales, sales to LNG customers and increased power generation, with the latter helping to maintain a stable portfolio cost of electricity despite increased wholesale prices, offset by lower electricity margins due to increased market competition. As anticipated, the available ramp gas has allowed Origin to use less gas from its Exploration and Production business, with the consequential reduction in liquids production, which together with lower liquids prices, has substantially reduced the contribution from liquids production in this period. This forgone gas and liquids production will be produced in subsequent periods. The contribution from Contact decreased due to increased competition and retail price discounting. Corporate costs increased primarily due to lower cost recoveries from Australia Pacific LNG under the service provider agreement.
9 Refer to Glossary in Appendix 2 for definitions of terms in the table. 10 Refer to Glossary in Appendix 2 for definition.
Page | 21 Origin Energy Limited ABN 30 000 051 696
Underlying EBITDA Underlying EBIT Year ended 30 June
2015 ($m)
2014 ($m)
Change (%)
2015 ($m)
2014 ($m)
Change (%)
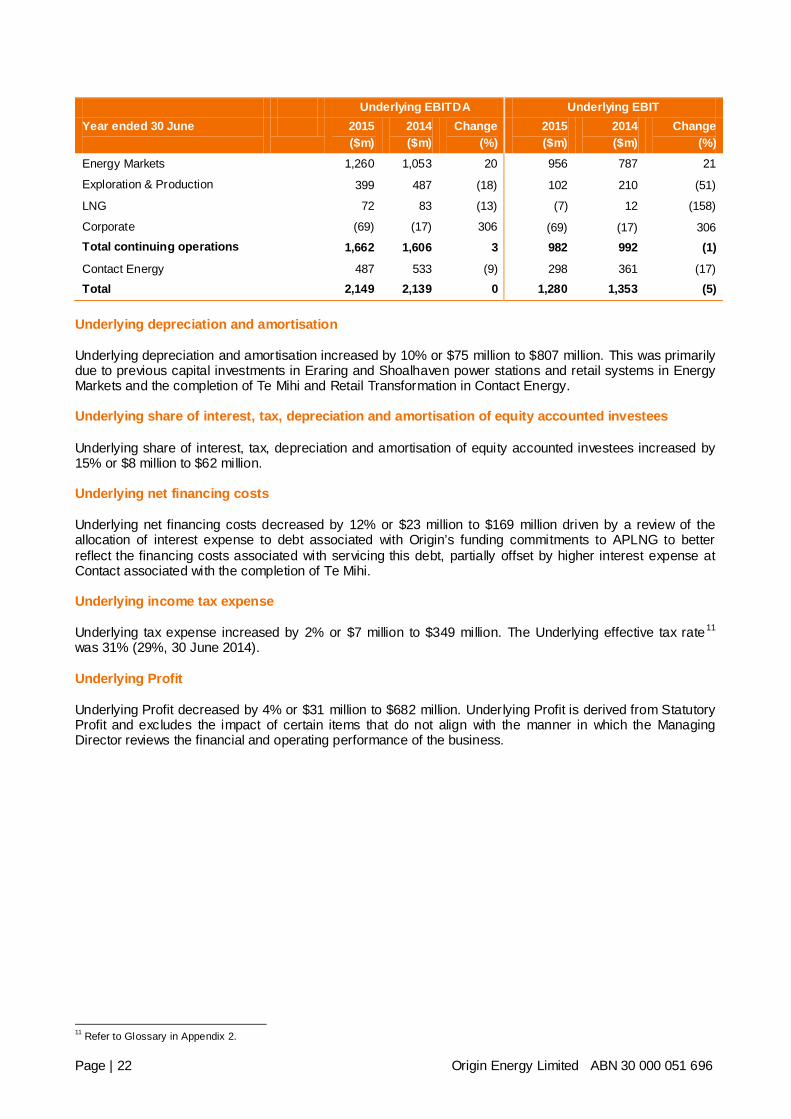
Energy Markets 1,260 1,053 20 956 787 21
Exploration & Production 399 487 (18) 102 210 (51)
LNG 72 83 (13) (7) 12 (158)
Corporate (69) (17) 306 (69) (17) 306 Total continuing operations 1,662 1,606 3 982 992 (1)
Contact Energy 487 533 (9) 298 361 (17) Total 2,149 2,139 0 1,280 1,353 (5)
Underlying depreciation and amortisation
Underlying depreciation and amortisation increased by 10% or $75 million to $807 million. This was primarily due to previous capital investments in Eraring and Shoalhaven power stations and retail systems in Energy Markets and the completion of Te Mihi and Retail Transformation in Contact Energy. Underlying share of interest, tax, depreciation and amortisation of equity accounted investees
Underlying share of interest, tax, depreciation and amortisation of equity accounted investees increased by 15% or $8 million to $62 million. Underlying net financing costs
Underlying net financing costs decreased by 12% or $23 million to $169 million driven by a review of the allocation of interest expense to debt associated with Origin’s funding commitments to APLNG to better reflect the financing costs associated with servicing this debt, partially offset by higher interest expense at Contact associated with the completion of Te Mihi. Underlying income tax expense
Underlying tax expense increased by 2% or $7 million to $349 million. The Underlying effective tax rate11 was 31% (29%, 30 June 2014). Underlying Profit
Underlying Profit decreased by 4% or $31 million to $682 million. Underlying Profit is derived from Statutory Profit and excludes the impact of certain items that do not align with the manner in which the Managing Director reviews the financial and operating performance of the business.
11 Refer to Glossary in Appendix 2.
Page | 22 Origin Energy Limited ABN 30 000 051 696
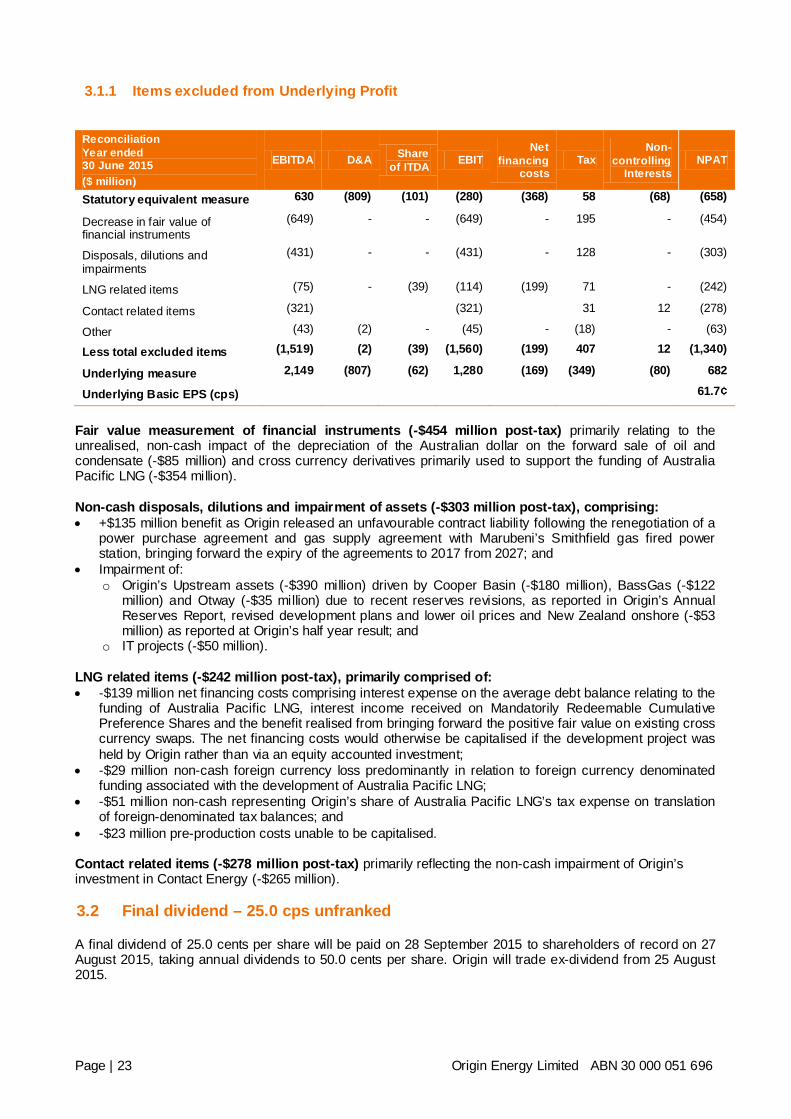
3.1.1 Items excluded from Underlying Profit
Reconciliation Year ended 30 June 2015 ($ million)
EBITDA D&A Share of ITDA EBIT
Net financing
costs Tax
Non-controlling
Interests NPAT
Statutory equivalent measure 630 (809) (101) (280) (368) 58 (68) (658)
Decrease in fair value of financial instruments
(649) - - (649) - 195 - (454)
Disposals, dilutions and impairments
(431) - - (431) - 128 - (303)
LNG related items (75) - (39) (114) (199) 71 - (242)
Contact related items (321) (321) 31 12 (278)
Other (43) (2) - (45) - (18) - (63)
Less total excluded items (1,519) (2) (39) (1,560) (199) 407 12 (1,340)
Underlying measure 2,149 (807) (62) 1,280 (169) (349) (80) 682
Underlying Basic EPS (cps) 61.7¢
Fair value measurement of financial instruments (-$454 million post-tax) primarily relating to the unrealised, non-cash impact of the depreciation of the Australian dollar on the forward sale of oil and condensate (-$85 million) and cross currency derivatives primarily used to support the funding of Australia Pacific LNG (-$354 million). Non-cash disposals, dilutions and impairment of assets (-$303 million post-tax), comprising: • +$135 million benefit as Origin released an unfavourable contract liability following the renegotiation of a
power purchase agreement and gas supply agreement with Marubeni’s Smithfield gas fired power station, bringing forward the expiry of the agreements to 2017 from 2027; and
• Impairment of: o Origin’s Upstream assets (-$390 million) driven by Cooper Basin (-$180 million), BassGas (-$122
million) and Otway (-$35 million) due to recent reserves revisions, as reported in Origin’s Annual Reserves Report, revised development plans and lower oil prices and New Zealand onshore (-$53 million) as reported at Origin’s half year result; and
o IT projects (-$50 million). LNG related items (-$242 million post-tax), primarily comprised of: • -$139 million net financing costs comprising interest expense on the average debt balance relating to the
funding of Australia Pacific LNG, interest income received on Mandatorily Redeemable Cumulative Preference Shares and the benefit realised from bringing forward the positive fair value on existing cross currency swaps. The net financing costs would otherwise be capitalised if the development project was held by Origin rather than via an equity accounted investment;
• -$29 million non-cash foreign currency loss predominantly in relation to foreign currency denominated funding associated with the development of Australia Pacific LNG;
• -$51 million non-cash representing Origin’s share of Australia Pacific LNG’s tax expense on translation of foreign-denominated tax balances; and
• -$23 million pre-production costs unable to be capitalised.
Contact related items (-$278 million post-tax) primarily reflecting the non-cash impairment of Origin’s investment in Contact Energy (-$265 million). 3.2 Final dividend – 25.0 cps unfranked
A final dividend of 25.0 cents per share will be paid on 28 September 2015 to shareholders of record on 27 August 2015, taking annual dividends to 50.0 cents per share. Origin will trade ex-dividend from 25 August 2015.
Page | 23 Origin Energy Limited ABN 30 000 051 696

As a result of the utilisation of available tax losses and the impact of development projects, including Australia Pacific LNG, Origin does not expect to have sufficient franking credits to frank the final dividend. The conduit foreign income component of the final dividend is nil. The Dividend Reinvestment Plan (DRP) will apply to this dividend. No discount will be applied in the calculation of the DRP price. The DRP price of shares will be calculated as the arithmetic average of the daily volume weight average market price during a period of ten trading days commencing on the third trading day immediately following the Record Date. The last election date for the DRP is 28 August 2015. Shares issued under the DRP will rank equally with other fully paid ordinary shares of the Company.
Page | 24 Origin Energy Limited ABN 30 000 051 696
4. REVIEW OF CASH FLOWS
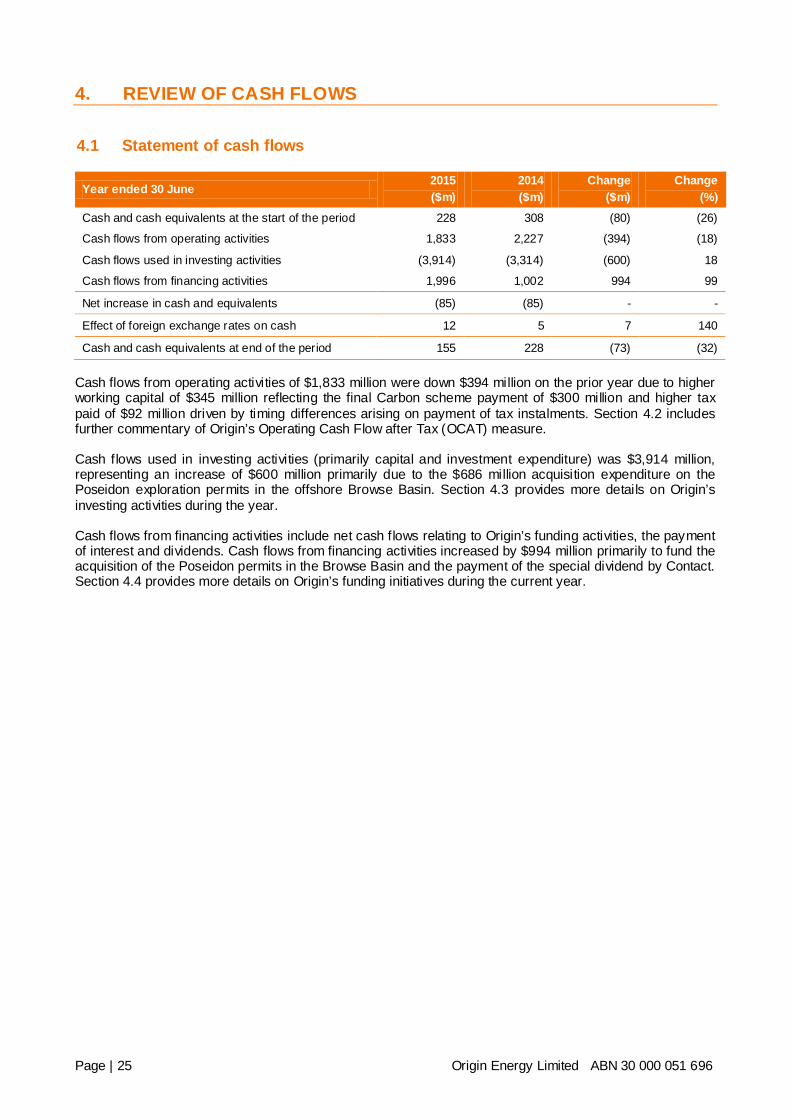
4.1 Statement of cash flows
Year ended 30 June 2015 ($m)
2014 ($m)
Change ($m)
Change (%)
Cash and cash equivalents at the start of the period 228 308 (80) (26)
Cash flows from operating activities 1,833 2,227 (394) (18)
Cash flows used in investing activities (3,914) (3,314) (600) 18
Cash flows from financing activities 1,996 1,002 994 99
Net increase in cash and equivalents (85) (85) - -
Effect of foreign exchange rates on cash 12 5 7 140
Cash and cash equivalents at end of the period 155 228 (73) (32) Cash flows from operating activities of $1,833 million were down $394 million on the prior year due to higher working capital of $345 million reflecting the final Carbon scheme payment of $300 million and higher tax paid of $92 million driven by timing differences arising on payment of tax instalments. Section 4.2 includes further commentary of Origin’s Operating Cash Flow after Tax (OCAT) measure. Cash flows used in investing activities (primarily capital and investment expenditure) was $3,914 million, representing an increase of $600 million primarily due to the $686 million acquisition expenditure on the Poseidon exploration permits in the offshore Browse Basin. Section 4.3 provides more details on Origin’s investing activities during the year. Cash flows from financing activities include net cash flows relating to Origin’s funding activities, the payment of interest and dividends. Cash flows from financing activities increased by $994 million primarily to fund the acquisition of the Poseidon permits in the Browse Basin and the payment of the special dividend by Contact. Section 4.4 provides more details on Origin’s funding initiatives during the current year.
Page | 25 Origin Energy Limited ABN 30 000 051 696
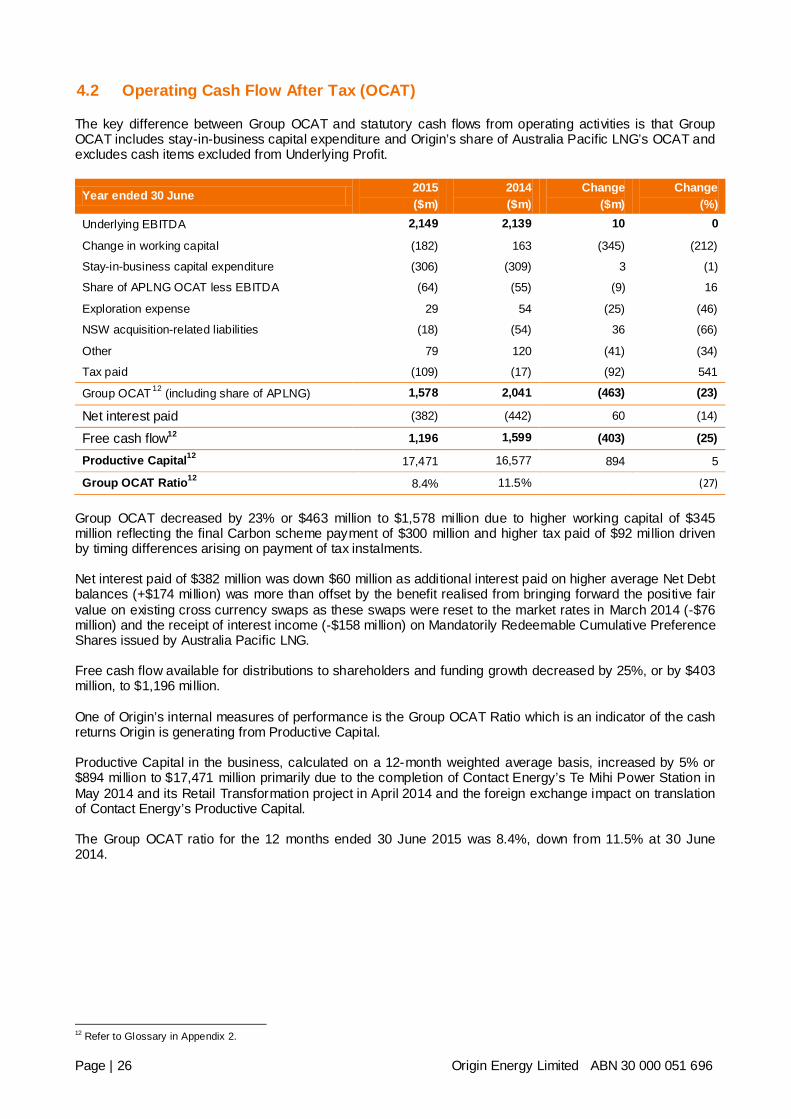
4.2 Operating Cash Flow After Tax (OCAT)
The key difference between Group OCAT and statutory cash flows from operating activities is that Group OCAT includes stay-in-business capital expenditure and Origin’s share of Australia Pacific LNG’s OCAT and excludes cash items excluded from Underlying Profit.
Year ended 30 June 2015 ($m)
2014 ($m)
Change ($m)
Change (%)
Underlying EBITDA 2,149 2,139 10 0
Change in working capital (182) 163 (345) (212)
Stay-in-business capital expenditure (306) (309) 3 (1)
Share of APLNG OCAT less EBITDA (64) (55) (9) 16
Exploration expense 29 54 (25) (46)
NSW acquisition-related liabilities (18) (54) 36 (66)
Other 79 120 (41) (34)
Tax paid (109) (17) (92) 541
Group OCAT 12 (including share of APLNG) 1,578 2,041 (463) (23)
Net interest paid (382) (442) 60 (14)
Free cash flow12 1,196 1,599 (403) (25)
Productive Capital12 17,471 16,577 894 5
Group OCAT Ratio12 8.4% 11.5% (27)
Group OCAT decreased by 23% or $463 million to $1,578 million due to higher working capital of $345 million reflecting the final Carbon scheme payment of $300 million and higher tax paid of $92 million driven by timing differences arising on payment of tax instalments. Net interest paid of $382 million was down $60 million as additional interest paid on higher average Net Debt balances (+$174 million) was more than offset by the benefit realised from bringing forward the positive fair value on existing cross currency swaps as these swaps were reset to the market rates in March 2014 (-$76 million) and the receipt of interest income (-$158 million) on Mandatorily Redeemable Cumulative Preference Shares issued by Australia Pacific LNG. Free cash flow available for distributions to shareholders and funding growth decreased by 25%, or by $403 million, to $1,196 million. One of Origin’s internal measures of performance is the Group OCAT Ratio which is an indicator of the cash returns Origin is generating from Productive Capital. Productive Capital in the business, calculated on a 12-month weighted average basis, increased by 5% or $894 million to $17,471 million primarily due to the completion of Contact Energy’s Te Mihi Power Station in May 2014 and its Retail Transformation project in April 2014 and the foreign exchange impact on translation of Contact Energy’s Productive Capital. The Group OCAT ratio for the 12 months ended 30 June 2015 was 8.4%, down from 11.5% at 30 June 2014.
12 Refer to Glossary in Appendix 2.
Page | 26 Origin Energy Limited ABN 30 000 051 696
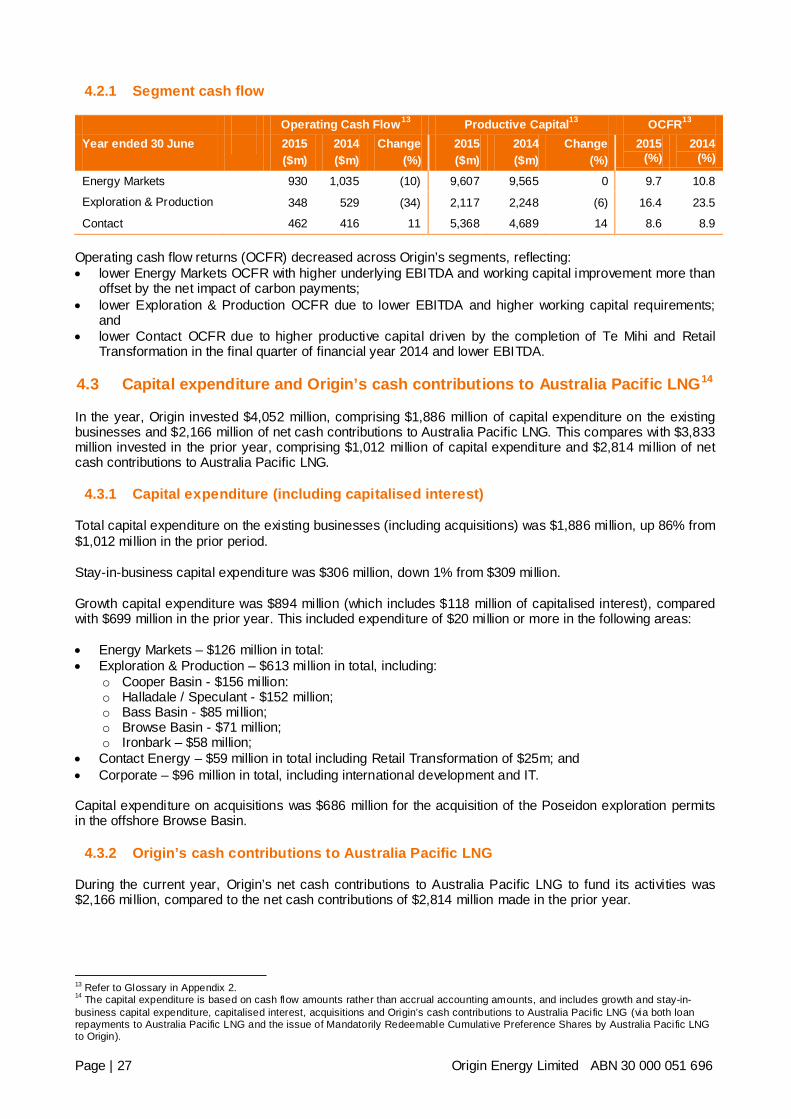
4.2.1 Segment cash flow
Operating Cash Flow13 Productive Capital13 OCFR13 Year ended 30 June
2015 ($m)
2014 ($m)
Change (%)
2015 ($m)
2014 ($m)
Change (%)
2015 (%)
2014 (%)
Energy Markets 930 1,035 (10) 9,607 9,565 0 9.7 10.8
Exploration & Production 348 529 (34) 2,117 2,248 (6) 16.4 23.5
Contact 462 416 11 5,368 4,689 14 8.6 8.9 Operating cash flow returns (OCFR) decreased across Origin’s segments, reflecting: • lower Energy Markets OCFR with higher underlying EBITDA and working capital improvement more than
offset by the net impact of carbon payments; • lower Exploration & Production OCFR due to lower EBITDA and higher working capital requirements;
and • lower Contact OCFR due to higher productive capital driven by the completion of Te Mihi and Retail
Transformation in the final quarter of financial year 2014 and lower EBITDA. 4.3 Capital expenditure and Origin’s cash contributions to Australia Pacific LNG14
In the year, Origin invested $4,052 million, comprising $1,886 million of capital expenditure on the existing businesses and $2,166 million of net cash contributions to Australia Pacific LNG. This compares with $3,833 million invested in the prior year, comprising $1,012 million of capital expenditure and $2,814 million of net cash contributions to Australia Pacific LNG.
4.3.1 Capital expenditure (including capitalised interest)
Total capital expenditure on the existing businesses (including acquisitions) was $1,886 million, up 86% from $1,012 million in the prior period. Stay-in-business capital expenditure was $306 million, down 1% from $309 million. Growth capital expenditure was $894 million (which includes $118 million of capitalised interest), compared with $699 million in the prior year. This included expenditure of $20 million or more in the following areas: • Energy Markets – $126 million in total: • Exploration & Production – $613 million in total, including:
o Cooper Basin - $156 million: o Halladale / Speculant - $152 million; o Bass Basin - $85 million; o Browse Basin - $71 million; o Ironbark – $58 million;
• Contact Energy – $59 million in total including Retail Transformation of $25m; and • Corporate – $96 million in total, including international development and IT. Capital expenditure on acquisitions was $686 million for the acquisition of the Poseidon exploration permits in the offshore Browse Basin.
4.3.2 Origin’s cash contributions to Australia Pacific LNG
During the current year, Origin’s net cash contributions to Australia Pacific LNG to fund its activities was $2,166 million, compared to the net cash contributions of $2,814 million made in the prior year.
13 Refer to Glossary in Appendix 2. 14 The capital expenditure is based on cash flow amounts rather than accrual accounting amounts, and includes growth and stay-in-business capital expenditure, capitalised interest, acquisitions and Origin’s cash contributions to Australia Pacific LNG (via both loan repayments to Australia Pacific LNG and the issue of Mandatorily Redeemable Cumulative Preference Shares by Australia Pacific LNG to Origin).
Page | 27 Origin Energy Limited ABN 30 000 051 696
4.4 Funding and capital management
Origin completed a number of funding initiatives during the period to extend its debt maturity profile and improve its liquidity position. In September 2014, Origin issued €1 billion ($1.4 billion) of hybrid capital securities swapped into Australian dollars. The hybrid is treated as debt for accounting purposes and has received 50% equity credit from both Standard & Poor’s and Moody’s. Proceeds from the hybrid issuance were used to finance Origin’s $686 million acquisition of a 40% interest in two offshore exploration permits, WA-315-P and WA-398-P, the Poseidon permits in the offshore Browse Basin. The balance of the proceeds was used to repay debt. In December 2014, Origin amended $6.6 billion of syndicated loan facilities to reduce the interest rate margin, extend the maturities and increase the limit of the facilities by $750 million to $7.4 billion. The interest cost of the bank loan facilities was reduced by 0.30% per annum and flexibility was added with increased US Dollar drawdown capacity. The terms of the bank loan facilities were extended by 16 months to December 2018 and December 2019 respectively. In March 2015, Origin executed $500 million of guarantee facilities with maturities between March 2018 and March 2020. As at 30 June 2015, Origin has $4.4 billion of committed undrawn debt facilities and cash (excluding Contact Energy and bank guarantees). This liquidity position is more than that required to support Origin’s remaining funding contribution to Australia Pacific LNG and other business initiatives. The total amount drawn down by Australia Pacific LNG from its project finance facility during the period was US$537 million. Capitalised interest on the project finance facility of US$283 million has been recognised during the current period. At 30 June 2015, US$8,305 million of the total US$8,500 million project finance facility had been drawn. Origin either holds debt denominated in, or hedges debt to, Australian dollars, US dollars and NZ dollars to match the currency denomination of cash flow receipts and the functional currency of its various businesses.
4.4.1 Share capital
During the current period, Origin issued an additional 5.98 million shares, raising a total of $79 million including 5.87 million shares under the DRP. The total number of shares on issue was 1,110 million at 30 June 2015. The weighted average number of shares used to calculate basic EPS at 30 June 2015 increased by 5 million to 1,106 million from 1,101 million at 30 June 2014.
4.4.2 Net Debt
Net Debt for the consolidated entity increased by 45% or $4,139 million to $13,273 million from $9,134 million at 30 June 2014. the increase in net debt is primarily due to Origin’s net cash contributions to Australia Pacific LNG ($2,166 million), capital expenditure excluding capitalised interest ($1,768 million, of which $686 million related to the Poseidon acquisition), net cash dividend payment ($722 million, including the payment of a special dividend by Contact), interest payments ($547 million), non-cash debt movements comprising fair value adjustments and foreign currency translation ($652 million), partially offset by cash flows from operating activities ($1,833 million). The non-cash fair value and foreign currency translation movements of debt of $652 million is primarily driven by the impact of foreign currency movements on foreign currency denominated debt used to match expected US dollar earnings from Australia Pacific LNG. Contact net debt was $1,547 million as at 30 June 2015. On 10 August 2015, Origin divested its entire 53.09% interest in Contact Energy and used the proceeds to repay A$1.4 billion of debt and will redeem NZ$200 million of redeemable preference shares. Origin’s net debt at 30 June 2015, adjusted for the deconsolidation of Contact and the repayment of $1.4 billion of debt is $10,297 million compared to the reported consolidated net debt of $13,273 million.
Page | 28 Origin Energy Limited ABN 30 000 051 696
4.4.3 Equity
Shareholders’ Equity 15 decreased by 6% (-$970 million) from $15,129 million at 30 June 2014 to $14,159 million at 30 June 2015. The decrease is predominantly due to the Statutory Loss of $658 million, dividends paid by the parent entity (-$553 million), an increase in non-controlling interests’ share of equity movements (-$249 million), partially offset by reserve movements including foreign currency and hedging (+$406 million) and movement in share capital (+$79 million).
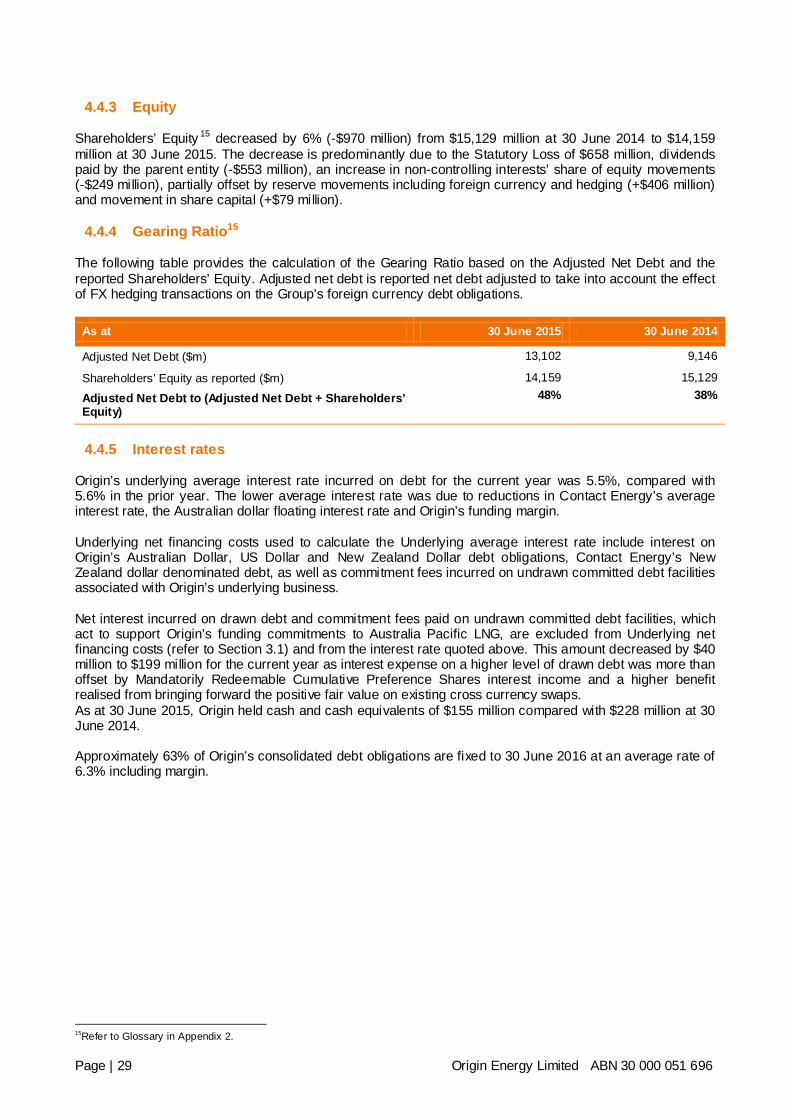
4.4.4 Gearing Ratio15
The following table provides the calculation of the Gearing Ratio based on the Adjusted Net Debt and the reported Shareholders’ Equity. Adjusted net debt is reported net debt adjusted to take into account the effect of FX hedging transactions on the Group’s foreign currency debt obligations.
As at 30 June 2015 30 June 2014
Adjusted Net Debt ($m) 13,102 9,146
Shareholders’ Equity as reported ($m) 14,159 15,129
Adjusted Net Debt to (Adjusted Net Debt + Shareholders’ Equity)
48% 38%
4.4.5 Interest rates
Origin’s underlying average interest rate incurred on debt for the current year was 5.5%, compared with 5.6% in the prior year. The lower average interest rate was due to reductions in Contact Energy’s average interest rate, the Australian dollar floating interest rate and Origin’s funding margin. Underlying net financing costs used to calculate the Underlying average interest rate include interest on Origin’s Australian Dollar, US Dollar and New Zealand Dollar debt obligations, Contact Energy’s New Zealand dollar denominated debt, as well as commitment fees incurred on undrawn committed debt facilities associated with Origin’s underlying business. Net interest incurred on drawn debt and commitment fees paid on undrawn committed debt facilities, which act to support Origin’s funding commitments to Australia Pacific LNG, are excluded from Underlying net financing costs (refer to Section 3.1) and from the interest rate quoted above. This amount decreased by $40 million to $199 million for the current year as interest expense on a higher level of drawn debt was more than offset by Mandatorily Redeemable Cumulative Preference Shares interest income and a higher benefit realised from bringing forward the positive fair value on existing cross currency swaps. As at 30 June 2015, Origin held cash and cash equivalents of $155 million compared with $228 million at 30 June 2014. Approximately 63% of Origin’s consolidated debt obligations are fixed to 30 June 2016 at an average rate of 6.3% including margin.
15Refer to Glossary in Appendix 2.
Page | 29 Origin Energy Limited ABN 30 000 051 696
5. PROSPECTS AND OUTLOOK FOR FUTURE FINANCIAL YEARS
5.1 Prospects
The 2016 financial year will be a transitional year for Origin as Energy Markets matures, there is no contribution from Contact, and LNG production in Queensland commences. While the Australia Pacific LNG project is expected to commence sustained production from Train 1 from the second quarter of the 2016 financial year, revenues and expenses from the export of LNG are not expected to be recognised in the income statement until the date on which the performance tests for Train 1 under the Bechtel EPC contract are satisfied (Bechtel Performance Date), which is not expected to occur until the second half of the 2016 financial year. The 2017 financial year will be the first full year of operations from both LNG trains. During this period Origin's key priorities are to: • Improve returns in the energy markets business; • Deliver growth in the integrated gas business; • Grow capabilities and increase investments in renewable energy; and • Maintain adequate funding and effective capital management. Notwithstanding the significant reduction in oil prices, these priorities remain appropriate albeit with some modifications implemented to reflect the lower than previously expected growth in revenues, earnings and cash flow that will occur should oil prices remain at current depressed levels. Looking forward, lower oil prices will impact Origin in a number of different ways, driven primarily by the fact that LNG prices are linked to oil prices. As LNG production ramps up in Queensland, East Coast gas prices will move to export parity, albeit at a lower level than previously expected if current low oil prices persist. Origin expects to continue to benefit from increased gas prices in its Exploration & Production and Energy Markets businesses, including the commencement of gas sales to LNG projects at oil-linked prices. From 1 July 2015, Origin’s earnings on a large proportion of its oil and condensate production will reflect the fixed price under the oil and condensate forward sale agreements16, which represents the prevailing average forward oil price at the time of executing the transactions of US$89/bbl, discounted to US$62.40/bbl to reflect the receipt of the sales proceeds upfront. If oil prices remain at current spot prices, the linkage of LNG prices to oil prices will significantly reduce the increase in contributions from Australia Pacific LNG relative to prior expectations. At A$100/bbl (oil price at the time of FID), Origin expects its share of distributable cash flow from Australia Pacific LNG to be around $900 million per annum on average from the 2017 financial year. Every A$10/bbl change in the oil price will change Origin’s expected distribution from Australia Pacific LNG by $200 million. Under the agreement that Australia Pacific LNG entered into with QGC in 2010, Australia Pacific LNG will sell to QGC its share of gas production from the ATP620/648 fields for an initial period of 15 months which extends through the balance of the 2016 financial year. The price of gas sold to QGC under this agreement reflects the linkage to oil prices and a fixed component which allows QGC to recover a return on capital invested in its export project. The fall in oil prices has resulted in a significant reduction in the revenue that Australia Pacific LNG is expecting to receive under this agreement. In this changed environment, with the fall in oil prices potentially reducing growth in earnings and cash flow relative to prior expectations, the continued implementation of Origin's key priorities has been moderated to conserve cash flow and accelerate cost reductions. To this end, Origin has: • combined the Exploration & Production and LNG businesses into a single business segment called
Integrated Gas from 1 July 2015; • continued to reduce operating costs and capital expenditure in Energy Markets with further reductions in
Natural Gas and Electricity cost to serve and Generation Operating Costs by $65 million and total capital expenditure by $50 million in the 2016 financial year;
16 In the 2013 financial year Origin entered into agreements to sell approximately 60% of its future oil and condensate over a 72 month period commencing 1 July 2015. Upon entry into the agreements, Origin received $482 million.
Page | 30 Origin Energy Limited ABN 30 000 051 696
• limited capital expenditure in the existing Exploration & Production business to permit and joint venture commitments and projects that increase gas production into growing gas demand in Australia;
• continued the good progress on achieving the planned $1 billion per annum reduction in Australia Pacific LNG’s upstream total cost structure as it transitions from project delivery to operations, which will take costs to levels consistent with previous guidance17;
• initiated a company-wide project to further improve efficiency and reduce cash costs by $200 million from the 2017 financial year;
• further constrained spend on international development activities; and • deferred planned investments in new systems and technology at an enterprise level. The divestment of Origin’s entire 53.09% interest in Contact Energy is consistent with Origin continuing to take actions to preserve financial flexibility in an environment of low oil prices.
5.1.1 Improving returns in the energy markets business
In the Energy Markets, Origin expects to improve returns by: • leveraging its competitive and flexible gas portfolio to increase sales in Natural Gas. Energy Markets is
expected to maintain the strong Natural Gas earnings achieved in the 2015 financial year with the increase in sales to LNG projects replacing the reduction in ramp gas benefit and the resulting increase in energy procurement costs;
• managing margins and customer position in Electricity amidst continued competition and discounting and maintaining a competitive cost of energy through a flexible fuel and generation portfolio;
• continuing to make reductions in Natural Gas and Electricity operating costs and capital expenditure to increase cash generation;
• building customer loyalty and trust by providing a better customer experience through simplifying processes and using new technologies to engage customers and by extending the range of energy products and services offered;
• growing solar and energy services with the aim of becoming the leading provider of solar products and services; and
• leveraging Origin’s flexible energy portfolio to develop or support the development of additional renewable generation required to meet the LRET target.
5.1.2 Delivering growth in the Integrated Gas business
Australia Pacific LNG continues to make good progress on the delivery of the CSG to LNG project and was 97% complete on the Upstream and 92% on the Downstream parts of the project as at 30 June 2015. As of 30 June 2015, $25 billion18 had been spent. Sustained production of LNG from Train 1 is expected to be achieved from the second quarter of the 2016 financial year and from Train 2 approximately 6 months later. Estimated costs to complete are not expected to be materially different from budget19. Australia Pacific LNG is transitioning from project delivery to ongoing sustainable development and operations and is focused on delivering reductions in the upstream project’s total cost structure as planned. Australia Pacific LNG has implemented initiatives to reduce total annual costs by approximately $650 million from Phase 1 levels and is targeting the implementation of the remaining $350 million of annual recurring savings by the end of financial year 2016. As foreshadowed in August 2014, the availability of ramp gas in Queensland allowed Origin to use less gas from its own production and invest in growing production for future years. BassGas is expected to increase production in the 2016 financial year as the Yolla-5 and Yolla-6 development wells enter into production. This is expected to be more than offset by production decreases due to field decline at Otway and scheduled maintenance shutdowns at Otway for 28 days and Kupe for 30 days. The appraisal and development focus is on executing projects with the highest returns and shorter payback periods. The success of the Speculant drilling program in the Otway Basin and the expected increase in demand for gas in Eastern Australia will see production from the Otway Basin increase in the 2017 financial year as the Halladale and Speculant wells enter production and the Ironbark field prioritised for development.
17 As provided in the Update on Amended Loan Facilities and Australia Pacific LNG on 11 December 2014. 18 Includes an unfavourable foreign exchange translation impact of A$362 million relative to project cost estimates announced in February 2013, which were based on 31 December 2012 exchange rates and around $500 million of accrued expenses. 19 As announced in February 2013, based on December 2012 exchange rates.
Page | 31 Origin Energy Limited ABN 30 000 051 696
The Senecio and Waitsia drilling programs in the Perth Basin will continue with the prospect for significant further increases in reserves.
5.1.3 Growing capabilities and increasing investment in renewable energy
In Australia, Origin’s energy portfolio provides flexibility for Origin to develop or support the development of the additional renewable energy required to meet the LRET target. Internationally, Origin is limiting spend to a modest level of investment in renewable energy opportunities in Chile and Indonesia. In Chile, Origin increased its investment in Energia Andina by 9.9% to 49.9%. At the same time, Energia Andina acquired a 40% stake in the 69 MW Javiera solar project in Chile’s Atacama Desert which commenced operations in the financial year.
5.1.4 Maintain adequate funding and effective capital management
Given the potential for lower oil prices to reduce the expected increase in Origin’s earnings and cash flow, Origin is focused on: • maintaining sufficient liquidity to meet committed capital and funding requirements; • ensuring cash flow from existing businesses is sufficient to service debt irrespective of oil prices; • delivering on commitments of:
o no equity raising to fund Australia Pacific LNG; o maintain its dividend policy of the greater of 50 cents per share to 60% of Underlying NPAT; o maintain an investment grade rating; o maintain stay-in-business capital expenditure to ensure the competitiveness of the business and o develop upstream projects with the highest returns and shortest payback periods.
If the current low oil prices are sustained, Origin will continue to take actions to meet its commitments and preserve flexibility to improve returns to shareholders by: • continuing to reduce capital and operating costs and • realigning debt across group entities. 5.2 Outlook
In the 2016 financial year, Origin expects: • Similar contributions from Energy Markets to that achieved in the 2015 financial year as the benefit of
ramp gas is largely replaced with increasing natural gas sales to LNG projects. The ongoing impact of intense competition in retail markets is expected to continue. Energy Markets will focus on reducing operating costs in Electricity and Natural Gas and invest in growing new solar and energy services;
• Contact contributions to cease from 10 August and interest savings on the reduction in debt from net sales proceeds to commence from this date;
• Contributions from the Integrated Gas business to reflect: o increased production from the Yolla 5 and 6 development wells at BassGas more than offset by
decreased production from Otway and Kupe. o earnings from most of oil and condensate production in the 2016 financial year to not be
impacted by the movements in oil price and will reflect the fixed price of US$62.40/bbl, however cash flow from the sale of liquids will be lower than received in 2015 financial year as proceeds from the forward sale agreement were received at the time of the agreement in the 2013 financial year;under a prior agreement, Australia Pacific LNG to sell to QGC its share of gas production from the ATP620/648 fields in the 2016 financial year. The fall in oil prices has resulted in a significant reduction in the revenue that Australia Pacific LNG is expecting to receive from the sale of gas to QGC;
o contribution to earnings from the sale of LNG to commence in the second half of the year; • Earnings from the sale of LNG to be more than offset by the disproportionate recognition of depreciation
and interest expense during the ramp up to full production in this period. • Origin’s remaining cash contribution to Australia Pacific LNG to be around $1.8 billion, an increase of
$550 million from previous guidance provided at the time of the half year results. This is primarily due to the reduction in revenue (approximately $300 million) as a result of lower oil prices and the impact of previously advised change in expected commencement of sustained production from Train 1 from the first quarter of the 2016 financial year to the second quarter. The remainder ($250 million) is due to the potential funding of sustain phase expenditure, previously assumed to be deferred, to take advantage of
Page | 32 Origin Energy Limited ABN 30 000 051 696

additional LNG production capacity that Australia Pacific LNG is anticipated to have. Estimated project cost for Australia Pacific LNG to the start of the Train 2 production is not expected to be materially different from the budget estimates20. Sustain phase capital and operating expenditure during steady state operations are consistent with previous guidance provided in December 2014.
• Growth capital expenditure21 in the existing businesses excluding acquisitions to reduce to around $650 million, primarily to meet permit commitments and complete approved upstream projects.
• The Corporate segment to recognise lower cost recoveries in the 2016 financial year from Australia Pacific LNG under the corporate service provider agreement.
• With the completion of a period of significant development, its cash costs will be reduced in line with future business priorities. A company-wide project is expected to deliver a reduction of $200 million in cash costs from the 2017 financial year. Cost savings achieved in the 2016 financial year are expected to be largely offset by restructuring costs.
20 As announced in February 2013, based on December 2012 exchange rates. 21 Excluding capitalised interest.
Page | 33 Origin Energy Limited ABN 30 000 051 696
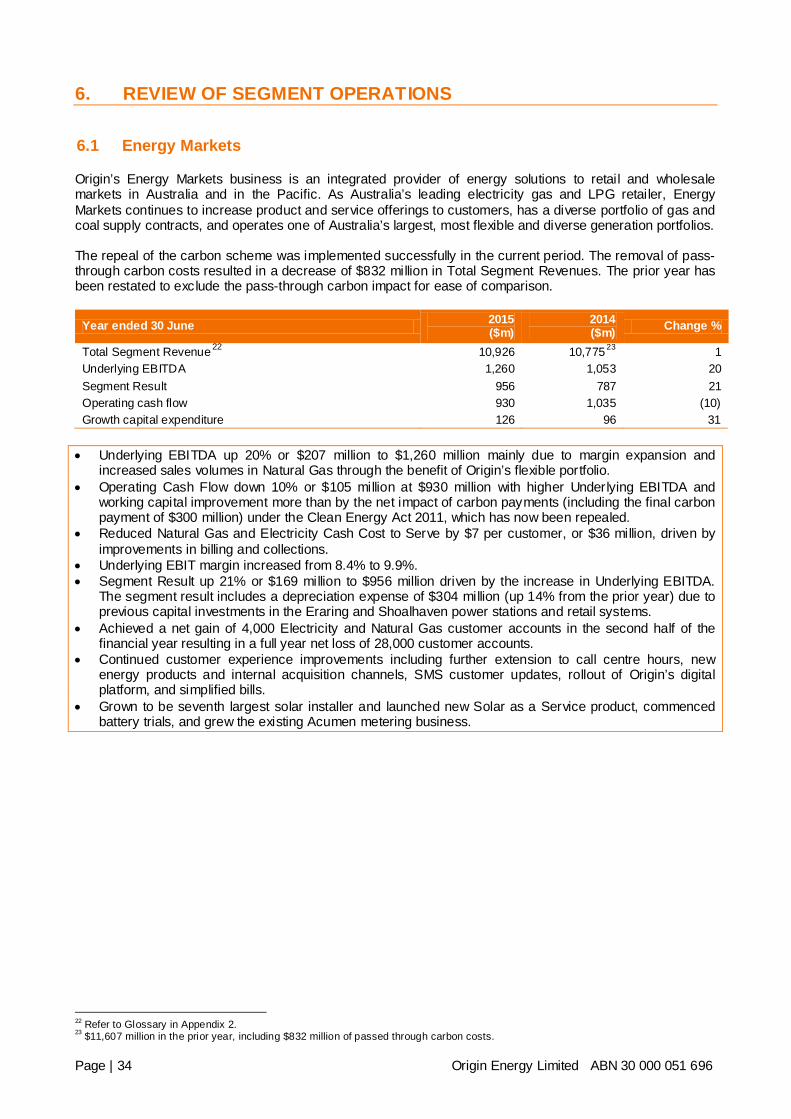
6. REVIEW OF SEGMENT OPERATIONS
6.1 Energy Markets
Origin’s Energy Markets business is an integrated provider of energy solutions to retail and wholesale markets in Australia and in the Pacific. As Australia’s leading electricity gas and LPG retailer, Energy Markets continues to increase product and service offerings to customers, has a diverse portfolio of gas and coal supply contracts, and operates one of Australia’s largest, most flexible and diverse generation portfolios. The repeal of the carbon scheme was implemented successfully in the current period. The removal of pass-through carbon costs resulted in a decrease of $832 million in Total Segment Revenues. The prior year has been restated to exclude the pass-through carbon impact for ease of comparison.
Year ended 30 June 2015 ($m)
2014 ($m) Change %
Total Segment Revenue22 10,926 10,77523 1 Underlying EBITDA 1,260 1,053 20 Segment Result 956 787 21 Operating cash flow 930 1,035 (10) Growth capital expenditure 126 96 31
• Underlying EBITDA up 20% or $207 million to $1,260 million mainly due to margin expansion and
increased sales volumes in Natural Gas through the benefit of Origin’s flexible portfolio. • Operating Cash Flow down 10% or $105 million at $930 million with higher Underlying EBITDA and
working capital improvement more than by the net impact of carbon payments (including the final carbon payment of $300 million) under the Clean Energy Act 2011, which has now been repealed.
• Reduced Natural Gas and Electricity Cash Cost to Serve by $7 per customer, or $36 million, driven by improvements in billing and collections.
• Underlying EBIT margin increased from 8.4% to 9.9%. • Segment Result up 21% or $169 million to $956 million driven by the increase in Underlying EBITDA.
The segment result includes a depreciation expense of $304 million (up 14% from the prior year) due to previous capital investments in the Eraring and Shoalhaven power stations and retail systems.
• Achieved a net gain of 4,000 Electricity and Natural Gas customer accounts in the second half of the financial year resulting in a full year net loss of 28,000 customer accounts.
• Continued customer experience improvements including further extension to call centre hours, new energy products and internal acquisition channels, SMS customer updates, rollout of Origin’s digital platform, and simplified bills.
• Grown to be seventh largest solar installer and launched new Solar as a Service product, commenced battery trials, and grew the existing Acumen metering business.
22 Refer to Glossary in Appendix 2. 23 $11,607 million in the prior year, including $832 million of passed through carbon costs.
Page | 34 Origin Energy Limited ABN 30 000 051 696
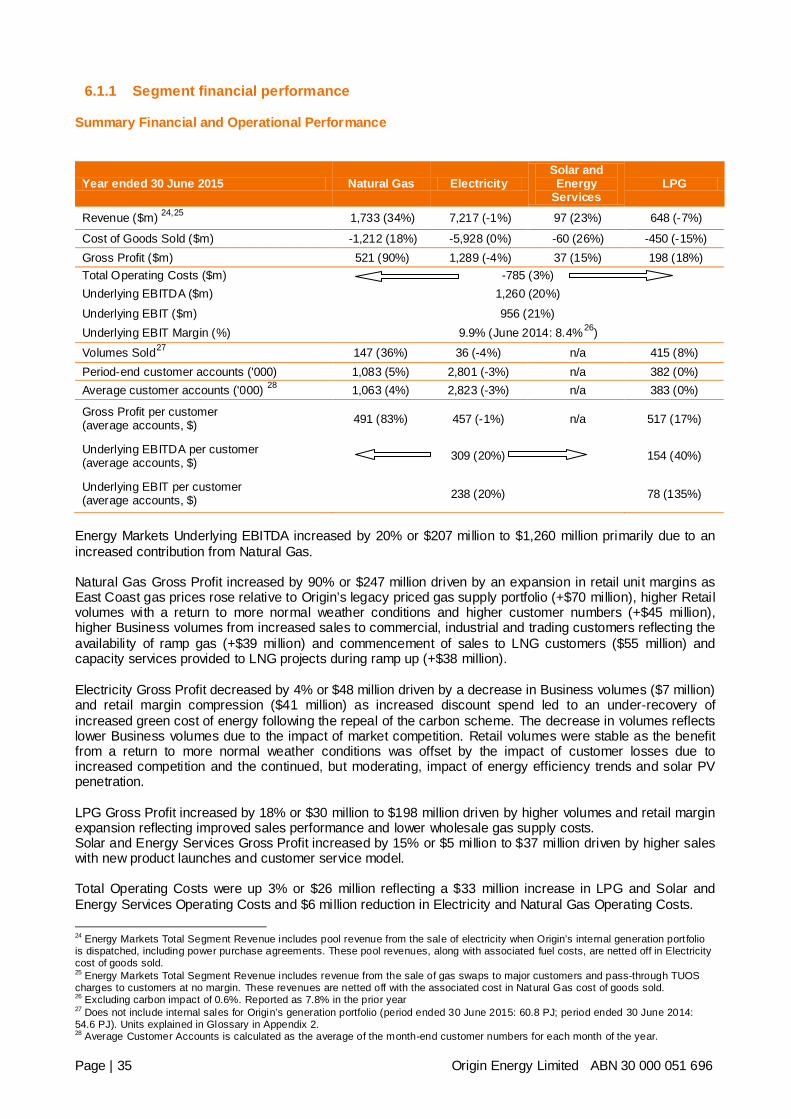
6.1.1 Segment financial performance
Summary Financial and Operational Performance
Year ended 30 June 2015 Natural Gas Electricity Solar and Energy
Services LPG
Revenue ($m) 24,25 1,733 (34%) 7,217 (-1%) 97 (23%) 648 (-7%)
Cost of Goods Sold ($m) -1,212 (18%) -5,928 (0%) -60 (26%) -450 (-15%) Gross Profit ($m) 521 (90%) 1,289 (-4%) 37 (15%) 198 (18%) Total Operating Costs ($m) -785 (3%) Underlying EBITDA ($m) 1,260 (20%) Underlying EBIT ($m) 956 (21%) Underlying EBIT Margin (%) 9.9% (June 2014: 8.4%26) Volumes Sold27 147 (36%) 36 (-4%) n/a 415 (8%) Period-end customer accounts ('000) 1,083 (5%) 2,801 (-3%) n/a 382 (0%) Average customer accounts ('000) 28 1,063 (4%) 2,823 (-3%) n/a 383 (0%)
Gross Profit per customer (average accounts, $) 491 (83%) 457 (-1%) n/a 517 (17%)
Underlying EBITDA per customer (average accounts, $) 309 (20%) 154 (40%)
Underlying EBIT per customer (average accounts, $) 238 (20%) 78 (135%)
Energy Markets Underlying EBITDA increased by 20% or $207 million to $1,260 million primarily due to an increased contribution from Natural Gas. Natural Gas Gross Profit increased by 90% or $247 million driven by an expansion in retail unit margins as East Coast gas prices rose relative to Origin’s legacy priced gas supply portfolio (+$70 million), higher Retail volumes with a return to more normal weather conditions and higher customer numbers (+$45 million), higher Business volumes from increased sales to commercial, industrial and trading customers reflecting the availability of ramp gas (+$39 million) and commencement of sales to LNG customers ($55 million) and capacity services provided to LNG projects during ramp up (+$38 million). Electricity Gross Profit decreased by 4% or $48 million driven by a decrease in Business volumes ($7 million) and retail margin compression ($41 million) as increased discount spend led to an under-recovery of increased green cost of energy following the repeal of the carbon scheme. The decrease in volumes reflects lower Business volumes due to the impact of market competition. Retail volumes were stable as the benefit from a return to more normal weather conditions was offset by the impact of customer losses due to increased competition and the continued, but moderating, impact of energy efficiency trends and solar PV penetration. LPG Gross Profit increased by 18% or $30 million to $198 million driven by higher volumes and retail margin expansion reflecting improved sales performance and lower wholesale gas supply costs. Solar and Energy Services Gross Profit increased by 15% or $5 million to $37 million driven by higher sales with new product launches and customer service model. Total Operating Costs were up 3% or $26 million reflecting a $33 million increase in LPG and Solar and Energy Services Operating Costs and $6 million reduction in Electricity and Natural Gas Operating Costs.
24 Energy Markets Total Segment Revenue includes pool revenue from the sale of electricity when Origin’s internal generation port folio is dispatched, including power purchase agreements. These pool revenues, along with associated fuel costs, are netted off in Electricity cost of goods sold. 25 Energy Markets Total Segment Revenue includes revenue from the sale of gas swaps to major customers and pass-through TUOS charges to customers at no margin. These revenues are netted off with the associated cost in Natural Gas cost of goods sold. 26 Excluding carbon impact of 0.6%. Reported as 7.8% in the prior year 27 Does not include internal sales for Origin’s generation portfolio (period ended 30 June 2015: 60.8 PJ; period ended 30 June 2014: 54.6 PJ). Units explained in Glossary in Appendix 2. 28 Average Customer Accounts is calculated as the average of the month-end customer numbers for each month of the year.
Page | 35 Origin Energy Limited ABN 30 000 051 696
Solar and Energy Services Operating Costs increased $20 million primarily reflecting remediation costs associated with early model Solar PV inverters and increased investments in capabilities to grow new products and services to customers. LPG Operating Costs increased $13 million driven by the Asia Pacific growth strategy and the translation impact of a weaker Australian dollar. The $6 million reduction in Electricity and Natural Gas Operating Costs is driven by a $36 million reduction in cash operating costs reflecting continued improvements in the operations of the retail business, offset by the non-cash Transitional Services Arrangement (TSA) provision release of $30 million reducing cost in the prior year. Customer experience remains a priority for the retail business with key operational improvements during the period and increased sales through internal channels (see section 6.1.5). Customer experience improvements included further extension to call centre hours, new energy products and internal acquisition channels, SMS customer updates, rollout of Origin’s digital platform, and simplified bills. Origin’s customer position declined by 28,000 Electricity and Natural Gas customer accounts during the period. Customer losses were driven by continued strong retail competition in Victoria and increasing competition in NSW, with 75,000 Electricity customer account losses. This was offset by an increase of 47,000 Natural Gas customer accounts, in NSW, Victoria and Queensland. The second half of the financial year delivered a net gain of 4,000 customer accounts, compared to a net loss of 32,000 customer accounts in the first half. Energy Markets’ Underlying EBIT margin increased from 8.4% at 30 June 2014 to 9.9%.
Page | 36 Origin Energy Limited ABN 30 000 051 696
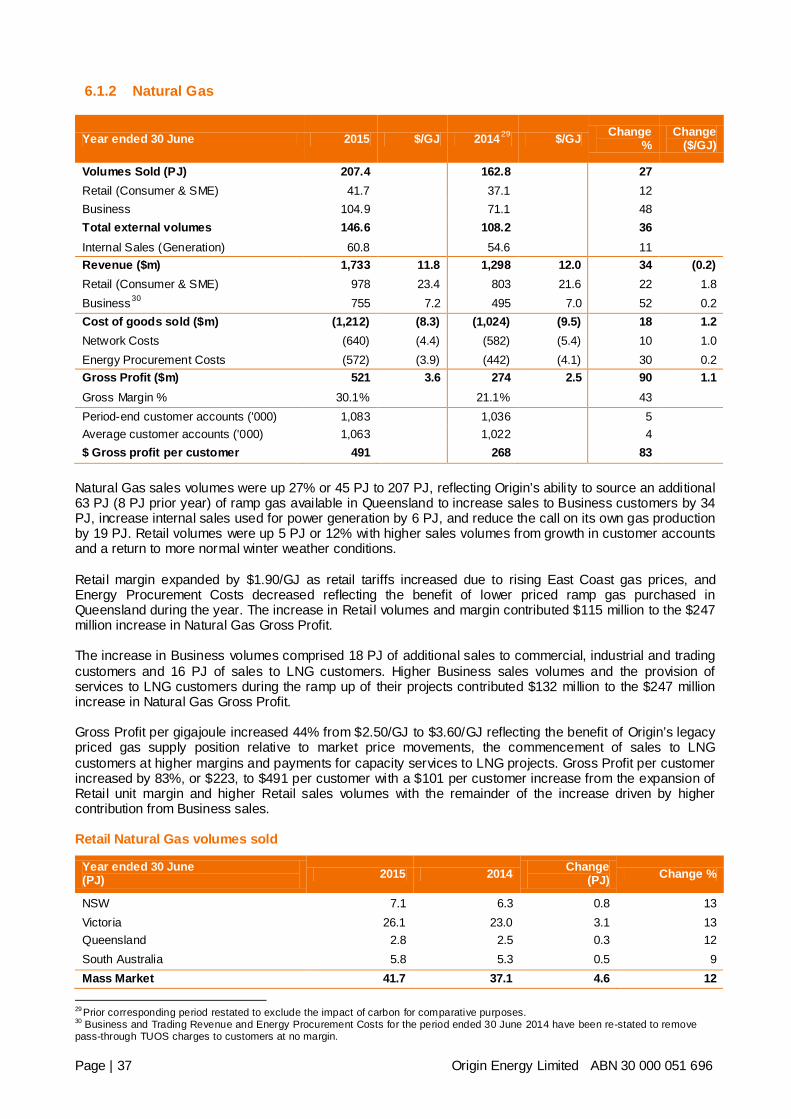
6.1.2 Natural Gas
Year ended 30 June 2015 $/GJ 2014 29 $/GJ Change %
Change ($/GJ)
Volumes Sold (PJ) 207.4 162.8 27 Retail (Consumer & SME) 41.7 37.1 12 Business 104.9 71.1 48 Total external volumes 146.6 108.2 36 Internal Sales (Generation) 60.8 54.6 11 Revenue ($m) 1,733 11.8 1,298 12.0 34 (0.2) Retail (Consumer & SME) 978 23.4 803 21.6 22 1.8 Business30 755 7.2 495 7.0 52 0.2 Cost of goods sold ($m) (1,212) (8.3) (1,024) (9.5) 18 1.2 Network Costs (640) (4.4) (582) (5.4) 10 1.0 Energy Procurement Costs (572) (3.9) (442) (4.1) 30 0.2 Gross Profit ($m) 521 3.6 274 2.5 90 1.1 Gross Margin % 30.1% 21.1% 43 Period-end customer accounts ('000) 1,083 1,036 5 Average customer accounts ('000) 1,063 1,022 4 $ Gross profit per customer 491 268 83
Natural Gas sales volumes were up 27% or 45 PJ to 207 PJ, reflecting Origin’s ability to source an additional 63 PJ (8 PJ prior year) of ramp gas available in Queensland to increase sales to Business customers by 34 PJ, increase internal sales used for power generation by 6 PJ, and reduce the call on its own gas production by 19 PJ. Retail volumes were up 5 PJ or 12% with higher sales volumes from growth in customer accounts and a return to more normal winter weather conditions. Retail margin expanded by $1.90/GJ as retail tariffs increased due to rising East Coast gas prices, and Energy Procurement Costs decreased reflecting the benefit of lower priced ramp gas purchased in Queensland during the year. The increase in Retail volumes and margin contributed $115 million to the $247 million increase in Natural Gas Gross Profit. The increase in Business volumes comprised 18 PJ of additional sales to commercial, industrial and trading customers and 16 PJ of sales to LNG customers. Higher Business sales volumes and the provision of services to LNG customers during the ramp up of their projects contributed $132 million to the $247 million increase in Natural Gas Gross Profit. Gross Profit per gigajoule increased 44% from $2.50/GJ to $3.60/GJ reflecting the benefit of Origin’s legacy priced gas supply position relative to market price movements, the commencement of sales to LNG customers at higher margins and payments for capacity services to LNG projects. Gross Profit per customer increased by 83%, or $223, to $491 per customer with a $101 per customer increase from the expansion of Retail unit margin and higher Retail sales volumes with the remainder of the increase driven by higher contribution from Business sales. Retail Natural Gas volumes sold
Year ended 30 June (PJ) 2015 2014 Change
(PJ) Change %
NSW 7.1 6.3 0.8 13 Victoria 26.1 23.0 3.1 13 Queensland 2.8 2.5 0.3 12 South Australia 5.8 5.3 0.5 9 Mass Market 41.7 37.1 4.6 12
29 Prior corresponding period restated to exclude the impact of carbon for comparative purposes. 30 Business and Trading Revenue and Energy Procurement Costs for the period ended 30 June 2014 have been re-stated to remove pass-through TUOS charges to customers at no margin.
Page | 37 Origin Energy Limited ABN 30 000 051 696
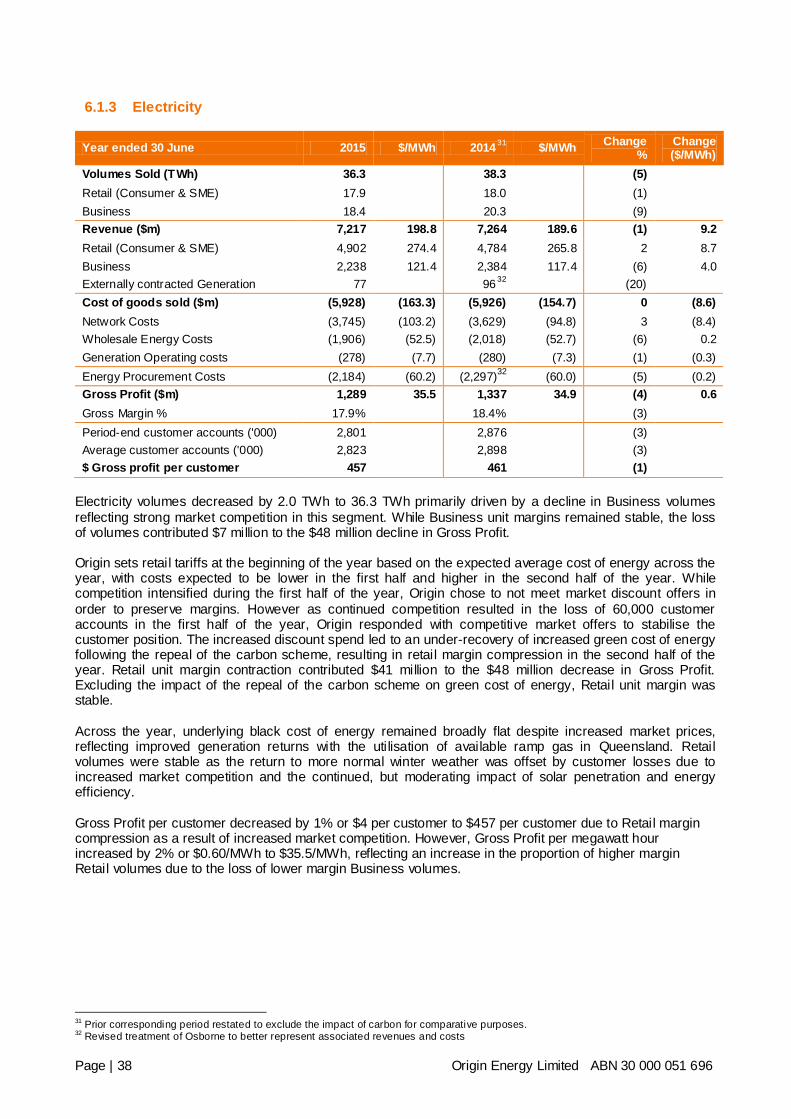
6.1.3 Electricity
Year ended 30 June 2015 $/MWh 2014 31 $/MWh Change %
Change ($/MWh)
Volumes Sold (TWh) 36.3 38.3 (5) Retail (Consumer & SME) 17.9 18.0 (1) Business 18.4 20.3 (9) Revenue ($m) 7,217 198.8 7,264 189.6 (1) 9.2 Retail (Consumer & SME) 4,902 274.4 4,784 265.8 2 8.7 Business 2,238 121.4 2,384 117.4 (6) 4.0 Externally contracted Generation 77 9632 (20) Cost of goods sold ($m) (5,928) (163.3) (5,926) (154.7) 0 (8.6) Network Costs (3,745) (103.2) (3,629) (94.8) 3 (8.4) Wholesale Energy Costs (1,906) (52.5) (2,018) (52.7) (6) 0.2 Generation Operating costs (278) (7.7) (280) (7.3) (1) (0.3) Energy Procurement Costs (2,184) (60.2) (2,297)32 (60.0) (5) (0.2) Gross Profit ($m) 1,289 35.5 1,337 34.9 (4) 0.6 Gross Margin % 17.9% 18.4% (3) Period-end customer accounts ('000) 2,801 2,876 (3) Average customer accounts ('000) 2,823 2,898 (3) $ Gross profit per customer 457 461 (1)
Electricity volumes decreased by 2.0 TWh to 36.3 TWh primarily driven by a decline in Business volumes reflecting strong market competition in this segment. While Business unit margins remained stable, the loss of volumes contributed $7 million to the $48 million decline in Gross Profit. Origin sets retail tariffs at the beginning of the year based on the expected average cost of energy across the year, with costs expected to be lower in the first half and higher in the second half of the year. While competition intensified during the first half of the year, Origin chose to not meet market discount offers in order to preserve margins. However as continued competition resulted in the loss of 60,000 customer accounts in the first half of the year, Origin responded with competitive market offers to stabilise the customer position. The increased discount spend led to an under-recovery of increased green cost of energy following the repeal of the carbon scheme, resulting in retail margin compression in the second half of the year. Retail unit margin contraction contributed $41 million to the $48 million decrease in Gross Profit. Excluding the impact of the repeal of the carbon scheme on green cost of energy, Retail unit margin was stable. Across the year, underlying black cost of energy remained broadly flat despite increased market prices, reflecting improved generation returns with the utilisation of available ramp gas in Queensland. Retail volumes were stable as the return to more normal winter weather was offset by customer losses due to increased market competition and the continued, but moderating impact of solar penetration and energy efficiency. Gross Profit per customer decreased by 1% or $4 per customer to $457 per customer due to Retail margin compression as a result of increased market competition. However, Gross Profit per megawatt hour increased by 2% or $0.60/MWh to $35.5/MWh, reflecting an increase in the proportion of higher margin Retail volumes due to the loss of lower margin Business volumes.
31 Prior corresponding period restated to exclude the impact of carbon for comparative purposes. 32 Revised treatment of Osborne to better represent associated revenues and costs
Page | 38 Origin Energy Limited ABN 30 000 051 696
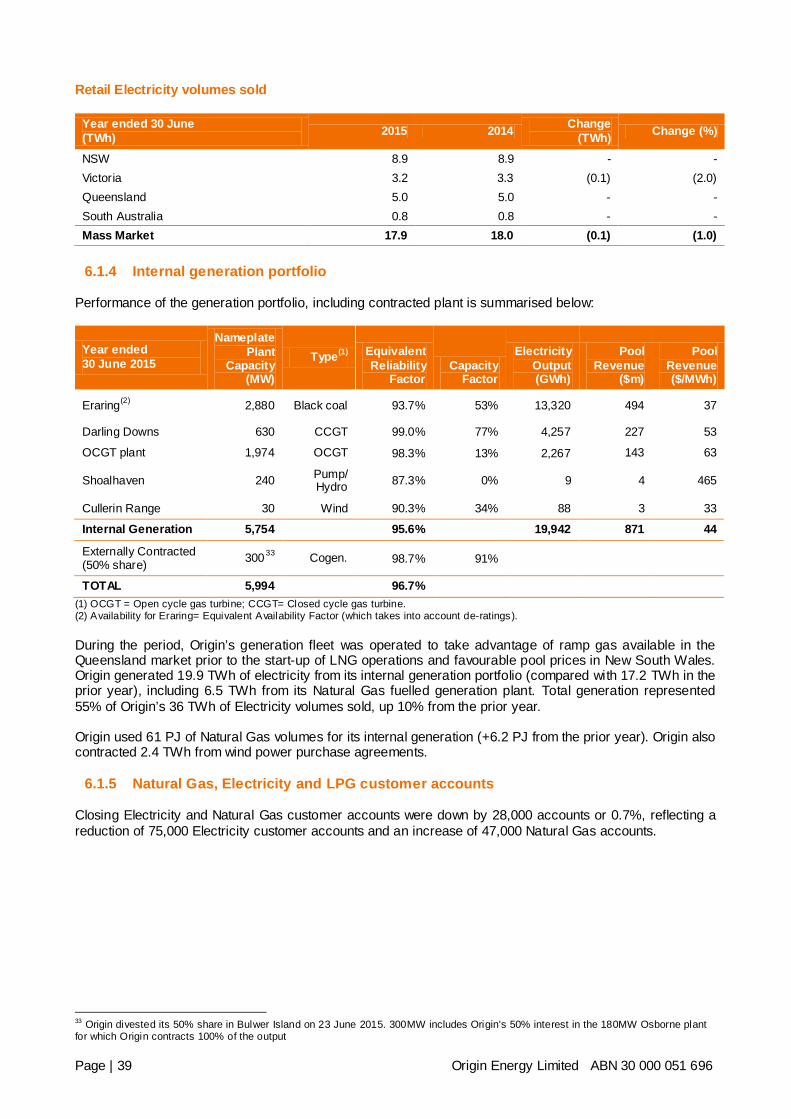
Retail Electricity volumes sold
Year ended 30 June (TWh) 2015 2014 Change
(TWh) Change (%)
NSW 8.9 8.9 - - Victoria 3.2 3.3 (0.1) (2.0) Queensland 5.0 5.0 - - South Australia 0.8 0.8 - - Mass Market 17.9 18.0 (0.1) (1.0)
6.1.4 Internal generation portfolio
Performance of the generation portfolio, including contracted plant is summarised below:
Year ended 30 June 2015
Nameplate Plant
Capacity (MW)
Type(1) Equivalent Reliability
Factor Capacity
Factor
Electricity Output (GWh)
Pool Revenue
($m)
Pool Revenue ($/MWh)
Eraring(2) 2,880 Black coal 93.7% 53% 13,320 494 37
Darling Downs 630 CCGT 99.0% 77% 4,257 227 53
OCGT plant 1,974 OCGT 98.3% 13% 2,267 143 63
Shoalhaven 240 Pump/ Hydro 87.3% 0% 9 4 465
Cullerin Range 30 Wind 90.3% 34% 88 3 33
Internal Generation 5,754 95.6% 19,942 871 44
Externally Contracted (50% share) 30033 Cogen. 98.7% 91%
TOTAL 5,994 96.7%
(1) OCGT = Open cycle gas turbine; CCGT= Closed cycle gas turbine. (2) Availability for Eraring= Equivalent Availability Factor (which takes into account de-ratings). During the period, Origin’s generation fleet was operated to take advantage of ramp gas available in the Queensland market prior to the start-up of LNG operations and favourable pool prices in New South Wales. Origin generated 19.9 TWh of electricity from its internal generation portfolio (compared with 17.2 TWh in the prior year), including 6.5 TWh from its Natural Gas fuelled generation plant. Total generation represented 55% of Origin’s 36 TWh of Electricity volumes sold, up 10% from the prior year. Origin used 61 PJ of Natural Gas volumes for its internal generation (+6.2 PJ from the prior year). Origin also contracted 2.4 TWh from wind power purchase agreements.
6.1.5 Natural Gas, Electricity and LPG customer accounts
Closing Electricity and Natural Gas customer accounts were down by 28,000 accounts or 0.7%, reflecting a reduction of 75,000 Electricity customer accounts and an increase of 47,000 Natural Gas accounts.
33 Origin divested its 50% share in Bulwer Island on 23 June 2015. 300MW includes Origin’s 50% interest in the 180MW Osborne plant for which Origin contracts 100% of the output
Page | 39 Origin Energy Limited ABN 30 000 051 696
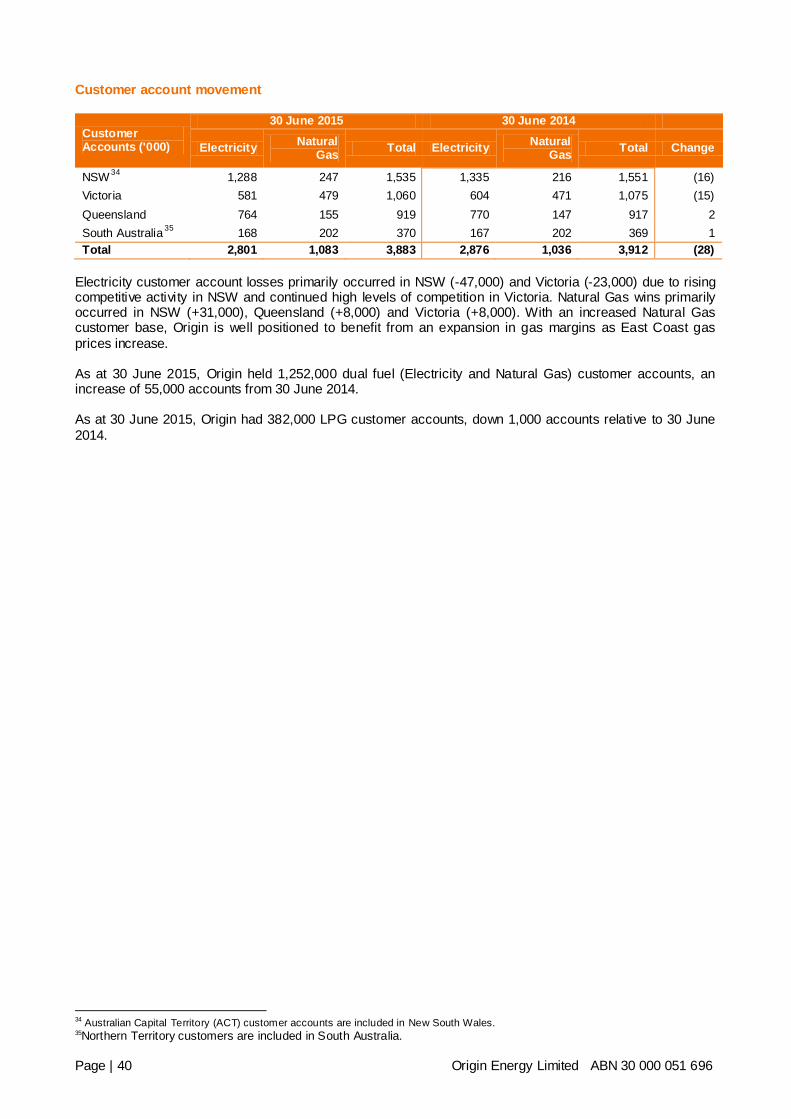
Customer account movement
Customer Accounts ('000)
30 June 2015 30 June 2014
Electricity Natural Gas Total Electricity Natural
Gas Total Change
NSW 34 1,288 247 1,535 1,335 216 1,551 (16) Victoria 581 479 1,060 604 471 1,075 (15) Queensland 764 155 919 770 147 917 2 South Australia35 168 202 370 167 202 369 1 Total 2,801 1,083 3,883 2,876 1,036 3,912 (28)
Electricity customer account losses primarily occurred in NSW (-47,000) and Victoria (-23,000) due to rising competitive activity in NSW and continued high levels of competition in Victoria. Natural Gas wins primarily occurred in NSW (+31,000), Queensland (+8,000) and Victoria (+8,000). With an increased Natural Gas customer base, Origin is well positioned to benefit from an expansion in gas margins as East Coast gas prices increase. As at 30 June 2015, Origin held 1,252,000 dual fuel (Electricity and Natural Gas) customer accounts, an increase of 55,000 accounts from 30 June 2014. As at 30 June 2015, Origin had 382,000 LPG customer accounts, down 1,000 accounts relative to 30 June 2014.
34 Australian Capital Territory (ACT) customer accounts are included in New South Wales. 35Northern Territory customers are included in South Australia.
Page | 40 Origin Energy Limited ABN 30 000 051 696
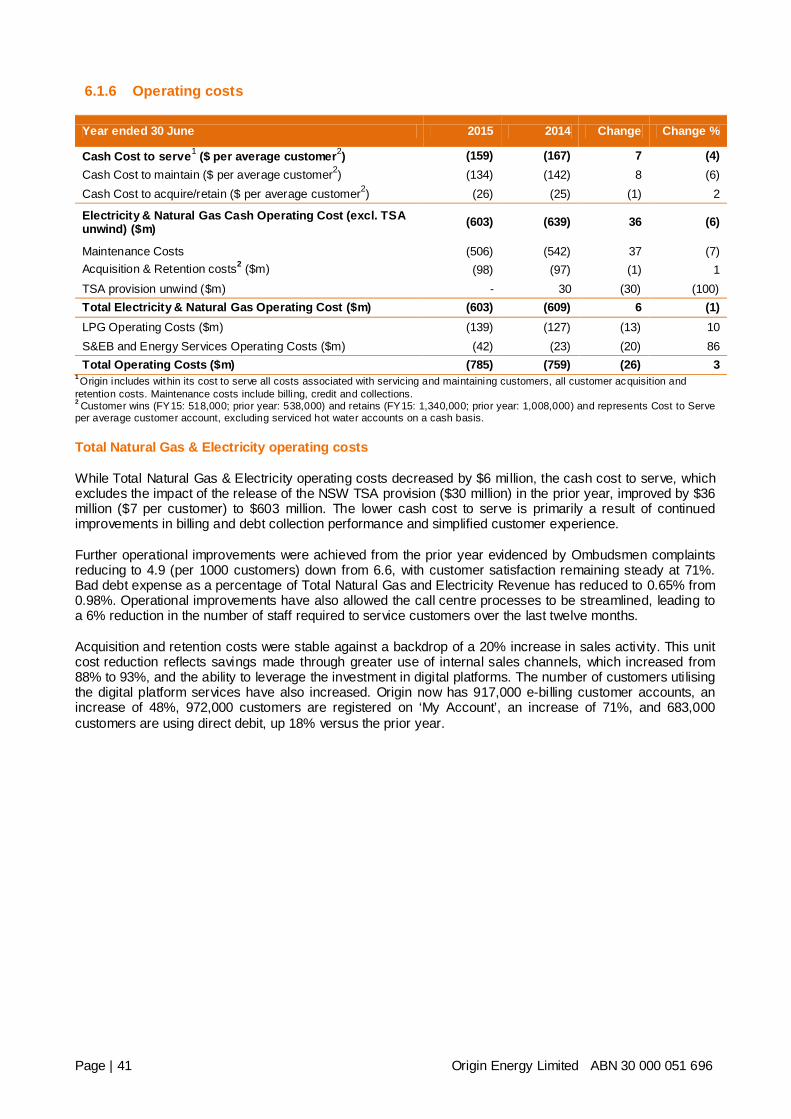
6.1.6 Operating costs
Year ended 30 June 2015 2014 Change Change %
Cash Cost to serve1 ($ per average customer2) (159) (167) 7 (4) Cash Cost to maintain ($ per average customer2) (134) (142) 8 (6) Cash Cost to acquire/retain ($ per average customer2) (26) (25) (1) 2
Electricity & Natural Gas Cash Operating Cost (excl. TSA unwind) ($m) (603) (639) 36 (6)
Maintenance Costs (506) (542) 37 (7) Acquisition & Retention costs2 ($m) (98) (97) (1) 1 TSA provision unwind ($m) - 30 (30) (100) Total Electricity & Natural Gas Operating Cost ($m) (603) (609) 6 (1) LPG Operating Costs ($m) (139) (127) (13) 10 S&EB and Energy Services Operating Costs ($m) (42) (23) (20) 86 Total Operating Costs ($m) (785) (759) (26) 3
1 Origin includes within its cost to serve all costs associated with servicing and maintaining customers, all customer acquisition and retention costs. Maintenance costs include billing, credit and collections.
2 Customer wins (FY15: 518,000; prior year: 538,000) and retains (FY15: 1,340,000; prior year: 1,008,000) and represents Cost to Serve per average customer account, excluding serviced hot water accounts on a cash basis. Total Natural Gas & Electricity operating costs
While Total Natural Gas & Electricity operating costs decreased by $6 million, the cash cost to serve, which excludes the impact of the release of the NSW TSA provision ($30 million) in the prior year, improved by $36 million ($7 per customer) to $603 million. The lower cash cost to serve is primarily a result of continued improvements in billing and debt collection performance and simplified customer experience. Further operational improvements were achieved from the prior year evidenced by Ombudsmen complaints reducing to 4.9 (per 1000 customers) down from 6.6, with customer satisfaction remaining steady at 71%. Bad debt expense as a percentage of Total Natural Gas and Electricity Revenue has reduced to 0.65% from 0.98%. Operational improvements have also allowed the call centre processes to be streamlined, leading to a 6% reduction in the number of staff required to service customers over the last twelve months. Acquisition and retention costs were stable against a backdrop of a 20% increase in sales activity. This unit cost reduction reflects savings made through greater use of internal sales channels, which increased from 88% to 93%, and the ability to leverage the investment in digital platforms. The number of customers utilising the digital platform services have also increased. Origin now has 917,000 e-billing customer accounts, an increase of 48%, 972,000 customers are registered on ‘My Account’, an increase of 71%, and 683,000 customers are using direct debit, up 18% versus the prior year.
Page | 41 Origin Energy Limited ABN 30 000 051 696
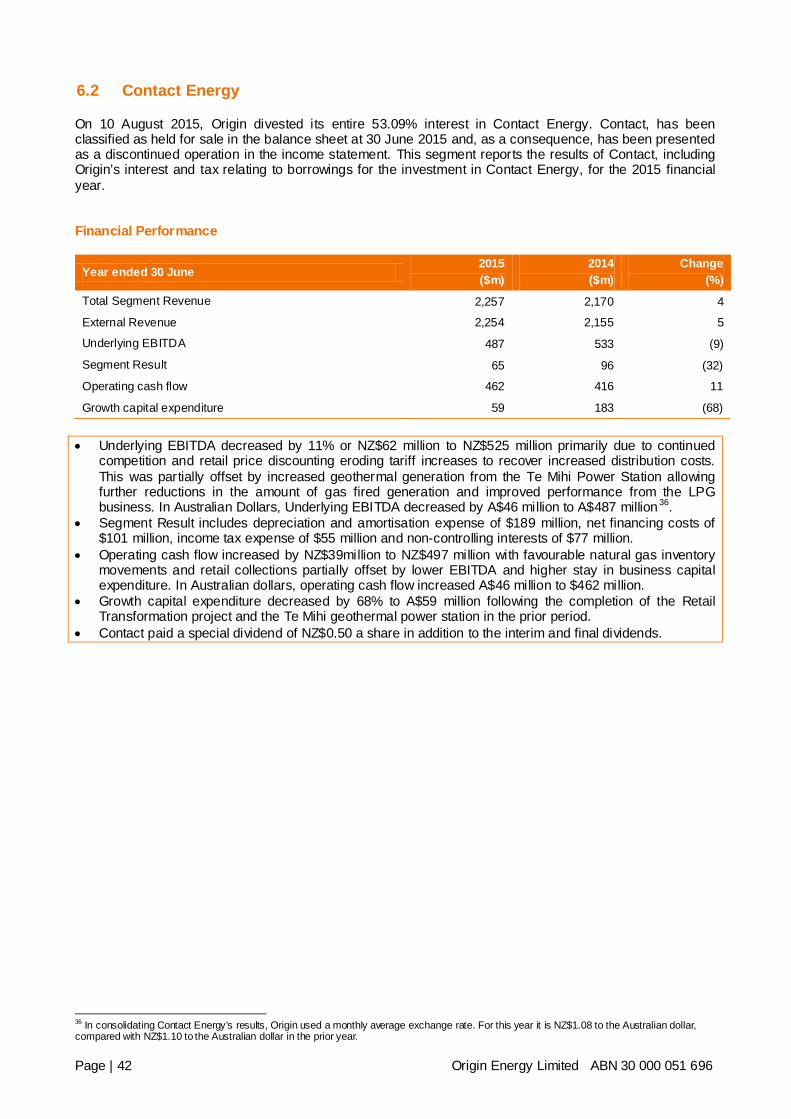
6.2 Contact Energy
On 10 August 2015, Origin divested its entire 53.09% interest in Contact Energy. Contact, has been classified as held for sale in the balance sheet at 30 June 2015 and, as a consequence, has been presented as a discontinued operation in the income statement. This segment reports the results of Contact, including Origin’s interest and tax relating to borrowings for the investment in Contact Energy, for the 2015 financial year. Financial Performance
Year ended 30 June 2015 ($m)
2014 ($m)
Change (%)
Total Segment Revenue 2,257 2,170 4
External Revenue 2,254 2,155 5
Underlying EBITDA 487 533 (9)
Segment Result 65 96 (32)
Operating cash flow 462 416 11
Growth capital expenditure 59 183 (68) • Underlying EBITDA decreased by 11% or NZ$62 million to NZ$525 million primarily due to continued
competition and retail price discounting eroding tariff increases to recover increased distribution costs. This was partially offset by increased geothermal generation from the Te Mihi Power Station allowing further reductions in the amount of gas fired generation and improved performance from the LPG business. In Australian Dollars, Underlying EBITDA decreased by A$46 million to A$487 million36.
• Segment Result includes depreciation and amortisation expense of $189 million, net financing costs of $101 million, income tax expense of $55 million and non-controlling interests of $77 million.
• Operating cash flow increased by NZ$39million to NZ$497 million with favourable natural gas inventory movements and retail collections partially offset by lower EBITDA and higher stay in business capital expenditure. In Australian dollars, operating cash flow increased A$46 million to $462 million.
• Growth capital expenditure decreased by 68% to A$59 million following the completion of the Retail Transformation project and the Te Mihi geothermal power station in the prior period.
• Contact paid a special dividend of NZ$0.50 a share in addition to the interim and final dividends.
36 In consolidating Contact Energy’s results, Origin used a monthly average exchange rate. For this year it is NZ$1.08 to the Australian dollar, compared with NZ$1.10 to the Australian dollar in the prior year.
Page | 42 Origin Energy Limited ABN 30 000 051 696
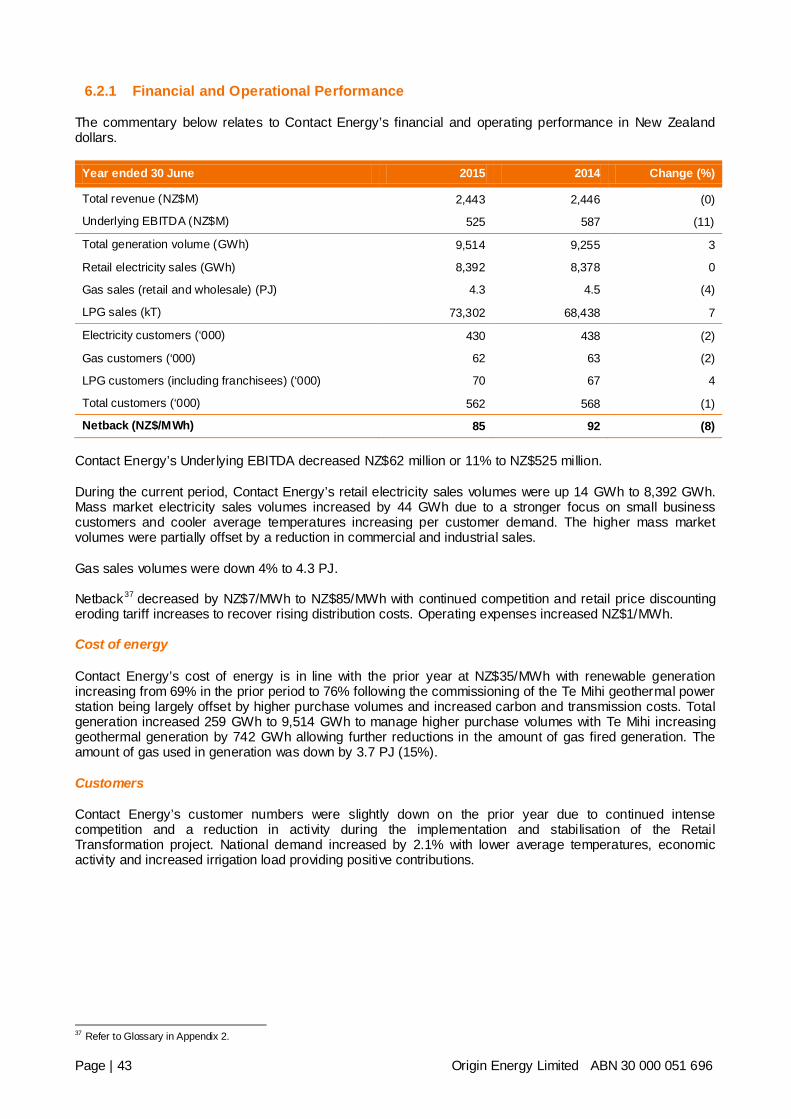
6.2.1 Financial and Operational Performance
The commentary below relates to Contact Energy’s financial and operating performance in New Zealand dollars.
Year ended 30 June 2015 2014 Change (%)
Total revenue (NZ$M) 2,443 2,446 (0)
Underlying EBITDA (NZ$M) 525 587 (11)
Total generation volume (GWh) 9,514 9,255 3
Retail electricity sales (GWh) 8,392 8,378 0
Gas sales (retail and wholesale) (PJ) 4.3 4.5 (4)
LPG sales (kT) 73,302 68,438 7
Electricity customers (‘000) 430 438 (2)
Gas customers (‘000) 62 63 (2)
LPG customers (including franchisees) (‘000) 70 67 4
Total customers (‘000) 562 568 (1)
Netback (NZ$/MWh) 85 92 (8) Contact Energy’s Underlying EBITDA decreased NZ$62 million or 11% to NZ$525 million. During the current period, Contact Energy’s retail electricity sales volumes were up 14 GWh to 8,392 GWh. Mass market electricity sales volumes increased by 44 GWh due to a stronger focus on small business customers and cooler average temperatures increasing per customer demand. The higher mass market volumes were partially offset by a reduction in commercial and industrial sales. Gas sales volumes were down 4% to 4.3 PJ. Netback37 decreased by NZ$7/MWh to NZ$85/MWh with continued competition and retail price discounting eroding tariff increases to recover rising distribution costs. Operating expenses increased NZ$1/MWh. Cost of energy
Contact Energy’s cost of energy is in line with the prior year at NZ$35/MWh with renewable generation increasing from 69% in the prior period to 76% following the commissioning of the Te Mihi geothermal power station being largely offset by higher purchase volumes and increased carbon and transmission costs. Total generation increased 259 GWh to 9,514 GWh to manage higher purchase volumes with Te Mihi increasing geothermal generation by 742 GWh allowing further reductions in the amount of gas fired generation. The amount of gas used in generation was down by 3.7 PJ (15%). Customers
Contact Energy’s customer numbers were slightly down on the prior year due to continued intense competition and a reduction in activity during the implementation and stabilisation of the Retail Transformation project. National demand increased by 2.1% with lower average temperatures, economic activity and increased irrigation load providing positive contributions.
37 Refer to Glossary in Appendix 2.
Page | 43 Origin Energy Limited ABN 30 000 051 696
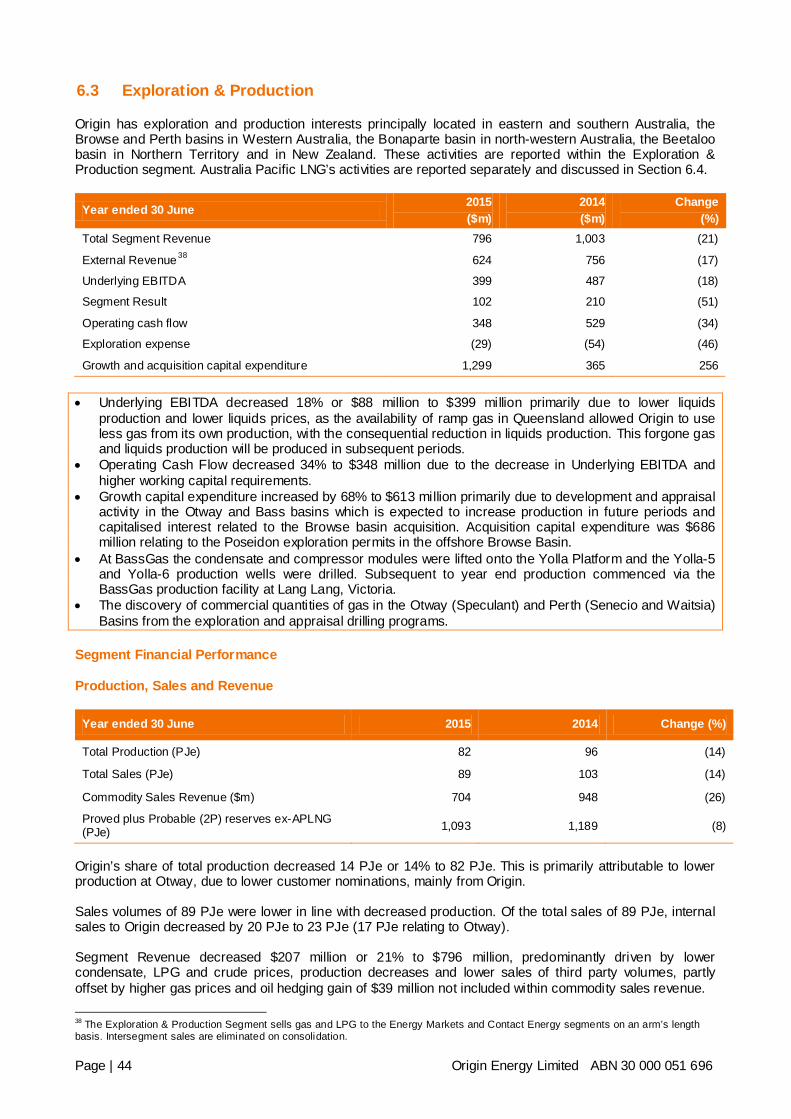
6.3 Exploration & Production
Origin has exploration and production interests principally located in eastern and southern Australia, the Browse and Perth basins in Western Australia, the Bonaparte basin in north-western Australia, the Beetaloo basin in Northern Territory and in New Zealand. These activities are reported within the Exploration & Production segment. Australia Pacific LNG’s activities are reported separately and discussed in Section 6.4.
Year ended 30 June 2015 ($m)
2014 ($m)
Change (%)
Total Segment Revenue 796 1,003 (21)
External Revenue38 624 756 (17)
Underlying EBITDA 399 487 (18)
Segment Result 102 210 (51)
Operating cash flow 348 529 (34)
Exploration expense (29) (54) (46)
Growth and acquisition capital expenditure 1,299 365 256 • Underlying EBITDA decreased 18% or $88 million to $399 million primarily due to lower liquids
production and lower liquids prices, as the availability of ramp gas in Queensland allowed Origin to use less gas from its own production, with the consequential reduction in liquids production. This forgone gas and liquids production will be produced in subsequent periods.
• Operating Cash Flow decreased 34% to $348 million due to the decrease in Underlying EBITDA and higher working capital requirements.
• Growth capital expenditure increased by 68% to $613 million primarily due to development and appraisal activity in the Otway and Bass basins which is expected to increase production in future periods and capitalised interest related to the Browse basin acquisition. Acquisition capital expenditure was $686 million relating to the Poseidon exploration permits in the offshore Browse Basin.
• At BassGas the condensate and compressor modules were lifted onto the Yolla Platform and the Yolla-5 and Yolla-6 production wells were drilled. Subsequent to year end production commenced via the BassGas production facility at Lang Lang, Victoria.
• The discovery of commercial quantities of gas in the Otway (Speculant) and Perth (Senecio and Waitsia) Basins from the exploration and appraisal drilling programs.
Segment Financial Performance
Production, Sales and Revenue
Year ended 30 June 2015 2014 Change (%)
Total Production (PJe) 82 96 (14)
Total Sales (PJe) 89 103 (14)
Commodity Sales Revenue ($m) 704 948 (26)
Proved plus Probable (2P) reserves ex-APLNG (PJe) 1,093 1,189 (8)
Origin’s share of total production decreased 14 PJe or 14% to 82 PJe. This is primarily attributable to lower production at Otway, due to lower customer nominations, mainly from Origin. Sales volumes of 89 PJe were lower in line with decreased production. Of the total sales of 89 PJe, internal sales to Origin decreased by 20 PJe to 23 PJe (17 PJe relating to Otway). Segment Revenue decreased $207 million or 21% to $796 million, predominantly driven by lower condensate, LPG and crude prices, production decreases and lower sales of third party volumes, partly offset by higher gas prices and oil hedging gain of $39 million not included within commodity sales revenue.
38 The Exploration & Production Segment sells gas and LPG to the Energy Markets and Contact Energy segments on an arm’s length basis. Intersegment sales are eliminated on consolidation.
Page | 44 Origin Energy Limited ABN 30 000 051 696
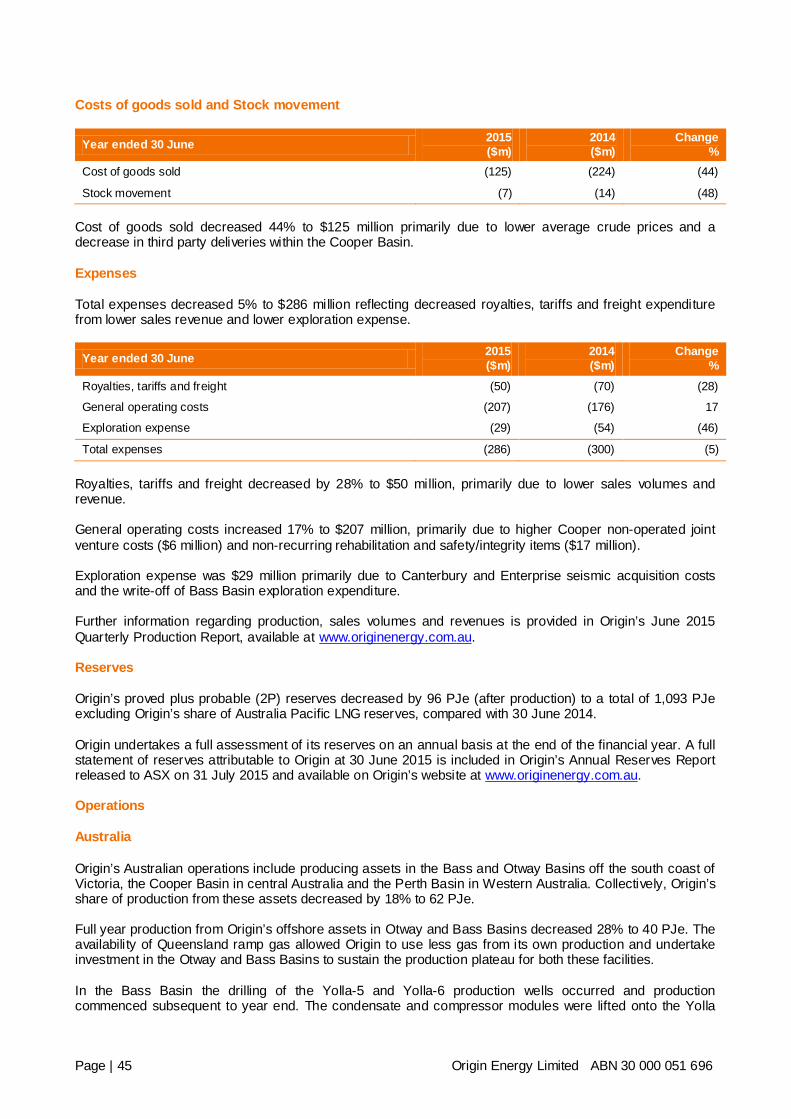
Costs of goods sold and Stock movement
Year ended 30 June 2015 ($m)
2014 ($m)
Change %
Cost of goods sold (125) (224) (44)
Stock movement (7) (14) (48) Cost of goods sold decreased 44% to $125 million primarily due to lower average crude prices and a decrease in third party deliveries within the Cooper Basin. Expenses
Total expenses decreased 5% to $286 million reflecting decreased royalties, tariffs and freight expenditure from lower sales revenue and lower exploration expense.
Year ended 30 June 2015 ($m)
2014 ($m)
Change %
Royalties, tariffs and freight (50) (70) (28)
General operating costs (207) (176) 17
Exploration expense (29) (54) (46)
Total expenses (286) (300) (5) Royalties, tariffs and freight decreased by 28% to $50 million, primarily due to lower sales volumes and revenue. General operating costs increased 17% to $207 million, primarily due to higher Cooper non-operated joint venture costs ($6 million) and non-recurring rehabilitation and safety/integrity items ($17 million). Exploration expense was $29 million primarily due to Canterbury and Enterprise seismic acquisition costs and the write-off of Bass Basin exploration expenditure. Further information regarding production, sales volumes and revenues is provided in Origin’s June 2015 Quarterly Production Report, available at www.originenergy.com.au. Reserves
Origin’s proved plus probable (2P) reserves decreased by 96 PJe (after production) to a total of 1,093 PJe excluding Origin’s share of Australia Pacific LNG reserves, compared with 30 June 2014. Origin undertakes a full assessment of its reserves on an annual basis at the end of the financial year. A full statement of reserves attributable to Origin at 30 June 2015 is included in Origin’s Annual Reserves Report released to ASX on 31 July 2015 and available on Origin’s website at www.originenergy.com.au. Operations
Australia
Origin’s Australian operations include producing assets in the Bass and Otway Basins off the south coast of Victoria, the Cooper Basin in central Australia and the Perth Basin in Western Australia. Collectively, Origin’s share of production from these assets decreased by 18% to 62 PJe. Full year production from Origin’s offshore assets in Otway and Bass Basins decreased 28% to 40 PJe. The availability of Queensland ramp gas allowed Origin to use less gas from its own production and undertake investment in the Otway and Bass Basins to sustain the production plateau for both these facilities. In the Bass Basin the drilling of the Yolla-5 and Yolla-6 production wells occurred and production commenced subsequent to year end. The condensate and compressor modules were lifted onto the Yolla
Page | 45 Origin Energy Limited ABN 30 000 051 696
Platform and together with Yolla-5 and Yolla-6 will allow production to the Lang Lang processing facility to be extended. During the year four wells were drilled in the Otway Basin. The Halladale-2 development well was completed during the June Quarter and suspended for future production. The Speculant campaign drilled three wells (one exploration well and two appraisal wells including the Speculant-2 side track well), two of which were cased, completed and suspended for future production. These high deliverability Halladale/Speculant wells will enable increased utilisation of the Onshore Otway facilities. Construction of pipeline and reception facilities is expected to commence in the second quarter of financial year 2016 to connect the wells to the Otway Gas Plant, with first gas expected early in the 2017 financial year. Full year production from Origin’s onshore assets in the central Australian Cooper Basin and Western Australia’s Perth Basin increased 9% to 22 PJe due to additional wells commencing production in the Cooper Basin. During the year four wells were drilled in the Perth Basin. The Senecio-3 appraisal well was drilled, cased and suspended in permits L1/L2 (Origin 50%, non-operated). The well successfully identified gas in the primary Senecio target (Dongara and Wagina sandstones) and also encountered new gas pools in the secondary Waitsia target of the deeper Kingia and High Cliff sandstones. A follow-up two well appraisal program of the Waitsia discovery commenced during the year. The Waitsia-1 well was drilled through the prospective section of the conventional Kingia and High Cliff Sandstones encountering high quality, gas filled sands, confirming the Waitsia play extending into the Waitsia-1 location. The well was cased and suspended for future production. The Waitsia-2 appraisal well drilling commenced during the year and reached total depth subsequent to year end. The Irwin 1 exploration well was drilled, within the EP 320 exploration permit. The well encountered gas within the Dongara/Wagina tight gas reservoir. Further appraisal activity was undertaken in Queensland’s Surat Basin. Pilot testing in the Ironbark field at the Duke-2 and Duke-3 pilots was successfully completed during the year. The results of the Duke pilot testing continue to be incorporated into the development plan for Ironbark. Subsequent to year end, in the Beetaloo Basin, the drilling of the Kalala S-1 well in EP98, Northern Territory, commenced. Kalala S-1 is the first of three onshore wells drilled by the joint venture and will target the Middle Velkerri formation to assess hydrocarbon saturation and reservoir quality. In the non-operated Cooper Basin, a total of 87 wells were drilled during the year consisting of 75 development wells and 12 exploration and appraisal wells. New Zealand
In New Zealand, Origin operates both offshore (Kupe) and onshore assets in the Taranaki Basin. Origin’s share of production from these assets increased by 4% to 20 PJe. This result is primarily attributable to higher customer nominations at Kupe. In the Canterbury Basin, an extension of the permit to 2021 was approved by the regulator. The ACB15 3D seismic survey was completed during the year. The operator, Anadarko, has contracted Petroleum Geo-Services to process the data. International exploration
In Vietnam, the processing of 2D seismic data acquired in Block 121 has been completed and interpretation of this data is ongoing.
Page | 46 Origin Energy Limited ABN 30 000 051 696
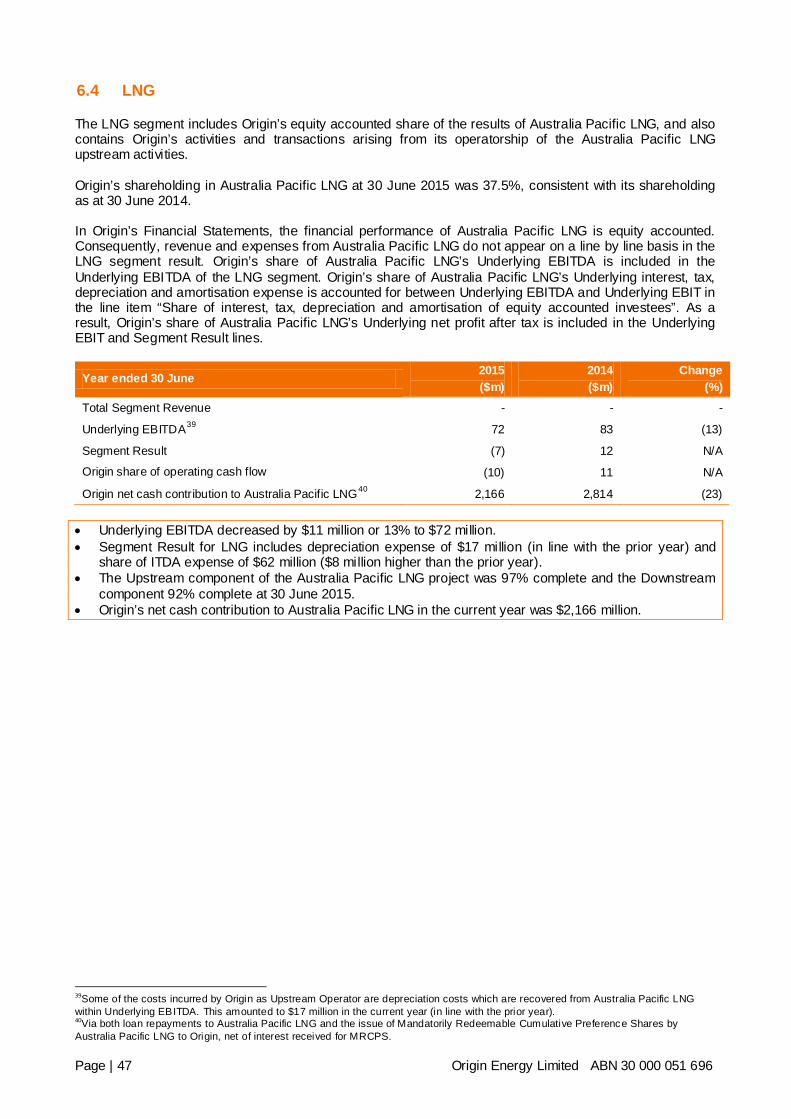
6.4 LNG
The LNG segment includes Origin’s equity accounted share of the results of Australia Pacific LNG, and also contains Origin’s activities and transactions arising from its operatorship of the Australia Pacific LNG upstream activities. Origin’s shareholding in Australia Pacific LNG at 30 June 2015 was 37.5%, consistent with its shareholding as at 30 June 2014. In Origin’s Financial Statements, the financial performance of Australia Pacific LNG is equity accounted. Consequently, revenue and expenses from Australia Pacific LNG do not appear on a line by line basis in the LNG segment result. Origin’s share of Australia Pacific LNG’s Underlying EBITDA is included in the Underlying EBITDA of the LNG segment. Origin’s share of Australia Pacific LNG’s Underlying interest, tax, depreciation and amortisation expense is accounted for between Underlying EBITDA and Underlying EBIT in the line item “Share of interest, tax, depreciation and amortisation of equity accounted investees”. As a result, Origin’s share of Australia Pacific LNG’s Underlying net profit after tax is included in the Underlying EBIT and Segment Result lines.
Year ended 30 June 2015 ($m)
2014 ($m)
Change (%)
Total Segment Revenue - - -
Underlying EBITDA39 72 83 (13)
Segment Result (7) 12 N/A
Origin share of operating cash flow (10) 11 N/A
Origin net cash contribution to Australia Pacific LNG40 2,166 2,814 (23) • Underlying EBITDA decreased by $11 million or 13% to $72 million. • Segment Result for LNG includes depreciation expense of $17 million (in line with the prior year) and
share of ITDA expense of $62 million ($8 million higher than the prior year). • The Upstream component of the Australia Pacific LNG project was 97% complete and the Downstream
component 92% complete at 30 June 2015. • Origin’s net cash contribution to Australia Pacific LNG in the current year was $2,166 million.
39Some of the costs incurred by Origin as Upstream Operator are depreciation costs which are recovered from Australia Pacific LNG within Underlying EBITDA. This amounted to $17 million in the current year (in line with the prior year). 40Via both loan repayments to Australia Pacific LNG and the issue of Mandatorily Redeemable Cumulative Preference Shares by Australia Pacific LNG to Origin, net of interest received for MRCPS.
Page | 47 Origin Energy Limited ABN 30 000 051 696
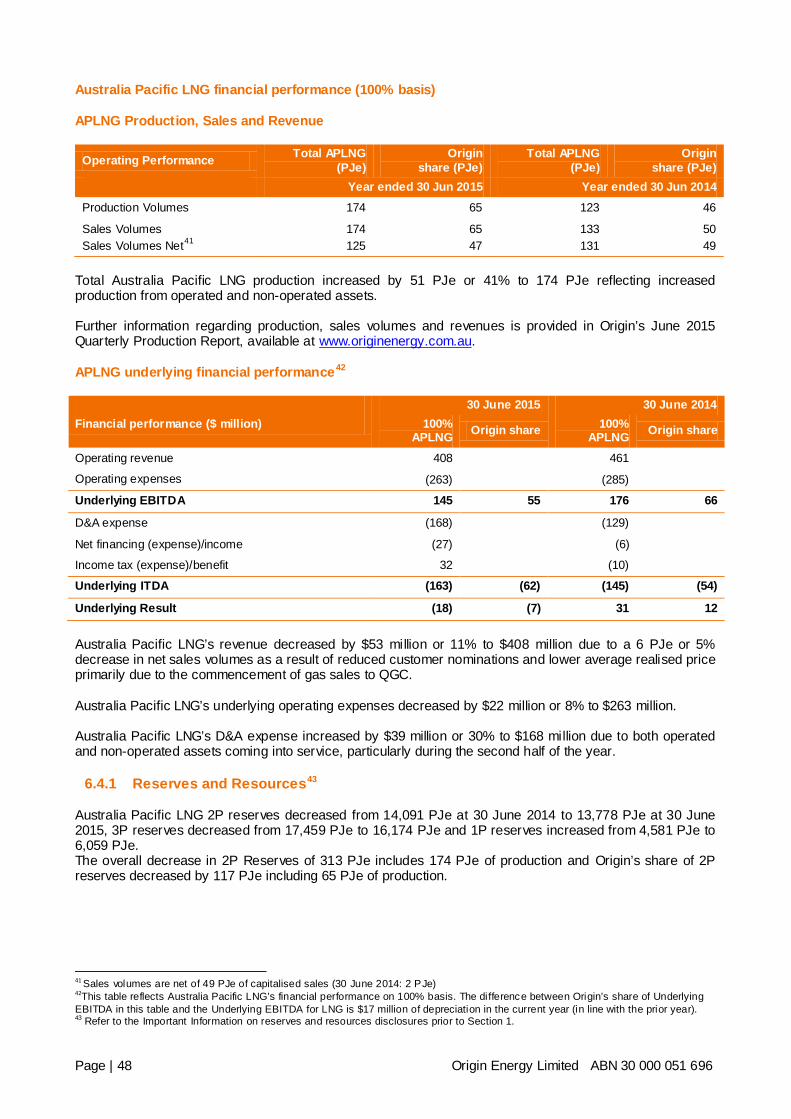
Australia Pacific LNG financial performance (100% basis)
APLNG Production, Sales and Revenue
Operating Performance Total APLNG (PJe)
Origin share (PJe)
Total APLNG (PJe)
Origin share (PJe)
Year ended 30 Jun 2015 Year ended 30 Jun 2014 Production Volumes 174 65 123 46
Sales Volumes Sales Volumes Net41
174 125
65 47
133 131
50 49
Total Australia Pacific LNG production increased by 51 PJe or 41% to 174 PJe reflecting increased production from operated and non-operated assets. Further information regarding production, sales volumes and revenues is provided in Origin’s June 2015 Quarterly Production Report, available at www.originenergy.com.au. APLNG underlying financial performance42
30 June 2015 30 June 2014 Financial performance ($ million) 100%
APLNG Origin share 100% APLNG Origin share
Operating revenue 408 461
Operating expenses (263) (285)
Underlying EBITDA 145 55 176 66
D&A expense (168) (129)
Net financing (expense)/income (27) (6)
Income tax (expense)/benefit 32 (10)
Underlying ITDA (163) (62) (145) (54)
Underlying Result (18) (7) 31 12 Australia Pacific LNG’s revenue decreased by $53 million or 11% to $408 million due to a 6 PJe or 5% decrease in net sales volumes as a result of reduced customer nominations and lower average realised price primarily due to the commencement of gas sales to QGC. Australia Pacific LNG’s underlying operating expenses decreased by $22 million or 8% to $263 million. Australia Pacific LNG’s D&A expense increased by $39 million or 30% to $168 million due to both operated and non-operated assets coming into service, particularly during the second half of the year.
6.4.1 Reserves and Resources43
Australia Pacific LNG 2P reserves decreased from 14,091 PJe at 30 June 2014 to 13,778 PJe at 30 June 2015, 3P reserves decreased from 17,459 PJe to 16,174 PJe and 1P reserves increased from 4,581 PJe to 6,059 PJe. The overall decrease in 2P Reserves of 313 PJe includes 174 PJe of production and Origin’s share of 2P reserves decreased by 117 PJe including 65 PJe of production.
41 Sales volumes are net of 49 PJe of capitalised sales (30 June 2014: 2 PJe) 42This table reflects Australia Pacific LNG’s financial performance on 100% basis. The difference between Origin’s share of Underlying EBITDA in this table and the Underlying EBITDA for LNG is $17 million of depreciation in the current year (in line with the prior year). 43 Refer to the Important Information on reserves and resources disclosures prior to Section 1.
Page | 48 Origin Energy Limited ABN 30 000 051 696
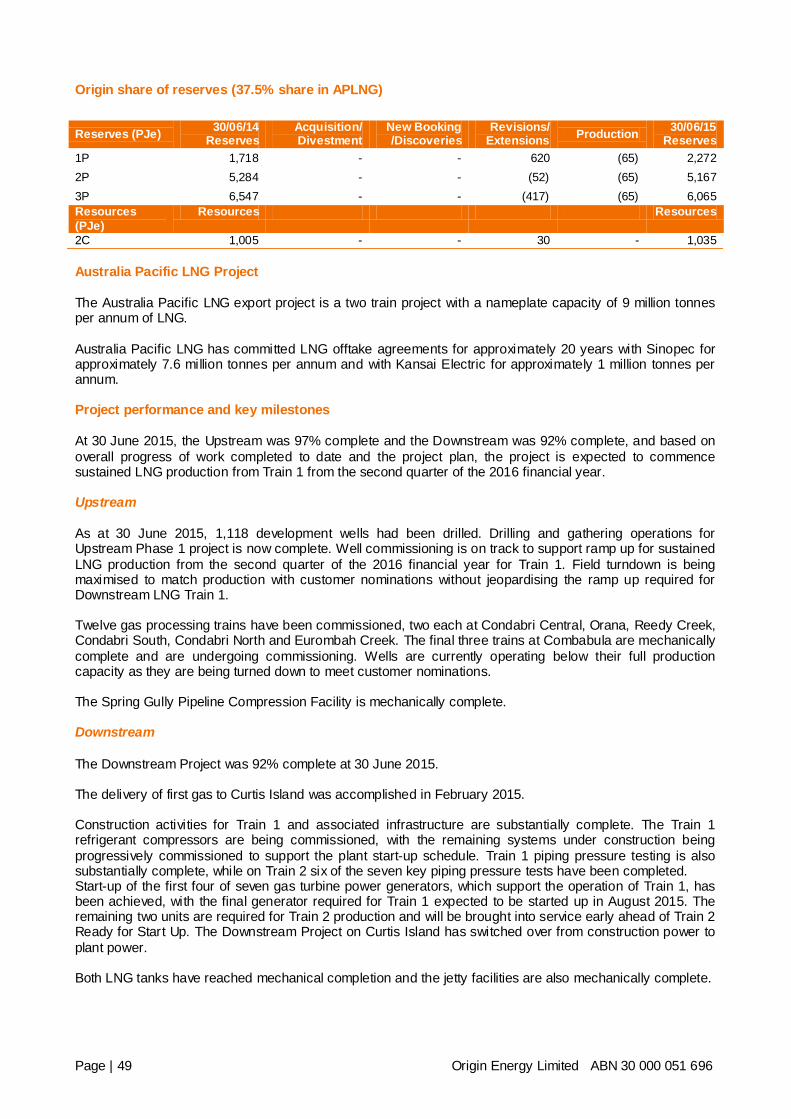
Origin share of reserves (37.5% share in APLNG)
Reserves (PJe) 30/06/14 Reserves
Acquisition/ Divestment
New Booking /Discoveries
Revisions/ Extensions Production 30/06/15
Reserves 1P 1,718 - - 620 (65) 2,272 2P 5,284 - - (52) (65) 5,167 3P 6,547 - - (417) (65) 6,065 Resources (PJe)
Resources Resources
2C 1,005 - - 30 - 1,035 Australia Pacific LNG Project
The Australia Pacific LNG export project is a two train project with a nameplate capacity of 9 million tonnes per annum of LNG. Australia Pacific LNG has committed LNG offtake agreements for approximately 20 years with Sinopec for approximately 7.6 million tonnes per annum and with Kansai Electric for approximately 1 million tonnes per annum. Project performance and key milestones
At 30 June 2015, the Upstream was 97% complete and the Downstream was 92% complete, and based on overall progress of work completed to date and the project plan, the project is expected to commence sustained LNG production from Train 1 from the second quarter of the 2016 financial year. Upstream
As at 30 June 2015, 1,118 development wells had been drilled. Drilling and gathering operations for Upstream Phase 1 project is now complete. Well commissioning is on track to support ramp up for sustained LNG production from the second quarter of the 2016 financial year for Train 1. Field turndown is being maximised to match production with customer nominations without jeopardising the ramp up required for Downstream LNG Train 1. Twelve gas processing trains have been commissioned, two each at Condabri Central, Orana, Reedy Creek, Condabri South, Condabri North and Eurombah Creek. The final three trains at Combabula are mechanically complete and are undergoing commissioning. Wells are currently operating below their full production capacity as they are being turned down to meet customer nominations. The Spring Gully Pipeline Compression Facility is mechanically complete. Downstream
The Downstream Project was 92% complete at 30 June 2015. The delivery of first gas to Curtis Island was accomplished in February 2015. Construction activities for Train 1 and associated infrastructure are substantially complete. The Train 1 refrigerant compressors are being commissioned, with the remaining systems under construction being progressively commissioned to support the plant start-up schedule. Train 1 piping pressure testing is also substantially complete, while on Train 2 six of the seven key piping pressure tests have been completed. Start-up of the first four of seven gas turbine power generators, which support the operation of Train 1, has been achieved, with the final generator required for Train 1 expected to be started up in August 2015. The remaining two units are required for Train 2 production and will be brought into service early ahead of Train 2 Ready for Start Up. The Downstream Project on Curtis Island has switched over from construction power to plant power. Both LNG tanks have reached mechanical completion and the jetty facilities are also mechanically complete.
Page | 49 Origin Energy Limited ABN 30 000 051 696
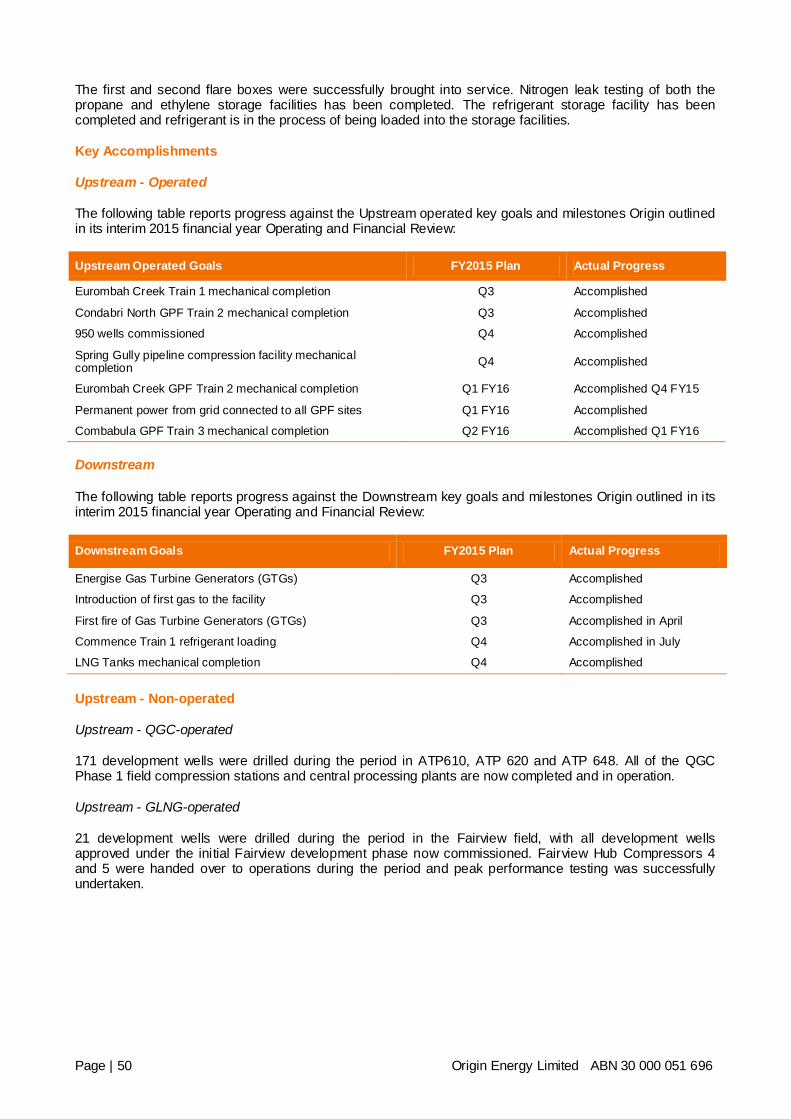
The first and second flare boxes were successfully brought into service. Nitrogen leak testing of both the propane and ethylene storage facilities has been completed. The refrigerant storage facility has been completed and refrigerant is in the process of being loaded into the storage facilities. Key Accomplishments
Upstream - Operated
The following table reports progress against the Upstream operated key goals and milestones Origin outlined in its interim 2015 financial year Operating and Financial Review: Upstream Operated Goals FY2015 Plan Actual Progress
Eurombah Creek Train 1 mechanical completion Q3 Accomplished
Condabri North GPF Train 2 mechanical completion Q3 Accomplished
950 wells commissioned Q4 Accomplished
Spring Gully pipeline compression facility mechanical completion Q4 Accomplished
Eurombah Creek GPF Train 2 mechanical completion Q1 FY16 Accomplished Q4 FY15
Permanent power from grid connected to all GPF sites Q1 FY16 Accomplished
Combabula GPF Train 3 mechanical completion Q2 FY16 Accomplished Q1 FY16 Downstream
The following table reports progress against the Downstream key goals and milestones Origin outlined in its interim 2015 financial year Operating and Financial Review: Downstream Goals FY2015 Plan Actual Progress
Energise Gas Turbine Generators (GTGs) Q3 Accomplished
Introduction of first gas to the facility Q3 Accomplished
First fire of Gas Turbine Generators (GTGs) Q3 Accomplished in April
Commence Train 1 refrigerant loading Q4 Accomplished in July
LNG Tanks mechanical completion Q4 Accomplished
Upstream - Non-operated
Upstream - QGC-operated
171 development wells were drilled during the period in ATP610, ATP 620 and ATP 648. All of the QGC Phase 1 field compression stations and central processing plants are now completed and in operation. Upstream - GLNG-operated
21 development wells were drilled during the period in the Fairview field, with all development wells approved under the initial Fairview development phase now commissioned. Fairview Hub Compressors 4 and 5 were handed over to operations during the period and peak performance testing was successfully undertaken.
Page | 50 Origin Energy Limited ABN 30 000 051 696
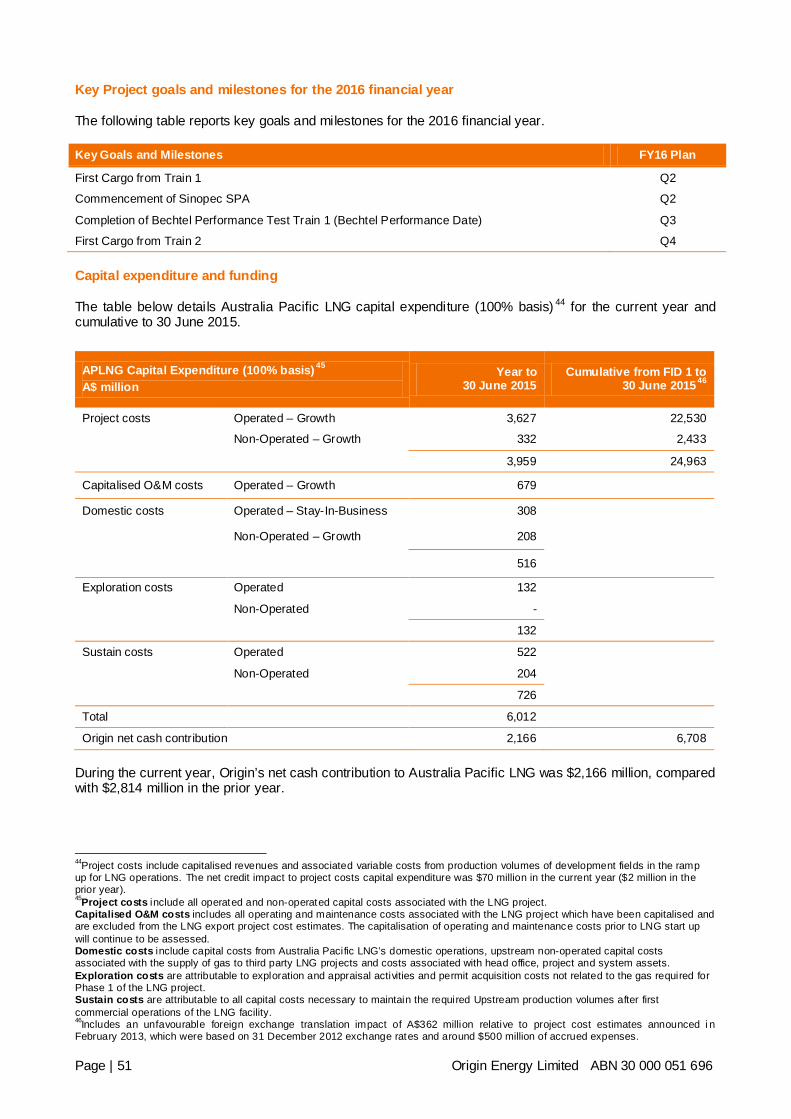
Key Project goals and milestones for the 2016 financial year
The following table reports key goals and milestones for the 2016 financial year. Key Goals and Milestones FY16 Plan
First Cargo from Train 1 Q2
Commencement of Sinopec SPA Q2
Completion of Bechtel Performance Test Train 1 (Bechtel Performance Date) Q3
First Cargo from Train 2 Q4 Capital expenditure and funding
The table below details Australia Pacific LNG capital expenditure (100% basis) 44 for the current year and cumulative to 30 June 2015.
During the current year, Origin’s net cash contribution to Australia Pacific LNG was $2,166 million, compared with $2,814 million in the prior year.
44Project costs include capitalised revenues and associated variable costs from production volumes of development fields in the ramp up for LNG operations. The net credit impact to project costs capital expenditure was $70 million in the current year ($2 million in the prior year). 45Project costs include all operated and non-operated capital costs associated with the LNG project. Capitalised O&M costs includes all operating and maintenance costs associated with the LNG project which have been capitalised and are excluded from the LNG export project cost estimates. The capitalisation of operating and maintenance costs prior to LNG start up will continue to be assessed. Domestic costs include capital costs from Australia Pacific LNG’s domestic operations, upstream non-operated capital costs associated with the supply of gas to third party LNG projects and costs associated with head office, project and system assets. Exploration costs are attributable to exploration and appraisal activities and permit acquisition costs not related to the gas required for Phase 1 of the LNG project. Sustain costs are attributable to all capital costs necessary to maintain the required Upstream production volumes after first commercial operations of the LNG facility. 46Includes an unfavourable foreign exchange translation impact of A$362 million relative to project cost estimates announced i n February 2013, which were based on 31 December 2012 exchange rates and around $500 million of accrued expenses.
APLNG Capital Expenditure (100% basis) 45 A$ million
Year to 30 June 2015
Cumulative from FID 1 to 30 June 201546
Project costs Operated – Growth 3,627 22,530
Non-Operated – Growth 332 2,433
3,959 24,963
Capitalised O&M costs Operated – Growth 679
Domestic costs Operated – Stay-In-Business 308
Non-Operated – Growth 208
516
Exploration costs Operated 132
Non-Operated -
132
Sustain costs Operated 522
Non-Operated 204
726
Total 6,012
Origin net cash contribution 2,166 6,708
Page | 51 Origin Energy Limited ABN 30 000 051 696
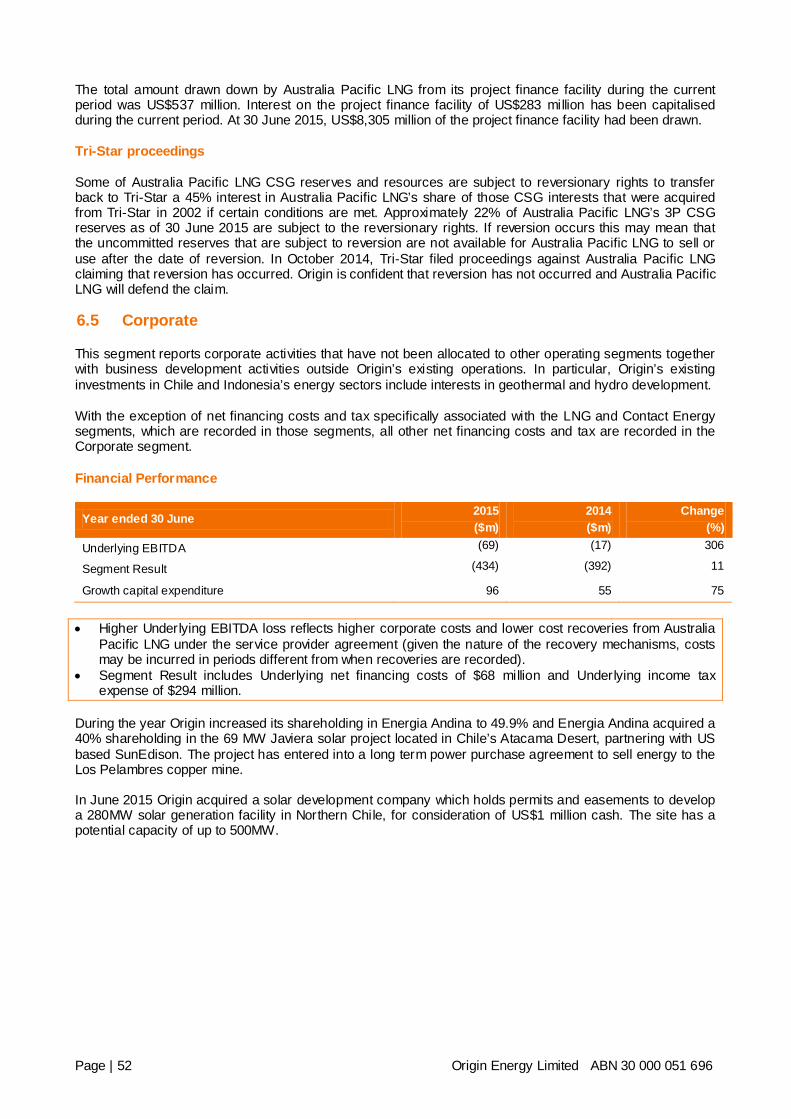
The total amount drawn down by Australia Pacific LNG from its project finance facility during the current period was US$537 million. Interest on the project finance facility of US$283 million has been capitalised during the current period. At 30 June 2015, US$8,305 million of the project finance facility had been drawn. Tri-Star proceedings
Some of Australia Pacific LNG CSG reserves and resources are subject to reversionary rights to transfer back to Tri-Star a 45% interest in Australia Pacific LNG’s share of those CSG interests that were acquired from Tri-Star in 2002 if certain conditions are met. Approximately 22% of Australia Pacific LNG’s 3P CSG reserves as of 30 June 2015 are subject to the reversionary rights. If reversion occurs this may mean that the uncommitted reserves that are subject to reversion are not available for Australia Pacific LNG to sell or use after the date of reversion. In October 2014, Tri-Star filed proceedings against Australia Pacific LNG claiming that reversion has occurred. Origin is confident that reversion has not occurred and Australia Pacific LNG will defend the claim. 6.5 Corporate
This segment reports corporate activities that have not been allocated to other operating segments together with business development activities outside Origin’s existing operations. In particular, Origin’s existing investments in Chile and Indonesia’s energy sectors include interests in geothermal and hydro development. With the exception of net financing costs and tax specifically associated with the LNG and Contact Energy segments, which are recorded in those segments, all other net financing costs and tax are recorded in the Corporate segment. Financial Performance
Year ended 30 June 2015 ($m)
2014 ($m)
Change (%)
Underlying EBITDA (69) (17) 306
Segment Result (434) (392) 11
Growth capital expenditure 96 55 75 • Higher Underlying EBITDA loss reflects higher corporate costs and lower cost recoveries from Australia
Pacific LNG under the service provider agreement (given the nature of the recovery mechanisms, costs may be incurred in periods different from when recoveries are recorded).
• Segment Result includes Underlying net financing costs of $68 million and Underlying income tax expense of $294 million.
During the year Origin increased its shareholding in Energia Andina to 49.9% and Energia Andina acquired a 40% shareholding in the 69 MW Javiera solar project located in Chile’s Atacama Desert, partnering with US based SunEdison. The project has entered into a long term power purchase agreement to sell energy to the Los Pelambres copper mine. In June 2015 Origin acquired a solar development company which holds permits and easements to develop a 280MW solar generation facility in Northern Chile, for consideration of US$1 million cash. The site has a potential capacity of up to 500MW.
Page | 52 Origin Energy Limited ABN 30 000 051 696
7. RISKS RELATED TO ORIGIN’S FUTURE FINANCIAL PROSPECTS
The scope of Origin’s operations means that a range of factors may impact on the achievement of the Company’s strategies and future financial prospects. Material risks and the Company’s approach to managing these risks are summarised below. The summary is not an exhaustive list of all risks that affect the business and the items have not been prioritised. Material Risks
Commodity prices
• Wholesale electricity prices - Origin’s business involves procuring electricity supply from Australian
wholesale electricity markets for on-sale to customers. Wholesale electricity prices are volatile and influenced by many factors that are difficult to predict, such as demand and supply balancing. Unexpected movements in wholesale prices, which are not mitigated through hedging arrangements, can result from a range of factors including operating constraints at Origin’s owned and operated power stations. This could result in adverse impacts on Origin’s financial performance.
• Commodity prices - Origin’s revenues include the sale of commodities such as oil, gas and other
products, such as LPG and LNG. Revenues from Origin’s LNG business will be primarily linked to the oil price. Additionally, our energy markets businesses are exposed to commodity price fluctuations in respect of coal and gas purchases for electricity generation and electricity, gas and LPG for on-sale to customers. Unexpected movements in commodity prices could result in adverse impacts on Origin’s financial performance.
Management of commodity price risk
Origin manages exposure to wholesale electricity and commodity price risk through a combination of physical positions (ownership, generation despatch rights or gas supply) and derivatives contracts. Exposure limits reflect the level of underlying risk which cannot be mitigated through hedging due to mismatches between customer demand and available hedges and the expected returns available through managing spot market volatility. Strict limits are set by the Board to manage the overall exposure that Origin is prepared to take, and a commodity risk management system is in place to monitor and report performance against these limits. Origin constantly monitors gas and electricity supply and demand dynamics and has built a portfolio of physical generation assets to assist in managing the exposure to movements in supply and demand. As a result of the physical assets, Origin is able to hedge a component of exposure to supply volatility by using owned generation or gas to meet demand. Origin supplies a range of market participants to manage demand risks.
Competition and energy demand Origin operates in competitive markets and changes in these competitive markets can impact the future financial performance of the Company. Origin is involved in supplying energy to customers and is impacted by changes in the ongoing demand for energy.
• Competition in energy markets - In the competitive Australian energy retailing markets, electricity, gas
and LPG customers are able to change providers, which in turn, can affect Origin’s future financial performance. High levels of competition can result in downward pressure on margins, customer account losses and higher costs of acquiring and maintaining customers, which can adversely impact future financial performance. There are many power generators in Australia which compete for generation capacity and sources of fuel, which can impact the cost of energy supply. Further, there is a risk of future development in competing generation technologies displacing Origin’s existing generation assets. These industry changes, including the competitive demand and supply balance for energy, may result in Origin’s portfolio becoming uncompetitive in the market.
Page | 53 Origin Energy Limited ABN 30 000 051 696
• Competition for sale and purchase of gas in eastern Australia - The potential discovery of significant new gas resources in eastern Australia could have a significant impact on the gas supply and demand dynamics in eastern Australia. This could result in changes in gas prices and therefore Origin’s future revenues and purchase costs. In addition, the LNG production on Curtis Island in Queensland will compete with domestic demand for gas. Changes in the demand and supply of gas in eastern Australia could result in material changes to the gas price, which could result in adverse impacts on Origin’s financial performance.
• Demand for energy - The volume of electricity, gas and LPG the Company sells is dependent on our customers’ energy usage. Reductions in energy demand from price changes, consumer perception of energy affordability, operational closures across energy intensive industries, technological advancement, mandatory energy efficiency schemes, weather and other factors, can reduce the Company’s revenues and adversely affect the Company’s future financial performance.
Management of competition and energy demand risks
In responding to competition and changes in customers’ energy demand, Origin regularly reviews the products offered to energy consumers, including alternative technology options (for example solar), by Origin and other market participants to ensure that offerings remain competitive. Origin is able to respond to changes in the competitive environment by changing its product offerings, the terms on which it is prepared to supply customers, including opportunities for customers to manage their consumption and billing. Origin is able to mitigate its exposure to competition for sale and purchase of gas in eastern Australia to some extent by altering how it manages its wholesale and generation portfolio.
Project delivery and reserves
• Project delivery - Origin undertakes investments in a variety of major projects including gas, oil, electricity generation, and operational systems. There is a risk that major projects, including Australia Pacific LNG’s CSG-to-LNG project in Queensland, could be subject to events outside of Origin’s control, such as weather events or natural disasters. This could result in projects costing more than intended or not proceeding as planned, which could adversely impact the Company’s future financial performance. There is also a risk of exposure to cost increases in non-operated joint ventures in which Origin has an interest but does not control.
• Oil and gas reserves and geothermal resources - There are numerous uncertainties inherent in exploring for new oil and gas reserves, and geothermal resources including estimating oil and gas reserves and geothermal resources and factors beyond Origin’s control.
Origin is involved in oil, gas and geothermal exploration and there is no assurance that resources will be discovered through these activities or that any particular undeveloped reserves will proceed to development or will be ultimately recovered. This risk could adversely impact Origin’s future financial prospects. Reserves classifications are the attempts to define the degree of uncertainty involved in estimating oil and gas reserves. There is a risk that actual production may vary from reserves predicted and any material variances could have an adverse impact on Origin’s future financial prospects and ability to supply fuel to its generation portfolio and to customers. Geothermal resources are dependent on continued geothermal fluid production from the geothermal reservoirs. Reservoir performance may be impacted by factors that may alter the physical state of the reservoir and the effectiveness of drilling programs targeted at maintaining and growing geothermal energy output.
Page | 54 Origin Energy Limited ABN 30 000 051 696
Management of project delivery and reserves risks
Origin manages projects in accordance with well established project management processes and continually reviews progress against deliverables, including budget and schedule. Origin employs geological and other standard industry procedures to identify and consider areas for potential exploration. These procedures consider a number of factors including the likelihood of exploration success, cost of exploration and potential benefit of success. Origin monitors well performance on a continual basis and reports production and reserves to the market regularly.
Regulatory, Tax and Legal • Acts and regulations - Origin operates in highly regulated environments, both domestic and
international and is exposed to the risk of changes in regulations or its own failure to meet regulatory requirements. Origin’s business, in particular Energy Markets, includes regulated electricity and gas retailer operations and is subject to a wide range of regulations such as dealing with customers, tariff setting in some States, participation in energy trading markets and competition. Origin’s assets are governed by a range of regulations during construction and once operational including environmental, industrial relations, health and safety, gas and electricity markets and competition. Origin is exposed to the risk of changes in climate and renewable policy. Further, retail tariffs set by regulators in regulated markets may not reflect Origin’s underlying costs, which could cause deterioration in profit margins. Failure to respond to changes in or meet regulatory requirements may result in a loss or constraint to Origin’s licence to operate and its inability to achieve its future financial prospects.
• Tax liabilities - Origin is exposed to risks arising from the manner in which the Australian and international tax regimes may be amended, applied, interpreted and enforced. Any actual or alleged failure to comply with, or any change in the interpretation, application or enforcement of, applicable tax laws and regulations could significantly increase Origin’s tax liability and expose Origin to legal, regulatory and other actions that could adversely affect Origin’s financial performance and prospects.
There is also a risk that the Australian federal government or, where relevant, state or territory governments, or foreign governments, will alter tax or royalty regimes that apply to Origin, Australia Pacific LNG, or to other entities in which it holds an investment, thereby adversely impacting Origin’s financial position. Australia Pacific LNG is required to pay royalties on its production to the Queensland government. A determination of the pricing mechanism in respect of the calculation of royalty payments to the Queensland government has been requested from the Queensland authorities. At the date of this Operating and Financial Review, no determination has been forthcoming. The outcome of this determination could have an adverse impact on the profitability of the project and thus on Origin’s financial performance.
• Litigation and dispute resolution - The nature of Origin’s business means that it has been, currently is and from time to time is likely to be involved in litigation, regulatory actions or similar dispute resolution processes arising from a wide range of possible matters. Origin may also be involved in investigations, inquiries, disputes or claims. Any of these could result in delays, increase costs or otherwise adversely impact Origin’s assets and operations, and adversely impact Origin’s financial performance and future financial prospects.
Management of Regulatory, Tax and Legal risks
Origin has in place systems and processes to identify, understand and capture compliance and regulatory obligations across the business, including tax liabilities. Origin’s risk management system and framework is designed to encourage early escalation of potential risks, including regulatory issues. Whistleblower and Serious Concern policies are in place to further enable issues to be escalated. In the event of non-compliance by individuals, Origin has procedures in place to take appropriate actions. Origin manages litigation and legal risk using internal legal counsel and external legal advice as required.
Page | 55 Origin Energy Limited ABN 30 000 051 696
Operational • Health, safety and security - The complexity, scale and geography of Origin’s operations give rise to a
range of health, safety and security risks potentially affecting our employees and contractors, including travel to and from our operations. Unintended harm to our employees and contractors may adversely impact the Company.
• Production - Origin is involved in large scale operating activities including oil and gas projects, power
generation, LPG facilities and, through Australia Pacific LNG, construction of CSG to LNG processing facilities. There is a risk that our operating equipment and facilities may not operate as intended and suffer outages or significant damage. This includes interruptions to any fuel supply required to operate the assets including gas, water and geothermal fluid. In addition, any failure or unavailability of third party infrastructure or providers including, in particular, transmission, distribution and pipeline infrastructure, could materially and adversely affect the ability of Origin to conduct business and production operations.
• Process safety - Origin’s production assets, including offshore drilling facilities, onshore gas processing
plants, pipelines and power stations, are exposed to process safety and containment loss risks. Unintended losses of containment in our production assets may adversely impact the Company.
• Joint venture relations - Origin’s joint venture partners may have economic or other business interests or goals that are inconsistent with Origin’s and may take actions contrary to the objectives or interests of Origin. There is also the risk that joint venture partners may become bankrupt, default on or fail to fulfil their obligations as required or expected thereby impacting the performance of the joint venture and adversely affecting Origin or its interests in the joint venture.
• Supply chain - In Origin’s projects and operations, there is a risk that goods or services may not be
delivered or supplied to contracted price, time or quality specifications or in accordance with Origin’s anti-bribery and corruption or health, safety and environmental requirements. Inadequate supply chain performance both internally and externally may adversely impact the Company achieving its financial prospects.
• Customer billing and collections - Origin supplies a large base of customers in Australia including
residential and commercial and industrial customers. If Origin is unable to effectively bill and or collect outstanding debt from customers, it could have an adverse impact on Origin’s future financial prospects.
• Cyber security - A cyber security incident could lead to a breach of privacy, disruption of critical business processes or theft of commercially sensitive information. Such events could have an adverse impact on Origin’s profitability or financial position.
• People and culture - There is a finite availability of skilled labour with expertise in some of the market sectors in which Origin operates, and certain of its operations may be reliant on small groups of individuals with specialist knowledge. The ability to attract and retain such personnel may impede Origin’s ability to undertake its activities efficiently and effectively. There is also a risk that Origin may pay a higher than expected cost to acquire or retain necessary labour. This could result in a material adverse increase or variability in Origin’s operating costs or add to the risk of development projects not proceeding as planned.
Page | 56 Origin Energy Limited ABN 30 000 051 696
Management of Operational risks
Origin’s risk management system and framework operates to identify, manage and mitigate operational risk across the business. It sets out the minimum standards that Origin expects of all operated assets. Procedures have been developed to identify and investigate significant incidents and near misses and to ensure that learnings are shared across the business. All projects and operations are subject to periodic audits and assurance of activities to ensure appropriate compliance to standards and effective risk management. Origin also maintains an extensive insurance program to mitigate the financial consequence by transferring some or all of its financial risk exposure to insurance markets. Origin works closely with joint venture and third party providers to reduce the likelihood of business interruption and to manage any exposure to cost increases and breaches. However, it is not always possible for Origin to influence the operational environment of third party providers (e.g. transmission companies). Origin has procurement and contracting policies, systems and personnel to support effective management of risks in the supply chain, covering selection, performance management and contract management. Origin administers customer credit procedures to monitor customer billings and debtor balances. These procedures are designed to monitor the accuracy and completeness of customer billings and reduce the incidence of bad debts. Origin has processes and systems in place for the ongoing detection of and protection against cyber security threats to IT services, including virus attacks, hacking, access control breaches and physical environment control failures. Origin’s remuneration structure includes a number of features to create significant attraction and retention incentives for key personnel including a short term incentive plan awarded partly in cash and partly as deferred share rights, and a long term incentive plan in the form of performance share rights and/or options. There is also a comprehensive program to measure and understand the drivers of employee engagement, and to positively influence these through enhanced management development, performance management and internal communication.
Environmental and Social • Environment - The complexity, scale and geography of Origin’s projects and operations give rise to a
range of environmental risks including carbon emissions, water and brine management, waste management, and biodiversity risks (both land and marine). These risks have the potential to harm the environment, increase operating costs and cause the loss of operating licences.
• Social - Origin’s projects and operations interact with a range of community stakeholders who have an interest in the impacts of our activities and the manner in which economic benefits are shared from such activities. These interactions give rise to a range of social risks including land access, reduced community acceptance and adverse public perception of Origin and the industries in which it operates. These risks have the potential to reduce access to resources and markets, impact Origin’s reputation and increase operating costs including from compliance obligations arising from changes in laws and regulations.
Page | 57 Origin Energy Limited ABN 30 000 051 696
Management of Environmental and Social risks
Origin’s risk management system and framework is used to assess and manage the environmental and social risks for all projects and operations. Projects are developed with precautionary engineering and management measures in place to mitigate or manage key environmental and social risks, and operations are managed using policies and procedures to control remaining environmental and social risks. Environmental and social regulatory obligations are maintained and managed for projects, including the Australia Pacific LNG’s CSG-to-LNG project. These approvals have been issued by regulatory bodies following extensive consultation with community and other stakeholders and cover a comprehensive range of environmental and social risks. Origin’s and Australia Pacific LNG’s processes and internal compliance monitoring are designed to ensure activities are conducted in accordance with all approval obligations. Stakeholder engagement and advocacy is undertaken to communicate relevant knowledge and information to customers and regulators. Origin also operates regional development programs and social and environmental research programs to better share the economic value created within the communities it operates.
Credit, Market and Liquidity • Credit - Origin is subject to the risk that some counterparties may fail to fulfil their obligations under
major hedge and sales contracts, including making payments as they fall due, and such defaults could adversely impact Origin’s financial prospects.
• Market - Origin is exposed to foreign exchange rate fluctuations in the Australian dollar value of foreign currency denominated assets, revenues, dividends received and expenses including interest expense. Interest rate risk rises in respect of the Company’s long term borrowings could adversely impact Origin’s financial prospects.
• Liquidity - Origin is exposed to the availability of capital in financial markets at the time of any financing or refinancing that Origin requires. There is a risk that Origin’s financial flexibility may be adversely affected.
Management of Credit, Market and Liquidity risks
Credit risk is managed using a contracts governance process that requires due diligence around counterparty default risks. Market risks are managed within Board approved risk limits. Financial exposures are subject to regular review and exposure limits are set at a level designed to preserve the financial integrity of the Company under a range of downside scenarios. Origin manages its liquidity position within limits designed to maintain sufficient liquidity to meet its objectives even in periods of reduced market liquidity.
Page | 58 Origin Energy Limited ABN 30 000 051 696
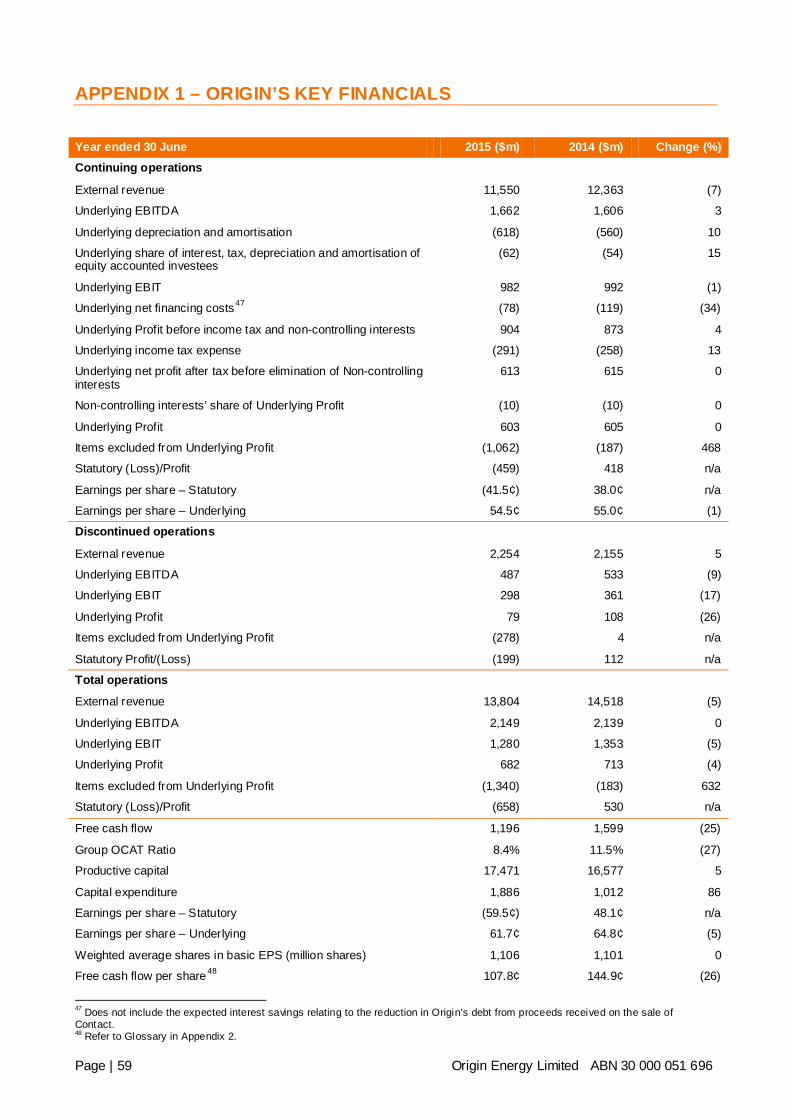
APPENDIX 1 – ORIGIN’S KEY FINANCIALS
Year ended 30 June 2015 ($m) 2014 ($m) Change (%) Continuing operations
External revenue 11,550 12,363 (7)
Underlying EBITDA 1,662 1,606 3
Underlying depreciation and amortisation (618) (560) 10
Underlying share of interest, tax, depreciation and amortisation of equity accounted investees
(62) (54) 15
Underlying EBIT 982 992 (1)
Underlying net financing costs47 (78) (119) (34)
Underlying Profit before income tax and non-controlling interests 904 873 4
Underlying income tax expense (291) (258) 13
Underlying net profit after tax before elimination of Non-controlling interests
613 615 0
Non-controlling interests’ share of Underlying Profit (10) (10) 0
Underlying Profit 603 605 0
Items excluded from Underlying Profit (1,062) (187) 468
Statutory (Loss)/Profit (459) 418 n/a
Earnings per share – Statutory (41.5¢) 38.0¢ n/a
Earnings per share – Underlying 54.5¢ 55.0¢ (1)
Discontinued operations
External revenue 2,254 2,155 5
Underlying EBITDA 487 533 (9)
Underlying EBIT 298 361 (17)
Underlying Profit 79 108 (26)
Items excluded from Underlying Profit (278) 4 n/a
Statutory Profit/(Loss) (199) 112 n/a
Total operations
External revenue 13,804 14,518 (5)
Underlying EBITDA 2,149 2,139 0
Underlying EBIT 1,280 1,353 (5)
Underlying Profit 682 713 (4)
Items excluded from Underlying Profit (1,340) (183) 632
Statutory (Loss)/Profit (658) 530 n/a
Free cash flow 1,196 1,599 (25)
Group OCAT Ratio 8.4% 11.5% (27)
Productive capital 17,471 16,577 5
Capital expenditure 1,886 1,012 86
Earnings per share – Statutory (59.5¢) 48.1¢ n/a
Earnings per share – Underlying 61.7¢ 64.8¢ (5)
Weighted average shares in basic EPS (million shares) 1,106 1,101 0
Free cash flow per share48 107.8¢ 144.9¢ (26)
47 Does not include the expected interest savings relating to the reduction in Origin’s debt from proceeds received on the sale of Contact. 48 Refer to Glossary in Appendix 2.
Page | 59 Origin Energy Limited ABN 30 000 051 696
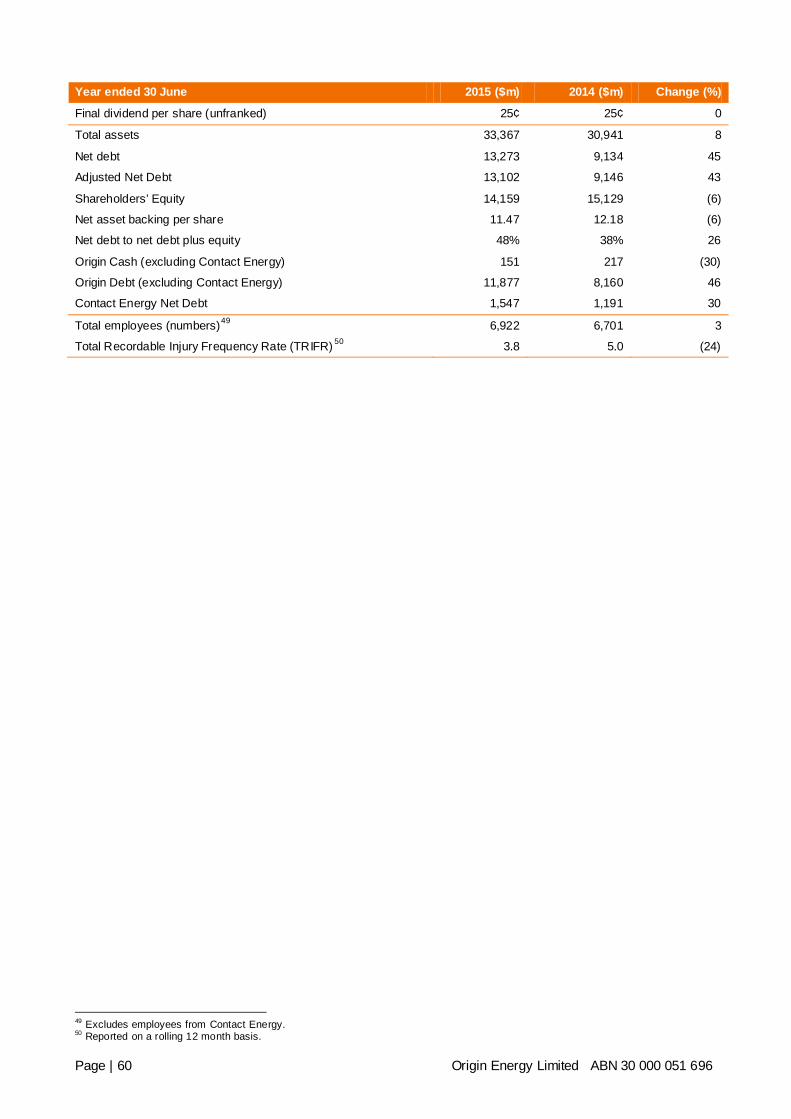
Year ended 30 June 2015 ($m) 2014 ($m) Change (%)
Final dividend per share (unfranked) 25¢ 25¢ 0
Total assets 33,367 30,941 8
Net debt 13,273 9,134 45
Adjusted Net Debt 13,102 9,146 43
Shareholders’ Equity 14,159 15,129 (6)
Net asset backing per share 11.47 12.18 (6)
Net debt to net debt plus equity 48% 38% 26
Origin Cash (excluding Contact Energy) 151 217 (30)
Origin Debt (excluding Contact Energy) 11,877 8,160 46
Contact Energy Net Debt 1,547 1,191 30
Total employees (numbers)49 6,922 6,701 3
Total Recordable Injury Frequency Rate (TRIFR) 50 3.8 5.0 (24)
49 Excludes employees from Contact Energy. 50 Reported on a rolling 12 month basis.
Page | 60 Origin Energy Limited ABN 30 000 051 696
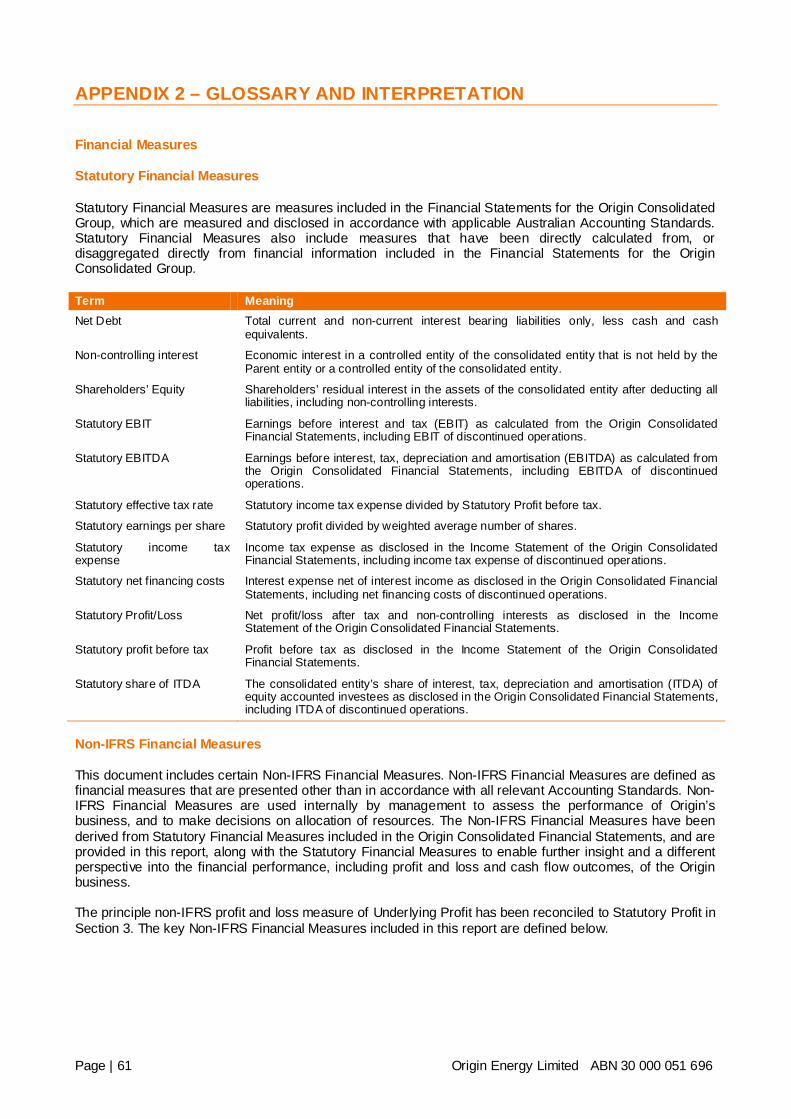
APPENDIX 2 – GLOSSARY AND INTERPRETATION
Financial Measures
Statutory Financial Measures
Statutory Financial Measures are measures included in the Financial Statements for the Origin Consolidated Group, which are measured and disclosed in accordance with applicable Australian Accounting Standards. Statutory Financial Measures also include measures that have been directly calculated from, or disaggregated directly from financial information included in the Financial Statements for the Origin Consolidated Group. Term Meaning Net Debt Total current and non-current interest bearing liabilities only, less cash and cash
equivalents.
Non-controlling interest Economic interest in a controlled entity of the consolidated entity that is not held by the Parent entity or a controlled entity of the consolidated entity.
Shareholders’ Equity Shareholders’ residual interest in the assets of the consolidated entity after deducting all liabilities, including non-controlling interests.
Statutory EBIT Earnings before interest and tax (EBIT) as calculated from the Origin Consolidated Financial Statements, including EBIT of discontinued operations.
Statutory EBITDA Earnings before interest, tax, depreciation and amortisation (EBITDA) as calculated from the Origin Consolidated Financial Statements, including EBITDA of discontinued operations.
Statutory effective tax rate Statutory income tax expense divided by Statutory Profit before tax.
Statutory earnings per share Statutory profit divided by weighted average number of shares.
Statutory income tax expense
Income tax expense as disclosed in the Income Statement of the Origin Consolidated Financial Statements, including income tax expense of discontinued operations.
Statutory net financing costs Interest expense net of interest income as disclosed in the Origin Consolidated Financial Statements, including net financing costs of discontinued operations.
Statutory Profit/Loss Net profit/loss after tax and non-controlling interests as disclosed in the Income Statement of the Origin Consolidated Financial Statements.
Statutory profit before tax Profit before tax as disclosed in the Income Statement of the Origin Consolidated Financial Statements.
Statutory share of ITDA The consolidated entity’s share of interest, tax, depreciation and amortisation (ITDA) of equity accounted investees as disclosed in the Origin Consolidated Financial Statements, including ITDA of discontinued operations.
Non-IFRS Financial Measures
This document includes certain Non-IFRS Financial Measures. Non-IFRS Financial Measures are defined as financial measures that are presented other than in accordance with all relevant Accounting Standards. Non-IFRS Financial Measures are used internally by management to assess the performance of Origin’s business, and to make decisions on allocation of resources. The Non-IFRS Financial Measures have been derived from Statutory Financial Measures included in the Origin Consolidated Financial Statements, and are provided in this report, along with the Statutory Financial Measures to enable further insight and a different perspective into the financial performance, including profit and loss and cash flow outcomes, of the Origin business. The principle non-IFRS profit and loss measure of Underlying Profit has been reconciled to Statutory Profit in Section 3. The key Non-IFRS Financial Measures included in this report are defined below.
Page | 61 Origin Energy Limited ABN 30 000 051 696
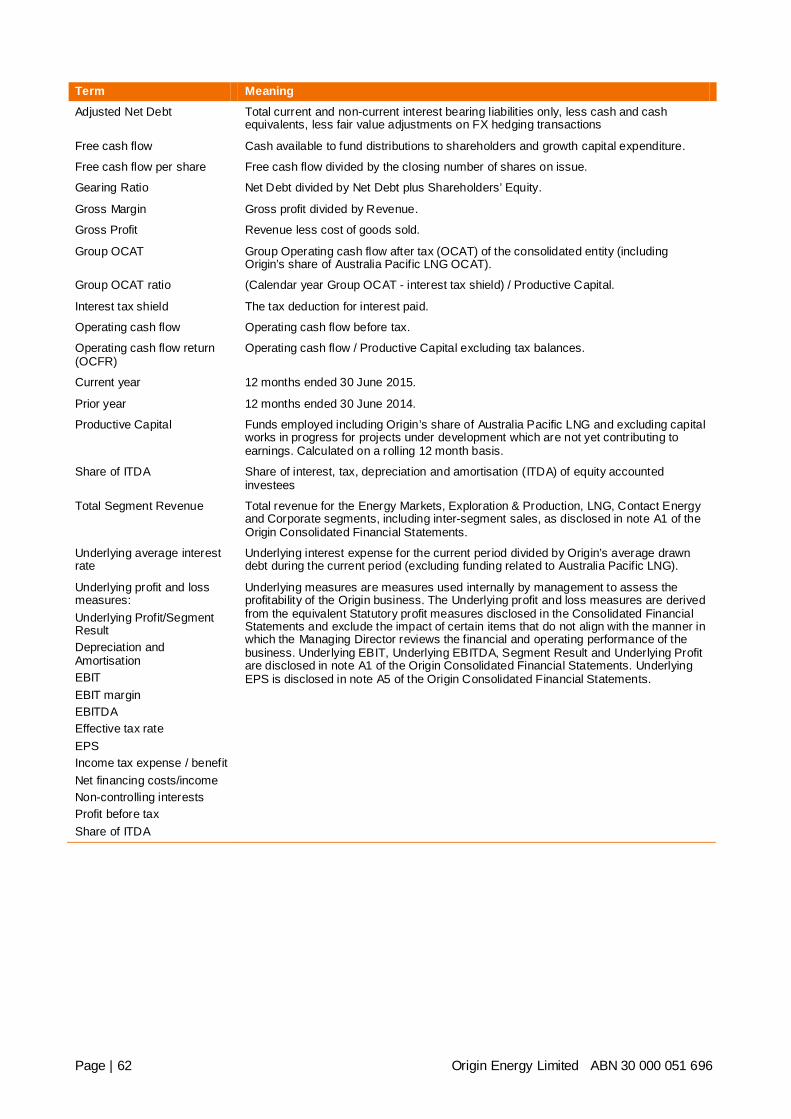
Term Meaning Adjusted Net Debt Total current and non-current interest bearing liabilities only, less cash and cash
equivalents, less fair value adjustments on FX hedging transactions
Free cash flow Cash available to fund distributions to shareholders and growth capital expenditure.
Free cash flow per share Free cash flow divided by the closing number of shares on issue.
Gearing Ratio Net Debt divided by Net Debt plus Shareholders’ Equity.
Gross Margin Gross profit divided by Revenue.
Gross Profit Revenue less cost of goods sold.
Group OCAT Group Operating cash flow after tax (OCAT) of the consolidated entity (including Origin’s share of Australia Pacific LNG OCAT).
Group OCAT ratio (Calendar year Group OCAT - interest tax shield) / Productive Capital.
Interest tax shield The tax deduction for interest paid.
Operating cash flow Operating cash flow before tax.
Operating cash flow return (OCFR)
Operating cash flow / Productive Capital excluding tax balances.
Current year 12 months ended 30 June 2015.
Prior year 12 months ended 30 June 2014.
Productive Capital Funds employed including Origin’s share of Australia Pacific LNG and excluding capital works in progress for projects under development which are not yet contributing to earnings. Calculated on a rolling 12 month basis.
Share of ITDA Share of interest, tax, depreciation and amortisation (ITDA) of equity accounted investees
Total Segment Revenue Total revenue for the Energy Markets, Exploration & Production, LNG, Contact Energy and Corporate segments, including inter-segment sales, as disclosed in note A1 of the Origin Consolidated Financial Statements.
Underlying average interest rate
Underlying interest expense for the current period divided by Origin’s average drawn debt during the current period (excluding funding related to Australia Pacific LNG).
Underlying profit and loss measures: Underlying Profit/Segment Result Depreciation and Amortisation EBIT EBIT margin EBITDA Effective tax rate EPS Income tax expense / benefit Net financing costs/income Non-controlling interests Profit before tax Share of ITDA
Underlying measures are measures used internally by management to assess the profitability of the Origin business. The Underlying profit and loss measures are derived from the equivalent Statutory profit measures disclosed in the Consolidated Financial Statements and exclude the impact of certain items that do not align with the manner in which the Managing Director reviews the financial and operating performance of the business. Underlying EBIT, Underlying EBITDA, Segment Result and Underlying Profit are disclosed in note A1 of the Origin Consolidated Financial Statements. Underlying EPS is disclosed in note A5 of the Origin Consolidated Financial Statements.
Page | 62 Origin Energy Limited ABN 30 000 051 696
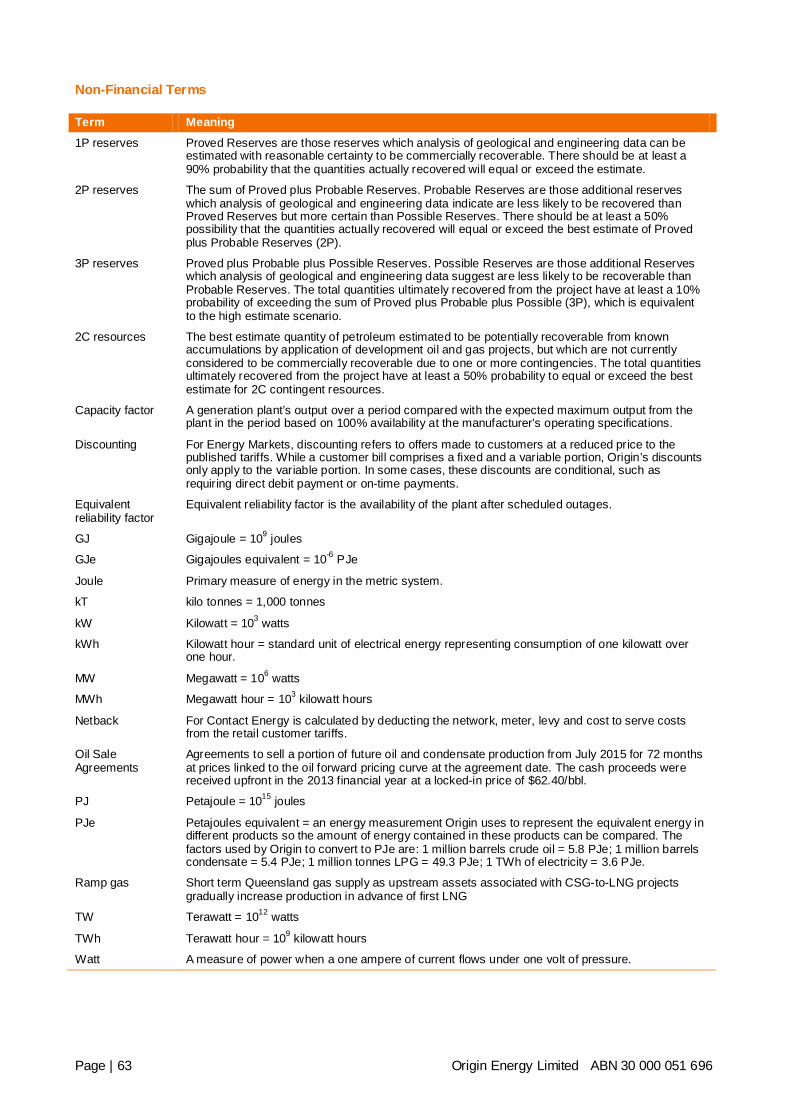
Non-Financial Terms
Term Meaning 1P reserves Proved Reserves are those reserves which analysis of geological and engineering data can be
estimated with reasonable certainty to be commercially recoverable. There should be at least a 90% probability that the quantities actually recovered will equal or exceed the estimate.
2P reserves The sum of Proved plus Probable Reserves. Probable Reserves are those additional reserves which analysis of geological and engineering data indicate are less likely to be recovered than Proved Reserves but more certain than Possible Reserves. There should be at least a 50% possibility that the quantities actually recovered will equal or exceed the best estimate of Proved plus Probable Reserves (2P).
3P reserves Proved plus Probable plus Possible Reserves. Possible Reserves are those additional Reserves which analysis of geological and engineering data suggest are less likely to be recoverable than Probable Reserves. The total quantities ultimately recovered from the project have at least a 10% probability of exceeding the sum of Proved plus Probable plus Possible (3P), which is equivalent to the high estimate scenario.
2C resources The best estimate quantity of petroleum estimated to be potentially recoverable from known accumulations by application of development oil and gas projects, but which are not currently considered to be commercially recoverable due to one or more contingencies. The total quantities ultimately recovered from the project have at least a 50% probability to equal or exceed the best estimate for 2C contingent resources.
Capacity factor A generation plant’s output over a period compared with the expected maximum output from the plant in the period based on 100% availability at the manufacturer’s operating specifications.
Discounting For Energy Markets, discounting refers to offers made to customers at a reduced price to the published tariffs. While a customer bill comprises a fixed and a variable portion, Origin’s discounts only apply to the variable portion. In some cases, these discounts are conditional, such as requiring direct debit payment or on-time payments.
Equivalent reliability factor
Equivalent reliability factor is the availability of the plant after scheduled outages.
GJ Gigajoule = 109 joules
GJe Gigajoules equivalent = 10-6 PJe
Joule Primary measure of energy in the metric system.
kT kilo tonnes = 1,000 tonnes
kW Kilowatt = 103 watts
kWh Kilowatt hour = standard unit of electrical energy representing consumption of one kilowatt over one hour.
MW Megawatt = 106 watts
MWh Megawatt hour = 103 kilowatt hours
Netback For Contact Energy is calculated by deducting the network, meter, levy and cost to serve costs from the retail customer tariffs.
Oil Sale Agreements
Agreements to sell a portion of future oil and condensate production from July 2015 for 72 months at prices linked to the oil forward pricing curve at the agreement date. The cash proceeds were received upfront in the 2013 financial year at a locked-in price of $62.40/bbl.
PJ Petajoule = 1015 joules
PJe Petajoules equivalent = an energy measurement Origin uses to represent the equivalent energy in different products so the amount of energy contained in these products can be compared. The factors used by Origin to convert to PJe are: 1 million barrels crude oil = 5.8 PJe; 1 million barrels condensate = 5.4 PJe; 1 million tonnes LPG = 49.3 PJe; 1 TWh of electricity = 3.6 PJe.
Ramp gas Short term Queensland gas supply as upstream assets associated with CSG-to-LNG projects gradually increase production in advance of first LNG
TW Terawatt = 1012 watts
TWh Terawatt hour = 109 kilowatt hours
Watt A measure of power when a one ampere of current flows under one volt of pressure.
Page | 63 Origin Energy Limited ABN 30 000 051 696

Interpretation
All comparable results reflect a comparison between the current year and the prior year ended 30 June 2014, unless specifically stated otherwise. A reference to Contact Energy is a reference to Origin’s controlled entity (53.09% ownership) Contact Energy Limited in New Zealand. In accordance with Australian Accounting Standards, Origin consolidates Contact Energy within its result. On 10 August 2015, Origin divested its entire interest in Contact Energy. A reference to Australia Pacific LNG or APLNG is a reference to Australia Pacific LNG Pty Limited in which Origin holds a 37.5% shareholding. Origin’s shareholding in Australia Pacific LNG is equity accounted. A reference to $ is a reference to Australian dollars unless specifically marked otherwise. All references to debt are a reference to interest bearing debt only (excludes Australia Pacific LNG shareholder loans). Individual items and totals are rounded to the nearest appropriate number or decimal. Some totals may not add down the page due to rounding of individual components. When calculating a percentage change, a positive or negative percentage change denotes the mathematical movement in the underlying metric, rather than a positive or a detrimental impact. Percentage changes on measures for which the numbers change from negative to positive, or vice versa, are labelled as not applicable.
Page | 64 Origin Energy Limited ABN 30 000 051 696

REMUNERATION REPORT For the year ended 30 June 2015 This report is attached to and forms part of the Directors’ Report
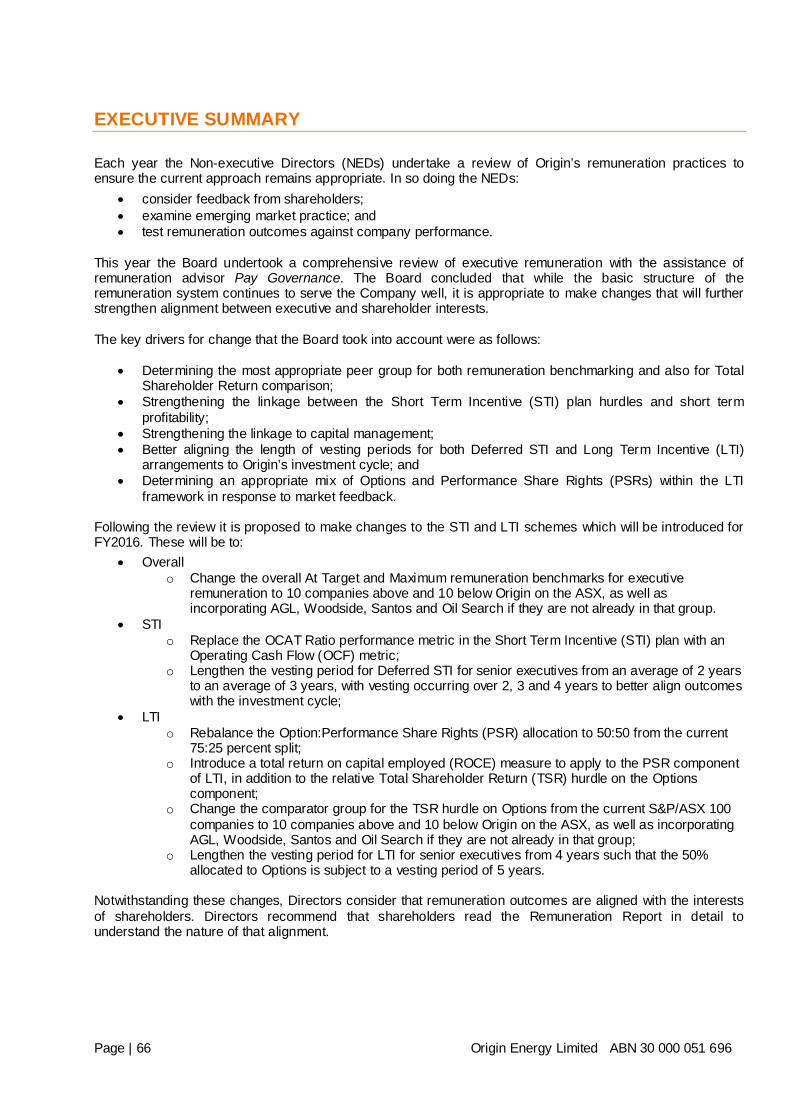
EXECUTIVE SUMMARY
Each year the Non-executive Directors (NEDs) undertake a review of Origin’s remuneration practices to ensure the current approach remains appropriate. In so doing the NEDs:
• consider feedback from shareholders; • examine emerging market practice; and • test remuneration outcomes against company performance.
This year the Board undertook a comprehensive review of executive remuneration with the assistance of remuneration advisor Pay Governance. The Board concluded that while the basic structure of the remuneration system continues to serve the Company well, it is appropriate to make changes that will further strengthen alignment between executive and shareholder interests. The key drivers for change that the Board took into account were as follows:
• Determining the most appropriate peer group for both remuneration benchmarking and also for Total Shareholder Return comparison;
• Strengthening the linkage between the Short Term Incentive (STI) plan hurdles and short term profitability;
• Strengthening the linkage to capital management; • Better aligning the length of vesting periods for both Deferred STI and Long Term Incentive (LTI)
arrangements to Origin’s investment cycle; and • Determining an appropriate mix of Options and Performance Share Rights (PSRs) within the LTI
framework in response to market feedback. Following the review it is proposed to make changes to the STI and LTI schemes which will be introduced for FY2016. These will be to:
• Overall o Change the overall At Target and Maximum remuneration benchmarks for executive
remuneration to 10 companies above and 10 below Origin on the ASX, as well as incorporating AGL, Woodside, Santos and Oil Search if they are not already in that group.
• STI o Replace the OCAT Ratio performance metric in the Short Term Incentive (STI) plan with an
Operating Cash Flow (OCF) metric; o Lengthen the vesting period for Deferred STI for senior executives from an average of 2 years
to an average of 3 years, with vesting occurring over 2, 3 and 4 years to better align outcomes with the investment cycle;
• LTI o Rebalance the Option:Performance Share Rights (PSR) allocation to 50:50 from the current
75:25 percent split; o Introduce a total return on capital employed (ROCE) measure to apply to the PSR component
of LTI, in addition to the relative Total Shareholder Return (TSR) hurdle on the Options component;
o Change the comparator group for the TSR hurdle on Options from the current S&P/ASX 100 companies to 10 companies above and 10 below Origin on the ASX, as well as incorporating AGL, Woodside, Santos and Oil Search if they are not already in that group;
o Lengthen the vesting period for LTI for senior executives from 4 years such that the 50% allocated to Options is subject to a vesting period of 5 years.
Notwithstanding these changes, Directors consider that remuneration outcomes are aligned with the interests of shareholders. Directors recommend that shareholders read the Remuneration Report in detail to understand the nature of that alignment.
Page | 66 Origin Energy Limited ABN 30 000 051 696
1. INTRODUCTION
Following a comprehensive review of Origin’s remuneration approach, undertaken with the assistance of Pay Governance, Director’s have reached the following conclusions:
• The existing remuneration system is focused on delivering shareholder value over the long term (Section 2);
• Remuneration outcomes for executives reflect returns to shareholders (Section 3); • Remuneration changes will support further alignment of the interests of executives and shareholders
(Section 4); • Appropriate governance and remuneration arrangements for Non-Executive Directors (NEDs) ensure
a strong focus on shareholders’ interests (Section 5). This report is focused on executives who are Key Management Personnel (KMP). It also provides a broad perspective on other employees of the Group whose remuneration includes awards under the LTI arrangements (which at June 2015 included approximately 100 executives).
Page | 67 Origin Energy Limited ABN 30 000 051 696
2. ORIGIN’S EXISTING REMUNERATION SYSTEM IS FOCUSED ON DELIVERING SHAREHOLDER VALUE OVER THE LONG TERM
The overriding objective of Origin’s remuneration system is to align the interests of staff and shareholders, while attracting and retaining valuable staff. Origin strives to do this by:
• Aligning the interests of executives and shareholders by providing rewards that support shareholder value creation; and
• Attracting and retaining high calibre executives from diverse backgrounds through a fair and competitive remuneration structure that appropriately rewards and incentivises superior performance.
Origin’s senior management remuneration, including for KMP, consists of three main elements, namely Fixed Remuneration; Short Term Incentives (STI); and Long-Term Incentives (LTI). Origin’s remuneration policy is designed so that each of these elements supports the overall objectives described above. In addition, the policy works to reward superior executive performance by paying in the top quartile of the market through a full STI and LTI allocation. The way Fixed Remuneration, STI and LTI operate together is described in greater detail in Sections 2.1 to 2.5. Changes that are proposed to the existing remuneration approach are outlined in Section 4. 2.1 Fixed Remuneration is benchmarked to the midpoint of the external market to
attract quality people who can deliver value for shareholders.
Fixed Remuneration takes into account the size and complexity of a recipient’s role, and the skills required to succeed in such a position. It includes cash salary, employer contributions to superannuation and salary sacrifice benefits. As the Group employs staff across a broad spectrum of roles and disciplines, the Hay Group’s All Organisations’ benchmark, representing approximately 430 organisations, is used as the major reference for most roles51. For KMP roles, more specific benchmarking is used, focusing on industry peers and comparable S&P/ASX companies. Refinements to that policy are outlined in Section 4. 2.2 Short Term Incentive awards are designed to reward superior achievement for
shareholders in relation to key operational measures.
STI plays a key role in aligning superior operational outcomes for shareholders with the remuneration outcomes for management. The amount of STI awarded reflects financial and operational outcomes over the course of the financial year. The STI opportunity levels vary according to the Business Unit served by the recipient and according to their role. The amount at risk increases with job size and the capacity to influence the overall performance of the business as shown in Table 1:
51 For job families in skill shortage areas (such as geosciences and some professional specialists) the relevant market has been determined by reference to smaller peer groups such as those sourced from commissioned surveys and industry forums such as National Rewards Group. Page | 68 Origin Energy Limited ABN 30 000 051 696
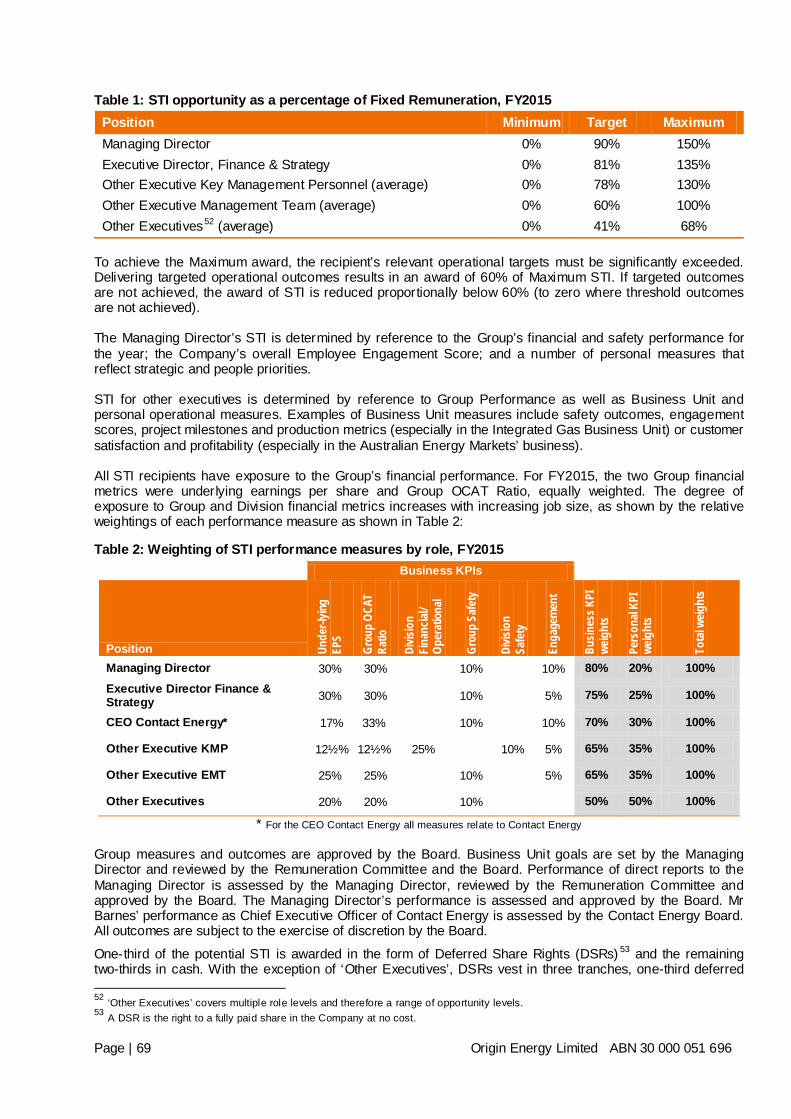
Table 1: STI opportunity as a percentage of Fixed Remuneration, FY2015 Position Minimum Target Maximum Managing Director 0% 90% 150% Executive Director, Finance & Strategy 0% 81% 135% Other Executive Key Management Personnel (average) 0% 78% 130% Other Executive Management Team (average) 0% 60% 100% Other Executives52 (average) 0% 41% 68%
To achieve the Maximum award, the recipient’s relevant operational targets must be significantly exceeded. Delivering targeted operational outcomes results in an award of 60% of Maximum STI. If targeted outcomes are not achieved, the award of STI is reduced proportionally below 60% (to zero where threshold outcomes are not achieved). The Managing Director’s STI is determined by reference to the Group’s financial and safety performance for the year; the Company’s overall Employee Engagement Score; and a number of personal measures that reflect strategic and people priorities. STI for other executives is determined by reference to Group Performance as well as Business Unit and personal operational measures. Examples of Business Unit measures include safety outcomes, engagement scores, project milestones and production metrics (especially in the Integrated Gas Business Unit) or customer satisfaction and profitability (especially in the Australian Energy Markets’ business). All STI recipients have exposure to the Group’s financial performance. For FY2015, the two Group financial metrics were underlying earnings per share and Group OCAT Ratio, equally weighted. The degree of exposure to Group and Division financial metrics increases with increasing job size, as shown by the relative weightings of each performance measure as shown in Table 2:
Table 2: Weighting of STI performance measures by role, FY2015 Business KPIs
Position Unde
r-lyin
g EP
S
Grou
p OC
AT
Ratio
Divis
ion
Fina
ncial
/ Op
erat
ional
Grou
p Sa
fety
Divis
ion
Sa
fety
Enga
gem
ent
Busin
ess K
PI
weig
hts
Pers
onal
KPI
weig
hts
Tota
l weig
hts
Managing Director 30% 30% 10% 10% 80% 20% 100% Executive Director Finance & Strategy 30% 30% 10% 5% 75% 25% 100%
CEO Contact Energy* 17% 33% 10% 10% 70% 30% 100%
Other Executive KMP 12½% 12½% 25% 10% 5% 65% 35% 100%
Other Executive EMT 25% 25% 10% 5% 65% 35% 100%
Other Executives 20% 20% 10% 50% 50% 100%
* For the CEO Contact Energy all measures relate to Contact Energy Group measures and outcomes are approved by the Board. Business Unit goals are set by the Managing Director and reviewed by the Remuneration Committee and the Board. Performance of direct reports to the Managing Director is assessed by the Managing Director, reviewed by the Remuneration Committee and approved by the Board. The Managing Director’s performance is assessed and approved by the Board. Mr Barnes’ performance as Chief Executive Officer of Contact Energy is assessed by the Contact Energy Board. All outcomes are subject to the exercise of discretion by the Board. One-third of the potential STI is awarded in the form of Deferred Share Rights (DSRs) 53 and the remaining two-thirds in cash. With the exception of ‘Other Executives’, DSRs vest in three tranches, one-third deferred
52 ‘Other Executives’ covers multiple role levels and therefore a range of opportunity levels. 53 A DSR is the right to a fully paid share in the Company at no cost. Page | 69 Origin Energy Limited ABN 30 000 051 696
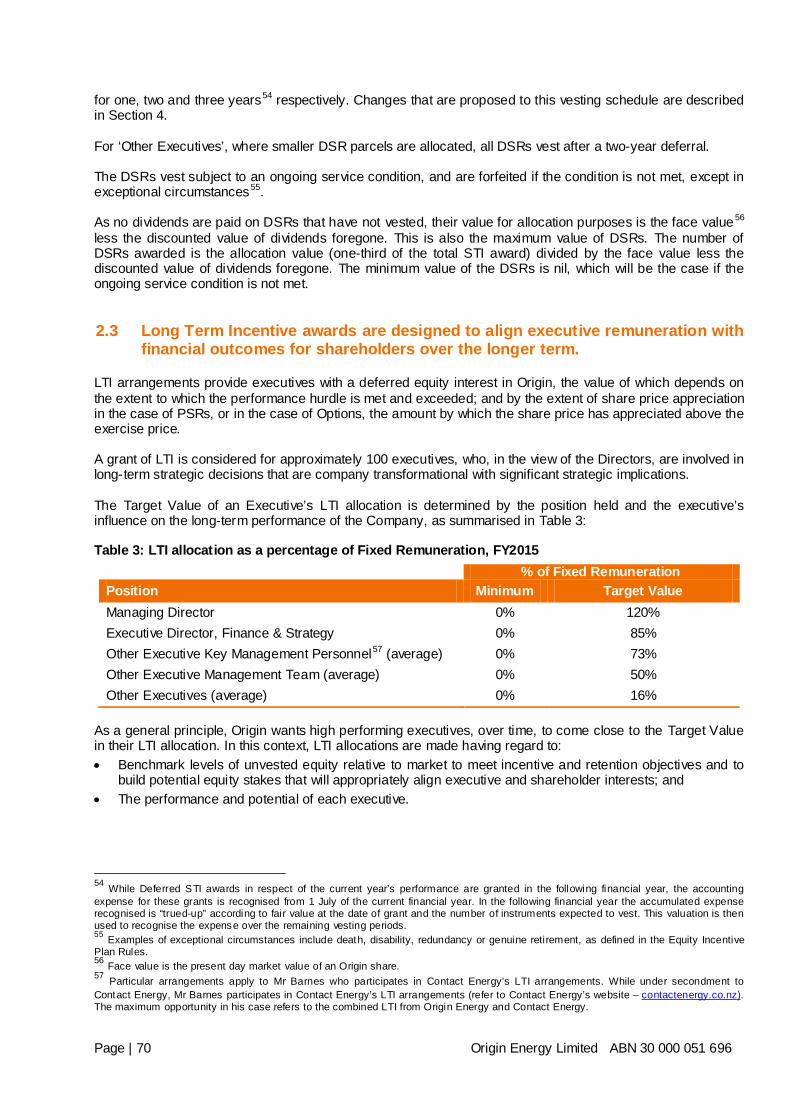
for one, two and three years54 respectively. Changes that are proposed to this vesting schedule are described in Section 4. For ‘Other Executives’, where smaller DSR parcels are allocated, all DSRs vest after a two-year deferral. The DSRs vest subject to an ongoing service condition, and are forfeited if the condition is not met, except in exceptional circumstances55. As no dividends are paid on DSRs that have not vested, their value for allocation purposes is the face value56 less the discounted value of dividends foregone. This is also the maximum value of DSRs. The number of DSRs awarded is the allocation value (one-third of the total STI award) divided by the face value less the discounted value of dividends foregone. The minimum value of the DSRs is nil, which will be the case if the ongoing service condition is not met.
2.3 Long Term Incentive awards are designed to align executive remuneration with financial outcomes for shareholders over the longer term.
LTI arrangements provide executives with a deferred equity interest in Origin, the value of which depends on the extent to which the performance hurdle is met and exceeded; and by the extent of share price appreciation in the case of PSRs, or in the case of Options, the amount by which the share price has appreciated above the exercise price. A grant of LTI is considered for approximately 100 executives, who, in the view of the Directors, are involved in long-term strategic decisions that are company transformational with significant strategic implications. The Target Value of an Executive’s LTI allocation is determined by the position held and the executive’s influence on the long-term performance of the Company, as summarised in Table 3: Table 3: LTI allocation as a percentage of Fixed Remuneration, FY2015
% of Fixed Remuneration Position Minimum Target Value Managing Director 0% 120% Executive Director, Finance & Strategy 0% 85% Other Executive Key Management Personnel57 (average) 0% 73% Other Executive Management Team (average) 0% 50% Other Executives (average) 0% 16%
As a general principle, Origin wants high performing executives, over time, to come close to the Target Value in their LTI allocation. In this context, LTI allocations are made having regard to: • Benchmark levels of unvested equity relative to market to meet incentive and retention objectives and to
build potential equity stakes that will appropriately align executive and shareholder interests; and • The performance and potential of each executive.
54 While Deferred STI awards in respect of the current year’s performance are granted in the following financial year, the accounting expense for these grants is recognised from 1 July of the current financial year. In the following financial year the accumulated expense recognised is “trued-up” according to fair value at the date of grant and the number of instruments expected to vest. This valuation is then used to recognise the expense over the remaining vesting periods. 55 Examples of exceptional circumstances include death, disability, redundancy or genuine retirement, as defined in the Equity Incentive Plan Rules. 56 Face value is the present day market value of an Origin share. 57 Particular arrangements apply to Mr Barnes who participates in Contact Energy’s LTI arrangements. While under secondment to Contact Energy, Mr Barnes participates in Contact Energy’s LTI arrangements (refer to Contact Energy’s website – contactenergy.co.nz). The maximum opportunity in his case refers to the combined LTI from Origin Energy and Contact Energy. Page | 70 Origin Energy Limited ABN 30 000 051 696
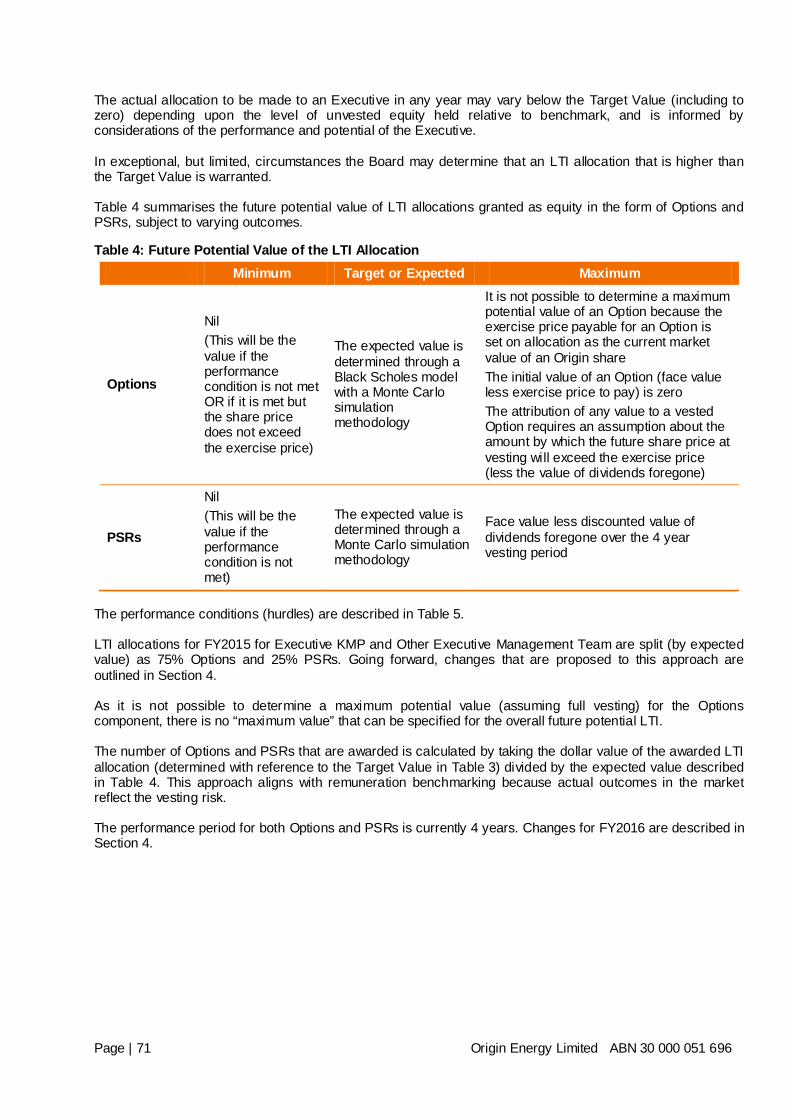
The actual allocation to be made to an Executive in any year may vary below the Target Value (including to zero) depending upon the level of unvested equity held relative to benchmark, and is informed by considerations of the performance and potential of the Executive. In exceptional, but limited, circumstances the Board may determine that an LTI allocation that is higher than the Target Value is warranted. Table 4 summarises the future potential value of LTI allocations granted as equity in the form of Options and PSRs, subject to varying outcomes.
Table 4: Future Potential Value of the LTI Allocation Minimum Target or Expected Maximum
Options
Nil (This will be the value if the performance condition is not met OR if it is met but the share price does not exceed the exercise price)
The expected value is determined through a Black Scholes model with a Monte Carlo simulation methodology
It is not possible to determine a maximum potential value of an Option because the exercise price payable for an Option is set on allocation as the current market value of an Origin share The initial value of an Option (face value less exercise price to pay) is zero The attribution of any value to a vested Option requires an assumption about the amount by which the future share price at vesting will exceed the exercise price (less the value of dividends foregone)
PSRs
Nil (This will be the value if the performance condition is not met)
The expected value is determined through a Monte Carlo simulation methodology
Face value less discounted value of dividends foregone over the 4 year vesting period
The performance conditions (hurdles) are described in Table 5. LTI allocations for FY2015 for Executive KMP and Other Executive Management Team are split (by expected value) as 75% Options and 25% PSRs. Going forward, changes that are proposed to this approach are outlined in Section 4. As it is not possible to determine a maximum potential value (assuming full vesting) for the Options component, there is no “maximum value” that can be specified for the overall future potential LTI. The number of Options and PSRs that are awarded is calculated by taking the dollar value of the awarded LTI allocation (determined with reference to the Target Value in Table 3) divided by the expected value described in Table 4. This approach aligns with remuneration benchmarking because actual outcomes in the market reflect the vesting risk. The performance period for both Options and PSRs is currently 4 years. Changes for FY2016 are described in Section 4.
Page | 71 Origin Energy Limited ABN 30 000 051 696
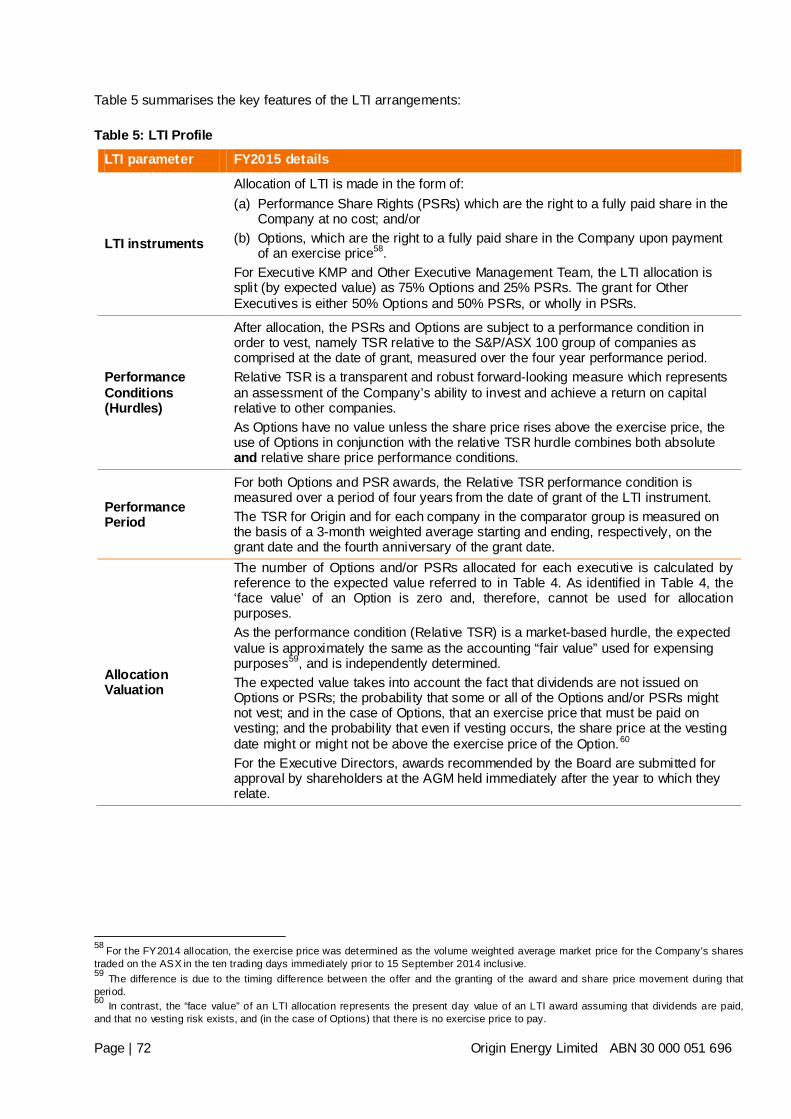
Table 5 summarises the key features of the LTI arrangements:
Table 5: LTI Profile LTI parameter FY2015 details
LTI instruments
Allocation of LTI is made in the form of: (a) Performance Share Rights (PSRs) which are the right to a fully paid share in the
Company at no cost; and/or (b) Options, which are the right to a fully paid share in the Company upon payment
of an exercise price58. For Executive KMP and Other Executive Management Team, the LTI allocation is split (by expected value) as 75% Options and 25% PSRs. The grant for Other Executives is either 50% Options and 50% PSRs, or wholly in PSRs.
Performance Conditions (Hurdles)
After allocation, the PSRs and Options are subject to a performance condition in order to vest, namely TSR relative to the S&P/ASX 100 group of companies as comprised at the date of grant, measured over the four year performance period. Relative TSR is a transparent and robust forward-looking measure which represents an assessment of the Company’s ability to invest and achieve a return on capital relative to other companies. As Options have no value unless the share price rises above the exercise price, the use of Options in conjunction with the relative TSR hurdle combines both absolute and relative share price performance conditions.
Performance Period
For both Options and PSR awards, the Relative TSR performance condition is measured over a period of four years from the date of grant of the LTI instrument. The TSR for Origin and for each company in the comparator group is measured on the basis of a 3-month weighted average starting and ending, respectively, on the grant date and the fourth anniversary of the grant date.
Allocation Valuation
The number of Options and/or PSRs allocated for each executive is calculated by reference to the expected value referred to in Table 4. As identified in Table 4, the ‘face value’ of an Option is zero and, therefore, cannot be used for allocation purposes. As the performance condition (Relative TSR) is a market-based hurdle, the expected value is approximately the same as the accounting “fair value” used for expensing purposes59, and is independently determined. The expected value takes into account the fact that dividends are not issued on Options or PSRs; the probability that some or all of the Options and/or PSRs might not vest; and in the case of Options, that an exercise price that must be paid on vesting; and the probability that even if vesting occurs, the share price at the vesting date might or might not be above the exercise price of the Option.60 For the Executive Directors, awards recommended by the Board are submitted for approval by shareholders at the AGM held immediately after the year to which they relate.
58 For the FY2014 allocation, the exercise price was determined as the volume weighted average market price for the Company’s shares traded on the ASX in the ten trading days immediately prior to 15 September 2014 inclusive. 59 The difference is due to the timing difference between the offer and the granting of the award and share price movement during that period. 60 In contrast, the “face value” of an LTI allocation represents the present day value of an LTI award assuming that dividends are paid, and that no vesting risk exists, and (in the case of Options) that there is no exercise price to pay. Page | 72 Origin Energy Limited ABN 30 000 051 696
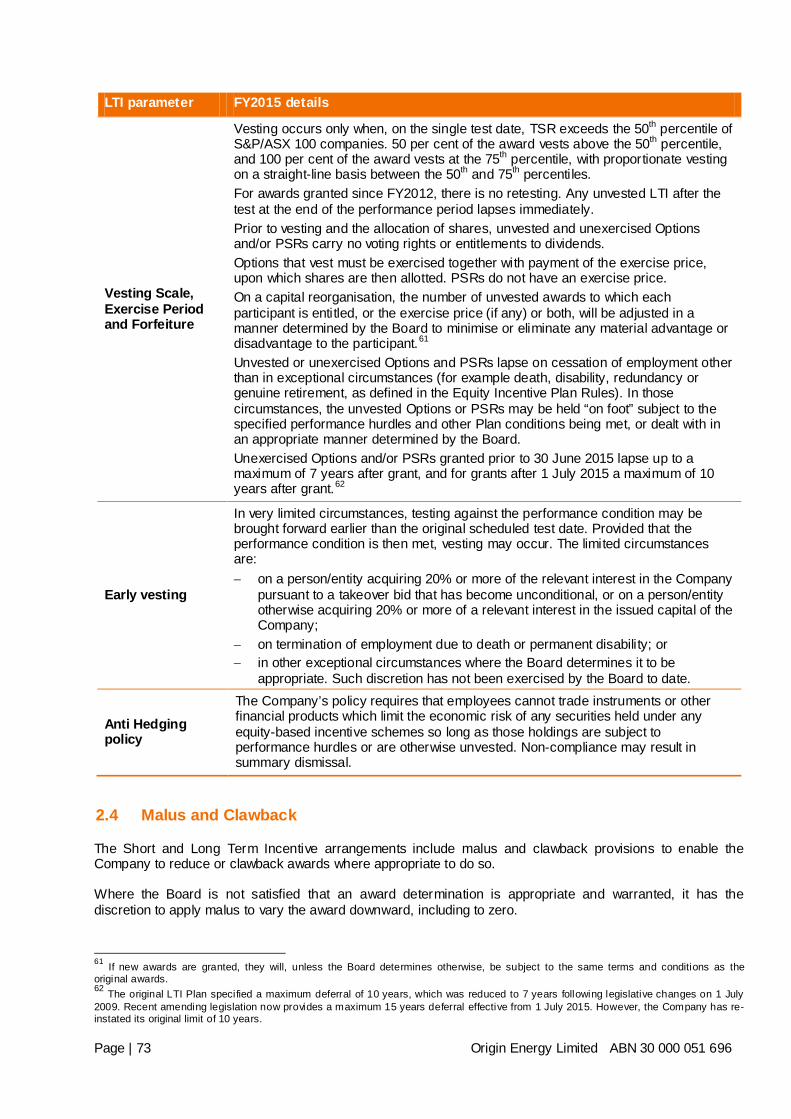
LTI parameter FY2015 details
Vesting Scale, Exercise Period and Forfeiture
Vesting occurs only when, on the single test date, TSR exceeds the 50th percentile of S&P/ASX 100 companies. 50 per cent of the award vests above the 50th percentile, and 100 per cent of the award vests at the 75th percentile, with proportionate vesting on a straight-line basis between the 50th and 75th percentiles. For awards granted since FY2012, there is no retesting. Any unvested LTI after the test at the end of the performance period lapses immediately. Prior to vesting and the allocation of shares, unvested and unexercised Options and/or PSRs carry no voting rights or entitlements to dividends. Options that vest must be exercised together with payment of the exercise price, upon which shares are then allotted. PSRs do not have an exercise price. On a capital reorganisation, the number of unvested awards to which each participant is entitled, or the exercise price (if any) or both, will be adjusted in a manner determined by the Board to minimise or eliminate any material advantage or disadvantage to the participant.61 Unvested or unexercised Options and PSRs lapse on cessation of employment other than in exceptional circumstances (for example death, disability, redundancy or genuine retirement, as defined in the Equity Incentive Plan Rules). In those circumstances, the unvested Options or PSRs may be held “on foot” subject to the specified performance hurdles and other Plan conditions being met, or dealt with in an appropriate manner determined by the Board. Unexercised Options and/or PSRs granted prior to 30 June 2015 lapse up to a maximum of 7 years after grant, and for grants after 1 July 2015 a maximum of 10 years after grant.62
Early vesting
In very limited circumstances, testing against the performance condition may be brought forward earlier than the original scheduled test date. Provided that the performance condition is then met, vesting may occur. The limited circumstances are: − on a person/entity acquiring 20% or more of the relevant interest in the Company
pursuant to a takeover bid that has become unconditional, or on a person/entity otherwise acquiring 20% or more of a relevant interest in the issued capital of the Company;
− on termination of employment due to death or permanent disability; or − in other exceptional circumstances where the Board determines it to be
appropriate. Such discretion has not been exercised by the Board to date.
Anti Hedging policy
The Company’s policy requires that employees cannot trade instruments or other financial products which limit the economic risk of any securities held under any equity-based incentive schemes so long as those holdings are subject to performance hurdles or are otherwise unvested. Non-compliance may result in summary dismissal.
2.4 Malus and Clawback
The Short and Long Term Incentive arrangements include malus and clawback provisions to enable the Company to reduce or clawback awards where appropriate to do so. Where the Board is not satisfied that an award determination is appropriate and warranted, it has the discretion to apply malus to vary the award downward, including to zero.
61 If new awards are granted, they will, unless the Board determines otherwise, be subject to the same terms and conditions as the original awards. 62 The original LTI Plan specified a maximum deferral of 10 years, which was reduced to 7 years following legislative changes on 1 July 2009. Recent amending legislation now provides a maximum 15 years deferral effective from 1 July 2015. However, the Company has re-instated its original limit of 10 years. Page | 73 Origin Energy Limited ABN 30 000 051 696
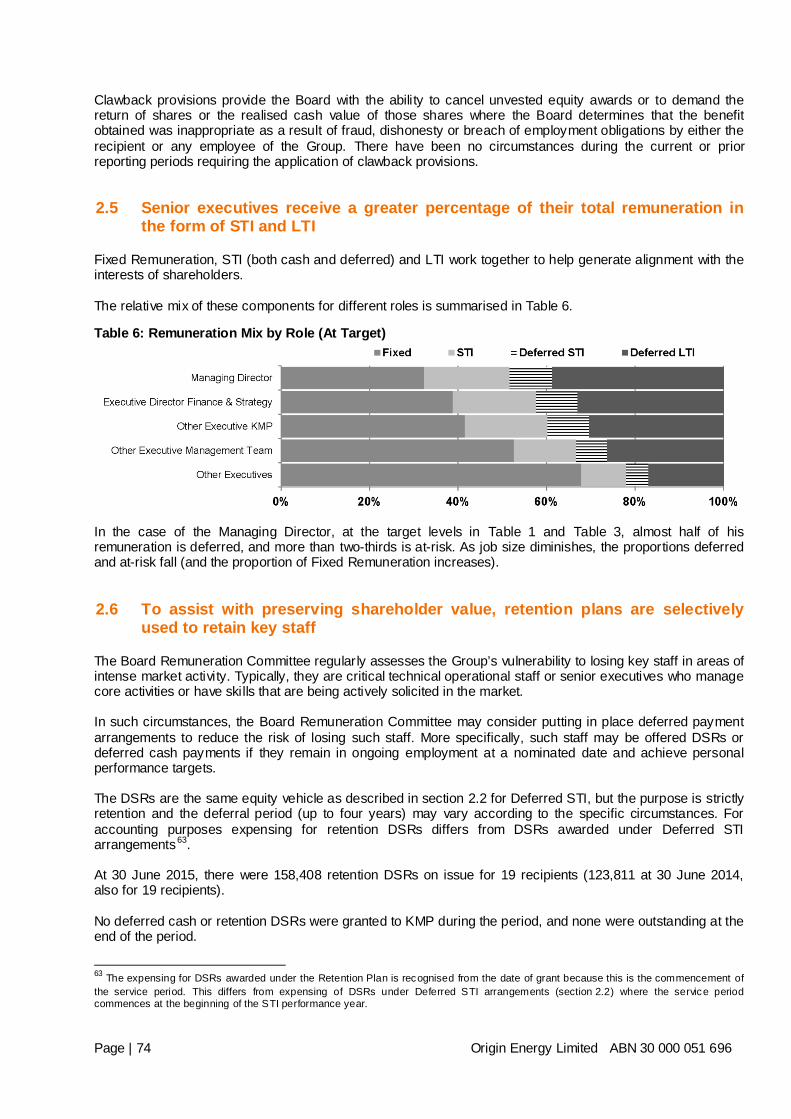
Clawback provisions provide the Board with the ability to cancel unvested equity awards or to demand the return of shares or the realised cash value of those shares where the Board determines that the benefit obtained was inappropriate as a result of fraud, dishonesty or breach of employment obligations by either the recipient or any employee of the Group. There have been no circumstances during the current or prior reporting periods requiring the application of clawback provisions. 2.5 Senior executives receive a greater percentage of their total remuneration in
the form of STI and LTI
Fixed Remuneration, STI (both cash and deferred) and LTI work together to help generate alignment with the interests of shareholders. The relative mix of these components for different roles is summarised in Table 6.
Table 6: Remuneration Mix by Role (At Target)
In the case of the Managing Director, at the target levels in Table 1 and Table 3, almost half of his remuneration is deferred, and more than two-thirds is at-risk. As job size diminishes, the proportions deferred and at-risk fall (and the proportion of Fixed Remuneration increases). 2.6 To assist with preserving shareholder value, retention plans are selectively
used to retain key staff
The Board Remuneration Committee regularly assesses the Group’s vulnerability to losing key staff in areas of intense market activity. Typically, they are critical technical operational staff or senior executives who manage core activities or have skills that are being actively solicited in the market. In such circumstances, the Board Remuneration Committee may consider putting in place deferred payment arrangements to reduce the risk of losing such staff. More specifically, such staff may be offered DSRs or deferred cash payments if they remain in ongoing employment at a nominated date and achieve personal performance targets. The DSRs are the same equity vehicle as described in section 2.2 for Deferred STI, but the purpose is strictly retention and the deferral period (up to four years) may vary according to the specific circumstances. For accounting purposes expensing for retention DSRs differs from DSRs awarded under Deferred STI arrangements63. At 30 June 2015, there were 158,408 retention DSRs on issue for 19 recipients (123,811 at 30 June 2014, also for 19 recipients). No deferred cash or retention DSRs were granted to KMP during the period, and none were outstanding at the end of the period.
63 The expensing for DSRs awarded under the Retention Plan is recognised from the date of grant because this is the commencement of the service period. This differs from expensing of DSRs under Deferred STI arrangements (section 2.2) where the service period commences at the beginning of the STI performance year. Page | 74 Origin Energy Limited ABN 30 000 051 696
2.7 The Employee Share Plan focuses all staff on safety
It is well known that operational excellence and safety performance are tightly linked. For this reason, the Board has determined that all staff should have an incentive to focus on safety. The Board has the ability to make an annual award of up to $1,000 worth of shares to all permanent employees in Australia and New Zealand (other than Executive Directors) with more than one year of service. Such an award is valued by staff, and for this reason the Board has determined that its allocation should be made subject to company-wide targets relating to safety being met during the year. Shares awarded under the Employee Share Plan must be held for at least three years following the award or until cessation of employment, whichever occurs first. For FY2015, a target was set for 80% of Actions to be closed out in the Company’s Health Safety & Environment Management System by the relevant manager or safety adviser. This target was exceeded (85.4%). As a result, the Company will award $1,000 worth of shares to approximately 5,600 eligible employees. The Company will acquire the requisite shares on market for transfer to employees during September 2015, subject to compliance with applicable regulations. 2.8 Shareholder interests are served by focusing on gender pay equity which aims
to make the most of the talents of all staff
Origin’s policy is to deliver equal pay for equal work, with a view to attracting and retaining quality staff regardless of gender. Research has shown that organisations that make the most of the talents of women are superior performers over time. Each year a central review of proposed pay arrangements for the coming 12 months is conducted for all divisions of the Company at all levels. If proposed pay arrangements diverge by plus or minus 2% between males and females within a job grade at the Business Unit or Company level, managers are required to revise recommendations until the variation is within 2%. Following the annual review in September 2014, the overall variation at Fixed Remuneration was within 0.5%, and gender variation for the allocation of Variable Remuneration was within 0.4%. A more detailed description of gender equity is provided in the Company’s Corporate Governance Statement. While equal work is rewarded with equal pay, females are over-represented in lower-graded jobs and under-represented in higher-graded jobs. The Corporate Governance Statement describes the Company’s initiatives and publicly stated goals that aim to improve the Company’s gender distribution profile and increase the proportion of women in senior roles.
Page | 75 Origin Energy Limited ABN 30 000 051 696
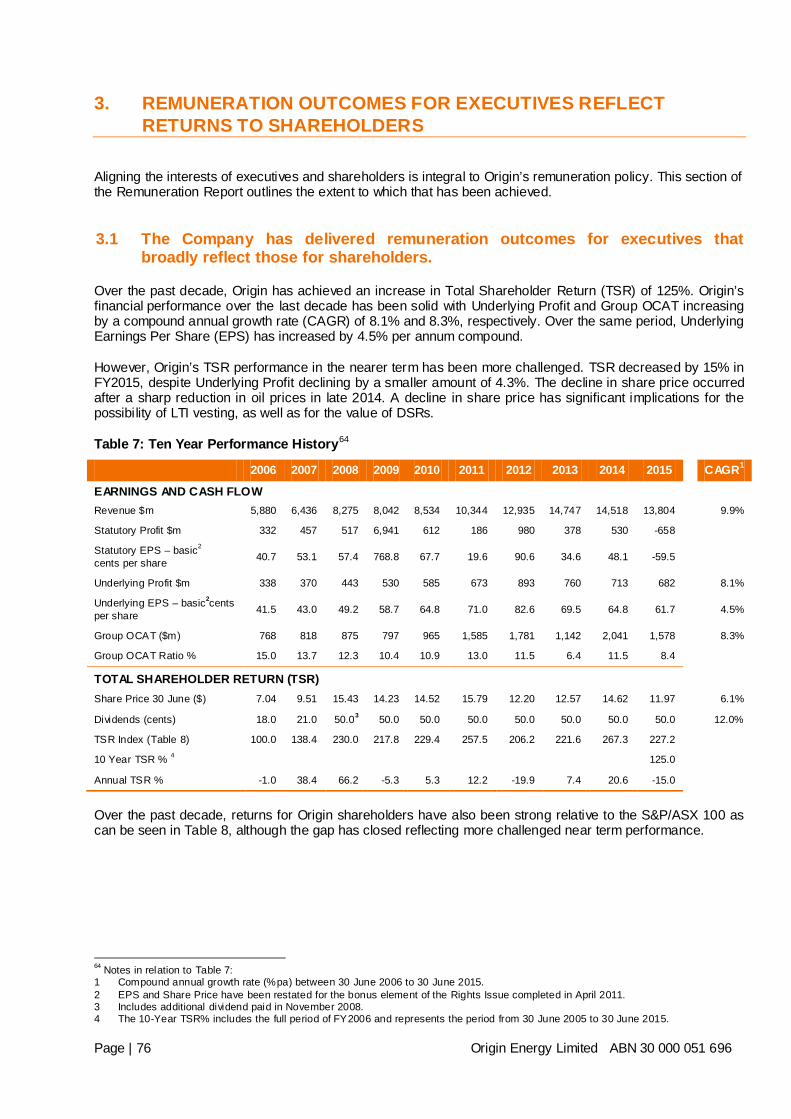
3. REMUNERATION OUTCOMES FOR EXECUTIVES REFLECT RETURNS TO SHAREHOLDERS
Aligning the interests of executives and shareholders is integral to Origin’s remuneration policy. This section of the Remuneration Report outlines the extent to which that has been achieved. 3.1 The Company has delivered remuneration outcomes for executives that
broadly reflect those for shareholders.
Over the past decade, Origin has achieved an increase in Total Shareholder Return (TSR) of 125%. Origin’s financial performance over the last decade has been solid with Underlying Profit and Group OCAT increasing by a compound annual growth rate (CAGR) of 8.1% and 8.3%, respectively. Over the same period, Underlying Earnings Per Share (EPS) has increased by 4.5% per annum compound. However, Origin’s TSR performance in the nearer term has been more challenged. TSR decreased by 15% in FY2015, despite Underlying Profit declining by a smaller amount of 4.3%. The decline in share price occurred after a sharp reduction in oil prices in late 2014. A decline in share price has significant implications for the possibility of LTI vesting, as well as for the value of DSRs. Table 7: Ten Year Performance History64
2006 2007 2008 2009 2010 2011 2012 2013 2014 2015 CAGR1
EARNINGS AND CASH FLOW Revenue $m 5,880 6,436 8,275 8,042 8,534 10,344 12,935 14,747 14,518 13,804 9.9%
Statutory Profit $m 332 457 517 6,941 612 186 980 378 530 -658
Statutory EPS – basic2
cents per share 40.7 53.1 57.4 768.8 67.7 19.6 90.6 34.6 48.1 -59.5
Underlying Profit $m 338 370 443 530 585 673 893 760 713 682 8.1%
Underlying EPS – basic2cents per share 41.5 43.0 49.2 58.7 64.8 71.0 82.6 69.5 64.8 61.7 4.5%
Group OCAT ($m) 768 818 875 797 965 1,585 1,781 1,142 2,041 1,578 8.3%
Group OCAT Ratio % 15.0 13.7 12.3 10.4 10.9 13.0 11.5 6.4 11.5 8.4
TOTAL SHAREHOLDER RETURN (TSR) Share Price 30 June ($) 7.04 9.51 15.43 14.23 14.52 15.79 12.20 12.57 14.62 11.97 6.1%
Dividends (cents) 18.0 21.0 50.03 50.0 50.0 50.0 50.0 50.0 50.0 50.0 12.0%
TSR Index (Table 8) 100.0 138.4 230.0 217.8 229.4 257.5 206.2 221.6 267.3 227.2
10 Year TSR % 4 125.0
Annual TSR % -1.0 38.4 66.2 -5.3 5.3 12.2 -19.9 7.4 20.6 -15.0
Over the past decade, returns for Origin shareholders have also been strong relative to the S&P/ASX 100 as can be seen in Table 8, although the gap has closed reflecting more challenged near term performance.
64 Notes in relation to Table 7: 1 Compound annual growth rate (%pa) between 30 June 2006 to 30 June 2015. 2 EPS and Share Price have been restated for the bonus element of the Rights Issue completed in April 2011. 3 Includes additional dividend paid in November 2008. 4 The 10-Year TSR% includes the full period of FY2006 and represents the period from 30 June 2005 to 30 June 2015. Page | 76 Origin Energy Limited ABN 30 000 051 696
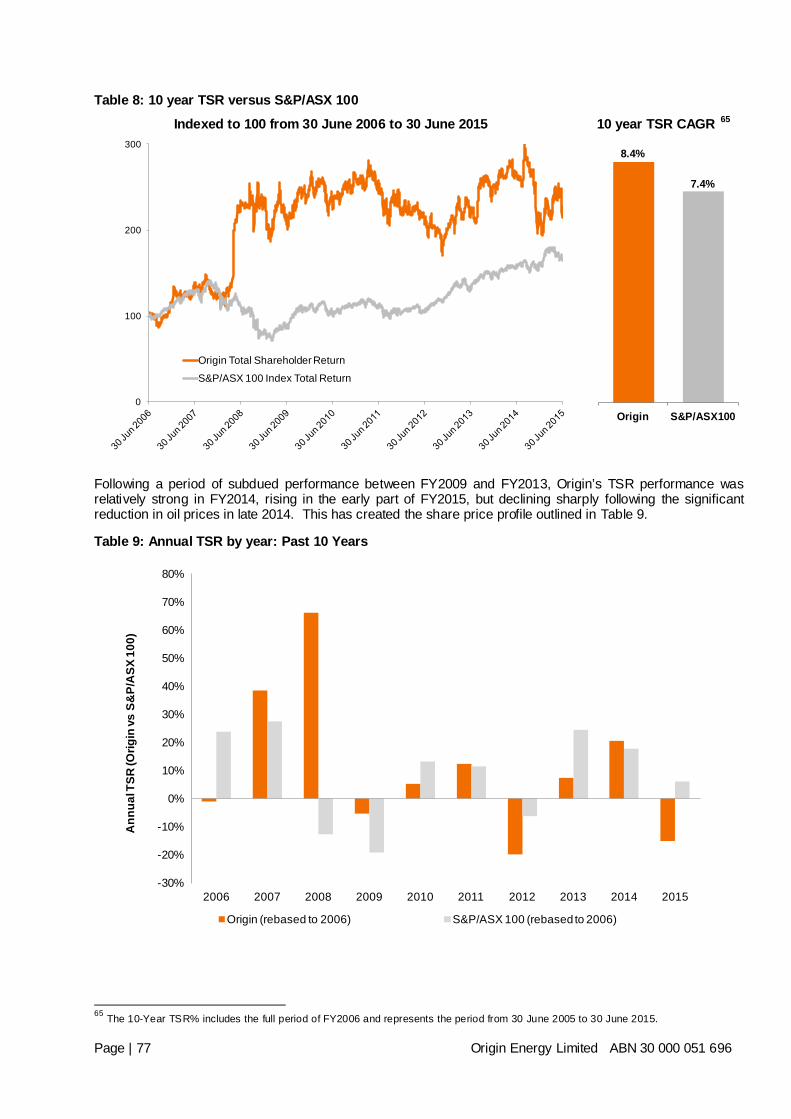
Table 8: 10 year TSR versus S&P/ASX 100 Indexed to 100 from 30 June 2006 to 30 June 2015
10 year TSR CAGR 65
Following a period of subdued performance between FY2009 and FY2013, Origin’s TSR performance was relatively strong in FY2014, rising in the early part of FY2015, but declining sharply following the significant reduction in oil prices in late 2014. This has created the share price profile outlined in Table 9.
Table 9: Annual TSR by year: Past 10 Years
65 The 10-Year TSR% includes the full period of FY2006 and represents the period from 30 June 2005 to 30 June 2015.
0
100
200
300
Origin Total Shareholder ReturnS&P/ASX 100 Index Total Return
8.4%
7.4%
Origin S&P/ASX100
-30%
-20%
-10%
0%
10%
20%
30%
40%
50%
60%
70%
80%
2006 2007 2008 2009 2010 2011 2012 2013 2014 2015
Ann
ual T
SR (O
rigin
vs S
&P/
ASX
100
)
Origin (rebased to 2006) S&P/ASX 100 (rebased to 2006)
Page | 77 Origin Energy Limited ABN 30 000 051 696
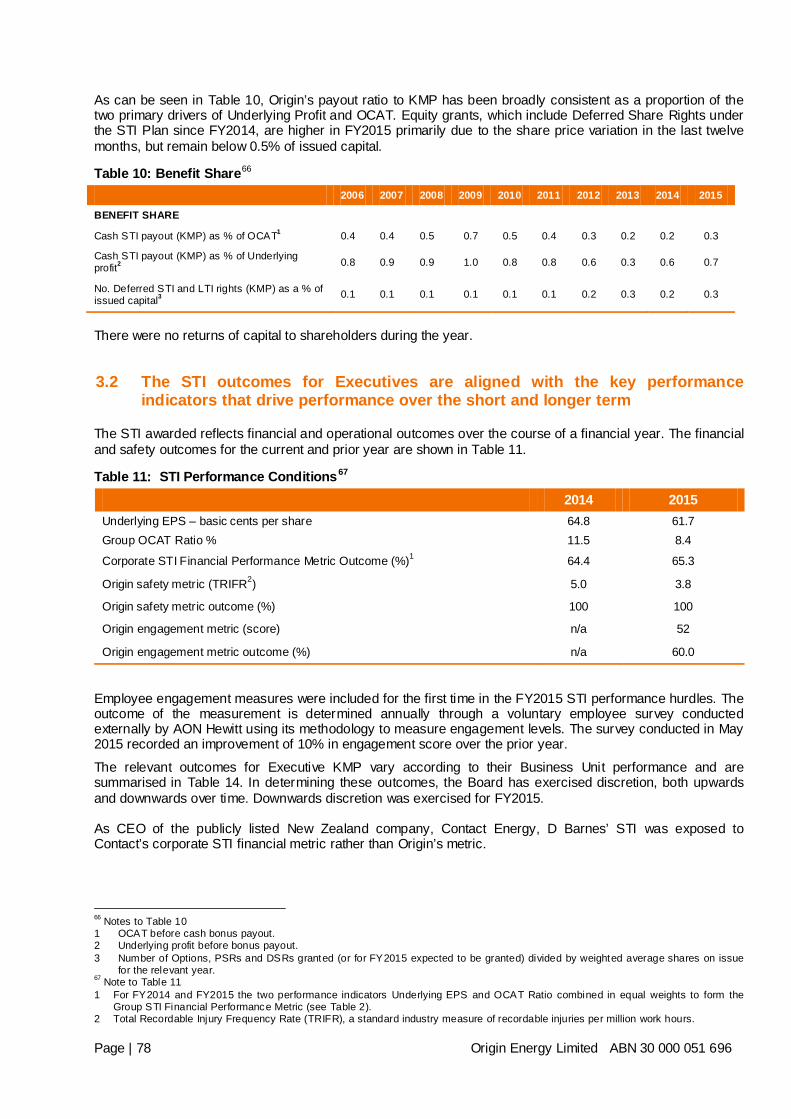
As can be seen in Table 10, Origin’s payout ratio to KMP has been broadly consistent as a proportion of the two primary drivers of Underlying Profit and OCAT. Equity grants, which include Deferred Share Rights under the STI Plan since FY2014, are higher in FY2015 primarily due to the share price variation in the last twelve months, but remain below 0.5% of issued capital.
Table 10: Benefit Share66 2006 2007 2008 2009 2010 2011 2012 2013 2014 2015
BENEFIT SHARE
Cash STI payout (KMP) as % of OCAT1 0.4 0.4 0.5 0.7 0.5 0.4 0.3 0.2 0.2 0.3
Cash STI payout (KMP) as % of Underlying profit2 0.8 0.9 0.9 1.0 0.8 0.8 0.6 0.3 0.6 0.7
No. Deferred STI and LTI rights (KMP) as a % of issued capital3 0.1 0.1 0.1 0.1 0.1 0.1 0.2 0.3 0.2 0.3
There were no returns of capital to shareholders during the year. 3.2 The STI outcomes for Executives are aligned with the key performance
indicators that drive performance over the short and longer term
The STI awarded reflects financial and operational outcomes over the course of a financial year. The financial and safety outcomes for the current and prior year are shown in Table 11.
Table 11: STI Performance Conditions67 2014 2015 Underlying EPS – basic cents per share 64.8 61.7 Group OCAT Ratio % 11.5 8.4
Corporate STI Financial Performance Metric Outcome (%)1 64.4 65.3
Origin safety metric (TRIFR2) 5.0 3.8
Origin safety metric outcome (%) 100 100
Origin engagement metric (score) n/a 52
Origin engagement metric outcome (%) n/a 60.0
Employee engagement measures were included for the first time in the FY2015 STI performance hurdles. The outcome of the measurement is determined annually through a voluntary employee survey conducted externally by AON Hewitt using its methodology to measure engagement levels. The survey conducted in May 2015 recorded an improvement of 10% in engagement score over the prior year. The relevant outcomes for Executive KMP vary according to their Business Unit performance and are summarised in Table 14. In determining these outcomes, the Board has exercised discretion, both upwards and downwards over time. Downwards discretion was exercised for FY2015. As CEO of the publicly listed New Zealand company, Contact Energy, D Barnes’ STI was exposed to Contact’s corporate STI financial metric rather than Origin’s metric.
66 Notes to Table 10 1 OCAT before cash bonus payout. 2 Underlying profit before bonus payout. 3 Number of Options, PSRs and DSRs granted (or for FY2015 expected to be granted) divided by weighted average shares on issue
for the relevant year. 67 Note to Table 11 1 For FY2014 and FY2015 the two performance indicators Underlying EPS and OCAT Ratio combined in equal weights to form the
Group STI Financial Performance Metric (see Table 2). 2 Total Recordable Injury Frequency Rate (TRIFR), a standard industry measure of recordable injuries per million work hours. Page | 78 Origin Energy Limited ABN 30 000 051 696
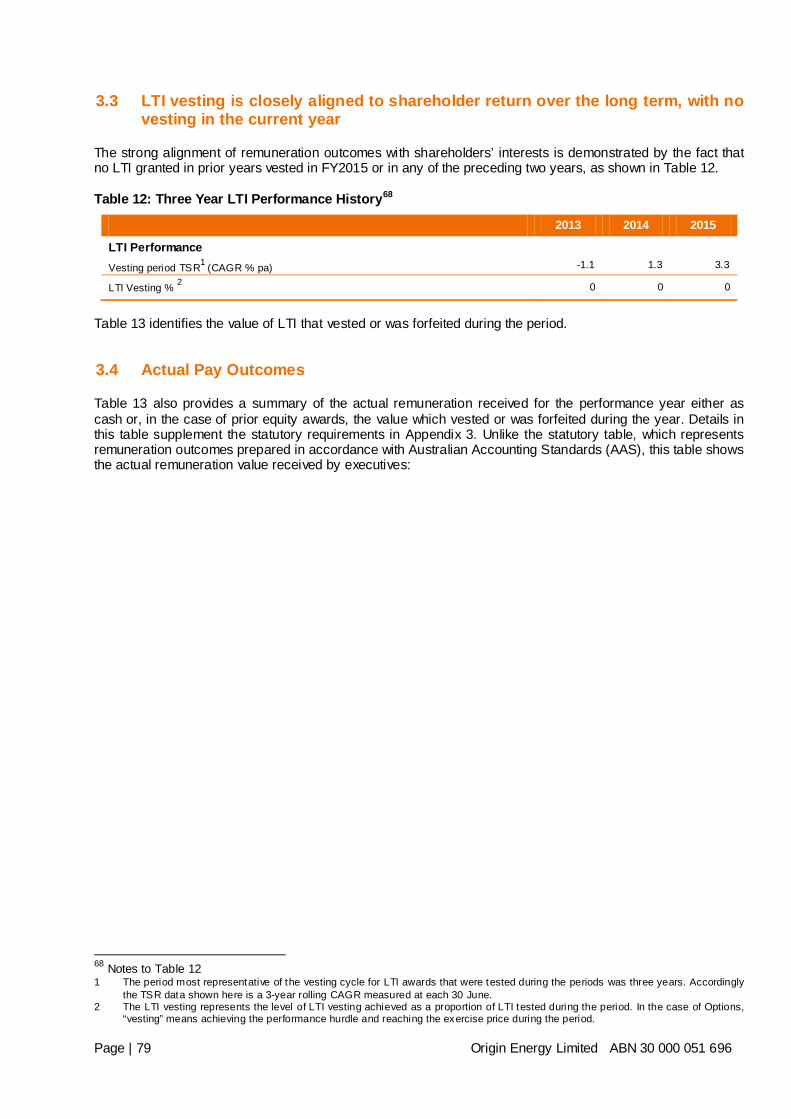
3.3 LTI vesting is closely aligned to shareholder return over the long term, with no vesting in the current year
The strong alignment of remuneration outcomes with shareholders’ interests is demonstrated by the fact that no LTI granted in prior years vested in FY2015 or in any of the preceding two years, as shown in Table 12. Table 12: Three Year LTI Performance History68
2013 2014 2015
LTI Performance
Vesting period TSR1 (CAGR % pa) -1.1 1.3 3.3
LTI Vesting % 2 0 0 0
Table 13 identifies the value of LTI that vested or was forfeited during the period. 3.4 Actual Pay Outcomes
Table 13 also provides a summary of the actual remuneration received for the performance year either as cash or, in the case of prior equity awards, the value which vested or was forfeited during the year. Details in this table supplement the statutory requirements in Appendix 3. Unlike the statutory table, which represents remuneration outcomes prepared in accordance with Australian Accounting Standards (AAS), this table shows the actual remuneration value received by executives:
68 Notes to Table 12 1 The period most representative of the vesting cycle for LTI awards that were tested during the periods was three years. Accordingly
the TSR data shown here is a 3-year rolling CAGR measured at each 30 June. 2 The LTI vesting represents the level of LTI vesting achieved as a proportion of LTI tested during the period. In the case of Options,
“vesting” means achieving the performance hurdle and reaching the exercise price during the period. Page | 79 Origin Energy Limited ABN 30 000 051 696
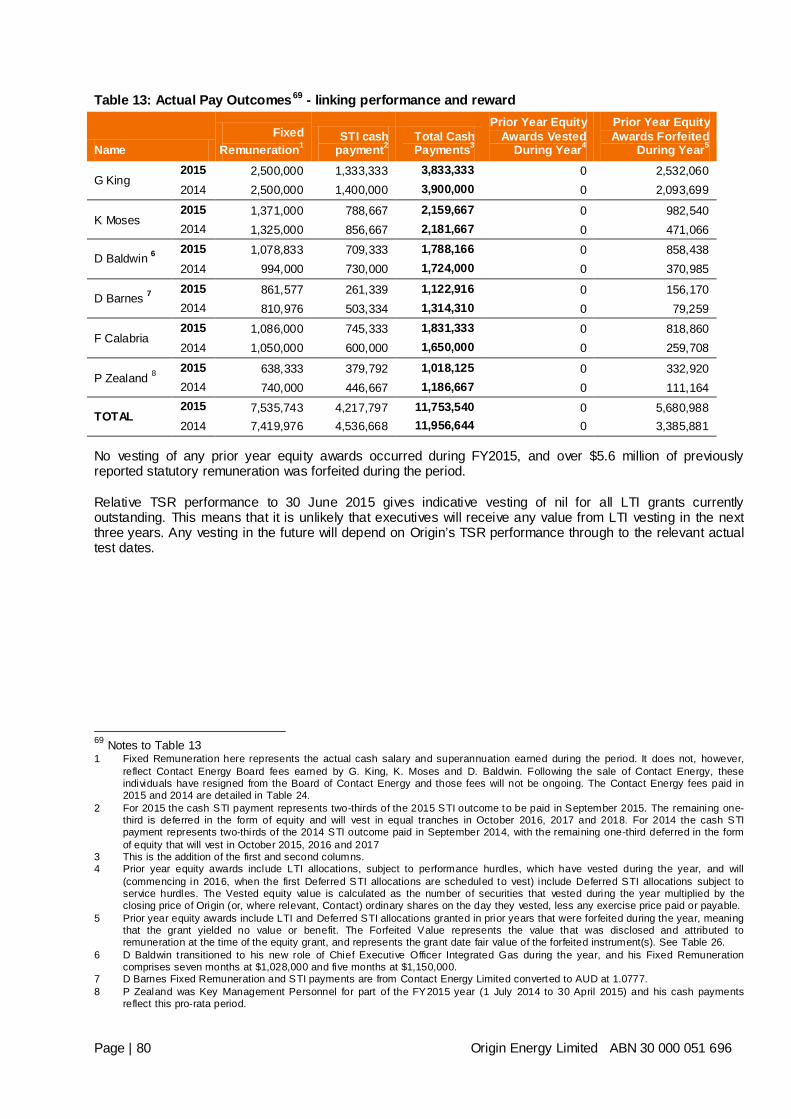
Table 13: Actual Pay Outcomes69 - linking performance and reward
Name Fixed
Remuneration1 STI cash
payment2 Total Cash Payments3
Prior Year Equity Awards Vested
During Year4
Prior Year Equity Awards Forfeited
During Year5
G King 2015 2,500,000 1,333,333 3,833,333 0 2,532,060 2014 2,500,000 1,400,000 3,900,000 0 2,093,699
K Moses 2015 1,371,000 788,667 2,159,667 0 982,540 2014 1,325,000 856,667 2,181,667 0 471,066
D Baldwin 6 2015 1,078,833 709,333 1,788,166 0 858,438 2014 994,000 730,000 1,724,000 0 370,985
D Barnes 7 2015 861,577 261,339 1,122,916 0 156,170 2014 810,976 503,334 1,314,310 0 79,259
F Calabria 2015 1,086,000 745,333 1,831,333 0 818,860 2014 1,050,000 600,000 1,650,000 0 259,708
P Zealand 8 2015 638,333 379,792 1,018,125 0 332,920 2014 740,000 446,667 1,186,667 0 111,164
TOTAL 2015 7,535,743 4,217,797 11,753,540 0 5,680,988 2014 7,419,976 4,536,668 11,956,644 0 3,385,881
No vesting of any prior year equity awards occurred during FY2015, and over $5.6 million of previously reported statutory remuneration was forfeited during the period. Relative TSR performance to 30 June 2015 gives indicative vesting of nil for all LTI grants currently outstanding. This means that it is unlikely that executives will receive any value from LTI vesting in the next three years. Any vesting in the future will depend on Origin’s TSR performance through to the relevant actual test dates.
69 Notes to Table 13 1 Fixed Remuneration here represents the actual cash salary and superannuation earned during the period. It does not, however,
reflect Contact Energy Board fees earned by G. King, K. Moses and D. Baldwin. Following the sale of Contact Energy, these individuals have resigned from the Board of Contact Energy and those fees will not be ongoing. The Contact Energy fees paid in 2015 and 2014 are detailed in Table 24.
2 For 2015 the cash STI payment represents two-thirds of the 2015 STI outcome to be paid in September 2015. The remaining one-third is deferred in the form of equity and will vest in equal tranches in October 2016, 2017 and 2018. For 2014 the cash STI payment represents two-thirds of the 2014 STI outcome paid in September 2014, with the remaining one-third deferred in the form of equity that will vest in October 2015, 2016 and 2017
3 This is the addition of the first and second columns. 4 Prior year equity awards include LTI allocations, subject to performance hurdles, which have vested during the year, and will
(commencing in 2016, when the first Deferred STI allocations are scheduled to vest) include Deferred STI allocations subject to service hurdles. The Vested equity value is calculated as the number of securities that vested during the year multiplied by the closing price of Origin (or, where relevant, Contact) ordinary shares on the day they vested, less any exercise price paid or payable.
5 Prior year equity awards include LTI and Deferred STI allocations granted in prior years that were forfeited during the year, meaning that the grant yielded no value or benefit. The Forfeited Value represents the value that was disclosed and attributed to remuneration at the time of the equity grant, and represents the grant date fair value of the forfeited instrument(s). See Table 26.
6 D Baldwin t ransitioned to his new role of Chief Executive Officer Integrated Gas during the year, and his Fixed Remuneration comprises seven months at $1,028,000 and five months at $1,150,000.
7 D Barnes Fixed Remuneration and STI payments are from Contact Energy Limited converted to AUD at 1.0777. 8 P Zealand was Key Management Personnel for part of the FY2015 year (1 July 2014 to 30 April 2015) and his cash payments
reflect this pro-rata period. Page | 80 Origin Energy Limited ABN 30 000 051 696
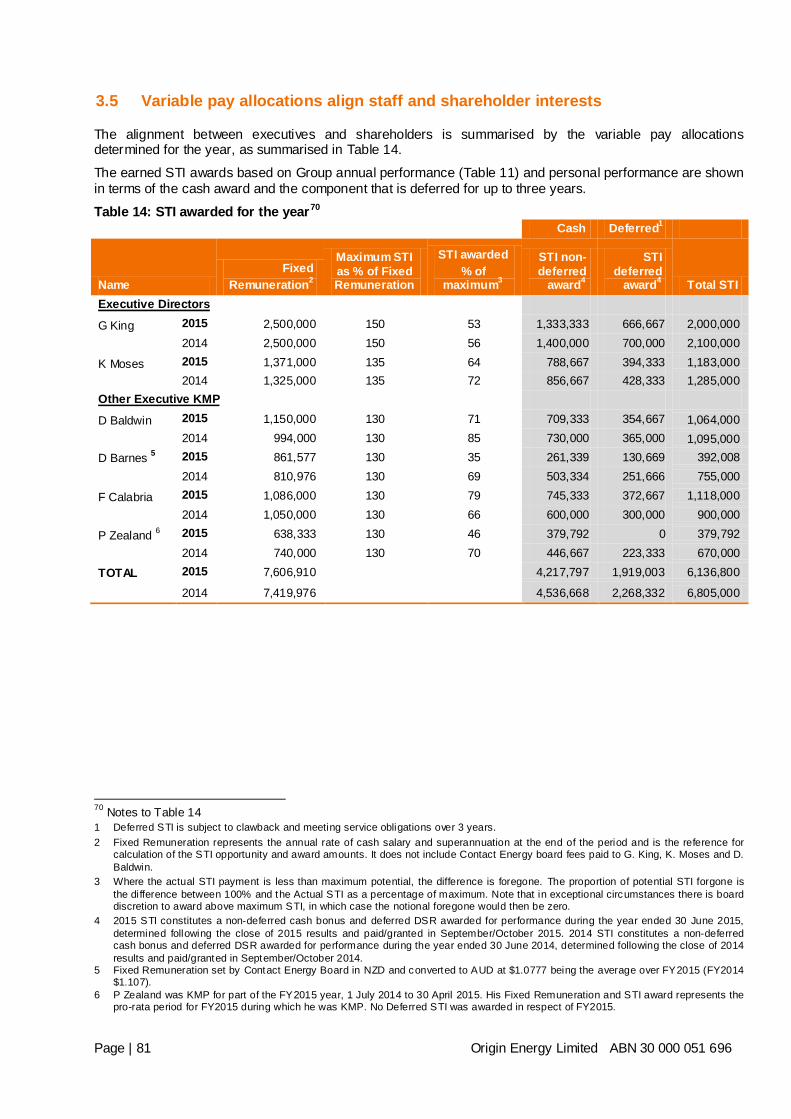
3.5 Variable pay allocations align staff and shareholder interests
The alignment between executives and shareholders is summarised by the variable pay allocations determined for the year, as summarised in Table 14. The earned STI awards based on Group annual performance (Table 11) and personal performance are shown in terms of the cash award and the component that is deferred for up to three years. Table 14: STI awarded for the year70
Cash Deferred1
Name Fixed
Remuneration2
Maximum STI as % of Fixed Remuneration
STI awarded % of
maximum3
STI non-deferred
award4
STI deferred
award4 Total STI Executive Directors
G King 2015 2,500,000 150 53 1,333,333 666,667 2,000,000 2014 2,500,000 150 56 1,400,000 700,000 2,100,000
K Moses 2015 1,371,000 135 64 788,667 394,333 1,183,000 2014 1,325,000 135 72 856,667 428,333 1,285,000
Other Executive KMP
D Baldwin 2015 1,150,000 130 71 709,333 354,667 1,064,000 2014 994,000 130 85 730,000 365,000 1,095,000
D Barnes 5 2015 861,577 130 35 261,339 130,669 392,008 2014 810,976 130 69 503,334 251,666 755,000
F Calabria 2015 1,086,000 130 79 745,333 372,667 1,118,000 2014 1,050,000 130 66 600,000 300,000 900,000
P Zealand 6 2015 638,333 130 46 379,792 0 379,792 2014 740,000 130 70 446,667 223,333 670,000
TOTAL 2015 7,606,910 4,217,797 1,919,003 6,136,800
2014 7,419,976 4,536,668 2,268,332 6,805,000
70 Notes to Table 14 1 Deferred STI is subject to clawback and meeting service obligations over 3 years. 2 Fixed Remuneration represents the annual rate of cash salary and superannuation at the end of the period and is the reference for
calculation of the STI opportunity and award amounts. It does not include Contact Energy board fees paid to G. King, K. Moses and D. Baldwin.
3 Where the actual STI payment is less than maximum potential, the difference is foregone. The proportion of potential STI forgone is the difference between 100% and the Actual STI as a percentage of maximum. Note that in exceptional circumstances there is board discretion to award above maximum STI, in which case the notional foregone would then be zero.
4 2015 STI constitutes a non-deferred cash bonus and deferred DSR awarded for performance during the year ended 30 June 2015, determined following the close of 2015 results and paid/granted in September/October 2015. 2014 STI constitutes a non-deferred cash bonus and deferred DSR awarded for performance during the year ended 30 June 2014, determined following the close of 2014 results and paid/granted in September/October 2014.
5 Fixed Remuneration set by Contact Energy Board in NZD and converted to AUD at $1.0777 being the average over FY2015 (FY2014 $1.107).
6 P Zealand was KMP for part of the FY2015 year, 1 July 2014 to 30 April 2015. His Fixed Remuneration and STI award represents the pro-rata period for FY2015 during which he was KMP. No Deferred STI was awarded in respect of FY2015.
Page | 81 Origin Energy Limited ABN 30 000 051 696
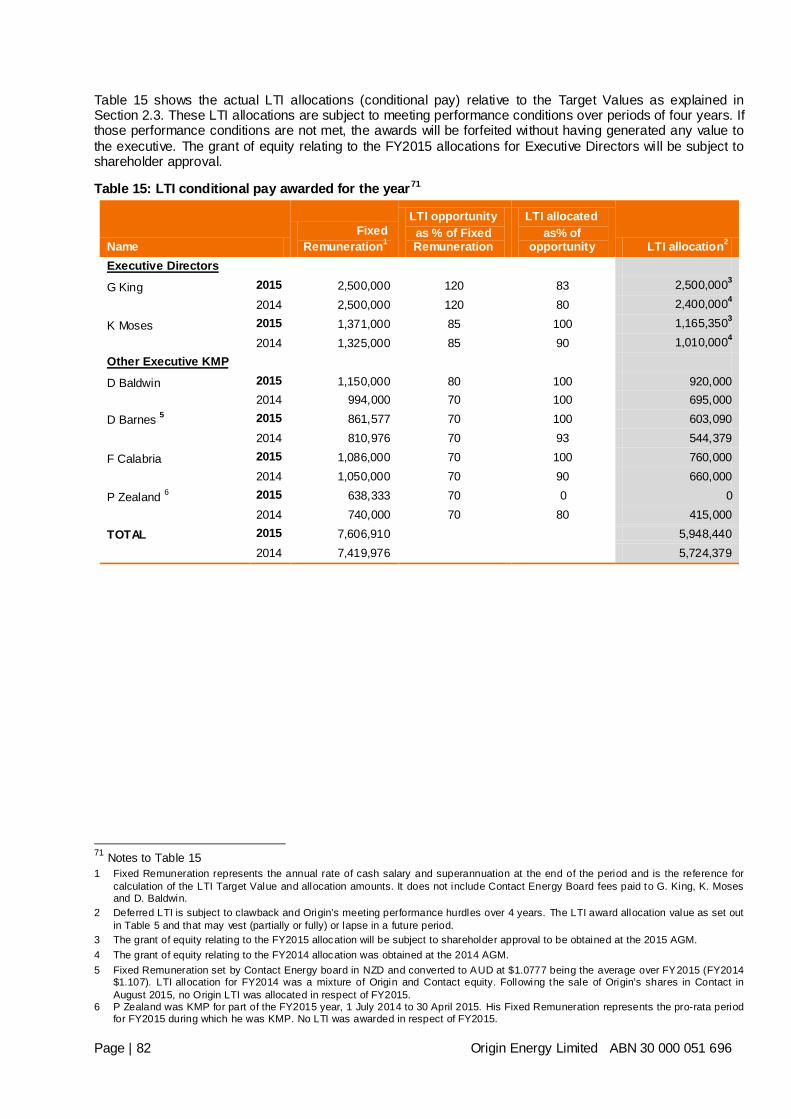
Table 15 shows the actual LTI allocations (conditional pay) relative to the Target Values as explained in Section 2.3. These LTI allocations are subject to meeting performance conditions over periods of four years. If those performance conditions are not met, the awards will be forfeited without having generated any value to the executive. The grant of equity relating to the FY2015 allocations for Executive Directors will be subject to shareholder approval.
Table 15: LTI conditional pay awarded for the year71
Name Fixed
Remuneration1
LTI opportunity as % of Fixed Remuneration
LTI allocated as% of
opportunity LTI allocation2 Executive Directors
G King 2015 2,500,000 120 83 2,500,0003 2014 2,500,000 120 80 2,400,0004
K Moses 2015 1,371,000 85 100 1,165,3503 2014 1,325,000 85 90 1,010,0004
Other Executive KMP
D Baldwin 2015 1,150,000 80 100 920,000 2014 994,000 70 100 695,000
D Barnes 5 2015 861,577 70 100 603,090 2014 810,976 70 93 544,379
F Calabria 2015 1,086,000 70 100 760,000 2014 1,050,000 70 90 660,000
P Zealand 6 2015 638,333 70 0 0 2014 740,000 70 80 415,000
TOTAL 2015 7,606,910 5,948,440 2014 7,419,976 5,724,379
71 Notes to Table 15 1 Fixed Remuneration represents the annual rate of cash salary and superannuation at the end of the period and is the reference for
calculation of the LTI Target Value and allocation amounts. It does not include Contact Energy Board fees paid to G. King, K. Moses and D. Baldwin.
2 Deferred LTI is subject to clawback and Origin’s meeting performance hurdles over 4 years. The LTI award allocation value as set out in Table 5 and that may vest (partially or fully) or lapse in a future period.
3 The grant of equity relating to the FY2015 allocation will be subject to shareholder approval to be obtained at the 2015 AGM. 4 The grant of equity relating to the FY2014 allocation was obtained at the 2014 AGM. 5 Fixed Remuneration set by Contact Energy board in NZD and converted to AUD at $1.0777 being the average over FY2015 (FY2014
$1.107). LTI allocation for FY2014 was a mixture of Origin and Contact equity. Following the sale of Origin’s shares in Contact in August 2015, no Origin LTI was allocated in respect of FY2015.
6 P Zealand was KMP for part of the FY2015 year, 1 July 2014 to 30 April 2015. His Fixed Remuneration represents the pro-rata period for FY2015 during which he was KMP. No LTI was awarded in respect of FY2015.
Page | 82 Origin Energy Limited ABN 30 000 051 696
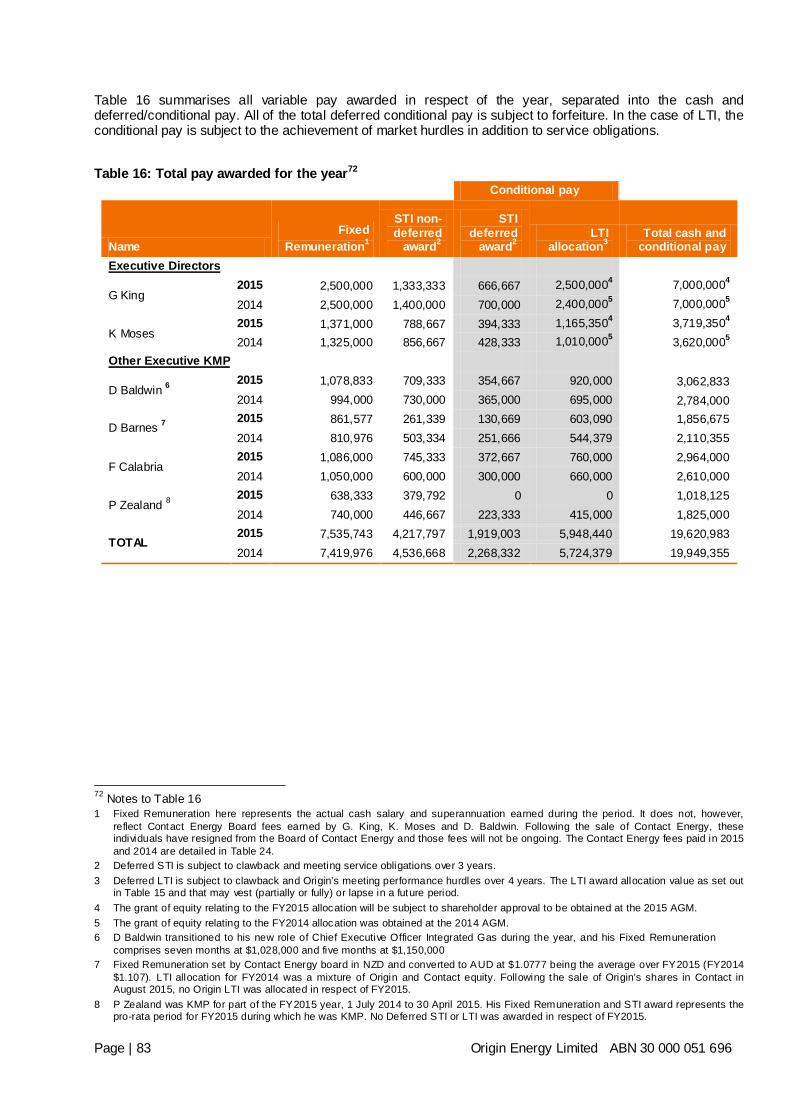
Table 16 summarises all variable pay awarded in respect of the year, separated into the cash and deferred/conditional pay. All of the total deferred conditional pay is subject to forfeiture. In the case of LTI, the conditional pay is subject to the achievement of market hurdles in addition to service obligations.
Table 16: Total pay awarded for the year72
Conditional pay
Name Fixed
Remuneration1
STI non-deferred
award2
STI deferred
award2 LTI
allocation3 Total cash and
conditional pay Executive Directors
G King 2015 2,500,000 1,333,333 666,667 2,500,0004 7,000,0004 2014 2,500,000 1,400,000 700,000 2,400,0005 7,000,0005
K Moses 2015 1,371,000 788,667 394,333 1,165,3504 3,719,3504 2014 1,325,000 856,667 428,333 1,010,0005 3,620,0005
Other Executive KMP
D Baldwin 6 2015 1,078,833 709,333 354,667 920,000 3,062,833 2014 994,000 730,000 365,000 695,000 2,784,000
D Barnes 7 2015 861,577 261,339 130,669 603,090 1,856,675 2014 810,976 503,334 251,666 544,379 2,110,355
F Calabria 2015 1,086,000 745,333 372,667 760,000 2,964,000 2014 1,050,000 600,000 300,000 660,000 2,610,000
P Zealand 8 2015 638,333 379,792 0 0 1,018,125 2014 740,000 446,667 223,333 415,000 1,825,000
TOTAL 2015 7,535,743 4,217,797 1,919,003 5,948,440 19,620,983 2014 7,419,976 4,536,668 2,268,332 5,724,379 19,949,355
72 Notes to Table 16 1 Fixed Remuneration here represents the actual cash salary and superannuation earned during the period. It does not, however,
reflect Contact Energy Board fees earned by G. King, K. Moses and D. Baldwin. Following the sale of Contact Energy, these individuals have resigned from the Board of Contact Energy and those fees will not be ongoing. The Contact Energy fees paid in 2015 and 2014 are detailed in Table 24.
2 Deferred STI is subject to clawback and meeting service obligations over 3 years. 3 Deferred LTI is subject to clawback and Origin’s meeting performance hurdles over 4 years. The LTI award allocation value as set out
in Table 15 and that may vest (partially or fully) or lapse in a future period. 4 The grant of equity relating to the FY2015 allocation will be subject to shareholder approval to be obtained at the 2015 AGM. 5 The grant of equity relating to the FY2014 allocation was obtained at the 2014 AGM. 6 D Baldwin transitioned to his new role of Chief Executive Officer Integrated Gas during the year, and his Fixed Remuneration
comprises seven months at $1,028,000 and five months at $1,150,000 7 Fixed Remuneration set by Contact Energy board in NZD and converted to AUD at $1.0777 being the average over FY2015 (FY2014
$1.107). LTI allocation for FY2014 was a mixture of Origin and Contact equity. Following the sale of Origin’s shares in Contact in August 2015, no Origin LTI was allocated in respect of FY2015.
8 P Zealand was KMP for part of the FY2015 year, 1 July 2014 to 30 April 2015. His Fixed Remuneration and STI award represents the pro-rata period for FY2015 during which he was KMP. No Deferred STI or LTI was awarded in respect of FY2015.
Page | 83 Origin Energy Limited ABN 30 000 051 696
4. REMUNERATION CHANGES WILL SUPPORT FURTHER ALIGNMENT OF THE INTERESTS OF EXECUTIVES AND SHAREHOLDERS.
Following investor feedback and a comprehensive review undertaken by the Remuneration Committee and the Board with the assistance of Pay Governance, a number of key changes are proposed to the remuneration system. The key objective in undertaking this review has been to strengthen alignment of the interests of shareholders and Origin’s most senior executives. The ways this will occur are outlined below. These changes will become effective for the new remuneration cycle commencing 1 July, 2015 (FY2016). It does not affect DSRs and LTIs allocated after 1 July 2015 in relation to the FY2015 year, the basis of which was outlined in the FY2014 Remuneration Report. 4.1 Benchmarks have been refined to reflect industry peers and company size.
Going forward, Origin will use a new and specific set of remuneration benchmarks that will reflect its most direct Australian industry peers and relative company size. To that end, Directors will have regard to companies that are 10 above and 10 below Origin on the ASX, as well as AGL, Woodside, Santos and Oil Search if they are not already in that group. This approach recognises the relationship between remuneration and company size while taking peer groups into account. It is recognised that Directors will need to exercise judgement in examining data in relation to these companies as they may change from time to time, dependent on movements in the ASX, as well as in Origin’s relative share price. This set of benchmarks will:
o provide the relevant benchmark for setting Fixed Remuneration at the midpoint of the external market as described in Section 2.1.
o determine the maximum remuneration benchmark in rewarding superior performance, as well as the At Target remuneration outcome.
Directors recognise that it may take some time to achieve these benchmarks, particularly if Fixed Remuneration for a particular executive is above the target. In such cases, the desired outcome will be achieved over time by holding Fixed Remuneration constant. If a new executive is appointed, they will be paid at the benchmark rate. 4.2 Fixed Remuneration will not be increased for Executive KMP in FY2016
In keeping with the approach outlined above, no changes to Fixed Remuneration for Executive KMP will apply for FY2016.73 Increases for Executives who are not KMP will be moderate, with the average being around 2.7 percent.
73 The increase that applied to D Baldwin during FY2015 related to his appointment to the role of Chief Executive Officer, Integrated Gas Page | 84 Origin Energy Limited ABN 30 000 051 696
4.3 STI will be more strongly aligned with shareholders interests
Two key changes are proposed in relation to STI. 4.3.1 Metrics for assessing STI Origin currently uses Operating Cash after Tax (OCAT) as a proportion of Productive Capital as one of the two corporate financial metrics for assessing performance for the STI. However, it is recognised that this measure is not commonly used and that it does not reflect the full value of cash invested. At the same time, Directors are cognisant of the importance of cash generation for any company, but particularly for Origin at this stage of its investment cycle. Directors have reflected on those matters and have decided to replace the OCAT Ratio metric with an Operating Cash Flow measure, commencing from 1 July 2015. Such a measure is more transparent from a shareholder’s perspective. 4.3.2 Longer period of deferral for DSRs To lengthen the deferral period to more strongly reflect Origin’s investment cycle, going forward, DSRs for Executive KMP will vest in three equal tranches at the end of years two, three and four respectively. This represents a change from the current vesting profile at years one, two and three. In other words, the average vesting period has been lengthened from two to three years. 4.4 LTI changes will be implemented that strengthen executive alignment with
shareholders
Three key changes to LTI are being made. 4.4.1 The LTI mix is being changed
Directors have considered feedback that fewer Options are preferred in the LTI mix. As a consequence of this feedback, the ratio of Options to PSRs will be reduced from 75:25 to 50:50. 4.4.2 A second hurdle is being introduced
Currently, Origin has a single TSR hurdle which is evaluated against the S&P ASX 100 benchmark. For Executive KMP going forward, consistent with evolving market practice, a second hurdle will be introduced as follows:
• The hurdle for determining whether Options will vest will continue to be TSR, but instead it will be evaluated against the comparator group outlined in Section 4.1, namely 10 companies above and 10 below, in addition to AGL, Santos, Woodside and Oil Search if they are not already in that group. That hurdle will be held constant for the life of the options, unless the constituent company ceases to be listed on the ASX, in which case it will be deleted entirely from the list.
• The hurdle for PSRs will be a return on total capital employed (ROCE) measure, which will be calculated on a simple arithmetic average for each year of the vesting period.
4.4.3 The vesting schedule will be lengthened
The performance period for Options will be increased and tested for vesting at 30 June in year five. Currently, they are tested for vesting in year four.
PSRs, which will have a ROCE hurdle, will be tested for vesting at 30 June in year four.
The longer vesting schedule is consistent with Origin’s investment cycle.
Page | 85 Origin Energy Limited ABN 30 000 051 696
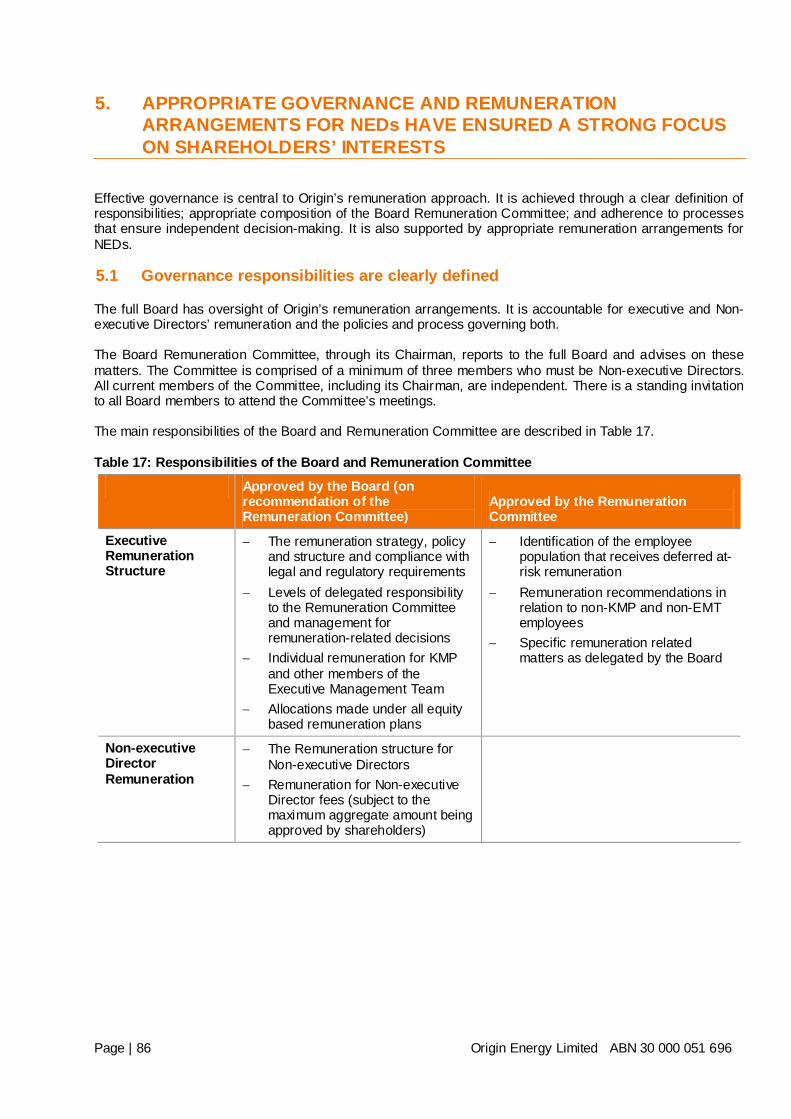
5. APPROPRIATE GOVERNANCE AND REMUNERATION ARRANGEMENTS FOR NEDs HAVE ENSURED A STRONG FOCUS ON SHAREHOLDERS’ INTERESTS
Effective governance is central to Origin’s remuneration approach. It is achieved through a clear definition of responsibilities; appropriate composition of the Board Remuneration Committee; and adherence to processes that ensure independent decision-making. It is also supported by appropriate remuneration arrangements for NEDs. 5.1 Governance responsibilities are clearly defined
The full Board has oversight of Origin’s remuneration arrangements. It is accountable for executive and Non-executive Directors’ remuneration and the policies and process governing both. The Board Remuneration Committee, through its Chairman, reports to the full Board and advises on these matters. The Committee is comprised of a minimum of three members who must be Non-executive Directors. All current members of the Committee, including its Chairman, are independent. There is a standing invitation to all Board members to attend the Committee’s meetings. The main responsibilities of the Board and Remuneration Committee are described in Table 17. Table 17: Responsibilities of the Board and Remuneration Committee
Approved by the Board (on recommendation of the Remuneration Committee)
Approved by the Remuneration Committee
Executive Remuneration Structure
− The remuneration strategy, policy and structure and compliance with legal and regulatory requirements
− Levels of delegated responsibility to the Remuneration Committee and management for remuneration-related decisions
− Individual remuneration for KMP and other members of the Executive Management Team
− Allocations made under all equity based remuneration plans
− Identification of the employee population that receives deferred at-risk remuneration
− Remuneration recommendations in relation to non-KMP and non-EMT employees
− Specific remuneration related matters as delegated by the Board
Non-executive Director Remuneration
− The Remuneration structure for Non-executive Directors
− Remuneration for Non-executive Director fees (subject to the maximum aggregate amount being approved by shareholders)
Page | 86 Origin Energy Limited ABN 30 000 051 696

5.2 The Remuneration Committee is composed of Non-executive Directors with an
appropriate level of independence and expertise
For the greater part of FY2015, the Board Remuneration Committee was comprised of three Non-executive Directors. It currently consists of four independent Non-executive Directors, as shown in Table 18. Each Director has strong remuneration experience either as a member of board remuneration committees at other major companies or in their prior role as an executive.
Table 18: Remuneration Committee FY2015 Role Status Other Origin Committees
Current Members
H Nugent (Chairman) Independent, Non-executive Director Audit; Risk; Nomination
G Cairns Independent, Non-executive Director; Origin Chairman (since October 2013)
Audit; Health, Safety & Environment; Risk; Nomination; Origin Foundation (Chairman)
R Norris Independent, Non-executive Director Audit
S Sargent (from 29 May 2015)
Independent, Non-executive Director Health, Safety & Environment
Former Member B Beeren (until 22 October 2014) Non-executive Director
The Committee met six times during FY2015. 5.3 Board and Remuneration Committee processes ensure independence
The Remuneration Committee operates under a Charter published on the Company’s website at www.originenergy.com.au. In particular, the Charter identifies the processes for dealing with conflicts of interest. The Charter and all associated processes are followed assiduously by the Board and Remuneration Committee. The Committee has established protocols for engaging and dealing with external advisors, including those defined as Remuneration Consultants for the purpose of the Corporations Act 2001 (Cth). The protocols require engagement by the Committee; instruction by the Chairman of the Committee; delivery of reports direct to the Committee through its Chairman; and a prohibition on communication with Company management except as authorised by the Chairman and limited to the provision or validation of factual and policy data. The advisor must furnish a statement confirming the absence of any undue influence from management. The Committee appointed Pay Governance as its advisor under these protocols in FY2015. Pay Governance did not act as a Remuneration Consultant for the purposes of the Corporations Act 2001 (Cth). It provided market benchmarking and comparative data to inform the Board’s decisions both on remuneration structure and design. Pay Governance has provided a statement confirming the absence of any influence from management. Table 19 summarises the sources of remuneration data used in FY2015.
Page | 87 Origin Energy Limited ABN 30 000 051 696
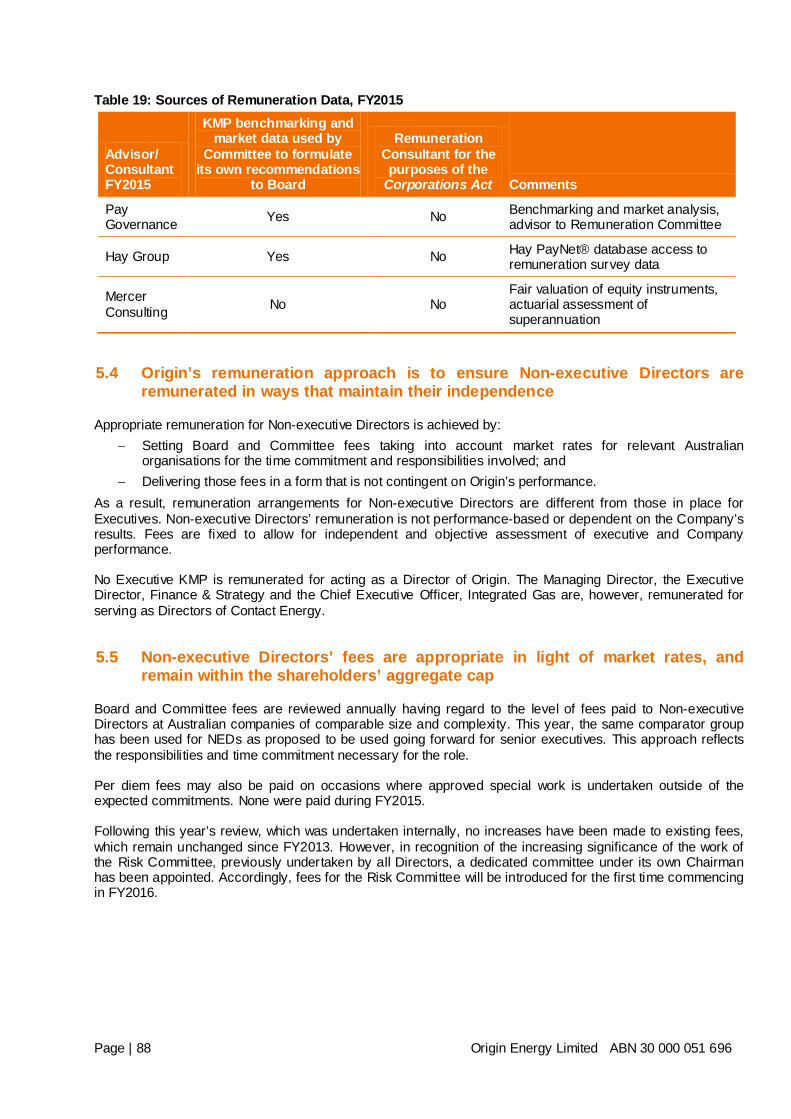
Table 19: Sources of Remuneration Data, FY2015
Advisor/ Consultant FY2015
KMP benchmarking and market data used by
Committee to formulate its own recommendations
to Board
Remuneration Consultant for the purposes of the
Corporations Act Comments
Pay Governance Yes No Benchmarking and market analysis,
advisor to Remuneration Committee
Hay Group Yes No Hay PayNet® database access to remuneration survey data
Mercer Consulting No No
Fair valuation of equity instruments, actuarial assessment of superannuation
5.4 Origin’s remuneration approach is to ensure Non-executive Directors are
remunerated in ways that maintain their independence
Appropriate remuneration for Non-executive Directors is achieved by: − Setting Board and Committee fees taking into account market rates for relevant Australian
organisations for the time commitment and responsibilities involved; and − Delivering those fees in a form that is not contingent on Origin’s performance.
As a result, remuneration arrangements for Non-executive Directors are different from those in place for Executives. Non-executive Directors’ remuneration is not performance-based or dependent on the Company’s results. Fees are fixed to allow for independent and objective assessment of executive and Company performance. No Executive KMP is remunerated for acting as a Director of Origin. The Managing Director, the Executive Director, Finance & Strategy and the Chief Executive Officer, Integrated Gas are, however, remunerated for serving as Directors of Contact Energy. 5.5 Non-executive Directors’ fees are appropriate in light of market rates, and
remain within the shareholders’ aggregate cap
Board and Committee fees are reviewed annually having regard to the level of fees paid to Non-executive Directors at Australian companies of comparable size and complexity. This year, the same comparator group has been used for NEDs as proposed to be used going forward for senior executives. This approach reflects the responsibilities and time commitment necessary for the role. Per diem fees may also be paid on occasions where approved special work is undertaken outside of the expected commitments. None were paid during FY2015. Following this year’s review, which was undertaken internally, no increases have been made to existing fees, which remain unchanged since FY2013. However, in recognition of the increasing significance of the work of the Risk Committee, previously undertaken by all Directors, a dedicated committee under its own Chairman has been appointed. Accordingly, fees for the Risk Committee will be introduced for the first time commencing in FY2016.
Page | 88 Origin Energy Limited ABN 30 000 051 696
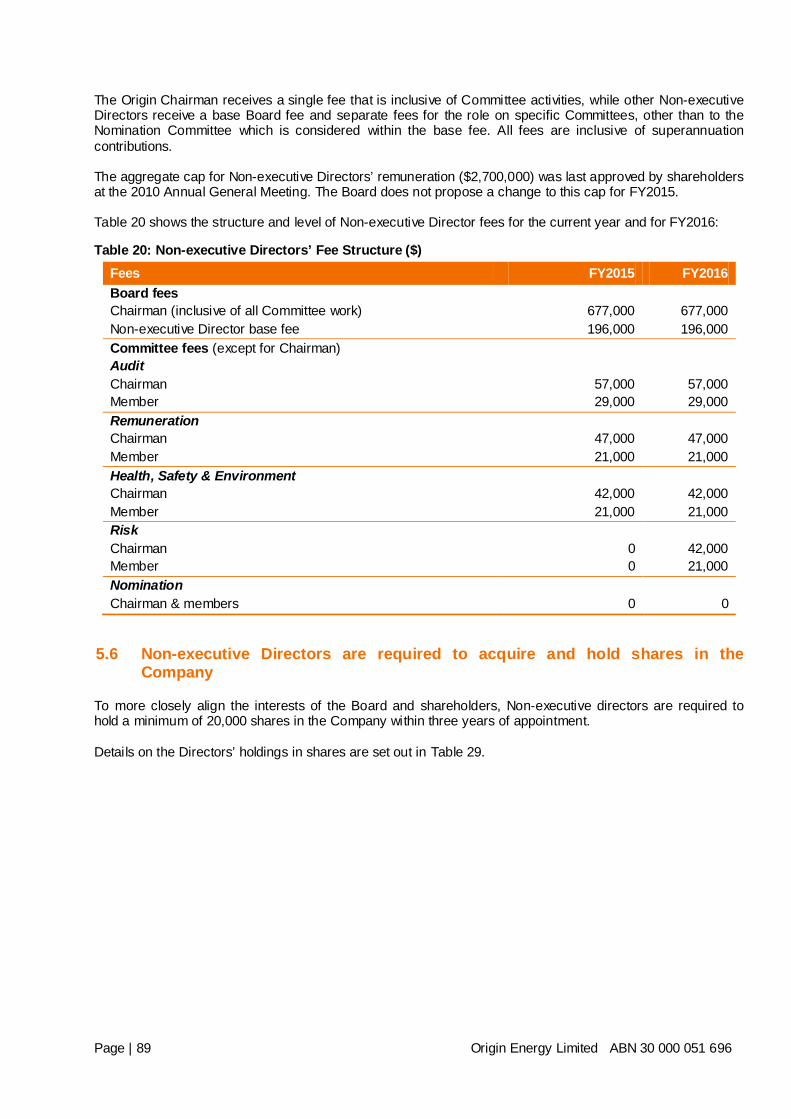
The Origin Chairman receives a single fee that is inclusive of Committee activities, while other Non-executive Directors receive a base Board fee and separate fees for the role on specific Committees, other than to the Nomination Committee which is considered within the base fee. All fees are inclusive of superannuation contributions. The aggregate cap for Non-executive Directors’ remuneration ($2,700,000) was last approved by shareholders at the 2010 Annual General Meeting. The Board does not propose a change to this cap for FY2015. Table 20 shows the structure and level of Non-executive Director fees for the current year and for FY2016:
Table 20: Non-executive Directors’ Fee Structure ($) Fees FY2015 FY2016 Board fees Chairman (inclusive of all Committee work) 677,000 677,000 Non-executive Director base fee 196,000 196,000 Committee fees (except for Chairman) Audit Chairman 57,000 57,000 Member 29,000 29,000 Remuneration Chairman 47,000 47,000 Member 21,000 21,000 Health, Safety & Environment Chairman 42,000 42,000 Member 21,000 21,000 Risk Chairman 0 42,000 Member 0 21,000 Nomination Chairman & members 0 0
5.6 Non-executive Directors are required to acquire and hold shares in the
Company
To more closely align the interests of the Board and shareholders, Non-executive directors are required to hold a minimum of 20,000 shares in the Company within three years of appointment. Details on the Directors’ holdings in shares are set out in Table 29.
Page | 89 Origin Energy Limited ABN 30 000 051 696
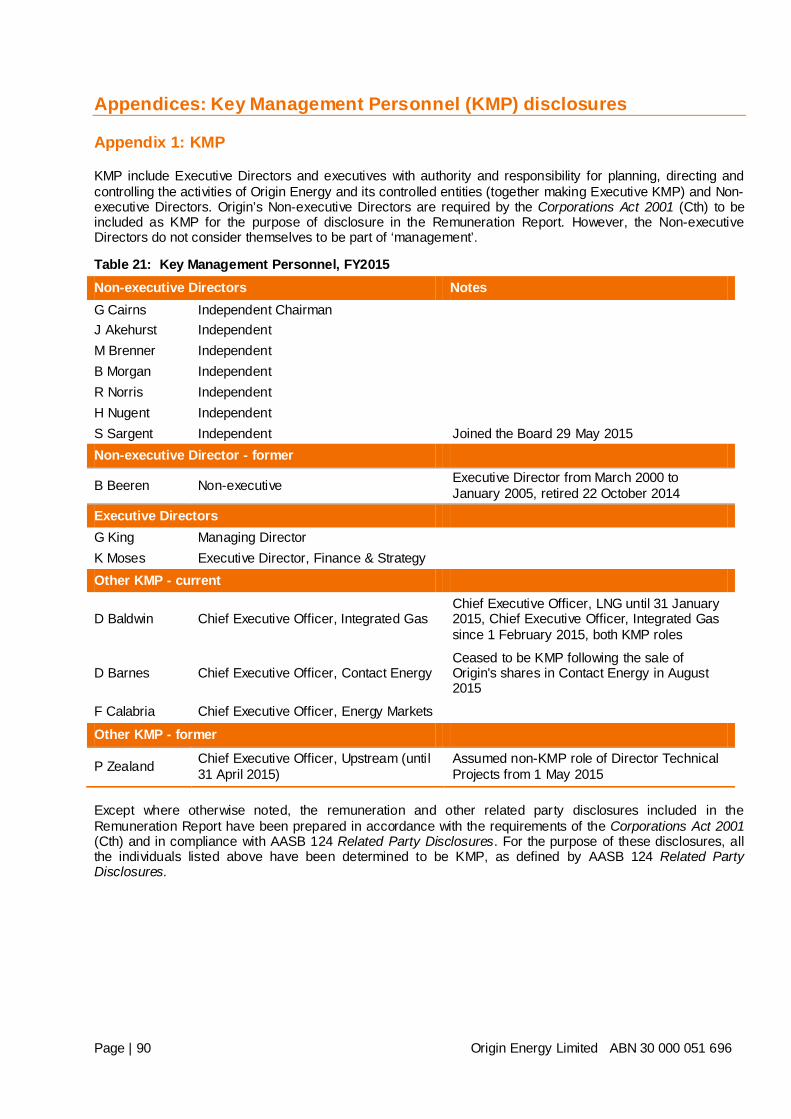
Appendices: Key Management Personnel (KMP) disclosures Appendix 1: KMP
KMP include Executive Directors and executives with authority and responsibility for planning, directing and controlling the activities of Origin Energy and its controlled entities (together making Executive KMP) and Non-executive Directors. Origin’s Non-executive Directors are required by the Corporations Act 2001 (Cth) to be included as KMP for the purpose of disclosure in the Remuneration Report. However, the Non-executive Directors do not consider themselves to be part of ‘management’.
Table 21: Key Management Personnel, FY2015 Non-executive Directors Notes G Cairns Independent Chairman J Akehurst Independent M Brenner Independent B Morgan Independent R Norris Independent H Nugent Independent S Sargent Independent Joined the Board 29 May 2015 Non-executive Director - former
B Beeren Non-executive Executive Director from March 2000 to January 2005, retired 22 October 2014
Executive Directors G King Managing Director K Moses Executive Director, Finance & Strategy Other KMP - current
D Baldwin Chief Executive Officer, Integrated Gas Chief Executive Officer, LNG until 31 January 2015, Chief Executive Officer, Integrated Gas since 1 February 2015, both KMP roles
D Barnes Chief Executive Officer, Contact Energy Ceased to be KMP following the sale of Origin's shares in Contact Energy in August 2015
F Calabria Chief Executive Officer, Energy Markets Other KMP - former
P Zealand Chief Executive Officer, Upstream (until 31 April 2015)
Assumed non-KMP role of Director Technical Projects from 1 May 2015
Except where otherwise noted, the remuneration and other related party disclosures included in the Remuneration Report have been prepared in accordance with the requirements of the Corporations Act 2001 (Cth) and in compliance with AASB 124 Related Party Disclosures. For the purpose of these disclosures, all the individuals listed above have been determined to be KMP, as defined by AASB 124 Related Party Disclosures.
Page | 90 Origin Energy Limited ABN 30 000 051 696
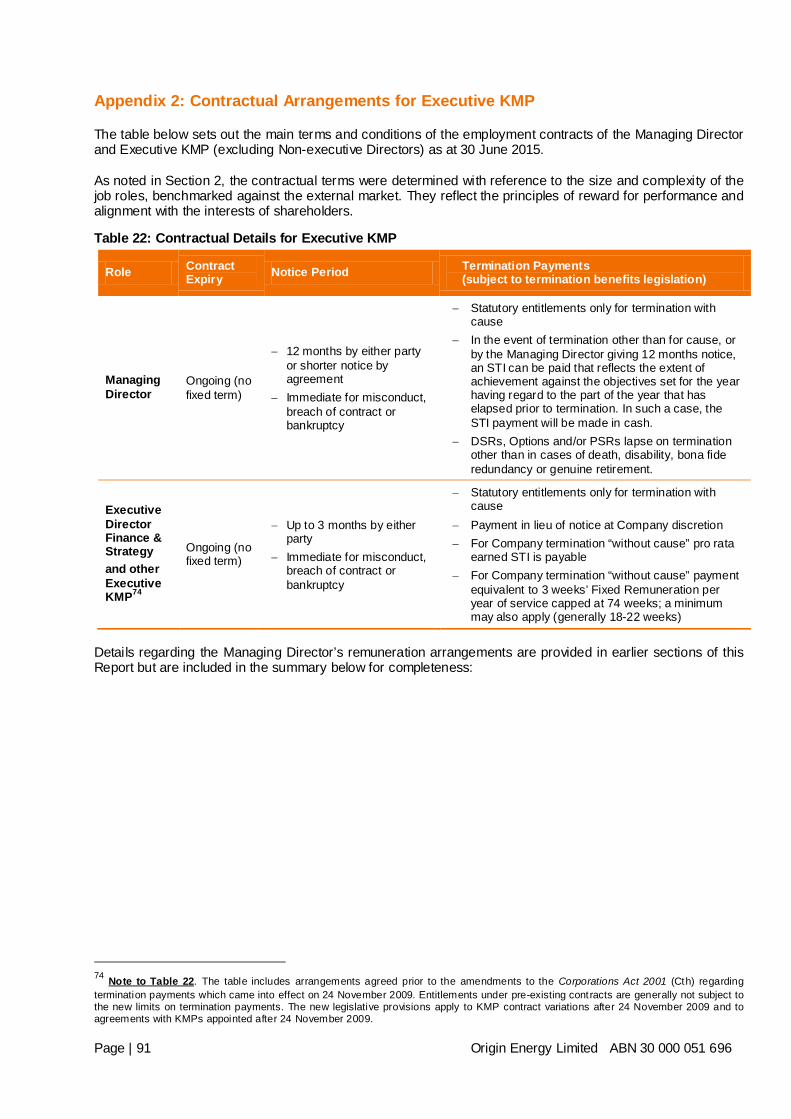
Appendix 2: Contractual Arrangements for Executive KMP
The table below sets out the main terms and conditions of the employment contracts of the Managing Director and Executive KMP (excluding Non-executive Directors) as at 30 June 2015. As noted in Section 2, the contractual terms were determined with reference to the size and complexity of the job roles, benchmarked against the external market. They reflect the principles of reward for performance and alignment with the interests of shareholders.
Table 22: Contractual Details for Executive KMP
Role Contract Expiry Notice Period Termination Payments
(subject to termination benefits legislation)
Managing Director
Ongoing (no fixed term)
− 12 months by either party or shorter notice by agreement
− Immediate for misconduct, breach of contract or bankruptcy
− Statutory entitlements only for termination with cause
− In the event of termination other than for cause, or by the Managing Director giving 12 months notice, an STI can be paid that reflects the extent of achievement against the objectives set for the year having regard to the part of the year that has elapsed prior to termination. In such a case, the STI payment will be made in cash.
− DSRs, Options and/or PSRs lapse on termination other than in cases of death, disability, bona fide redundancy or genuine retirement.
Executive Director Finance & Strategy and other Executive KMP74
Ongoing (no fixed term)
− Up to 3 months by either party
− Immediate for misconduct, breach of contract or bankruptcy
− Statutory entitlements only for termination with cause
− Payment in lieu of notice at Company discretion − For Company termination “without cause” pro rata
earned STI is payable − For Company termination “without cause” payment
equivalent to 3 weeks’ Fixed Remuneration per year of service capped at 74 weeks; a minimum may also apply (generally 18-22 weeks)
Details regarding the Managing Director’s remuneration arrangements are provided in earlier sections of this Report but are included in the summary below for completeness:
74 Note to Table 22. The table includes arrangements agreed prior to the amendments to the Corporations Act 2001 (Cth) regarding termination payments which came into effect on 24 November 2009. Entitlements under pre-existing contracts are generally not subject to the new limits on termination payments. The new legislative provisions apply to KMP contract variations after 24 November 2009 and to agreements with KMPs appointed after 24 November 2009. Page | 91 Origin Energy Limited ABN 30 000 051 696
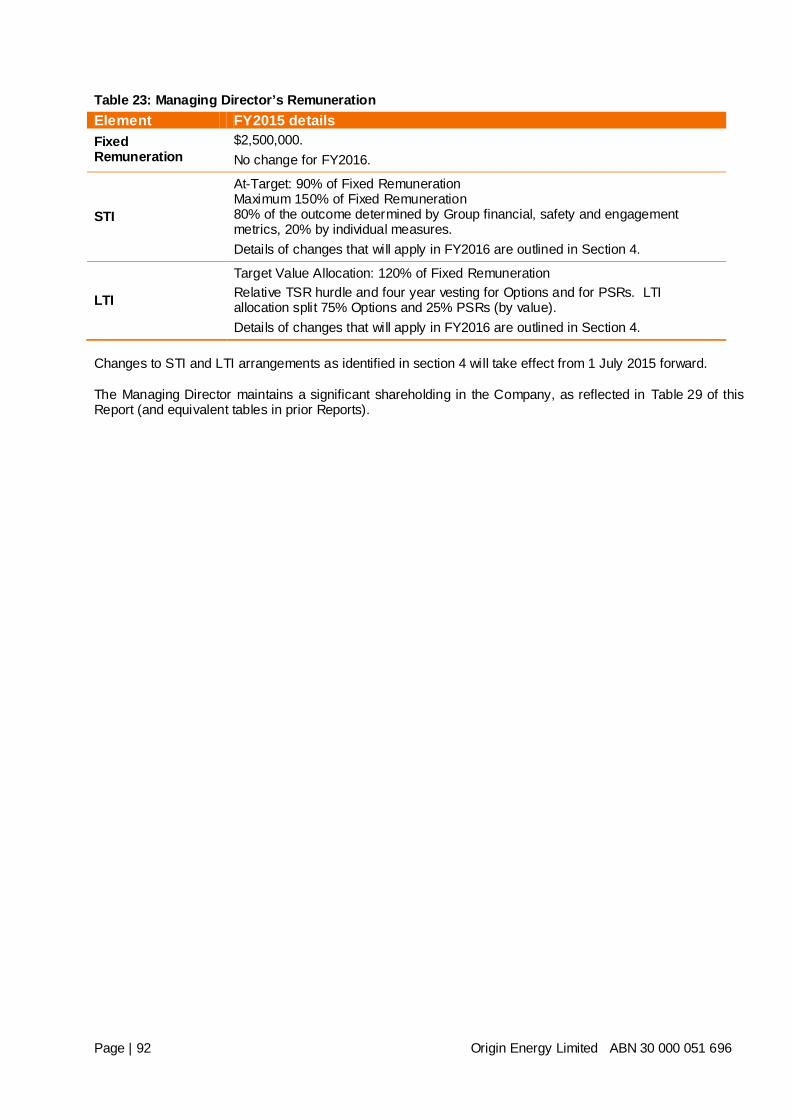
Table 23: Managing Director’s Remuneration Element FY2015 details Fixed Remuneration
$2,500,000. No change for FY2016.
STI
At-Target: 90% of Fixed Remuneration Maximum 150% of Fixed Remuneration 80% of the outcome determined by Group financial, safety and engagement metrics, 20% by individual measures. Details of changes that will apply in FY2016 are outlined in Section 4.
LTI
Target Value Allocation: 120% of Fixed Remuneration Relative TSR hurdle and four year vesting for Options and for PSRs. LTI allocation split 75% Options and 25% PSRs (by value). Details of changes that will apply in FY2016 are outlined in Section 4.
Changes to STI and LTI arrangements as identified in section 4 will take effect from 1 July 2015 forward. The Managing Director maintains a significant shareholding in the Company, as reflected in Table 29 of this Report (and equivalent tables in prior Reports).
Page | 92 Origin Energy Limited ABN 30 000 051 696
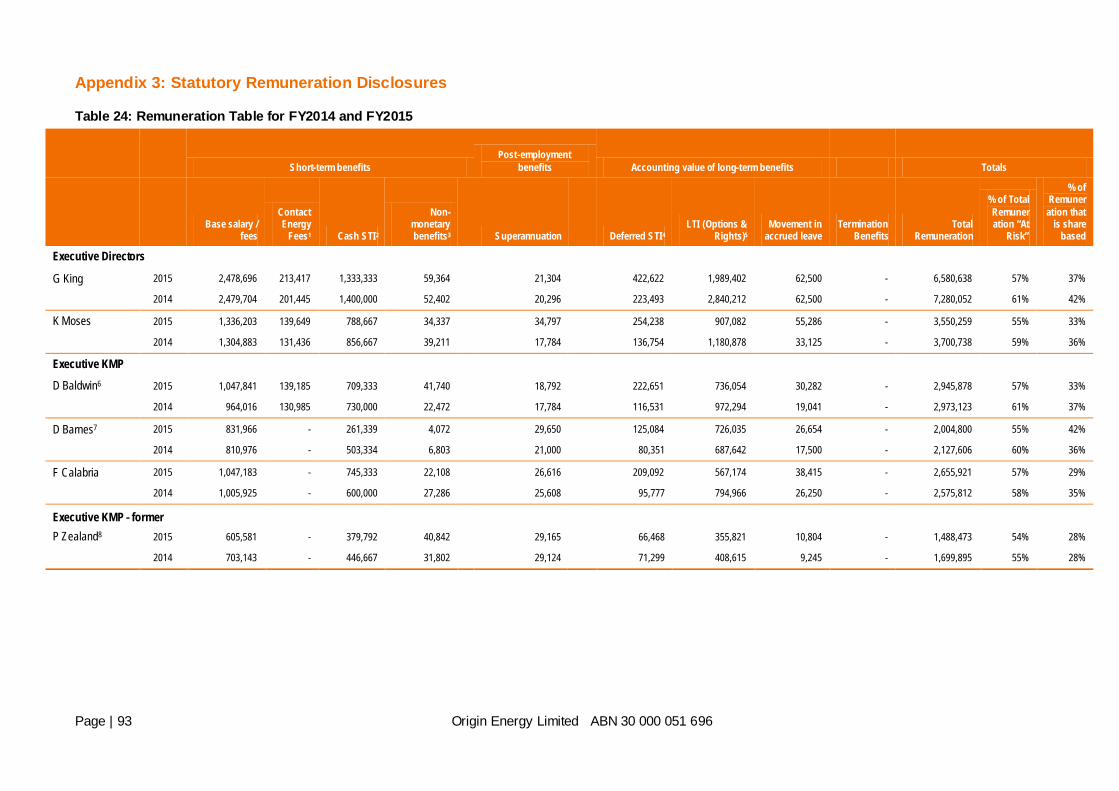
Appendix 3: Statutory Remuneration Disclosures
Table 24: Remuneration Table for FY2014 and FY2015
Short-term benefits Post-employment
benefits Accounting value of long-term benefits Totals
Base salary / fees
Contact Energy
Fees1 Cash STI2
Non-monetary benefits3
Superannuation
Deferred STI4 LTI (Options &
Rights)5 Movement in
accrued leave Termination
Benefits Total
Remuneration
% of Total Remuneration “At
Risk”
% of Remuner
ation that is share
based
Executive Directors
G King 2015 2,478,696 213,417 1,333,333 59,364 21,304 422,622 1,989,402 62,500 - 6,580,638 57% 37%
2014 2,479,704 201,445 1,400,000 52,402
20,296
223,493 2,840,212 62,500 - 7,280,052 61% 42%
K Moses 2015 1,336,203 139,649 788,667 34,337 34,797 254,238 907,082 55,286 - 3,550,259 55% 33%
2014 1,304,883 131,436 856,667 39,211
17,784
136,754 1,180,878 33,125 - 3,700,738 59% 36%
Executive KMP
D Baldwin6 2015 1,047,841 139,185 709,333 41,740 18,792 222,651 736,054 30,282 - 2,945,878 57% 33%
2014 964,016 130,985 730,000 22,472
17,784
116,531 972,294 19,041 - 2,973,123 61% 37%
D Barnes7 2015 831,966 - 261,339 4,072 29,650 125,084 726,035 26,654 - 2,004,800 55% 42%
2014 810,976 - 503,334 6,803
21,000
80,351 687,642 17,500 - 2,127,606 60% 36%
F Calabria 2015 1,047,183 - 745,333 22,108 26,616 209,092 567,174 38,415 - 2,655,921 57% 29%
2014 1,005,925 - 600,000 27,286
25,608
95,777 794,966 26,250 - 2,575,812 58% 35%
Executive KMP - former
P Zealand8 2015 605,581 - 379,792 40,842 29,165 66,468 355,821 10,804 - 1,488,473 54% 28%
2014 703,143 - 446,667 31,802
29,124
71,299 408,615 9,245 - 1,699,895 55% 28%
Page | 93 Origin Energy Limited ABN 30 000 051 696
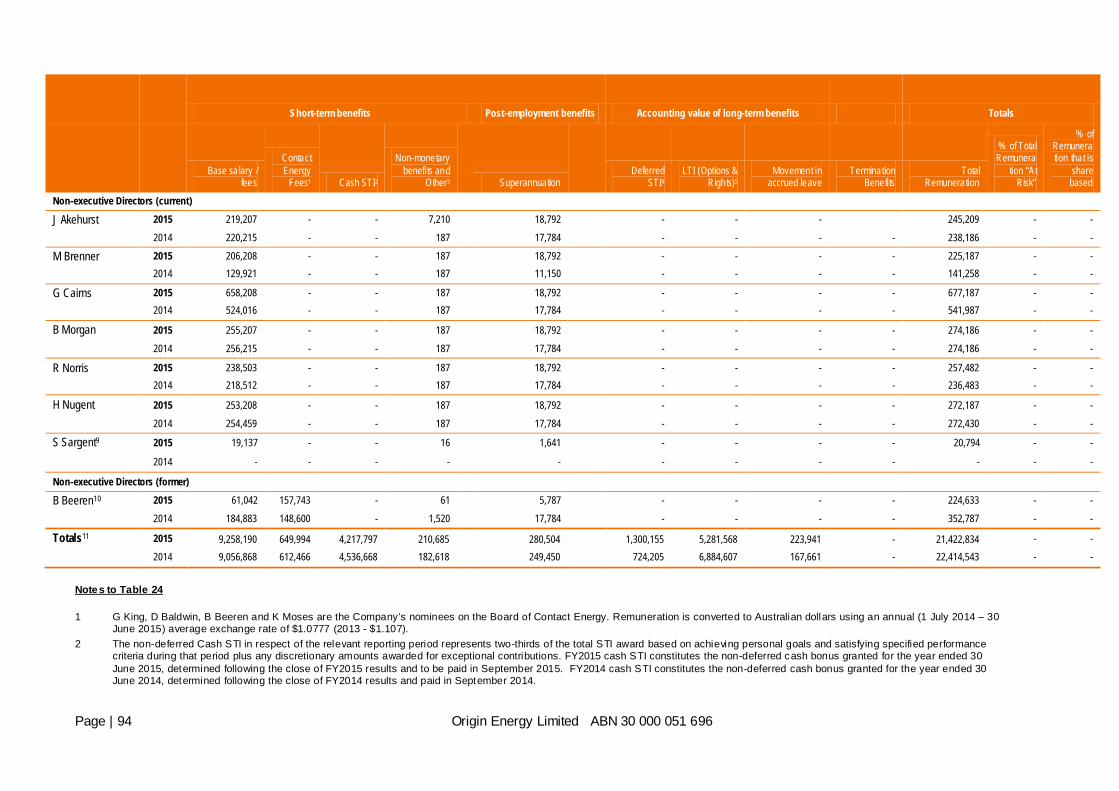
Short-term benefits Post-employment benefits Accounting value of long-term benefits Totals
Base salary / fees
Contact Energy
Fees1 Cash STI2
Non-monetary benefits and
Other3
Superannuation
Deferred STI4
LTI (Options & Rights)5
Movement in accrued leave
Termination Benefits
Total Remuneration
% of Total Remunera
tion “At Risk”
% of Remuneration that is
share based
Non-executive Directors (current)
J Akehurst
2015 219,207 - - 7,210 18,792 - - - 245,209 - -
2014 220,215 - - 187
17,784
- - - - 238,186 - -
M Brenner
2015 206,208 - - 187 18,792 - - - - 225,187 - - 2014 129,921 - - 187
11,150
- - - - 141,258 - -
G Cairns
2015 658,208 - - 187 18,792 - - - - 677,187 - - 2014 524,016 - - 187
17,784
- - - - 541,987 - -
B Morgan 2015 255,207 - - 187 18,792 - - - - 274,186 - -
2014 256,215 - - 187
17,784
- - - - 274,186 - -
R Norris
2015 238,503 - - 187 18,792 - - - - 257,482 - - 2014 218,512 - - 187
17,784
- - - - 236,483 - -
H Nugent 2015 253,208 - - 187 18,792 - - - - 272,187 - -
2014 254,459 - - 187
17,784
- - - - 272,430 - -
S Sargent9 2015 19,137 - - 16 1,641 - - - - 20,794 - -
2014 - - - - - - - - - - - -
Non-executive Directors (former)
B Beeren10
2015 61,042 157,743 - 61
5,787
- - - - 224,633 - -
2014 184,883 148,600 - 1,520
17,784
- - - - 352,787 - -
Totals11 2015 9,258,190 649,994 4,217,797 210,685 280,504 1,300,155 5,281,568 223,941 - 21,422,834 - -
2014 9,056,868 612,466 4,536,668 182,618
249,450
724,205 6,884,607 167,661 - 22,414,543 - -
Notes to Table 24 1 G King, D Baldwin, B Beeren and K Moses are the Company’s nominees on the Board of Contact Energy. Remuneration is converted to Australian dollars using an annual (1 July 2014 – 30
June 2015) average exchange rate of $1.0777 (2013 - $1.107). 2 The non-deferred Cash STI in respect of the relevant reporting period represents two-thirds of the total STI award based on achieving personal goals and satisfying specified performance
criteria during that period plus any discretionary amounts awarded for exceptional contributions. FY2015 cash STI constitutes the non-deferred cash bonus granted for the year ended 30 June 2015, determined following the close of FY2015 results and to be paid in September 2015. FY2014 cash STI constitutes the non-deferred cash bonus granted for the year ended 30 June 2014, determined following the close of FY2014 results and paid in September 2014.
Page | 94 Origin Energy Limited ABN 30 000 051 696
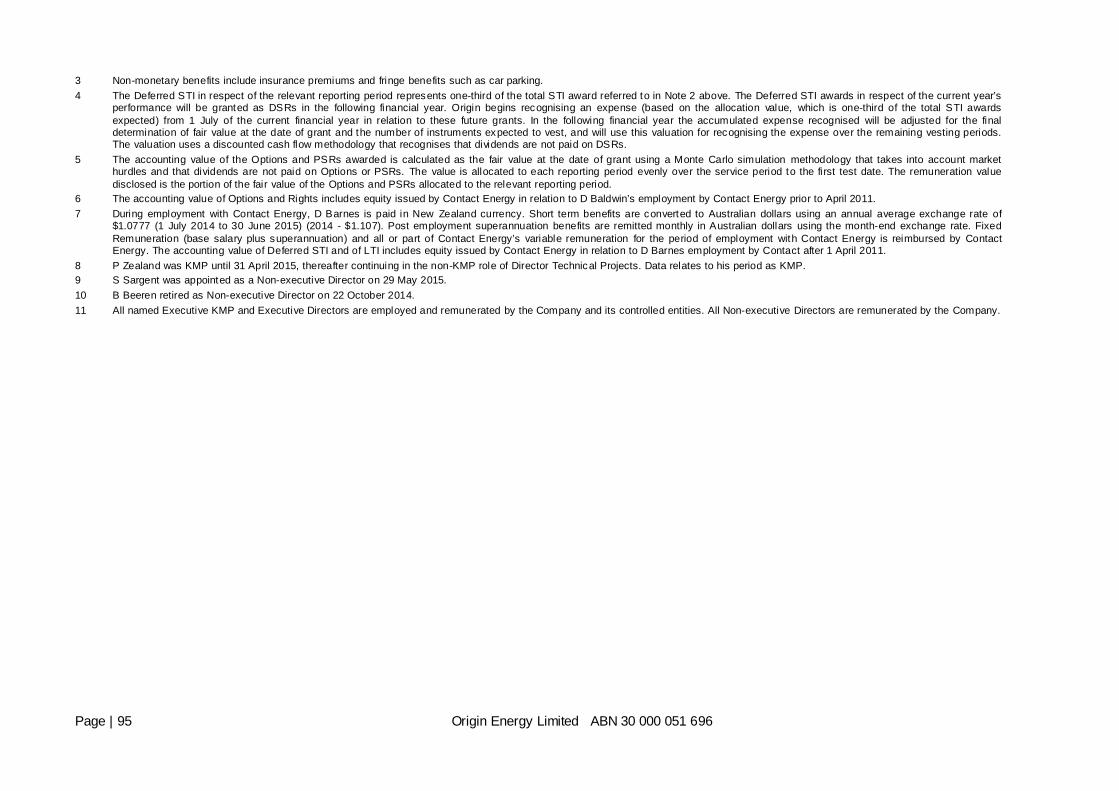
3 Non-monetary benefits include insurance premiums and fringe benefits such as car parking. 4 The Deferred STI in respect of the relevant reporting period represents one-third of the total STI award referred to in Note 2 above. The Deferred STI awards in respect of the current year’s
performance will be granted as DSRs in the following financial year. Origin begins recognising an expense (based on the allocation value, which is one-third of the total STI awards expected) from 1 July of the current financial year in relation to these future grants. In the following financial year the accumulated expense recognised will be adjusted for the final determination of fair value at the date of grant and the number of instruments expected to vest, and will use this valuation for recognising the expense over the remaining vesting periods. The valuation uses a discounted cash flow methodology that recognises that dividends are not paid on DSRs.
5 The accounting value of the Options and PSRs awarded is calculated as the fair value at the date of grant using a Monte Carlo simulation methodology that takes into account market hurdles and that dividends are not paid on Options or PSRs. The value is allocated to each reporting period evenly over the service period to the first test date. The remuneration value disclosed is the portion of the fair value of the Options and PSRs allocated to the relevant reporting period.
6 The accounting value of Options and Rights includes equity issued by Contact Energy in relation to D Baldwin’s employment by Contact Energy prior to April 2011. 7 During employment with Contact Energy, D Barnes is paid in New Zealand currency. Short term benefits are converted to Australian dollars using an annual average exchange rate of
$1.0777 (1 July 2014 to 30 June 2015) (2014 - $1.107). Post employment superannuation benefits are remitted monthly in Australian dollars using the month-end exchange rate. Fixed Remuneration (base salary plus superannuation) and all or part of Contact Energy’s variable remuneration for the period of employment with Contact Energy is reimbursed by Contact Energy. The accounting value of Deferred STI and of LTI includes equity issued by Contact Energy in relation to D Barnes employment by Contact after 1 April 2011.
8 P Zealand was KMP until 31 April 2015, thereafter continuing in the non-KMP role of Director Technical Projects. Data relates to his period as KMP. 9 S Sargent was appointed as a Non-executive Director on 29 May 2015. 10 B Beeren retired as Non-executive Director on 22 October 2014. 11 All named Executive KMP and Executive Directors are employed and remunerated by the Company and its controlled entities. All Non-executive Directors are remunerated by the Company.
Page | 95 Origin Energy Limited ABN 30 000 051 696
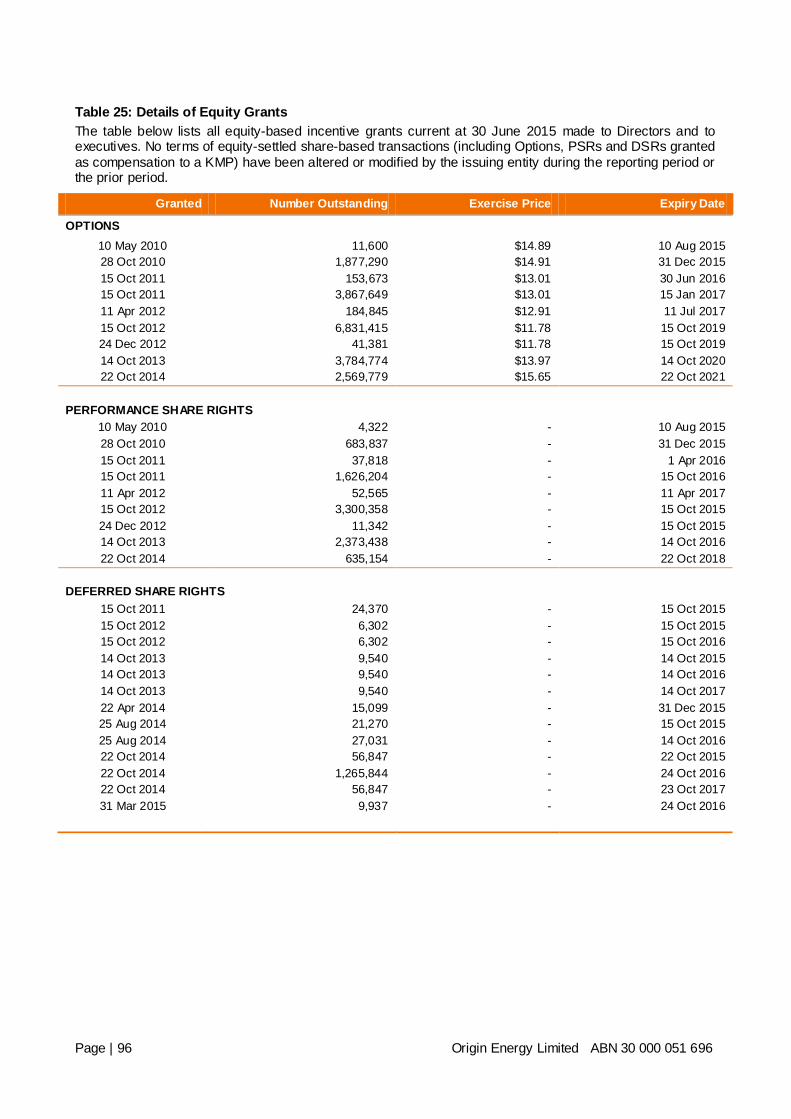
Table 25: Details of Equity Grants The table below lists all equity-based incentive grants current at 30 June 2015 made to Directors and to executives. No terms of equity-settled share-based transactions (including Options, PSRs and DSRs granted as compensation to a KMP) have been altered or modified by the issuing entity during the reporting period or the prior period.
Granted Number Outstanding Exercise Price Expiry Date
OPTIONS 10 May 2010 11,600 $14.89 10 Aug 2015 28 Oct 2010 1,877,290 $14.91 31 Dec 2015 15 Oct 2011 153,673 $13.01 30 Jun 2016 15 Oct 2011 3,867,649 $13.01 15 Jan 2017 11 Apr 2012 184,845 $12.91 11 Jul 2017 15 Oct 2012 6,831,415 $11.78 15 Oct 2019 24 Dec 2012 41,381 $11.78 15 Oct 2019 14 Oct 2013 3,784,774 $13.97 14 Oct 2020 22 Oct 2014 2,569,779 $15.65 22 Oct 2021
PERFORMANCE SHARE RIGHTS
10 May 2010 4,322 - 10 Aug 2015 28 Oct 2010 683,837 - 31 Dec 2015 15 Oct 2011 37,818 - 1 Apr 2016 15 Oct 2011 1,626,204 - 15 Oct 2016 11 Apr 2012 52,565 - 11 Apr 2017 15 Oct 2012 3,300,358 - 15 Oct 2015 24 Dec 2012 11,342 - 15 Oct 2015 14 Oct 2013 2,373,438 - 14 Oct 2016 22 Oct 2014 635,154 - 22 Oct 2018
DEFERRED SHARE RIGHTS
15 Oct 2011 24,370 - 15 Oct 2015 15 Oct 2012 6,302 - 15 Oct 2015 15 Oct 2012 6,302 - 15 Oct 2016 14 Oct 2013 9,540 - 14 Oct 2015 14 Oct 2013 9,540 - 14 Oct 2016 14 Oct 2013 9,540 - 14 Oct 2017 22 Apr 2014 15,099 - 31 Dec 2015 25 Aug 2014 21,270 - 15 Oct 2015 25 Aug 2014 27,031 - 14 Oct 2016 22 Oct 2014 56,847 - 22 Oct 2015 22 Oct 2014 1,265,844 - 24 Oct 2016 22 Oct 2014 56,847 - 23 Oct 2017 31 Mar 2015 9,937 - 24 Oct 2016
Page | 96 Origin Energy Limited ABN 30 000 051 696
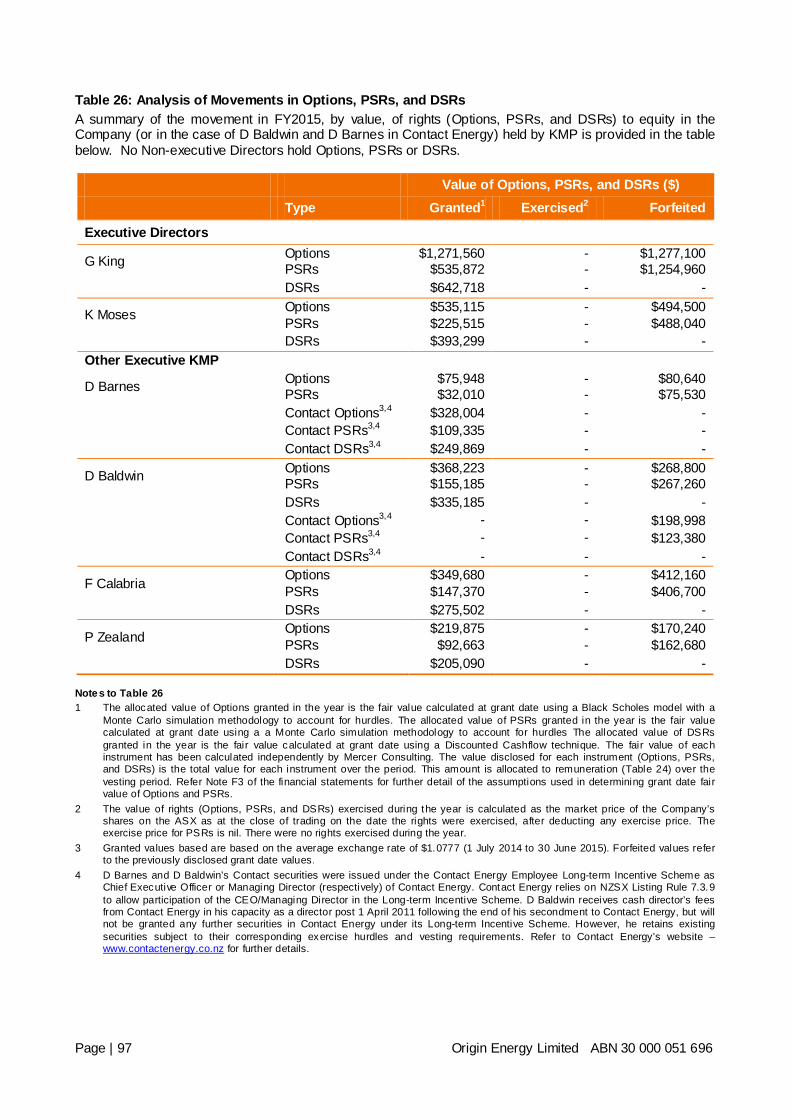
Table 26: Analysis of Movements in Options, PSRs, and DSRs A summary of the movement in FY2015, by value, of rights (Options, PSRs, and DSRs) to equity in the Company (or in the case of D Baldwin and D Barnes in Contact Energy) held by KMP is provided in the table below. No Non-executive Directors hold Options, PSRs or DSRs.
Value of Options, PSRs, and DSRs ($) Type Granted1 Exercised2 Forfeited
Executive Directors
G King Options PSRs
$1,271,560 $535,872
- -
$1,277,100 $1,254,960
DSRs $642,718 - -
K Moses Options PSRs
$535,115 $225,515
- -
$494,500 $488,040
DSRs $393,299 - - Other Executive KMP
D Barnes Options PSRs
$75,948 $32,010
- -
$80,640 $75,530
Contact Options3,4 $328,004 - - Contact PSRs3,4 $109,335 - - Contact DSRs3,4 $249,869 - -
D Baldwin Options PSRs
$368,223 $155,185
- -
$268,800 $267,260
DSRs $335,185 - - Contact Options3,4 - - $198,998 Contact PSRs3,4 - - $123,380 Contact DSRs3,4 - - -
F Calabria Options PSRs
$349,680 $147,370
- -
$412,160 $406,700
DSRs $275,502 - -
P Zealand Options PSRs
$219,875 $92,663
- -
$170,240 $162,680
DSRs $205,090 - - Notes to Table 26 1 The allocated value of Options granted in the year is the fair value calculated at grant date using a Black Scholes model with a
Monte Carlo simulation methodology to account for hurdles. The allocated value of PSRs granted in the year is the fair value calculated at grant date using a a Monte Carlo simulation methodology to account for hurdles The allocated value of DSRs granted in the year is the fair value calculated at grant date using a Discounted Cashflow technique. The fair value of each instrument has been calculated independently by Mercer Consulting. The value disclosed for each instrument (Options, PSRs, and DSRs) is the total value for each instrument over the period. This amount is allocated to remuneration (Table 24) over the vesting period. Refer Note F3 of the financial statements for further detail of the assumptions used in determining grant date fair value of Options and PSRs.
2 The value of rights (Options, PSRs, and DSRs) exercised during the year is calculated as the market price of the Company’s shares on the ASX as at the close of trading on the date the rights were exercised, after deducting any exercise price. The exercise price for PSRs is nil. There were no rights exercised during the year.
3 Granted values based are based on the average exchange rate of $1.0777 (1 July 2014 to 30 June 2015). Forfeited values refer to the previously disclosed grant date values.
4 D Barnes and D Baldwin’s Contact securities were issued under the Contact Energy Employee Long-term Incentive Scheme as Chief Executive Officer or Managing Director (respectively) of Contact Energy. Contact Energy relies on NZSX Listing Rule 7.3.9 to allow participation of the CEO/Managing Director in the Long-term Incentive Scheme. D Baldwin receives cash director’s fees from Contact Energy in his capacity as a director post 1 April 2011 following the end of his secondment to Contact Energy, but will not be granted any further securities in Contact Energy under its Long-term Incentive Scheme. However, he retains existing securities subject to their corresponding exercise hurdles and vesting requirements. Refer to Contact Energy’s website – www.contactenergy.co.nz for further details.
Page | 97 Origin Energy Limited ABN 30 000 051 696
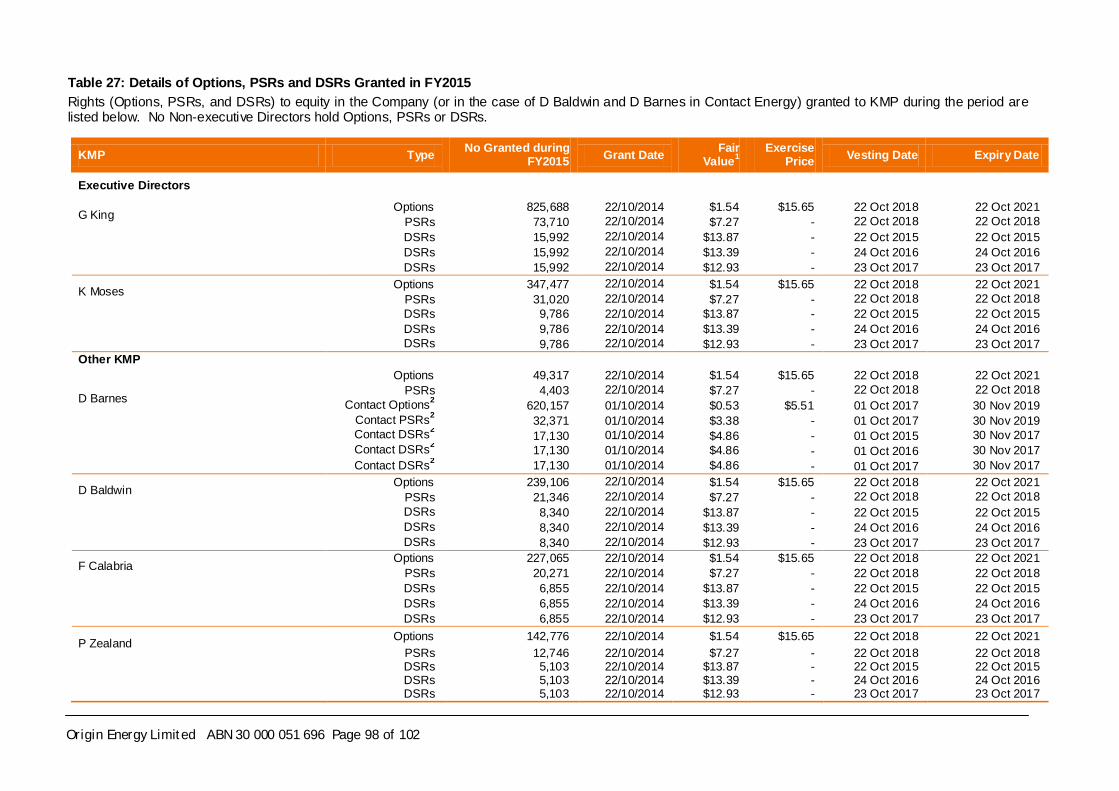
Table 27: Details of Options, PSRs and DSRs Granted in FY2015 Rights (Options, PSRs, and DSRs) to equity in the Company (or in the case of D Baldwin and D Barnes in Contact Energy) granted to KMP during the period are listed below. No Non-executive Directors hold Options, PSRs or DSRs.
KMP Type No Granted during FY2015 Grant Date Fair
Value1 Exercise
Price Vesting Date Expiry Date
Executive Directors
G King Options 825,688 22/10/2014 $1.54 $15.65 22 Oct 2018 22 Oct 2021 PSRs 73,710 22/10/2014 $7.27 - 22 Oct 2018 22 Oct 2018
DSRs 15,992 22/10/2014 $13.87 - 22 Oct 2015 22 Oct 2015 DSRs 15,992 22/10/2014 $13.39 - 24 Oct 2016 24 Oct 2016 DSRs 15,992 22/10/2014 $12.93 - 23 Oct 2017 23 Oct 2017
K Moses Options 347,477 22/10/2014 $1.54 $15.65 22 Oct 2018 22 Oct 2021 PSRs 31,020 22/10/2014 $7.27 - 22 Oct 2018 22 Oct 2018
DSRs 9,786 22/10/2014 $13.87 - 22 Oct 2015 22 Oct 2015 DSRs 9,786 22/10/2014 $13.39 - 24 Oct 2016 24 Oct 2016 DSRs 9,786 22/10/2014 $12.93 - 23 Oct 2017 23 Oct 2017 Other KMP
D Barnes
Options 49,317 22/10/2014 $1.54 $15.65 22 Oct 2018 22 Oct 2021 PSRs 4,403 22/10/2014 $7.27 - 22 Oct 2018 22 Oct 2018
Contact Options2 620,157 01/10/2014 $0.53 $5.51 01 Oct 2017 30 Nov 2019 Contact PSRs2 32,371 01/10/2014 $3.38 - 01 Oct 2017 30 Nov 2019
Contact DSRs2 17,130 01/10/2014 $4.86 - 01 Oct 2015 30 Nov 2017 Contact DSRs2 17,130 01/10/2014 $4.86 - 01 Oct 2016 30 Nov 2017 Contact DSRs2 17,130 01/10/2014 $4.86 - 01 Oct 2017 30 Nov 2017
D Baldwin Options 239,106 22/10/2014 $1.54 $15.65 22 Oct 2018 22 Oct 2021 PSRs 21,346 22/10/2014 $7.27 - 22 Oct 2018 22 Oct 2018
DSRs 8,340 22/10/2014 $13.87 - 22 Oct 2015 22 Oct 2015 DSRs 8,340 22/10/2014 $13.39 - 24 Oct 2016 24 Oct 2016 DSRs 8,340 22/10/2014 $12.93 - 23 Oct 2017 23 Oct 2017
F Calabria Options 227,065 22/10/2014 $1.54 $15.65 22 Oct 2018 22 Oct 2021 PSRs 20,271 22/10/2014 $7.27 - 22 Oct 2018 22 Oct 2018
DSRs 6,855 22/10/2014 $13.87 - 22 Oct 2015 22 Oct 2015 DSRs 6,855 22/10/2014 $13.39 - 24 Oct 2016 24 Oct 2016 DSRs 6,855 22/10/2014 $12.93 - 23 Oct 2017 23 Oct 2017
P Zealand Options 142,776 22/10/2014 $1.54 $15.65 22 Oct 2018 22 Oct 2021 PSRs 12,746 22/10/2014 $7.27 - 22 Oct 2018 22 Oct 2018
DSRs 5,103 22/10/2014 $13.87 - 22 Oct 2015 22 Oct 2015 DSRs 5,103 22/10/2014 $13.39 - 24 Oct 2016 24 Oct 2016 DSRs 5,103 22/10/2014 $12.93 - 23 Oct 2017 23 Oct 2017
Origin Energy Limited ABN 30 000 051 696 Page 98 of 102

Notes to Table 27 1 Fair values are at the date of grant. 2 Converted to Australian dollars using an average exchange rate of $1.0777 (1 July 2014 to 30 June 2015). For terms refer to Contact Energy’s website – www.contactenergy.co.nz. No Options, PSRs, or DSRs have been granted since the end of the reporting period. Options, PSRs, and DSRs were provided at no cost to the recipients. Unvested Options and PSRs expire on the earlier of their expiry date or on cessation of employment. In addition to a continuing employment service condition, the ability to exercise Options and PSRs is conditional on the consolidated entity achieving certain performance hurdles. Subject to achieving the performance hurdles, Options and PSRs granted in the period will be exercisable four years after the Grant Date. Details of the performance hurdles are included in the LTI information in section 2.3 (and, for Contact Energy, refer to Contact Energy’s website – www.contactenergy.co.nz).
Origin Energy Limited ABN 30 000 051 696 Page 99 of 102
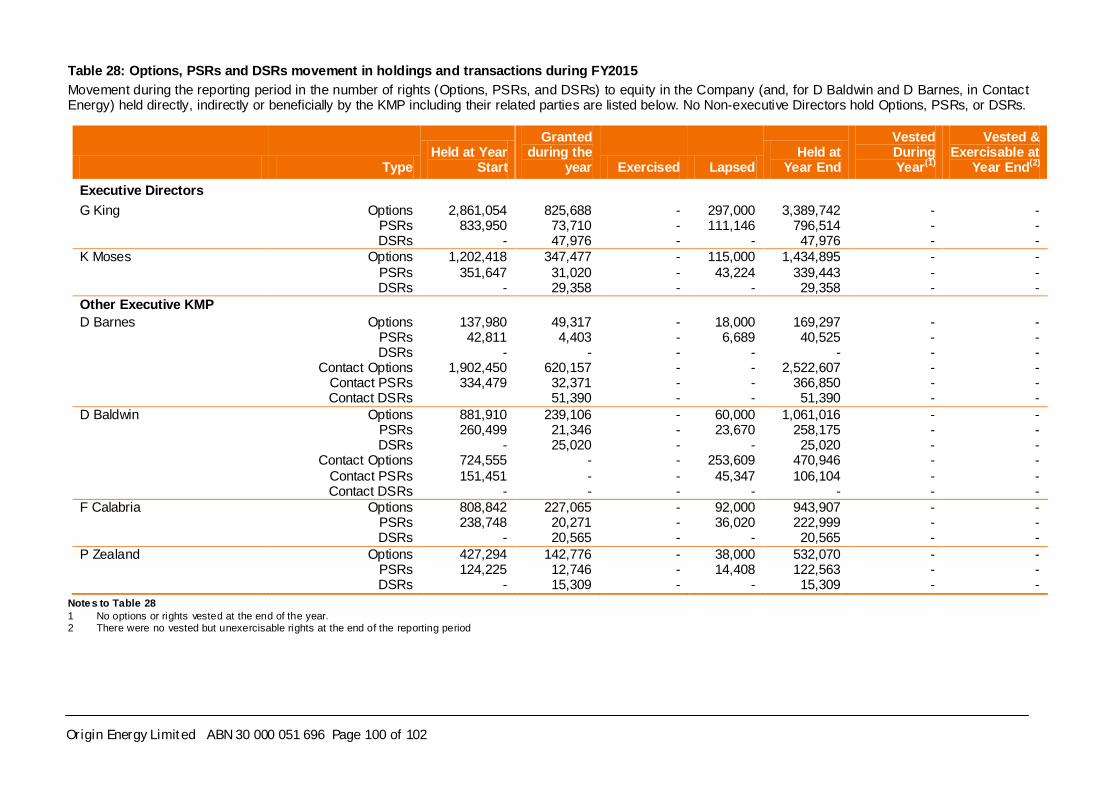
Table 28: Options, PSRs and DSRs movement in holdings and transactions during FY2015 Movement during the reporting period in the number of rights (Options, PSRs, and DSRs) to equity in the Company (and, for D Baldwin and D Barnes, in Contact Energy) held directly, indirectly or beneficially by the KMP including their related parties are listed below. No Non-executive Directors hold Options, PSRs, or DSRs.
Type Held at Year
Start
Granted during the
year Exercised Lapsed Held at
Year End
Vested During Year(1)
Vested & Exercisable at
Year End(2) Executive Directors G King Options 2,861,054 825,688 - 297,000 3,389,742 - - PSRs 833,950 73,710 - 111,146 796,514 - - DSRs - 47,976 - - 47,976 - - K Moses Options 1,202,418 347,477 - 115,000 1,434,895 - - PSRs 351,647 31,020 - 43,224 339,443 - - DSRs - 29,358 - - 29,358 - - Other Executive KMP D Barnes Options 137,980 49,317 - 18,000 169,297 - - PSRs 42,811 4,403 - 6,689 40,525 - - DSRs - - - - - - - Contact Options 1,902,450 620,157 - - 2,522,607 - - Contact PSRs 334,479 32,371 - - 366,850 - - Contact DSRs 51,390 - - 51,390 - - D Baldwin Options 881,910 239,106 - 60,000 1,061,016 - - PSRs 260,499 21,346 - 23,670 258,175 - - DSRs - 25,020 - - 25,020 - - Contact Options 724,555 - - 253,609 470,946 - - Contact PSRs 151,451 - - 45,347 106,104 - - Contact DSRs - - - - - - - F Calabria Options 808,842 227,065 - 92,000 943,907 - - PSRs 238,748 20,271 - 36,020 222,999 - - DSRs - 20,565 - - 20,565 - - P Zealand Options 427,294 142,776 - 38,000 532,070 - - PSRs 124,225 12,746 - 14,408 122,563 - - DSRs - 15,309 - - 15,309 - -
Notes to Table 28 1 No options or rights vested at the end of the year. 2 There were no vested but unexercisable rights at the end of the reporting period
Origin Energy Limited ABN 30 000 051 696 Page 100 of 102
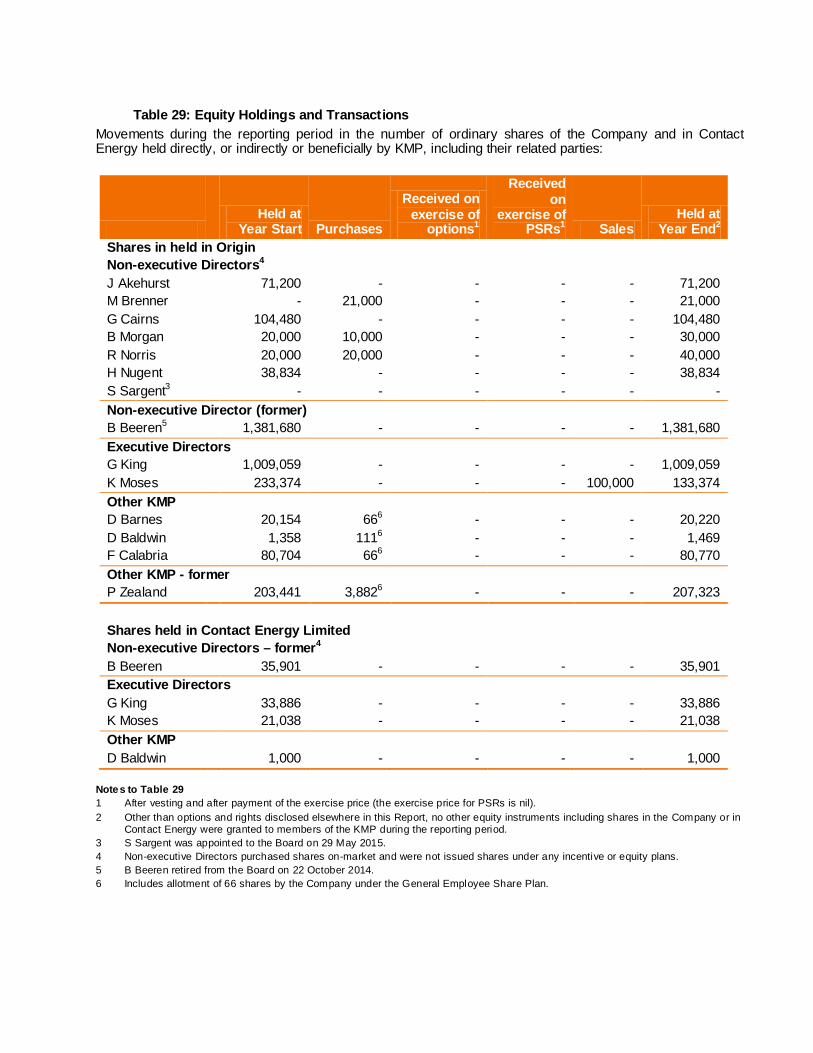
Table 29: Equity Holdings and Transactions Movements during the reporting period in the number of ordinary shares of the Company and in Contact Energy held directly, or indirectly or beneficially by KMP, including their related parties:
Held at
Year Start Purchases
Received on exercise of
options1
Received on
exercise of PSRs1 Sales
Held at Year End2
Shares in held in Origin Non-executive Directors4 J Akehurst 71,200 - - - - 71,200 M Brenner - 21,000 - - - 21,000 G Cairns 104,480 - - - - 104,480 B Morgan 20,000 10,000 - - - 30,000 R Norris 20,000 20,000 - - - 40,000 H Nugent 38,834 - - - - 38,834 S Sargent3 - - - - - - Non-executive Director (former) B Beeren5 1,381,680 - - - - 1,381,680 Executive Directors G King 1,009,059 - - - - 1,009,059 K Moses 233,374 - - - 100,000 133,374 Other KMP D Barnes 20,154 666 - - - 20,220 D Baldwin 1,358 1116 - - - 1,469 F Calabria 80,704 666 - - - 80,770 Other KMP - former P Zealand 203,441 3,8826 - - - 207,323 Shares held in Contact Energy Limited Non-executive Directors – former4 B Beeren 35,901 - - - - 35,901 Executive Directors G King 33,886 - - - - 33,886 K Moses 21,038 - - - - 21,038 Other KMP D Baldwin 1,000 - - - - 1,000
Notes to Table 29 1 After vesting and after payment of the exercise price (the exercise price for PSRs is nil). 2 Other than options and rights disclosed elsewhere in this Report, no other equity instruments including shares in the Company or in
Contact Energy were granted to members of the KMP during the reporting period. 3 S Sargent was appointed to the Board on 29 May 2015. 4 Non-executive Directors purchased shares on-market and were not issued shares under any incentive or equity plans. 5 B Beeren retired from the Board on 22 October 2014. 6 Includes allotment of 66 shares by the Company under the General Employee Share Plan.
Table 30: Loans and Other Transactions with KMP (a) Loans
There were no loans with KMP during the year. (b) Other Transactions with the consolidated entity or its controlled entities
Transactions entered into during the year with KMP which are within normal employee, customer or supplier relationships on terms and conditions no more favourable than dealings in the same circumstances on an arm’s length basis include: • the receipt of dividends from Origin Energy Limited and Contact Energy Limited • participation in the Employee Share Plan and Equity Incentive Plan Terms and conditions of
employment • reimbursement of expenses • purchases of goods and services; and • interest on Retail Notes. Certain directors of Origin Energy Limited are also directors of other companies which supply Origin Energy Limited with goods and services or acquire goods or services from Origin Energy Limited. Those transactions are approved by management within delegated limits of authority and the directors do not participate in the decisions to enter into such transactions. If the decision to enter into those transactions should require approval of the Board, the director concerned will not vote upon that decision nor take part in the consideration of it.
Signed in accordance with a resolution of Directors:
G Cairns, Chairman Sydney, 20 August 2015
Page | 102


