29
DISABILITY In INDIA : An Overview Presented by: Ms. Amitpal
| Date post: | 26-Dec-2015 |
| Category: |
Documents |
| Upload: | erick-bradley |
| View: | 215 times |
| Download: | 0 times |
DISABILITY In INDIA : An Overview
Presented by: Ms. Amitpal
Kaur

Census of India 2011
towards a bright future . . .

Census in India
• In 1872 the first Census was held in India.
• Since then, Census in India held uninterruptedly.
• The Census of India 2011 was the 15th Census and the 7th after Independence.
3
Wealth of InformationIt’s the biggest source of comprehensive data on :
• Demography
• Economic Activity
• Literacy & Education
• Housing & Household Amenities
• Urbanization
• Fertility and Mortality
• Scheduled Castes and Scheduled Tribes
• Language, Religion & Migration

Census - Utility
• Only source of primary data at village, town and ward level.
• Valuable information for planning and formulation of polices for Central & State Governments
• Widely used by National & International agencies, scholars, business people, industrialists, and many more.
• Compared to other areas of statistics such as labour
force, education, women, and older people, disability statistics has not been well developed or utilized. It is only very recently that governments have begun to recognize the urgency and importance of such statistics for better policies and program developments.
5

What is disability? World Health Organization (WHO) :
Disability is an umbrella term, covering impairments, activity limitations, and Participation restrictions.
Impairment is a problem in body function or structure
activity limitation is a difficulty encountered by an individual in executing a task or action
while a participation restriction is a problem experienced by an individual in involvement in life situations.
Acc to Census 2001
“ A person with disability means a person suffering from not less than 40% of any disability as certified by medical authority. “

Two kinds of Disability1. Mental Disability
1. Mental Retardation,2. Mental Illness
2. Physical Disability:1. Blindness 2. Hearing Disability3. Speech Disability4. Locomotor Disability
8JSS Law College

Increasing International Attention and Action.
To collect and analyze relevant data to improve understanding of situation of people with disability.
To measure the prevalence of disability.
To provide a demographic and socioeconomic profile of persons with disabilities.
Disability Statistics: Why?

The first data collected on disability is in the year
1881, in which data is collected on physical
disability, mental disability as well as on leprosy.
The Collection of data on disability was continued
from 1881 to 1931. however due to some serious
doubts expressed by census commissioners,
about the authenticity and quality of data, it was
discontinued during 1941 census.

Total number of disabled persons in undivided India
Census Year
Total population
*
Total disabled
population
Percentage to total
population
Infirmity - Type
Insanity Deaf-muteness
Blindness Leprosy
1881 253,896,330 937,063 0.37 81,132 197,215 526,748 131,968
1891 287,314,671 856,252 0.30 74,279 196,861 458,868 126,244
1901 294,361,056 670,817 0.23 66,205 153,168 354,104 97,340
1911 315,156,396 833,644 0.26 81,006 199,891 443,653 109,094
1921 318,942,480 860,099 0.27 88,305 189,644 479,637 102,513
1931 352,837,778 1,095,678 0.31 120,304 230,895 601,370 147,911

Disability Status
According to the Census 2001
• 2.19 crore people with disabilities in India ( 2.13 %)
• 58% males & 42 % females
• 49 % are literate.
• Only 34 % are employed.

Location of the Disabled Persons
Rural 75%
Urban 25%

Decomposition of Disabled Population by Type of Age-Group
More than 50% have Age less than 30
25% are of age 50 or more
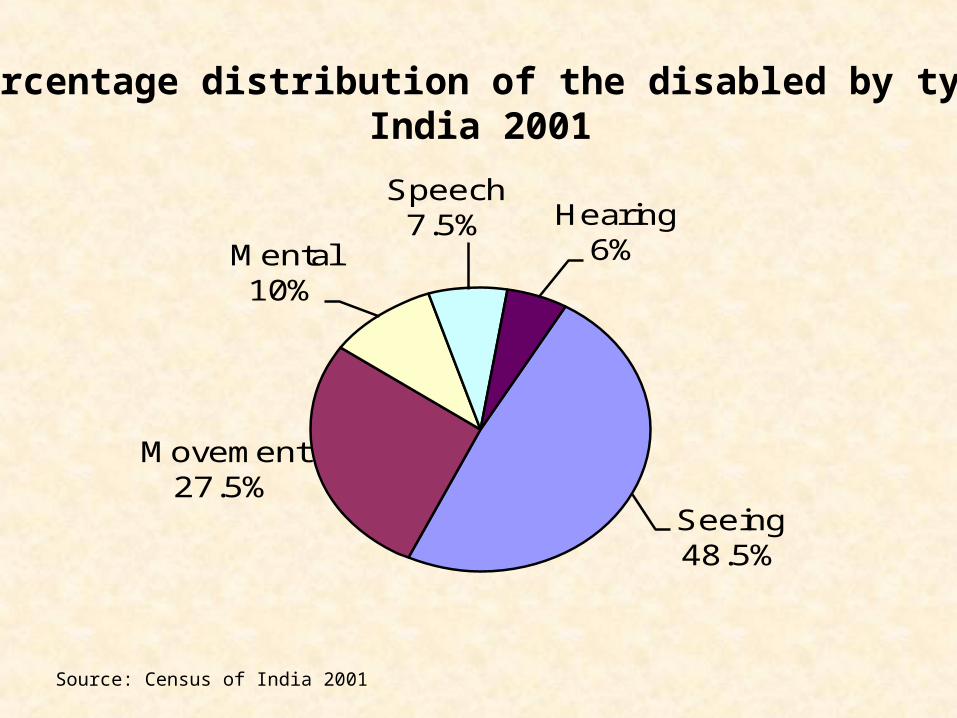
Percentage distribution of the disabled by typeIndia 2001
Source: Census of India 2001
Seeing48.5%
Movement27.5%
Mental10%
Speech7.5% Hearing
6%

Highest Number Of Disabled Uttar Pradesh (3.6 million).
Bihar (1.9 million)
West Bengal (1.8million)
Tamil Nadu (1.6 million each).
Tamil Nadu is the only state, which has a
higher number of disabled females than males.
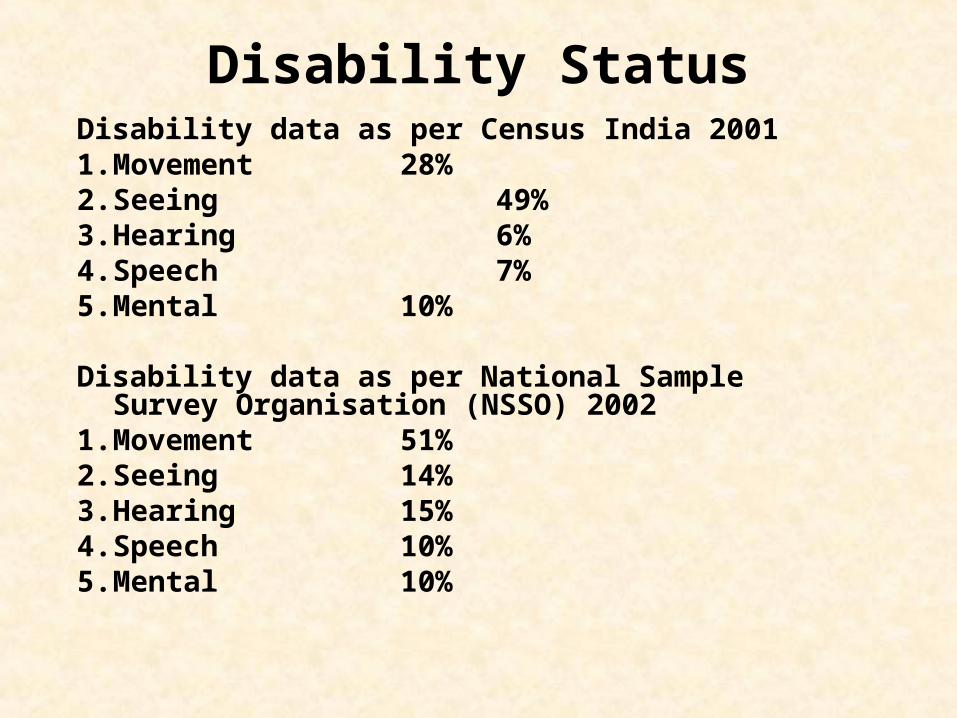
Disability StatusDisability data as per Census India 20011. Movement 28%2. Seeing 49%3. Hearing 6%4. Speech 7%5. Mental 10%
Disability data as per National Sample Survey Organisation (NSSO) 2002
1. Movement 51%2. Seeing 14%3. Hearing 15%4. Speech 10%5. Mental 10%
This difference can be explained by the
lack of universal definitions and criteria of
disabilities used during the surveys.

10% of the world’s population experiences some form of disability or impairment
(WHO Action Plan 2006-2011).
World Bank Report
In India, people with disabilities comprise between 5 and 8 per cent of the Indian population (around 55 – 90 million individuals).

Disability Data of Few Countries

Causes and Risk Factors of Disability
• The most common causes of impairment and disability include serious illness during childhood, head injury in childhood and pregnancy and birth related causes, chronic diseases such as diabetes, cardiovascular disease and cancer; injuries such as those due to road traffic crashes, falls, landmines, mental impairments, birth defects, malnutrition, and other communicable diseases.
Causes and Risk Factors of Disability
• World Bank study says that “ most of the disabled people are undisputedly amongst the poorest of the poor. Chronic poverty conditions enhance the risk of illness, injury and impairment and thus disability
• World Bank reported in 2007 that in India, disability is associated with lower socio-economic status.
10 million people are severely mentally ill in India while 5% of the population suffer from depression.
WHO Mental Health Action Plan Report,2012
WHO estimates that about 1,70,000 deaths by suicides occur every year in India. The maximum suicide rate is in the age of 15-29 years.

According to WHO countries like India
devote less than 1% of their health
budgets to mental health compared
to 10%, 12%, 18% in other countries.
Social Isolation
Families believed that they could not include the disabled person – in social occasions & gatherings and are definitely dependent on them

Attitude of Disabled People

They even have their own Olympics!
Conclusion
As you have seen, people with disabilities are unseen and
unaccounted in our country. There is a huge underestimation of
number of people with disabilities. As a result, people with
disabilities do not have the necessary facilities. You can make a big
difference in the lives of people with disability by counting them in
the upcoming Census and by providing authentic data on disability.
And feel that they are not disabled , they are differently abled.


![[IJCST-V3I5P2]:Er.Harsimranpreet Kaur, Er.Rupinder Kaur Gurm](https://static.documents.pub/doc/80x56/563dba34550346aa9aa393ed/ijcst-v3i5p2erharsimranpreet-kaur-errupinder-kaur-gurm.jpg)


