27
* *
Disadvantages of Linguistic Origin � Evidence
from Immigrant Literacy Scores∗
Ingo E. Isphording
Ruhr University Bochum
This version: May 2013
Abstract
This study quanti�es the disadvantage in the formation of literacy skills of im-
migrants that arises from the linguistic distance between mother tongue and host
country language. Combining cross-country data on literacy scores from the Inter-
national Adult Literacy Survey with unique information on the linguistic distance
between languages, gaps in literacy test scores are estimated. Linguistically distant
immigrants with a large degree of dissimilarity between mother tongue and desti-
nation language face signi�cant initial disadvantages in the literacy acquisition that
can be attributed to their linguistic origin. The importance of the linguistic ori-
gin increases with the age at migration. Linguistically distant immigrants face a
steeper assimilation pro�le in literacy scores, but convergence by time of residence
is moderate and does not o�set the initial disadvantage.
Keywords: Linguistic Distance, Literacy, Human Capital, Immigrants
JEL classi�cations: F22, J15, J24, J31
∗The author is grateful to Marcos A. Rangel and the participants of the Symposium on Migration andLanguage at Princeton University, Sebastian Otten and the members of the Chair of Competition Policy,Bochum, for helpful comments and suggestions. � All correspondence to: Ingo Isphording, Chair forEconomic Policy: Competition Theory and Policy, Ruhr University Bochum, 44780 Bochum, Germany,Email: [email protected].

1 Introduction
The information age and the accompanying rapid transformation of labor market demands
drastically increases the need for skills including literacy and numeracy (OECD 2000).
By the rise of information and communication technology usage, almost every occupation
demands a minimum level on literacy and language ability. The OECD de�nes literacy as
�the ability to understand and employ written information in daily activities, at home, at
work and in the community � to achieve one's goals, and to develop one's knowledge and
potential� (OECD 2000). As such, literacy comprises the productive functions of language
that are rewarded in the labor market, e.g. the usage of language to store information,
communicate with co-workers and to order one's thoughts (Crystal 2010). The importance
of language-related human capital represented by individual literacy for individual labor
market success has gained considerable attention in the literature (Vignoles et al. 2011,
Finnie and Meng 2005, Dougherty 2003, Gonzalez 2000, Charette and Meng 1994).
A group especially prone to insu�cient levels of literacy are immigrants from distant
linguistic backgrounds. For immigrants, low levels of literacy are a crucial risk factor in
the the social and economic integration of immigrants (Ferrer et al. 2006, Kahn 2004).
Non-native speaking immigrants face an economic decision to acquire a host-country lan-
guage (Selten and Pool 1991, Chiswick and Miller 1995). One important cost factor in
this human capital investment is the linguistic distance between mother tongue and host
country language, the degree of dissimilarities between languages in terms of pronunci-
ation, grammar, script, vocabularies etc. In linguistics, the linguistic distance between
languages is believed to decrease the potential language transfer in language acquisition,
i.e. the application of knowledge in the mother tongue L1 in the acquired language L2
(Llach 2010). In an economic sense, the linguistic distance displays the degree of trans-
ferability of home country language capital into the destination country, analogue to the
discussion of imperfect portability of human capital by Friedberg (2000). Chiswick and
Miller (1999) argue that linguistic di�erences towards the destination language decrease
the e�ciency of language acquisition, rise the costs of skill investment, and �nally have
subsequent consequences on labor market success and integration.
The multidimensionality of linguistic di�erences makes it di�cult to analyze its e�ect
on the language acquisition empirically in large scale micro data studies. The linguistic
literature on linguistic barriers in the language acquisition of immigrants mainly comprises
of qualitative or small scale quantitative studies in the linguistic literature. Van der Slik
(2010) o�ers an overview and notable exception. Beenstock et al. (2001) use non-collinear
sets of indicators for country of birth and mother tongue to identify the importance of the
linguistic origin on language skills of immigrants in Israel. A noteworthy and innovative
approach has been undertaken by Chiswick and Miller (1999) using average test scores
4

of language classes to proxy linguistic di�erences. Unfortunately, due to data limitations
this approach is restricted to the analysis of English-speaking destination countries.
Against this background, this study aims at quantifying the linguistic barriers in the
literacy skill formation. Data on literacy scores from the International Adult Literacy
Survey (IALS) are combined with a unique measure of the linguistic distance based on
di�erences in pronunciation between mother tongue and the host country language. This
measure, drawn from linguistic research by the German Max Planck Institute of Evo-
lutionary Anthropology, o�ers a continous and cardinally interpretable measurement of
linguistic di�erences for any of the world's languages. The resulting dataset covers 9 host
countries receiving immigrants from 70 sending countries and includes 1,559 individual
observations. Regressing literacy scores on the linguistic distance yields estimates of score
di�erentials with respect to the linguistic origin of an immigrant.
The study contributes to the existing literature in four ways. First, the cross-sectional
design of the IALS data allows to control for destination and origin country speci�c char-
acteristics simultaneously, which were omitted in previous studies using national datasets.
Second, the application of the innovative measure of linguistic distance allows the broad-
ening of national results to an international comparison. Third, the usage of objective
literacy scores allows to con�rm previous results for subjective measures of language skills
and avoids issues of measurement error in these self-reported indicators. Finally, the
study speci�cally addresses the in�uence of linguistic origin over time of residence and
o�ers additional evidence for the so-called Critical Period hypothesis which states that
the necessary e�ort for acquiring a language is increasing with the age at arrival of an
immigrant.
The results indicate a strong negative e�ect of the linguistic distance on the achieved
literacy score. To give a rough quanti�cation: Linguistically distant immigrants (e.g. a
Turk in the Netherlands) face signi�cant initial disadvantages of linguistic origin that are
comparable to the disadvantage of having formal education of ISCED 1 (primary edu-
cation) compared to ISCED 5 (short-cycle tertiary education). In line with the Critical
Period hypothesis, this negative e�ect is mainly observable for late arrivals who immi-
grated at an age of 12 or older. The e�ect of linguistic origin decreases over time of
residence, although the convergence does not o�set the initial disadvantage.
This study is organized as follows. Section 3 describes the data sources, speci�cally the
measurement of linguistic di�erences between languages, Section 4 outlines the empirical
strategy. Section 5 discusses the regression results against the signi�cance of literacy skills
in the labor market. Section 7 concludes.
5

2 Language Skill Acquisition and Linguistic Distance
3 Data
This study utilizes data from the public use �le of the International Adult Literacy Study
(IALS). The IALS represents a unique data source on adult's literacy skills and socio-
economic characteristics over the period of 1994 to 1998 (OECD 2000). Regarding the
migration background, not all participating countries o�er the necessary information on
the origin of immigrants. The sample is therefore restricted to immigrants to Switzerland,
the Netherlands, Sweden, Great Britain, Italy, Slovenia, Czech Republic, Finland and
Hungary.
The key advantage of the IALS data is the direct measurement of individual literacy
scores. Immigrants are de�ned as those individuals who were not born in the country of
assessment. The usage of these objective test scores circumvents measurement error is-
sues of self-reported measures of language ability. Subjective measures of language skills
are prone to substantial degrees of misreporting (Charette and Meng 1994, Dustmann
and van Soest 2001, de Coulon and Wol� 2007). Akresh and Frank (2011) show that
the misclassi�cation is not merely white noise but related to individual labor market out-
comes. The objective test scores from the IALS data o�er a convenient way to analyze
determinants of language or literacy acquisition without having to deal with these mea-
surement error issues. Three di�erent dimensions of literacy are assessed independently
in the IALS: prose literacy (the knowledge to understand and use information in texts),
document literacy (the skills to use information stored in documents like forms, schedules,
tables etc.) and quantitative literacy (the skill to locate numbers found in printed mate-
rials and to apply simple arithmetic operations). A score between 0 and 500 is assigned
to task booklets in the respective o�cial language of a region. The reported scores of the
immigrant subpopulations di�er in means. Highest average scores are found in the Czech
Republic, the lowest average in Slovenia (see Table 1). 1
To identify linguistic barriers in the formation of literacy skills, the literacy test scores
are regressed on a measure of linguistic distance between mother tongue and host country
language. The measurement of linguistic distance stems from the Automatic Similarity
1Speci�c answers to the test booklet do not indicate a literacy level with certainty. Due to therestricted number of questions, individuals with di�erent levels of literacy might still produce the sameset of answers. To take this uncertainty into account, the IALS data provides 5 di�erent plausible valuesof literacy scores for every individual. To take into account this sampling procedure of the IALS (seeMurray (1997) for further details), I follow the established method to use the simple average of the 5plausible values of test scores as the outcome variable. Standard errors are then computed taking intoaccount the replicate weights o�ered by IALS. This method takes into account unspeci�ed intra-clustercorrelation, but ignores the strati�cation of the sampling. Brown and Micklewright (2004) show that thismethod might produce slightly overstated standard errors in some cases.
6

Judgment Program, which has been developed by the German Max Planck Institute of
Evolutionary Anthropology to explain geographical distribution and historical develop-
ment of languages Bakker et al. (2009). This method has been applied to the explanation
of linguistic barriers in international trade �ows by Isphording and Otten (2013). The
idea behind this approach is that languages share common ancestors. After a language
population splits up, languages begin to di�er over time by the development of new speech
patters, changes in pronunciation and vocabulary. These di�erences are then represented
in the the number of so-called cognates, words in di�erent languages sharing a common
ancestor. The number of cognates can be approximated by comparing the pronunciation
of words between di�erent languages (Serva 2011).
The measurement of similarities in pronunciations relies on a direct comparison of
word pairs having the same meaning across di�erent languages. These words are taken
from a 40-item sublist of the so-called Swadesh list (Swadesh 1952). This deductively
derived list includes words that are believed to be culturally independent and which are
represented in any of the world's languages. These words comprise basic words of human
communication (e.g. I, You, One), body parts (e.g. Eye, Nose, Tooth) or environmental
concepts (e.g. Water, Stone, Night). For each word, the respective representation in a
language is expressed in a phonetic script, e.g. the English word mountain is transcribed
as maunt3n, while its Spanish counterpart is transcribed as monta5a. Each character in
these transcriptions represents a common sound of human communication. To assess the
dissimilarity of two words, the Levenshtein distance, i.e. the minimum number of sounds
that have to be changed, to be removed or added to transfer the word of one language into
the same word in a di�erent language is calculated. In the above example, this minimum
distance consists of 5 sounds. Table 2 summarizes some computational examples. The
average minimum distance between all 40 word pairs is normalized to take into account
potential similarities by chance due to shared phonetic inventories, resulting in the �nal
measure of linguistic dissimilarities (Bakker et al. 2009).
The approach yields a continuous descriptive measure of the di�erences in pronunci-
ation between two languages as the proxy for the number of cognates, and thus, on the
approximative linguistic di�erence between the languages. Wichmann et al. (2010) show
that the linguistic distance measured by di�erences in pronunciation is a strong predictor
for family relations of languages. Table 3 lists the closest and furthest languages in the
used sample with regard to some destination languages. Closest distances emerge within
the same language family (Germanic languages for English and German, Romance lan-
guages for French and Slavic languages for Czech). The closest linguistic distance di�erent
from zero in the present sample is faced by Serbian-speaking immigrants in Slovenia, the
largest distance by Turkish immigrants in the Netherlands. The complete matrix of lin-
7

guistic distances can be found in Table 9 in the appendix. The linguistic distance is
merged with the IALS data using information on the �rst language of an immigrant.
4 Empirical Strategy
To identify systematic disadvantages of linguistic origin in the literacy scores, the following
equation is estimated separately for each of the three literacy scores using multivariate
linear regressions:
Y = β0 + β1LD + β2Y SM + β3AgeEntry
+ β4LD × AgeEntry12 + β5LD × Y SM
+ X ′γ +O′δ +D′λ+ ε
Y indicates the literacy score in one of the three dimensions. LD is the calculated
linguistic distance towards the host country language. Acquisition of the destination
language is crucially a�ected by the time exposed to the language, proxied by the time
of residence (Y SM) in the destination country. The interaction term between years
since migration (Y SM) and the linguistic distance accounts for a convergence over time
of residence between native and non-native speakers in literacy scores. The linguistic
distance is also interacted with a binary indicator for arrival in the host country at the
age of 12 or older (AgeEntry12). Previous psychobiological literature indicates that early
childhood language acquisition is not hindered by linguistic di�erences until a certain
age threshold in adolescence, which is referred to in linguistics as the Critical Period
hypothesis (Newport 2002). Following this hypothesis, the interaction e�ect is expected
to be negative, indicating a higher impact of linguistic origin for late arrivals. The main
e�ects of years since migration and arrival at age 12 or older, β4 and β5, indicate the
e�ects for the subpopulation of native-speaking immigrants with LD = 0.
The control variables X consist of a gender indicator, the individual and parental ed-
ucation (in ISCED groups)2, birth cohort indicators and the geographic distance between
capitals of destination and origin. Country-wise descriptive statistics on these explana-
tory variables are reported in Table 1. The inclusion of own and parental education is
of speci�c importance for my speci�cation, as it is a �rst way to deal with potential se-
lection into source countries according to expected linguistic di�erences, as analyzed for
2The underlying question for the educational information is: What is the highest level of schooling youhave completed? Information is coded into ISCED codes, omitting ISCED category 4, Post-secondarynon-tertiary education including vocational training. In the estimations ISCED 0 and ISCED 1 are usedas comparison group.
8

aggregated migration �ows by Adsera and Pytlikova (2012).
The cross-national design of the IALS allows to control simultaneously for origin-
and destination-�xed e�ects by including indicators for 9 receiving (D) and 70 sending
countries (O). These �xed e�ects capture potentially omitted receiving country charac-
teristics, e.g. di�erences in language acquisition support, or selective migration policies
favoring skilled immigrants. Potentially omitted sending country characteristics can be
di�erences in media exposure to foreign languages or di�erences in the quality of the edu-
cation system. As linguistic and geographic distance both vary on the level of origin- and
destination-country permutations, they are not collinear with either the set of origin- or
destination-country indicators.
5 Results
The main results of the estimation of equation 1 are summarized in Table 4. The spec-
i�cations are estimated separately for each dimension of literacy, prose, document and
quantitative. Linguistic distance enters the speci�cation both as a main e�ect and as an
interaction with the age at arrival and the years since migration. Such, the main e�ect
of linguistic distance displays the initial disadvantage (at Y SM = 0) for young arrivals
immigrating at the age of 11 or younger. This initial relationship of linguistic distance and
the literacy scores turns out to be signi�cant in the prose and the quantitative literacy,
but remains insigni�cant for document literacy.
The negative e�ect of the linguistic distance strongly increases with the age at arrival,
indicated by the signi�cant coe�cients of the interaction terms between age of entry at
the age of 12 or older and the linguistic distance, where now also the document literacy
is negatively a�ected. This interaction supports the idea of the linguistic Critical Period
Hypothesis. Young children are able to learn new languages irrespectively from their own
linguistic origin or are only marginally a�ected by the linguistic distance. With increasing
age at arrival, the linguistic barriers in the language acquisition start to rise.3 Based on
these parameters, this is also depicted in illustrations of depicted means in Figure 2. A
similar pattern arises for all three dimensions of literacy in the upper panels (a), (b) and
(c). Though the linguistic distance has only a small e�ect for childhood immigrants (the
dark grey line), it distinctively decreases the test scores for late arrivals, indicated by
much steeper slope of the light grey line.
The results indicate a certain convergence over time of residence for immigrants with
3The Critical Period is believed to end with adolescence, although some scholars (e.g. Chiswick andMiller 2008) claim a continuous decrease in learning e�ciency rather than a speci�c threshold. Estima-tions with indicators de�ned at di�erent age thresholds indicate that the results are not sensitive to thechoice of the actual threshold, see Table 8 in the appendix.
9

di�erent linguistic background. The positive interaction of linguistic distance and years
since migration shows that immigrants with a distant linguistic background face a steeper
assimilation pro�le and are able to catch up over time. This is consistent with larger
incentives for immigrants with larger initial disadvantages as discussed by Chiswick (1978).
Still, looking again at the illustrations in Figure 2, the convergence is only moderate. The
time of exposure to the host county language, indicated by the years since migration, does
not signi�cantly a�ect the literacy scores of native speakers. A more distant linguistic
background increases the assimilation rate, although only marginally (Figure 2, panels
(d), (e), (f)). The convergence does not compensate the large initial disadvantage of
linguistic origin.
Due to the interaction with the linguistic distance, the pure main e�ects of age at ar-
rival and years since migration indicate the in�uence on literacy scores for native speakers
(with LD = 0). The coe�cients of these main e�ects remain small in levels and mostly
insigni�cant. Native speakers do not face a disadvantage by immigrating at an older
age, as they acquired the destination language skills already as their mother tongue prior
migration. Neither do they face an assimilation process by time of residence.4
The e�ect of linguistic distance can be quanti�ed using di�erences in predicted means
and �xing covariates at their sample means: the initial disadvantage of linguistic origin
of a linguistically distant immigrant (e.g. a Turk in the Netherlands, LD = 102.33)
compared to a native-speaking immigrant accounts for 33.5 (13.1, 25.3) points in the
prose (quantitative, document) scale. It increases to 79.2 (66.1, 67.5) points for immigrants
who arrived at the age of 12 or later. This is a very large initial e�ect of the linguistic
origin. The strong disadvantage is roughly comparable to the disadvantage of having no
formal schooling or schooling of ISCED 1 (only primary schooling) compared to ISCED 5
(short-cycle tertiary education). Due to the only moderate convergence, the disadvantage
prevails over a long period of time. After 15 years of residence, the average disadvantage
still accounts for 59.8 (53.9, 50.6) points.
Concerning the control variables, women experience disadvantages in the quantitative
and document literacy, but not in the prose literacy. Younger birth cohorts show higher
levels of literacy. Strongest determinant for the literacy scores is the level of formal
schooling. The ISCED level indicators show a highly signi�cant positive partial correlation
4One concern might be that the results are solely driven by the di�erence between native-speakingimmigrants and non-native speakers. Therefore, I repeat the estimations on a subsample excluding nativespeakers with a linguistic distance of zero. This leads to a reduced sample of 878 observations, whilethe �t of the regressions decreases slightly. The results for this subsample are summarized in Table 7.Compared to the estimations in Table 4 the general pattern remains the same, although the coe�cients ofinterest become larger. The now missing natural control group of native speakers (with LD = 0) rendersthe quantitative interpretation of the results less intuitive, but I conclude from this additional resultsthat the results of the main regressions are not solely driven by the comparison of native speakers andnon-native speakers.
10

to the literacy scores that increases with the accomplished degree. Parental education
shows a similar but less distinct pattern.
Gender di�erences in estimates are reported in Table 5. The general pattern seems to
be independent of gender. Di�erences arise in the increase of the e�ect of the linguistic
distance by age at entry. Here, the female results are more distinct than the male coun-
terparts. Insigni�cant main e�ects of linguistic distance in the document and quantitative
literacy and strong negative interaction terms with age at entry at age 12 or older strongly
con�rm the Critical Period hypothesis of e�ortless language acquisition for young arrivals,
while the picture remains fuzzy for the male subsample.
The general pattern that can be concluded from the results is a moderate e�ect of
linguistic distance on the average literacy scores for young arriving immigrants, which is
distinctively larger for late arrivals who immigrated at the age of 12 or later. Time of
residence leads to an increase in exposure to the destination country language and has a
moderate positive e�ect on the literacy scores. The convergence in literacy scores does
not make up for the initial disadvantage, which prevails even a long time after immigra-
tion. Disadvantage of age at arrival and the assimilation pro�le cannot be observed for
immigrating native speakers with zero linguistic distance.
Although the small number of observations does not allow for a direct estimation of
labor market disadvantages of linguistic origin, the magnitude of the results indicates
the importance of linguistic barriers on the labor market. Figure 1 displays descriptively
the distributions of literacy scores along the wage distribution and for the employed and
unemployed subsample. The initial disadvantage of linguistically distant immigrants dis-
tinctively exceeds the di�erences we can observe along labor market outcomes. Therefore,
it is likely, that the e�ect of linguistic distance I observe has an economically signi�cant
e�ect on the labor market integration of immigrants, above and beyond merely statistical
signi�cance.
6 Additional Robustness Tests
So far, I interpreted the coe�cient of the linguistic distance as the pure linguistic in�u-
ence of the mother tongue on the destination language acquisition, while controlling for
unobservable �xed e�ects on the origin- destination-country level. However, unobserved
heterogeneity might also arise on the level of combinations of origin and destination.
Unfortunately, I cannot include combined destination-origin �xed e�ects, as this would
eliminate almost any variation in the variable of interest, the linguistic distance. Still,
some potential sources of such a community e�ect can be directly addressed by enriching
the data by additional external sources.
11

Table 6 reports results of robustness checks that aim at ruling out potential omit-
ted variables on the origin/destination level that could bias my main results. Due to
incomplete data availability of some of these variables, the number of observations di�ers
from the main speci�cations in Table 4. Column (1) reports changes in estimation results
when the bilateral migrant stock on the origin/destination level is included. The numbers
are provided by the UN Population Division (United Nations, Department of Economic
and Social A�airs 2012). Migrant stocks are related to the language acquisition by am-
bigous enclave e�ects (Dustmann and Fabbri 2003, Chiswick and Miller 2002, Cutler et al.
2008). Living in a neighbourhood dominated by speakers of the same language family
might decrease incentives to acquire skills in the destination language or might provide a
supportive environment easing hurdles for integration. As I only observe migrant stocks
on the national level, it additionally represents selection patterns by linguistic hurdles
as analyzed by Adsera and Pytlikova (2012), which are not captured by the already in-
cluded measures for individual and parental education. Although the migrant stock is
positively related to the literacy scores, the results for the linguistic distance measure and
the interactions with age at migration and time of residence remain robust.
Language is a major dimension of the culture of a country. Therefore, it is important
to note that the concept of linguistic distance is di�cult to separate from further cultural
dissimilarities between countries. A number of studies has attempted to operationalize the
idea of cultural distances between countries, using innovative approaches as the average
genetic distance between populations (Spolaore and Wacziarg 2009), expert-based opin-
ions on cultural values (Hofstede et al. 2010), or even voting behavior in international song
contests (Kokko and Gustavsson Tingvall 2012). While each of these measures possesses
its own advantages and �aws, the major disadvantage is the restriction to small subsets of
origin and destination countries. A very generally applicable approach is o�ered by Ingle-
hart and Welzel (2005, 2010), who use di�erences in answers to the World Value Survey
to generate a cultural map of the world's populations using average di�erences between
countries on two cultural dimensions, traditional vs. secular-rational values and survival
vs. self-expression. Column (2) summarizes the results of including this measure for
cultural di�erence. The cultural di�erences are negatively related to the literacy scores.
Despite the fact that cultural distance and linguistic distance are negatively correlated by
a correlation coe�cient of r = 0.38, the results for the linguistic distance measure remain
robust to the inclusion of this proxy of cultural di�erences. This makes me con�dent that
the estimated e�ect of linguistic distance does not capture further cultural dissimilarities
and indeed shows the e�ect of linguistic di�erences.
Finally, immigrants sharing the same origin country might face di�erent degrees of
discrimination and/or institutional hurdles when accessing the destination country labor
12

market. Chiswick and Miller (2012) even use a measure of linguistic distance as a proxy
for transferability of human capital. As labor market opportunities act as important
incentives in the acquisition of language-related human capital, such correlations between
linguistic distance and transferability or discriminational hurdles could bias the results. To
control for this potential source of unobserved heterogeneity, column (3) includes controls
for labor force particiation and, conditional on being employed, the individual wage. The
results con�rm a positive relationship between labor market success and literacy scores.
The results concerning the linguistic distance remain robust.
In the last column (4), the additional regressors enter the speci�cation jointly, again
not signifantly a�ecting the main results on the linguistic distance. Taken together, the
robustness checks indicate that omitted variables on the origin/destination level do not
bias the main results reported in Table 4.
7 Conclusion
Insu�cient language pro�ciency is a signi�cant hurdle for the integration and assimilation
of immigrants into the labor market of the destination countries. The literacy acquisition
in the host country language is crucially in�uenced by the linguistic origin of an immigrant.
Immigrants with a linguistically distant background face distinctively higher costs to reach
a su�cient level of command of a language. Against this background, I aim at quantifying
the disadvantage of linguistic origin in literacy test scores.
Literacy test scores from the International Adult Literacy Survey are regressed on a
novel measure of linguistic distance between the mother tongue and the destination coun-
try language of immigrants. The results indicate signi�cant di�erences in literacy scores
among immigrants that can be attributed to their respective linguistic origin. Linguisti-
cally distant immigrants face a strong disadvantage in literacy scores that is distinctively
larger for late arrivals immigrating at the age of 12 or older. This increasing importance
of the linguistic origin by age at arrival con�rms the linguistic Critical Period hypothe-
sis. Although I observe a moderate convergence in test scores over time of residence, the
disadvantages in literacy scores prevail over a long period after immigration. The di�er-
entials in literacy scores by linguistic origin exceed the average di�erence in literacy scores
between the employed and unemployed subpopulations as well as the increase in average
literacy scores along the wage distribution. As such, the linguistic origin is expected to
have a signi�cant in�uence on the economic success of immigrants in the host country,
as directly estimated by Isphording and Sinning (2012) and Bleakley and Chin (2004) for
the US.
These results broaden the previous evidence on the heterogeneity by linguistic origin
13

using national datasets (Chiswick and Miller 1999, Van der Slik 2010, Isphording and
Otten 2013) to a cross-national perspective. By using objective measures of literacy, the
results con�rm the previous �ndings on the e�ect of linguistic distance on subjective in-
dicators of language ability and allow for a quanti�cation of the e�ects. The operational-
ization of the concept of linguistic distance o�ers important insights into a previously
unobservable source of heterogeneity in the assimilation of immigrants, attributed to the
�black box� of cultural barriers and di�erences (Epstein and Gang 2010).
14

8 Tables and Figures
Figure 1: Literacy and Labor Market Outcomes (Box-Whisker-Plots)
Notes: � Own calculations from IALS data. � Boxes bordered at 25th and 75th percentile, median lineindicated at 50th percentile. � Whiskers of 1.5 × interquartile range.
15

Table1:Descriptives
All
CH(G
)CH(F)
CH(I)
NSW
GB
ISL
CZ
FIN
HU
Fem
ale
0.53
0.58
0.54
0.52
0.51
0.56
0.49
0.58
0.53
0.58
0.41
0.59
(0.50)
(0.50)
(0.50)
(0.50)
(0.50)
(0.50)
(0.50)
(0.50)
(0.50)
(0.50)
(0.50)
(0.50)
Ageatentry12orolder
0.65
0.93
0.80
0.78
0.51
0.74
0.70
0.44
0.65
0.44
0.60
0.51
(0.48)
(0.26)
(0.40)
(0.42)
(0.50)
(0.44)
(0.46)
(0.50)
(0.48)
(0.50)
(0.49)
(0.51)
Born
before
1940
0.12
0.33
0.20
0.15
0.11
0.17
0.12
0.01
0.08
0.10
0.01
0.26
(0.33)
(0.47)
(0.40)
(0.36)
(0.32)
(0.38)
(0.33)
(0.08)
(0.27)
(0.30)
(0.12)
(0.45)
Born
1940-49
0.17
0.19
0.23
0.27
0.27
0.22
0.17
0.04
0.19
0.52
0.09
0.27
(0.38)
(0.39)
(0.42)
(0.45)
(0.44)
(0.42)
(0.38)
(0.20)
(0.39)
(0.51)
(0.29)
(0.45)
Born
1950-59
0.22
0.17
0.22
0.21
0.21
0.28
0.25
0.18
0.33
0.19
0.17
0.03
(0.42)
(0.38)
(0.41)
(0.41)
(0.41)
(0.45)
(0.43)
(0.39)
(0.47)
(0.40)
(0.38)
(0.18)
Born
1960-69
0.30
0.24
0.22
0.24
0.28
0.21
0.31
0.42
0.26
0.11
0.24
0.26
(0.46)
(0.43)
(0.42)
(0.43)
(0.45)
(0.41)
(0.46)
(0.50)
(0.44)
(0.32)
(0.43)
(0.45)
Born
1970-84
0.18
0.07
0.13
0.13
0.13
0.12
0.15
0.34
0.15
0.08
0.49
0.18
(0.39)
(0.25)
(0.34)
(0.33)
(0.34)
(0.33)
(0.36)
(0.48)
(0.36)
(0.28)
(0.50)
(0.39)
Yearssince
migration
21.98
23.43
21.27
23.97
23.60
20.81
21.04
21.17
26.51
33.47
13.95
29.47
(12.86)
(13.28)
(12.74)
(12.28)
(12.62)
(13.26)
(12.80)
(10.25)
(11.95)
(16.21)
(11.75)
(21.50)
NoSchooling
0.02
0.00
0.00
0.03
0.05
0.03
0.02
0.02
0.01
0.00
0.00
0.03
(0.13)
(0.00)
(0.00)
(0.18)
(0.22)
(0.17)
(0.13)
(0.12)
(0.07)
(0.00)
(0.00)
(0.17)
ISCED1
0.12
0.17
0.29
0.25
0.15
0.21
0.11
0.03
0.08
0.26
0.00
0.04
(0.33)
(0.38)
(0.45)
(0.43)
(0.36)
(0.41)
(0.32)
(0.18)
(0.28)
(0.45)
(0.00)
(0.19)
ISCED2
0.32
0.24
0.19
0.29
0.25
0.11
0.41
0.29
0.41
0.44
0.46
0.21
(0.47)
(0.43)
(0.39)
(0.46)
(0.44)
(0.32)
(0.49)
(0.46)
(0.49)
(0.50)
(0.50)
(0.41)
ISCED3
0.32
0.44
0.33
0.33
0.34
0.47
0.19
0.48
0.41
0.22
0.37
0.30
(0.47)
(0.50)
(0.47)
(0.47)
(0.47)
(0.50)
(0.39)
(0.50)
(0.49)
(0.42)
(0.49)
(0.47)
ISCED5
0.05
0.08
0.09
0.03
0.00
0.05
0.06
0.05
0.05
0.00
0.01
0.12
(0.22)
(0.27)
(0.28)
(0.17)
(0.00)
(0.22)
(0.24)
(0.22)
(0.22)
(0.00)
(0.11)
(0.33)
ISCED6/7
0.16
0.07
0.11
0.06
0.21
0.13
0.21
0.13
0.04
0.08
0.16
0.31
(0.37)
(0.25)
(0.31)
(0.23)
(0.41)
(0.33)
(0.41)
(0.33)
(0.20)
(0.27)
(0.37)
(0.47)
LinguisticDistance
41.36
46.45
53.07
24.32
46.82
71.08
41.43
29.46
27.40
31.66
50.45
10.06
(44.25)
(45.73)
(36.93)
(37.86)
(43.71)
(42.24)
(46.92)
(38.55)
(21.05)
(29.72)
(46.16)
(29.96)
Distance
betweencapitals
3763.24
819.15
938.69
1224.08
4686.52
10726.36
4559.22
2376.89
680.39
1531.73
1460.44
659.64
(4272.56)
(298.59)
(469.33)
(1843.50)
(4291.51)
(3901.37)
(4244.19)
(2945.99)
(1633.83)
(1903.56)
(2446.70)
(387.50)
Prose
Literacy
245.83
212.66
237.05
230.50
257.90
264.01
246.77
250.26
212.12
260.41
267.57
253.72
(72.99)
(75.04)
(67.70)
(57.18)
(51.63)
(59.77)
(85.69)
(53.28)
(61.43)
(57.23)
(84.02)
(51.89)
DocumentScore
246.62
215.08
252.36
236.84
261.37
266.49
246.38
247.81
209.27
265.93
268.11
252.97
(78.24)
(84.09)
(63.03)
(60.49)
(57.83)
(60.61)
(92.67)
(56.86)
(66.81)
(67.55)
(76.14)
(58.39)
QuantitativeLiteracy
253.23
235.56
259.35
238.51
260.10
270.32
252.80
253.61
221.78
273.06
263.57
261.62
(75.93)
(77.20)
(64.63)
(63.14)
(59.72)
(61.98)
(89.19)
(57.74)
(66.70)
(72.07)
(72.86)
(70.68)
Observations
1521
120
220
324
88
140
140
76
282
36
69
26
Notes:
�Weightedmeansandstandard
deviations(inparantheses)by
country.�CH(G
):Switzerland(G
erman),
CH(F):
Switzerland(French),
CH(I):
Switzerland(Italian),
N:
Netherlands,SW:Sweden,GB:GreatBritain,I:Italy,SL:Slovenia,CZ:Czech
Republic,FIN
:Finland,HU:Hungary.
16

Table 2: Linguistic Distance: Computational Examples
Word Spanish English Distance
you tu yu 1
not no nat 2
Person persona pers3n 2
Night noCe nEit 3
Mountain monta5a maunt3n 5
Source: Brown (2008).
17

Table 3: Closest and Furthest Languages
English German
Closest Furthest Closest Furthest
Language Distance Language Distance Language Distance Language DistanceDutch 63.22 Tamil 100.81 Swiss-German 48.34 Tamil 100.2Norwegian 64.12 Turkish 101.04 Dutch 51.50 Hebrew 100.39Swedish 64.40 Finnish 102.27 Norwegian 64.92 Indonesian 101.75Danish 69.63 Somalian 103.03 Swedish 66.56 Malay 101.75German 72.21 Vietnamese 104.06 Danish 66.96 Korean 104.3
French Czech
Closest Furthest Closest Furthest
Language Distance Language Distance Language Distance Language DistanceCatalano 71.6 Irish 100.22 Slovak 32.59 Hebrew 99.55Italian 73.89 Hungarian 100.65 Croatian 43.74 Vietnamese 99.72Portuguese 74.36 Vietnamese 101.81 Serbian 43.74 Korean 99.85Romanian 74.39 Japanese 101.94 Serbo-croatian 43.95 Chinese 101.12Friulano 74.54 Korean 102.74 Polish 44.93 Japanese 101.76
Notes: � Source: Own calculations using programs for calculating ASJP distance matrices (Version 2.1),see http: // email. eva. mpg. de/ ~wichmann/ software. htm .
18

Table 4: Literacy and Linguistic Origin
Prose Document Quantitative
Linguistic Distance -0.328∗∗ -0.128 -0.247∗
(0.09) (0.10) (0.11)Ling. Dist. × Age at entry 12 or older -0.446∗∗∗ -0.518∗∗∗ -0.413∗∗∗
(0.06) (0.07) (0.08)Ling. Dist. × years since migration 0.013∗∗∗ 0.008∗∗ 0.011∗∗∗
(0.00) (0.00) (0.00)Age at entry 12 or older 0.397 7.211† 9.333∗
(4.15) (3.68) (3.79)Years since migration -0.333 0.054 0.106
(0.22) (0.22) (0.22)Female 2.686 -8.694∗∗ -17.621∗∗∗
(2.21) (2.49) (2.74)Born 1940-49 30.436∗∗∗ 32.123∗∗∗ 25.491∗∗∗
(5.40) (5.93) (5.44)Born 1950-59 37.270∗∗∗ 45.309∗∗∗ 40.902∗∗∗
(5.25) (5.67) (5.37)Born 1960-69 35.115∗∗∗ 39.948∗∗∗ 36.678∗∗∗
(6.75) (7.34) (7.15)Born 1970-84 50.196∗∗∗ 54.610∗∗∗ 42.278∗∗∗
(8.45) (8.81) (8.51)ISCED 2 26.925∗∗∗ 26.830∗∗∗ 22.465∗∗∗
(3.48) (3.81) (3.94)ISCED 3 52.008∗∗∗ 57.721∗∗∗ 58.877∗∗∗
(3.50) (3.82) (3.89)ISCED 5 68.633∗∗∗ 65.066∗∗∗ 65.026∗∗∗
(4.28) (4.71) (5.05)ISCED 6/7 78.334∗∗∗ 75.788∗∗∗ 76.834∗∗∗
(3.43) (3.73) (3.92)Parents: ISCED 1 11.804† 10.320 11.091†
(5.82) (6.17) (6.06)Parents: ISCED 2 5.980 5.963 7.634
(6.10) (6.48) (6.10)Parents: ISCED 3 13.444† 12.657 17.285∗
(6.88) (7.60) (7.55)Parents: ISCED 5 12.467† 16.517∗ 10.961
(6.94) (7.31) (7.08)Parents: ISCED 6/7 5.664 -0.679 -0.711
(6.15) (6.72) (6.64)Distance between capitals -0.007 -0.008 -0.010∗
(0.01) (0.00) (0.00)Destination-�xed e�ects yes yes yesOrigin-�xed e�ects yes yes yes
R2 0.602 0.589 0.569N 1521 1521 1521
Notes: � Signi�cant at: ∗∗∗0.1% level; ∗∗1% level; ∗5% level; †10% level. �Standard errors in parantheses, computed using replicate weights and mean ofplausible values to take sampling structure into account. � Education base cat-egory: ISCED1/No schooling. � Reference birth cohort: Born before 1940. �The dependent variable: Literacy test scores (range 0-500).
19

Table5:LiteracyandLinguistic
Origin:GenderDifferences
Men
Women
Prose
Document
Quantitative
Prose
Document
Quantitative
LinguisticDistance
-0.274∗∗
-0.146†
-0.225∗
-0.277∗∗
-0.026
-0.149
(0.08)
(0.08)
(0.09)
(0.09)
(0.11)
(0.09)
Ling.Dist.×Ageatentry12orolder
-0.529∗∗∗
-0.505∗∗∗
-0.397∗∗∗
-0.389∗∗∗
-0.641∗∗∗
-0.570∗∗∗
(0.10)
(0.10)
(0.10)
(0.09)
(0.11)
(0.09)
Ling.Dist.×yearssince
migration
0.009∗∗∗
0.006∗
0.005†
0.014∗∗∗
0.009∗∗
0.015∗∗∗
(0.00)
(0.00)
(0.00)
(0.00)
(0.00)
(0.00)
Ageatentry12orolder
9.807†
15.149∗
20.125∗∗
-12.498
-0.249
1.665
(5.21)
(5.66)
(5.75)
(9.32)
(9.18)
(8.58)
Yearssince
migration
0.099
0.619∗
0.745∗
-0.710∗
-0.612†
-0.575†
(0.23)
(0.24)
(0.28)
(0.27)
(0.30)
(0.29)
Born
1940-49
23.157∗∗
21.437∗∗
10.192
38.286∗∗∗
43.966∗∗∗
46.764∗∗∗
(6.52)
(6.16)
(6.03)
(7.57)
(8.53)
(7.78)
Born
1950-59
41.594∗∗∗
49.708∗∗∗
39.822∗∗∗
26.804∗∗
37.798∗∗∗
44.449∗∗∗
(6.68)
(7.99)
(7.72)
(9.16)
(8.34)
(8.35)
Born
1960-69
48.550∗∗∗
53.986∗∗∗
44.440∗∗∗
18.331†
23.869∗
30.220∗∗
(7.23)
(7.83)
(8.39)
(9.61)
(9.82)
(9.72)
Born
1970-84
61.787∗∗∗
69.886∗∗∗
50.053∗∗∗
41.432∗∗
47.623∗∗
47.498∗∗∗
(10.00)
(10.53)
(10.94)
(12.38)
(12.80)
(11.63)
ISCED2
32.284∗∗∗
33.407∗∗∗
28.236∗∗∗
10.470
8.967
4.328
(5.77)
(5.52)
(5.86)
(6.20)
(7.51)
(6.67)
ISCED3
44.957∗∗∗
55.948∗∗∗
53.876∗∗∗
50.095∗∗∗
49.221∗∗∗
49.887∗∗∗
(5.35)
(5.46)
(5.28)
(6.67)
(8.07)
(7.53)
ISCED5
63.326∗∗∗
59.439∗∗∗
56.837∗∗∗
56.276∗∗∗
51.409∗∗∗
53.167∗∗∗
(6.51)
(6.20)
(6.12)
(6.57)
(7.69)
(7.32)
ISCED6/7
79.161∗∗∗
84.523∗∗∗
80.118∗∗∗
66.640∗∗∗
53.898∗∗∗
58.813∗∗∗
(6.35)
(7.40)
(6.11)
(6.54)
(6.97)
(6.16)
Parents:ISCED1
13.857∗∗
10.739∗
20.588∗∗∗
28.156∗∗
26.858∗∗∗
19.943∗∗
(4.75)
(4.19)
(5.18)
(7.58)
(6.38)
(6.35)
Parents:ISCED2
12.715∗
5.636
15.784∗∗
13.160†
18.377∗
14.311∗
(5.35)
(4.42)
(5.10)
(6.79)
(6.82)
(6.54)
Parents:ISCED3
15.178∗
8.864
20.995∗
23.976∗∗
24.878∗∗
19.189∗∗
(6.73)
(7.46)
(8.09)
(6.99)
(6.76)
(6.76)
Parents:ISCED5
16.344†
18.864†
25.114∗∗
31.994∗∗
42.727∗∗∗
25.387∗∗
(8.26)
(9.77)
(8.14)
(9.70)
(8.01)
(8.47)
Parents:ISCED6/7
11.120∗
1.492
12.433†
25.746∗
21.122∗
10.587
(4.96)
(5.16)
(6.19)
(9.77)
(9.44)
(8.89)
Distance
betweencapitals
-0.034∗
-0.030†
-0.044∗
0.008
0.002
0.002
(0.02)
(0.02)
(0.02)
(0.00)
(0.01)
(0.01)
Destination-�xed
e�ects
yes
yes
yes
yes
yes
yes
Origin-�xed
e�ects
yes
yes
yes
yes
yes
yes
R2
0.689
0.678
0.651
0.649
0.641
0.635
N871
871
871
650
650
650
Notes:
�Signi�cantat:∗∗∗0.1%
level;∗∗1%
level;∗5%
level;† 10%
level.
�Standard
errors
inparantheses,computed
usingreplicate
weights
andmeanofplausiblevalues
totake
samplingstructure
into
account.
�Educationbase
category:
ISCED1/Noschooling.
�Reference
birthcohort:Born
before
1940.�Thedependentvariable:
Literacy
test
scores(range
0-500).
20

Table 6: Literacy and Linguistic Origin: Robustness checks
(1) (2) (3) (4)
Linguistic Distance -0.288∗∗ -0.279∗∗ -0.322∗∗ -0.263∗
(0.09) (0.08) (0.11) (0.10)Ling. Dist. × Age at entry 12 or older -0.438∗∗∗ -0.468∗∗∗ -0.395∗∗∗ -0.385∗∗∗
(0.06) (0.06) (0.08) (0.08)Ling. Dist. × years since migration 0.012∗∗∗ 0.012∗∗∗ 0.013∗∗∗ 0.012∗∗∗
(0.00) (0.00) (0.00) (0.00)Migrant stock 0.015∗∗ 0.014∗
(0.00) (0.01)Cultural distance -18.597∗ -36.300∗∗∗
(7.98) (9.21)Labor force participation 17.535∗∗∗ 19.138∗∗
(4.46) (5.41)Wage quintile 1.645 1.521
(1.56) (1.68)Destination-�xed e�ects yes yes yes yesOrigin-�xed e�ects yes yes yes yes
R2 0.606 0.606 0.605 0.620N 1521 1444 1238 1176
Notes: � Signi�cant at: ∗∗∗0.1% level; ∗∗1% level; ∗5% level; †10% level. � Standard er-rors in parantheses, computed using replicate weights and mean of plausible values to takesampling structure into account. � Further controls omitted: Own and parental education,gender, birth cohort, geographical distance. � The dependent variable: Prose literacy testscores (range 0-500).
21

Figure 2: Interaction Effects: Linguistic Distance, Age at Entry andYears since Migration
200
220
240
260
280
Lite
racy
sco
re
0 10 20 30 40 50 60 70 80 90 100Linguistic distance
(a) Prose literacy
220
230
240
250
260
270
Lite
racy
sco
re
0 10 20 30 40 50 60 70 80 90 100Linguistic distance
(b) Document literacy
230
240
250
260
270
Lite
racy
sco
re
0 10 20 30 40 50 60 70 80 90 100Linguistic distance
(c) Quantitative literacy
Age at arrival-effect
Young arrival (Age at entry <= 11) Late arrival (Age at entry > 11)
180
200
220
240
260
280
Lite
racy
sco
re
0 1 2 3 4 5 6 7 8 9 101112131415Years since migration
(d) Prose literacy
200
220
240
260
280
Lite
racy
sco
re
0 1 2 3 4 5 6 7 8 9 101112131415Years since migration
(e) Document literacy
200
220
240
260
280
Lite
racy
sco
re
0 1 2 3 4 5 6 7 8 9 101112131415Years since migration
(f) Quantitative literacy
Assimilation
LD = 0 LD = 50 LD = 100
22

References
Adsera, A. and Pytlikova, M. (2012). 1206 The role of language in shaping international
migration, Centre for Research and Analysis of Migration (CReAM), Department of
Economics, University College London.
Akresh, I. R. and Frank, R. (2011). At the intersection of self and other: English language
ability and immigrant labor market outcomes. Social Science Research 40: 1362�1370.
Bakker, D., Müller, A., Velupillai, V., Wichmann, S., Brown, C. H., Brown, P., Egorov,
D., Mailhammer, R., Grant, A. and Holman, E. W. (2009). Adding typology to lex-
icostatistics: A combined approach to language classi�cation. Linguistic Typology 13:
169�181.
Beenstock, M., Chiswick, B. R. and Repetto, G. L. (2001). The e�ect of linguistic distance
and country of origin on immigrant language skills: Application to israel. International
Migration 39: 33�60, doi:10.1111/1468-2435.00155.
Bleakley, H. and Chin, A. (2004). Language skills and earnings: Evidence from childhood
immigrants. The Review of Economics and Statistics 86: 481�496.
Brown, G. and Micklewright, J. (2004). Using international surveys of achievement and
literacy: A view from the outside. UNESCO Institute for Statistics.
Charette, M. and Meng, R. (1994). Explaining language pro�ciency : Objective versus
self-assessed measures of literacy. Economics Letters 44: 313�321.
Chiswick, B. R. (1978). The e�ect of Americanization on the earnings of foreign-born
men. Journal of Political Economy 86: 897�921.
Chiswick, B. R. and Miller, P. (2008). A test of the critical period hypothesis for language
learning. Journal of Mul Vol. 29, No. 1: pp. 16�29.
Chiswick, B. R. and Miller, P. W. (1995). The endogeneity between language and earnings:
International analyses. Journal of Labor Economics 13: 246�288.
Chiswick, B. R. and Miller, P. W. (1999). English language �uency among immigrants in
the united states. In Polachek, S. W. (ed.), Research in Labor Economics . Oxford: JAI
Press, 17 , 151�200.
Chiswick, B. R. and Miller, P. W. (2002). Immigrant earnings: Language skills, linguistic
concentrations and the business cycle. Journal of Population Economics 15: 31�57,
doi:10.1007/PL00003838.
23

Chiswick, B. R. and Miller, P. W. (2012). Negative and positive assimilation, skill trans-
ferability, and linguistic distance. Journal of Human Capital 6: 35 � 55.
Coulon, A. de and Wol�, F.-C. (2007). Language pro�ciency of immigrants and misclas-
si�cation. Applied Economics Letters 14: 857�861.
Crystal, D. (2010). The Cambridge Encyclopedia of Language. Cambridge University
Press, third edition ed.
Cutler, D. M., Glaeser, E. L. and Vigdor, J. L. (2008). When are ghettos bad? lessons from
immigrant segregation in the united states. Journal of Urban Economics 63: 759�774.
Dougherty, C. (2003). Numeracy, literacy and earnings: evidence from the national lon-
gitudinal survey of youth. Economics of Education Review 22: 511�521.
Dustmann, C. and Fabbri, F. (2003). Language pro�ciency and labour market perfor-
mance of immigrants in the uk. The Economic Journal 113: 695�717, doi:10.1111/
1468-0297.t01-1-00151.
Dustmann, C. and Soest, A. van (2001). Language �uency and earnings: Estimation with
misclassi�ed language indicators. Review of Economics and Statistics 83: 663�674.
Epstein, G. S. and Gang, I. N. (2010). Migration and culture. In Epstein, G. S. and Gang,
I. N. (eds), Frontiers of Economics and Globalization: Migration and Culture. Emerald
Group Publishing Limited, 8 .
Ferrer, A., Green, D. A. and Riddell, W. C. (2006). The e�ect of literacy on immigrant
earnings. Journal of Human Resources 41.
Finnie, R. and Meng, R. (2005). Literacy and labour market outcomes: self-assessment
versus test score measures. Applied Economics 37: 1935�1951.
Friedberg, R. M. (2000). You can't take it with you? immigrant assimilation and the
portability of human capital. Journal of Labor Economics 18: 221�51.
Gonzalez, A. (2000). The acquisition and labor market value of four english skills: new
evidence from nals. Contemporary Economic Policy 18: 259�269.
Hofstede, G., Hofstede, G. J. and Minkov, M. (2010). Cultures and Organizations: Soft-
ware of the Mind . McGraw Hill Professional.
Inglehart, R. and Welzel, C. (2005). Modernization, Cultural Change and Democracy .
New York: Cambridge University Press.
24

Inglehart, R. and Welzel, C. (2010). Changing mass priorities: The link between modern-
ization and democracy. Perspectives on Politics vol 8, No. 2: p. 554.
Isphording, I. E. and Otten, S. (2013). The costs of babylon - linguistic distance in applied
economics. Review of International Economics Vol. 21, Issue 2: pp. 354�369.
Isphording, I. E. and Sinning, M. (2012). 391 The Returns to Language Skills in the US
Labor Market.
Kahn, L. M. (2004). Immigration, skills and the labor market: International evidence.
Journal of Population Economics 17: 501�534.
Kokko, A. and Gustavsson Tingvall, P. (2012). 183 The Eurovision Song Contest, Prefer-
ences and European Trade, The Ratio Institute.
Llach, A. M. (2010). An overview of variables a�ecting lexical transfer in writing: A
review study. International Journal of Linguistics 2: E2.
Murray, K. J., T. Scott (1997). Adult literacy in OECD countries: Technical report on
the First International Adult Literacy Survey. National Center of Education Statistics.
Newport, E. L. (2002). Critical periods in language development. In Encyclopedia of Cog-
nitive Science.. Macmillan Publishers Ltd./Nature Publishing Group.
OECD (2000). Tech. Rep. Literacy in the Information Age. Final Report of the Interna-
tional Adult Literacy Survey.
Selten, R. and Pool, J. (1991). The distribution of foreign language skills as a game
equilibrium. In Selten, R. (ed.), Game Equilibrium Models, vol. 4, Social and Political
Interaction. Springer, 64�87.
Serva, M. (2011). Tech. Rep. Phylogeny and geometry of languages from normalized
Levenshtein distance, Cornell University Library, Ithaca, NY.
Slik, F. W. P. Van der (2010). Acquisition of dutch as a second language. Studies in
Second Language Acquisition 32: 401�432.
Spolaore, E. and Wacziarg, R. (2009). The di�usion of development. The Quarterly Jour-
nal of Economics 124: 469�529.
Swadesh, M. (1952). Lexico-statistic dating of prehistoric ethnic contacts: With special
reference to north american indians and eskimos. Proceedings of the American Philo-
sophical Society 96: 452�463.
25

United Nations, Department of Economic and Social A�airs (2012). Tech. Rep. Trends
in International Migrant Stock: Migrants by Destination and Origin (United Nations
database, POP/DB/MIG/Stock/Rev.2012).
Vignoles, A., Coulon, A. D. and Marcenaro-Gutierrez, O. (2011). The value of basic skills
in the british labour market. Oxford Economic Papers 63: 27�48.
Wichmann, S., Holman, E. W., Bakker, D. and Brown, C. H. (2010). Evaluating linguistic
distance measures. Physica A: Statistical Mechanics and its Applications 389: 3632�
3639.
26

9 Appendix
Table 7: Literacy and Linguistic Origin, Excluding Native Speakers
Prose Document Quantitative
Linguistic Distance -0.837∗∗ -0.980∗ -1.193∗∗
(0.23) (0.37) (0.38)Ling. Dist. × Age at entry 12 or older -0.391∗ -0.514∗∗ -0.385∗
(0.15) (0.14) (0.14)Ling. Dist. × years since migration 0.029∗∗∗ 0.021∗∗ 0.018∗∗
(0.01) (0.01) (0.01)Age at entry 12 or older 22.201 14.672 9.871
(13.79) (11.30) (10.96)Years since migration -0.885 -0.555 -0.261
(0.53) (0.58) (0.56)Female -0.951 -12.758∗ -22.006∗∗∗
(4.05) (4.94) (4.87)Born 1940-49 40.718∗∗∗ 29.889∗∗ 24.075∗∗
(6.53) (7.98) (7.41)Born 1950-59 61.420∗∗∗ 56.657∗∗∗ 51.278∗∗∗
(6.78) (9.95) (9.34)Born 1960-69 55.527∗∗∗ 50.707∗∗∗ 44.676∗∗∗
(6.49) (11.82) (10.85)Born 1970-84 87.568∗∗∗ 84.299∗∗∗ 64.132∗∗∗
(8.83) (14.04) (13.25)ISCED 2 38.887∗∗∗ 8.681 2.198
(6.33) (7.52) (7.19)ISCED 3 64.617∗∗∗ 46.049∗∗∗ 43.908∗∗∗
(6.17) (6.24) (5.89)ISCED 5 94.265∗∗∗ 59.532∗∗∗ 58.103∗∗∗
(7.22) (9.30) (9.66)ISCED 6/7 122.861∗∗∗ 82.735∗∗∗ 82.784∗∗∗
(8.57) (7.41) (6.58)Parents: ISCED 1 16.625∗∗ 17.561∗∗ 20.486∗∗∗
(5.51) (5.89) (5.36)Parents: ISCED 2 15.884† 2.799 3.683
(7.96) (9.25) (8.82)Parents: ISCED 3 30.977∗∗ 19.845∗ 24.022∗
(8.57) (9.30) (9.02)Parents: ISCED 5 -3.945 2.454 7.839
(10.49) (8.39) (8.28)Parents: ISCED 6/7 -3.444 -16.309∗ -13.540†
(7.31) (7.81) (7.59)Distance between capitals 0.004∗∗∗ -0.011 -0.014
(0.00) (0.01) (0.01)Destination-�xed e�ects yes yes yesOrigin-�xed e�ects yes yes yes
R2 0.432 0.646 0.633N 830 830 830
Notes: � Signi�cant at: ∗∗∗0.1% level; ∗∗1% level; ∗5% level; †10% level. � Standard errors in paran-theses, computed using replicate weights and mean of plausible values to take sampling structure intoaccount. � Education base category: ISCED1/No schooling. � Reference birth cohort: Born before1940. � The dependent variable: Literacy test scores (range 0-500). � Native-speakers with LD = 0are excluded from the estimations.
27
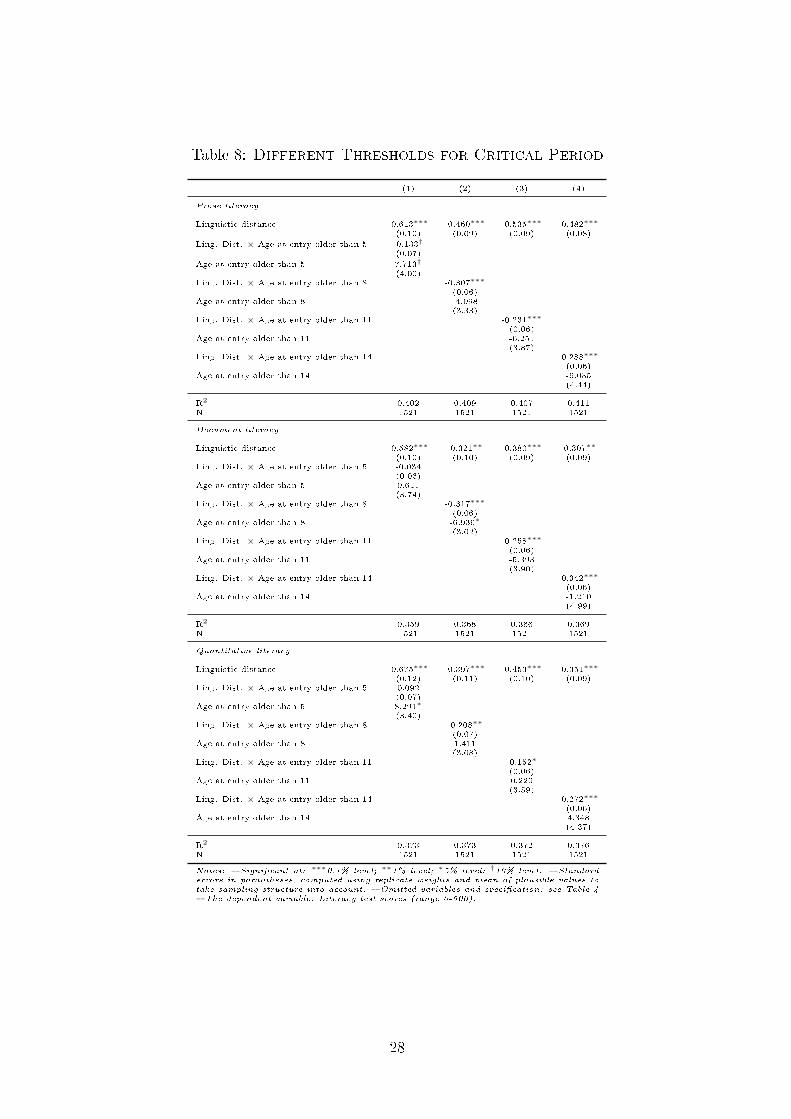
Table 8: Different Thresholds for Critical Period
(1) (2) (3) (4)
Prose literacy
Linguistic distance -0.613∗∗∗ -0.460∗∗∗ -0.535∗∗∗ -0.482∗∗∗
(0.10) (0.09) (0.09) (0.08)
Ling. Dist. × Age at entry older than 5 -0.133†
(0.07)
Age at entry older than 5 7.713†
(4.00)Ling. Dist. × Age at entry older than 8 -0.307∗∗∗
(0.06)Age at entry older than 8 -4.098
(3.33)Ling. Dist. × Age at entry older than 11 -0.231∗∗∗
(0.06)Age at entry older than 11 -6.251
(3.87)Ling. Dist. × Age at entry older than 14 -0.288∗∗∗
(0.06)Age at entry older than 14 -6.035
(4.44)
R2 0.402 0.409 0.407 0.411N 1521 1521 1521 1521
Document literacy
Linguistic distance -0.582∗∗∗ -0.321∗∗ -0.380∗∗∗ -0.307∗∗
(0.10) (0.10) (0.09) (0.09)Ling. Dist. × Age at entry older than 5 -0.034
(0.06)Age at entry older than 5 0.611
(3.74)Ling. Dist. × Age at entry older than 8 -0.317∗∗∗
(0.06)Age at entry older than 8 -6.936∗
(3.02)Ling. Dist. × Age at entry older than 11 -0.258∗∗∗
(0.06)Age at entry older than 11 -5.393
(3.90)Ling. Dist. × Age at entry older than 14 -0.342∗∗∗
(0.06)Age at entry older than 14 -1.210
(4.99)
R2 0.359 0.368 0.366 0.369N 1521 1521 1521 1521
Quantitative literacy
Linguistic distance -0.675∗∗∗ -0.397∗∗∗ -0.453∗∗∗ -0.351∗∗∗
(0.12) (0.11) (0.10) (0.09)Ling. Dist. × Age at entry older than 5 0.092
(0.07)Age at entry older than 5 8.291∗
(3.40)Ling. Dist. × Age at entry older than 8 -0.208∗∗
(0.07)Age at entry older than 8 1.411
(3.08)Ling. Dist. × Age at entry older than 11 -0.152∗
(0.06)Age at entry older than 11 0.220
(3.59)Ling. Dist. × Age at entry older than 14 -0.272∗∗∗
(0.06)Age at entry older than 14 4.348
(4.37)
R2 0.373 0.373 0.372 0.376N 1521 1521 1521 1521
Notes: � Signi�cant at: ∗∗∗0.1% level; ∗∗1% level; ∗5% level; †10% level. � Standarderrors in parantheses, computed using replicate weights and mean of plausible values totake sampling structure into account. � Omitted variables and speci�cation: see Table 4� The dependent variable: Literacy test scores (range 0-500).
28

Table 9: Matrix of Linguistic Distance
Test language Czech Dutch French German English Finnish Italian Swedish Hungarian Slovenian
Albanian 93.23 95.86 94.03 95.78 95.64 98.77 93.75 98.36 98.54 93.17Arabic 99.48 100 97.20 98.96 97.95 98.15 96.56 98.02 98.68 98.97Byelorussian 51.32 92.94 93.05 90.27 90.28 99.13 92.54 91.47 93.68 53.04Catalano 89.90 89.53 71.60 89.45 86.51 100.94 64.03 93.13 100.33 89.95Chinese 101.12 99.68 98.74 99.43 98.67 101.52 99.02 99.51 102.53 99.95Croatian 43.74 90.99 89.18 91.98 87.79 97.89 89.29 89.41 94.55 28.79Czech 0.00 92.96 90.49 92.04 90.98 97.76 89.52 91.65 94.58 35.40Danish 94.24 66.92 93.11 66.96 69.63 100.67 90.06 50.73 98.55 91.68Dutch 92.96 0.00 91.06 51.50 63.22 99.00 87.28 64.95 99.16 90.92English 90.98 63.22 91.02 72.21 0.00 102.27 89.23 64.40 95.22 90.46Estonian 98.51 97.77 98.57 95.51 98.77 45.59 97.80 96.95 86.19 97.11Finnish 97.76 99.00 98.08 96.31 102.27 0.00 100.46 98.11 84.53 97.35French 90.49 91.06 0.00 95.87 91.02 98.08 73.89 93.95 100.65 90.92Friulano 92.73 91.04 74.54 95.80 89.96 100.72 64.95 91.28 99.43 92.69German 92.04 51.50 95.87 0.00 72.21 96.31 87.89 66.56 98.43 88.66Greek 96.42 96.02 95.08 97.25 97.15 100.2 92.01 96.65 97.60 97.21Hebrew 99.55 98.29 93.26 100.39 97.49 99.16 98.57 95.79 96.76 100.26Hungarian 94.58 99.16 100.65 98.43 95.22 84.53 101.03 97.92 0.00 93.94Indonesian 98.88 101.09 99.91 101.75 99.28 99.41 95.49 100.96 97.98 98.46Irish 94.08 99.39 100.22 95.20 96.02 96.20 96.93 97.50 100.31 92.09Italian 89.52 87.28 73.89 87.89 89.23 100.46 0.00 91.12 101.03 87.76Japanese 101.76 101.92 101.94 100.14 99.39 96.98 99.80 100.34 98.18 102.19Korean 99.85 99.04 102.74 104.3 99.12 100.18 98.51 99.44 100.92 96.96Macedonian 50.58 91.08 89.68 89.08 91.21 96.26 87.90 92.85 97.04 35.45Malay 98.88 101.09 99.91 101.75 99.28 99.41 95.49 100.96 97.98 98.46Moroccan 99.48 100 97.20 98.96 97.95 98.15 96.56 98.02 98.68 98.97Norwegian 90.57 63.29 94.38 64.92 64.12 101.21 91.67 45.52 99.17 88.90Persian 94.93 92.19 91.11 93.89 94.31 97.36 90.31 98.93 99.38 93.92Polish 44.93 94.55 92.89 96.09 93.80 95.28 91.11 95.28 95.59 46.51Portuguese 95.49 94.86 74.36 93.59 95.18 99.44 62.50 95.47 99.04 93.82Punjabi 93.26 92.09 95.56 91.81 97.38 96.34 86.19 93.90 94.43 93.64Romanian 90.37 87.21 74.39 87.66 85.55 99.53 52.03 92.85 99.25 88.61Romansch 87.89 90.16 77.73 92.15 89.04 99.23 72.12 91.70 100.48 86.31Romany (gypsy) 96.49 97.19 92.37 93.05 98.98 98.08 90.51 96.88 97.81 93.33Russian 60.40 95.19 92.83 94.41 94.02 96.49 95.24 96.67 96.96 56.65Serbian 43.74 90.99 89.18 91.98 87.79 97.89 89.29 89.41 94.55 28.79Serbo-croatian 43.95 91.26 89.89 91.49 88.40 96.63 89.40 87.91 96.84 33.94Slovak 32.59 92.17 90.81 93.05 91.99 98.76 91.53 90.71 95.80 44.26Somalian 99.00 98.97 100.07 100.15 103.03 97.17 98.90 99.58 100.83 100.14Spanish 90.55 91.82 81.07 94.69 93.08 99.18 56.51 93.31 102.12 90.90Swedish 91.65 64.95 93.95 66.56 64.40 98.11 91.12 0.00 97.92 90.22Swiss-german 89.68 68.27 93.23 48.34 73.51 94.65 90.78 71.17 98.00 87.48Tamil 97.37 96.93 96.82 100.2 100.81 99.57 99.97 101.62 101.93 98.18Turkish 98.81 102.33 98.12 99.91 101.04 96.70 98.22 101.35 94.55 98.89Ukrainian 60.23 95.06 95.41 94.00 97.35 99.12 94.70 92.87 95.77 54.34Vietnamese 99.72 100.81 101.81 96.14 104.06 97.80 100.39 99.17 98.86 101.25
Notes: � Source: Own calculations using programs for calculating ASJP distance matrices (Version 2.1), see http: // email.
eva. mpg. de/ ~wichmann/ software. htm .
29


