Page 1
8/9/2019 disaster management chennai
http://slidepdf.com/reader/full/disaster-management-chennai 1/77
1
CHAPTER 1
INTRODUCTION
1.1 DISASTER
United Nations defined disasters as ‘a serious disruption of the functioning of a
community or a society causing widespread human, material, economic and environmental
losses which exceeds the ability of the affected community /society to cope using its own
resources.
WHO defines Disaster as "any occurrence that causes damag1e, ecological
disruption, loss of human life, deterioration of health and health services, on a scale
sufficient to warrant an extraordinary response from outside the affected community or
area.”
Disaster literally means ‘Catastrophe’, ‘Calamity’, or ‘Aapada’. The Second
Wednesday of every October during the Decade observed as “World Disaster Reduction
Day”. National Day for Disaster Reduction was observed on 11 October. Theme for the
year 2000 was “Community Participation and Public Awareness”. The United Nations
observed the Nineties as the “International Decade for Natural Disaster Reduction”
(IDNDR), in order to focus on International Initiatives for minimizing the adverse impact
of natural calamities particularly in the developed countries like India. The period of 1970
alone accounted for death of over 1 million persons and destruction of property over 46
billion dollars by Cyclones, Hurricanes, Tornados, Earthquakes, Floods and other disasters
(UNDRO, 1979). In Past Century, more than 10 million people have died due to Floods,
Earthquakes and Tropical Storms (United Nation, 1983).
Man Made Disasters as a result of Toxic Chemicals; Explosions, Fire Incidents;
High Rising Building’s Collapse; And Hazardous Waste etc. have been the cause of many
deaths and casualties. The increase in Chemical Processes and Manufacturing Industryinevitably carries the risk of accidents. Enrico Fermi and his associates in the year 1944 at
the University of Chicago developed the First Atomic Reactor and when proved that chain
reaction was in fact a reality the world introduced to new and terrifying dimensions, in the
cause and scope of disasters. The Nuclear Bomb dropped in Hiroshima and Nagasaki
in1945, since then the threat of Nuclear War is ever increasing (Mass Casualties
Management, 1983). Increasing Nuclear Power Plants the world over inevitably carries the
risk of accidents like manifested in the Three Mile Island and Chernobyl.
Page 2
8/9/2019 disaster management chennai
http://slidepdf.com/reader/full/disaster-management-chennai 2/77
2
The earth has been an unstable proposition throughout its existence. Man who
entered the scene has been exploring during his short existence to unravel the various
mysteries that are mysteries till date. These mysteries understood by and confined to the
intellectual community. However, when the victims of the mysteries are the people then
they need to know the mysteries and the impact the mysteries can have on them. As the
proverb says, “Knowing your strengths and your foes’ strengths is half the battle won”.
Thus, the need of the hour is awareness about the disasters and the ways of managing
them.
1.2 DISASTER MANAGEMENT
Disaster Management can be defined as the organization and management of
resources and responsibilities for dealing with all humanitarian aspects of emergencies, in
particular preparedness, response and recovery in order to lessen the impact of
disasters.The field of Disaster Management deals with all four stages of a disaster:
mitigation, preparedness, response, and recovery.
1.2.1 Mitigation:
Mitigation is the actions considered long before an emergency occurs and includes
any activity aimed at reducing the probability of damage from a disaster. Mitigation
strengthens the structure of you home to protect it from hurricanes, floods, and other
natural disasters. Mitigation helps business and industry avoid damages to their facilities
and remain operational in the face of catastrophe.
1.2.2 Preparedness:
Preparedness is the action intended to save lives before and during a natural
disaster. It ensures people are ready for a disaster and respond to it effectively.
Preparedness requires figuring out what you will do if essential services break down,
developing a disaster plan, and practicing the plan. Preparedness activities includeforecasting and warning systems, stocking an emergency preparedness kit with supplies,
and knowing where your nearest emergency shelter is.
1.2.3 Response:
Response occurs after the onset of a disaster. Response intended to provide
emergency assistance for casualties, including search and rescue, shelters, and medical
care, to reduce the probability or extent of secondary damage through such measures as
anti-looting security patrols, and to reduce damage by efforts such as sandbagging against
floodwaters.
Page 3
8/9/2019 disaster management chennai
http://slidepdf.com/reader/full/disaster-management-chennai 3/77
3
1.2.4 Recovery:
Recovery is the activities continue immediately following a disaster. The purpose
of recovery activities is to return all systems and services back to normal. Local
communities and State governments can do what they can to bring about recovery. When
those resources are gone, Federal loans and grants can help. Funds are used to rebuild
homes, businesses, and public facilities, to clear debris and repair roads and bridges, and to
restore water, sewer, and other essential services.
It is important for all of us to know the steps each of us can take before a disaster strikes to
reduce the loss of lives and property.
Figure 1.2 stages of disaster management
Source: www.raddningsverket.se/templates/SRSA(swedish recue service agency)
1.2.5 Paradigm:In recent years, organizations involved in Disaster Management have shifted their
efforts and resources from a post-disaster approach (response + recovery) to pre-disaster
and pro-active efforts (mitigation + preparedness). The shift is the result of the realization
that by minimizing the impact of natural and man-made hazards onto communities,
damages and loss will be lessened, thus reducing the recovery time and cost.
Page 4
8/9/2019 disaster management chennai
http://slidepdf.com/reader/full/disaster-management-chennai 4/77
4
1.3 FIRE RELATED MAN-MADE DISASTERS
The following are the major fire related man-made disasters considered in this study
• Fire at home
• Fire at workplace/ multi-storeyed building
• Bomb blast & Explosion
• Industrial explosion
• Accidents of vehicle carrying hazardous material
1.4 Why fire related disasters?
The reasons for considering fire as a major concern are the following:
1.4.1 Fire is FAST! There is little time!
In less than 30 seconds, a small flame can get completely out of control and turn
into a major fire. It only takes minutes for thick black smoke to fill a house. In minutes, a
house can be engulfed in flames. Most fires occur in the home when people are asleep. If
you wake up to a fire, you will not have time to grab valuables because fire spreads too
quickly and the smoke is too thick. There is only time to escape.
1.4.2 Fire is HOT! Heat is more threatening than flames.
A fire's heat alone can kill. Room temperatures in a fire can be 100 degrees at floor
level and rise to 600 degrees at eye level. Inhaling this super hot air will scorch your lungs.
This heat can melt clothes to your skin. In five minutes, a room can get so hot that
everything in it ignites at once and this is called flashover.
1.4.3 Fire is DARK! Fire is not bright, its pitch black.
Fire starts bright, but quickly produces black smoke and complete darkness. If you
wake up to a fire you may be blinded, disoriented and unable to find your way around the
home you've lived in for years.
1.4.4 Fire is DEADLY!
Smoke and toxic gases kill more people than flames do. Fire uses up the oxygen
you need and produces smoke and poisonous gases that kill. Breathing even small amounts
of smoke and toxic gases can make you drowsy, disoriented and short of breath. The
odorless, colorless fumes can lull you into a deep sleep before the flames reach your door.
You may not wake up in time to escape.
Source: http://www.usfa.dhs.gov/downloads/pdf/fswy6.pdf
Page 5
8/9/2019 disaster management chennai
http://slidepdf.com/reader/full/disaster-management-chennai 5/77
5
Table 1.5 Statistics of fire related accidents in Chennai 2008
Total fire accidents
Small fire accidents
Medium fire accidents
Serious fire accidents
17,433
16,444
544
445
Total rescue calls (non-fire) 10,747
Property lost Rs. 53.17 Crores (approximately)
Property saved Rs. 446.56 Crores (approximately)
No. of lives lost in fire calls 69 No. of lives saved 139
No. of lives lost in Rescue calls 2,110
No. of lives saved 16,088
Source: www.tnfrs.tn.nic.in (Tamil Nadu Fire and rescue service)
1.6 ORGANISATION PROFILE
Center for Study of Science, Technology and Policy (CSTEP) is a private, not
Page 6
8/9/2019 disaster management chennai
http://slidepdf.com/reader/full/disaster-management-chennai 6/77
6
for profit research corporation registered under Section 25 of the Companies Act 1956,
founded in 2005. CSTEP's mandate and vision is to undertake world-class research and
analysis in chosen areas of engineering, science and technology and their intersection with
policy and decision-making. Expertise includes materials science, information and
communications technologies, energy and strategic domains, as well as in the use of data
and computational modeling. CSTEP is Bangalore based organization and its founders
include some of India's foremost scientists and scholars. CSTEP performs leading-edge
research in issues of science and technology in human development, economic growth and
security.
Technology is a vital ingredient for economic and human development. However,
technology alone is not the solution; its success and relevance to society depend on the
economic and policy environments. Harnessing technology well requires an integrated
assessment of science and technology along with issues of economics, policy and
regulation. Such interdisciplinary research is the signature of CSTEP.
All policy requires detailed and objective analysis but technology policy analysis
requires both domain expertise in conventional disciplines such as science, engineering,
mathematics, statistics, economics and social sciences as well as inter-disciplinary skills,
which can include simulation and modeling. Some of the quantitative tools available to
help guide policy and decision-makers are optimization, operations research, dynamic
programming, machine learning, stochastic analysis, cost-benefit analysis, probabilistic
risk analysis and game theory. CSTEP researchers employ and develop such scientific
tools and models applied to policy research and analysis.
Initial funding for CSTEP has generously come from the SSN Education and
Charitable Trust, with energy-related work continuing to be funded from this source. In
September 2008, CSTEP received a grant from the Sir Dorabji Tata Trust, providing
funding for our next generation infrastructure laboratory.
1.6.1 Research
Page 7
8/9/2019 disaster management chennai
http://slidepdf.com/reader/full/disaster-management-chennai 7/77
7
CSTEP focuses its research on several options such as bio-fuels, solar energy,
nuclear power, coal gasification and liquefaction. Research involves technology modeling,
economic analysis and life cycle assessment. CSTEP researchers also focus on assessment
of natural gas supply and pricing options. The Indian power sector requires significant
upgrading and reforms, in particular power transmission and distribution. This is crucial to
reduce the losses and improve efficiency. CSTEP has outstanding reports in the political
economy of power sector reforms. CSTEP professionals are also leading the charge
towards innovative IT based solutions for a state of the art “smart-grid”.
1.6.2 Projects
The following are the projects undertaken in
(i) Solar thermal modeling
(ii) Karnataka Esscom evaluation
(iii) Bescom new equipment evaluation
(iv) IT in power sector
(v) Nuclear report
(vi) UCG conference
(vii) Slum evolution in Bangalore
(viii) Disaster management
(ix) Innovative India
(x) Institutional aspects of infrastructure
(xi) Serving the poor to serve rich in health care
(xii) Simulation and game development: energy, agricultural supply chain,
industrial clusters
(xiii) Regional/ rural air link
1.7 LITERATURE REVIEW1.7.1 Awareness
Page 8
8/9/2019 disaster management chennai
http://slidepdf.com/reader/full/disaster-management-chennai 8/77
8
"Knowledge and preparation" are the keys to survival in the event of a catastrophe,
from an annoying power outage to TEOTWAWKI (The End Of The World As We Know
It). Do you want to be prepared? Or do you want to be surprised? Make disaster
preparations at home. Survivalism is a state of mind. (Times of India article no.1318386)
For any management method to be successful, it requires mass participation, which not
only gives strength but also makes the task very simple. Therefore, for effective
management of disasters in India, which is one among the most populous countries in the
world, it is very important that we bring about mass participation. But, how do we bring
about mass participation in a country like India? The solution would be to make people
aware about disasters and educate them to know is their responsibility during such a
disaster.
To prepare communities take care of themselves in the aftermath of a major disaster
when first responders who provide emergency services are not available to provide
immediate assistance is an important aspect of disaster management.(Wei,2001)
1.7.1.1 Article of department of civil engineering Anna University “GIS approach for
disaster management through awareness” - an overview
This article is about the importance of awareness among the people about disaster
management and the GIS approach for effective disaster management.
Awareness facilitates
• Co-operation between the government, the intellectual community, and public
• Individual preparedness before, during or after a disaster
• The tendency to help the victims of the disaster
• Compliance with the laws and legislations for disaster control
1.7.1.2 Integrated community-based disaster management program in Taiwan: A
case study of Shang-A Village
Taiwan has long made efforts to increase community emergency response
capability, due to its vulnerability to earthquakes, typhoons, landslides and debris flows.
Not until recent major natural disasters, such as the 1999 Chi-Chi Earthquake, Typhoon
Toraji and Typhoon Nari, has the government reformed its policy toward empowering the
community to take actions in hazard mitigation, emergency preparedness and emergency
response. A new initiative, Integrated Community-Based Disaster Management Program
(ICBDM), was launched in 2001 by the Executive Yuan to achieve the goal of
strengthening community resistance. The paper, taking Shang-An Village as an example,
Page 9
8/9/2019 disaster management chennai
http://slidepdf.com/reader/full/disaster-management-chennai 9/77
9
describes Taiwan's new community-based disaster management program. Through a
participatory process, community residents have learned how to analyze vulnerable
conditions, discover problems, develop solutions and establish an organization to
implement disaster management tasks. Further, basic response training courses and a
disaster scenario were held in order to improve their emergency response capability. Based
on the case study, a phased process, including initiation, assessment, planning and practice,
is generalized.
1.7.1.3 Research paper on “Awareness of storm surge risk in coastal community on
the north sea” by Sonja D. Hofmann, Gunilla Kaiser Karlsruhe University 2007.
The risk awareness and preparedness are seemed to be important parameter in
integrated risk management scheme today. Regarding the risk of storm-surges, an
assessment of perception and the status of personal preparedness of the people are
addressed in the interview study in a coastal community in North Sea. The major points of
discussion are the relation between risk awareness preparedness and self-responsibility in
disaster preparedness scheme and role of media. The conclusion include that the trust in
coastal defense authorities is very high which might influence by the local media
presentation of dike safety.
1.7.2 Preparedness
Disasters disrupt hundreds of thousands of lives every year. Each disaster has
lasting effects, both to people and property. Being prepared can reduce fear, anxiety and
losses that accompany disasters. Communities, families, and individuals should know what
to do in the event of a fire and where to seek shelter. People can also reduce the impact of
disasters and sometimes the danger completely. Every citizen in this country is part of a
national emergency management system that is all about protection- protecting people and
property from all types of hazard. Most of the emergencies handled at local level puttremendous responsibility on people to handle the disaster situation effectively.
Public readiness index(PRI) a first of its kind tool for individuals, families and
communities to determine and evaluate their readiness for emergencies ranging from
natural disasters to terrorist attack(the council for excellence US). The public readiness
measured in knowledge elements and behavior elements gives the preparedness of an
individual to a disaster.
1.7.2.1 Article from American Red Cross National Fire Prevention Association (1997)
Page 10
8/9/2019 disaster management chennai
http://slidepdf.com/reader/full/disaster-management-chennai 10/77
10
This article gives details about how an individual can be prepared to handle a fire
related disaster. It also provides details about personalised fire related disaster plan.
1.7.2.2 Article from Times of India no.1318386
This article gives details about the "Disaster Supplies Kit." developed by the
Federal Emergency Management Agency and the American Red Cross. This supplies kit
give details about the list of items to be stored at home to handle the disaster situation
effectively.
1.7.2.3 UNDP article on disaster management methodology for Assam
The investment on preparedness, prevention, and mitigation is more cost effective
compared to expenditure on relief and rehabilitation. The basic characteristic of disaster
management is proactive prevention, preparedness and mitigation rather than the prevalent
reactive relief and rehabilitation approach. The article gives details about the preparedness
plan of the community in grass root level.
1.7.3 Risk perception
The perception of risk, the experience and the knowledge of the people are the
basis for the behavior in disaster situations (Kaiser et al., 2004). For the development of
better strategies in disaster management, it is thus important to be aware of these factors.
Human behavior depends on perception, experience, and knowledge. In order to be able to
develop effective information and communication strategies and policies on disasters, the
perception and evaluation of these risks and influencing factors to be
known(RENIN,1989,PLAPP,2001).
Ammon (2001) revealed that developing risk management plan consist of three
steps 1) identifying risk 2) classifying the risk 3) selecting methods of treatment for risk.
He pointed out that the most important step is risk identification. When the risk managers
identify risk, they should understand the perception of risk in general public constitutes the proper identification of risk. For the development of effective risk communication policies,
the risk perception of the targeted group as well as the factors influencing risk perception
should be known. (PLAPP, 2001, p.2)
Risk is defined as the likelihood that an individual will experience the effect of
danger (short Jr 1984).According to Raynor and Cantor, risk is being consisting of the
probability of an adverse event and the magnitude of its consequences. Rosa (2003:56)
define risk as “a situation or an event where something of human value (sometimes the
human themselves) is at stake and where the outcome is uncertain.
Page 11
8/9/2019 disaster management chennai
http://slidepdf.com/reader/full/disaster-management-chennai 11/77
11
Risk perception is the subjective assessment of a specified type of accident
happening and how concerned we are with the consequences. Person who have previous
experience with the hazard have greater perceived probability of occurrence. (Dongo Rémi
KOUABENAN1, Marc GANDIT1 & Sandrine CAROLY)
1.7.3.1 Factors predicting risk perception:
KNOWLEDGE
SOCIAL TRUST RISK PERCEPTION DEMOGRAPHIC
FACTORS
EXPERIENCE
Source: Lao & Tao
In this study, trust, experience and demographic factors were considered. Social trust is the
willingness to rely on those who have the responsibility for making decision and taking
actions related to the management of technology, the environment, medicine or other
realms of public health and safety. (Siegrist et al, 2000, p.354).Social trust has been found
to influence risk perception. Higher trust predicts lower risk perception. (Siegrist et al,
2000, p.354).
Richardson, Sorensen and Soderstrom (1987) indicated that experience is a factor
that determines how sensitive people are to risk. People with great experience of constant
and extreme risk are less concerned. Person who have previous experience with the hazard
have greater perceived probability of occurrence. (Dongo Rémi KOUABENAN
1
, MarcGANDIT1 & Sandrine Caroly).
The demographic factors considered in this study were age, gender, education, and
income/year.
CHAPTER 2
RESEARCH METHODOLOGY
Page 12
8/9/2019 disaster management chennai
http://slidepdf.com/reader/full/disaster-management-chennai 12/77
12
2.1 Need for the study
Recently various types of disasters are striking India in general and Chennai in
particular. These include natural and man-made disasters. There are different types of man-
made disasters, which can be managed using disaster management planning. Chennai
being densely populated city and highly industrialized, it is more prone to fire related
disasters. Risk awareness, personal preparedness and risk perception seemed to be
important parameters in disaster management and it is perceived to be low in Chennai.
2.2 Scope of the study
The scope of the study is confined to fire related man-made disasters and specific
segments of the population of Chennai. The study focuses on fire related disasters confined
to bomb blast & explosion, industrial explosion, fire at home, fire at work place/multi
storied building and accidents of vehicles carrying hazardous material. The specific
segments of Chennai population used in this study are students, homemakers, people
working in multistoried building, people working in ordinary building and
shopkeepers/businessman.
2.3 Objectives
• To determine the awareness among the people of Chennai on fire related disaster
management.
• To determine the preparedness of the people of Chennai on fire related disaster
management.
• To identify the risk perception of people of Chennai on fire related disasters.
• To analyze the factors influencing risk perception of the people of Chennai on fire
related disasters.
2.4 Hypothesis
• There is no association between risk perception of people of Chennai on accidents
of vehicle carrying hazardous material and the trust of people on civil authorities of
Chennai.
• There is no association between risk perception of people of Chennai on industrial
explosion and the trust of people on civil authorities of Chennai.
• There is no association between risk perception of people of Chennai on fire at
home and the trust of people on civil authorities of Chennai.
Page 13
8/9/2019 disaster management chennai
http://slidepdf.com/reader/full/disaster-management-chennai 13/77
13
• There is no association between risk perception of people of Chennai on fire at
multi-storied building and the trust of people on civil authorities of Chennai.
• There is no association between risk perception of people of Chennai on bomb blast
& explosion and the trust of people on civil authorities of Chennai.
• There is no association between risk perception of people of Chennai on accidents
of vehicle carrying hazardous material and the experience of people to fire related
disasters.
• There is no association between risk perception of people of Chennai on industrial
explosion and the experience of people to fire related disasters.
• There is no association between risk perception of people of Chennai on fire at
home and the experience of people to fire related disasters.
• There is no association between risk perception of people of Chennai on fire at
multi-storied building and the experience of people to fire related disasters.
• There is no association between risk perception of people of Chennai on bomb blast
& explosion and the experience of people to fire related disasters.
• There is no association between risk perception of people of Chennai on accidents
of vehicle carrying hazardous material and the gender of people to fire related
disasters.
• There is no association between risk perception of people of Chennai on industrial
explosion and the gender of people to fire related disasters.
• There is no association between risk perception of people of Chennai on fire at
home and the gender of people to fire related disasters.
• There is no association between risk perception of people of Chennai on fire at
multi-storied building and the gender of people to fire related disasters.
• There is no association between risk perception of people of Chennai on bomb blast
& explosion and the gender of people to fire related disasters.
• There is no association between risk perception of people of Chennai on accidents
of vehicle carrying hazardous material and the age of people to fire related
disasters.
• There is no association between risk perception of people of Chennai on industrial
explosion and the age of people to fire related disasters.
Page 14
8/9/2019 disaster management chennai
http://slidepdf.com/reader/full/disaster-management-chennai 14/77
14
• There is no association between risk perception of people of Chennai on fire at
home and the age of people to fire related disasters.
• There is no association between risk perception of people of Chennai on fire at
multi-storied building and the age of people to fire related disasters.
• There is no association between risk perception of people of Chennai on bomb blast
& explosion and the age of people to fire related disasters
• There is no association between risk perception of people of Chennai on accidents
of vehicle carrying hazardous material and the education of people to fire related
disasters.
• There is no association between risk perception of people of Chennai on industrial
explosion and the education of people to fire related disasters.
• There is no association between risk perception of people of Chennai on fire at
home and the education of people to fire related disasters.
• There is no association between risk perception of people of Chennai on fire at
multi-storied building and the education of people to fire related disasters.
• There is no association between risk perception of people of Chennai on bomb blast
& explosion and the education of people to fire related disasters
• There is no association between risk perception of people of Chennai on accidents
of vehicle carrying hazardous material and the income of people to fire related
disasters.
• There is no association between risk perception of people of Chennai on industrial
explosion and the income of people to fire related disasters.
• There is no association between risk perception of people of Chennai on fire at
home and the income of people to fire related disasters.
• There is no association between risk perception of people of Chennai on fire at
multi-storied building and the income of people to fire related disasters.
• There is no association between risk perception of people of Chennai on bomb blast
& explosion and the income of people to fire related disasters.
Page 15
8/9/2019 disaster management chennai
http://slidepdf.com/reader/full/disaster-management-chennai 15/77
15
2.5 Limitations of the study
The study does not test the awareness of people on industrial explosion.
Only two dimensions of the risk perception of Burn’s risk perception scale is
included in this study.
The study is confined to few segments of the population and the sample is not the
representative of Chennai population due to time constraint.
The study assumes that the people who knew the preventive measures also knew
the causes of the fire related disasters.
The awareness and preparedness of the people are confined to the dimensions
mentioned in this study.
The overall awareness of the people about fire related disasters does not include the
awareness of the people about first aid and smoke detector.
2.6 Research design
The research design used in this study was exploratory research
Exploratory research is the most commonly used unstructured, “informal” research
that is undertaken to gain background information about the general nature of the research
problem. Exploratory research is conducted when the researcher does not know much
about the problem and needs additional information or desires new or more recent
information.
2.7 Sampling design
2.7.1 Population:
The population of Chennai was 6.4 million (including the suburbs of Chennai) and
the study is confined to five segments of the population that includes students,
homemakers, people working in multistoried building, people working in ordinary
building, shopkeepers and college students
2.7.2 Sample:
The sample for this study was the five segments of the population. The segments
included in this study are homemakers, people working in ordinary building, people
working in multistoried building and college students.
2.7.3 Sample Size: The sample size was 280 in which 56 respondents were drawn from
each segment.
Page 16
8/9/2019 disaster management chennai
http://slidepdf.com/reader/full/disaster-management-chennai 16/77
16
2.7.4 Sampling Technique:
The sampling technique used for the study was convenience sampling. It is a type
of non-probability random sampling in which the sample is chosen in such a way that the
individuals are easy to reach. Convenience sampling does not represent the entire
population.
2.7.5 Source of data
The sources of data used in this study were both primary and secondary in nature.
The secondary sources of data were
• Published reports of disaster management
• Various articles on peoples risk perception, awareness, and preparedness of disaster
management.
• Manuals of International Federation of Red Cross and Red Crescent societies.
• The Ready Campaign of the US Department of Homeland Security
• Field visit to EMRI:
To understand the process of handling various accident phone calls across
Tamil Nadu in EMRI (emergency management research institute) and an
unstructured interview with the operations manager of EMRI.
• Unstructured interviews were conducted with Director of Tamil Nadu fire and
Rescue service and various officers of fire service department Chennai.
Primary data was collected using the tool called questionnaire.
2.8 QUESTIONNAIRE DESIGN:
The three parts of the questionnaire were
• Awareness
• Preparedness
• Risk perception
The questionnaire includes both close ended and open-ended questions.
The questionnaire was structured in such a way that preparedness and awareness were
followed by risk perception.
Page 17
8/9/2019 disaster management chennai
http://slidepdf.com/reader/full/disaster-management-chennai 17/77
17
2.8.1 AWARENESS:
Awareness of an individual about fire related disasters and its management was measured
in the following four dimensions.
1. Causes of the fire related disaster
2. Preventive measures of fire related disasters
3. Handling disaster situation
4. First aid
First aid awareness was not included in overall awareness calculation
2.8.2 PREPAREDNESS:
Preparedness of an individual to a fire related hazards were measured in the
following four dimensions.
Table 2.8.2 preparedness dimension
Equipment:
First aid kit
Smoke detector
Fire extinguisher
Resources:
Knowing the Emergency service hotline
number
Ambulance -104,108
Police- 100
Fire -101,102
Nearest police station number
Nearest fire service number
Nearest hospital number
Knowing the Assembling point in multi-storied building
Training:
Fire fighting training (includes first aid
training)
Periodic mock evacuation drill
Operating fire extinguisher
Insurance:
Life insurance
Fire insurance for properties
Page 18
8/9/2019 disaster management chennai
http://slidepdf.com/reader/full/disaster-management-chennai 18/77
18
2.8.3 RISK PERCEPTION
The risk perception of the respondent was measured using the scale used in the
studies on perception of natural and environmental risk (Brun 1992, karger & Wiedemann
1998).Two risk characteristics were selected for the questionnaire.
The respondents were asked to judge each hazard regarding the two risk characteristics on
a0- 5point scale.
• Low personal risk------------------high personal risk (The perceived likelihood to die
from a hazard)
• Likely not fatal…………………likely fatal (Intensity of disasters)
2.8.3.1 General risk rating:
The respondents were asked to rate various fire related hazards that they perceive it
to be dangerous to them and then the reasons for the high ratings is asked. This helps to
identify which hazard is perceived to be the most dangerous and the reasons for it.
The predicted reason may be
• Consequences of the disaster
• Perceived lack of possibilities to protect from the disaster
• Lack of possibilities to prepare for the disaster
• Lack of precise, timely or reliable prediction about the disaster
2.8.3.2 Experience:
The experience of the individual to fire related hazards was measured in three
dimensions
• Experience of the fire related hazards to self.
• Experience of the fire related hazards to friends and relatives.
• Experience of the fire related hazards to colleagues and neighbors.
2.8.3.3 Social trust:
The trust of an individual on civil authorities was measured as the confidence of people
on the competency of civil authorities
2.9 Tools and techniques used
• Chi square test
• Descriptive statistics
Page 19
8/9/2019 disaster management chennai
http://slidepdf.com/reader/full/disaster-management-chennai 19/77
19
3. DATA ANALYSIS AND INTERPRETATION
3.1 DATA ANALYSIS FOR AWARENESS OF THE PEOPLE OF CHENNAI
Figure 3.1.1 Overall awareness of for fire related disaster management-preventive
measures and handling disaster situation.
Inference:The awareness level of the people was found to be low for the fire related disasters
management.
Page 20
8/9/2019 disaster management chennai
http://slidepdf.com/reader/full/disaster-management-chennai 20/77
20
Figure 3.1.2 awareness of the public about fire related disaster management-
preventive measures and handling disaster situation.
Inference:
The homemakers have high awareness in the disaster accidents of vehicle carrying
hazardous material and low awareness in the disaster fire at home. Students have high
awareness in accidents of vehicle carrying hazardous material and low in bomb blast and
explosion. The people working in multi-storeyed building have high awareness in
accidents of vehicle carrying hazardous material and low awareness in fire at home. The
people working in ordinary building have high awareness in fire at home and fire at multi-
storied building and low awareness in the disaster bomb blast and explosion. The
shopkeepers have high awareness about the disaster accidents of vehicle carrying
hazardous material and low awareness about the disaster bomb blast & explosion
Page 21
8/9/2019 disaster management chennai
http://slidepdf.com/reader/full/disaster-management-chennai 21/77
21
Figure 3.1.3 Awareness of the public about fire related disaster management –
preventive measures and handling the disaster (disaster wise)
Inference:
Awarenss level was found to be high for accidents of vehicle carrying hazardous
material and low for the disaster bomb blast & explosion when compared to other
disasters.
Page 22
8/9/2019 disaster management chennai
http://slidepdf.com/reader/full/disaster-management-chennai 22/77
22
3.1.4 Awareness of the public of Chennai of fire related disaster management –
preventive measures and handling disaster (segment wise)
Inference:
The people working in multistoried building show high level of awareness and
homemakers show low level of awareness when compared to other segments.
Page 23
8/9/2019 disaster management chennai
http://slidepdf.com/reader/full/disaster-management-chennai 23/77
23
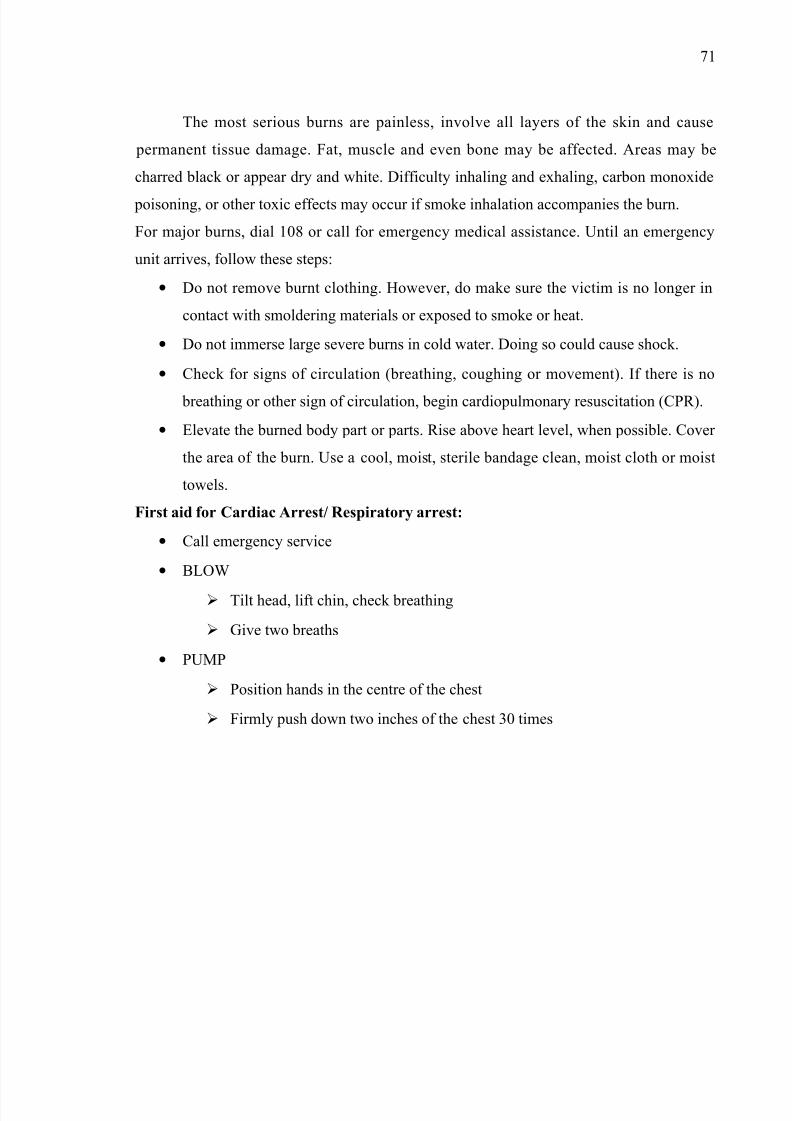
3.2 AWARENESS ABOUT FIRST AID FOR BURNS AND CARDIAC ARREST
Figure 3.2.1Overall awareness of the public about first aid for burns and cardiac
arrest
Inference:The awareness level of the people about first aid for burns and cardiac arrest was
found to be low.
Page 24
8/9/2019 disaster management chennai
http://slidepdf.com/reader/full/disaster-management-chennai 24/77
24
Figure 3.2.2 Awareness of the each segment about first aid for burns and cardiac
arrest (segment wise)
Inference:
The people working in multistoried building have high awareness about first aid for
burns and cardiac arrest when compared to other segments. Home makers have low
awareness about first aid for burns and cardiac arrest.
Page 25
8/9/2019 disaster management chennai
http://slidepdf.com/reader/full/disaster-management-chennai 25/77
25
Figure 3.2.3 Awareness of the public about first aid for major burns, minor burns
and electrocuted person.
Inference:
The awareness about first aid for major burns was found to be low and many
respondents don’t have any information about the first aid of major burns. The awareness
about first aid for minor burns is moderate as the respondents have some information about
the first aid for minor burns.The awareness about first aid for cardiac arrest/respiratory
arrest was found to be low however respondents have some information about the first aid
for cardiac arrest/respiratory arrest.
Page 26
8/9/2019 disaster management chennai
http://slidepdf.com/reader/full/disaster-management-chennai 26/77
26
3.3 AWARENESS OF THE FEMALE RESPONDENTS ABOUT HANDLING FIRE
IN FRYING PAN
Figure 3.3 Awareness of the female respondents about handling fire in frying pan.
Inference:The awareness level was found to be low among the female respondents to handle a
fire in frying pan. However the female respondents have some information to handle fire in
frying pan.
Page 27
8/9/2019 disaster management chennai
http://slidepdf.com/reader/full/disaster-management-chennai 27/77
27
3.4 AWARNEESS OF THE RESPONDENTS ABOUT THE TYPE OF FIRE
EXTINGUISHER PLACED IN WORKPLACE
Figure 3.4.Awareness of the respondents about the type of fire extinguisher placed in
the workplace.
Inferrence:
The level of awareness of the people about the type of fire extinguisher placed in
the workplace was found to be low.
Page 28
8/9/2019 disaster management chennai
http://slidepdf.com/reader/full/disaster-management-chennai 28/77
28
3.5 AWARENESS OF THE RESPONDENTS ABOUT THE SMOKE DETECTOR
Figure 3.5 Awareness of the respondents about the smoke detector
Inferrence:
The awareness of the people about the smoke detector was found to be low.
Page 29
8/9/2019 disaster management chennai
http://slidepdf.com/reader/full/disaster-management-chennai 29/77
29
3.6 DATA ANALYSIS FOR PREPAREDNES OF THE PEOPLE OF CHENNAI TO
FIRE RELATED DISASTERS
Figure 3.6.1 Overall preparedness of the public to fire related disasters
Inference:
The preparedness level was found to be low for fire related disasters.
Page 30
8/9/2019 disaster management chennai
http://slidepdf.com/reader/full/disaster-management-chennai 30/77
30
Figure 3.6.2 Preparedness of the public to fire related disasters – Dimension wise
Inference:
The preparedness level was high in the dimension equipment and low in thedimension training .
Page 31
8/9/2019 disaster management chennai
http://slidepdf.com/reader/full/disaster-management-chennai 31/77
31
Figure 3.6.3 Preparedness of the public to fire related disasters – Equipment
Inference:
The presence of fire extinguisher is high in multistoried building indicating an apt
level of preparedness however in multistoried building presence of the smoke detector was
found to be low. Pocessing first aid kit is prominent among students and people working in
multi-storied building.
Page 32
8/9/2019 disaster management chennai
http://slidepdf.com/reader/full/disaster-management-chennai 32/77
32
Figure 3.6.4 Preparedness of the public to fire related disasters – Equipment
Inference:
The presence of fire extinguisher in the work place of the respondents was found to
be high when compared to smoke detector and first aid kit. Also it was infered that the
presence of smoke detector in a building was found to be low.
Page 33
8/9/2019 disaster management chennai
http://slidepdf.com/reader/full/disaster-management-chennai 33/77
33
Figure 3.6.5 Preparedness of the public to fire related disasters – Resources
Inference:
The home makers have sufficient information about the fire service hotline number
and shopkeepers have less information when compared to other segments.People working
in multistoried building have sufficient information about the police service hotline
number and home makers have less information when compared to other segments. Home
makers was better at knowing the ambulance hotline number when compared to other segments. Knowing the phone numbers of nearest fire station ,police station number and
hospital was found to be low. Only few people working in multi storied building knew the
location of the assembling point.
Page 34
8/9/2019 disaster management chennai
http://slidepdf.com/reader/full/disaster-management-chennai 34/77
34
Figure 3.6.6 Preparedness of the public to fire related disasters based on the
dimension Resources
Inference:
The preparedness level was found to be low for the respondents knowledge about
nearest fire station phone number and this was followed by nearest police station phone
number and nearest hospital phone number. However the knowledge about ambulance
hotline number and the location of the assembling point among the people working in
multi-storied building was found to be low. The knowledge of the people knowing the
police hotline number was found to be high and fire service hotline number was found to
be moderate.
Page 35
8/9/2019 disaster management chennai
http://slidepdf.com/reader/full/disaster-management-chennai 35/77
35
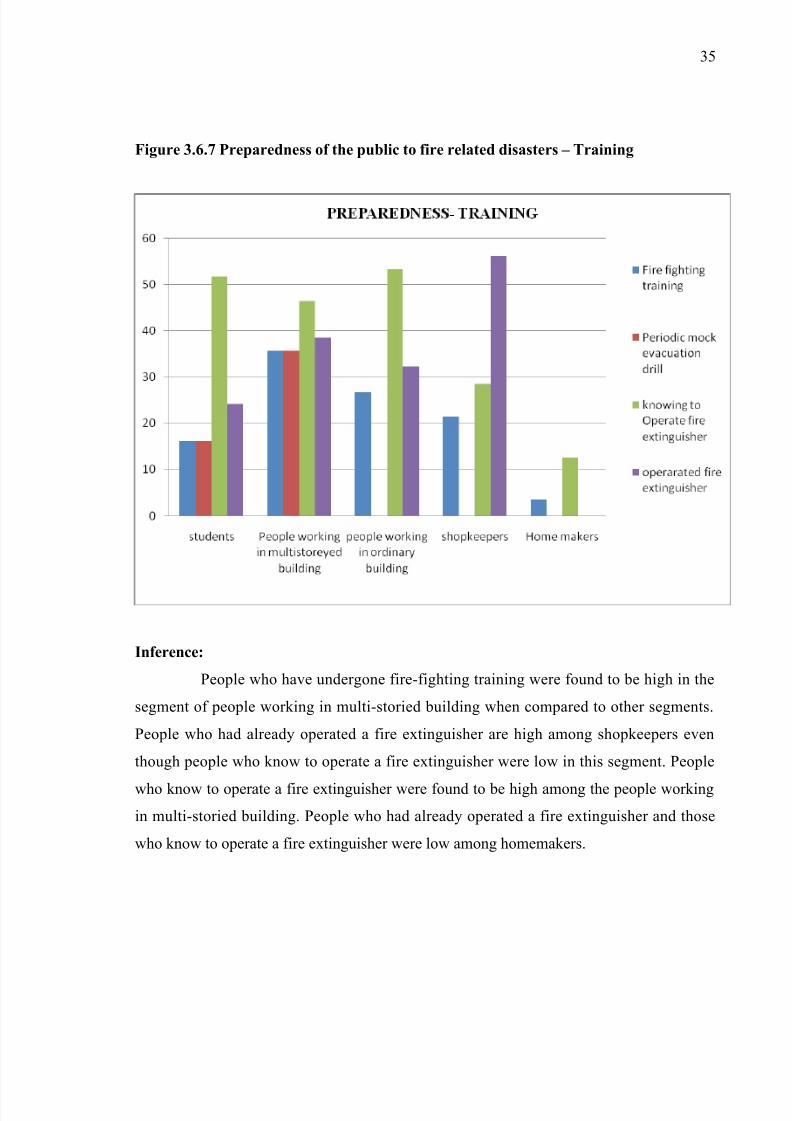
Figure 3.6.7 Preparedness of the public to fire related disasters – Training
Inference:
People who have undergone fire-fighting training were found to be high in the
segment of people working in multi-storied building when compared to other segments.
People who had already operated a fire extinguisher are high among shopkeepers even
though people who know to operate a fire extinguisher were low in this segment. People
who know to operate a fire extinguisher were found to be high among the people working
in multi-storied building. People who had already operated a fire extinguisher and those
who know to operate a fire extinguisher were low among homemakers.
Page 36
8/9/2019 disaster management chennai
http://slidepdf.com/reader/full/disaster-management-chennai 36/77
36
Figure 3.6.8 Preparedness of the public to fire related disasters based on the
Dimension- training
Inference:The fire fighting training was found to be low among the factors considered under
the dimension trainning.
Page 37
8/9/2019 disaster management chennai
http://slidepdf.com/reader/full/disaster-management-chennai 37/77
37
Figure 3.6.9 Preparedness of the public to fire related disasters based on the
dimension Insurance
Inference:
The people working in ordinary building was found to be high in having life
insurance for all members of their family,life insurance for properties and life insurance for
earning member of the family when compared to other segments of the respondents.
Page 38
8/9/2019 disaster management chennai
http://slidepdf.com/reader/full/disaster-management-chennai 38/77
38
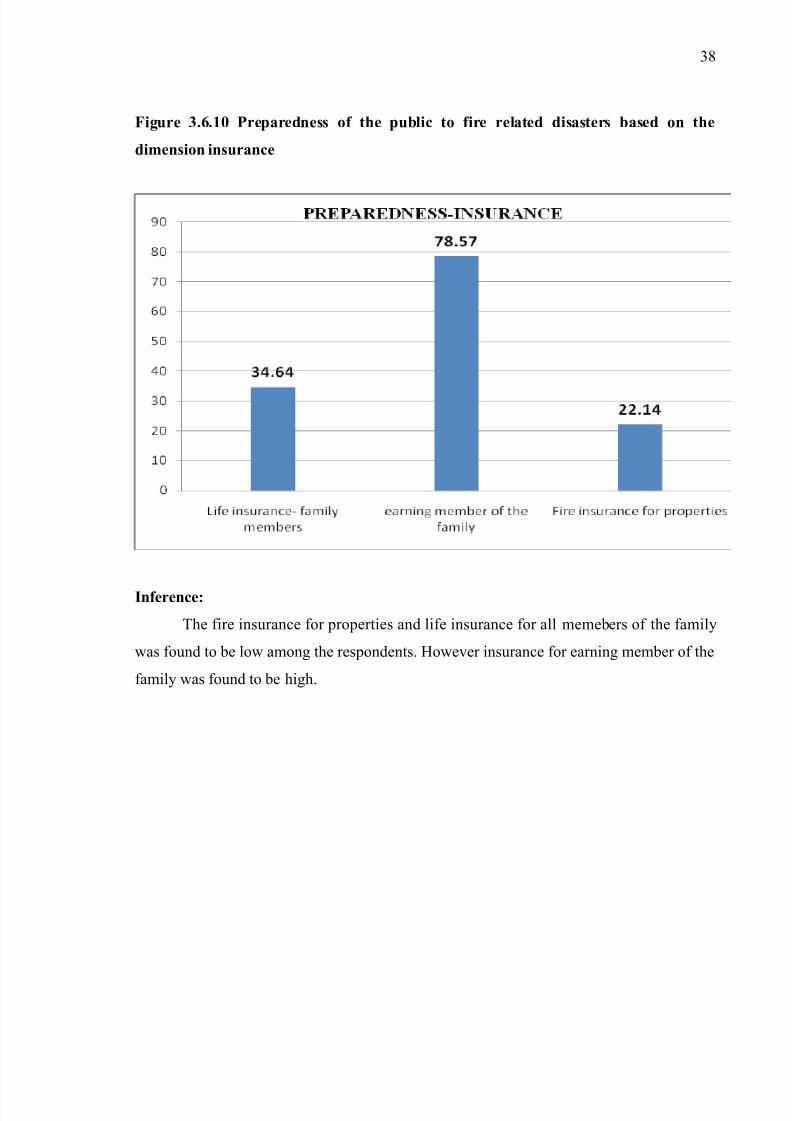
Figure 3.6.10 Preparedness of the public to fire related disasters based on the
dimension insurance
Inference:
The fire insurance for properties and life insurance for all memebers of the family
was found to be low among the respondents. However insurance for earning member of the
family was found to be high.
Page 39
8/9/2019 disaster management chennai
http://slidepdf.com/reader/full/disaster-management-chennai 39/77
39
Figure 3.6.11 Preparedness of the public to fire related disasters -segment wise.
Inference:
The people working in multi-storied building were better prepared when compared
to other segments. The homemakers have the lowest level of preparedness to fire related
disasters.
Page 40
8/9/2019 disaster management chennai
http://slidepdf.com/reader/full/disaster-management-chennai 40/77
40
Figure 3.6.12 Preparedness of the public to fire related disasters-comparison among
segments and dimensions.
Inference:
The students have high preparedness in dimensions equipment and insurance and
low preparedness in the dimension training. People working in multi-storied building have
high preparedness in dimension training and equipment and low preparedness in the
dimension resources. People working in ordinary building have high in preparedness the
dimension equipment and low preparedness in resources. Shopkeepers have high
preparedness in the dimension equipment and low preparedness in resources. Homemakers
have high preparedness in equipment and low preparedness in training.
Page 41
8/9/2019 disaster management chennai
http://slidepdf.com/reader/full/disaster-management-chennai 41/77
41
3.7 DATA ANALYSIS FOR RISK PERCEPTION OF THE PEOPLE OF CHENNAI
ON FIRE RELATED DISASTERS
Table 3.7.1 Risk perception index
LEVEL OF RISK PERCEPTION VALUE
HIGH >9
MODERATE =9
LOW <9
Note: Risk perception index was calculated using the product of two dimension of risk
perception.
Figure 3.7.2 the risk perception of people on fire related disasters.
Inference:
The risk percpetion of accidents of vehicle carrying hazardous material and
industrial explosion was found to be high as the risk percpetion value was greater than 9.
The risk percpetion of fire at home was found to be the highest followed by the disaster
bombblast &explosion as the risk perception value was found to be greater than index
value 9.
Figure3.7.3 Risk perception of threat level to Chennai environment
Page 42
8/9/2019 disaster management chennai
http://slidepdf.com/reader/full/disaster-management-chennai 42/77
42
Inference:
The risk perception of the respondents on threat level of fire related disasters to
chennai environment was found to be moderate.
Figure3.7.4 Risk perception of the respondents on fire related disasters
Page 43
8/9/2019 disaster management chennai
http://slidepdf.com/reader/full/disaster-management-chennai 43/77
43
Inference:
The bomb blast was percieved as the most dangerous disaster.
Figure 3.7.5 Reason for choosing the most dangerous disaster
Page 44
8/9/2019 disaster management chennai
http://slidepdf.com/reader/full/disaster-management-chennai 44/77
44
Inference:
Most of the respondents perceived the dangerousness of the disaster based on its
consequences.
3.7.6 Experience of the respondents to fire related hazards
Page 45
8/9/2019 disaster management chennai
http://slidepdf.com/reader/full/disaster-management-chennai 45/77
45
Inference:
The experience of the people to fire related disaster was found to be low.
Figure 3.7.7 Experience of respondents to fire related disasters-self,friends and family
memebers/friends and collegues/neighbours.
Page 46
8/9/2019 disaster management chennai
http://slidepdf.com/reader/full/disaster-management-chennai 46/77
46
Inference:
The self experience of the peopl to the fire related disasters was found to be low
and the people who haven’t experienced a fire related disaster even to their neigbours or
family members was found to be high.
Table 3.8 Association between risk perception of the people on fire related disasters
and experience of the people to fire related disasters.
Page 47
8/9/2019 disaster management chennai
http://slidepdf.com/reader/full/disaster-management-chennai 47/77
47
Disasters Value df Asymp. Sig. (2-sided)
Industrial
explosion
Pearson Chi-Square 14.713a 15 .472
Likelihood Ratio 16.640 15 .341
Linear-by-Linear Association .165 1 .685
N of Valid Cases 2809 cells (28.1%) have expected count less than 5. The minimum expected
count is .88.
Fire at home
Pearson Chi-Square 27.564a 15 0.024
Likelihood Ratio 29.997 15 0.012
Linear-by-Linear Association 0.009 1 0.922
N of Valid Cases 280
10 cells (31.3%) have expected count less than 5. The minimum expected
count is .44.
Bomb blast &
explosion
Pearson Chi-Square 31.572a 15 0.007
Likelihood Ratio 37.616 15 0.001
Linear-by-Linear Association 10.064 1 0.002
N of Valid Cases 280 10 cells (31.3%) have expected count less than 5. The minimum expected
count is .88
Accidents of
vehicles carrying
hazardous
material
Pearson Chi-Square 32.509a 15 0.005
Likelihood Ratio 36.331 15 0.002
Linear-by-Linear Association 2.265 1 0.132
N of Valid Cases 280 11 cells (34.4%) have expected count less than 5. The minimum expected
count is 2.64.
Fire at multistoried building
Pearson Chi-Square 20.172a 15 0.165
Likelihood Ratio 21.729 15 0.115
Linear-by-Linear Association 0.002 1 0.961N of Valid Cases 280 11 cells (34.4%) have expected count less than 5. The minimum expected
count is .44.
Inference:
The calculated value was found to be less than 0.05 for the disasters fire at home,
bomb blast & explosion and accidents of vehicle carrying hazardous material. Hence, there
was an association between risk perception of the people on the disasters fire at home,
bomb blast & explosion and accidents of vehicle carrying hazardous material and the
experience of people to fire related disasters. The calculated value was greater than 0.05
for the disasters industrial explosion and fire at multi-storied building. Hence, there was no
association between risk perception of the people on the disasters industrial explosion and
fire at multi-storied building and the experience of the people to fire related disasters.
Page 48
8/9/2019 disaster management chennai
http://slidepdf.com/reader/full/disaster-management-chennai 48/77
48
3.9 Trust of the people on civil authorities
Figure 3.9.1 the trust of the people on competency of civil authorities
Page 49
8/9/2019 disaster management chennai
http://slidepdf.com/reader/full/disaster-management-chennai 49/77
49
Inference:
The trust of the people on civil authority’s competency to handle the disaster
situation was found to be low.
Figure 3.9.2 the confidence of the people on civil authorities to handle disaster
competently
Page 50
8/9/2019 disaster management chennai
http://slidepdf.com/reader/full/disaster-management-chennai 50/77
50
Inference:
The confidence of people on civil authorities was found to be high for fire
service and medical response system to handle the disaster situation effectively. The
confidence of people on civil authorities was found to be low for government and moderate
for police service and paramilitary forces to handle the disaster situation effectively whencompared among the civil authorities.
3.10 Association between risk perception of the people on fire related disasters and
the trust of people on civil authorities.
Disasters Value df
Asymp. Sig. (2-
sided)
Page 51
8/9/2019 disaster management chennai
http://slidepdf.com/reader/full/disaster-management-chennai 51/77
51
Industrial explosion
Pearson Chi-Square 94.894a 60 .003
Likelihood Ratio 98.508 60 .001
Linear-by-Linear
Association
.000 1 .986
N of Valid Cases 280
59 cells (73.8%) have expected count less than 5. The minimum
expected count is .07.
Fire at home
Pearson Chi-Square 85.582a 60 .017
Likelihood Ratio 91.175 60 .006
Linear-by-Linear
Association
1.458 1 .227
N of Valid Cases 280
62 cells (77.5%) have expected count less than 5. The minimumexpected count is .04.
Bomb blast &
explosion
Pearson Chi-Square 93.735a 60 .003
Likelihood Ratio 97.214 60 .002
Linear-by-Linear
Association
.707 1 .400
N of Valid Cases 280
60 cells (75.0%) have expected count less than 5. The minimum
expected count is .07.
Accidents of vehicles
carrying
hazardous material
Pearson Chi-Square 71.542a 60 .146
Likelihood Ratio 76.741 60 .071
Linear-by-Linear
Association
.457 1 .499
N of Valid Cases 280
63 cells (78.8%) have expected count less than 5. The minimum
expected count is .21.
Fire at multi storied
building
Pearson Chi-Square 109.268a 60 .000
Likelihood Ratio 92.353 60 .005
Linear-by-Linear
Association
1.276 1 .259
N of Valid Cases 280
60 cells (75.0%) have expected count less than 5. The minimum
expected count is .04.
Inference:
The calculated value was found to be less than 0.05 for the disasters fire at home,
bomb blast & explosion, industrial explosion and fire at multi-storied building. Hence,there was an association between risk perception of the people on the disasters fire at
Page 52
8/9/2019 disaster management chennai
http://slidepdf.com/reader/full/disaster-management-chennai 52/77
52
home, bomb blast, & explosion, industrial explosion and fire at multi-storied building and
the trust of the people on civil authorities. The calculated value was greater than 0.05 for
the disaster accidents of vehicle carrying hazardous material. Hence, there was no
association between risk perception of the people on the disasters accidents of vehicle
carrying hazardous material and the trust of the people on civil authorities.
3.11ASSOCIATION BETWEEN RISK PERCPETION OF AN INDIVIDUAL ON
FIRE RELATED DISASTERS AND DEMOGRAPHIC FACTORS
3.11.1 Association between risk perception of people on accidents of vehicle carrying
hazardous material and gender.
Page 53
8/9/2019 disaster management chennai
http://slidepdf.com/reader/full/disaster-management-chennai 53/77
53
Disasters Value
df Asymp. Sig. (2-sided)
Industrial explosion
Pearson Chi-Square 17.389 15 .297
Likelihood Ratio 17.910 15 .267
Linear-by-Linear Association 1.589 1 .207 N of Valid Cases 280
6 cells (18.8%) have expected count less than 5. The minimum expected count is 1.00.
Fire at home
Pearson Chi-Square 17.112 15 .312
Likelihood Ratio 18.201 15 .252
Linear-by-Linear Association .947 1 .330
N of Valid Cases 280
8 cells (25.0%) have expected count less than 5. The minimum expected count is .50.
Bomb blast & explosion
Pearson Chi-Square 24.369 15 .059
Likelihood Ratio 28.080 15 .021
Linear-by-Linear Association 5.210 1 .022
N of Valid Cases 280
10 cells (31.3%) have expected count less than 5. The minimum expected count is
1.00.
Accidents of vehicles
carrying
hazardous material
Pearson Chi-Square 34.788a 15 .003
Likelihood Ratio 39.190 15 .001
Linear-by-Linear Association 16.004 1 .000
N of Valid Cases 280
12 cells (37.5%) have expected count less than 5. The minimum expected count is3.00.
Fire at multi storied building
Pearson Chi-Square 25.660a 15 .042
Likelihood Ratio 27.726 15 .023
Linear-by-Linear Association .740 1 .390
N of Valid Cases 280
8 cells (25.0%) have expected count less than 5. The minimum expected count is .50.
Inference
There was an association between risk perception of the people on accidents of
vehicle carrying hazardous material, fire at multi-storied building and the gender of the
people. There was no association between risk perception of the people on industrial
explosion, fire at home, bomb blast & explosion and the gender of the people.
3.11.2 Association between risk perception of an individual on accidents on fire
related disasters &income of the people.Disasters Value
df Asymp. Sig. (2-sided)
Industrial explosion
Pearson Chi-Square 127.925 60 .000
Likelihood Ratio 141.062 60 .000
Linear-by-Linear Association 6.665 1 .010
N of Valid Cases 280
Fire at home
Pearson Chi-Square 109.338 60 .000
Likelihood Ratio 100.491 60 .001
Linear-by-Linear Association 2.252 1 .133
N of Valid Cases 28058 cells (72.5%) have expected count less than 5. The minimum expected count
is .08.
Page 54
8/9/2019 disaster management chennai
http://slidepdf.com/reader/full/disaster-management-chennai 54/77
54
Bomb blast &
explosion
Pearson Chi-Square 144.208 60 .000
Likelihood Ratio 143.023 60 .000Linear-by-Linear Association 12.388 1 .000
N of Valid Cases 280
58 cells (72.5%) have expected count less than 5. The minimum expected count
is .08.
Accidents of
vehicles carrying
hazardous material
Pearson Chi-Square 179.750a 90 .000
Likelihood Ratio 141.605 90 .000
Linear-by-Linear Association .062 1 .804
N of Valid Cases 280
97 cells (86.6%) have expected count less than 5. The minimum expected count
is .09.
Fire at multi storied
building
Pearson Chi-Square 78.464 60 .055
Likelihood Ratio 82.199 60 .030
Linear-by-Linear Association 3.040 1 .081
N of Valid Cases 280
57 cells (71.3%) have expected count less than 5. The minimum expected count
is .08.
Inference:
There was an association between risk perception of the people on accidents of
vehicle carrying hazardous material, industrial explosion, fire at home, bomb blast
&explosion and the income of the people. There was no association between risk
perception of the people on fire at multi storied building and income of the people.
3.11.3 Association between risk perception of the people on fire related disasters &
education of the people.
Disasters Value
Df Asymp. Sig. (2-sided)
Industrial explosion
Pearson Chi-Square 95.868a 90 .316
Likelihood Ratio 96.305 90 .305
Linear-by-Linear Association .657 1 .418
N of Valid Cases 280
96 cells (85.7%) have expected count less than 5. The minimum expected count
is .03.
Fire at home
Pearson Chi-Square 133.815a 90 .002
Likelihood Ratio 121.568 90 .015
Linear-by-Linear Association .014 1 .904
N of Valid Cases 280
95 cells (84.8%) have expected count less than 5. The minimum expected count
is .01.
Bomb blast &
explosion
Pearson Chi-Square 111.432a 90 .062
Likelihood Ratio 104.406 90 .142
Linear-by-Linear Association .810 1 .368
N of Valid Cases 280
96 cells (85.7%) have expected count less than 5. The minimum expected count
is .03.
Page 55
8/9/2019 disaster management chennai
http://slidepdf.com/reader/full/disaster-management-chennai 55/77
55
Accidents of
vehicles carrying
hazardous material
Pearson Chi-Square 179.750a 90 .000
Likelihood Ratio 141.605 90 .000
Linear-by-Linear Association .062 1 .804
N of Valid Cases 280
97 cells (86.6%) have expected count less than 5. The minimum expected count
is .09.
Fire at multi storied
building
Pearson Chi-Square 135.398a 90 .001
Likelihood Ratio 125.501 90 .008
Linear-by-Linear Association 4.916 1 .027
N of Valid Cases 280
96 cells (85.7%) have expected count less than 5. The minimum expected count
is .01.
Inference:
There was an association between risk perception of the people on accidents of
vehicle carrying hazardous material, fire at multi-storied building, fire at home and the
education of the people. There was no association between risk perception of the people on
industrial explosion, bomb blast &explosion and the education of the people.
3.11.4 Association between risk perception of the people on fire related disasters &
age of the people.
Disasters Value df Asymp. Sig. (2-
sided)
Industrial explosion
Pearson Chi-Square 871.918a 675 .000
Likelihood Ratio 581.141 675 .996
Linear-by-Linear Association
12.832 1 .000
N of Valid Cases 280
736 cells (100.0%) have expected count less than 5. The minimum
expected count is .01.
Fire at home
Pearson Chi-Square 876.431a 675 .000
Likelihood Ratio 570.698 675 .999
Linear-by-Linear
Association
.103 1 .748
N of Valid Cases 280
735 cells (99.9%) have expected count less than 5. The minimum
expected count is .00.
Bomb blast &
explosion
Pearson Chi-Square 828.293a 675 .000
Likelihood Ratio 581.141 675 .996
Linear-by-Linear
Association
12.832 1 .000
N of Valid Cases 280
735 cells (99.9%) have expected count less than 5. The minimum
expected count is .01.
Accidents of vehicles
carrying
hazardous material
Pearson Chi-Square 831.452a 675 .000
Likelihood Ratio 570.106 675 .999
Linear-by-Linear
Association
.072 1 .788
N of Valid Cases 280
Page 56
8/9/2019 disaster management chennai
http://slidepdf.com/reader/full/disaster-management-chennai 56/77
56
736 cells (100.0%) have expected count less than 5. The minimum
expected count is .02.
Fire at multi storied
building
Pearson Chi-Square 874.062a 675 .000
Likelihood Ratio 551.479 675 1.000Linear-by-Linear
Association
1.741 1 .187
N of Valid Cases 280
735 cells (99.9%) have expected count less than 5. The minimum
expected count is .00.
Inference:
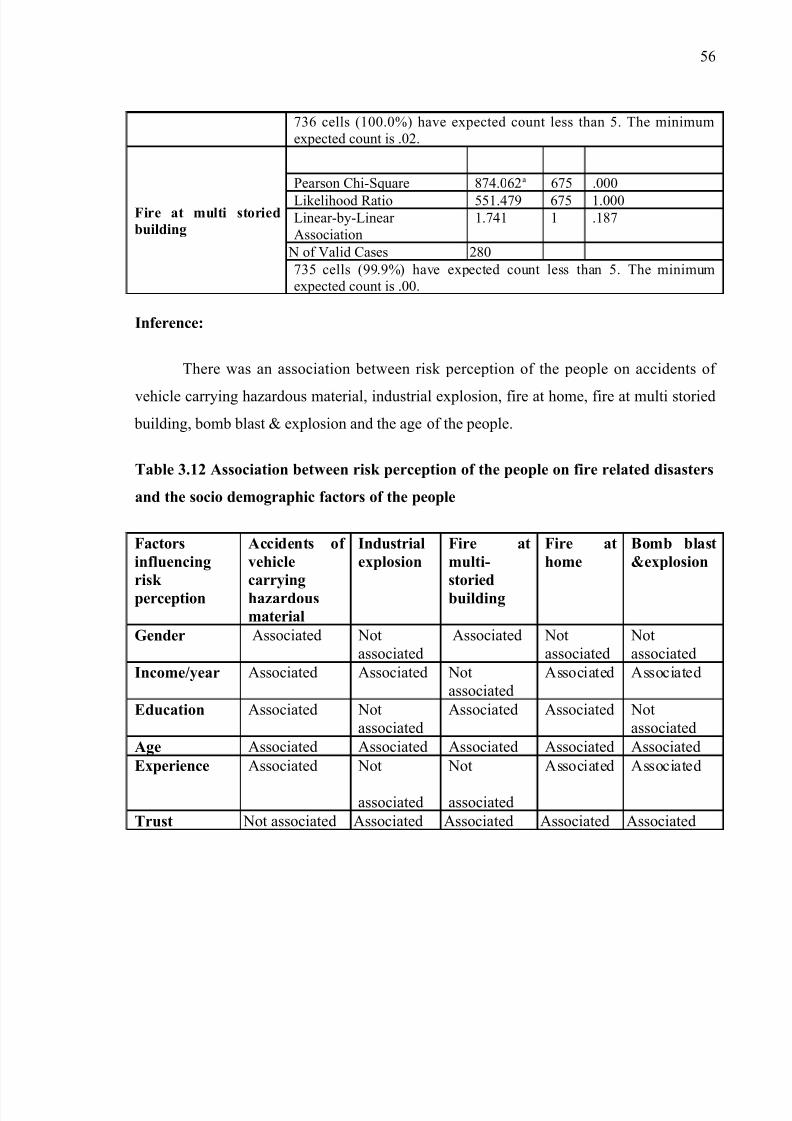
There was an association between risk perception of the people on accidents of
vehicle carrying hazardous material, industrial explosion, fire at home, fire at multi storied
building, bomb blast & explosion and the age of the people.
Table 3.12 Association between risk perception of the people on fire related disasters
and the socio demographic factors of the people
Factors
influencing
risk
perception
Accidents of
vehicle
carrying
hazardous
material
Industrial
explosion
Fire at
multi-
storied
building
Fire at
home
Bomb blast
&explosion
Gender Associated Not
associated
Associated Not
associated
Not
associated
Income/year Associated Associated Not
associated
Associated Associated
Education Associated Not
associated
Associated Associated Not
associated
Age Associated Associated Associated Associated Associated
Experience Associated Not
associated
Not
associated
Associated Associated
Trust Not associated Associated Associated Associated Associated
Page 57
8/9/2019 disaster management chennai
http://slidepdf.com/reader/full/disaster-management-chennai 57/77
57
Table 3.13 Awareness level summary:
SEGMENT WISE % OF
AWARENESS
LEVEL OF
AWARENESS
HOMEMAKER 26.68 Low
STUDENTS 30.98 Low
PEOPLE WORKING IN MULTI-
STORIED BUILDING
42.66 Low
PEOPLE WORKING IN ORDINARY
BUILDING
33.78 Low
SHOPKEEPERS 28.03 Low
DISASTER WISE
FIRE AT HOME 34.05 Low
FIRE AT MULTI-STORIED BUILDING 31.07 Low
BOMB BLAST& EXPLOSION 27.98 Low
ACCIDENTS OF VEHICLE CARRYING
HAZARDOUS MATERIAL
38.21 Low
OVERALL AWARENESS 32.83 Low
Page 58
8/9/2019 disaster management chennai
http://slidepdf.com/reader/full/disaster-management-chennai 58/77
58
Table 3.13 preparedness level summary:
DIMENSION WISE% OF
PREPAREDNESS
LEVEL OF
PREPAREDNESSEQUIPMENT 52.74 Moderate
RESOURCES 31.13 Low
TRAINING 29 Low
INSURANCE 45.12 Low
SEGMENTWISE
STUDENTS 38.23 Low
PEOPLE WORKING IN MULTI-
STORIED BUILDING
48.01 Low
PEOPLE WORKING IN
ORDINARY BUILDING
44.13 Low
HOMEMAKERS 31.77 Low
SHOPKEEPERS 35.34 Low
OVERALLPREPAREDNESS 39 Low
Page 59
8/9/2019 disaster management chennai
http://slidepdf.com/reader/full/disaster-management-chennai 59/77
59
CHAPTER 4
FINDINGS
AWARENESS
The awareness of people about fire related disaster was assessed along two
dimensions (i) preventive measures (ii) handling disaster situations. The awareness was
assessed for the following disasters fire at home, fire at multi-storied building, bomb blast
&explosion and accidents of vehicles carrying hazardous material.
• The overall awareness level of people of Chennai about fire related disaster
management was found to be low.
The awareness level was found to be high for the disaster accidents of
vehicle carrying hazardous material and low for the disaster bomb blast
&explosion when compared to other disasters
The people working in multistoried building show high level of awareness
and homemakers show low level of awareness when compared to other
segments.
The awareness of the people about the first aid for burns and cardiac arrest
was extremely low.
The people don’t have any information about the first aid for major burns
however they have some information about first aid for cardiac arrest.
The awareness level was limited among females about handling fire in the
frying pan.
The awareness of people about the type of fire extinguisher placed in the
workplace was found to be low.
The awareness of people about knowing an instrument called smoke
detector was found to be low.
Page 60
8/9/2019 disaster management chennai
http://slidepdf.com/reader/full/disaster-management-chennai 60/77
60
PREPAREDNESS
• The preparedness level of the people of Chennai to fire related disasters was low.
The preparedness level was assessed in four dimensions namely equipment,
resources, insurance and training.
When assessing the level of preparedness along various dimensions, the
preparedness was high in relation to “equipment” and low in relation to
“training”
When assessing the level of preparedness along various segments the
preparedness was high in relation to “the people working in multi-storied
building and low in relation to” the homemakers”.
RISK PERCPETION
• The risk perception of people of Chennai on fire related disasters was high.
The risk perception of the people was high for the disaster fire at home
followed by bomb blast and explosion when compared to other disasters.
The risk perception of the people on threat level of fire related disasters to
chennai environment was moderate.
Bomb blast & explosion was percieved to be the most dangerous disaster.
Most of the people perceive the event of danger in a disaster situation based
on consequences.
• The experience of people of Chennai to fire related disasters was found to be low.
CONFIDENCE OF PEOPLE ON VARIOUS CIVIL AUTHORITIES
The trust of people of Chennai on civil authorities’ competency was found
to be low.
The confidence of people on civil authorities was high for Fire service and
Medical response system to handle the disaster situation effectively.
The confidence of people was found to be low for government and
moderate for Police service and Paramilitary forces to handle the disaster
situation effectively.
Page 61
8/9/2019 disaster management chennai
http://slidepdf.com/reader/full/disaster-management-chennai 61/77
61
RISK PERCPETION IN RELATION TO TRUST ON CIVIL AUTHORITIES
There was no association between risk perception of people on accidents of
vehicle carrying hazardous material and the trust of people on civil
authorities.
There was an association between risk perception of people on fire at
multi-storied building, industrial explosion, bomb blast &explosion, fire at
home and the trust of people on civil authorities.
RISK PERCPETION IN RELATION TO EXPERIENCE OF THE PEOPLE TO
FIRE RELATED DISASTERS
There was an association between risk perception of people on accidents of
vehicle carrying hazardous material, fire at home bomb blast & explosion
and the experience of the people to fire related hazards.
There was no association between risk perception of people on industrial
explosion, fire at multi-storied building and the experience of the people to
fire related hazards.
RISK PERCPETION IN RELATION TO GENDER OF THE PEOPLE
There was an association between risk perception of the people on accidents
of vehicle carrying hazardous material, fire at multi-storied building and the
gender of the people.
There was no association between risk perception of the people on
industrial explosion, fire at home, bomb blast & explosion and the gender of
the people.
RISK PERCPETION IN RELATION TO INCOME OF THE PEOPLE
There was an association between risk perception of the people on
accidents of vehicle carrying hazardous material, fire at multistoried
building, fire at home, bomb blast &explosion and the income of the people.
There was no association between risk perception of the people on
industrial explosion and income of the people.
Page 62
8/9/2019 disaster management chennai
http://slidepdf.com/reader/full/disaster-management-chennai 62/77
62
RISK PERCPETION IN RELATION TO AGE OF THE PEOPLE
There was an association between risk perception of the people on fire related
disasters and the age of the people.
RISK PERCPETION IN RELATION TO EDUCATION OF THE PEOPLE
There was an association between risk perception of the people on accidents
of vehicle carrying hazardous material, fire at multi-storied building, fire at
home and the education of the people.
There was no association between risk perception of the people on
industrial explosion, bomb blast &explosion and the education of the
people.
Page 63
8/9/2019 disaster management chennai
http://slidepdf.com/reader/full/disaster-management-chennai 63/77
63
CHAPTER 5
DISCUSSION
Around 35-40% of the respondents are aware and prepared of fire related disaster
management.Hence it can be inferred that there is a need for awareness programme to
reach wide audience.Special emphasis is on the segments of the people which are low in
awarenss and also the disaster which has low awareness. The awareness can be increased
through media inorder to reach wide range of population and can be included in the
curriculam to make a better prepared citizenry for tomorrow.
TRAINING:
There is a need for training in fire fighting and first aid to reach a wide cross
section of population, as the opportunities for training available today are limited. The
people working in multi-storied building do not know the location of the assembling point.
So periodic mock drills can be made mandatory in all multistoried building, which gives a
clear picture of handling a fire situation. This can help to reduce panic and avoid
stampedes in event of any actual disaster.
The reason for high preparedness among the people working in multi-storied
building may be due to periodic mock evacuation drills followed in the building, and also
insurance is given through the company and it is mandatory.
RESOURCES:
The people need to be made aware about the importance of having the phone
numbers of the nearest police station, hospital and fire station in order to be better prepared
to fire related disasters.
INSURANCE:
Page 64
8/9/2019 disaster management chennai
http://slidepdf.com/reader/full/disaster-management-chennai 64/77
64
The people working in multistoried building show high level of preparedness in this
dimension because life insurance is mandatory in many companies. If insurance for
properties is made mandatory then the preparedness level can be improved in this
dimension.
RISK PERCEPTION:
The reason for high-risk perception may be due to the high media coverage about
the various disasters across the nation and the risk perception was high for the disaster fire
at home and bomb blast & explosion because the media coverage was high for such
disasters when compared to other disasters. The reason for the perception of most
dangerous disaster as bomb blast and explosion may be due to the exhaustive coverage of
terrorism in media.
The risk awareness campaign can be framed in such a way that the consequences of
the disaster can be emphasized to make the people understand the importance of being
aware and prepared to fire related disasters.
High-risk perception is prevalent along with low awareness and low preparedness
in the present study. There is a need for further studies to evaluate if improving awareness
and preparedness will result in decreased risk perception.
TRUST:
The trust of the people on competency of civil authorities can be increased by
exposing the activities of the civil authorities through media. This may reduce the risk
perception of the people on fire related disasters. Higher trust predicts lower risk
perception. (Siegrist et al, 2000, p.354).
EXPERIENCE:
The experience of the people to fire related disaster is low. This may be the reason
for moderete threat level perception of the people to chennai environment.
ASSOCIATION BETWEEN RISK PERCPETION AND SOCIO DEMOGRAPHIC
FACTORS:
Page 65
8/9/2019 disaster management chennai
http://slidepdf.com/reader/full/disaster-management-chennai 65/77
65
There is a need for further studies to evaluate the directional aspect of the
association between risk perception of the people on fire related disasters and socio
demographic variables of the people.
CHAPTER 6
CONCLUSION
The awareness of the people to fire related disaster management was low. The
preparedness of the people of Chennai to fire related disasters was also low. These findings
suggest that the need for effective and wide spread program for increasing awareness. The
risk perception of the people about the fire related disasters was high. Further research is
needed to find the correlation between various factors influencing risk perception and the
risk perception of people to frame effective risk communication strategy. Further research
would also help to guide the public policy concerning disaster awareness and disaster
preparedness program.
Page 66
8/9/2019 disaster management chennai
http://slidepdf.com/reader/full/disaster-management-chennai 66/77
66
APPENDIX 1
AWARNESS OF FIRE RELATED DISASTER MANAGEMENT
Preventive measures for fire at home:
Hazardous materials
• Never use gasoline, benzene, naphtha or similar inflammables indoor
• Keep matches and lighters away from children
• Keep the products containing hazardous materials in their original containers and
never remove the labels unless the container is corroding. Corroding containers
should be repackaged and clearly labeled.
• Never store hazardous materials in food containers
• Never use air spray, cleaning solutions, paint products, or pesticides near an open
flame.
Smoking & crackers
• Do not smoke near vulnerable areas like huts or petrol bunks
• Handle the crackers properly during festivals and funerals.
• Never smoke in bed.
Electricity
• Inspect extension cords for frayed or exposed wires or loose plugs
• Do not overload an extension cords or outlets
• Have the electrical wiring in your residence checked by the electrician.
Equipment
• Replace the regulator and gas tube in a LPG gas stove appropriately
ACCIDENT OF VEHICLES CARRYING HAZARDOUS MATERIALS:
Page 67
8/9/2019 disaster management chennai
http://slidepdf.com/reader/full/disaster-management-chennai 67/77
67
Chemicals purify drinking water, increase crop production, and simplify household
chores. However, chemicals also can be hazardous to the humans or the environment if
released improperly. Hazards can occur during production, storage, transportation, use or
disposal.
DURING A HAZARDOUS MATERIAL INCIDENT
• Listen to the local radio or television for detailed information and instructions.
Follow the instruction carefully.
• Stay away from the area to minimize contamination. Remember that some toxic
chemicals are odorless.
If you are then:
Asked to evacuate Do so immediately
Caught outside Stay upstream, uphill and upwind! In general, try to go at
least one and half mile from the danger area. Do not walk
into or touch any spilled liquids, airborne mists or
condensed solid chemical deposits
In a motor vehicle Stop and seek shelter in a permanent building. If you must
remain in your car, keep car windows and vents closed
and shut off the air conditioner
Requested to stay
indoors
Close and lock all exterior doors and windows. Close
vents, fireplace dampers and as many interior doors as
possible.
Turn off air conditioners and ventilation. In large
buildings, set ventilation system to 100% recirculation so
that no outside air is drawn into the building. If this is not
possible ventilation, system should be turned off.
Seal the room by covering each window door and vent
using plastic sheeting and duct tape
Use material to fill cracks and holes in the room such as
those around pipes.
Page 68
8/9/2019 disaster management chennai
http://slidepdf.com/reader/full/disaster-management-chennai 68/77
68
EXPLOSIONS:
If there is explosion, you should
• Get under a sturdy table or desk if things or falling around you. When they stop
falling, leave quickly, watching for obviously weakened floors and staircases. As
you exit from the building, be especially watchful of debris.
• Leave the building as quickly as possible. Do not stop to retrieve personal
possessions or make phone calls.
• Do not use a elevator
Once you are out of the building:
• Do not stand in front of windows, glass doors or other potentially hazardous areas.
• Move away from sidewalks or streets to be used by emergency officials or others
still exciting the buildings.
If you are trapped in debris
• If possible, use a flashlight or whistle to signal your location to rescuers.
• Avoid unnecessary movement so you do not pick up dust.
• Cover your nose and mouth with anything you have on hand.
• Tap on a pipe or wall so that rescuers can hear where you are
• Shout only as a last resort. Shouting can cause a person to inhale dangerous
amount of dust.
Bomb threat:
• Keep the caller on the line and record everything
• Notify the police and building management
• Get as much information from the caller as possible.
Page 69
8/9/2019 disaster management chennai
http://slidepdf.com/reader/full/disaster-management-chennai 69/77
69
Handling Disaster situation:
Type of fire What to do
On wood, paper or
clothes
Pour water
Cover thick woolen cloth
The person should roll on the floor to put off fire.
On oil in a frying pan Shut out the heat source and cover the pan with a lid
Electric fire
Switch off the main and put sand on the fire
Remove the person from the source of electricity using a wood or
leather object.
Source: www.tnfrs.com and US department of homeland securities
TYPES OF FIRE EXTINGUISHERS:
• Soda acid/water co2
• Foam
• Dry chemical powder
• CO2
• Halon1211 type
• ABC type(Mono ammonium phosphate base chemical powder)
Source: www.tnfrs.com (Tamil Nadu Fire and rescue service)
FIRST AID FOR BURNS
Page 70
8/9/2019 disaster management chennai
http://slidepdf.com/reader/full/disaster-management-chennai 70/77
70
First-degree burn
The least serious burns are those in which only the outer layer of skin is burned.
The skin is usually red, with swelling and pain sometimes present. The outer layer of skin
has not been burned through
Second-degree burn
When the first layer of skin has been burned through and the second layer of skin (dermis)
is burned, the injury is called a second-degree burn. Blisters develop and the skin takes on
an intensely reddened, splotchy appearance. Second-degree burns produce severe pain and
swelling.
For minor burns, including first-degree burns and second-degree burns limited to an area
no larger than 3 inches (7.5 centimeters) in diameter, take the following action:
• Cool the burn. Hold the burned area under cold running water for at least five
minutes, or until the pain subsides. If this is impractical, immerse the burn in cold
water or cool it with cold compresses. Cooling the burn reduces swelling by
conducting heat away from the skin. Do not put ice on the burn.
• Cover the burn with a sterile gauze bandage. Do not use fluffy cotton, which may
irritate the skin. Wrap the gauze loosely to avoid putting pressure on burned skin.
Bandaging keeps air off the burned skin reduces pain and protects blistered skin.
• Take an over-the-counter pain reliever. These include aspirin, ibuprofen (Advil,
Motrin, others), naproxen (Aleve) or acetaminophen (Tylenol, others). Never give
aspirin to children or teenagers.
Third-degree burn
Page 71
8/9/2019 disaster management chennai
http://slidepdf.com/reader/full/disaster-management-chennai 71/77
71
The most serious burns are painless, involve all layers of the skin and cause
permanent tissue damage. Fat, muscle and even bone may be affected. Areas may be
charred black or appear dry and white. Difficulty inhaling and exhaling, carbon monoxide
poisoning, or other toxic effects may occur if smoke inhalation accompanies the burn.
For major burns, dial 108 or call for emergency medical assistance. Until an emergency
unit arrives, follow these steps:
• Do not remove burnt clothing. However, do make sure the victim is no longer in
contact with smoldering materials or exposed to smoke or heat.
• Do not immerse large severe burns in cold water. Doing so could cause shock.
• Check for signs of circulation (breathing, coughing or movement). If there is no
breathing or other sign of circulation, begin cardiopulmonary resuscitation (CPR).
• Elevate the burned body part or parts. Rise above heart level, when possible. Cover
the area of the burn. Use a cool, moist, sterile bandage clean, moist cloth or moist
towels.
First aid for Cardiac Arrest/ Respiratory arrest:
• Call emergency service
• BLOW
Tilt head, lift chin, check breathing
Give two breaths
• PUMP
Position hands in the centre of the chest
Firmly push down two inches of the chest 30 times
Page 72
8/9/2019 disaster management chennai
http://slidepdf.com/reader/full/disaster-management-chennai 72/77
72
APPENDIX 2
QUESTIONNAIRE
Age: Education: Occupation: Income/year:
Gender:
1. Do you reside/work in a multi-storied building (more than five floors).
(a) Yes (b) No
(i) If yes, do you have an assembling point?
(a) Yes (b) No
(ii) If yes, do you know where it is?
(a) Yes (b) No
(iii) If yes to (ii), can you name the place?
2. Does your work place have a smoke detector?
(a) Yes (b) No (c) not aware (d) aware3. Does your workplace have a fire extinguisher? (For working)
(a) Yes (b) No
4. Do you know how to operate a fire extinguisher?
(a) Yes (b) No
5. If yes, have you ever operated a fire extinguisher?
(a) Yes (b) No
6. Have you undergone any mock evacuation drills in the recent past (2years)?
(a) Yes (b) No
Page 73
8/9/2019 disaster management chennai
http://slidepdf.com/reader/full/disaster-management-chennai 73/77
73
7. Have you attended any first aid /fire fighting training? If yes, when?
(a) Yes (b) No
8. Have you had an opportunity to undergo first aid training?
(a) Yes (b) No
(i) If yes, when and where
(i) If no, do you know where to get first aid training?
9. Do you have first aid kit at home?
(a) Yes (b) No
10. If yes, what are the items included in the first aid kit.
11. Do you have fire insurance for your properties?
(a) Yes (b) No (c) don’t know
12. How many members of your family have life insurance?
13. Who is the earning member of your family? Is he insured?
14. What is the hotline/ phone number of the following?
Police Fire Ambulance Nearest police station Nearest fire station Nearest hospital
15. What is the first thing you will do in case of an electric fire at your place?
16. What is the first thing you will do if your friend electrocuted?
17. What is the first thing you will do in case of fire on oil in frying pan? (Only for
women)
18. What is the first thing you will do in case of destructive fire at your home?
19. What will you do if someone’s cloths are on fire?
20. You need to escape a fire through a closed door. What, if anything, should you do
before opening the door?
21. What is the first thing would you do, when you were at work and if…?
(i) There was an explosion in the building
(ii) You trapped in debris
(iii) You received a package in the mail that you find suspicious
(iv) You received a telephone call that was a bomb threat
22. If you hear a loud noise of a blast near your place, what will you do?
23. Do you know the types of fire extinguisher? If yes, can you list a few of them?
24. If yes to (4), do you know the type of fire extinguisher placed in your work place?(a) Yes (b) No
Page 74
8/9/2019 disaster management chennai
http://slidepdf.com/reader/full/disaster-management-chennai 74/77
74
25. Where is usually a fire extinguisher kept in your workplace/ in any public places?
26. If there is an accident of vehicle carrying hazardous materials and you are near the
spot, what will you do?
(i) If you are asked to evacuate
(ii) If you are in an A/C motor vehicle
(iii) If you are requested to stay indoors
27. What are the preventive measures you can take to mitigate in the following situation?
(i)Fire accidents at home
(ii) Explosion& bomb blast
(iii)Fire at workplace or multi-storied building
28. (i) Imagine that your friend got burn in his/her hand and the outer layer of the skin
is completely burnt. What is the first aid you will do before approaching a doctor?
(ii) Imagine that your friend met with a fire accident, inner layer of the skin is
burnt, and the bones are visible. What is the first aid you will do before
approaching a doctor?
(iii) If you see, your friend electrocuted and he/she has fainted. Your friend stops
breathing. What will you do before you go to the doctor/arrival of an ambulance?
29. (i) Have you ever experienced any fire related accident?
(a) Yes (b) No
(ii) Have any of your family members/friends experienced any fire related
accident?
(a) Yes (b) No
(iii) Have any of your neighbors/colleagues experienced any fire related accident?(a) Yes (b) No
30. What is your rating on the level of threat of fire hazards to the Chennai environment?
1.No
threat at
all
2.Minimal
threat
3. Mild
threat
4. Moderate
threat
5. Strong
threat
6.Very
strong
threat
7.Extreme
threat
31. Rank the following fire related hazard which you consider it to be the most dangerous
hazard and why? (Show cards& record response)
Page 75
8/9/2019 disaster management chennai
http://slidepdf.com/reader/full/disaster-management-chennai 75/77
75
Heavy vehicles
carrying hazardous
material
Industrial
explosion
Fire at work
place/multi storied
building
Fire at
home
Bomb blast &
explosion
Reason:
32. How do you rate the following fire related hazards in the following risk characteristicson five-point scale given below (show cards& record the response)
0..1..2...3..4…5
Heavy vehicles
carrying
hazardous
material
Industrial
explosion
Fire at
multi-
storied
building
Fire at
home
Bomb
blast&
explosion
Low personal risk
…….high personal
risk
Likely not
fatal….likely fatal
33. Do you agree that the civil authorities in Chennai can handle a disaster situation
competently?
Strongly
Agree(5)
Agree
(4)
Neither agree nor
disagree (3)
Disagree
(2)
Strongly disagree
(1)
34. How confident are you that the following civil authorities can handle a disaster
situation competently? (Show cards & record response)
Civil authoritiesVery
confident(4)
Confident
(3)
Somewhat
confident(2)
Not at all
confident(1)
Fire servicePolice service
Page 76
8/9/2019 disaster management chennai
http://slidepdf.com/reader/full/disaster-management-chennai 76/77
76
Government
Paramilitary forces
Medical response
system
REFERENCES
Brun(1992) karger& wiedemann (1998), perception of natural and environmental
risk
Lai&Tao (2003), perception of risk in Chinese people, city university, Hongkong
Plapp (2001), Perception and evaluation of risk of natural hazards (working paper
on risk research and insurance management) Germany interim report.
Sonja D Hofmann et al (2007), Disaster reduction in climate change, Awareness of
storm surge risk in coastal community on the North Sea.
The council for excellence in US government (2006), Public readiness index A
Survey-Based Tool to Measure the Preparedness of Individuals, Families, and
Communities.
Websites
www.tnfrs.com
www.raddningsverket.se/templates/SRSA
www.usfa.dhs.gov
www.ready.gov
www.excelgov.org
http://hsc.usf.edu/publichealth/cdmha/CDMHA_mitigation_preparedness.htm
http://earthchangesmedia.com/survival/rcfire.php
http://timesfoundation.indiatimes.com/articleshow/1318386.cms
Page 77
8/9/2019 disaster management chennai
http://slidepdf.com/reader/full/disaster-management-chennai 77/77
77