DISCIPLINING FISHERIES SUBSIDIES: INCORPORATING SUSTAINABILITY AT THE WTO & BEYOND Fisheries Development Strategies: Past, Present, and Way Forward Lidvard Grønnevet Environment Department World Bank Thursday March 1, 2007
Transcript
DISCIPLINING FISHERIES SUBSIDIES:INCORPORATING SUSTAINABILITY AT THE
WTO & BEYOND
Fisheries Development Strategies: Past, Present, and Way Forward
Lidvard Grønnevet Environment Department
World Bank
Thursday March 1, 2007
•OVERVIEW
•DEVELOPMENT OVER TIME
•PRESENT WORLD BANK ACTIVITIES
•SUCESSFUL FISHERIES MANAGEMENT
•WAY FORWARD
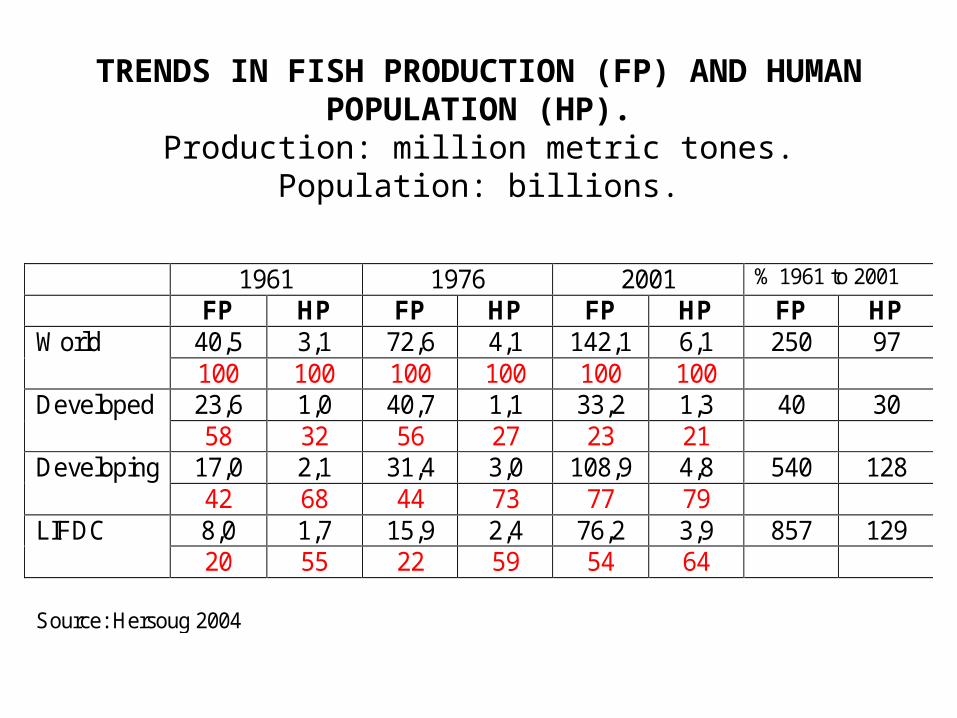
TRENDS IN FISH PRODUCTION (FP) AND HUMAN POPULATION (HP).
Production: million metric tones. Population: billions.
1961 1976 2001 % 1961 to 2001
FP HP FP HP FP HP FP HP 40,5 3,1 72,6 4,1 142,1 6,1 250 97 World 100 100 100 100 100 100 23,6 1,0 40,7 1,1 33,2 1,3 40 30 Developed 58 32 56 27 23 21
the rent drain• telling the story of overfishing in economic terms• make country-level estimates of rent loss to support
reforms • build economic arguments to justify the political and social
costs of change – a focus on finance ministers• “Where is - Fish in - the Wealth of Nations?” – track the
depleting capital account
and to follow the estimates …
• develop an arsenal of tools to capture lost rent, including• a roadmap for the political economy of reform• address the social costs of adjustment (e.g. fleet reduction) • build equity into change management (pro-poor) Preliminary global estimate:
US$ 50 billion/ year
SDN Vice Presidency for
Sustainable Development Integration of ESSD and INF to
SDN
• The new Vice Presidency for Sustainable Development will work across all spaces – from the biggest cities to the smallest towns, at the global, national, and local levels –
Agriculture - Fisheries
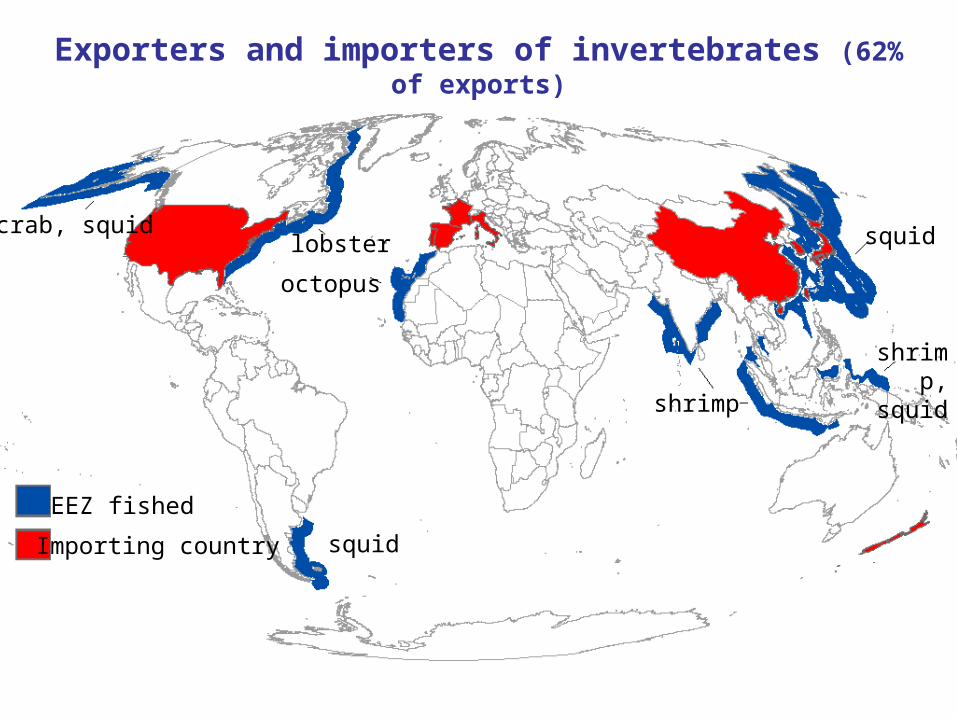
• ~ 20% wheat & 5% of rice are exported;• Exports in 2000 : 26 million tonnes of product worth
55 million USD;• ~ 40% of fish produced are exported; • Imports : 27 million tonnes worth 61 million USD.
INDICATOR AGRICULTURE FISHERIES
Tenure/ ownership private propertyprivate propertytransferable rightstransferable rights
common property, common property, poorly-defined rightspoorly-defined rights
Dimensions for success in fisheries management:• Economic - meeting wealth and efficiency objectives• Societal - equity objectives; distribution and access• Biological - meeting conservations objectives • Political – stability in relation to political changes
Require institutional capacity to define balance and to implement responsible over timeRequire institutional and policy environment that creates incentives to conserve fish and optimize wealth generationPolitical commitment and will are essential
(From Bostock 2005)
Changes in catch and season length in the central Gulf of Alaska halibut fishery from 1970 to 1994, before the
introduction of IFQs
How subsidies induce overfishing
MEY
MSY Bionomic equilibrium (BE)
Total cost of fishing effort (TC)
Total Revenue (TR)
Fishing effort (E)
TR & TC ( $)
E1 E2 E3
Max. rent
TC1
TC2BE2
BE1
TR
TR& TC ($)
E3 E4 Fishing effort (E)
Cost-reducing subsidies
Gordon Schaefer bioeconomic model
LESSONS FROM NAMIBIA:• Right based fisheries management system. Gives
incentive to harvest effectively. Generates considerable resource rent.
• Effective enforcement of rules. Cooperation and support from fishers.
• Payment (fees) for the right to fish. Establishes the principle that broader society has the right to benefit from the productivity of the natural resources. Also: that management of the fishery is part of the cost of fishing. (Ensures that portion of the rent does not become capitalized into the trading of rights.)
• Overcapacity can create economic vulnerability that can seriously undermine the robustness of the
management system. (P. Manning 2005)
SIERRA LEONEObjectives
The aims of the paper are to:
(i) present an assessment of the fisheries sector in Sierra Leone, highlighting the potential opportunities for contributing to national development, and the major issues which need to be addressed in order for this to be successful and sustainable;
(ii) outline a broad strategy for fisheries development in Sierra Leone; the main features of this strategy would be expected to form the basis of a dedicated programme of support by donors to underpin and enable its successful implementation in the future.
Focus: wealth-based approaches that aim to optimize economic returns from fisheries for the long-term benefit of society in Sierra Leone.
Goal:
to ensure that the fisheries sector makes a significant contribution to sustainable development and pro-poor economic growth in line with the national PRSP.
FSS will focus on four sets of outputs: Opportunities for sustainable fisheries development -
identified, assessed and supported; An enabling environment for sustainable fisheries
development will be created and enhanced over time;Capacity will be created to capitalize on opportunities, in
both the public and private sectors, to create and sustain both the enabling environment and fisheries management systems;
Fisheries management system options will be analyzed, leading to the establishment and operationalisation of appropriate fisheries systems in Sierra Leone over time.