26


Disclaimer
This presentation has been prepared by Bajaj Finserv Limited (the “Company”) solely for your information and for your use. This presentation is for information purposes only and should not be deemed to constitute or form part of any offer or invitation or inducement to sell or issue any securities, or any solicitation of any offer to purchase or subscribe for, any securities of the Company, nor shall it or any part of it or the fact of its distribution form the basis of, or be relied upon in connection with, any contract or commitment therefor. The financial information in this presentation may have been re-classified and reformatted for the purposes of this presentation. You may also refer to the financial statements of the Company available at www.bajajfinserv.in, before making any decision on the basis of this information.
This presentation contains statements that may not be based on historical information or facts but that may constitute forward-looking statements. These forward looking statements include descriptions regarding the intent, belief or current expectations of the Company or its directors and officers with respect to the results of operations and financial condition of the Company. Such forward-looking statements are not guarantees of future performance and involve risks and uncertainties, and actual results may differ from those in such forward-looking statements as a result of various factors and assumptions which the Company presently believes to be reasonable in light of its operating experience in recent years but these assumptions may prove to be incorrect. Any opinion, estimate or projection constitutes a judgment as of the date of this presentation, and there can be no assurance that future results or events will be consistent with any such opinion, estimate or projection. The Company does not undertake to revise any forward-looking statement that may be made from time to time by or on behalf of the Company.
No representation, warranty, guarantee or undertaking, express or implied, is or will be made as to, and no reliance should be placed on, the accuracy, completeness, correctness or fairness of the information, estimates, projections and opinions contained in this presentation. Potential investors must make their own assessment of the relevance, accuracy and adequacy of the information contained in this presentation and must make such independent investigation as they may consider necessary or appropriate for such purpose. This presentation does not constitute and should not be considered as a recommendation by the Company that any investor should subscribe for, purchase or sell any of Company's securities. By viewing this presentation you acknowledge that you will be solely responsible for your own assessment of the market and the market position of the Company and that you will conduct your own analysis and be solely responsible for forming your own view of the potential future performance of the business of the Company. None of the Company, book running lead managers, their affiliates, agents or advisors, the placement agents, promoters or any other persons that may participate in any offering of any securities of the Company shall have any responsibility or liability whatsoever for any loss howsoever arising from this presentation or its contents or otherwise arising in connection therewith.
This presentation and its contents are confidential and should not be distributed, published or reproduced, in whole or part, or disclosed by recipients directly or indirectly to any other person. Viewing this information may not be lawful in certain jurisdictions. In other jurisdictions only certain categories of person may be allowed to view this information. Any person who wishes to view this site must first satisfy themselves that they are not subject to any local requirements which prohibit or restrict them from doing so. If you are not permitted to view this presentation on this website or are in any doubt as to whether you are permitted to view these materials, please exit this webpage. In particular, this presentation is not directed at persons located in the United States, Canada Australia or Japan and this presentation is not for publication or distribution or release in the United States, Australia, Canada or Japan or in any other country where such distribution may lead to a breach of any law or regulatory requirement. The information contained herein does not constitute or form part of an offer or solicitation of an offer to purchase or subscribe for securities for sale in the United States, Australia, Canada or Japan or any other jurisdiction where such distribution may lead to a breach of any law or regulatory requirement. The securities referred to herein have not been and will not be registered under the United States Securities Act of 1933, as amended, and may not be offered or sold in the United States or absent registration or an applicable exemption from registration. This presentation is not intended to be a prospectus or preliminary placement document or final placement document under the Securities Exchange Board of India (Issue of Capital and Disclosure Requirements) Regulations, 2009, as amended.
2
3
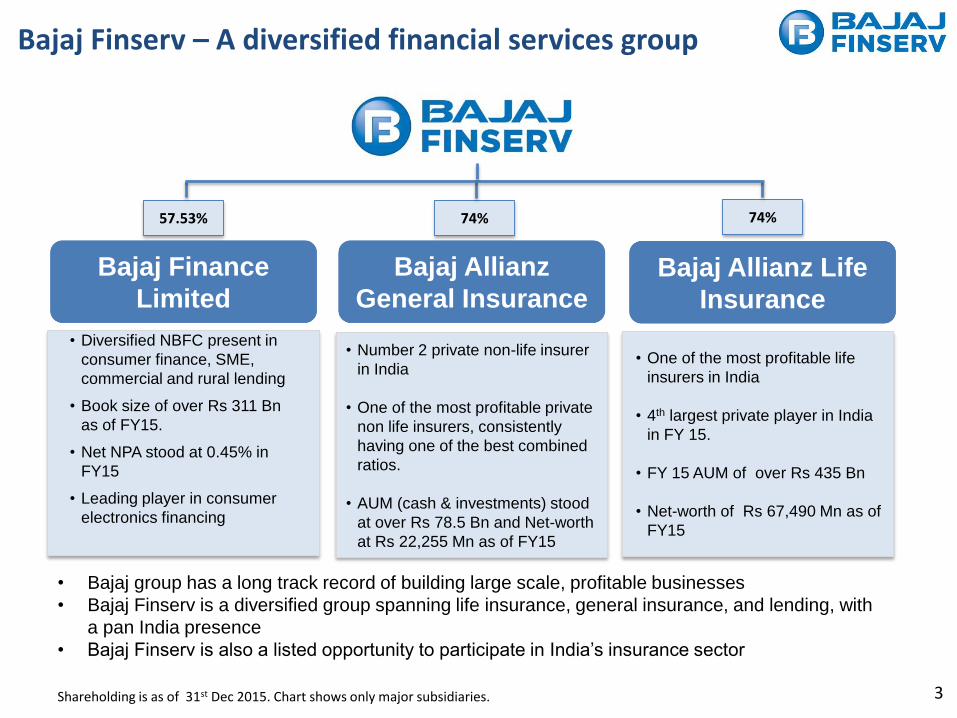
• Diversified NBFC present in
consumer finance, SME,
commercial and rural lending
• Book size of over Rs 311 Bn
as of FY15.
• Net NPA stood at 0.45% in
FY15
• Leading player in consumer
electronics financing
• Number 2 private non-life insurer
in India
• One of the most profitable private
non life insurers, consistently
having one of the best combined
ratios.
• AUM (cash & investments) stood
at over Rs 78.5 Bn and Net-worth
at Rs 22,255 Mn as of FY15
• One of the most profitable life
insurers in India
• 4th largest private player in India
in FY 15.
• FY 15 AUM of over Rs 435 Bn
• Net-worth of Rs 67,490 Mn as of
FY15
Bajaj Finance
Limited
Bajaj Allianz
General InsuranceBajaj Allianz Life
Insurance
Bajaj Finserv – A diversified financial services group
Shareholding is as of 31st Dec 2015. Chart shows only major subsidiaries.
57.53% 74% 74%
• Bajaj group has a long track record of building large scale, profitable businesses
• Bajaj Finserv is a diversified group spanning life insurance, general insurance, and lending, with
a pan India presence
• Bajaj Finserv is also a listed opportunity to participate in India’s insurance sector

4
All Figures in Rs Million
Profit before Tax
(Consolidated)
9541
7480
27.6%
53959
Gross Revenue
(Consolidated)
48022
PAT
(Consolidated)
4373
3474
25.9%
Net Worth
(Standalone)
26564
25443
4.4%12.4%
Performance Highlights of Q3 FY 2016 over Q3 FY2015
Bajaj Finserv performance highlights
Q3FY2016
•Bajaj Finserv Standalone : Bajaj Finserv remains a debt free company. Bajaj
Finserv’s surplus funds stood at Rs. 7753 million as on December 31, 2015.
•Consolidated Net Worth stood at Rs. 129098 million and Consolidated Book Value
Per Share at Rs. 811.

102
4373
Bajaj Finserv
-
Consolidated
5
Consolidated profit components for Q3 FY2016
Bajaj Finserv -
Standalone
BAGIC
BALIC
Bajaj Allianz
Financial
Distributors
Bajaj Finance
Consolidated
507
1411
3
2350
-
Intercompany
adjustments
141
Consolidated profit components for Q3 FY2015
Bajaj Finserv -
Standalone
BAGIC
BALIC
Bajaj Allianz
Financial
Distributors
1057
733
3
-50
Intercompany
adjustments
All Figures in Rs Million
Consolidated profit components
3474
Bajaj Finserv
-
Consolidated
Bajaj Finance
Consolidated
1590

6
All Figures in Rs Million
9M Highlights
BALIC 9M FY16 9M FY15 Growth
GWP 34,788 36,383 -4%
New Business 16,716 15,754 6%
Total Investments 433,614 421,693 3%
PAT# 6,474 3,171 #Refer Note
BAGIC 9M FY16 9M FY15 Growth
GWP 41,705 38,357 9%
NEP 30,976 28,321 9%
AUM (cash & investments) 90,899 72,510 25%
PAT 3,563 4,179 -15%
BAJAJ FINANCE 9M FY16 9M FY15 Growth
Book Size 417,604 295,276 41%
Total Income 54,260 39,732 37%
PAT 9,635 6,669 44%
Group Company Highlights
BAJAJ FINSERV 9M FY16 9M FY15 Growth
Gross Revenue 154,081 134,321 15%
Net worth 129,098 102,819 26%
PAT 13,453 9,827 37%
• Others includes Bajaj Finserv Standalone, and all remaining components.
70% 73%60%
49%38%
3%7%
14%20%
25%
12%
17% 23% 29%33%
15%3% 3% 2% 4%
2010-11 2011-12 2012-13 2013-14 2014-15
Consolidated Profit Components*
BALIC BAGIC BFL Others
# Note: BALIC’s PAT for 9M FY 16 includes an amount of Rs 2,120 Mn, which represents the transfer of shareholders’ share of policyholder surplus
arising in 9M FY16. In the previous years, such profit was transferred only at the end of the year. Had the transfer not been made, 9M FY16 PAT
would have been Rs 4,354 Mn.
Consolidated Bajaj Finserv Highlights

7
Bajaj Allianz Life Insurance

8
Life Insurance - Overview
STRATEGY
DIFFERENTIATORS
Large Proprietary
Agency Force
Capital Efficiency
Sustainable model
• Large pan India agency force. Deep pan India distribution
reach of offices and agents
• Support structure is quite lean
• BALIC is a highly capital efficient player
• Product mix isn’t skewed towards any one product line.
• FY15 13th month persistency at 67.6%. Q2 FY16 persistency has
remained stable over same period last year.*
The strategy is to balance growth with sustainability, and steadily increase market share.
This will be backed by diversified distribution channels, an efficient operating model and a
balanced product mix.
* Figures basis IRDA definition, and as disclosed in public disclosures

New business trend
9
All Figures in Rs Million
• New business was down 6% in Q3 FY16 over Q3 FY15.
• 9M FY16 new business grew 6% over corresponding period last year
-
3,00,000
6,00,000
9,00,000
12,00,000
15,00,000
2010-11 2011-12 2012-13 2013-14 2014-15
Industry New Business Trend
LIC Private Life Insurers
29,879
25,920 27,021
15,754 16,716
5,724 5,385
-
5,000
10,000
15,000
20,000
25,000
30,000
35,000
2012-13 2013-14 2014-15 9M FY15 9M FY16 Q3FY2015
Q3FY2016
New Business - BALIC

The product mix is diversified
10
13%
5%
25%
31%
26%
13%
3%
24%22%
37%
0%
20%
40%
Individual - Par Individual -Non Par
Individual - UL Group Fund Group NonFund
New Business Premium - Product Mix
Q3 FY 2015 Q3 FY 2016
Product mix depicted on percentage basis to new business.
13%
6%
21%
36%
24%
14%
6%
21%
30%28%
11%
3%
18%
36%32%
0%
20%
40%
Individual - Par Individual -Non Par
Individual -Unit Linked
Group - Fund Group - NonFund
New Business Premium - Product Mix
2014-15 9M FY 2015 9M FY 2016
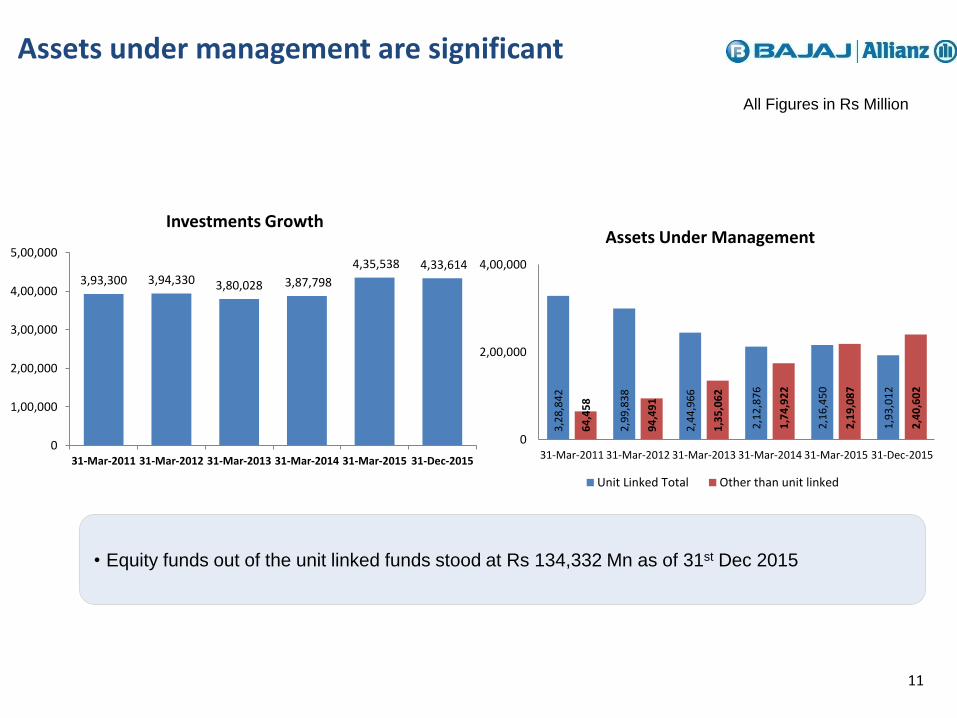
Assets under management are significant
11
All Figures in Rs Million
• Equity funds out of the unit linked funds stood at Rs 134,332 Mn as of 31st Dec 2015
3,93,300 3,94,330 3,80,028 3,87,798
4,35,538 4,33,614
0
1,00,000
2,00,000
3,00,000
4,00,000
5,00,000
31-Mar-2011 31-Mar-2012 31-Mar-2013 31-Mar-2014 31-Mar-2015 31-Dec-2015
Investments Growth
3,2
8,8
42
2,9
9,8
38
2,4
4,9
66
2,1
2,8
76
2,1
6,4
50
1,9
3,0
12
64
,45
8
94
,49
1
1,3
5,0
62
1,7
4,9
22
2,1
9,0
87
2,4
0,6
02
0
2,00,000
4,00,000
31-Mar-2011 31-Mar-2012 31-Mar-2013 31-Mar-2014 31-Mar-2015 31-Dec-2015
Assets Under Management
Unit Linked Total Other than unit linked

12
Net worth and PAT
BALIC is a capital efficient
insurer
Policyholders surplus for Q3
FY16 stood at Rs 532 Mn
vs Rs 766 Mn in Q3 FY15
Note: PAT for Q3 of FY 16 includes
an amount of Rs 486 Mn, which
represents the transfer of
shareholders’ share of policyholder
surplus arising in the quarter. In the
previous years, such profit was
transferred only at the end of the
year. Had the transfer not been
made in Q3 FY16, PAT would have
been Rs 1,421 Mn.
.
All Figures in Rs Million1
2,1
07
12
,10
7
12
,10
7
12
,10
7
12
,10
7
12
,10
7
12
,10
7 22,494
35,606
48,441
58,708
67,490 61,851
73,999
0
10,000
20,000
30,000
40,000
50,000
60,000
70,000
80,000
2010-11 2011-12 2012-13 2013-14 2014-15 Q3 FY2015
Q3 FY2016
Capital Invested Networth
Capital Invested - Networth
10,570
13,112 12,856
10,246
8,762
9911,908
-
5,000
10,000
15,000
2010-11 2011-12 2012-13 2013-14 2014-15 Q3 FY2015
Q3 FY2016
PAT

Bajaj Allianz Life Insurance performance highlights
Performance Highlights of Q3 FY2016 over Q3 FY2015
1,908
13
PAT *
New Business Premium Renewal Premium
991
5,385
5,724
6,867
8,694
433,614
421,693
Total Investments
* Refer Note
-6% -21%
12,252
14,419
Gross Written Premium
-15%
All Figures in Rs Million
797%
Solvency Ratio as
on 31st Dec 2015
3%
*Note: PAT for Q3 of FY 16 includes an amount of Rs 486 Mn, which represents the transfer of shareholders’ share of policyholder surplus
arising in the quarter. In the previous years, such profit was transferred only at the end of the year. Had the transfer not been made in Q3 FY16,
PAT would have been Rs 1,421 Mn.

14
Bajaj Allianz General Insurance

15
General Insurance - Overview
STRATEGY
DIFFERENTIATORS
Strategy is to retain focus on retail product lines, with diversified distribution, prudent
underwriting and strong cash flow generation, while delivering excellence in customer
service.
Underwriting
Standards
Sustained
Innovation
Distribution Depth
& Servicing
• Deeply ingrained underwriting focus, which has reflected in
industry leading combined ratios over time.
• FY15 Combined Ratio stood at 96.7%
• Early adopter of cash less claims in the industry
• First to have an in house health administration team to
handle health insurance claims
• Multi-channel distribution network consisting of motor
dealers, manufacturer tie ups, agency, banca, direct etc.
Has a track record of excellence in claims servicing

306 350 386 425
100 114
223 279
320 351
83 95
-
150
300
450
600
750
900
2011-12 2012-13 2013-14 2014-15 Q3 FY 2015 Q3 FY 2016
Rs.
Bill
ion
Industry Premium Trends(Ex Specialized)
PSU Private Insurers
BAGIC is the second largest private sector general insurer
16
• BAGIC grew GWP in Q3 FY 2016 By 14% compared to corresponding period last year
777
529629
706
182 208
31
,29
3
36
,75
9
41
,09
4
45
,83
9
53
,00
7
11
,83
1
13
,48
4
23
,10
5
26
,95
7
32
,03
1
37
,60
8
40
,08
9
9,4
49
11
,19
5
0
7,500
15,000
22,500
30,000
37,500
45,000
52,500
60,000
2010-11 2011-12 2012-13 2013-14 2014-15 Q3 FY2015
Q3 FY2016
Rs.
Mill
ion
BAGIC Premium Trend
GWP NWP

BAGIC has a healthy and profitable business mix -leading to a steady growth in investments – has added stability to revenues
BAGIC continues to grow its
AUM strongly. Investments are
largely in fixed income
securities.
17
Business mix is retail focused.
Motor continues to lead the
business mix.
All Figures in Rs Million
59% 58% 59% 59% 55% 63% 65%
12% 13% 15% 16%14%
12% 13%17% 17% 16% 15%
14%13% 11%
12% 12% 10% 10% 18% 12% 12%
0%
50%
100%
2010-11 2011-12 2012-13 2013-14 2014-15 Q3 FY2015
Q3 FY2016
Business Mix
Motor Health Property and Eng Others
39,75147,584
58,447
69,669 78,588
90,899
0
20,000
40,000
60,000
80,000
1,00,000
31-Mar-201131-Mar-201231-Mar-201331-Mar-201431-Mar-2015 31-Dec-2015
Rs.
Mill
ion
AUM (cash & investments)

BAGIC has high capital efficiency coupled with a very good combined ratio
18
All Figures in Rs Million
Q3 FY 2016 combined ratio
affected due to Chennai floods
during November and
December 2015. Without this
impact, combined ratio would
have been 101.4%
Note on Combined Ratio: Combined Ratios are in accordance with the Master Circular on ‘Preparation of Financial statements of General Insurance Business’ issued by IRDA effective from 1st April, 2013. (Net claims incurred divided by Net Earned Premium) + ( Expenses of management including net Commission divided by Net Written Premium). Pool losses, wherever applicable, include the impact of the erstwhile IMTPIP and Declined Risk Pool.
97.8% 96.3% 93.8%89.4%
94.2%
0.0%
20.0%
40.0%
60.0%
80.0%
100.0%
120.0%
2009-10 2010-11 2011-12 2012-13 2013-14
Combined Ratios (Excluding Motor Pool)
27
68
27
68
27
68
27
68
27
68
27
68
2,7
68
8,3569,587
12,553
16,643
22,255 20,811
25,818
0
4000
8000
12000
16000
20000
24000
28000
2010-11 2011-12 2012-13 2013-14 2014-15 Q3 FY2015
Q3 FY2016
Rs.
Mill
ion
BAGIC - Capital Invested - Networth
Capital Invested Net Worth
108.9%104.8% 99.5% 98.1% 96.7% 98.8%
108.7%
0.0%
20.0%
40.0%
60.0%
80.0%
100.0%
120.0%
2010-11 2011-12 2012-13 2013-14 2014-15 Q3 FY2015
Q3 FY2016
Combined Ratios (Including Pool)

Bajaj Allianz General performance highlights
19
All Figures in Rs Million
685
1,428
13,484
11,831
Profit After TaxGross Written
Premium
-52%14%
Net Earned Premium
10,373
9,583
8%
2.7%
7.1%
ROE
(Non Annualized)
Performance Highlights of Q3 FY2016 over Q3 FY2015
Solvency Ratio was 254% as
against regulatory requirement of
150% as of 31st Dec 2015
433
1,237
2,951
4,090
5,623
1,428
685
0
750
1500
2250
3000
3750
4500
5250
6000
2010-11 2011-12 2012-13 2013-14 2014-15 Q3 FY2015
Q3 FY2016
Rs.
Mill
ion
PAT

20
Bajaj Finance Limited

21
Bajaj Finance - Overview
Overview
Diversified Lending
• A non bank with strategy, structure & support model of a bank
• Diversified financial services strategy envisages an optimal mix of risk and profit to deliver a
sustainable business model
• The business construct is to deliver a sustainable and superior ROA & ROE in the medium term
Consumer
Sustained Growth
SME
Commercial Rural 72,718
1,22,831
1,67,436
2,29,710
3,11,994
-
50,000
1,00,000
1,50,000
2,00,000
2,50,000
3,00,000
3,50,000
2010-11 2011-12 2012-13 2013-14 2014-15
Book Size – Rs Mn
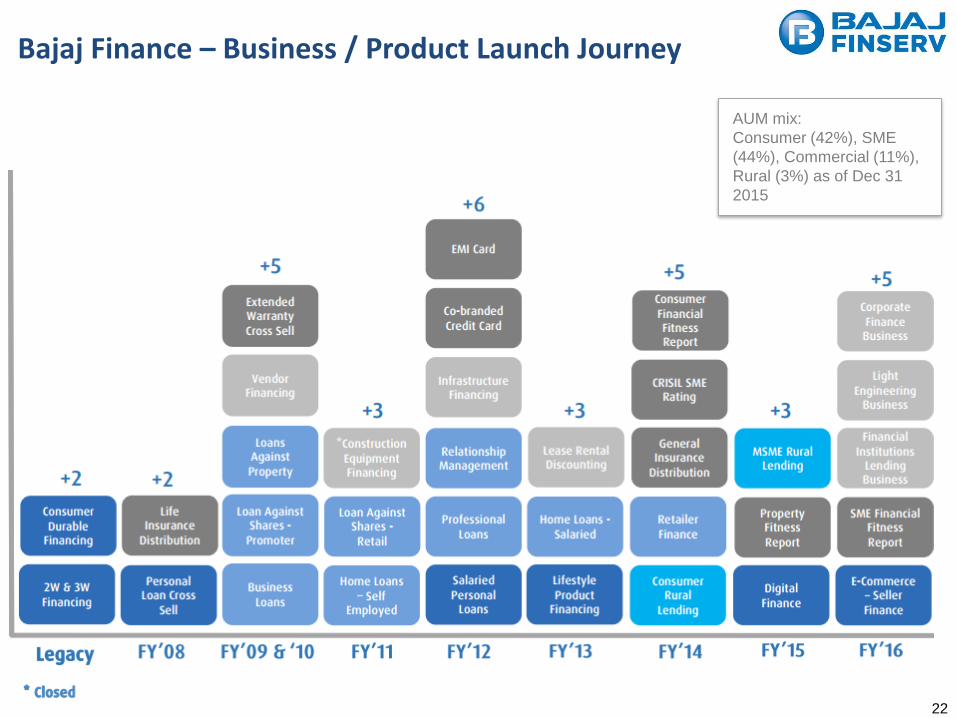
Bajaj Finance – Business / Product Launch Journey
22
AUM mix:
Consumer (42%), SME
(44%), Commercial (11%),
Rural (3%) as of Dec 31
2015

Bajaj Finance has clocked healthy growth in revenues
23
All Figures in Rs Million
72,718
1,22,831
1,67,436
2,29,710
3,11,9942,95,276
4,17,604
-
50,000
1,00,000
1,50,000
2,00,000
2,50,000
3,00,000
3,50,000
4,00,000
4,50,000
2010-11 2011-12 2012-13 2013-14 2014-15 Q3 FY2015
Q3 FY2016
Book Size
14,061
21,719
31,097
40,744
54,182
14,854
20,696
0
10,000
20,000
30,000
40,000
50,000
60,000
2010-11 2011-12 2012-13 2013-14 2014-15 Q3 FY2015
Q3 FY2016
Revenues
10,351
14,257
19,040
25,011
31,699
8,930
13,203
0
5,000
10,000
15,000
20,000
25,000
30,000
35,000
2010-11 2011-12 2012-13 2013-14 2014-15 Q3 FY2015
Q3 FY2016
Net Interest Income

Quality of assets is good, and operating costs remain under control
24
All Figures in Rs Million
45% 47%45% 46% 45% 43.9% 41.6%
0%
10%
20%
30%
40%
50%
60%
2010-11 2011-12 2012-13 2013-14 2014-15 Q3 FY2015
Q3 FY2016
Operating expenses as a % of NII
2,046
1,5441,818
2,588
3,846
1,0791,462
0.8%
0.12%0.19%
0.28%
0.45%
0.49%
0.26%
0.0%
2.0%
0
1000
2000
3000
4000
5000
2010-11 2011-12 2012-13 2013-14 2014-15 Q3 FY2015
Q3 FY2016
Loss Provision and Net NPA%
Loss Provision (Rs. millions) Net NPA %
2,470
4,064
5,913
7,190
8,979
2,584
4,085
-
1,000
2,000
3,000
4,000
5,000
6,000
7,000
8,000
9,000
10,000
2010-11 2011-12 2012-13 2013-14 2014-15 Q3 FY2015
Q3 FY2016
PAT

Bajaj Finance performance highlights
Performance Highlights of Q3 FY2016 over Q3 FY2015
4,085
25
Profit After TaxTotal Income
2,584
20,696
14,854
58%39%
All Figures in Rs Million
Return on Assets
(Non-annualized)
1%
0.9%
417,604
Book Size
ROE
(Non-annualized)
295,276
5.8%
5.7%
41%
• Borrowing mix is not excessively dependent
on banks (47:53 mix between banks and
other sources as of 31st Dec 2015).
• Capital Adequacy stands at 19.54% as of 31st
Dec 2015

Thank You
26


