49


Disc
laim
erThe information, statements and opinions contained in this Presentation and subsequent discussion do not constitute anoffer to sell or solicitation of any offer to subscribe for or purchase any securities or other financial instruments or anyadvice or recommendation in respect of such securities or other financial instruments.
Potential investors and shareholders of the Company (the “Potential Investors and Shareholders”) are reminded thatinformation contained in this Presentation and subsequent discussion comprises extracts of operational data and financialinformation of the Group for the six months period ended 30 June 2019. The information included in this Presentation andsubsequent discussion, which does not purport to be comprehensive nor render any form of financial or other advice, hasbeen provided by the Group for general information purposes only and certain information has not been independentlyverified. No representations or warranties, expressed or implied, are made as to, and no reliance should be placed on, thefairness, accuracy, completeness or correctness of the information, statements or opinions presented or contained in thisPresentation and any subsequent discussions or any data which such information generates. Potential Investors andShareholders should refer to the 2019 Interim Report for the unaudited results of the Group which are published inaccordance with the Rules Governing the Listing of Securities on The Stock Exchange of Hong Kong Limited.
The performance data and the results of operations of the Group contained in this Presentation and subsequent discussionare historical in nature, and past performance is no guarantee of the future results of the Group. Any forward-lookingstatements and opinions contained in this Presentation and subsequent discussion are based on current plans, beliefs,expectations, estimates and projections at the date the statements are made, and therefore involve risks and uncertainties.There can be no assurance that any of the matters set out in such forward-looking statements are attainable, will actuallyoccur or will be realised or are complete or accurate. Actual results may differ materially from those stated, implied and/orreflected in such forward-looking statements and opinions. The Group, the Directors, officers, employees and agents of theGroup assume (a) no obligation to correct, update or supplement the forward-looking statements or opinions contained inthis Presentation and subsequent discussion; and (b) no liability in the event that any of the forward-looking statements oropinions do not materialise or turn out to be incorrect.
Potential Investors and Shareholders should exercise caution when investing in or dealing in the securities of the Company.
QR code for Operations Analysis

Agen
da


2019
1H
Res
ults
Hig
hlig
hts
Revenue #
$217.1bn
- 3%(+2% in local currencies)
5
EBITDA #
$54.0bn
- 2%(+3% in local currencies)
EBIT #
$34.2bn
- 3%(+2% in local currencies)
Net Earnings # *
$18.2bn
+ 1%(+6% in local currencies)
EPS *
(Post-IFRS 16)
$4.75
+ 2%
DPS
$0.87
flat
* Net earnings represent profit attributable to ordinary shareholders. 1H 2019 EPS is calculated based on profit attributable to ordinary shareholders and CKHH’s weighted average number of shares outstanding during the six-month period of 3,856,240,500.
# Following the adoption of IFRS 16 on 1 January 2019, the Group’s statutory results for six months ended 30 June 2019 are on a IFRS 16 basis, whereas the statutory results for the corresponding six months ended 30 June 2018 are on a IAS 17 basis (“Pre-IFRS 16 basis”) as previously reported. Hence, any comparison between the two bases of reporting would not be meaningful. The Group believes that the IAS 17 basis metrics, which are not intended to be a substitute for, or superior to, the reported metrics on a IFRS 16 basis (“Post-IFRS 16 basis”), allows a like-with-like comparison with the prior period results, and to better reflect management’s view of the Group’s underlying operational performance. As a result, the Group has provided an alternative presentation of the Group’s EBITDA, EBIT and profit attributable to ordinary shareholders prepared under the Pre-IFRS 16 basis relating to the accounting for leases for the first six months of 2019. Unless otherwise specified, the discussion of the Group’s operating results in this presentation is on a Pre-IFRS 16 basis as mentioned above. Under Post-IFRS 16 basis, Revenue, EBITDA, EBIT and Net Earnings were HK$217.1bn, HK$65.7bn, HK$36.3bn and HK$18.3bn respectively.

55,350
56,866
53,988
490
1,047 4,341 409
( 3,554 )
( 975 )
( 27 ) ( 215 )
( 2,878 )
1H 2018 Ports &RelatedServices
Retail Infrastructure HuskyEnergy
3 GroupEurope
HTHKH HAT F&Iand
Others
1H 2019Underlying
EBITDA
Foreigncurrency
translationimpact
1H 2019EBITDA
# Asia, Australia & Others includes Panama, Mexico and the Middle East. Canada includes contribution from the USA for Husky Energy.* Represents contributions from Finance & Investments and Others.
$54.0bn-2%
(+3% in local currencies)
EBITDA
6
EBIT
DA +8% +14%
-19% -17%
+34%
-4%
+118%
-7%
EBITDAChange %(in localcurrencies)
HK$ m
EBITDA Change by Division
Port & Related Services Retail Infrastructure
Energy Telecommunications Finance and Investments & Others

Operating FCF Operating FCF by Core Business
Note 1 : Operating FCF (Operating Free Cash Flow) represents EBITDA of Company & subsidiaries (Pre-IFRS 16 basis) and dividends from Asso & JVs less capex of Company & subsidiaries (excluding Telecom licences and capex of assets classified as held for sale) and investments in Asso & JVs.
Note 2 : Total bank and other debts are defined, for the purpose of “Net debt” calculation, as the total principal amount of bank and other debts and unamortised fair value adjustments arising from acquisitions. Net debt is defined as total cash, liquid funds and other listed investments less total bank and other debts. Net total capital is defined as total bank and other debts plus total equity (adjusted to exclude IFRS 16 effects) and loans from non-controlling shareholders net of total cash, liquid funds and other listed investments. The consolidated net debt to net total capital ratio under IFRS 16 basis, after including IFRS 16 impact in total equity, is 26.7%.
Port & Related Services Retail
Infrastructure Energy
Telecommunications Finance and Investments & Others
Dividends from Asso & JVsEBITDA of Subsidiaries
Capex Investments in Asso & JVs
EBITDA – Share ofAsso & JVs
Telecom licences
Oper
atin
g FC
F
7
Net Debt
Credit Ratings
Net debt (2) as at 30 June 2019 HK$212,455mNet debt to net total capital ratio(2) 26.2%
30 June 2019 31 Dec 2018
Moody’s A2 (Stable) A2 (Stable)S & P A (Stable) A (Stable)Fitch A- (Stable) A- (Stable)
$27.9bn+ 6%
9,836 4,859
26,775 33,203
HK$ m
(9,226) (9,615)
(1,074) (504)
1H 2018 1H 2019
8
Fina
ncia
l Pro
file
Oper
atin
g FCF
by
divi
sion
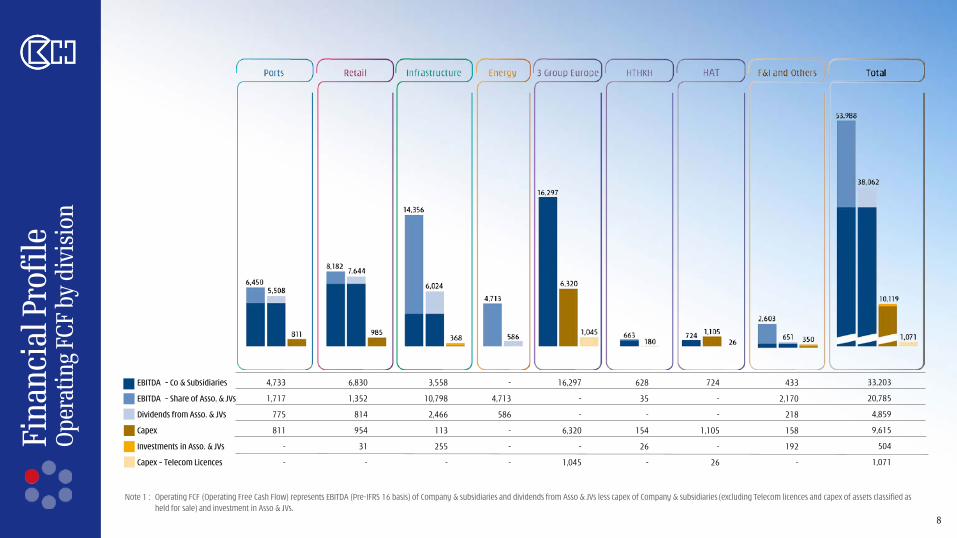
4,733
1,717
775
811
-
-
6,830
1,352
814
954
31
-
3,558
10,798
2,466
113
255
-
-
4,713
586
-
-
-
16,297
-
-
6,320
-
1,045
628
35
-
154
26
-
724
-
-
1,105
-
26
433
2,170
218
158
192
-
33,203
20,785
4,859
9,615
504
1,071
EBITDA – Co & Subsidiaries
EBITDA – Share of Asso. & JVs
Dividends from Asso. & JVs
Capex
Investments in Asso. & JVs
Capex – Telecom Licences
Note 1 : Operating FCF (Operating Free Cash Flow) represents EBITDA (Pre-IFRS 16 basis) of Company & subsidiaries and dividends from Asso & JVs less capex of Company & subsidiaries (excluding Telecom licences and capex of assets classified as held for sale) and investment in Asso & JVs.

6,205
6,695
6,450 18
226
349
(3)(100)
( 245 )
1H 2018EBITDA
HPH Trust MainlandChina
and OtherHong Kong
Europe Asia,Australia
and Others *
Corporatecosts
& other portrelatedservices
1H 2019Underlying
EBITDA
Foreigncurrency
translationimpact
1H 2019EBITDA
• Assets: US$12.2bn
• 288 Berths52 Ports27 Countries
• 42.1m TEUs handled in1H 2019
TEUs
EBITDA #
EBITDA Change
HPH Trust Mainland China and Other Hong Kong
Europe Asia, Australia and Others *
Corporate costs & other port related services
* Asia, Australia and Others includes Panama, Mexico and the Middle East.# Under Post-IFRS 16 basis, EBITDA was HK$7,766 million.
EBITDA Growth
9
Port
s & R
elat
ed S
ervi
ces
EBITDAChange % (in local currencies)
42.1m+4%
$6,450m+4%
(+8% in local currencies)
11.3 m (-1%)
6.5 m (-2%)
8.2 m (+8%)
16.1 m(+8%)
10%
8%
24%49%
9%
flat
-16%
+1%
+7% +8%
HPH Trust Mainland Chinaand Other Hong
Kong
Europe Asia, Australia andOthers *
Total
+8% in local currencies
HK$ m

7,532
8,579 8,182 92 201 136 18
600
(397)
1H 2018EBITDA
H&BChina
H&BAsia
H&BWesternEurope
H&BEasternEurope
OtherRetail &
one-off gain
1H 2019Underlying
EBITDA
Foreigncurrency
translationimpact
1H 2019EBITDA
• Assets: US$27.3bn
• World’s largest international H&B retailer
• Operating in 25 markets with 12 retail brands
• 136m loyalty members worldwide
EBITDA Growth
H&B EBITDA Change
EBITDAMargin %
Store number
15,213+5%
EBITDA #
HK$ m H&B growth: +6% in local currencies
Reta
il
10
* During the first half of 2019, ASW formed a joint venture with Yonghui and Tencent and recognized a one-off gain of approximately HK$633 million, with its interest in China supermarket business reduced to 40%.
# Under Post-IFRS 16 basis, EBITDA was HK$13,065 million.
$8,182m+9%
(+14% in local currencies)
3,666
3,221 5,551
2,303
472
+4%
+15%
+6%
+2%
+6%
H&B China H&B Asia H&B WesternEurope
H&BEastern Europe
H&B Total
19% 10% 7% 12% 10%
EBITDAChange % (in local currencies)
H&B China H&B Asia
H&B Western Europe H&B Eastern Europe
Other Retail One-off gain from PNS China merger*
29%
18%28%
12%
5%8%
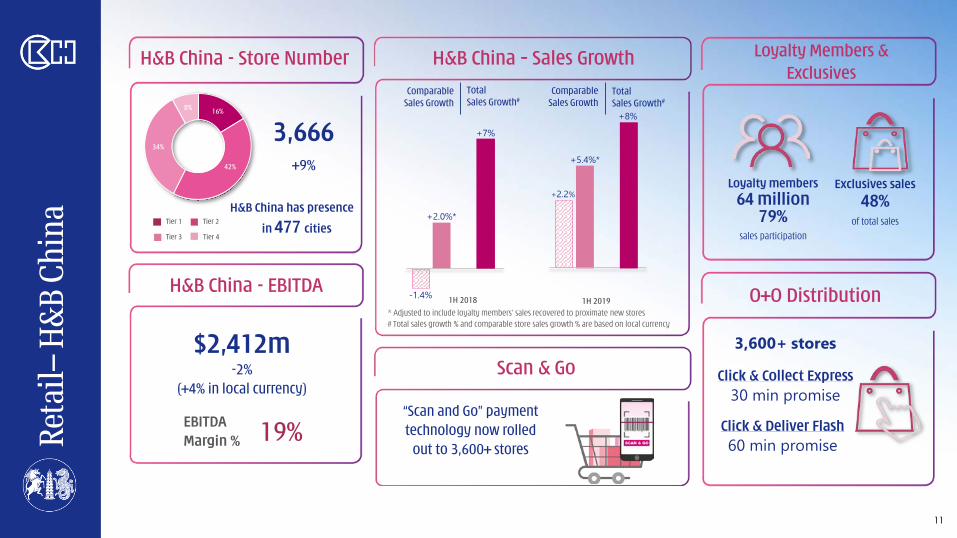
H&B China – Sales GrowthH&B China - Store Number
3,666+9%
H&B China - EBITDA
11
Tier 1 Tier 2
Tier 3 Tier 4
1H 2018 1H 2019* Adjusted to include loyalty members’ sales recovered to proximate new stores# Total sales growth % and comparable store sales growth % are based on local currency
ComparableSales Growth
TotalSales Growth#
Loyalty members
64 million79%
sales participation
Exclusives sales
48% of total sales
ComparableSales Growth
TotalSales Growth#
O+O Distribution
Loyalty Members & Exclusives
$2,412m-2%
(+4% in local currency)
-1.4%
+2.0%*
+7%
+2.2%
+5.4%*
+8%16%
42%
34%
8%
EBITDAMargin % 19%
“Scan and Go” payment technology now rolled
out to 3,600+ stores
Scan & Go
H&B China has presence
in 477 cities
Click & Collect Express30 min promise
Click & Deliver Flash60 min promiseRe
tail–
H&B
Chi
na
3,600+ stores
$5,943mFlat
Earnings Per Share (HK$)
Dividends Per Share (HK$)
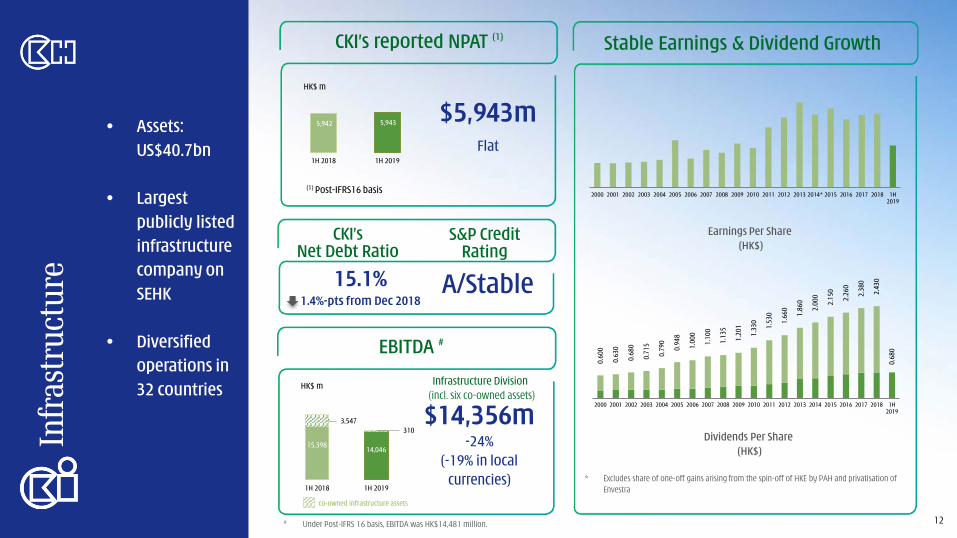
CKI’s reported NPAT (1)
HK$ m
Stable Earnings & Dividend Growth
* Excludes share of one-off gains arising from the spin-off of HKE by PAH and privatisation of Envestra
12
Infra
stru
ctur
e
Infrastructure Division (incl. six co-owned assets)
$14,356m-24%
(-19% in localcurrencies)
HK$ m
EBITDA #
(1) Post-IFRS16 basis
CKI’s Net Debt Ratio
S&P Credit Rating
A/Stable15.1%1.4%-pts from Dec 2018
co-owned infrastructure assets
• Assets: US$40.7bn
• Largest publicly listed infrastructure company on SEHK
• Diversified operations in 32 countries
5,942 5,943
1H 2018 1H 2019
15,398 14,046
3,547310
1H 2018 1H 2019
2000 2001 2002 2003 2004 2005 2006 2007 2008 2009 2010 2011 2012 2013 2014* 2015 2016 2017 2018 1H2019
# Under Post-IFRS 16 basis, EBITDA was HK$14,481 million.
0.68
0
0.60
0
0.63
0
0.68
0
0.71
5
0.79
0
0.94
8
1.00
0
1.10
0
1.13
5
1.20
1
1.33
0
1.53
0
1.66
0
1.86
0
2.00
0
2.15
0
2.26
0
2.38
0
2.43
0
2000 2001 2002 2003 2004 2005 2006 2007 2008 2009 2010 2011 2012 2013 2014 2015 2016 2017 2018 1H2019

C$ m
Ener
gy
13
Thermal-bitumen
Other oil & gas
(1) Post-IFRS 16 Basis
(2) Under Post-IFRS 16 basis, EBITDA was HK$4,839 million.
• Assets: US$8.4bn
• Capture value along the Integrated Corridor businesses
• One of the few publicly-traded North American energy co with significant exposure in the fast-growing energy markets in Asia
696 698
1H 2018 1H 2019
41%
59%
45%55%
276.8 mboe/day-7%
1H 2018297.9
mboe/day
1H 2019276.8
mboe/day
3.32 2.64
53.78
68.82
11.22
21.61
NYMEX natural gas (US$/mmbtu)Brent Crude Oil (US$/bbl)Chicago 3:2:1 crack spread (US$/bbl)
Average benchmark prices2017Q1
2019Q2
Integrated Corridor(approx. 70% contribution)
Upstream (1H 2019)• Production:
223mboe/day
• Netback: C$24/boe
Downstream (1H 2019)• Throughput:
337mboe/day
• Gross margin: C$23/bbl
Thermal & Heavy Oil
• Large supply of low-cost, reliable feedstock
Western Canada
• Supplies gas to Corridor
• Competitive, standalone business
Downstream
• Capture full value for all Corridor production
• Production (1H2019): 54mboe/day
• Operating costs (1H2019): C$17/boe
• Netback (1H2019): C$57/boe
Asia Pacific
• Attractive, long-term contracts
• Fast-growing market
Atlantic
• High-netback production• Global pricing • Production growth
Offshore (approx. 30% contribution)
HK$4,713m-20%
(-17% in local currency)HK$ m
C$698mFlat
Attributable EBITDA to CKHH (2)
5,877 4,713
1H 2018 1H 2019
Net Earnings (1) Production Husky’s Value Chain

Tele
com
mun
icat
ions
-3
Grou
p Eu
rope
Net Customer Service Revenue
$33,245m+16%
(+23% in local currencies)
KPI
Active mobile customers41.7m -7%
12-month trailing Net AMPU€11.17 -11%
Data Usage1,845 pb/ half yr+31%
EBITDA
$16,297m(1)
+27%(+34% in local
currencies)
14
HK$ m
+34% in local currencies
47% 46% 39% 48% 38% 44%40%Margin %
EBITDAChange % (in local currencies)
-8%
+112%
-8%+6%
-7%+4%
+34%
UK Italy Sweden Denmark Austria Ireland 3 GroupEurope
12,797
17,138 16,297
4,824
( 333 )
( 90 )
29
( 121 )
32
( 841 )
1H 2018 UK Italy Sweden Denmark Austria Ireland 1H 2019Underlying
EBITDA
Foreigncurrency
translationimpact
1H 2019EBITDA
(1) Under Post-IFRS 16 basis, EBITDA was HK$19,625 million

Tele
com
mun
icat
ions
-3
Grou
p Eu
rope
15
Results by Operations
Note (1): Group Europe 1H 2019 includes 100% share of Wind Tre’s results, of which fixed line business revenue was €552 million and EBTIDA was €168 million, while 1H 2018 represented 50% share of Wind Tre’s results, of which fixed line business revenue was €290 million andEBITDA was €83 million. For comparability purposes in the Italy section above, 100% Wind Tre results in 1H 2018 have also been presented and the % changes are calculated based on the 100% Wind Tre numbers.
Note (2): Net customer service margin represents net customer service revenue deducting direct variable costs (including interconnection charges and roaming costs).
Note (3): EBITDA margin % represents EBITDA as a % of total revenue excluding handset revenue.
Note (4): 1H 2019 licence cost for Austria represents investment for 10x10 MHz of 3500 MHz spectrum acquired in March 2019 and the licence cost for Denmark represents investment for 2x10 MHz of 700 MHz spectrum and 2x10MHz of 900MHz spectrum acquired in March2019. 1H 2018 licence cost for UK represents investment for 4x5 MHz of 3.4 GHz spectrum acquired in April 2018.
In million
1H 2019 1H 2018
1H 2019
Wind Tre
(100%)
1H 2018Wind Tre
(100%)
1H 2018Wind Tre
(50%)
1H 2019 1H 2018 1H 2019 1H 2018 1H 2019 1H 2018 1H 2019 1H 2018 1H 2019 1H 2018
Total Revenue 1,167 1,186 2,398 2,492 1,246 3,238 3,556 1,054 1,076 425 427 296 290 43,464 36,124
% change -2% -4% -9% -2% - +2% +20%
+27%
- Net Customer Service Revenue 782 807 1,956 2,336 1,168 2,222 2,362 947 927 339 344 222 221 33,245 28,551 % change -3% -16% -6% +2% -1% - +16%
+23%
- Handset Revenue 323 286 201 88 44 913 1,089 49 62 53 51 39 35 6,694 5,410
- Other Revenue 62 93 241 68 34 103 105 58 87 33 32 35 34 3,525 2,163
Net Customer Service Margin(2) 681 699 1,480 1,816 908 1,874 2,002 809 777 294 294 198 195 26,922 23,672
Net Customer Service Margin % 87% 87% 76% 78% 78% 84% 85% 85% 84% 87% 85% 89% 88% 81% 83%
Other margin 40 30 238 62 31 61 54 28 61 14 14 26 23 2,949 1,091
Total margin 721 729 1,718 1,878 939 1,935 2,056 837 838 308 308 224 218 29,871 24,763% change -1% -9% -6% - - +3% +21%
TOTAL CACs (408) (370) (230) (178) (89) (1,166) (1,359) (124) (158) (60) (58) (42) (44) (8,198) (7,268)
Less: Handset Revenue 323 286 201 88 44 913 1,089 49 62 53 51 39 35 6,694 5,410
Total CACs (net of handset revenue) (85) (84) (29) (90) (45) (253) (270) (75) (96) (7) (7) (3) (9) (1,504) (1,858)
Operating Expenses (302) (281) (664) (822) (411) (617) (625) (373) (376) (121) (108) (123) (115) (12,070) (10,108)
Opex as a % of net customer service margin 44% 40% 45% 45% 45% 33% 31% 46% 48% 41% 37% 62% 59% 45% 43%
EBITDA 334 364 1,025 966 483 1,065 1,161 389 366 180 193 98 94 16,297 12,797 % change -8% +6% -8% +6% -7% +4% +27%
+34%
EBITDA margin %(3) 40% 40% 47% 40% 40% 46% 47% 39% 36% 48% 51% 38% 37% 44% 42%
Depreciation & Amortisation (163) (167) (333) (378) (189) (469) (406) (180) (158) (67) (71) (59) (48) (6,327) (5,309)
EBIT 171 197 692 588 294 596 755 209 208 113 122 39 46 9,970 7,488 % change -13% +18% -21% - -7% -15% +33%
+40%
Wind Tre
(100%)Wind Tre
(100%)Wind Tre
(50%)
Capex (excluding licence) (155) (125) (352) (308) (154) (549) (515) (80) (70) (68) (43) (56) (62) (6,320)
EBITDA less Capex 179 239 673 658 329 516 646 309 296 112 150 42 32 9,977
Licence(4) - (165) - - - - - (488) - (52) - - - (1,045)
HK$ equivalents of EBITDA and EBIT are summarised as follows:
EBITDA - pre IFRS 16 basis (HK$) 3,381 3,938 9,093 9,170 4,585 898 1,088 462 466 1,596 1,827 867 893 16,297 12,797
EBITDA - post IFRS 16 basis in 1H 2019 (HK$) 3,772 3,938 11,435 9,170 4,585 1,034 1,088 549 466 1,813 1,827 1,022 893 19,625 12,797
EBIT - pre IFRS 16 basis (HK$) 1,729 2,128 6,142 5,588 2,794 502 708 248 265 1,002 1,155 347 438 9,970 7,488
EBIT - post IFRS 16 basis in 1H 2019 (HK$) 1,798 2,128 6,430 5,588 2,794 516 708 257 265 1,045 1,155 389 438 10,435 7,488
Local currencies growth %
Local currencies growth %
Local currencies growth %
3 Group Europe (1)
EURO HK$
Local currencies growth %
Ireland
GBP SEK DKK EUROEURO
UK Sweden Denmark AustriaItaly (1)

Total Revenue
$4,325m+ 6%
(+10% in local currencies)
KPI
Active mobile customer account45.7m -29% (1)
Data Usage1,392.2 pb/ half yr +54%
HK$ m
$724m(2)
+109%(+118% in local
currencies)
16
EBITDA Change %(in local currencies)
Tele
com
mun
icat
ions
-H
ATEBITDA
+61%
+19%
-118%
Indonesia Vietnam Sri Lanka
346
755 724
394 47
(20) (12) (31)
1H 2018 EBITDA Indonesia Vietnam Sri Lanka Corporatecosts
1H 2019Underlying
EBITDA
Foreigncurrency
translationimpact
1H 2019 EBITDA
HK$ m
+118% in local currencies
(1) Reduction primarily from Indonesia (due to the subscriber registration process imposed by the Government of Indonesia since May 2018).
(2) Under Post-IFRS 16 basis, EBITDA was HK$1,761 million.
64.2 45.7
1H 2018 1H 2019
901.6
1,392.2
1H 2018 1H 2019
Million
Petabyte
4,081 4,325
1H 2018 1H 2019

645
1,039 1,008 190 15
360
(171) (31)
1H 2018EBITDA
Service revenue Variable costs CACs & CRCs Opex &others
1H 2019Underlying
EBITDA
Foreigncurrency
translationimpact
1H 2019EBITDA
KPI
Active mobile customer account30.0m -43% (1)
RGS ARPUUS$3.33 +45%
Data Usage1,214.0 pb/ half yr+46%
HK$ m
3,658
3,734
1H 2018 1H 2019
17
Tele
com
mun
icat
ions
-H
AT –
Indo
nesi
aEBITDA
(1) Reduction primarily due to the subscriber registration process imposed by the Government of Indonesia since May 2018.
(2) MACC (Margin after CACs & CRCs) is defined as revenue less variable costs (i.e. net customer service margin) net of CACs & CRCs.
Total Revenue
$3,734m+2%
(+5% in local currency)$1,008m
+56%(+61% in local
currency)
HK$ m
+61% in local currency
MACC(2) +19%

CK Hutchison Group Telecom Holdings

19

Geographical Footprint Investment-Grade Rating Sizable Tower PortfolioInnovative Platform
- Leading worldwide
operator of mobile telecommunications networks primarily under brand
- 6 European countries + HK &
Macau
- Majority of the contribution from Wind Tre accounted for
54% of CK Hutchison
Group Telecom’s EBITDA in 1H 2019
- Sizable portfolio representing
31% & 28% of
CKHH’s EBITDA & Total Assets respectively
- Refinance independently all Wind
Tre existing €10bn high-yield debt generating in
excess of €100mn
expected annual interest savings
- Investment Grade entity with
provisional ratings from all 3 rating agencies:Fitch: BBB+; Moody’s: Baa1 S&P: A-
- Secured a Full Bridge
Financing
- Net leverage is < 2.5xas at 1H 2019
- Set to emerge as #4 European telecom infrastructure portfolio once the structure is in place
- Interests in 28,500tower assets across 6 European countries
- Operational efficiency in
managing telecom infrastructure assets
- Value transparency in the
current “Tower Co” valuation environment
- IT & network transformationin progress to provide a leading customer experience that is online, multi-channel & real-time
- Established a Central Digital Aggregation Platform to deliver value creation and innovation on a global scale as well as leveraging on partnership ecosystems
- Sufficient 5G spectrum in all
major operations
20The numbers represented 1H 2019 operating results under pre-IFRS 16 basis of CK Hutchison Group Telecom’s operating entities (excludes “corporate and others”) & on a combined basis
Credit RatingMaintain investment
grade rating
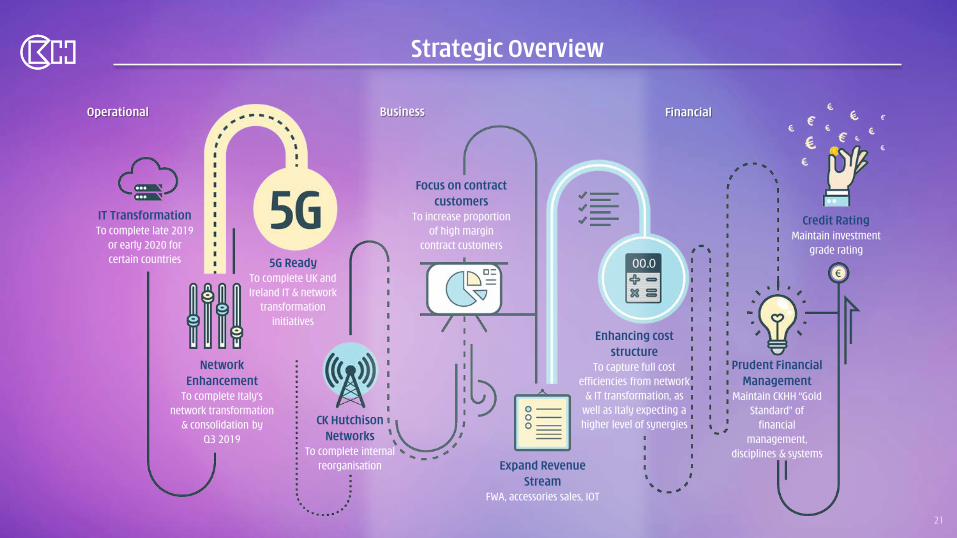
Strategic Overview
IT TransformationTo complete late 2019
or early 2020 for certain countries
Network Enhancement
To complete Italy’s network transformation
& consolidation by Q3 2019
5G ReadyTo complete UK and Ireland IT & network
transformation initiatives
CK Hutchison Networks
To complete internal reorganisation
Focus on contract customers
To increase proportion of high margin
contract customers
Expand Revenue Stream
FWA, accessories sales, IOT
Enhancing cost structure
To capture full cost efficiencies from network
& IT transformation, as well as Italy expecting a higher level of synergies
Prudent Financial Management
Maintain CKHH “Gold Standard” of
financial management,
disciplines & systems
Operational Business Financial
21
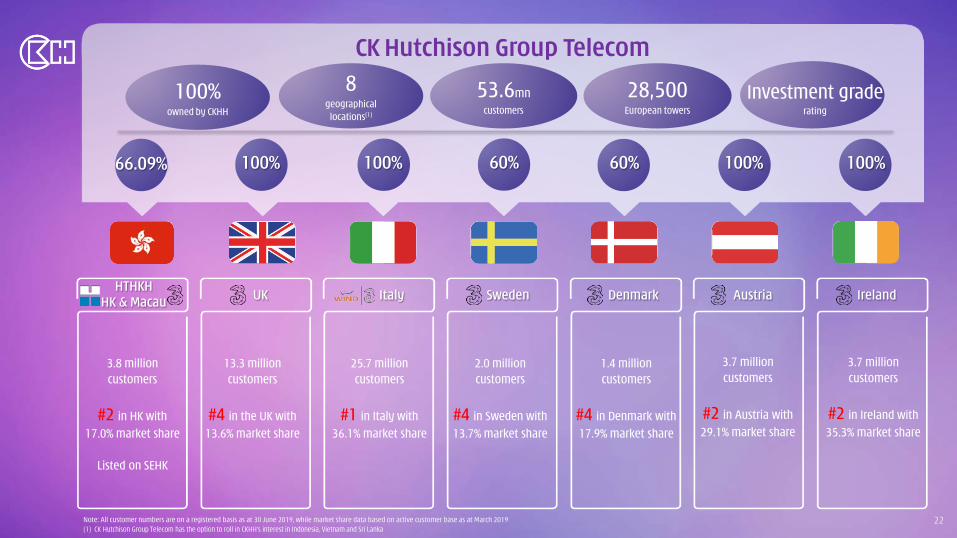
CK Hutchison Group Telecom
HTHKHHK & Macau UK Italy Sweden Denmark Austria Ireland
3.8 millioncustomers
#2 in HK with 17.0% market share
Listed on SEHK
13.3 millioncustomers
#4 in the UK with 13.6% market share
25.7 millioncustomers
#1 in Italy with 36.1% market share
Note: All customer numbers are on a registered basis as at 30 June 2019, while market share data based on active customer base as at March 2019(1) CK Hutchison Group Telecom has the option to roll in CKHH’s interest in Indonesia, Vietnam and Sri Lanka
2.0 millioncustomers
#4 in Sweden with 13.7% market share
1.4 millioncustomers
#4 in Denmark with 17.9% market share
3.7 millioncustomers
#2 in Austria with 29.1% market share
3.7 millioncustomers
#2 in Ireland with 35.3% market share
66.09% 100% 100% 60% 60% 100% 100%
8 geographical
locations(1)
53.6mncustomers
28,500European towers
Investment graderating
100%owned by CKHH
22

Total Asset (HK$345.0bn)
CK Hutchison Group Telecom
Total Revenue (HK$46.0bn)
Total EBITDA (HK$17.0bn) Total CAPEX (HK$7.5bn)
The numbers represented 1H 2019 operating results under pre-IFRS 16 basis of CK Hutchison Group Telecom’s operating entities (excludes “corporate and others”) & on a combined basis23
70% of CKHH
21% of CKHH28% of CKHH
31% of CKHH

CK Hutchison Group Telecom Holdings preliminary Revenue, EBITDA and EBIT for 1H 2019
# The preliminary unaudited combined results of CK Hutchison Group Telecom (“CK Hutchison Telecom”) for the six months ended 30 June 2019 is solely for illustrative purposes only and assuming that the internal reorganisation to include the Group’s interests in 3 Group Europe telecommunication operations and HTHKH to form CK Hutchison Telecom has happened immediately prior to 1 January 2019. The preliminary Revenue, EBITDA and EBIT were compiled by combining the Group’s share of first half 2019 actual results of the seven telecommunication operations, as well as adjusted for an allocated corporate costs of the Group and other consolidation adjustments, where applicable. These preliminary unaudited combined results are still subject to further allocation or consolidation adjustments and may not give a full picture of the actual combined results of CK Hutchison Telecom for the six months ended 30 June 2019.
Preliminary Pre-IFRS 16combined unaudited results
for the six monthsended 30 June 2019
HK$ billion
#
%
Revenue
UK 11.8 26%
Italy 21.3 46%
Sweden 2.7 6%
Denmark 1.3 3%
Austria 3.8 8%
Ireland 2.6 6%
HTHKH 2.5 5%
Corporate Costs and Others 0.2 —
Total Revenue 46.2 100%
Preliminary Pre-IFRS 16combined unaudited results
for the six monthsended 30 June 2019
HK$ billion
#
%
EBITDA
UK 3.4 20%
Italy 9.1 53%
Sweden 0.9 5%
Denmark 0.4 2%
Austria 1.6 10%
Ireland 0.9 5%
HTHKH 0.7 4%
Corporate Costs and Others 0.1 1%
Total EBITDA 17.1 100%
Preliminary Pre-IFRS 16combined unaudited results
for the six monthsended 30 June 2019
HK$ billion
#
%
EBIT
UK 1.7 16%
Italy 6.1 59%
Sweden 0.5 5%
Denmark 0.3 3%
Austria 1.0 9%
Ireland 0.4 4%
HTHKH 0.3 3%
Corporate Costs and Others 0.1 1%
Total EBIT 10.4 100%
24

CK Hutchison Networks
25

CK Hutchison Networks – A Leading Telecom Infrastructure Company
28.5k sites across Europe, with the option to include a further 9.3k sites in Asia
Tenancy ratio of 1.2x across 6 markets in Europe with further room to grow
Set to emerge as the 4th largest Tower Co in Europe
Specialised management team, focused on optimising the asset portfolio; achieving
cost synergies and maximising returns on invested capital
A wholly owned subsidiary of CK Hutchison Group Telecom anchored by Three
Optionality for other passive infrastructure requirements of CKHH Telecom operations in 5G and
future deployments
CK Hutchison Networks
26

Telecom Infrastructure Reorganisation Structure
CK Hutchison Group Telecom
HTHKH UKItaly
Sweden Denmark Austria Ireland
Mobile
Telecom Infra.
CKHH
Mobile
Telecom Infra. (1)
Mobile/ Fixed Line
Telecom Infra.
Mobile
Telecom Infra. (2)
Mobile
Telecom Infra.
Mobile/ Fixed Line
Telecom Infra.
Mobile
Telecom Infra.
CK Hutchison Group Telecom
CKHH
CK Hutchison Networks
Telecom Infrastructure
Direct Interest or EBA (3)
GroupHTHKH
Mobile/ Fixed Line
Provision of Tower Co
Services to 3 Group Europe
Pre CK Hutchison Networks Reorganisation
66.09% 100% 100% 60% 60% 100% 100%
100% 100%
66.09% 100% / 60% 100%
Post CK Hutchison Networks Reorganisation
Mobile
Telecom Infra.
Note:(1) Telecom Infrastructure of approx. 7,300 sites, primarily managed by the 50:50 joint venture with EE(2) Includes Telecom Infrastructure sites held through a 50:50 joint venture with Telenor(3) EBA represents the economic benefit arrangements over Telecom Infrastructure in certain countries where physical transfers of the Telecom Infrastructure interests remain
pending, or cannot be effected due to joint venture arrangements or other third parties’ rights 27

Panel Antennas
Microwave Antennas
Feeders and Connectors
Telecom Equipment
Tower / Mast
Physical Site
Batteries1
Rack / Shelter
Cooling1
Fence
Generator1
Power Grid1
Scope of Tower Infrastructure to be Included
The below diagram illustrates which assets will be transferred to or included in CK Hutchison Networks and which assets will remain with the MNO operations
Illustrative Tower / Mast SiteScope of Services Performed by
CK Hutchison Networks
CK Hutchison Networks Network Operator A Network Operator BKey:
Note 1: On a country by country basis, these assets may be excluded from the perimeter of CK Hutchison Networks
• Provision of space on the site
• Site access management
• Related utilities / energy and power supply
• Operations and management for site infrastructure
• Site planning, design and construction management
28

Global Telecom Infrastructure Portfolio
Sites and Tenancy Ratios by Country
Note:(1) Telecom Infrastructure of approx. 7,300 sites, primarily managed by the 50:50 joint venture with EE(2) Includes Telecom Infrastructure sites held through a 50:50 joint venture with Telenor(3) Represents 3 Sweden’s tenancy ratio(4) Tenancy ratio refers to average number of tenants / MNO’s per site(5) Asian regions include Hong Kong/Macau, Indonesia, Vietnam and Sri Lanka
Potential to add 9.3k sites across Asia (5)7,300 (1)
N/A
6,200 (2)
(1.3x) (3,4)
8,100 (1.2x) (4)
29
1,200 (1.1x) (4)
1,100 (1.2x) (4)
4,600 (1.2x) (4)

51
37
30 29
22
18
CK Hutchison Networks will Hold One of the Largest Portfolios in Europe
Note:(1) TowerCo (Vodafone) site count based on 2020 Q1 results presentation; Cellnex and Inwit site count based on 2019 Q2 results presentation; Deutsche Funkturm site count based on Deutsche Telekom 2019 Q1 results presentation; Telxius site count based on Telefonica 2019 Q2 results presentation(2) CK Hutchison Networks site count includes European sites only (includes sites managed / owned by JV interests in the UK / Sweden)(3) TowerCo (Vodafone) site count excludes 11k sites acquired by Inwit and Inwit site count includes 11k sites acquired from Vodafone(4) Based on European tower transactions from 2016 to 2019 with site count over 1,000; Value per site based on 100% transaction value and the total number of sites(5) Lease rate implied based on company disclosure of EUR140mm revenue for 7,416 rural/suburban sites and EUR113mm revenue for 4,103 urban sites
(000 sites)1Ce
llnex
Deut
sche
Fun
ktur
m
CK H
utch
ison
Netw
orks
2
Inw
it3
Telx
ius
Tow
erCo
(Vod
afon
e) 3
Next 15 largest TowerCos in Europe
ILLUSTRATIVE LEASE RATE / SITE 5
UrbanEUR27.5k p.a.
Rural/SuburbanEUR18.9k p.a.
(2015)
IMPLIED VALUE / SITE
ILLUSTRATIVE TOWER PORTFOLIO TRANSACTIONS 4
Low EndEUR180k / Site
EUR350k / SiteHigh End
AverageEUR250k / Site
SELECT TRANSACTIONS
30

Key Project Timeline
31

Aug 2019 Deal
Announcement & CK Hutchison
Group Telecom formed
Q3 2019 CK Hutchison
Group Telecom Draw on bridge loan to refinance Wind Tre
€10bn debt
Q3 – Q4 2019 CK Hutchison
Group TelecomReorganise tower assets / interests internally into CK
Hutchison Networks
End of 2019 or early 2020
CK Hutchison Group Telecom
Complete the reorganisation of
CK Hutchison Networks
Post Q2 2019 to Q4 2020
CK Hutchison Group Telecom
Refinance bridge loan with a combination of
bonds / bank loans
Q3 2019 Wind Tre
Completion of network & IT
transformation
Q4 2019 –early 2020
UK & IrelandCompletion of IT & network
transformation & continuation of 5G rollout
2020Scandinavia, Austria & HK
Small Remaining 5G spectrum
auctions
Key Strategic Focus
Operations Milestones
CK Hutchison Group Telecom
Milestones
32

Q &
A


1
CK Hutchison Holdings Limited
2019 Interim Report
Analyses of Core Business Segments by Geographical Location
Total Revenue for the six months ended 30 June 2019
HK$217,062 million
Total EBITDA for the six months ended 30 June 2019 HK$53,988 million
Total EBIT for the six months ended 30 June 2019 HK$34,238 million
* Represents contributions from Finance & Investments and Others # Includes Panama, Mexico and the Middle East
r Includes contribution from the USA for Husky Energy
Europe HK$104,206 million
Asia, Australia & Others # HK$33,344 million
Hong Kong HK$19,564 million
Mainland China HK$19,488 million
Canada r HK$23,503 million
5% 95%
37% 23% 13%27%
75% 7% 12%6%
9% 78% 6% 6% 1%
42%14%39%5%
Europe HK$29,679 million
Asia, Australia & Others # HK$10,342 million
Hong Kong HK$1,571 million
Mainland China HK$5,584 million
Canada r HK$4,209 million
15% 85%
13% 42% 7%36%
23% 15% 39%23%
15% 58% 10% 17%
55%29%11%5%
Europe HK$19,581 million
Asia, Australia & Others # HK$7,035 million
Hong Kong HK$509 million
Mainland China HK$4,405 million
Canada r HK$1,444 million
25% 75%
16% 42% 4%37%
33% 8% 47%12%
13% 64% 10% 13%
51%31%13%5%
2%
1%
Ports & Related Services Retail Infrastructure Energy
Telecommunications Finance & Investments and Others
12%
38%
23%
9%
4%* 12%
15%
29%
19%31%
8%*
5%* 12%
8%
11%
Hong Kong
9%
Asia, Australia & Others #
15%
Canada r11%
Europe
48%(UK: 16%)
Mainland China
9%
Hong Kong
3%
Asia, Australia & Others #
19%
Canada r8%
Europe
55%(UK: 22%)
Mainland China
10%
Hong Kong
1%
Asia, Australia & Others #
21%
Canadar 4%
4%*
Europe
57%(UK: 22%)
Mainland China
13%
27%
32%
5%
5%*
8%*
CKHH 2019 Interim Results Appendix
Page 1 of 15

CK Hutchison Holdings Limited
2015 Interim Report
8
CK Hutchison Holdings Limited
2019 Interim Report
Operations Highlights
Ports and Related Services
30 June 2019 30June2018 LocalcurrenciesHK$ million HK$million Change change
TotalRevenue(1) 17,550 17,591 — +5%
EBITDA(1)(4) 6,450 6,205 +4% +8%
EBIT(1)(4) 4,250 3,864 +10% +14%
Throughput(millionTEU) 42.1 40.6 +4%
Throughput (million TEU) Number of Berths (3)
30 June2019
30June2018 Change
30 June 2019
31December2018 Change
HPHTrust 11.3 11.4 -1% 52 52 —
MainlandChinaandotherHongKong 6.5 6.7 -2% 42 42 —
Europe 8.2 7.6 +8% 61 61 —
Asia,Australiaandothers(2) 16.1 14.9 +8% 133 133 —
Total 42.1 40.6 +4% 288 288 —
Total Revenue (1) Total EBITDA (1) (4)
HK$million30 June
201930June
2018 Change
Localcurrencies
change30 June
201930June
2018 Change
Localcurrencies
change
HPHTrust 1,248 1,290 -3% -3% 645 648 — —
MainlandChinaandotherHongKong 1,183 1,282 -8% -2% 506 635 -20% -16%
Europe 5,603 5,648 -1% +6% 1,538 1,627 -5% +1%
Asia,Australiaandothers(2) 8,939 8,799 +2% +7% 3,149 3,032 +4% +7%
Corporatecosts&otherrelatedservices 577 572 +1% +1% 612 263 +133% +133%
Total 17,550 17,591 — +5% 6,450 6,205 +4% +8%
Note1: TotalRevenue,EBITDAandEBIThavebeenadjustedtoexcludenon-controllinginterests’shareofresultsofHPHTrust.
Note2: Asia,AustraliaandOthersincludesPanama,MexicoandMiddleEast.
Note3: Basedon300metresperberthandiscomputedbydividingthetotalberthlengthby300metres.
Note4:UnderPost-IFRS16basis,EBITDAwasHK$7,766million;EBITwasHK$4,826million.
CKHH 2019 Interim Results Appendix
Page 2 of 15

CK Hutchison Holdings Limited
2015 Interim Report
9
CK Hutchison Holdings Limited
2019 Interim Report
Throughputincreasedby4%to42.1millionTEUinthefirsthalfof2019,with65%and35%localandtranshipmentvolumerespectively(1H2018:same).
ThroughputimprovementsprimarilycomingfromKlanginMalaysiaduetostrongtranshipmentvolumecontributedbyexport growth in Intra-AsiaandEurope, Europe regions (BarcelonaandRotterdamdue tonewcustomersandorganicgrowth),YantianduetogrowthinemptyandtranshipmentcargoesandFreeportinBahamasduetorecoveryofhandlingcapacity from hurricane damage. Although volume has improved, revenue for the firsthalfof2019wereadverselyaffectedbyexchangetranslationimpactwithtotalrevenuebeingflatagainstthesameperiodlastyear.Inlocalcurrencies,revenue increased5%,drivenprimarilybyvolume improvementsmentionedabove.EBITDAandEBIT increased4%and10%respectively in reportedcurrencyagainst thesameperiod lastyear. In localcurrencies,EBITDAandEBIT increased8%and14%respectively,mainlyduetohigherrevenueasmentionedabove,continuedcostmanagementandefficiencyenhancements,andlowerdepreciationatDammamuponconcessionextension,partlyoffsetbyweakerperformanceinShanghaiandPanamafromintensecompetition.
CKHH 2019 Interim Results Appendix
Page 3 of 15

CK Hutchison Holdings Limited
2015 Interim Report
10
CK Hutchison Holdings Limited
2019 Interim Report
Retail
30 June 2019 30June2018 LocalcurrenciesHK$ million HK$million Change change
TotalRevenue 83,161 83,874 -1% +4%
EBITDA(5) 8,182 7,532 +9% +14%
EBIT(5) 6,590 5,992 +10% +15%
StoreNumbers 15,213 14,432 +5%
Net Store Comparable StoresStore Numbers Additions Sales Growth (%) (6)
30 June 30June 30 June 30 June 30June2019 2018 Change 2019 2019 2018
H&BChina 3,666 3,377 +9% 289 +2.2% +5.4 (7) -1.4% +2.0%(7)
H&BAsia 3,221 2,951 +9% 270 +6.9% +7.4%
H&B China & Asia Subtotal 6,887 6,328 +9% 559 +4.7% +3.3%
H&BWesternEurope 5,551 5,413 +3% 138 +1.6% +1.5%
H&BEasternEurope 2,303 2,236 +3% 67 +3.1% +2.5%
H&B Europe Subtotal 7,854 7,649 +3% 205 +1.9% +1.6%
H&B Subtotal 14,741 13,977 +5% 764 +2.9% +2.3%
OtherRetail(8) 472 455 +4% 17 -7.3% +4.5%
Total Retail 15,213 14,432 +5% 781 +1.5% +2.6%
Note5: UnderPost-IFRS16basis,EBITDAwasHK$13,065million;EBITwasHK$6,994million.
Note6: Comparablestoressalesgrowthrepresentsthepercentagechangeinrevenuecontributedbystoreswhich,asatthefirstdayoftherelevantfinancialyear(a)havebeenoperatingforover12monthsand(b)havenotundergonemajorresizingwithintheprevious12months.
Note7: Adjustedtoincludeloyaltymembers’salesrecoveredinproximatenewstores.
Note8: OtherRetailincludesPARKnSHOP,Fortress,Watson’sWineandmanufacturingoperationsforwaterandbeveragebusinesses.
EBITDAandEBITwere9%and10%higherthanfirsthalfof2018respectivelyinreportedcurrency.Excludingtheadverseexchangetranslationimpact,EBITDAandEBITgrowthwere14%and15%respectively.Includedinthefirsthalfof2019wasaone-offdilutiongainofapproximatelyHK$633millionfromtheformationofthejointventureofthesupermarketbusinessinGuangdong.Underlyingperformancesremainedstrong,drivenbya5%increaseinstoreportfolioanda1.5%comparablestoressalesgrowth.
CKHH 2019 Interim Results Appendix
Page 4 of 15

CK Hutchison Holdings Limited
2015 Interim Report
11
CK Hutchison Holdings Limited
2019 Interim Report
Total Revenue Total EBITDA (5)
Local Local30 June 30June currencies 30 June EBITDA 30June EBITDA currencies
HK$million 2019 % 2018 % Change change 2019 % Margin 2018 % Margin Change change
H&BChina 12,512 15% 12,353 15% +1% +8% 2,412 29% 19% 2,470 33% 20% -2% +4%
H&BAsia 15,700 19% 14,363 17% +9% +13% 1,502 18% 10% 1,332 18% 9% +13% +15%
H&B China & Asia Subtotal 28,212 34% 26,716 32% +6% +10% 3,914 47% 14% 3,802 51% 14% +3% +8%
H&BWesternEurope 32,819 39% 33,685 40% -3% +4% 2,255 28% 7% 2,259 30% 7% — +6%
H&BEasternEurope 8,026 10% 8,073 10% -1% +7% 984 12% 12% 1,043 14% 13% -6% +2%
H&B Europe Subtotal 40,845 49% 41,758 50% -2% +5% 3,239 40% 8% 3,302 44% 8% -2% +5%
H&B Subtotal 69,057 83% 68,474 82% +1% +7% 7,153 87% 10% 7,104 95% 10% +1% +6%
OtherRetail(8)andothers 14,104 17% 15,400 18% -8% -8% 1,029 13% 7% 428 5% 3% +140% +140%
Total Retail 83,161 100% 83,874 100% -1% +4% 8,182 100% 9% 7,532 100% 9% +9% +14%
Health & Beauty Loyalty members’ participation & Exclusives sales contribution 30 June 2019 30June2018
TotalloyaltymembersinHealth&Beautydivision(million) 135 130
Loyaltymembers’saleparticipation(%) 63% 62%
ExclusivessalescontributiontototalH&Bsales(%) 34% 34%
TheoverallHealthandBeautysubdivision,whichrepresents87%ofthedivision’sEBITDA,reportedarevenueandEBITDAgrowthof7%and6%respectivelyinlocalcurrencies,mainlydrivenbya5%increaseinnumberofstoresto14,741storesasat30June2019anda2.9%comparablestoresalesgrowth.
Comparable stores salesgrowth remainedhealthyoverallat2.9%with stronggrowth inHealthandBeautyAsiaandencouragingimprovementinHealthandBeautyChina.Withtheon-goingintegrationoftheonlineandofflineplatformsandenhancedoperationalstrategies,HealthandBeautyChinareportedapositive2.2%comparablestoressalesgrowthforfirsthalfof2019.TakingintoaccounttheCRMsalesrecovery,thecomparablestoressalesgrowthwas5.4%.Despitegenerallylowerconsumersentiment,HealthandBeautyEuropeoverallreportedarobustcomparablestoressalesgrowthrateof1.9%primarilyfromtheUK,PolandandGermany.
The Health and Beauty subdivision opened 411 new stores during the first half of 2019, of which 62% were in theMainlandandcertainAsiancountries.Thequalityofnewstoreopeningremainshighwithanaveragenewstorecashpaybackperiodlessthan13months.ThedivisionopeneditsfirstflagshipstoreinHoChiMinhCity,Vietnam,whichisthe25thoperatingmarketofthedivisioninJanuary2019.
CKHH 2019 Interim Results Appendix
Page 5 of 15

CK Hutchison Holdings Limited
2015 Interim Report
12
CK Hutchison Holdings Limited
2019 Interim Report
Infrastructure
30 June 2019 30June2018 Localcurrencies HK$ million HK$million Change change
Total Revenue (9) 25,625 34,225 -25% -21% –CKI 24,945 27,416 -9% -4% –Co-ownedinfrastructureassets 680 6,809 -90% -89%
EBITDA(9) (10) 14,356 18,945 -24% -19% –CKI 14,046 15,398 -9% -2% –Co-ownedinfrastructureassets 310 3,547 -91% -91%
EBIT (9) (10) 9,901 13,242 -25% -20% –CKI 9,703 10,904 -11% -5% –Co-ownedinfrastructureassets 198 2,338 -92% -91%
CKI Reported Net Profit (under Post-IFRS 16 basis) 5,943 5,942 —
TheinfrastructuredivisioncomprisestheGroup’s75.67%(11)interestinCKInfrastructureHoldingsLimited(“CKI”)andtheGroup’sadditionalinterestsinsixco-ownedinfrastructureassets.
CKI
CKIisthelargestpubliclylistedinfrastructurecompanyontheSEHK,withdiversifiedinvestmentsinenergy,transportationand water infrastructure, waste management, waste-to-energy, household infrastructure and infrastructure-relatedbusinesses.CKIoperatesinHongKong,theMainland,theUK,ContinentalEurope,Australia,NewZealandandCanada.CKIannouncedprofitattributabletoshareholdersunderPost-IFRS16basisofHK$5,943millioninthefirsthalfof2019,flatagainstthesameperiodlastyear.Ifexchangecurrencymovementsontranslationareremoved,netprofitattributabletoshareholders increased6%.TheGroup’sshareofCKI’sEBITDAandEBITofHK$14,046millionandHK$9,703millionrespectivelywere9%and11%lowerthanthesameperiodlastyearinreportedcurrency,mainlyduetoadverseforeigncurrency translation impacts, lower contribution from UK Power Networks and the loss on partial disposal of 2.05%interestinPowerAssets(“PAH”)ofHK$302million.
CKIhasalwaysbeencommittedtoprudentfinancialmanagementandtheriskmanagementapproachisconservativewiththeunderlyingfinancialpositioncloselymonitored.CKI’sfinancialstrengthcontinuestoberobust,withmorethanHK$8billioncashonhandandanetdebttototalcapitalratioof15.1%asat30June2019.FollowingthecreditratingupgradebyStandard&Poor’sfrom“A-/Positive”to“A/Stable”inSeptemberlastyear,the“A/Stable”ratingwasreaffirmedinJune2019.
Co-owned infrastructure assets
Thelowercontributionfromtheco-ownedinfrastructureassetsinthefirsthalfof2019reflectedthefullsixmonthseffectonthedivestureofanaggregated90%economicbenefitsintheGroup’sdirectinterestinthesixco-ownedinfrastructureassetsundertheEconomicBenefitsagreementsenteredwithCKAssetHoldingsLimited,CKIandPAHinOctober2018.
Note9: Totalrevenue,EBITDAandEBITreflecttheGroup’sshareofresultsontheremaining10%directinterestintheco-ownedinfrastructureassetswithCKIafterthedivestmentof90%ofthedirecteconomicbenefitsinOctober2018.
Note10: UnderPost-IFRS16basis,EBITDAforCKIwasHK$14,171millionandco-ownedinfrastructureassetswasHK$310million;EBITforCKIwasHK$9,721millionandco-ownedinfrastructureassetswasHK$198million.
Note11:InJanuary2015,CKIcompletedashareplacementandsharesubscriptiontransactionthatresultedintheGroup’sinterestinCKIreducingfrom78.16%to75.67%.On1March2016,CKIissuednewsharesinconnectionwithanissueofperpetualcapitalsecurities.Subsequenttothistransaction,theGroupholdsa71.93%interest.Asthesenewsharesaredisregardedforthepurposeofdeterminingthenumberofsharesheldbythepublic,theGroup’sprofitsharinginCKIcontinuestobe75.67%.
CKHH 2019 Interim Results Appendix
Page 6 of 15

CK Hutchison Holdings Limited
2015 Interim Report
13
CK Hutchison Holdings Limited
2019 Interim Report
Husky Energy
30 June 2019 30June2018 LocalcurrencyHK$ million HK$million Change change
TotalRevenue 23,465 27,315 -14% -11%
EBITDA(12) 4,713 5,877 -20% -17%
EBIT(12) 1,787 2,761 -35% -32%
Production(mboe/day) 276.8 297.9 -7%
Husky’sreportednetearnings(13)(C$million) 698 696 —
Note12: UnderPost-IFRS16basis,EBITDAwasHK$4,839million;EBITwasHK$1,803million.
Note13:Netearningsforthesixmonthsended30June2019areunderPost-IFRS16basis,whereasnetearningsforthesixmonthsended30June2018areunderPre-IFRS16basis.
HuskyEnergy(“Husky”)Post-IFRS16netearningsofC$698millioninthefirsthalfof2019wasflatwhencomparedtonetearningsofC$696millioninthesameperiodlastyear,primarilydueto:
- HigherrealisedUpstreamcrudeoilpricingduetonarrowingoftheCanadianlight/heavyoildifferential,
- One-timetaxrecoveriesrelatedtothereductionintheAlbertaprovincialcorporatetaxrateinthefirsthalfof2019;
fullyoffsetby:
- Lower earnings from Upstream operations due to lower production and lower global crude oil commoditybenchmarkprices,
- LowerearningsfromcrudeoilmarketingactivitiesduetothetighteningoflocationpricingdifferentialsbetweenCanadaandtheUS,
- LowerrealisedUpgradingmargins,
- LowerearningsfromtheCanadianandUSRefiningoperationsduetotheturnaroundsinfirsthalfof2019,and
- Certainone-timewrite-offsandprovisionsrecognisedinthefirsthalfof2019.
AftertranslationintoHongKongdollarsandincludingconsolidationadjustmentsbasedonPre-IFRS16,theGroup’sshareofEBITDAandEBITwereHK$4,713millionandHK$1,787millionrespectively,adecreaseof20%and35%respectivelyinreportedcurrencyor17%and32%respectivelyinlocalcurrencyagainstthefirsthalfof2018,drivenbythereasonsmentionedaboveaffectingthepre-taxearnings.
CashflowfromoperatingactivitieswasC$1,305millionforthefirsthalfof2019comparedtoC$1,538millionforthefirsthalfof2018,withthedecreaseprimarilyattributedtolowernetearningsfromUpstreamoperationsandCanadianandUSRefiningoperationsasmentionedabove.
Huskyreporteda7%decreaseofaverageproductioninthefirsthalfof2019,from297,900barrelsofoilequivalentperday(“boe/day”)infirsthalfof2018to276,800boe/dayinfirsthalfof2019.
CKHH 2019 Interim Results Appendix
Page 7 of 15
CK Hutchison Holdings Limited
2015 Interim Report
14
CK Hutchison Holdings Limited
2019 Interim Report
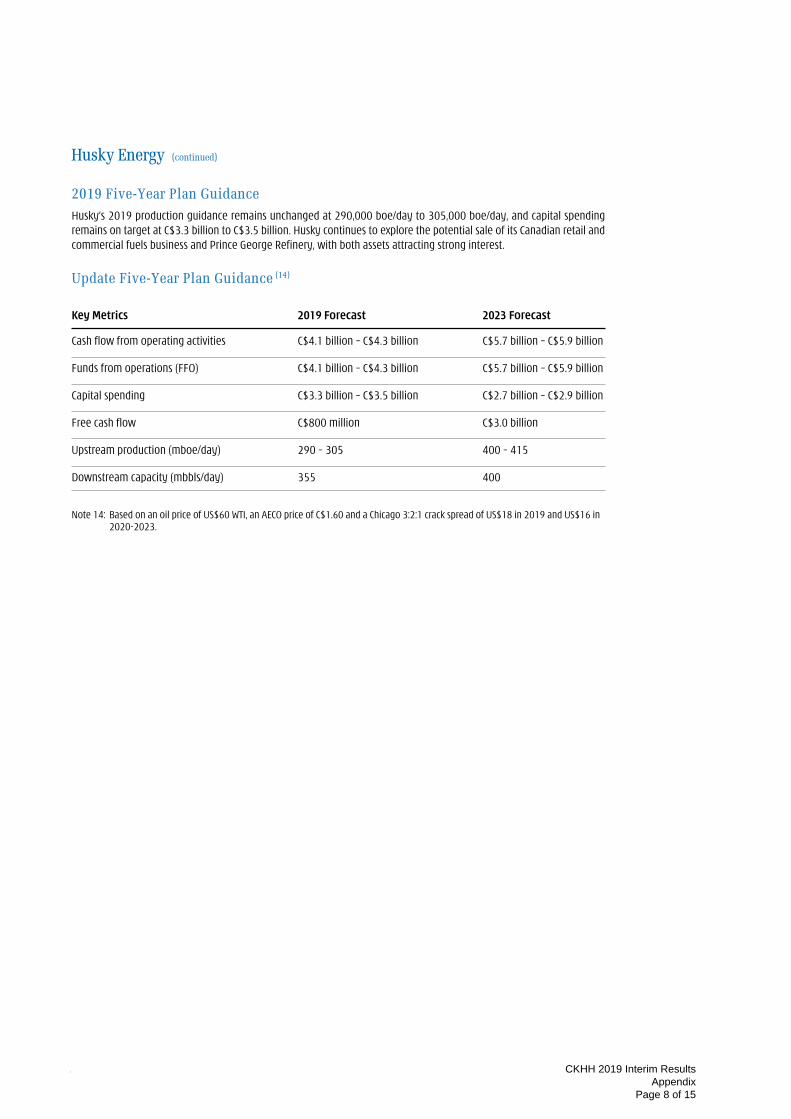
2019 Five-Year Plan Guidance
Husky’s2019productionguidanceremainsunchangedat290,000boe/dayto305,000boe/day,andcapitalspendingremainsontargetatC$3.3billiontoC$3.5billion.HuskycontinuestoexplorethepotentialsaleofitsCanadianretailandcommercialfuelsbusinessandPrinceGeorgeRefinery,withbothassetsattractingstronginterest.
Update Five-Year Plan Guidance (14)
Key Metrics 2019 Forecast 2023 Forecast
Cashflowfromoperatingactivities C$4.1billion–C$4.3billion C$5.7billion–C$5.9billion
Fundsfromoperations(FFO) C$4.1billion–C$4.3billion C$5.7billion–C$5.9billion
Capitalspending C$3.3billion–C$3.5billion C$2.7billion–C$2.9billion
Freecashflow C$800million C$3.0billion
Upstreamproduction(mboe/day) 290–305 400–415
Downstreamcapacity(mbbls/day) 355 400
Note14:BasedonanoilpriceofUS$60WTI,anAECOpriceofC$1.60andaChicago3:2:1crackspreadofUS$18in2019andUS$16in2020-2023.
Husky Energy (continued)
CKHH 2019 Interim Results Appendix
Page 8 of 15

CK Hutchison Holdings Limited
2015 Interim Report
15
CK Hutchison Holdings Limited
2019 Interim Report
3 Group Europe
30 June 2019 30June2018 Localcurrencies HK$ million HK$million Change change
Total Revenue 43,464 36,124 +20% +27% –Netcustomerservicerevenue 33,245 28,551 +16% +23%
–Handsetrevenue 6,694 5,410 +24%
–Otherrevenue 3,525 2,163 +63%
Netcustomerservicemargin(15) 26,922 23,672 +14% Net customer service margin % 81% 83%
Othermargin 2,949 1,091 +170%
Totalmargin 29,871 24,763 +21% TotalCACs (8,198) (7,268) -13%
Less:Handsetrevenue 6,694 5,410 +24%
TotalCACs(netofhandsetrevenue) (1,504) (1,858) +19%
Operatingexpenses (12,070) (10,108) -19% Opex as a % of Net customer service margin 45% 43%
EBITDA (17) 16,297 12,797 +27% +34% EBITDA margin % (16) 44% 42%
Depreciation&Amortisation (6,327) (5,309) -19%
EBIT (17) 9,970 7,488 +33% +40%
Note15: Netcustomerservicemarginrepresentsnetcustomerservicerevenuedeductingdirectvariablecosts(includinginterconnectionchargesandroamingcosts).
Note16: EBITDAmargin%representsEBITDAasapercentageoftotalrevenue(excludinghandsetrevenue).
Note17:UnderPost-IFRS16basis,EBITDAwasHK$19,625million;EBITwasHK$10,435million.
CKHH 2019 Interim Results Appendix
Page 9 of 15

CK Hutchison Holdings Limited
2015 Interim Report
16
CK Hutchison Holdings Limited
2015 Interim Report
17
CK Hutchison Holdings Limited
2019 Interim Report
CK Hutchison Holdings Limited
2019 Interim Report
UK Italy (22) Sweden Denmark Austria Ireland 3 Group Europe
1H 2019 1H 2018 1H 2019 1H 2018 1H 2019 1H 2018 1H 2019 1H 2018 1H 2019 1H 2018 1H 2019 1H 2018 1H 2019 1H 2018
Total registered customer base (million) 13.3 13.0 25.7 28.6 2.0 2.0 1.4 1.3 3.7 3.6 3.7 3.4 49.9 51.9
Total active customer base (million) 10.2 10.1 22.9 26.2 2.0 1.9 1.4 1.3 2.9 2.9 2.3 2.1 41.7 44.6
Contract customers as a % of the total registered customer base 53% 54% 42% 26% 72% 78% 59% 60% 70% 69% 38% 38% 49% 40%
Contract customers’ contribution to the net customer service margin (%) (23) 88% 88% 50% 33% 86% 91% 71% 72% 92% 92% 64% 63% 69% 68%
Average monthly churn rate of the total contract registered customer base (%) 1.2% 1.2% 1.5% 1.9% 1.6% 1.9% 1.8% 2.0% 0.2% 0.2% 1.0% 1.0% 1.3% 1.4%
Active contract customers as a % of the total contract registered customer base 99% 98% 93% 93% 100% 100% 100% 100% 100% 100% 99% 98% 96% 97%
Active customers as a % of the total registered customer base 77% 78% 89% 92% 97% 96% 97% 97% 80% 80% 61% 63% 83% 86%
LTE coverage by population (%) 94% 94% 99% 97% 87% 84% 99% 96% 98% 98% (24) 98% 97% — —
Six month data usage per active customer (Gigabyte) 46.0 33.1
Note 23: 3 Group Europe 1H 2019 contract customers’ contribution to net customer service margin was calculated based on 100% contribution from Wind Tre, whereas 1H 2018 was calculated based on 50% contribution from Wind Tre.
Note 24: 1H 2018 LTE coverage by population for Austria is restated to conform with current year presentation.
Note 22: Italy KBIs were calculated based on 100% of Wind Tre’s figures. The contract customer base of Wind and corresponding KBIs have been adjusted in 2019 to conform with the definition of 3, the comparative KBIs have not been restated due to limitations of the data tracking system.
Note 18: 3 Group Europe 1H 2019 includes 100% share of Wind Tre’s results, of which fixed line business revenue was €552 million and EBITDA was €168 million, while 1H 2018 represented 50% share of Wind Tre’s results, of which fixed line business revenue was €290 million and EBITDA was €83 million. For comparability purposes in the Italy section above, 100% Wind Tre results in 1H 2018 have also been presented and the % changes are calculated based on the 100% Wind Tre numbers.
Note 19: Net customer service margin represents net customer service revenue deducting direct variable costs (including interconnection charges and roaming costs).
3 Group Europe - Results by operations
In millionUKGBP
Italy (18)
EUROSweden
SEKDenmark
DKKAustria
EUROIreland
EURO3 Group Europe (18)
HK$
1H 2019 1H 20181H 2019
Wind Tre(100%)
1H 2018 Wind Tre
(100%)
1H 2018 Wind Tre
(50%)1H 2019 1H 2018 1H 2019 1H 2018 1H 2019 1H 2018 1H 2019 1H 2018 1H 2019 1H 2018
TOTAL REVENUE 1,167 1,186 2,398 2,492 1,246 3,238 3,556 1,054 1,076 425 427 296 290 43,464 36,124% change -2% -4% -9% -2% — +2% +20%
Local currencies growth % +27%
- Net Customer Service Revenue 782 807 1,956 2,336 1,168 2,222 2,362 947 927 339 344 222 221 33,245 28,551% change -3% -16% -6% +2% -1% — +16%
Local currencies growth % +23%
- Handset Revenue 323 286 201 88 44 913 1,089 49 62 53 51 39 35 6,694 5,410
- Other Revenue 62 93 241 68 34 103 105 58 87 33 32 35 34 3,525 2,163
Net Customer Service Margin (19) 681 699 1,480 1,816 908 1,874 2,002 809 777 294 294 198 195 26,922 23,672% change +14%
Net Customer Service Margin % 87% 87% 76% 78% 78% 84% 85% 85% 84% 87% 85% 89% 88% 81% 83%
Other margin 40 30 238 62 31 61 54 28 61 14 14 26 23 2,949 1,091
Total margin 721 729 1,718 1,878 939 1,935 2,056 837 838 308 308 224 218 29,871 24,763% change -1% -9% -6% — — +3% +21%
TOTAL CACs (408) (370) (230) (178) (89) (1,166) (1,359) (124) (158) (60) (58) (42) (44) (8,198) (7,268)
Less: Handset Revenue 323 286 201 88 44 913 1,089 49 62 53 51 39 35 6,694 5,410
Total CACs (net of handset revenue) (85) (84) (29) (90) (45) (253) (270) (75) (96) (7) (7) (3) (9) (1,504) (1,858)
Operating Expenses (302) (281) (664) (822) (411) (617) (625) (373) (376) (121) (108) (123) (115) (12,070) (10,108)Opex as a % of net customer service margin 44% 40% 45% 45% 45% 33% 31% 46% 48% 41% 37% 62% 59% 45% 43%
EBITDA 334 364 1,025 966 483 1,065 1,161 389 366 180 193 98 94 16,297 12,797% change -8% +6% -8% +6% -7% +4% +27%
Local currencies growth % +34%
EBITDA margin % (20) 40% 40% 47% 40% 40% 46% 47% 39% 36% 48% 51% 38% 37% 44% 42%
Depreciation & Amortisation (163) (167) (333) (378) (189) (469) (406) (180) (158) (67) (71) (59) (48) (6,327) (5,309)
EBIT 171 197 692 588 294 596 755 209 208 113 122 39 46 9,970 7,488% change -13% +18% -21% — -7% -15% +33%
Local currencies growth % +40%
Capex (excluding licence) (155) (125) (352) (308) (154) (549) (515) (80) (70) (68) (43) (56) (62) (6,320)
EBITDA less Capex 179 239 673 658 329 516 646 309 296 112 150 42 32 9,977Licence (21) — (165) — — — — — (488) — (52) — — — (1,045)
HK dollar equivalents of EBITDA and EBIT are summarised as follows:
EBITDA-pre IFRS 16 basis (HK$) 3,381 3,938 9,093 9,170 4,585 898 1,088 462 466 1,596 1,827 867 893 16,297 12,797
EBITDA-post IFRS 16 basis in 1H 2019 (HK$) 3,772 3,938 11,435 9,170 4,585 1,034 1,088 549 466 1,813 1,827 1,022 893 19,625 12,797
EBIT-pre IFRS 16 basis (HK$) 1,729 2,128 6,142 5,588 2,794 502 708 248 265 1,002 1,155 347 438 9,970 7,488
EBIT-post IFRS 16 basis in 1H 2019 (HK$) 1,798 2,128 6,430 5,588 2,794 516 708 257 265 1,045 1,155 389 438 10,435 7,488
Note 20: EBITDA margin % represents EBITDA as a percentage of total revenue (excluding handset revenue).
Note 21: 1H 2019 licence cost for Austria represents investment for 10x10 MHz of 3500 Mhz spectrum acquired in March 2019 and the licence cost for Denmark represents investment for 2x10 MHz of 700 Mhz spectrum and 2x10 MHz of 900 MHz spectrum acquired in March 2019. 1H 2018 licence cost for UK represents investment for 4x5 MHz of 3.4 GHz spectrum acquired in April 2018.
CKHH 2019 Interim Results Appendix
Page 10 of 15

CK Hutchison Holdings Limited
2015 Interim Report
18
CK Hutchison Holdings Limited
2019 Interim Report
Key Business Indicators
Registered Customer Base
Registered Customers at Registered Customer Growth (%) from Registered Customer Growth (%) from30 June 2019 (’000) 31 December 2018 to 30 June 2019 30 June 2018 to 30 June 2019
Non-contract Contract Total Non-contract Contract Total Non-contract Contract Total
UnitedKingdom 6,232 7,107 13,339 — +1% +1% +4% +2% +3%
Italy(25) 14,870 10,803 25,673 -25% +49% -5% -30% +45% -10%
Sweden 574 1,471 2,045 +11% -3% — +28% -6% +2%
Denmark 587 843 1,430 +7% +3% +4% +10% +4% +6%
Austria 1,106 2,569 3,675 -2% +1% — +1% +3% +2%
Ireland 2,328 1,419 3,747 +5% +6% +5% +11% +10% +11%
3GroupEuropeTotal 25,697 24,212 49,909 -16% +18% -2% -18% +18% -4%
Active (26) Customer Base
Active Customers at Active Customer Growth (%) from Active Customer Growth (%) from30 June 2019 (’000) 31 December 2018 to 30 June 2019 30 June 2018 to 30 June 2019
Non-contract Contract Total Non-contract Contract Total Non-contract Contract Total
UnitedKingdom 3,230 7,004 10,234 +3% +2% +2% -2% +2% +1%
Italy(25) 12,857 10,001 22,858 -28% +49% -7% -33% +45% -13%
Sweden 505 1,471 1,976 +15% -3% +1% +39% -6% +2%
Denmark 544 843 1,387 +6% +3% +4% +10% +4% +6%
Austria 366 2,560 2,926 -5% +1% — -3% +3% +2%
Ireland 882 1,402 2,284 — +6% +4% +1% +11% +7%
3GroupEuropeTotal 18,384 23,281 41,665 -20% +18% -3% -26% +17% -7%
Note25: ItalyKBIswerecalculatedbasedon100%ofWindTre’sfigures.Inadditiontotheabove,WindTrehas2.7millionfixedlinecustomers.ThecontractcustomerbaseofWindandcorrespondingKBIshavebeenadjustedin2019toconformwiththedefinitionof3,thecomparativeKBIshavenotbeenrestatedduetolimitationsofthedatatrackingsystem.
Note26: Anactivecustomerisonethatgeneratedrevenuefromanoutgoingcall,incomingcallordata/contentserviceintheprecedingthreemonths.
12-month Trailing Average Revenue per Active User (“ARPU”) (27)
to 30 June 2019
%VarianceBlended comparedto
Non-contract Contract Total 30June2018
UnitedKingdom £4.93 £24.45 £18.26 +2%
Italy €9.65 €13.16 €10.86 -11%
Sweden SEK116.39 SEK342.46 SEK291.82 -4%
Denmark DKK88.86 DKK148.11 DKK125.31 -5%
Austria €10.67 €22.40 €20.88 -3%
Ireland €15.19 €22.44 €19.56 -6%
3GroupEuropeAverage(30) €9.25 €21.32 €15.46 -12%
3 Group Europe (continued)
CKHH 2019 Interim Results Appendix
Page 11 of 15

CK Hutchison Holdings Limited
2015 Interim Report
19
CK Hutchison Holdings Limited
2019 Interim Report
12-monthTrailingNetAverageRevenueperActiveUser(“NetARPU”)(28)
to30June2019
%Variance Blended comparedto Non-contract Contract Total 30June2018
UnitedKingdom £4.93 £17.30 £13.38 -1%
Italy €9.65 €13.16 €10.86 -11%
Sweden SEK116.39 SEK217.27 SEK194.67 -6%
Denmark DKK88.86 DKK136.76 DKK118.33 -4%
Austria €10.67 €18.48 €17.46 -4%
Ireland €15.19 €17.87 €16.81 -8%
3GroupEuropeAverage(30) €9.25 €16.96 €13.22 -11%
12-monthTrailingNetAverageMarginperActiveUser(“NetAMPU”)(29)
to30June2019
%Variance Blended comparedto Non-contract Contract Total 30June2018
UnitedKingdom £4.30 £15.04 £11.63 -1%
Italy €7.58 €11.24 €8.84 -12%
Sweden SEK92.33 SEK185.44 SEK164.58 -6%
Denmark DKK75.64 DKK114.84 DKK99.76 -2%
Austria €9.34 €16.37 €15.46 -1%
Ireland €13.68 €15.60 €14.84 -7%
3GroupEuropeAverage(30) €7.46 €14.67 €11.17 -11%
Note27: ARPUequals totalmonthly revenue, including incomingmobile termination revenueandcontributions forahandset/deviceincontractbundledplans,dividedbytheaveragenumberofactivecustomersduringtheperiod.
Note28: NetARPUequals totalmonthly revenue, including incomingmobile termination revenuebutexcludingcontributionsforahandset/deviceincontractbundledplans,dividedbytheaveragenumberofactivecustomersduringtheperiod.
Note29: NetAMPUequals totalmonthly revenue, including incomingmobile termination revenuebutexcludingcontributionsforahandset/deviceincontractbundledplans,lessdirectvariablecosts(includinginterconnectionchargesandroamingcosts)(i.e.netcustomerservicemargin),dividedbytheaveragenumberofactivecustomersduringtheperiod.
Note30: 3GroupEurope12-monthtrailingARPU,NetARPUandNetAMPUinthefirsthalfof2019werecalculatedbasedon50%contributionfromWindTrefromJunetoAugust2018and100%contributionfromSeptember2018onwards,whereasfirsthalfof2018werecalculatedbasedon50%contributionfromWindTre.
CKHH 2019 Interim Results Appendix
Page 12 of 15

CK Hutchison Holdings Limited
2015 Interim Report
20
CK Hutchison Holdings Limited
2019 Interim Report
United Kingdom
EBITDAandEBITdecreasedby8%and13% in localcurrencyrespectivelycomparedto thesameperiod lastyear,mainlydrivenbyhighercostincurredfornetworkandITtransformationprojectsandlowernetcustomerservicemarginduetomarketcompetitionandregulatoryimpact,partlyoffsetbyhigherothermarginthroughvariousinitiatives.ThenetworkandITtransformationprojectsareexpectedtobecompletedoverthecomingyear,whichisexpectedtoimprovecustomerexperienceaswellascreatecostsynergiesfor3UK.
Italy
Inlocalcurrency,theGroup’sshareofWindTre’sEBITDAandEBITincreasedby112%and135%respectively,reflectingtheaccretivecontributionfromtheacquisitionoftheadditional50%shareinWindTreinSeptember2018.Onacomparablebasis,EBITDAandEBITgrewby6%and18%,mainlyduetocontinuedsynergyrealisation,lowerdepreciationandamortisationfromnetworkconsolidation,aswellashigherothermarginundertheremedytakercontract,partlyoffsetbylowernetcustomerservicemarginduetounfavourablemarketcondition.
Sweden
Sweden,wheretheGrouphasa60%interest,reported8%and21%decreaseinEBITDAandEBITinlocalcurrencyrespectivelycomparedtothesameperiodlastyear,mainlyduetolowernetcustomerservicemarginasVATreclaimwasnotrecognisedfromDecember2018onwards.UnderlyingEBITDA, without the VAT reclaim benefits in the first half of 2018, would be 3% higher than same period last year primarily driven by loweroperatingcostsandtotalCACsfromstringentcostcontrol.UnderlyingEBITwouldbe5%belowthesameperiodlastyearprimarilyduetothehigherdepreciationandamortisationfromanenlargedassetbase,particularlytheongoingLTEnetworkrolloutsince2018.
Denmark
TheoperationinDenmark,wheretheGrouphasa60%interest,reported6%growthinEBITDAinlocalcurrencycomparedtothesameperiodlastyear,mainlydueto4%growthinnetcustomerservicemargindrivenby6%growthincustomerbase.EBITwasflatcomparedtothesameperiodlastyearinlocalcurrencyastheEBITDAgrowthwasfullyoffsetbyhigherdepreciationandamortisationfromanenlargedassetbase.
Austria
EBITDAandEBITbothdecreasedby7% in local currencymainlydue tohighernetworkand IT costs to copewithnetworkcapacityexpansion.Depreciationandamortisationdecreasedto€67millionfrom€71millionfromthesameperiodlastyearprimarilyduetoloweramortisationfromcapitalisedcustomervaluefromOrangeacquisitionfullyamortisedattheendof2018,partlyoffsetbyhigherdepreciationfromanenlargedassetbase.
Ireland
EBITDAinlocalcurrencyincreasedby4%comparedtothesameperiodlastyeardrivenbyimprovednetcustomerservicemarginfromincreasedcustomerbase,aswellasstringentcontrolontotalCACs,partlyoffsetbyhigheroperatingcostduetoinclusionofcertainprovisionreleasesinthefirsthalfof2018.EBITinlocalcurrencydecreasedby15%fromthesameperiodlastyearduetohigherdepreciationandamortisationfromanenlargedassetbase.
Hutchison Telecommunications Hong Kong Holdings
30 June 2019 30June2018 HK$ million HK$million Change
Total Revenue 2,515 4,021 -37% -Service 1,782 1,843 -3%
-Hardware 733 2,178 -66%
EBITDA(31) 663 690 -4%
EBIT(31) 260 284 -8%
Total active customer base (’000) 3,328 3,414 -3%
Note31: UnderPost-IFRS16basis,EBITDAwasHK$896million;EBITwasHK$269million.
Total revenue of HK$2,515 million was 37% lower as compared to the same period last year, primarily driven by the decrease in low marginhardwaresalesinthefirsthalfof2019.EBITDAandEBITofHK$663millionandHK$260millionwere4%and8%lowerrespectivelyascomparedtothesameperiodlastyear,mainlyduetolowernetcustomerservicemarginfromkeencompetitionandthecontinuedreductioninhardwaresales,partlyoffsetbystringentcontrolonoperatingcosts.
3 Group Europe (continued)
CKHH 2019 Interim Results Appendix
Page 13 of 15

CK Hutchison Holdings Limited
2015 Interim Report
21
CK Hutchison Holdings Limited
2019 Interim Report
CK Hutchison Group Telecom Holdings and CK Hutchison Networks Holdings
In July 2019, the Group formed a new wholly-owned telecommunication holding company, CK Hutchison Group Telecom Holdings (“CK Hutchison Telecom”), which consolidates the Group’s European operations and HTHKH under one holding entity, providing a diversified telecommunication asset platform across eight geographical locations. CK Hutchison Telecom has secured an 18-months bridge financing with the intention to repay all the existing external debt of Wind Tre of approximately €10 billion. The bridge loan will then be subsequently refinanced through bonds or bank loans. CK Hutchison Telecom will be separately rated with an expected investment grade rating from all three credit rating agencies. On a combined basis, CK Hutchison Telecom’s net debt to EBITDA ratio is less than 2.5x as at 30 June 2019 and the reorganisation will allow the Group to generate significant financing cost savings from 2020 onwards, based on expectation, in excess of €100 million per annum.
Correspondingly, the CK Hutchison Telecom Group will also set up a new telecommunication infrastructure company, CK Hutchison Networks Holdings (“CK Hutchison Networks”) which will group the 28,500 tower asset interests (32) into a separately managed wholly owned subsidiary of CK Hutchison Telecom and could potentially become the fourth largest European telecom infrastructure portfolio with the expected completion of the reorganisation by the end of 2019 or early 2020. CK Hutchison Networks will start with an expected tenancy ratio of 1.2x across the six European markets and through reorganising the tower and infrastructure asset interests under a specialised management team, the new structure will allow the Group to focus on optimising the asset portfolio, achieving cost synergies, as well as maximising returns on invested capital.
Note 32: CK Hutchison Networks site count includes European sites only (includes shared sites of joint venture interests in the UK and Sweden), with an option to include
a further 9,300 sites in Asia.
CK Hutchison Group Telecom Holdings preliminary Revenue, EBITDA and EBIT for 1H 2019
Preliminary Pre-IFRS 16combined unaudited results #
for the six months ended 30 June 2019HK$ billion %
RevenueUK 11.8 26%Italy 21.3 46%Sweden 2.7 6%Denmark 1.3 3%Austria 3.8 8%Ireland 2.6 6%HTHKH 2.5 5%Corporate Costs and Others 0.2 —
Total Revenue 46.2 100%
EBITDAUK 3.4 20%Italy 9.1 53%Sweden 0.9 5%Denmark 0.4 2%Austria 1.6 10%Ireland 0.9 5%HTHKH 0.7 4%Corporate Costs and Others 0.1 1%
Total EBITDA 17.1 100%
EBITUK 1.7 16%Italy 6.1 59%Sweden 0.5 5%Denmark 0.3 3%Austria 1.0 9%Ireland 0.4 4%HTHKH 0.3 3%Corporate Costs and Others 0.1 1%
Total EBIT 10.4 100%
# The preliminary unaudited combined results of CK Hutchison Group Telecom (“CK Hutchison Telecom”) for the six months ended 30 June 2019 is solely for illustrative purposes only and assuming that the internal reorganisation to include the Group’s interests in 3 Group Europe telecommunication operations and HTHKH to form CK Hutchison Telecom has happened immediately prior to 1 January 2019. The preliminary Revenue, EBITDA and EBIT were compiled by combining the Group’s share of first half 2019 actual results of the seven telecommunication operations, as well as adjusted for an allocated corporate costs of the Group and other consolidation adjustments, where applicable. These preliminary unaudited combined results are still subject to further allocation or consolidation adjustments and may not give a full picture of the actual combined results of CK Hutchison Telecom for the six months ended 30 June 2019.
CKHH 2019 Interim Results Appendix
Page 14 of 15

CK Hutchison Holdings Limited
2015 Interim Report
22
CK Hutchison Holdings Limited
2019 Interim Report
Hutchison Asia Telecommunications
30 June 2019 30June2018 LocalcurrenciesHK$ million HK$million Change change
Total Revenue 4,325 4,081 +6% +10%-Indonesia 3,734 3,658 +2% +5%
-Vietnam 329 258 +28% +28%
-SriLanka 262 165 +59% +81%
EBITDA (33) 724 346 +109% +118%-Indonesia 1,008 645 +56% +61%
-Vietnam (202) (249) +19% +19%
-SriLanka (3) 17 -118% -118%
-Corporatecosts (79) (67) -18% -18%
EBIT (33) 216 69 +213% +233%-Indonesia 643 405 +59% +64%
-Vietnam (304) (282) -8% -8%
-SriLanka (44) 13 -438% -485%
-Corporatecosts (79) (67) -18% -18%
Total active customer account (’000) 45,695 64,240 -29%
Note33:UnderPost-IFRS16basis,EBITDAwasHK$1,761million;EBITwasHK$687million.
Asof30June2019,HutchisonAsiaTelecommunications(“HAT”)hadapproximately45.7millionactivecustomeraccounts,29%decreasecomparedtothesameperiodlastyear,primarilyduetothesubscriberregistrationprocessimposedbytheGovernmentofIndonesiasinceMay2018.IndonesiaandVietnamrepresent66%and23%ofthetotalactivecustomeraccountnumberrespectively.
InIndonesia,theoperationfocusedongrowthofsubcriber4Gdatausageandofferingdataservicesinadditionalareasofthecountry.Accordingly,theoperationcontinuedtoupgradeitsnetworkcapacityandexpandits4Gnetworkcoveragebymorethan1,700villages.Asat30June2019,theIndonesiaoperationhadexpandedits4Gnetworktoover21,000basetransceiverstations(“BTS”).DatatrafficgrowthhasresultedinimprovednetworkutilisationandthroughthisscalingofthebusinesstheIndonesiaoperationreportedEBITDAandEBITgrowthof56%and59%respectivelyinthereportedcurrencycomparedtothesameperiodlastyear.
TheVietnamoperationcontinuedtoreportLBITDAandLBITinthefirsthalfof2019,primarilyduetothedelaysinnetworkrolloutwhichwas resumed in July2018after theembargoeson themajornetworkproviderwas lifted.WithLTEserviceofficiallylaunchedinsouthernregioninfirstquarterof2019,theoperationhadapproximately15,000BTSasat30June2019,ofwhichapproximately66%are3G/LTEBTS.
InSriLanka, following theacquisitionofEtisalatLankacompleted inNovember2018, theoperation focused innetworkintegrationandLTEnetworkexpansioninthefirsthalfoftheyear.Withastrongernetworkandcostsynergiesexpectedtomaterialiseinthesecondhalfoftheyear,SriLankaoperationisexpectedtoincreaseitscontributiontothebusiness.
CKHH 2019 Interim Results Appendix
Page 15 of 15


