The Suggested Answers hosted in the website do not constitute the basis for evaluation of the students’ answers in the examination. The answers are prepared by the Faculty of the Board of Studies with a view to assist the students in their education. While due care is taken in preparation of the answers, if any errors or omissions are noticed, the same may be brought to the attention of the Director of Studies. The Council of the Institute is not in anyway responsible for the correctness or otherwise of the answers published herein.
PAPER – 3: COST ACCOUNTING AND FINANCIAL MANAGEMENT Question No. 1 is compulsory.
Answer any five questions from the remaining six questions. Working notes should form part of the answers.
Question 1 Answer the following: (a) Following details are related to a manufacturing concern:
Re-order Level 1,60,000 units Economic Order Quantity 90,000 units Minimum Stock Level 1,00,000 units Maximum Stock Level 1,90,000 units Average Lead Time 6 days Difference between minimum lead time and Maximum lead time 4 days
Calculate: (i) Maximum consumption per day (ii) Minimum consumption per day
(b) Zed Limited sells its product at ` 30 per unit. During the quarter ending on 31st March, 2014, it produced and sold 16,000 units and suffered a loss of ` 10 per unit. If the volume of sales is raised to 40,000 units, it can earn a profit of ` 8 per unit. You are required to calculate: (i) Break Even Point in Rupees. (ii) Profit if the sale volume is 50,000 units. (iii) Minimum level of production where the company needs not to close the production if
unavoidable fixed cost is ` 1,50,000. (c) Alpha Limited requires funds amounting to ` 80 lakhs for its new project. To raise the
funds, the company has following two alternatives: (i) to issue Equity Shares (at par) amounting to ` 60 lakhs and borrow the balance
amount at the interest of 12% p.a.; or (ii) to issue Equity Shares (at par) and 12% Debentures in equal proportion. The Income-tax rate is 30%.
Find out the point of indifference between the available two modes of financing and state which option will be beneficial in different situations.
(d) 'A' Ltd. and 'B' Ltd. are identical in every respect except capital structure. 'A' Ltd. does not employ debts in its capital structure whereas 'B' Ltd. employs 12% Debentures amounting to ` 10 lakhs. Assuming that : (i) All assumptions of M-M model are met; (ii) Income-tax rate is 30%; (iii) EBIT is ` 2,50,000 and (iv) The Equity capitalization rate of ‘A' Ltd. is 20%. Calculate the value of both the companies and also find out the Weighted Average Cost of Capital for both the companies. (4 x 5 = 20 Marks)
Answer (a) Difference between Minimum lead time Maximum lead time = 4 days
Max. lead time – Min. lead time = 4 days Or, Max. lead time = Min. lead time + 4 days.............................................(i) Average lead time is given as 6 days i.e. Max.lead time Min.lead time
Putting the value of (i) in (ii), Min. lead time 4 days Min.lead time
2+ + = 6 days
Or, Min. lead time + 4 days + Min. lead time = 12 days Or, 2 Min. lead time = 8 days
Or, Minimum lead time = 8days2
= 4 days
Putting this Minimum lead time value in (i), we get Maximum lead time = 4 days + 4 days = 8 days (i) Maximum consumption per day: Re-order level = Max. Re-order period × Maximum Consumption per day 1,60,000 units = 8 days × Maximum Consumption per day
Or, Maximum Consumption per day = 1,60,000units8days
= 20,000 units
(ii) Minimum Consumption per day: Maximum Stock Level =
Re-order level + Re-order Quantity – (Min. lead time × Min. Consumption per day) Or, 1,90,000 units = 1,60,000 units + 90,000 units – (4 days × Min. Consumption per day) Or, 4 days × Min. Consumption per day = 2,50,000 units – 1,90,000 units
Or, Minimum Consumption per day = 60,000 units4 days
= 15,000 units
(b) Units sold Sales value (`) Profit/ (loss) (`) 16,000 units 4,80,000
(ii) Earnings per share (EPS) under Two Situations for both the Plans
Situation A (EBIT is assumed to be ` 9,50,000) Particulars Plan I Plan II EBIT 9,50,000 9,50,000 Less: Interest @ 12% 2,40,000 4,80,000 EBT 7,10,000 4,70,000 Less: Taxes @ 30% 2,13,000 1,41,000 EAT 4,97,000 3,29,000 No. of Equity Shares 60,000 40,000 EPS 8.28 8.23
Comment: In Situation A, when expected EBIT is less than the EBIT at indifference point then, Plan I is more viable as it has higher EPS. The advantage of EPS would be available from the use of equity capital and not debt capital.
Situation B (EBIT is assumed to be ` 9,70,000) Particulars Plan I Plan II EBIT 9,70,000 9,70,000 Less: Interest @ 12% 2,40,000 4,80,000 EBT 7,30,000 4,90,000 Less: Taxes @ 30% 2,19,000 1,47,000 EAT 5,11,000 3,43,000 No. of Equity Shares 60,000 40,000 EPS 8.52 8.58
Comment: In Situation B, when expected EBIT is more than the EBIT at indifference point then, Plan II is more viable as it has higher EPS. The use of fixed-cost source of funds would be beneficial from the EPS viewpoint. In this case, financial leverage would be favourable.
(Note: The problem can also be worked out assuming any other figure of EBIT which is more than 9,60,000 and any other figure less than 9,60,000. Alternatively, the answer may also be based on the factors/governing the capital structure like the cost, risk, control, etc. Principles).
(d) (i) Calculation of Value of Firms ‘A Ltd.’ and ‘B Ltd’ according to MM Hypothesis Market Value of ‘A Ltd’ (Unlevered)
V E = V u + DT = 8,75,000 + (10,00,000 x 0.30) = 8,75,000 + 3,00,000 = ` 11,75,000 (ii) Computation of Weighted Average Cost of Capital (WACC)
WACC of ‘A Ltd.’ = 20% (Ke =Ko) WACC of ‘B Ltd.’
B Ltd. EBIT 2,50,000 Interest to Debt holders (1,20,000) EBT 1,30,000 Taxes @ 30% (39,000) Income available to Equity Shareholders 91,000 Total Value of Firm 11,75,000 Less: Market Value of Debt (10,00,000) Market Value of Equity 1,75,000 Ke = 91,000 / 1,75,000 0.52
For Computation of WACC B. Ltd
Component of Costs Amount Weight Cost of Capital WACC Equity 1,75,000 0.149 0.52 0.0775 Debt 10,00,000 0.851 0.084* 0.0715 11,75,000 WACC 0.1490
Kd= 12% (1- 0.3) = 12% x 0.7 = 8.4% WACC = 14.90%
Question 2 (a) Z Limited obtained a contract No. 999 for ` 50 lacs. The following details are available in
respect of this contract for the year ended March 31, 2014:
` Materials purchased 1,60,000 Materials issued from stores 5,00,000 Wages and salaries paid 7,00,000 Drawing and maps 60,000 Sundry expenses 15,000 Electricity charges 25,000 Plant hire expenses 60,000 Sub-contract cost 20,000 Materials returned to stores 30,000 Materials returned to suppliers 20,000
The following balances relating to the contract No. 999 for the year ended on March 31, 2013 and March 31, 2014 are available:
as on 31st March, 2013 as on 31st March, 2014 Work certified 12,00,000 35,00,000 Work uncertified 20,000 40,000 Materials at site 15,000 30,000 Wages outstanding 10,000 20,000
The contractor receives 75% of work certified in cash. Prepare Contract Account and Contractee's Account. (8 Marks)
(b) Balance Sheets of Star Ltd. are as under: Balance Sheet (in lakh `)
With the help of following additional information, prepare Cash Flow Statement:
(i) Depreciation on plant and machinery was charged @ 25% on its opening balance and on building @ 10% on its opening balance.
(ii) During the year an old machine costing ` 1,50,000 (written down value ` 60,000) was sold for ` 1,05,000.
(iii) ` 1,50,000 was paid towards Income-tax, during the year. (8 Marks)
Answer (a) Contract No. 999 Account for the year ended 31st March, 2014
Dr. Cr. Particulars Amount (`) Particulars Amount (`) To Work in progress b/d: By Material returned to store 30,000
- Work certified 12,00,000 By Material returned to suppliers
20,000
- Work uncertified 20,000 By Stock (Material) c/d 30,000 To Stock (Materials) b/d 15,000 By Work in progress c/d: To Material purchased 1,60,000 - Work certified 35,00,000 To Material issued 5,00,000 - Work uncertified 40,000 To Wages paid 7,00,000 Less: Opening O/s (10,000) Add: Closing O/s 20,000 7,10,000 To Drawing and maps* 60,000 To Sundry expenses 15,000 To Electricity charges 25,000 To Plant hire expenses 60,000 To Sub- contract cost 20,000 To Notional profit c/d (balancing figure)
8,35,000
36,20,000 36,20,000 To Costing P& L A/c (W.N.-1) 4,17,500 By Notional profit b/d 8,35,000 To WIP Reserve (balancing figure) 4,17,500 8,35,000 8,35,000
*Assumed that expenses incurred for drawing and maps are used exclusively for this contract only.
Dr. Contractee’s Account Cr. Particulars Amount (`) Particulars Amount (`) To Balance c/d (` 35,00,000 × 75%)
26,25,000 By Balance b/d (75% of ` 12,00,000)
9,00,000
By Bank A/c 17,25,000 26,25,000 26,25,000
Working Note: 1. Profit to be Transferred to Costing Profit & Loss account:
(a) Percentage of completion = Work certfied x100Value of contract
= 35,00,000 x10050,00,000
`
` = 70%
(b) Profit to be transferred to Costing Profit & Loss Account
= 32 × Notional profit ×
certifiedWorkreceivedCash
= 32 × ` 8,35,000 × 75
100 = ` 4,17,500
(b) Cash Flow Statement for the year ending on March 31, 2014
` in lakhs ` in lakhs I. Cash flows from Operating Activities Net Profit made during the year (W.N.1) 10.65 Adjustment for Depreciation on Machinery (W.N.2) 3.60 Adjustment for Depreciation on Land & Building 1.20 Operating Profit before change in Working Capital 15.45 Increase in Inventory (6.00) Decrease in Debtors 6.00 Decrease in Creditors (3.60) Cash Generated from Operations 11.85 Income-tax Paid (1.50) Net Cash from Operating Activities 10.35
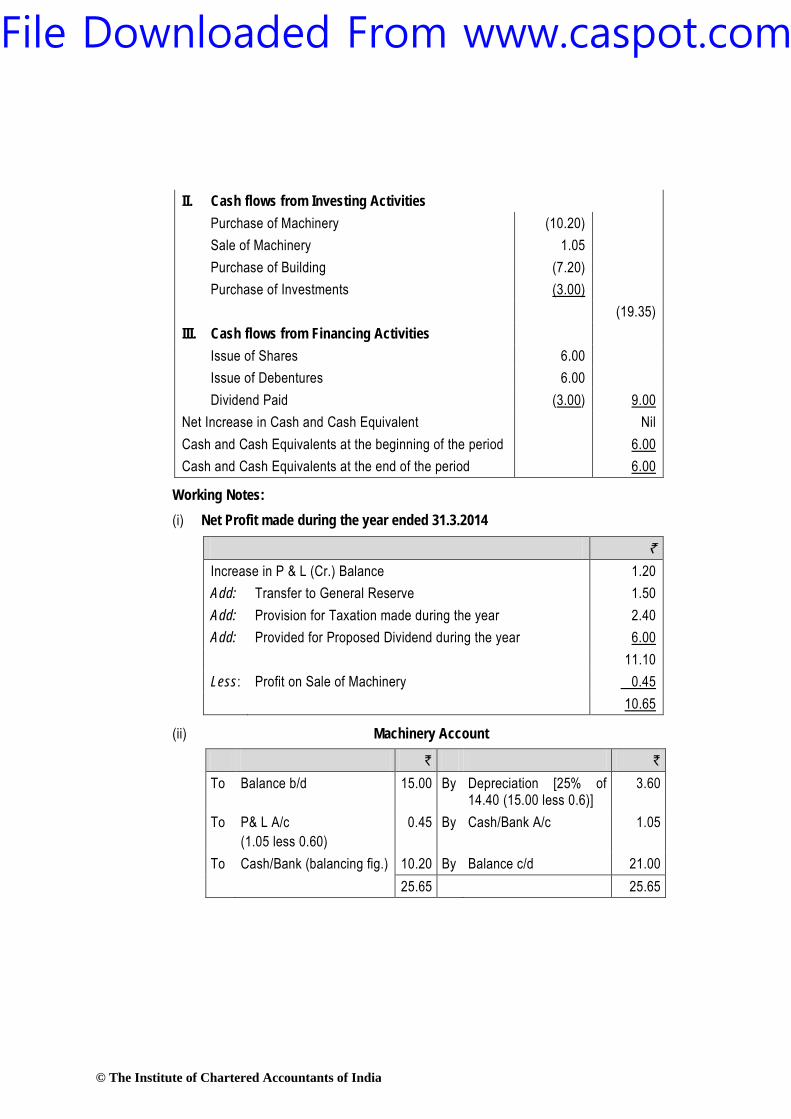
II. Cash flows from Investing Activities Purchase of Machinery (10.20) Sale of Machinery 1.05 Purchase of Building (7.20) Purchase of Investments (3.00) (19.35) III. Cash flows from Financing Activities Issue of Shares 6.00 Issue of Debentures 6.00 Dividend Paid (3.00) 9.00 Net Increase in Cash and Cash Equivalent Nil Cash and Cash Equivalents at the beginning of the period 6.00 Cash and Cash Equivalents at the end of the period 6.00
Working Notes: (i) Net Profit made during the year ended 31.3.2014
` Increase in P & L (Cr.) Balance 1.20 Add: Transfer to General Reserve 1.50 Add: Provision for Taxation made during the year 2.40 Add: Provided for Proposed Dividend during the year 6.00 11.10 Less: Profit on Sale of Machinery 0.45 10.65
(ii) Machinery Account
` ` To Balance b/d 15.00 By Depreciation [25% of
14.40 (15.00 less 0.6)] 3.60
To P& L A/c (1.05 less 0.60)
0.45 By Cash/Bank A/c 1.05
To Cash/Bank (balancing fig.) 10.20 By Balance c/d 21.00 25.65 25.65
` ` To Cash/Bank (Bal. Fig.) 1.50 By Balance b/d 2.10 To Balance c/d 3.00 By P & L A/c 2.40 4.50 4.50
(iv) Proposed Dividend Account
` ` To Bank 3.00* By Balance b/d 3.00 To Balance c/d 6.00 By P & L A/c (Bal. Fig.) 6.00
9.00 9.00
* last year proposed dividend assumed to be paid this year.
(v) Building Account
` ` To Balance b/d 12.00 By Depreciation 1.20 To Bank A/c (Purchase) 7.20 By Balance c/d 18.00 19.20 19.20
(Note: In the above solution, Depreciation has been provided on the opening balance of Plant and Machinery Account (after deducting the WDV of sold machinery) and profit on sale of machinery is computed as difference of sale value (1.05) and WDV (0.60) given in the question. However, alternative treatment is also possible in which depreciation will be calculated on the entire opening balance of 15 lakhs given as on 1.4.13 and separate calculation for depreciation on sold machinery will be done, in that case, the depreciation charged would be ` 3.75 and loss on sale of machinery will be 0.60. The cash flow statement will change accordingly).
Question 3 (a) RST Limited is presently operating at 50% capacity and producing 30,000 units. The
entire output is sold at a price of ` 200 per unit. The cost structure at the 50% level of activity is as under:
` Direct Material 75 per unit Direct Wages 25 per unit Variable Overheads 25 per unit
Direct Expenses 15 per unit Factory Expenses (25% fixed) 20 per unit Selling and Distribution Exp. (80% variable) 10 per unit Office and Administrative Exp. (100% fixed) 5 per unit
The company anticipates that the variable costs will go up by 10% and fixed costs will go up by 15%. You are required to prepare an Expense budget, on the basis of marginal cost for the company at 50% and 60% level of activity and find out the profits at respective levels.
(8 Marks) (b) From the following information, prepare Balance Sheet of a firm:
Stock Turnover Ratio (based on cost of goods sold) - 7 times Rate of Gross Profit to Sales - 25% Sales to Fixed Assets - 2 times Average debt collection period - 1.5 months Current Ratio - 2 Liquidity Ratio - 1.25 Net Working Capital - ` 8,00,000 Net Worth to Fixed Assets - 0.9 times Reserve and Surplus to Capital - 0.25 times Long Term Debts - Nil All Sales are on credit basis. (8 Marks)
Answer (a) Expense Budget of RST Ltd. for the period
Liabilities ` Assets ` Share Capital 28,80,000 Fixed Assets 28,00,000 Reserves and Surplus 7,20,000 Current Assets: Long Term Debts - Stock 6,00,000 Current Liabilities 8,00,000 Debtors 7,00,000 - Cash 3,00,000 44,00,000 44,00,000
(Note: The above solution has been worked out by ignoring the Net worth to Fixed assets ratio given in the question in order to match the total of assets and liabilities in the Balance Sheet).
Question 4 (a) Following information have been extracted from the cost records of XYZ Pvt. Ltd:
` Stores: Opening balance 54,000 Purchases 2,88,000 Transfer from WIP 1,44,000 Issue to WIP 2,88,000 Issue for repairs 36,000 Deficiency found in stock 10,800
Draw the Stores Ledger Control Account, Work-in-Progress Control Account, Overheads Control Account and Costing Profit and Loss Account. (8 Marks)
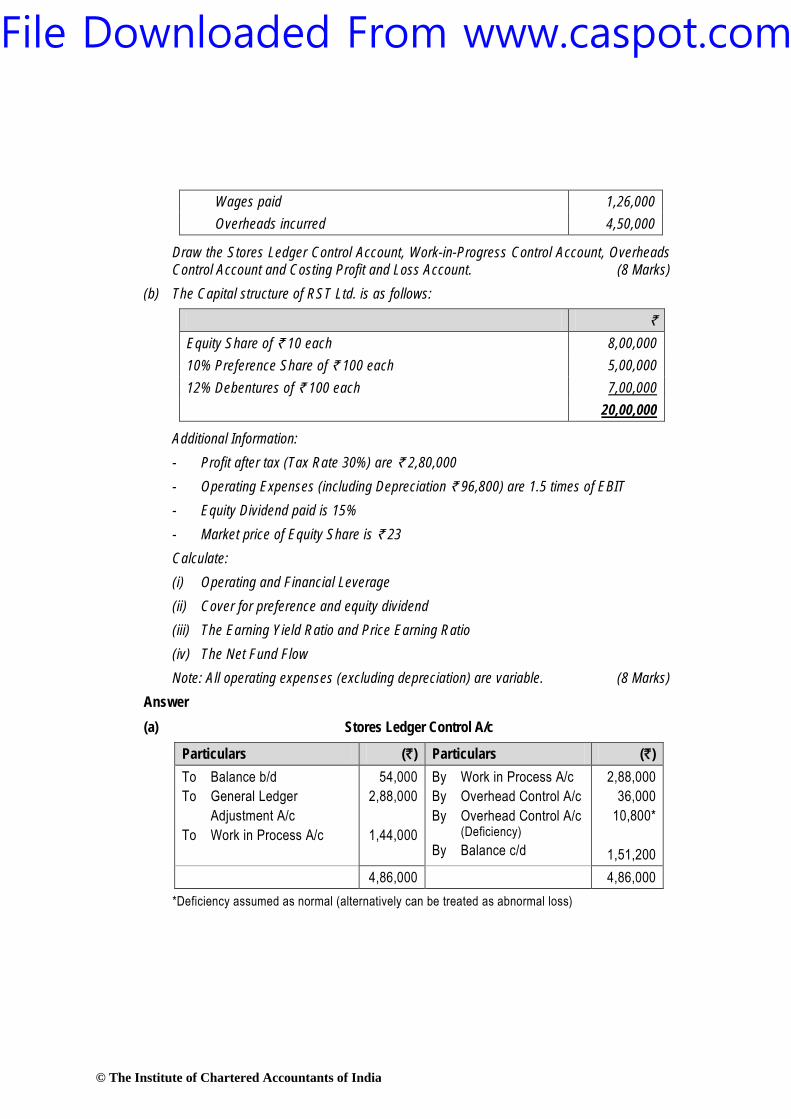
(b) The Capital structure of RST Ltd. is as follows:
` Equity Share of ` 10 each 8,00,000 10% Preference Share of ` 100 each 5,00,000 12% Debentures of ` 100 each 7,00,000 20,00,000
Additional Information: - Profit after tax (Tax Rate 30%) are ` 2,80,000 - Operating Expenses (including Depreciation ` 96,800) are 1.5 times of EBIT - Equity Dividend paid is 15% - Market price of Equity Share is ` 23 Calculate: (i) Operating and Financial Leverage (ii) Cover for preference and equity dividend (iii) The Earning Yield Ratio and Price Earning Ratio (iv) The Net Fund Flow Note: All operating expenses (excluding depreciation) are variable. (8 Marks)
Answer (a) Stores Ledger Control A/c
Particulars (`) Particulars (`) To Balance b/d To General Ledger Adjustment A/c To Work in Process A/c
54,000 2,88,000
1,44,000
By Work in Process A/c By Overhead Control A/c By Overhead Control A/c (Deficiency) By Balance c/d
2,88,000 36,000
10,800*
1,51,200 4,86,000 4,86,000
*Deficiency assumed as normal (alternatively can be treated as abnormal loss)
(iii) Where cost is ascertained for a single product. (iv) Where the nature of the product is complex and method can not be ascertained.
(b) Explain the treatment of over and under absorption of overheads in cost accounts. (c) Explain four kinds of float with reference to management of cash. (d) Distinguish between ‘Operating Lease’ and ‘Financial Lease’. (4 x 4 = 16 Marks) Answer (a)
Sl. No. Method of Costing (i) Job Costing (ii) Batch Costing (iii) Unit Costing or Single or Output Costing (iv) Multiple Costing
(b) Treatment of over and under absorption of overheads are:- (i) Writing off to costing P&L A/c:– Small difference between the actual and absorbed
amount should simply be transferred to costing P&L A/c, if difference is large then investigate the causes and after that abnormal loss/ gain shall be transferred to costing P&L A/c.
(ii) Use of supplementary Rate: Under this method the balance of under and over absorbed overheads may be charged to cost of W.I.P., finished stock and cost of sales proportionately with the help of supplementary rate of overhead.
(iii) Carry Forward to Subsequent Year: Difference should be carried forward in the expectation that next year the position will be automatically corrected.
(c) Four Kinds of Float with reference to Management of Cash The four kinds of float are: (i) Billing Float: The time between the sale and the mailing of the invoice is the billing
float. (ii) Mail Float: This is the time when a cheque is being processed by post office,
messenger service or other means of delivery. (iii) Cheque processing float: This is the time required for the seller to sort, record and
deposit the cheque after it has been received by the company. (iv) Bank processing float: This is the time from the deposit of the cheque to the
(d) Difference between Financial Lease and Operating Lease
S.No. Finance Lease Operating Lease 1. The risk and reward incident to
ownership are passed on the lessee. The lessor only remains the legal owner of the asset.
The lessee is only provided the use of the asset for a certain time. Risk incident to ownership belongs only to the lessor.
2. The lessee bears the risk of obsolescence.
The lessor bears the risk of obsolescence.
3. The lease is non-cancellable by either party under it.
The lease is kept cancellable by the lessor.
4. The lessor does not bear the cost of repairs, maintenance or operations.
Usually, the lessor bears the cost of repairs, maintenance or operations.
5. The lease is usually full payout. The lease is usually non-payout. (Note: Students may answer any four of the above differences)
Question 6 (a) PQR Ltd. having an annual sales of ` 30 lakhs, is re-considering its present collection
policy. At present, the average collection period is 50 days and the bad debt losses are 5% of sales. The company is incurring an expenditure of ` 30,000 on account of collection of receivables. The alternative policies are as under:
Alternative I Alternative II Average Collection Period 40 days 30 days Bad Debt Losses 4% of sales 3% of sales Collection Expenses ` 60,000 ` 95,000
Evaluate the alternatives on the basis of incremental approach and state which alternative is more beneficial. (8 Marks)
(b) The following information relate to Process A:
(i) Opening Work-in-Progress 8,000 units at ` 75,000 Degree of Completion: Material 100% Labour and Overhead 60% (ii) Input 1,82,000 units at ` 7,37,500 (iii) Wages paid ` 3,40,600 (iv) Overheads paid ` 1,70,300
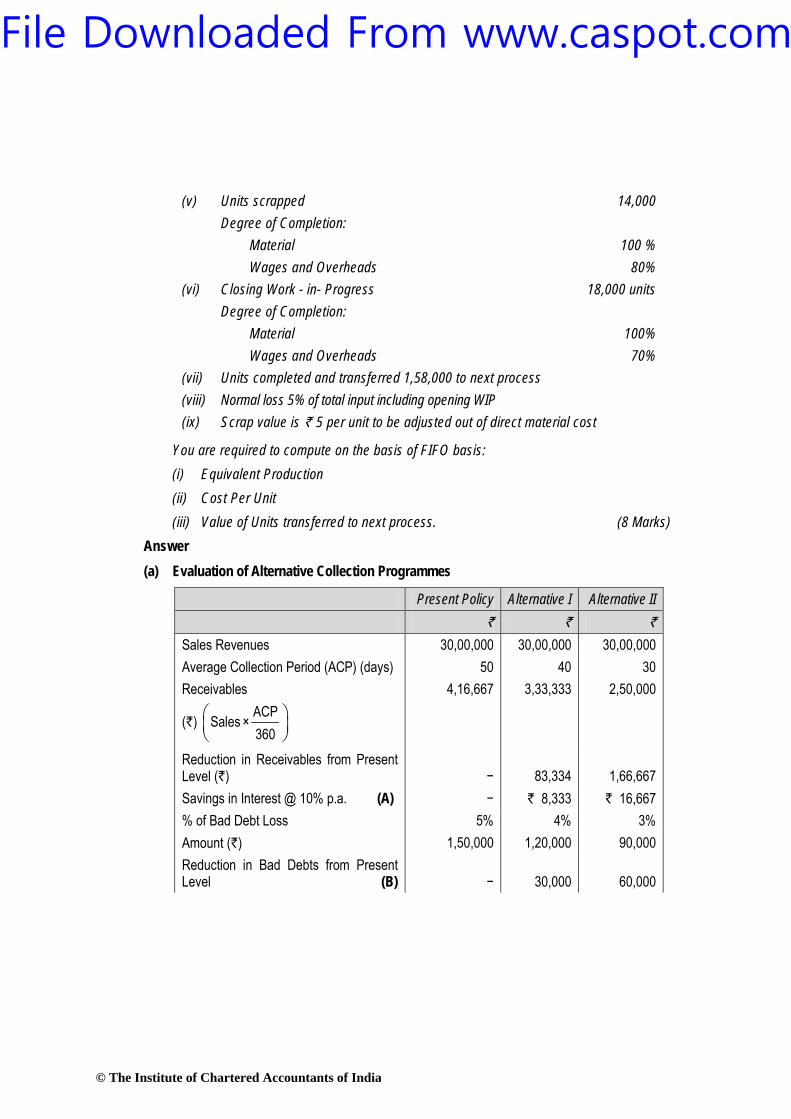
(v) Units scrapped 14,000 Degree of Completion: Material 100 % Wages and Overheads 80% (vi) Closing Work - in- Progress 18,000 units Degree of Completion: Material 100% Wages and Overheads 70% (vii) Units completed and transferred 1,58,000 to next process (viii) Normal loss 5% of total input including opening WIP (ix) Scrap value is ` 5 per unit to be adjusted out of direct material cost
You are required to compute on the basis of FIFO basis: (i) Equivalent Production (ii) Cost Per Unit (iii) Value of Units transferred to next process. (8 Marks)
Answer (a) Evaluation of Alternative Collection Programmes
Present Policy Alternative I Alternative II ` ` ` Sales Revenues 30,00,000 30,00,000 30,00,000 Average Collection Period (ACP) (days) 50 40 30 Receivables
(`) ACPSales × 360
4,16,667 3,33,333 2,50,000
Reduction in Receivables from Present Level (`)
−
83,334
1,66,667
Savings in Interest @ 10% p.a. (A) − ` 8,333 ` 16,667 % of Bad Debt Loss 5% 4% 3% Amount (`) 1,50,000 1,20,000 90,000 Reduction in Bad Debts from Present Level (B)
Conclusion: From the analysis it is apparent that Alternative I has a benefit of ` 8,333 and Alternative II has a benefit of ` 11,667 over present level. Alternative II has a benefit of ` 3,334 more than Alternative I. Hence Alternative II is more viable. (Note: In absence of Cost of Sales, sales has been taken for purpose of calculating investment in receivables. Cost of Funds has been assumed to be 10%. 1 year = 360 days.)
(b) (i) Statement of Equivalent Production (FIFO Method)
Input Output Equivalent Production Particulars Units Particulars Units Material Labour & Overheads
(%) Units (%) Units Opening WIP 8,000 Transfer to next Process : Introduced 1,82,000 Opening WIP completed 8,000 -- -- 40 3,200 Introduced & completed 1,50,000 100 1,50,000 100 1,50,000 Normal loss
(ii) Computation of Cost per unit Particulars Materials
(`) Labour
(`) Overhead
(`) Input of Materials 7,37,500 -- -- Expenses -- 3,40,600 1,70,300 Total 7,37,500 3,40,600 1,70,300 Less : Sale of Scrap (9,500 units x ` 5 ) (47,500) -- -- Net cost 6,90,000 3,40,600 1,70,300 Equivalent Units 1,72,500 1,69,400 1,69,400 Cost Per Unit 4.0000 2.0106 1.0053
Total cost per unit = ` (4.0000 + 2.0106 + 1.0053) = ` 7.0159
Amount (`) Amount (`) Opening W-I-P 75,000 Add: Labour (3,200 units × ` 2.0106) 6,434 Overhead (3,200 units × ` 1.0053) 3,217 84,651 New introduced (1,50,000 units × ` 7.0159) 10,52,385 11,37,036
Question 7 Answer any four of the following: (a) Why money in the future is worth less than similar money today? Give the reasons and
explain. (b) Distinguish between 'Business Risk' and 'Financial Risk'. (c) What is 'Internal Rate of Return'? Explain. (d) State the different types of Packing Credit. (e) Define ‘Labour Turnover’. How is it measured? Explain. (4 x 4 = 16 Marks) Answer (a) Money in the Future is worth less than the Similar Money Today due to several reasons:
Risk − There is uncertainty about the receipt of money in future. Preference For Present Consumption − Most of the persons and companies in
general, prefer current consumption over future consumption. Inflation − In an inflationary period a rupee today represents a greater real
purchasing power than a rupee a year hence. Investment Opportunities − Most of the persons and companies have a
preference for present money because of availabilities of opportunities of investment for earning additional cash flow.
(b) Business Risk and Financial Risk: Business risk refers to the risk associated with the firm’s operations. It is an unavoidable risk because of the environment in which the firm has to operate and the business risk is represented by the variability of earnings before interest and tax (EBIT). The variability in turn is influenced by revenues and expenses. Revenues and expenses are affected by demand of firm’s products, variations in prices and proportion of fixed cost in total cost. Whereas, Financial risk refers to the additional risk placed on firm’s shareholders as a result of debt use in financing. Companies that issue more debt instruments would have
higher financial risk than companies financed mostly by equity. Financial risk can be measured by ratios such as firm’s financial leverage multiplier, total debt to assets ratio etc.
(c) Internal Rate of Return: It is that rate at which discounted cash inflows are equal to the discounted cash outflows. It can be stated in the form of a ratio as follows:
Cash inflows 1Cash Outflows
=
This rate is to be found by trial and error method. This rate is used in the evaluation of investment proposals. In this method, the discount rate is not known but the cash outflows and cash inflows are known. In evaluating investment proposals, internal rate of return is compared with a required rate of return, known as cut-off rate. If it is more than cut-off rate the project is treated as acceptable; otherwise project is rejected.
(d) Different Types of Packing Credit Packing credit may be of the following types:
(i) Clean Packing credit: This is an advance made available to an exporter only on production of a firm export order or a letter of credit without exercising any charge or control over raw material or finished goods. It is a clean type of export advance. Each proposal is weighted according to particular requirements of the trade and credit worthiness of the exporter. A suitable margin has to be maintained. Also, Export Credit Guarantee Corporation (ECGC) cover should be obtained by the bank.
(ii) Packing credit against hypothecation of goods: Export finance is made available on certain terms and conditions where the exporter has pledgeable interest and the goods are hypothecated to the bank as security with stipulated margin. At the time of utilising the advance, the exporter is required to submit alongwith the firm export order or letter of credit, relative stock statements and thereafter continue submitting them every fortnight and whenever there is any movement in stocks.
(iii) Packing credit against pledge of goods: Export finance is made available on certain terms and conditions where the exportable finished goods are pledged to the banks with approved clearing agents who will ship the same from time to time as required by the exporter. The possession of the goods so pledged lies with the bank and is kept under its lock and key.
(iv) E.C.G.C. guarantee: Any loan given to an exporter for the manufacture, processing, purchasing, or packing of goods meant for export against a firm order qualifies for the packing credit guarantee issued by Export Credit Guarantee Corporation.
(v) Forward exchange contract: Another requirement of packing credit facility is that if the export bill is to be drawn in a foreign currency, the exporter should enter into a forward exchange contact with the bank, thereby avoiding risk involved in a possible change in the rate of exchange.
(Note: Students may answer any four of the above packing credits). (e) Labour turnover in an organisation is the rate of change in the composition of labour
force during a specified period measured against a suitable index. The standard of usual labour turnover in the industry or labour turnover rate for a past period may be taken as the index or norm against which actual turnover rate should be compared.
The methods for measuring labour turnover are: Replacement method: This method takes into consideration actual replacement of
Separation method: In this method labour turnover is measured by dividing the total no. of separations during the period by average no. of workers on payroll during the same period.